Submitted:
14 June 2024
Posted:
17 June 2024
You are already at the latest version
Abstract

Keywords:
1. Introduction
2. Materials and Methods
2.1. Materials
2.2. Characterization
2.3. Sample Preparation
2.4. Photocatalytic Activity Test
3. Results and Discussion
3.1. Characterization of the NWJ
3.2. NWJ Impregnated with nCN
3.3. Photocatalytical Measurements
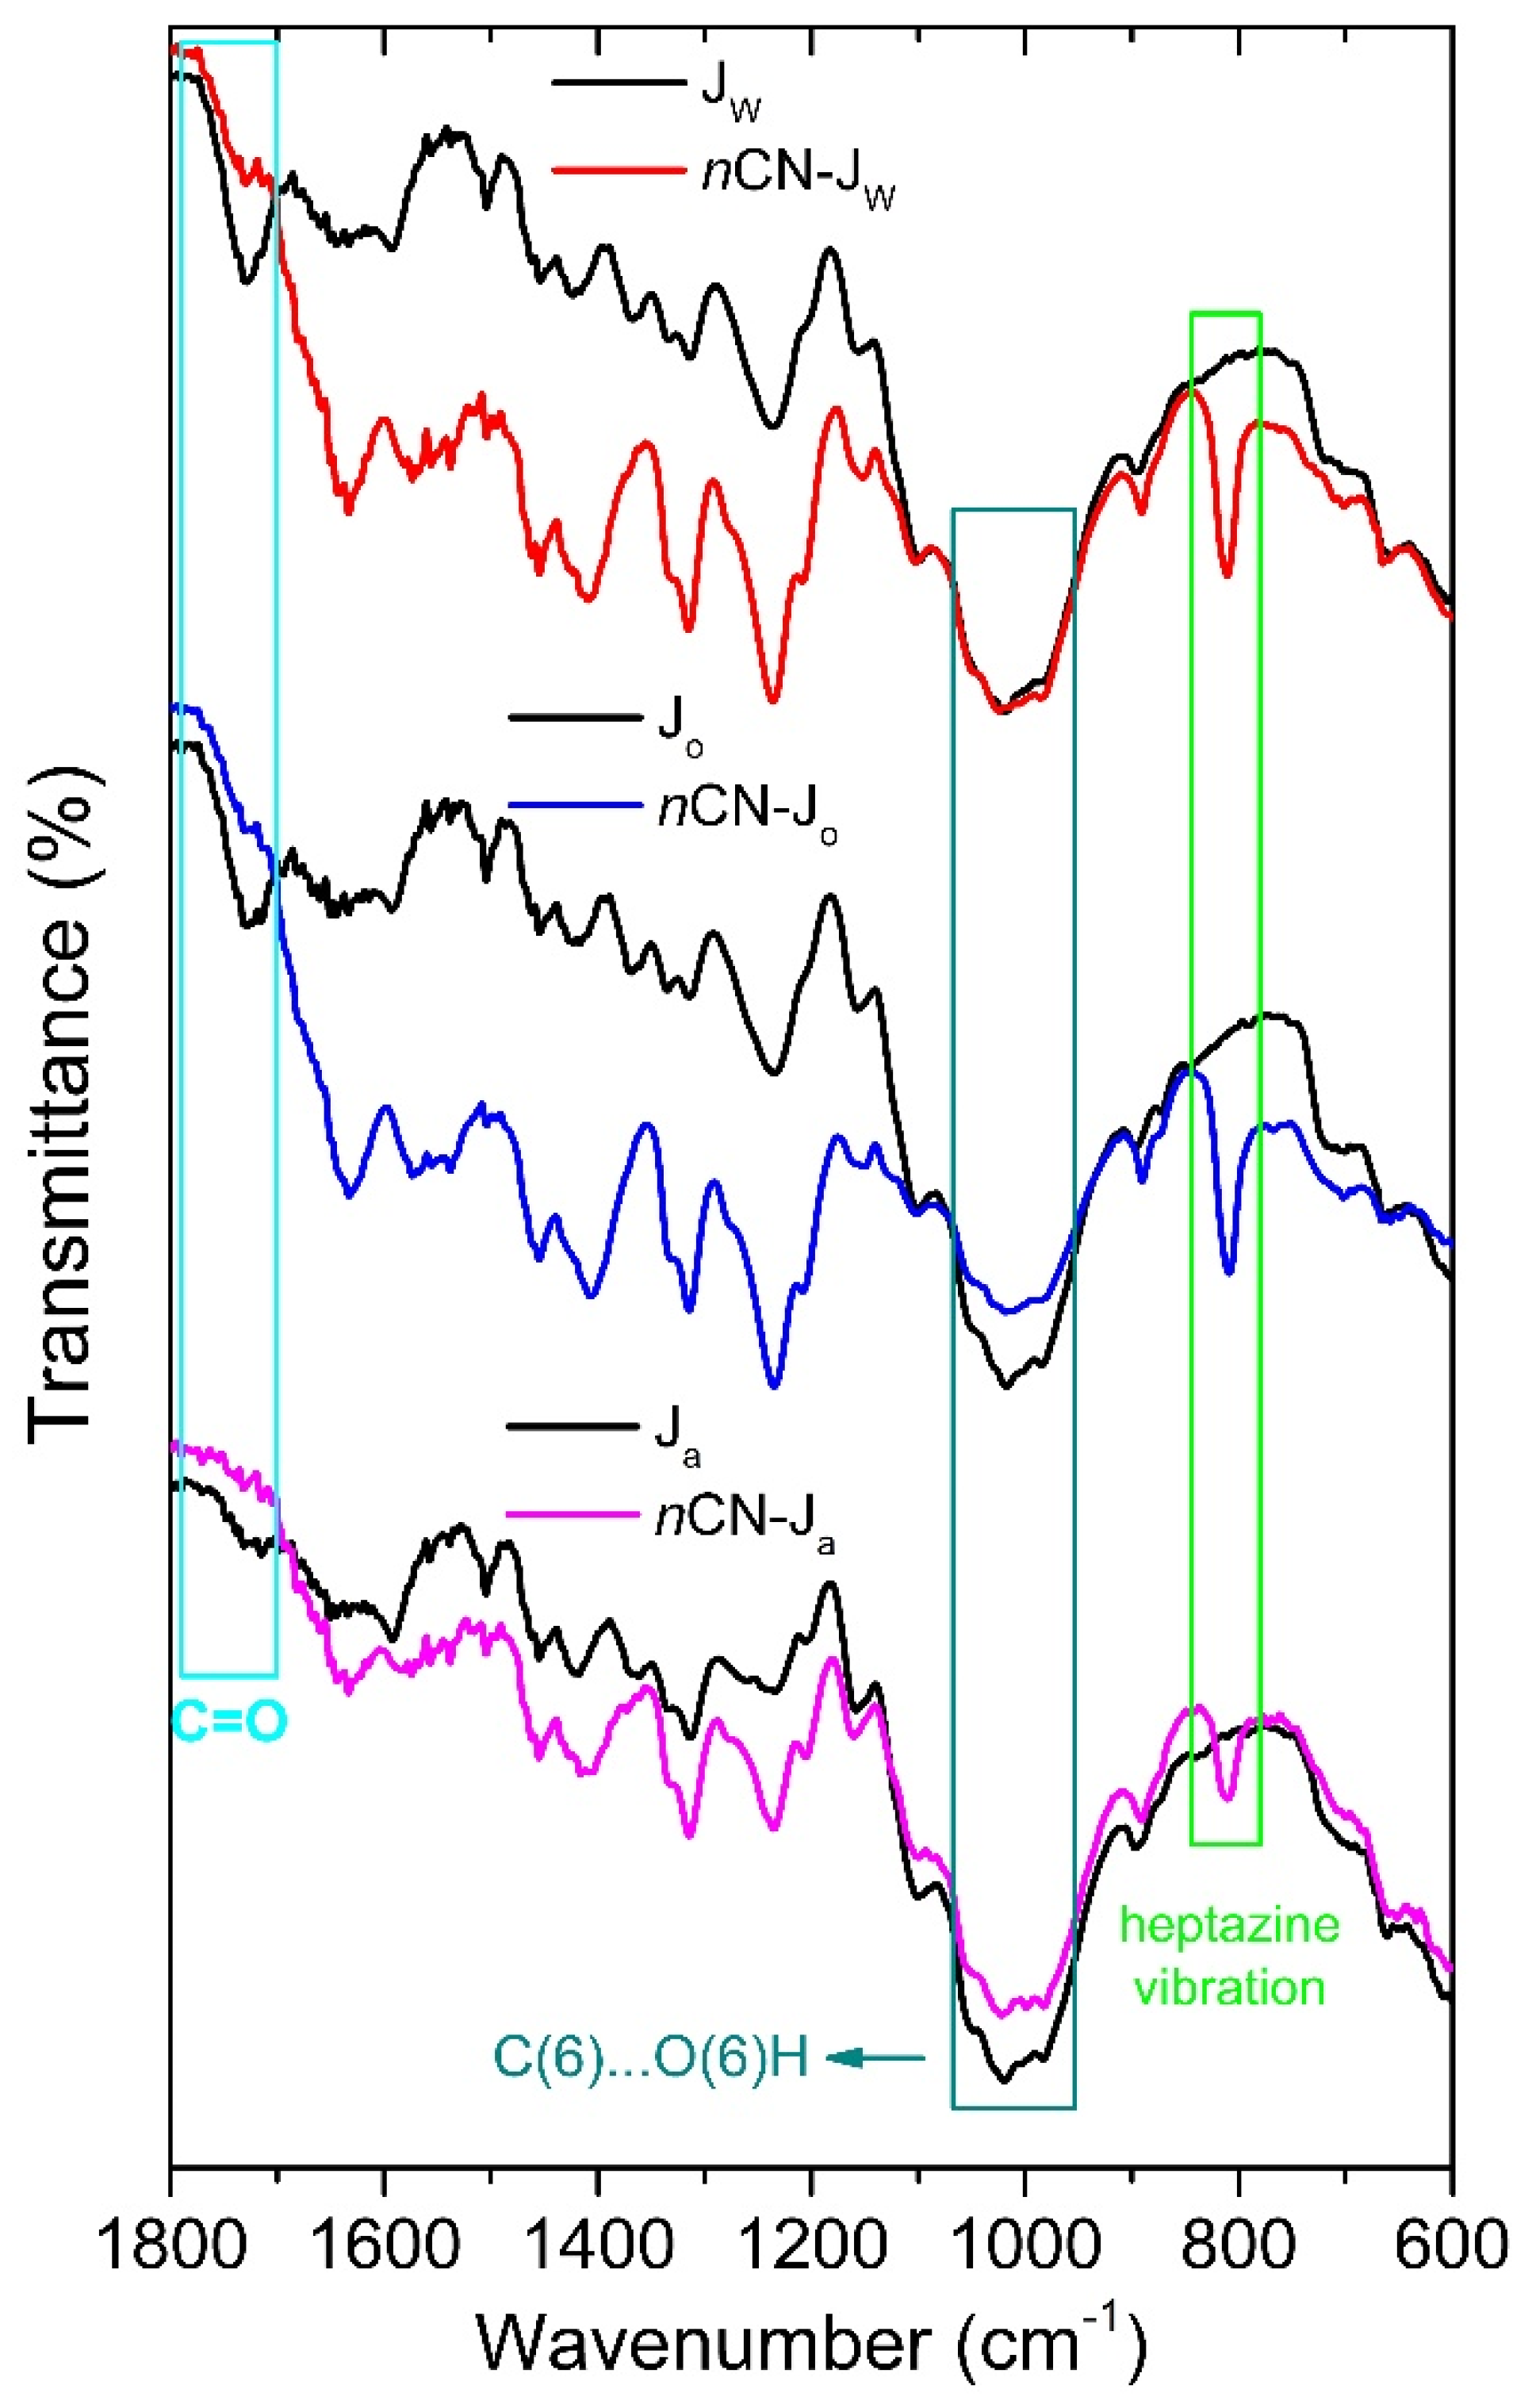
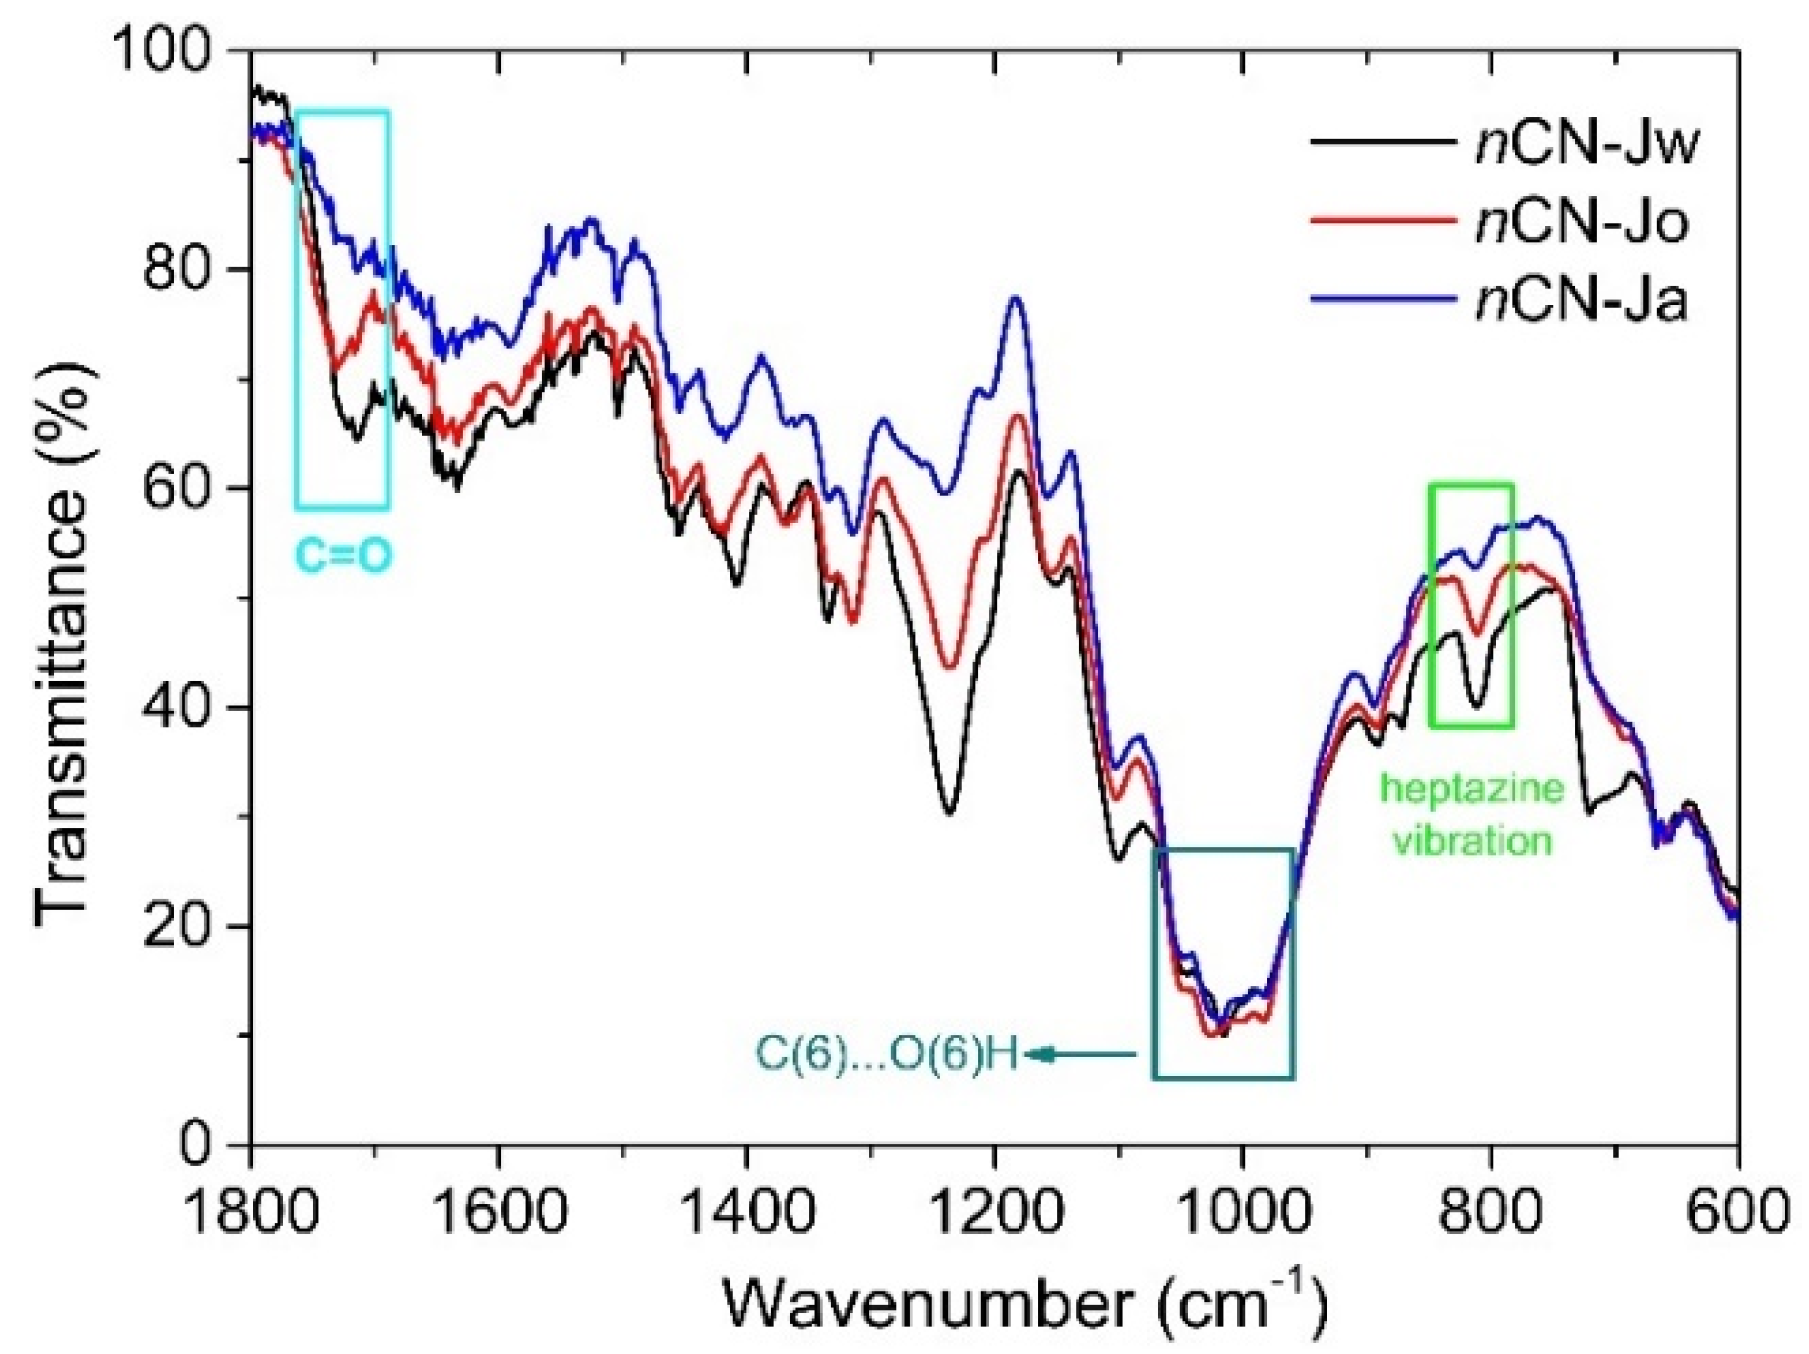
- The band at ~1725cm-1 is recovered in the nCN-Jw and nCN-Jo samples, pointing to the breakage of the carbon-nitride-hemicellulose bond.
- Intensities of the bands related to hydroxymethyl group vibrations (at 1020 and 985 cm-1) are fully recovered in the FTIR spectra of the nCN-Jo and nCN-Ja samples, indicating the detachment of the carbon-nitride from the cellulose.
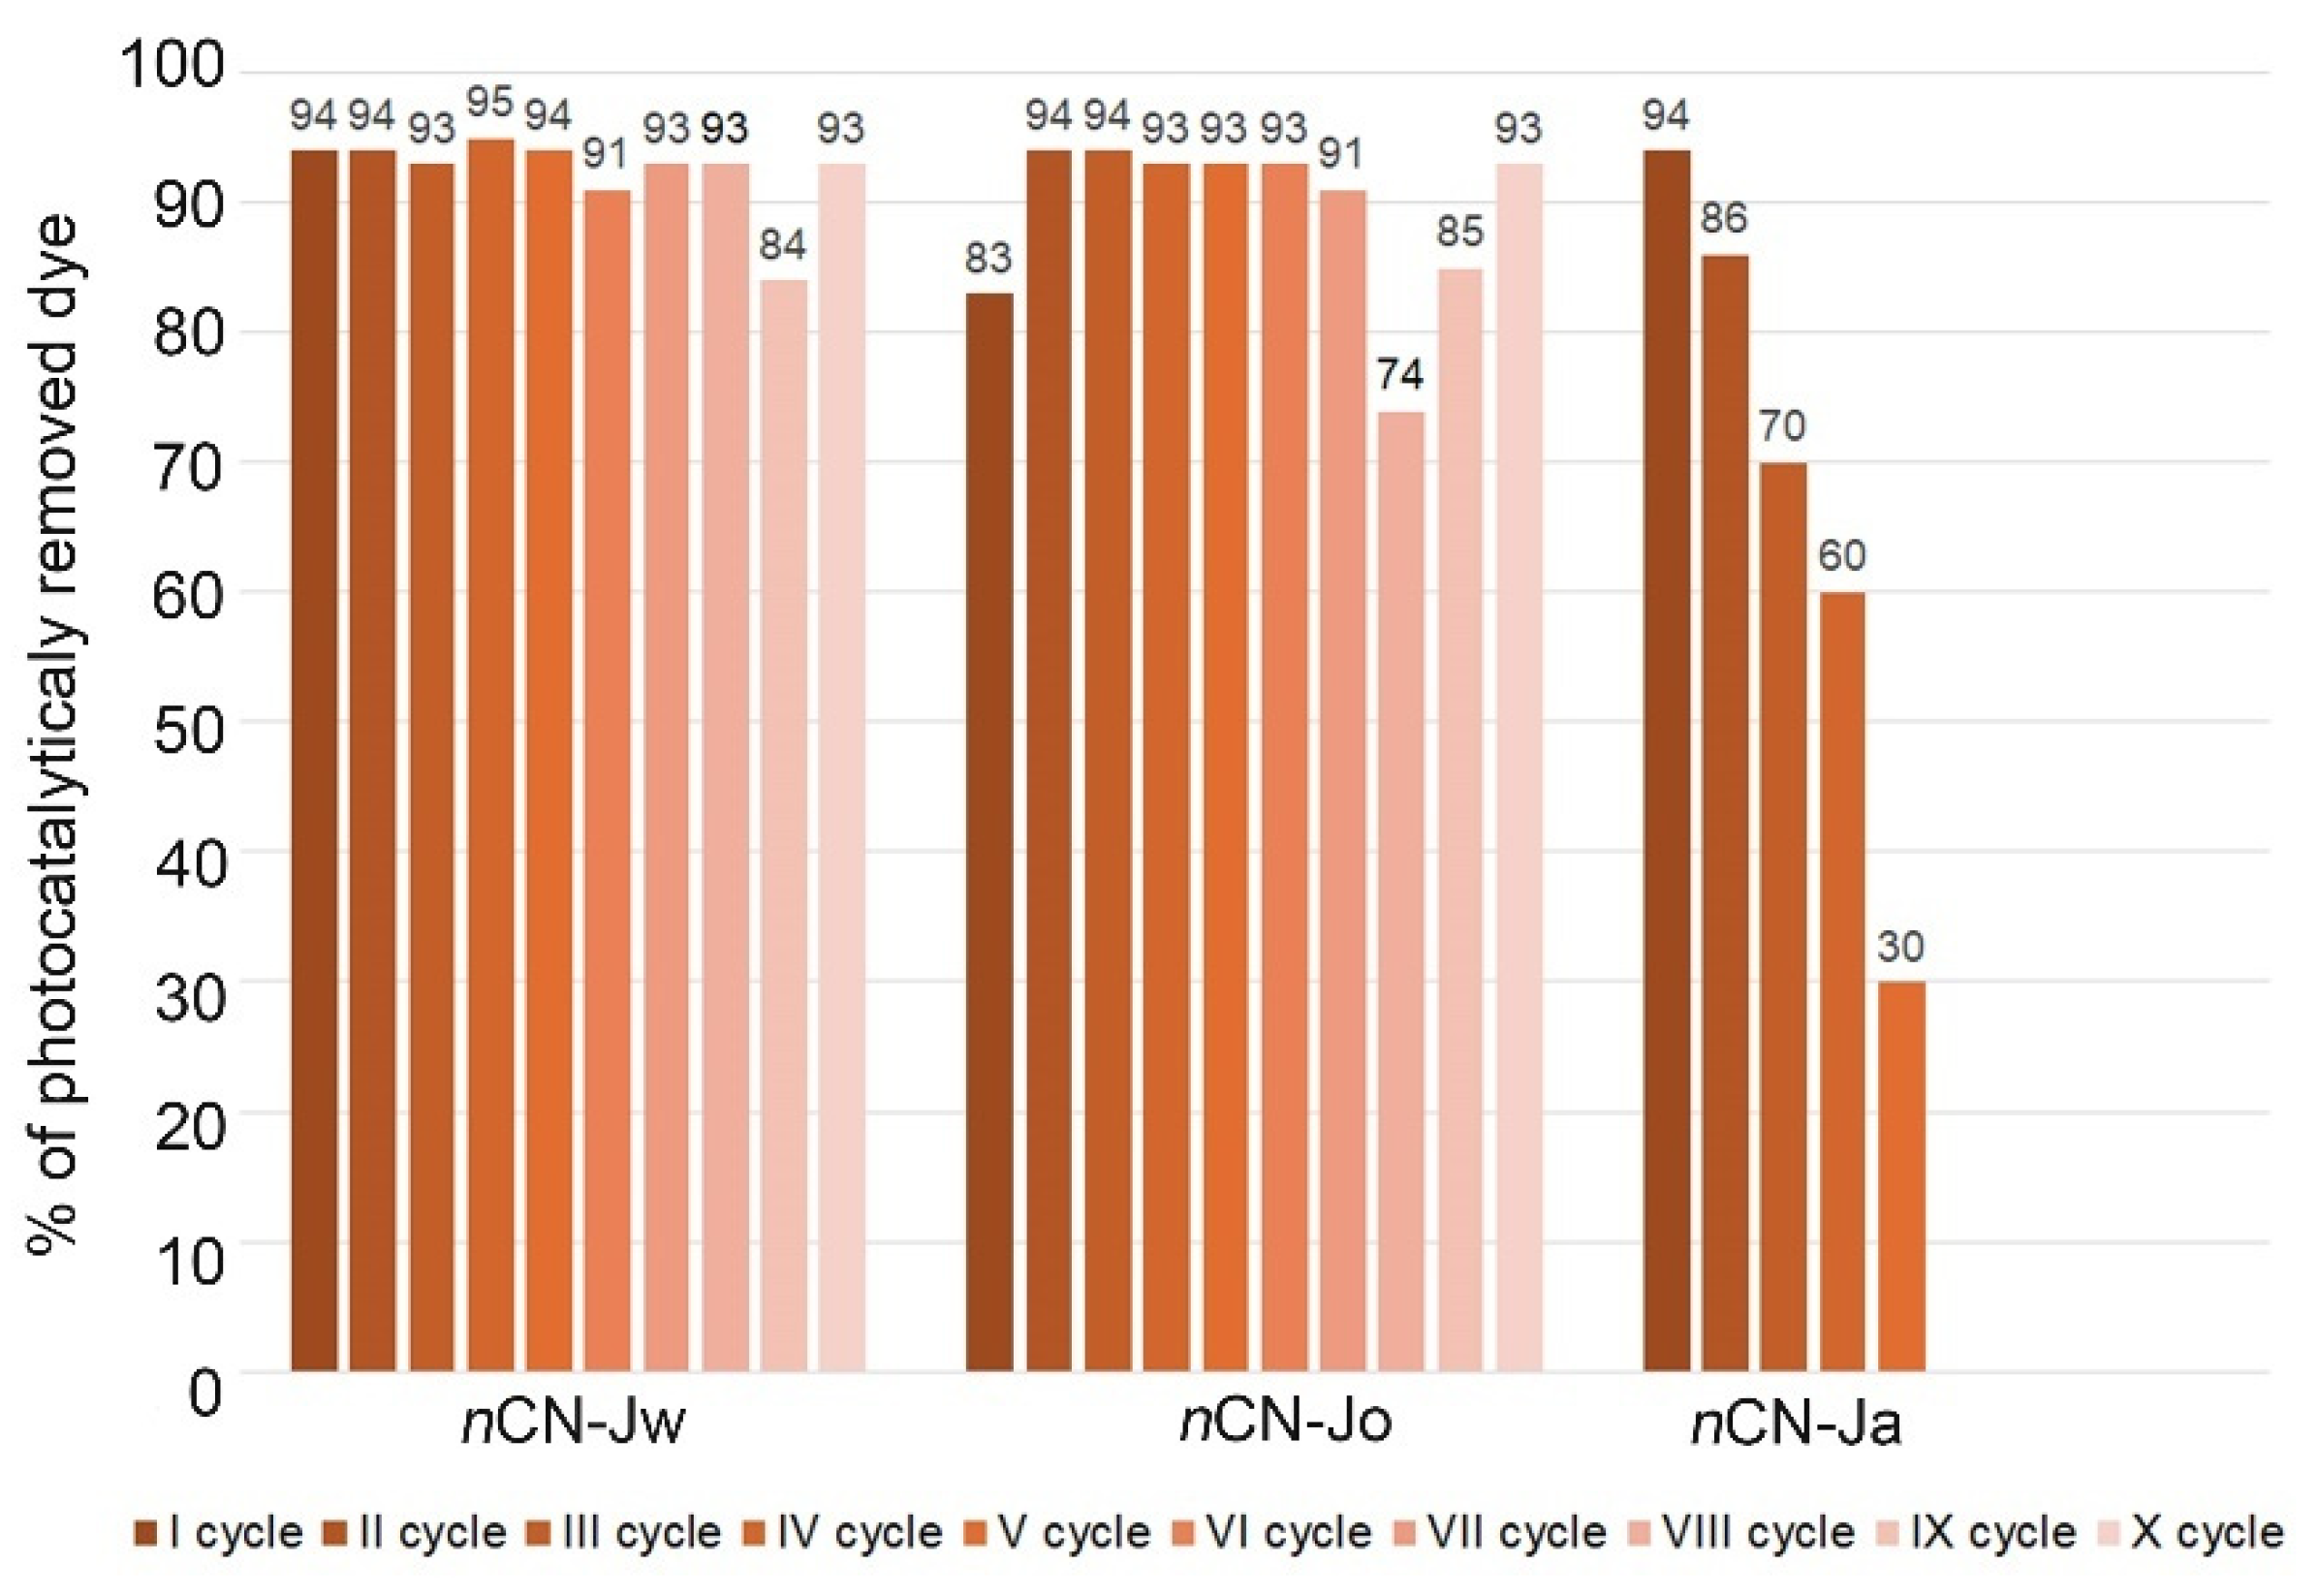
- In all three spectra band at ~ 815 cm-1 (characteristic vibration of the heptazine) is present, proving presence of the carbon nitride in the impregnated samples, even after multiple photocatalytic cycles, but with significant differences in the intensities, which can be correlated to the lowering of the photocatalytic effectiveness stability in Jw>Jo>Ja order.
4. Conclusions
Supplementary Materials
Author Contributions
Funding
Data Availability Statement
Acknowledgments
Conflicts of Interest
References
- Available online: https://businessesranker.com/largest-producer-of-jute-in-the-world/1489/.
- Krishnan, K.B.; Doraiswamy, I.; Chellamani, K.P. (2005) Jute. In:Franck RR (ed) Bast and other plant fibers, 1st edn. Woodhead Publishing Limited and CRC Press LCR, Cambridge, pp 24–94.
- Derkacheva, O.; Sukhov, D. Investigation of Lignins by FTIR Spectroscopy. Macromol. Symp. 2008, 265, 61–68. [Google Scholar] [CrossRef]
- Kostic, M.; Pejic, B.; Skundric, P. Quality of chemically modified hemp fibers. Bioresour. Technol. 2008, 99, 94–99. [Google Scholar] [CrossRef]
- Pejic, B.M.; Kostic, M.M.; Skundric, P.D.; Praskalo, J.Z. The effects of hemicelluloses and lignin removal on water uptake behavior of hemp fibers. Bioresour. Technol. 2008, 99, 7152–7159. [Google Scholar] [CrossRef]
- Ivanovska, A.; Cerovic, D.; Maletic, S.; Jankovic Castvan, I.; Asanovic, K.; Kostic, M. Influence of the alkali treatment on the sorption and dielectric properties of woven jute fabric. Cellulose 2019, 26, 5133–5146. [Google Scholar] [CrossRef]
- Gassan, J.; Bledzki, A.K. Alkali Treatment of Jute Fibers: Relationship Between Structure and Mechanical Properties. Appl. Polym. Sci. 1999, 711, 623–629. [Google Scholar] [CrossRef]
- Lazic, B.D.; Janjic, S.D.; Korica, M.; Pejic, B.M.; Djokic, V.R.; Kostic, M.M. Electrokinetic and sorption properties of hydrogen peroxide treated flax fibers (Linum usitatissimum L.). Cellulose 2021, 28, 2889–2903. [Google Scholar] [CrossRef]
- López Durán, V.; Larsson, P.A.; Wågberg, L. Chemical modification of cellulose-rich fibres to clarify the influence of the chemical structure on the physical and mechanical properties of cellulose fibres and thereof made sheets. Carbohydr. Polym. 2018, 182, 1–7. [Google Scholar] [CrossRef]
- Schutyser, W.; Renders, T.; Van den Bosch, S.; Koelewijn, S.F.; Beckham, G.T.; Sels, B.F. Chemicals from lignin: an interplay of lignocellulose fractionation, depolymerisation and upgrading. Chem. Soc. Rev. 2018, 47(3), 852–908. [Google Scholar] [CrossRef]
- Kumar, J.; Kumar, K.; Kumar, K.; Jaiswal, B.; Verma, R.K. Development of waste carpet (jute) and Multi-wall carbon nanotube incorporated epoxy composites for lightweight applications, Progress in Rubber Plastics and Recycling Technology 2022, 38(3), 247–263. [CrossRef]
- Carević, M.V.; Vulić, T.D.; Šaponjić, Z.V.; Mojović, Z.D.; Abazović, N.D.; Čomor, M.I. Carbon nitride impregnated non-woven jute post-industrial waste in photocatalytic degradation of textile dyes. Cellulose 2024, 31, 5297–5312. [Google Scholar] [CrossRef]
- Poletto, M.; Pistor, V.; Zattera, A.J. Structural Characteristics and Thermal Properties of Native Cellulose, Chapter 2 in Cellulose - Fundamental Aspects, Edited by Theo van de Ven and Louis Godbout, IntechOpen, Rijeka, Croatia. [CrossRef]
- Eyley, S.; Thielemans, W. Surface modification of cellulose nanocrystals. Nanoscale 2014, 6, 7764–7779. [Google Scholar] [CrossRef]
- Wang, W.; Cai, Z.; Yu, J.; Xia, Z. Changes in Composition, Structure, and Properties of Jute Fibers after Chemical Treatments. Fibers Polym. 2009, 10(6), 776–780. [Google Scholar] [CrossRef]
- Loganathan, T.M.; Sultan, M.T.H.; Ahsan, Q.; Jawaid, M.; Naveen, J.; Shah, A.U.M.; Hua, L.S. Characterization of alkali treated new cellulosic fibre from Cyrtostachys renda. J. Mater. Res. Tech. 2020, 9(3), 3537–3546. [Google Scholar] [CrossRef]
- Ivanovska, A.; Cerovic, D.; Tadic, N.; Jankovic Castvan, I.; Asanovic, K.; Kostic, M. Sorption and dielectric properties of jute woven fabrics: Effect of chemical composition. Ind. Crops. Prod. 2019, 140, 111632. [Google Scholar] [CrossRef]
- Nishiyama, Y.; Langan, P.; Chanzy, H. Crystal Structure and Hydrogen-Bonding System in Cellulose Iβ from Synchrotron X-ray and Neutron Fiber Diffraction. J. Am. Chem. Soc. 2002, 124, 9074–9082. [Google Scholar] [CrossRef]
- Khan, M.A.; Guru, S.; Padmakaran, P.; Mishra, D.; Mudgal, M.; Dhakad, S. Characterisation Studies and Impact of Chemical Treatment on Mechanical Properties of Sisal Fiber. Composite Interfaces 2011, 18, 527–541. [Google Scholar] [CrossRef]
- Lakshmanan, A.; Ghosh, R.K.; Dasgupta, S.; Chakraborty, S.; Ganguly, P.K. Optimization of alkali treatment condition on jute fabric for the development of rigid biocomposite. J. Ind. Text. 2018, 47, 640–655. [Google Scholar] [CrossRef]
- Horikawa, Y.; Hirano, S.; Mihashi, A.; Kobayashi, Y.; Zhai, S.; Sugiyama, J. Prediction of Lignin Contents from Infrared Spectroscopy: Chemical Digestion and Lignin/Biomass Ratios of Cryptomeria japonica. Appl. Biochem. Biotechnol. 2019, 188(4), 1066–1076. [Google Scholar] [CrossRef]
- Hellström, P.; Heijnesson-Hultén, A.; Paulsson, M.; Håkansson, H.; Germgård, U. The effect of Fenton chemistry on the properties of microfibrillated cellulose. Cellulose 2014, 21, 1489–1503. [Google Scholar] [CrossRef]

| Sample | Moisture content (%) | Weight loss (%) |
| Jw | 7.6±0.3 | 1.3±0.1 |
| Jo | 7.6±0.3 | 3.5±0.4 |
| Ja | 7.6±0.2 | 5.1±0.4 |
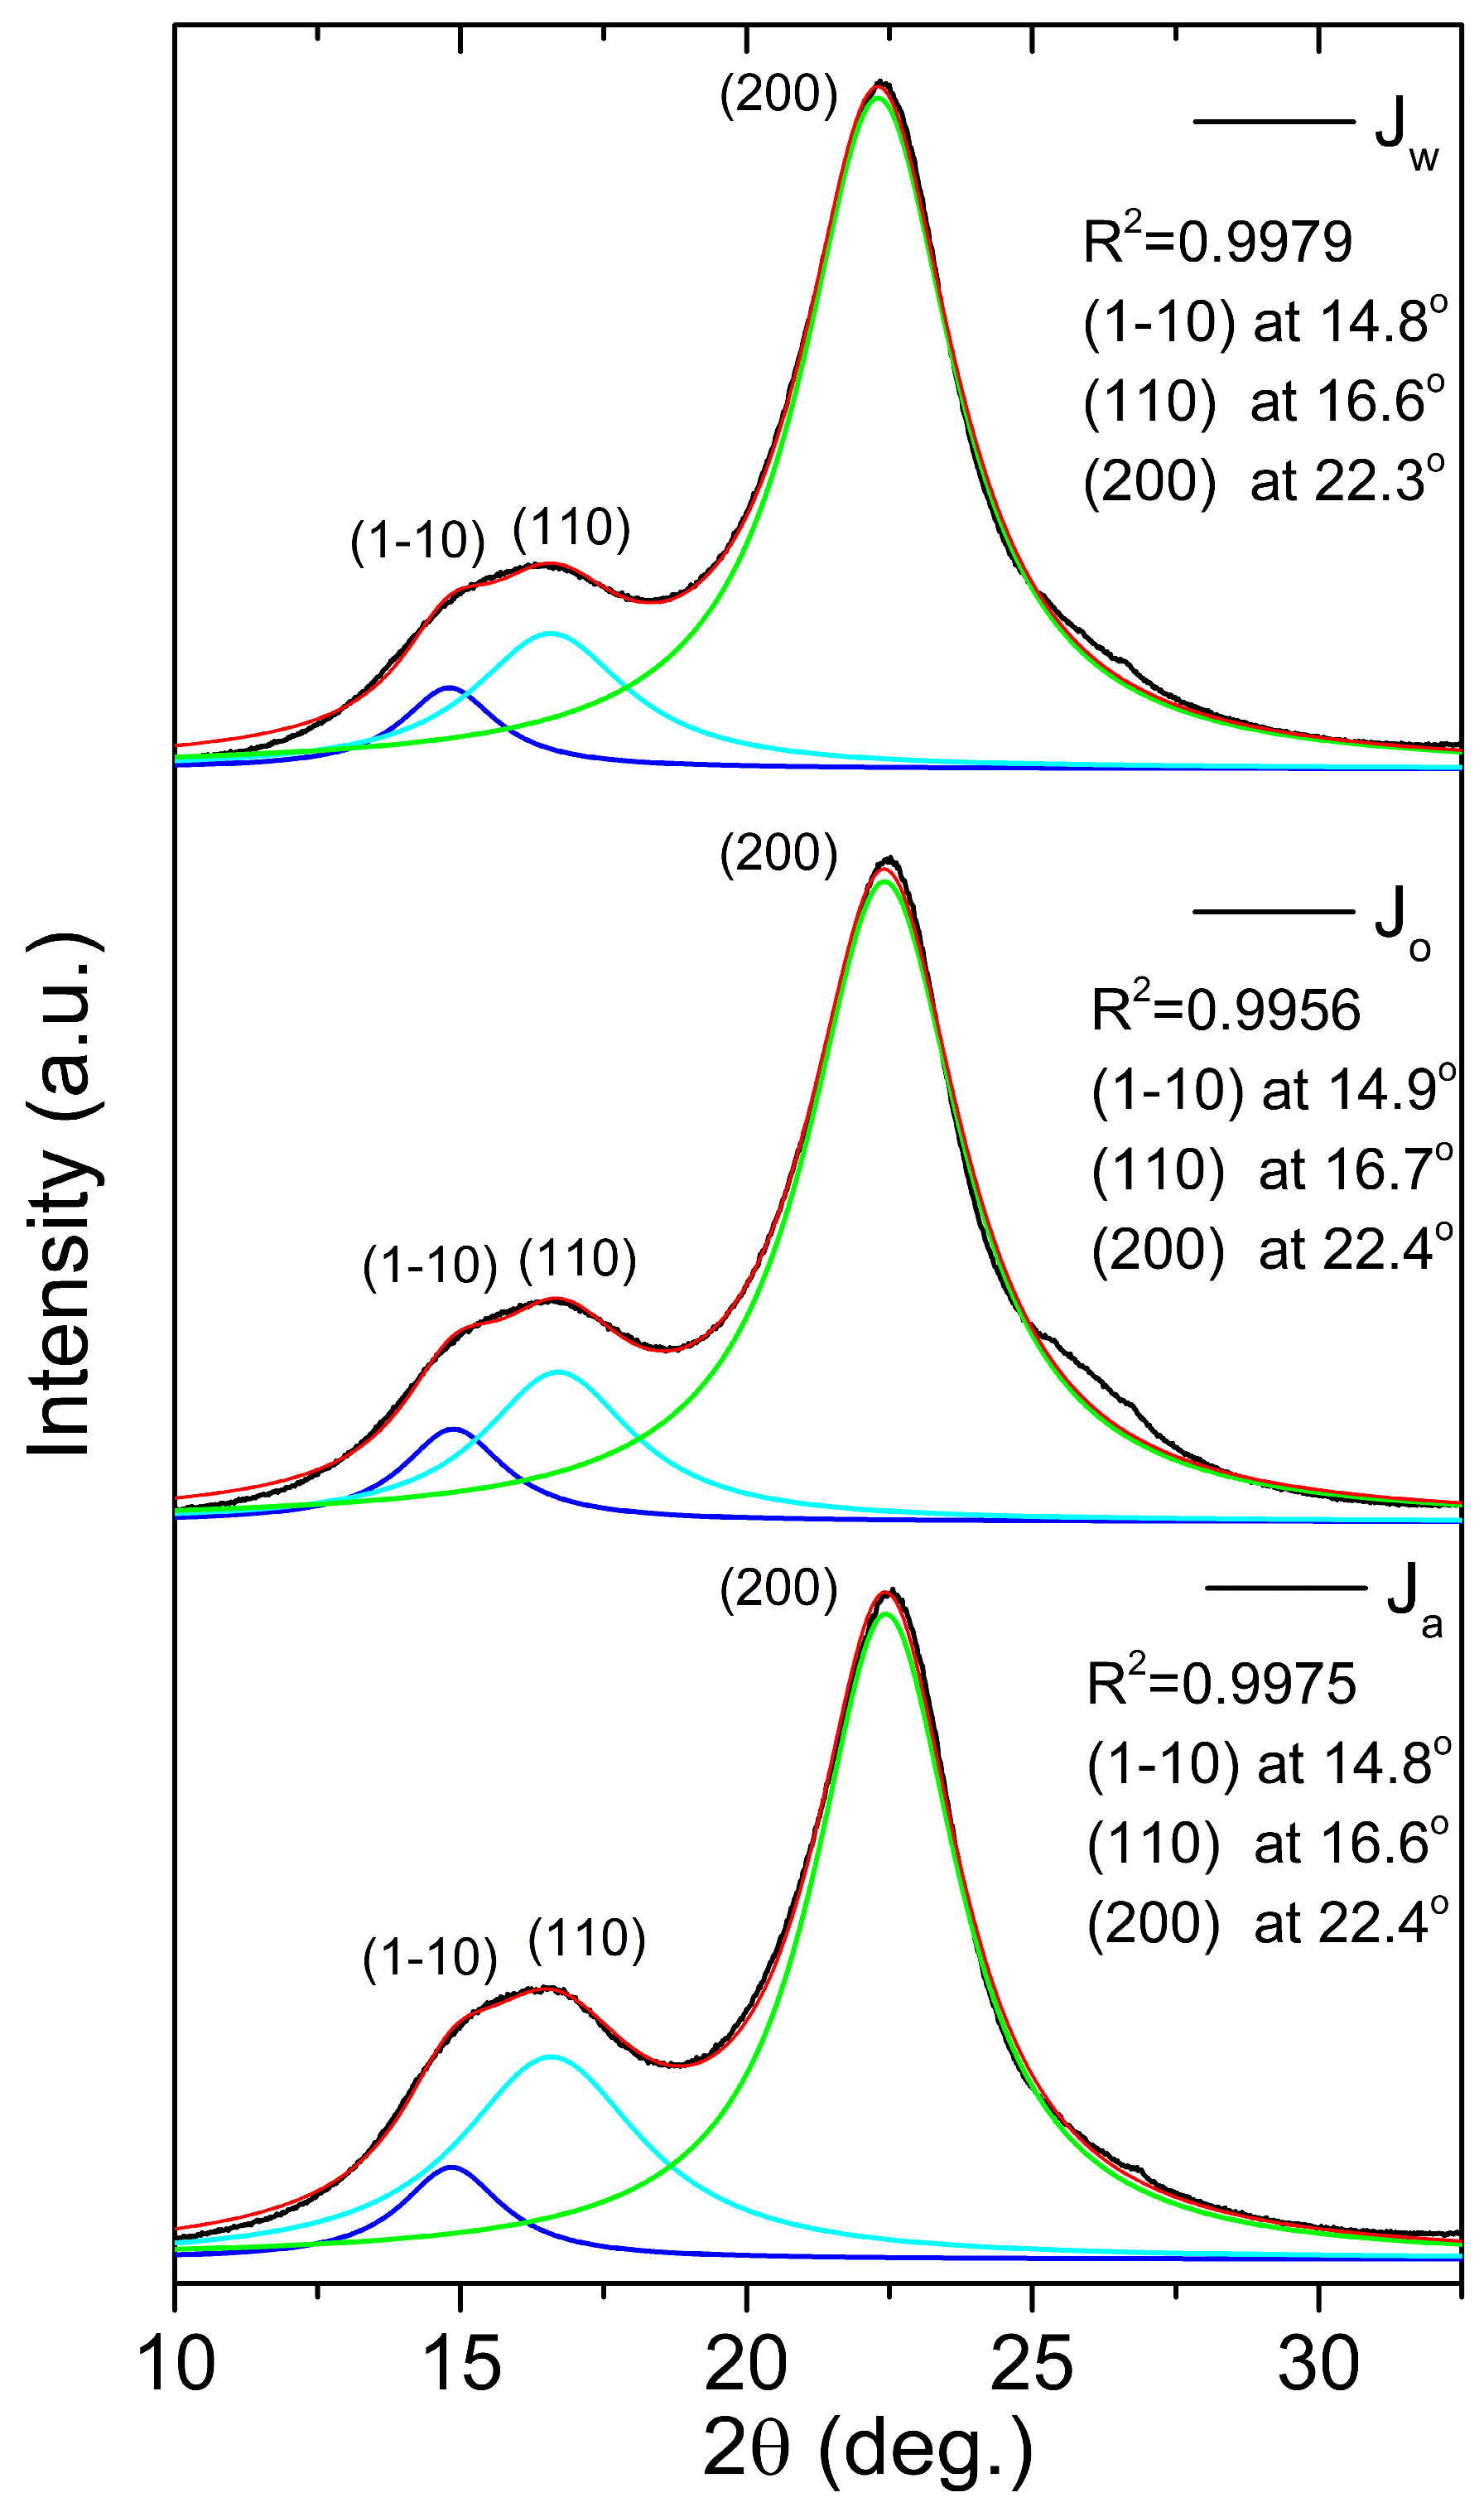
| Sample | Z | Cr.I. (%) | d(1-10) (nm) | d(110) (nm) | d(200) (nm) | D(1-10) (nm) | D(110) (nm) | D(200) (nm) |
| Jw | -11 | 75.0 | 0.60 | 0.53 | 0.40 | 4.14 | 2.58 | 2.59 |
| Jo | -11 | 72.9 | 0.60 | 0.53 | 0.40 | 3.86 | 2.64 | 2.56 |
| Ja | -11 | 70.6 | 0.60 | 0.53 | 0.40 | 3.91 | 2.16 | 2.73 |
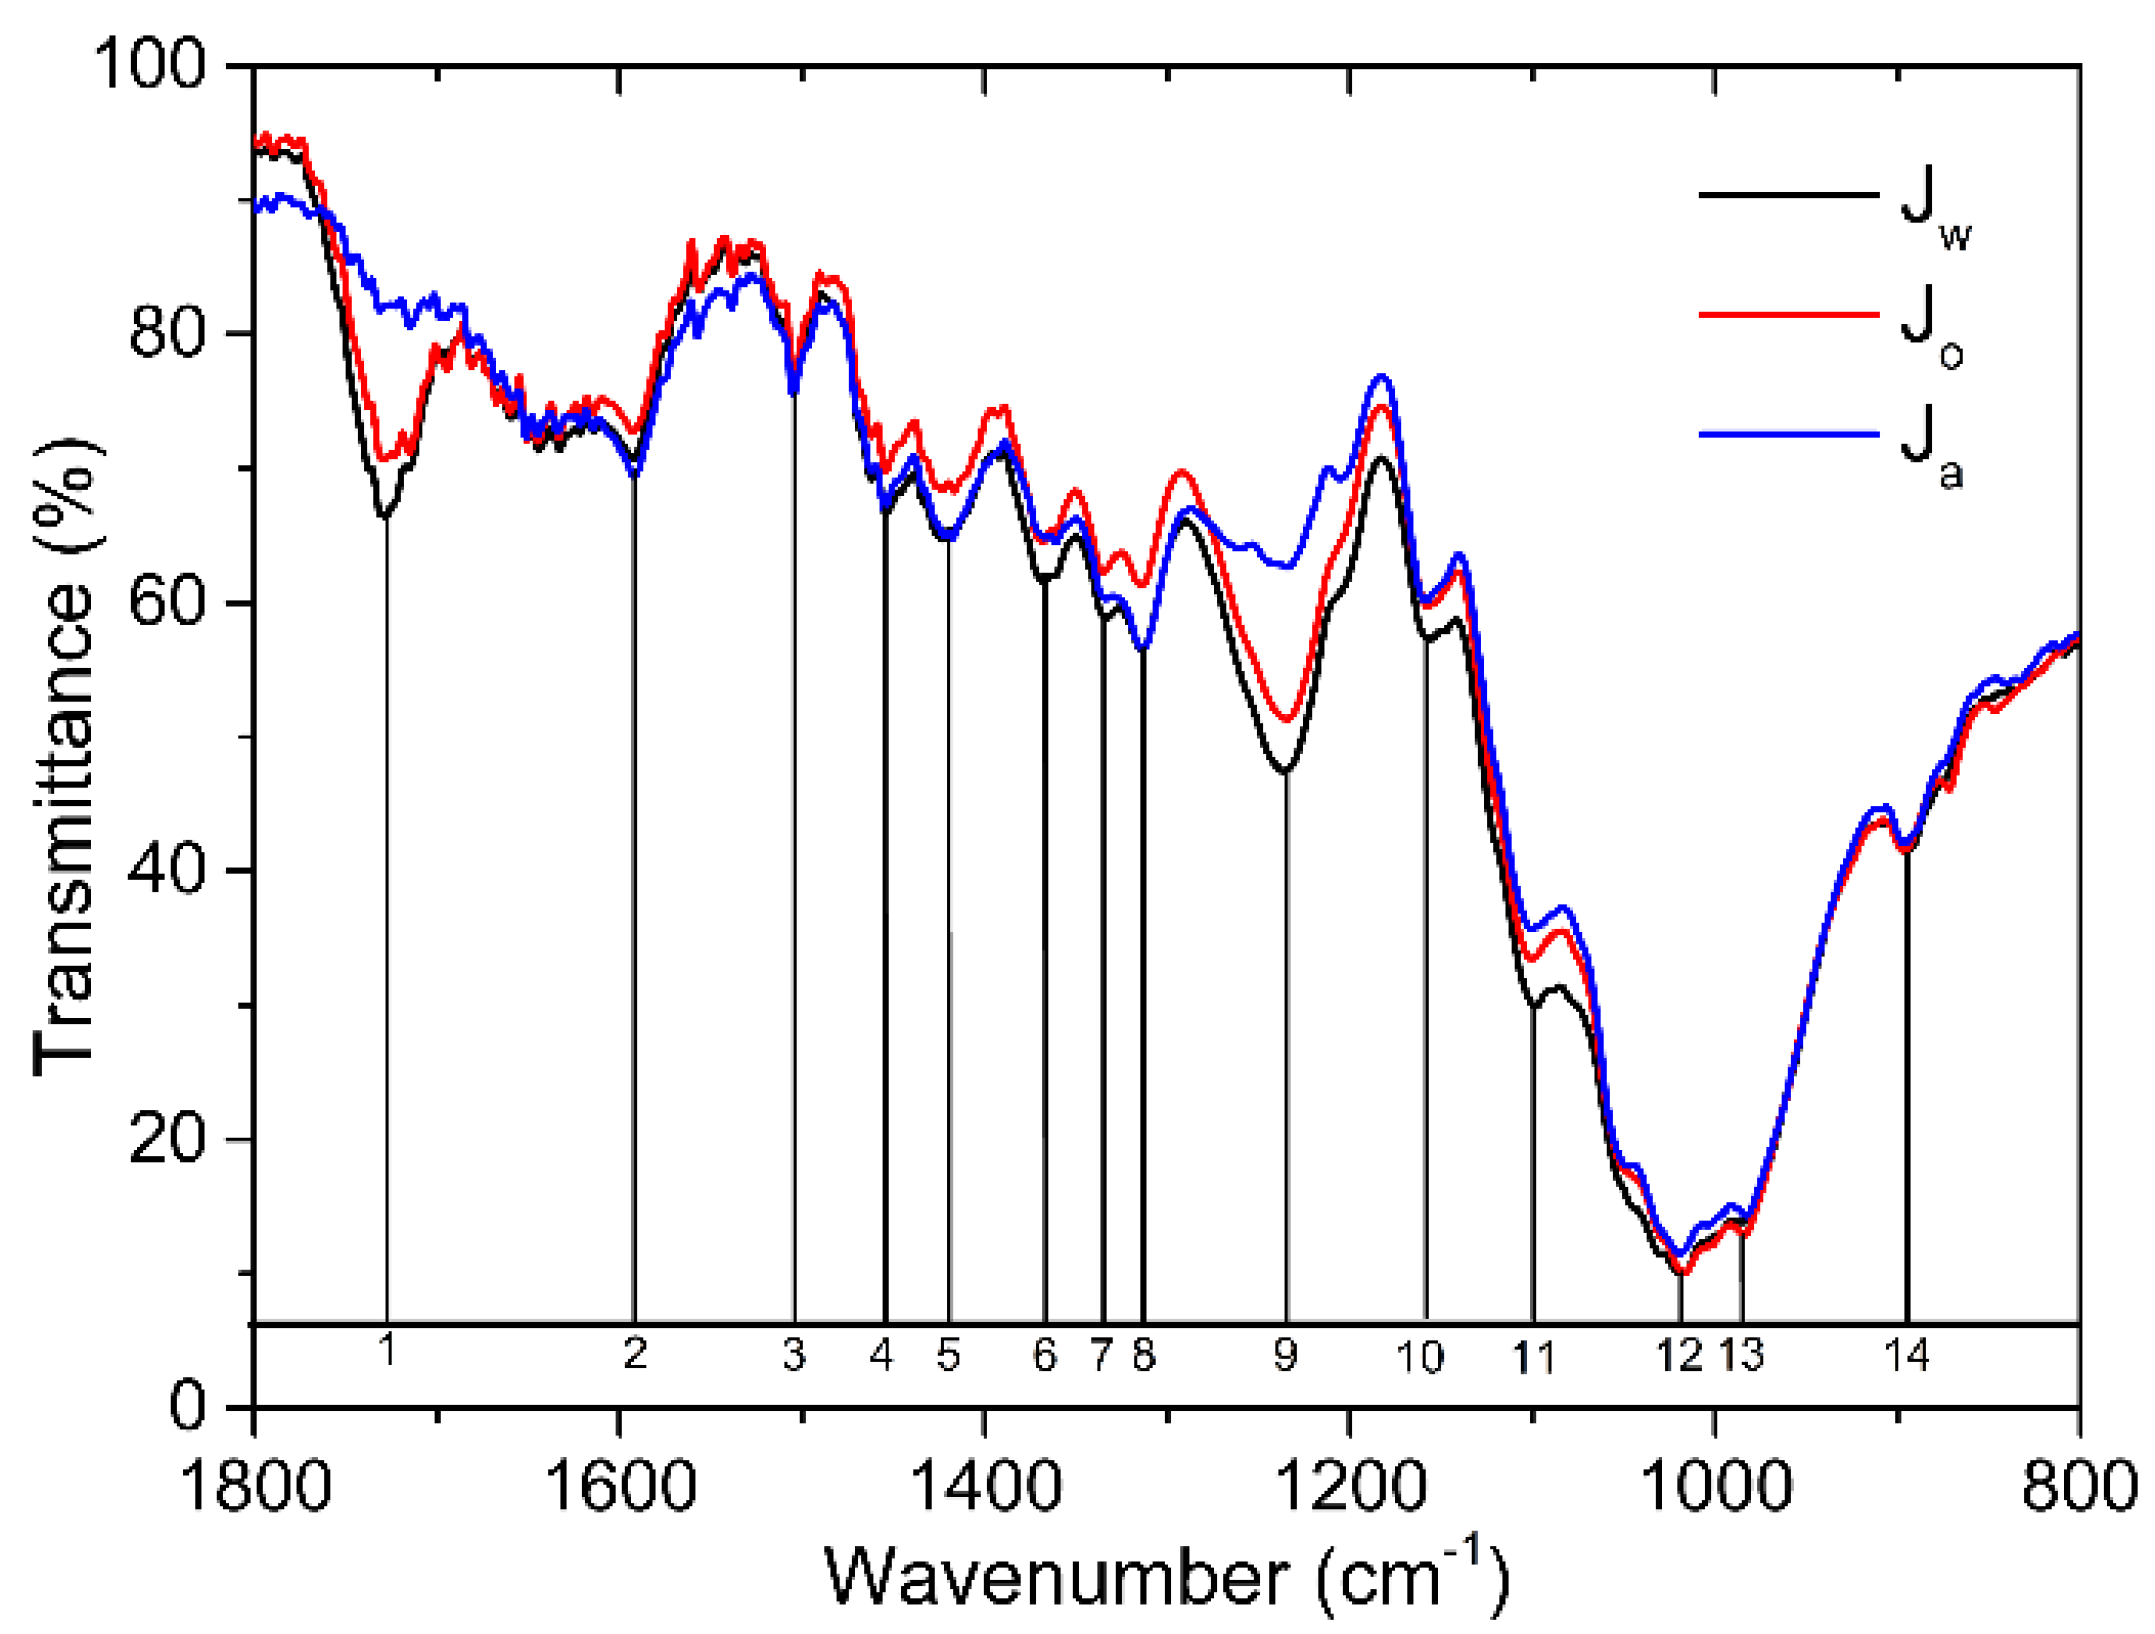
| Wavenumber (cm-1) | Band assignment | |
| 1 | 1727 | HC, C=O stretching in acetyl group and carboxylic group |
| 2 | 1592 | L, Aromatic skeletal vibration HC, (COO- stretching) |
| 3 | 1506 | L, Aromatic skeletal vibration |
| 4 | 1456 | C, HC, O-H in-plane bending |
| 5 | 1420 | C, HC, O-H in-plane bending L, C-H bending in CH3 |
| 6 | 1365 | C, HC, C-H bending |
| 7 | 1335 | C, HC, O-H in-plane bending |
| 8 | 1315 | C, HC, O-H in-plane bending |
| 9 | 1236 | HC, C-O stretching in carboxylic acid |
| 10 | 1155 | C, HC, C-O-C antisymmetric stretching |
| 11 | 1100 | C, HC, C(2)…O(2)H stretching |
| 12 | 1020 | C, C(6)…O(6)H stretching |
| 13 | 985 | C, C(6)…O(6)H stretching |
| 14 | 896 | C, HC, antisymmetric vibration at the β-glycosidic linkage |
Disclaimer/Publisher’s Note: The statements, opinions and data contained in all publications are solely those of the individual author(s) and contributor(s) and not of MDPI and/or the editor(s). MDPI and/or the editor(s) disclaim responsibility for any injury to people or property resulting from any ideas, methods, instructions or products referred to in the content. |
© 2024 by the authors. Licensee MDPI, Basel, Switzerland. This article is an open access article distributed under the terms and conditions of the Creative Commons Attribution (CC BY) license (https://creativecommons.org/licenses/by/4.0/).


