Preprint
Article

Data analysis and inflection point generation algorithm for RPN intermediate range detectors in active nuclear power plants

Altmetrics

Downloads

67

Views

11

Comments

0

Submitted:

17 June 2024

Posted:

17 June 2024

You are already at the latest version

Alerts
Abstract
The nuclear reactor measurement system is a crucial component of the nuclear measurement system in a nuclear power plant. Its primary function is to measure the power distribution within the reactor core using detectors, calibrate, and provide data on core fuel consumption. Therefore, the study of the detectors' reliability is crucial for ensuring the safe operation of the nuclear power system. The article describes the operational mechanism of the gas ionization chamber detector utilized in the intermediate-range detector of the off-board nuclear measurement system. It also analyzes the movement of particles between the plates during the ionization process of the nuclear reaction taking place in the detector. The functional relationship between the current in the recombination region and the ionization region involved in the actual working condition, and the change with the increase of voltage between the plates, is deduced. A mathematical model is established for the number of pulses generated between the plates and the magnitude of the voltage between the plates. Subsequently, the change in the offset of the voltage corresponding to the inflection point of the ping curve and the change rule of the slope of the ping curve are investigated. Combined with the analysis of experimental data, the results show that the initial particle energy of Ar+, the primary sensitive particle on the detector surface, follows a normal distribution and is influenced by the energy loss associated with the initial velocity and the voltage between the plates. The trends of the inflection points and slopes of the ping curves can be utilized to evaluate the performance and operational status of the detector. Combined with the results of the experimental data analysis, the fit is good, and the inflection point currents in the normal state decrease by about 1.5% annually. The intelligent diagnostic system, based on the method studied in this paper, has been successfully implemented in the RPN digital retrofit and upgrade project at Qinshan No. 2 Plant.
Keywords: 
Subject: Engineering  -   Energy and Fuel Technology

1. Introduction

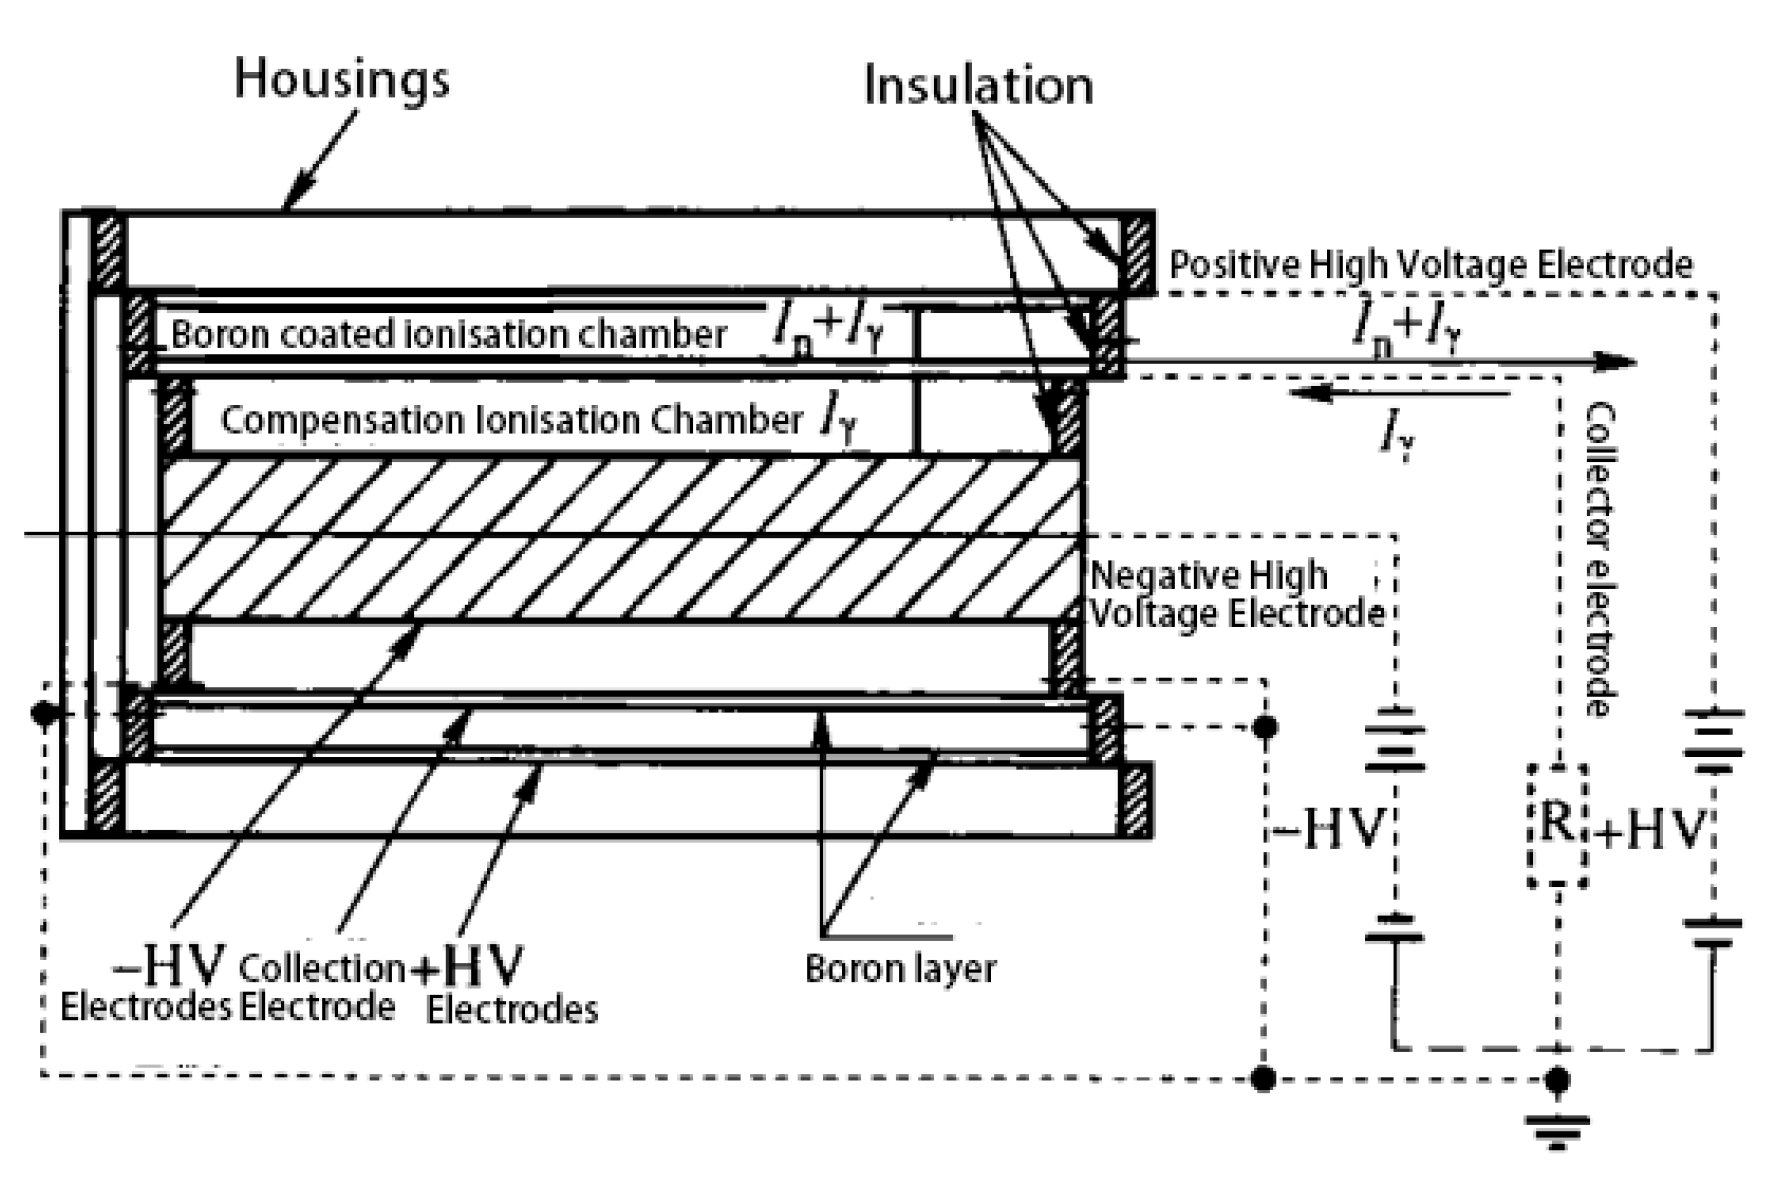
The off-heap nuclear measurement system is a crucial component of the reactor instrumentation and control system. It is utilized for continuous monitoring and control of a nuclear power plant from reactor start-up to full-power operation. The dynamic range of its nuclear power varies by more than 10 orders of magnitude [1]. It is challenging for a single detector and its electronic measurement processing channel to meet the accuracy and reliability requirements for such a wide range of measurements and monitoring. In order to solve this problem, currently in-service detectors are generally divided into three stages according to range. Source-range detectors are used for measuring low-flux neutrons, intermediate-range detectors for intermediate-flux neutrons, and power-range detectors for high-flux neutrons [2]. The intermediate-range detectors are gas ionization chamber type, as shown in Figure 1. The ionization chamber is filled with a mixture of inert gases, primarily argon, at a gas pressure of 100 kPa, with specific compositions of argon (93%), nitrogen (about 6%), and helium (1%) [1]. The electrodes were coated with boron as a sensitive material, and the following reactions occurred under neutron irradiation:
10B + 1n → 7Li + 4α + 2.79MeV (94%)
10B + 1n → 7Li* + 4α + 2.316MeV (6%)
7Li*7Li + γ(0.48MeV)
The cations Li+ and α particles produced by the reaction further ionise the inert filler gas (e.g. argon) in the gas ionisation chamber, the electrons produced are collected by the positive plate and the Ar+ cation produced reaches the other plate under the action of the voltage between the plates and the charge moves to produce a pulse, which achieves the detection function[3] . The detector operates in accumulation mode, where the size of the pulse current is proportional to the number of incident neutrons and incident γ in the detection environment. The internal ionisation chamber reacts only with γ-rays to generate a current, which is also proportional to the number of incident γ-rays. In practice, by adjusting the negative high pressure of the compensating ionisation chamber, the sensitivity of the two ionisation chambers to γ is close to the same, so as to realise the compensation function of offsetting the γ current, thus making the detector output current positively proportional to the rate of neutron injection at the probe of the ionisation chamber[4] , and its structure is shown in Figure 2.
At present, most of the experimental studies related to detectors focus on specific applications in engineering practice. This includes detecting and determining detector faults, as well as finding corresponding solutions. Reng Yi et al. [5] provide a comprehensive debugging scheme for off-heap nuclear instrumentation; Chen Siming et al. [6] propose a scheme for the application of our detectors in reactor criticality and power upgrading. Meng Fanfeng et al. [7] used the measurement signals from the intermediate range of the off-board nuclear instrumentation to validate the dynamic stick-carving test data. Hu, Zhuxuan et al. [8] investigated the combustion consumption of the detector over its design lifetime and studied the reduction in lifetime corresponding to a 1% decrease in its sensitivity. Lu Jian et al. [9] provided an overview of the detector overhaul process in real-world environments. They discussed equipment failures of the off-heap nuclear power measurement system detectors over the past 15 years, their impacts, preventive measures, and suggestions for future operation and maintenance (O&M) improvements.[10]. There are fewer studies on trend analysis of data over the years and on making failure judgments based on data analysis. There is also a lack of unified methods and theories to analyze and process the data collected in the field. Field testing of in-service detectors and analyzing the collected data is an important guarantee for the normal operation of detectors. Therefore, it is particularly important to study the segmentation of the voltage-pulse current curve and the corresponding functional expressions of each segment. It is also crucial to propose a method for processing the data in segments and obtaining the precise inflection point. By fitting actual experimental data, analyzing the trend of changes in data from multiple operating cycles of the same detector, and providing evaluation and calibration standards, theoretical basis can be provided for actual maintenance conditions.

2. Study of the distribution law of the detector power curve

2.1. Principle and Curve Distribution Law of Gas Ionisation Chamber Detectors

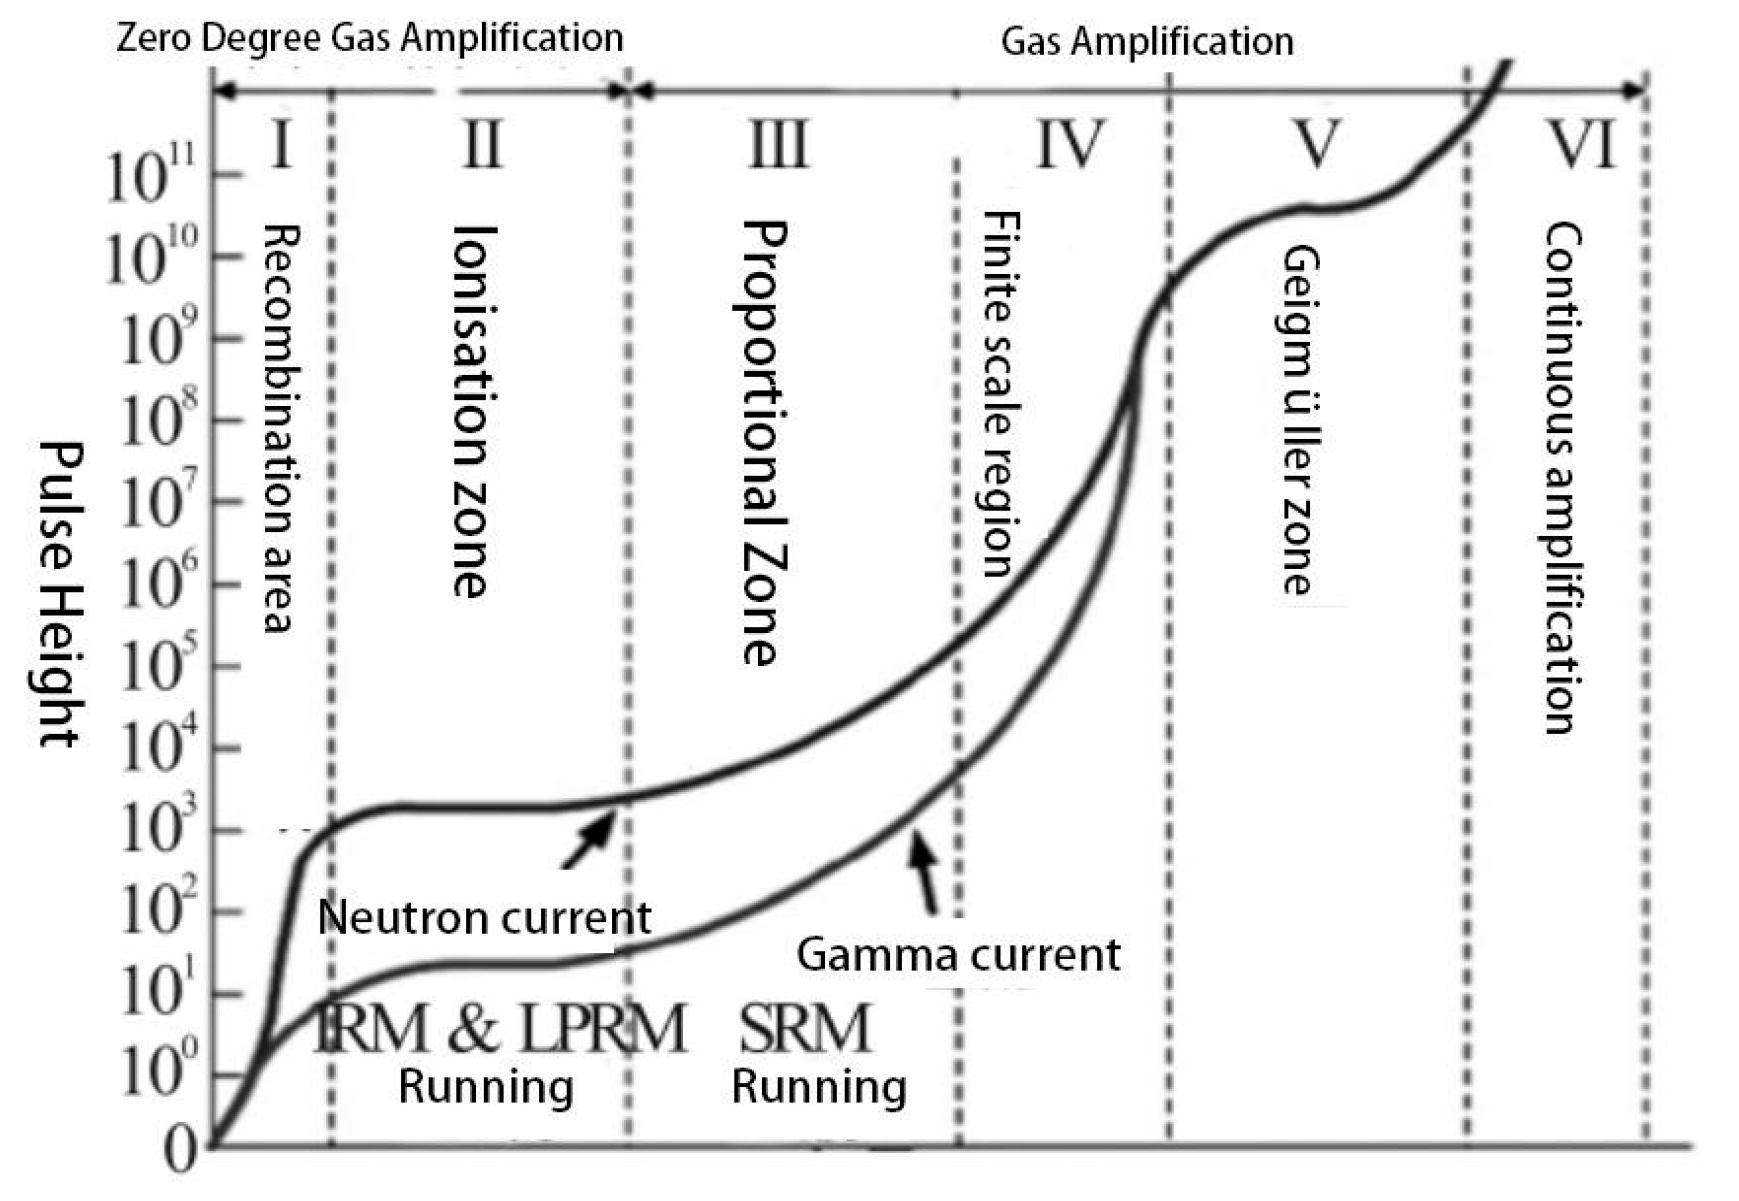
When the gas ionization chamber detector is in use, the voltage-current variations at different stages are shown in Figure 3 as the voltage applied on both sides of the pole plate continues to rise:
Zone I is the recombination region. Under low voltage, some free electrons and positively charged atoms produced by neutron reactions will recombine into uncharged atoms, which cannot be completely collected by the two sides of the plate. Zone II is the ionization region. Under high voltage, most of the free electrons and positive ions produced by the impact will be collected by the positive and negative electrodes, respectively, generating a pulse current. An inflection point exists between zones I and II, which is used to distinguish between the two zones.
In practice, most of the voltage-current data distributions involve only the recombination and ionization regions[11]. α particles and Li+ particles produced by the nuclear reaction of neutrons hitting the boron coating are ionized by argon gas in the space around the coating to produce Ar+. The rate of production of Ar+ remains constant at an approximately constant neutron flux. The recombination rate of Ar+ particles produced is positively correlated with their concentration and reaches a steady state when the production rate equals the recombination rate as the concentration increases. At this point, the Ar+ particles are mainly concentrated near the boron coating, and the amount of Ar+ remains constant in the steady state. There is a competitive relationship between the recombination of argon after being ionized and the adsorption of positive and negative particles generated after ionization by the positive and negative plates, respectively. The total energy of the particles in the entire system during the steady-state phase can be considered constant.
The energy distribution of a particle at equilibrium can be described by the Boltzmann function:
  n E = N e E k T
According to the Maxwell-Boltzmann distribution of particles, their energy distribution follows a normal distribution. The partial velocities Vx, Vy, and Vz in each direction of the 3D XYZ coordinates also follow a normal distribution [12].
Z = V x 2 + V y 2 + V z 2
It can be deduced that: (In the following text, N(μ, σ2 ) denotes the normal distribution, the two parameters are the mean (μ) and the variance (σ2 ), and Φ(μ, σ2 , a) denotes the distribution function of the normal distribution N(μ, σ2 ), i.e. Φ(x) = x N ( μ σ 2 ) , the value at x = a)
1. The initial energy distribution of the particles in the vertical pole plate direction obeys N(μ, σ2 )
2. The number of particles with energy less than a in the direction of the perpendicular pole plate obeys: f(a) = Φ(μ, σ2 , a )
3. The number of particles above a certain energy a in the direction of the perpendicular pole plate is: f(a) = 1 - Φ(μ, σ2 , a)
It is evident from the detector design that a certain energy threshold is necessary for a particle to reach the polar plate, generate a pulse, and be recorded. That is, the particle still requires a certain amount of energy to generate a pulse current after reaching the pole plate. When particles are set perpendicular to the pole plate direction in the X direction, they reach the other pole plate, generating pulses that are recorded. The required energy remains constant. As the voltage between the pole plates increases while the distance between them remains constant, the energy acquired by the particle moving through the pole plate is directly related to the increase in the energy needed for the particle to be captured perpendicular to the pole plate's direction. This energy increase is followed by a corresponding decrease in the total number of captured particles. There is the following derivation:
1. assuming that the total energy required for the particle to cross the pole plate and be accepted is 1.
2. Percentage of energy required for a particle to reach and be recorded under conditions where the voltage provides a percentage of energy to the particle as b: 1 - b
3. the number of particles that can reach and be recorded at a voltage percentage of b: f(b) = 1 - Φ(μ, σ2 , 1 - b)
4. Collation gives the number of particles that can be reached and recorded at a voltage percentage of b: f(b) = Φ(μ, σ2 , b)
where Φ(x) distribution is the number of particles arriving at the pole plate as a function of voltage. the parameters σ and μ of Φ(x) will be determined from the detector hardware parameters such as the distance between the pole plates, the size of the base threshold, and the initial energy distribution of the particles in the perpendicular pole plate direction.
where the detector pulse height should be 0 when voltage = 0. This is obtained from the law of relationship between the parameters of the Φ(x) distribution function and the function value:
1. The parameter σ of the Φ(x) distribution is approximately equal to 1/3 the length of the reorganisation region (according to the 3sigma principle)
2. Φ(x) distribution has values from 0-1, corresponding to 0%-100% of the maximum value of the pulse current in the recombination region (rightmost value)
3, the parameter σ of the Φ(x) distribution can be approximated as the maximum voltage value in the 1/2 recombination region
The above serves as the basis for the analysis of the curve basis function Φ(x).

2.2. Derivation of Particle Energy Loss Laws for Gas Ionisation Chambers

The interaction of charged particles with gases in gas ionization chambers is primarily governed by inelastic collisions with the electrons outside the nucleus of gas atoms or molecules. This leads to ionization or excitation of the gas atoms or molecules, which constitutes the main mode of energy loss. The relationship between specific ionization losses and various parameters can be described by the Bethe-Bloch equation (Eq. 6) [13].
d E D x = K z 2 Z A 1 β 2 1 2 ln 2 m e c 2 β 2 γ 2 T m a x I 2 β 2 δ β γ 2
K = 4 π N A r e 2 m e c 2
r e = 1 4 π ε 0 e 2 m e c 2      
Tmax: maximum energy transfer in a single collision NA: Avogadro's constant
z: incident particle charge me: electron mass
Z: atomic number of the medium's atoms β: particle velocity/c
A: atomic number of the medium atom γ: (1-β2)-2
δ: Correction for density effects      dx: mass thickness
1, the ionisation loss is independent of the mass of the incident particle, particles with the same charge and speed have the same ionisation loss in the same substance.
2. Ionisation loss is proportional to the square of the charge of the incident particle
3. At non-relativistic velocities, ionisation losses are inversely proportional to the velocity squared.
Under the influence of the following parameters: initial velocity V0 in the x-direction, and different electric field strengths E (a is the acceleration of the particle under the strength of E), the energy loss of the same particle has the following formula:
E l o s s = 0 s k 1 V 0 + a t 2 x
S is the distance between the plates, and constant , the integration object is the particle in the distance between the plates forward
E l o s s = 0 t   m a x k 1 V 0 + a t 2 1 2 a t 2 + V 0 t
t m a x is the arrival time at the pole plate
E l o s s = 0 t   m a x k 1 V 0 + a t 2 ( a t + V 0 ) t
reduced fraction
E l o s s = k a ln a t + V 0 0 t m a x
on account of
S = 1 2 a t 2 + V 0 t
the reason why
E l o s s = t = V 0 ± V 0 2 + 2 a S a
Since t is constant > 0
E l o s s = t = V 0 + V 0 2 + 2 a S a
Substitute to get
E l o s s = k 2 a ln ( 1 + 2 aS V 0 2 )
As can be seen from Equation 14, the energy loss decreases with an increase in the voltage between the pole plates and with a higher initial velocity of the particles. Among these factors, the impact of the voltage change between the pole plates is significant, and the fitting of the relationship between them will be discussed later.

3. Research Data Collection and Data Analysis

3.1. Field Experiment Data Collection and Analysis

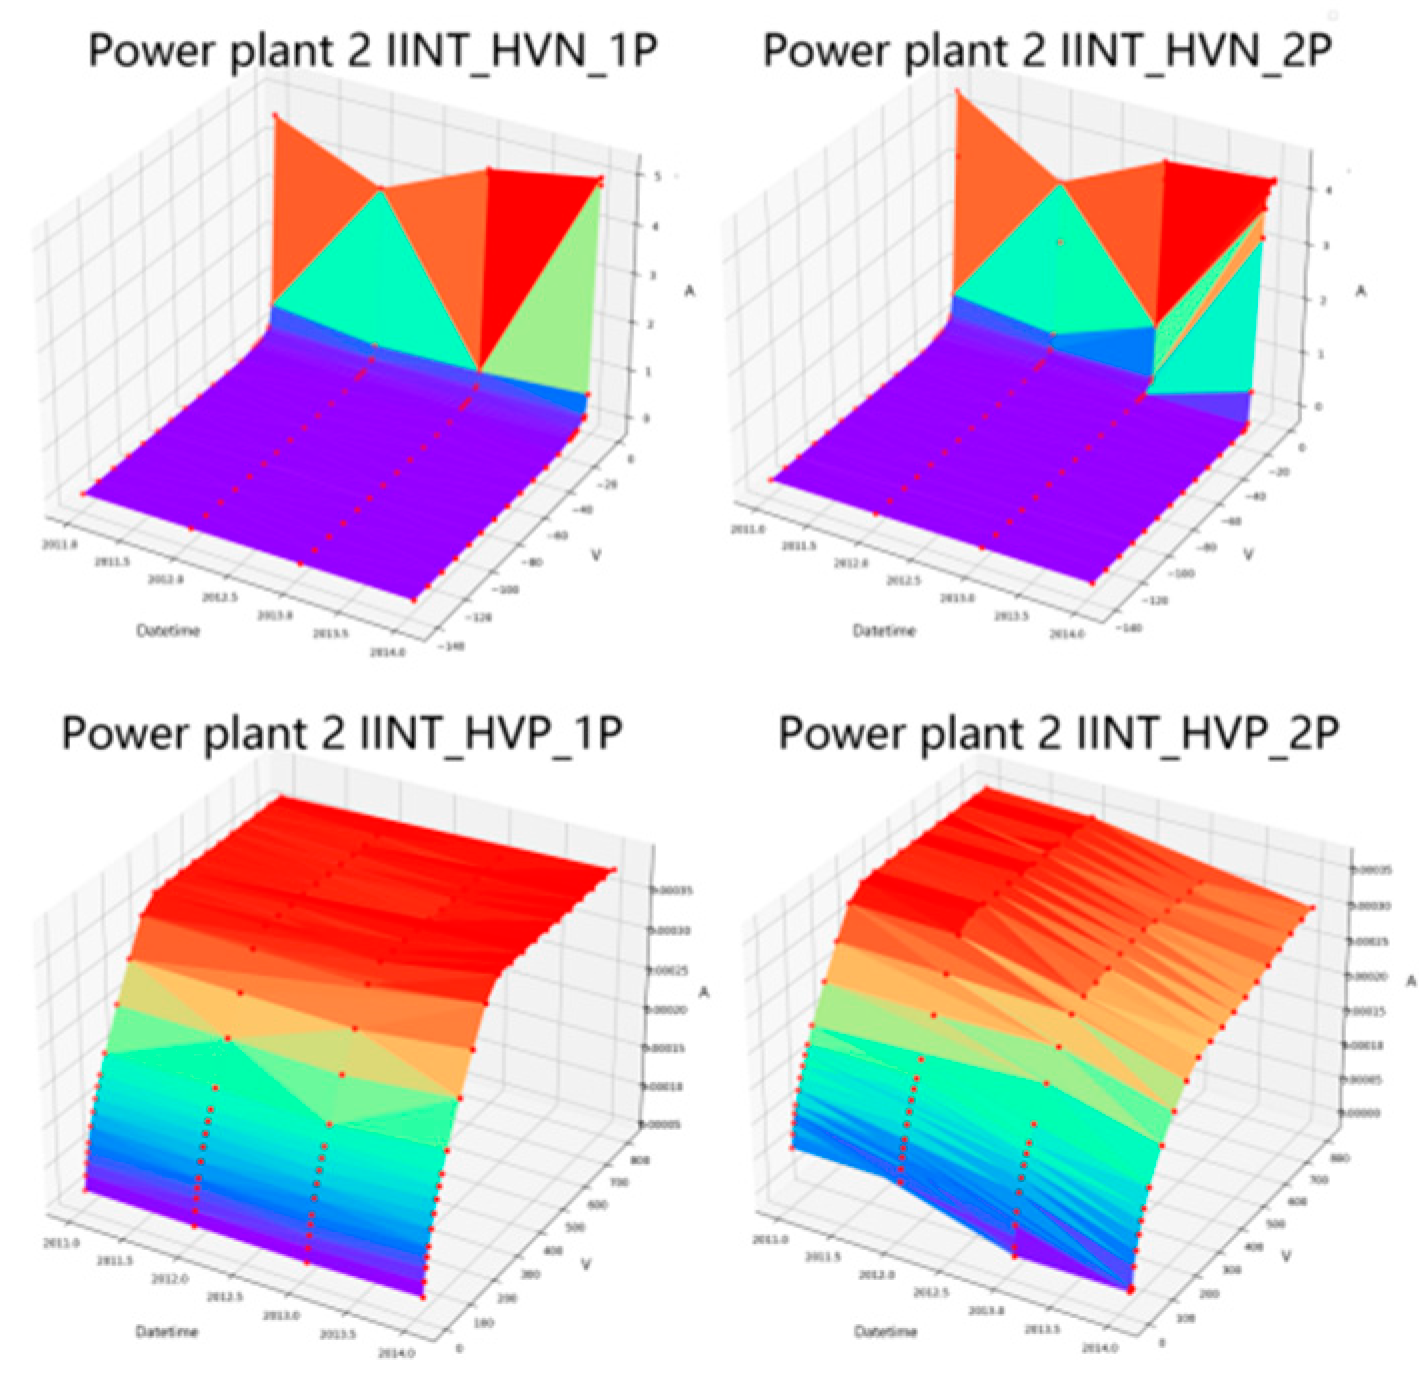
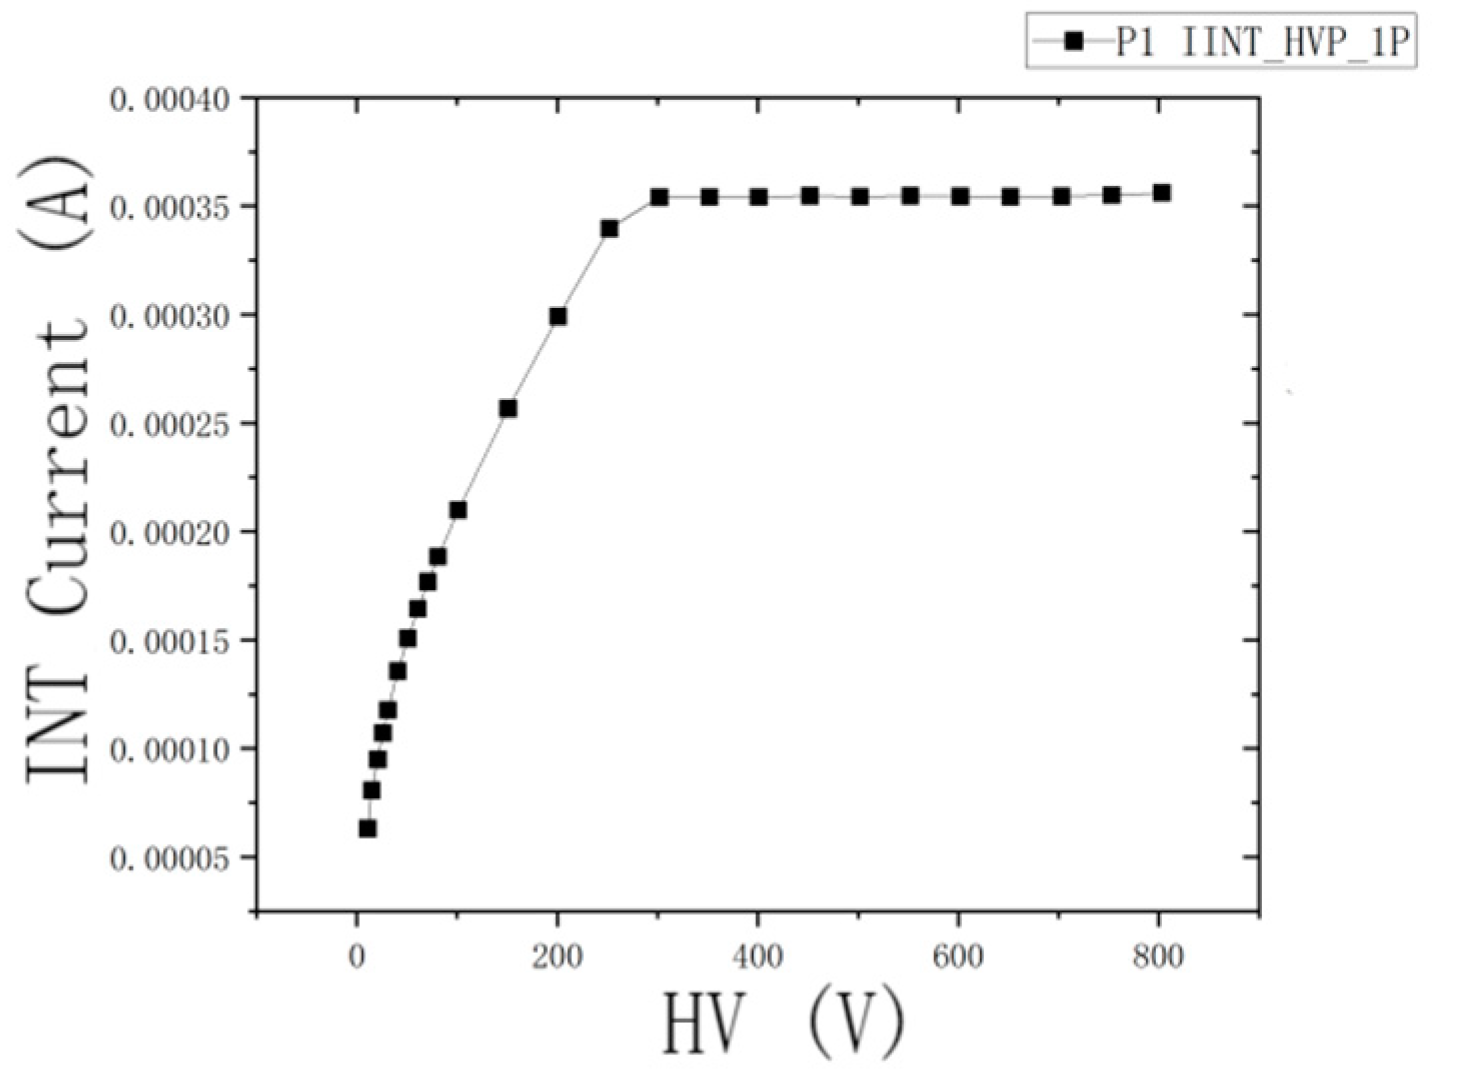
The field test data from the detectors of the four sets of off-heap nuclear measurement systems (RPN) in units 1 and 2 of the Qinshan II nuclear power plant have been collected and analyzed. From the intermediate-range detector (IIT) data of Unit 2 (shown in Figure 4), it can be observed that there is a cyclic pattern of change in the data.

3.2. Processing of Experimental Data

(1) Two divisions
Since the experimentally collected data are mainly distributed in the recombination and ionization regions (i.e., regions I and II above), they are treated by two functions fitted separately. The two functions have an intersection point between two of the data points, which is called an inflection point on the function. The data point that is relatively close to that point is the split point to be found, known as the inflection point in the data.
During the search for inflection points, it is observed that the overall slope remains relatively constant until the inflection point emerges. When the inflection point is included in the dataset in region II, the slope of the fitted function and the fitting error undergo significant changes, often by orders of magnitude. This point can then be identified as an inflection point in the data.
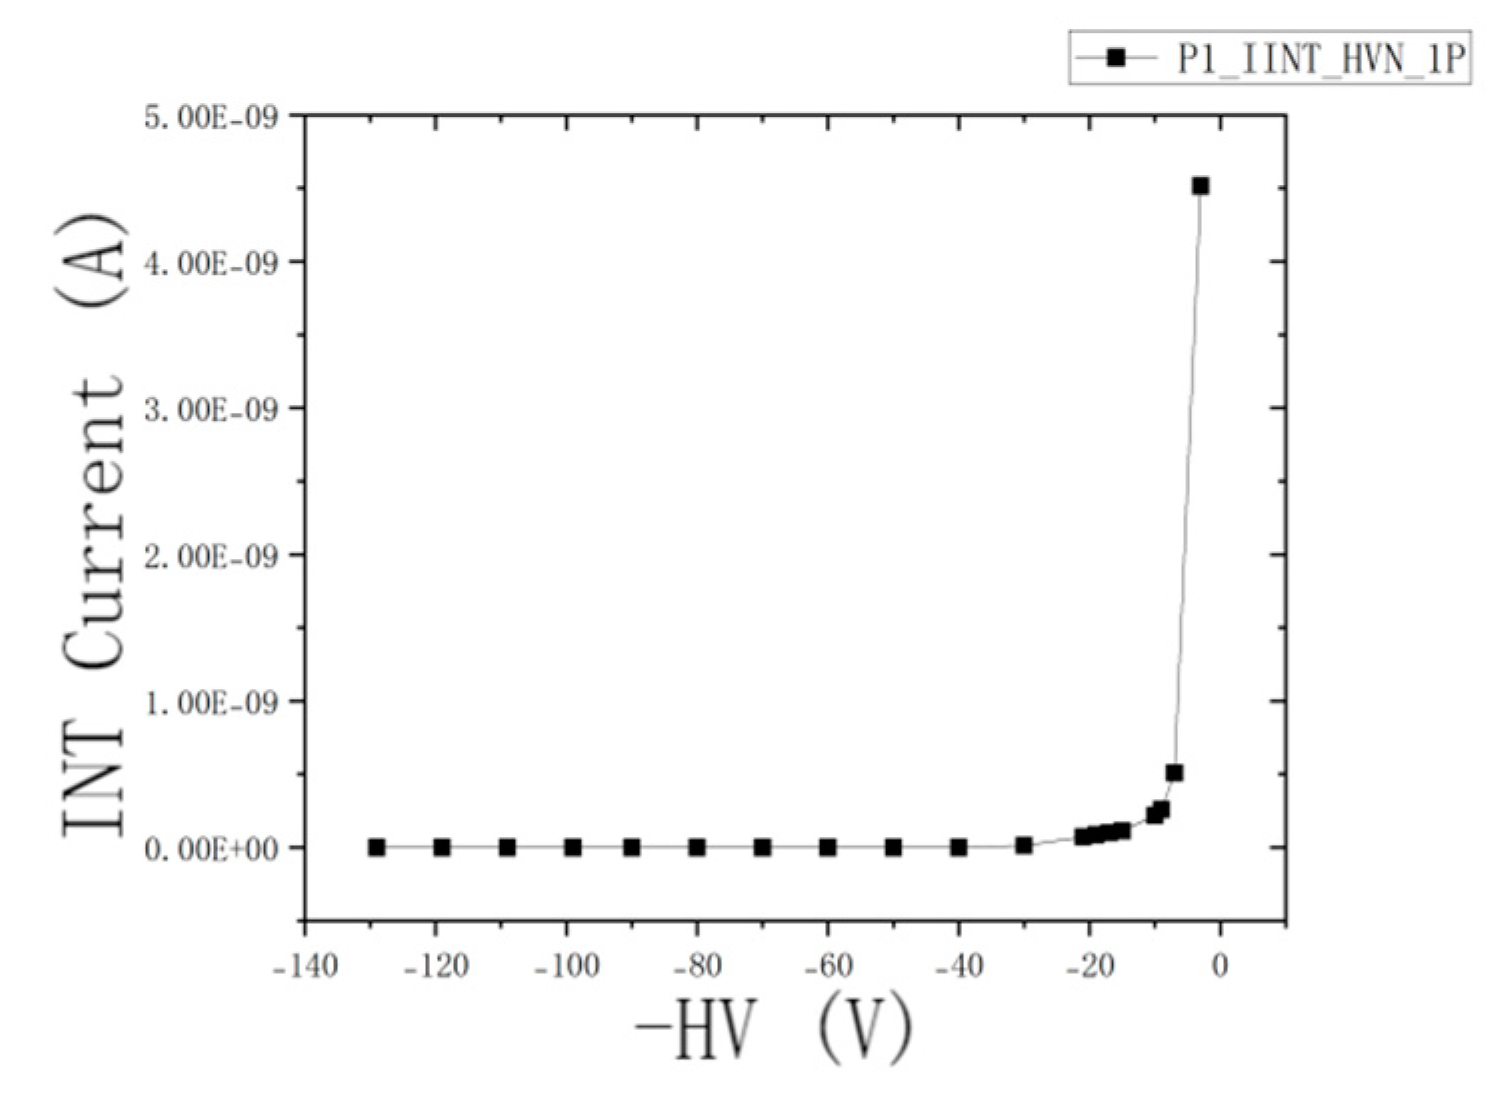
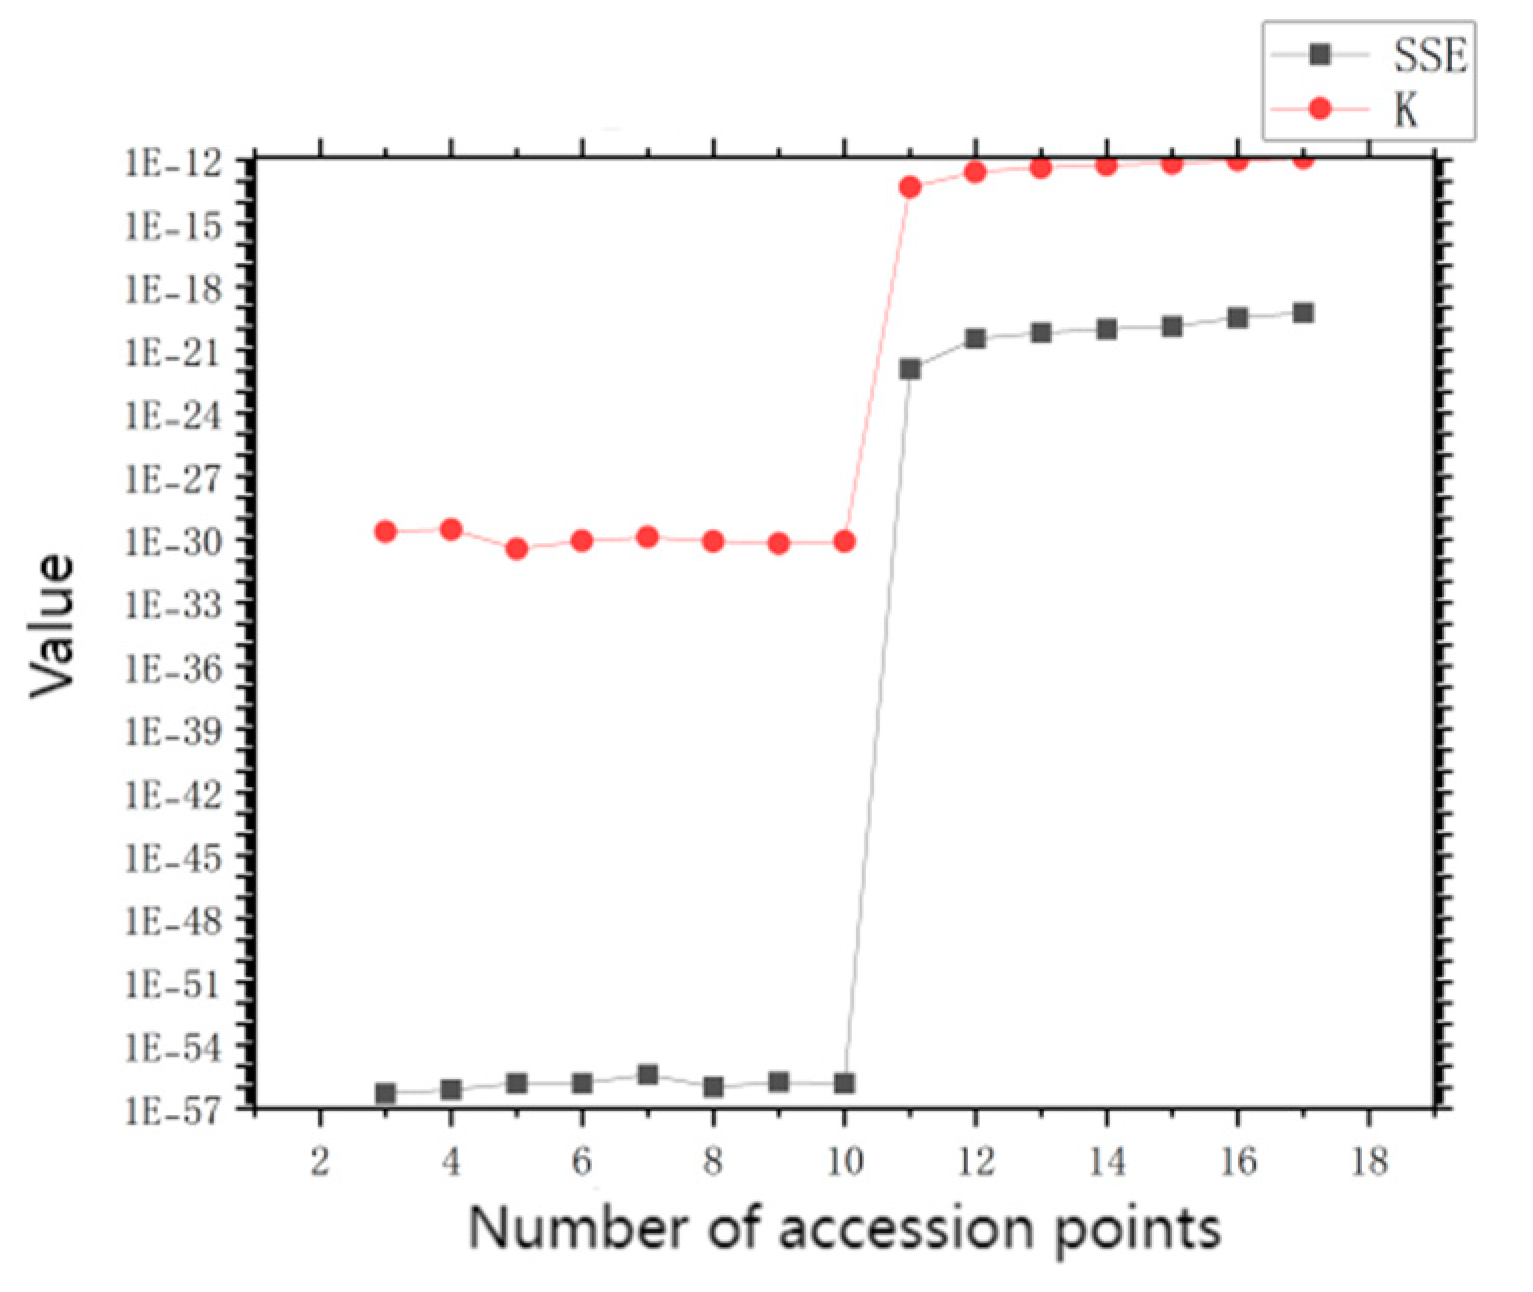
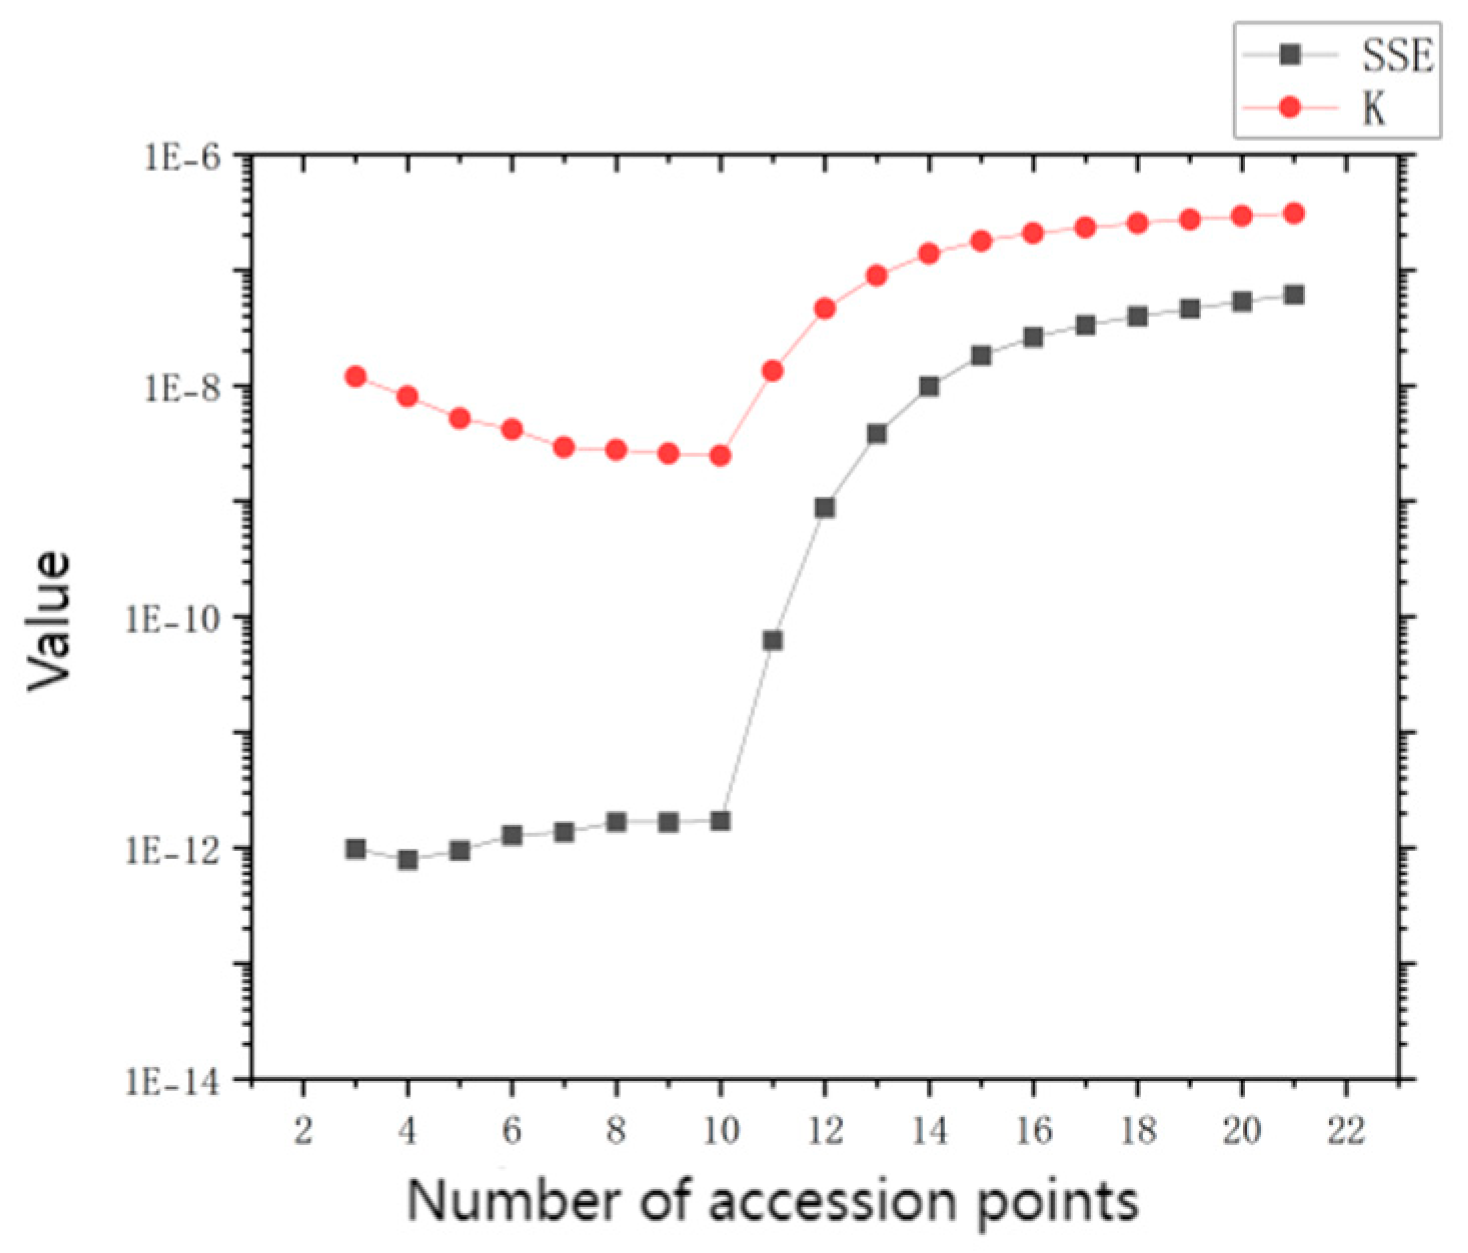
In the process of quantitative fitting error, the method of calculating the sum of squares of residuals and SSE (Sum of Squares for Error) is used to reflect the discrete status of each observation for each sample. The raw data are shown in Figure 5 and Figure 6, while the results obtained from the experiments are displayed in Figure 7 and Figure 8.
The analysis of the data results obtained in Figure 6 indicates that the 11th data point in the figure is the inflection point. The residual sum-of-squares thresholds for determining the inflection point are as follows: the sum of squares error (SSE) for positive high-voltage (HVP) should be less than 1*1011, and for negative high-voltage (HVN) it should be less than 1*1022. It can be assumed that the first value exceeding these thresholds can be considered as the data inflection point. From the figure, it can be seen that there is a significant order of magnitude change in the K value corresponding to the parameters near the inflection point.
(2) Multi-segment division
For individual intermediate-range positive high-voltage detector data, the last few data points enter the scaling region because of the relatively fixed detector characteristics and the voltage range of the manually measured data. If left untreated, this can have a devastating effect on the accuracy of the ping curve fitting results. To address this problem, a method is needed to find the most appropriate set of consecutive data points among the data points for ping curve fitting and to assess the accuracy of the identified ping curves.
The following factors are used to assess the accuracy of the ping curve:
1. The sum of the squares of the residuals of the points in the ping curve and the fitted ping curve is known as the Sum of Squared Errors (SSE). It is used to evaluate the likelihood that the points in the point set form a single curve at a time. The smaller the SSE, the higher the confidence level.
2. Number of points in the point set of the ping curve. A minimum of three points in the point set of the ping curve is required. The confidence level increases with more points in the set, assuming other factors remain similar.
3. Slope of the fitted ping curve. In general, the ping curve is the least variable part of the entire data segment. The smaller the slope, the higher its confidence level, assuming other factors are similar.
Give the error expression:
Loss=SSE×(Rate(n-3) )×k2 (3-18)
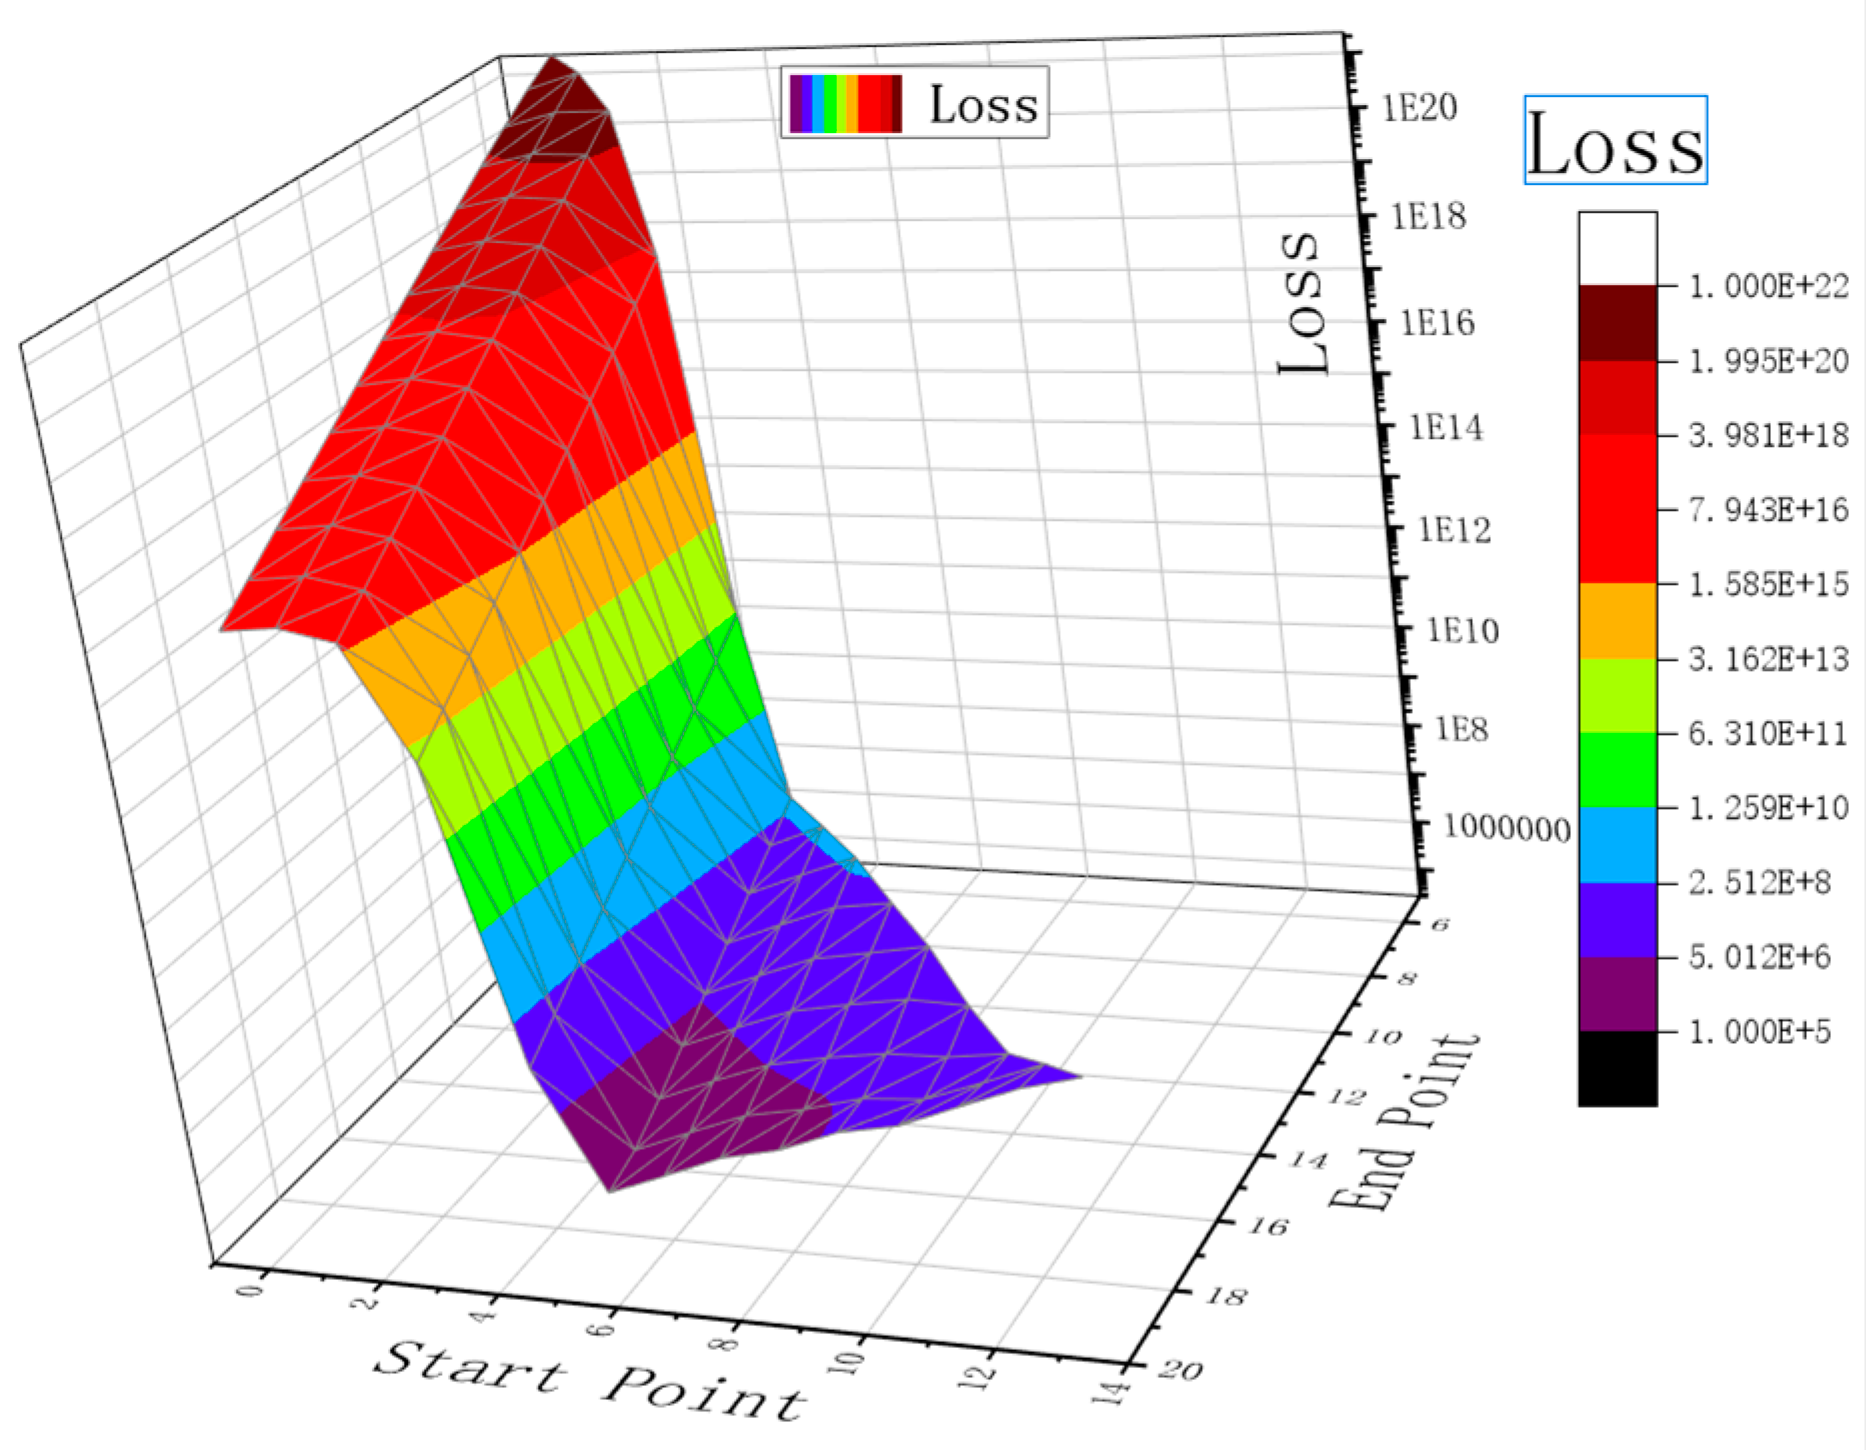
Where SSE represents the sum of squared residuals value, n stands for the number of points in the point set, and k denotes the slope of the fitted curve. The parameter "Rate" represents the trade-off coefficient for the increase in Sum of Squared Errors (SSE) resulting from the increase in the number of points in the point set. After experimentation, it was found that setting the rate to 0.35 better separates the ping curves.
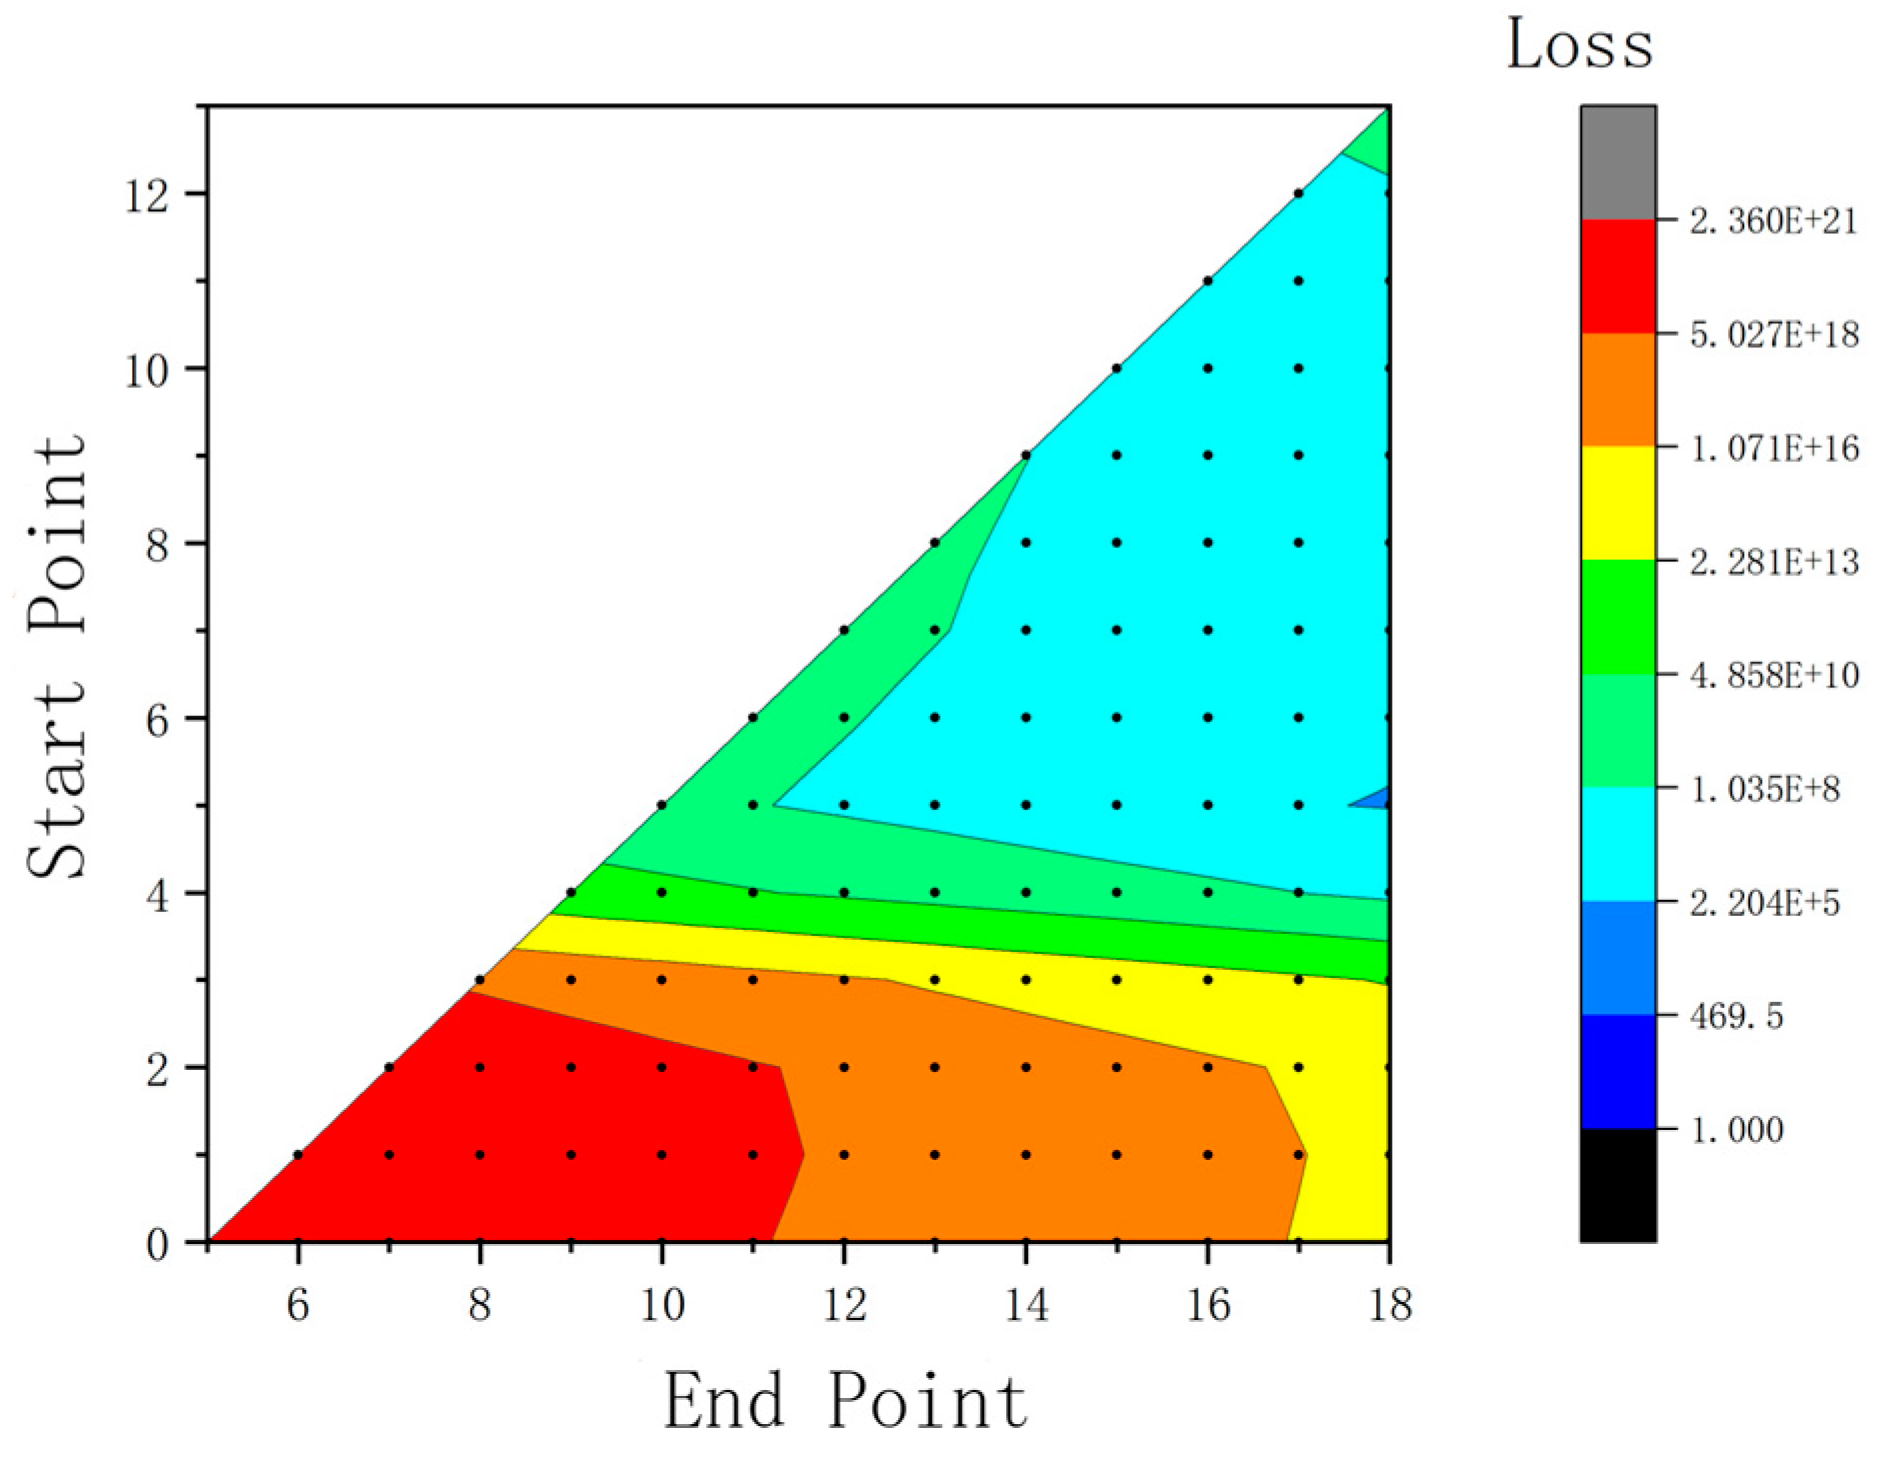
The optimal ping curve is determined by exploring all potential start and end positions of the ping curve and identifying the start and end points that correspond to the smallest loss value. The variation of loss between two points for a set of intermediate-range high-voltage detector data is shown in the Figure 9 and Figure 10. It can be seen that around the final result (starting point of 5 and ending point of 18), both the addition and subtraction of points result in a significant increase in loss. It is worth noting that the expression and parameter settings of the loss function are appropriate.
The above two segmentation methods can be compared with each other to get an accurate data segmentation method.

3.3. Analysis of Detector Data and Its Correction Study

In the coupled analysis of data processing in the recombination region, the setup function is over the (0,0) point, i.e., the current is 0 when the voltage between the pole plates is 0; the recombination region curve intersects the ping curve, and the whole curve is continuous.
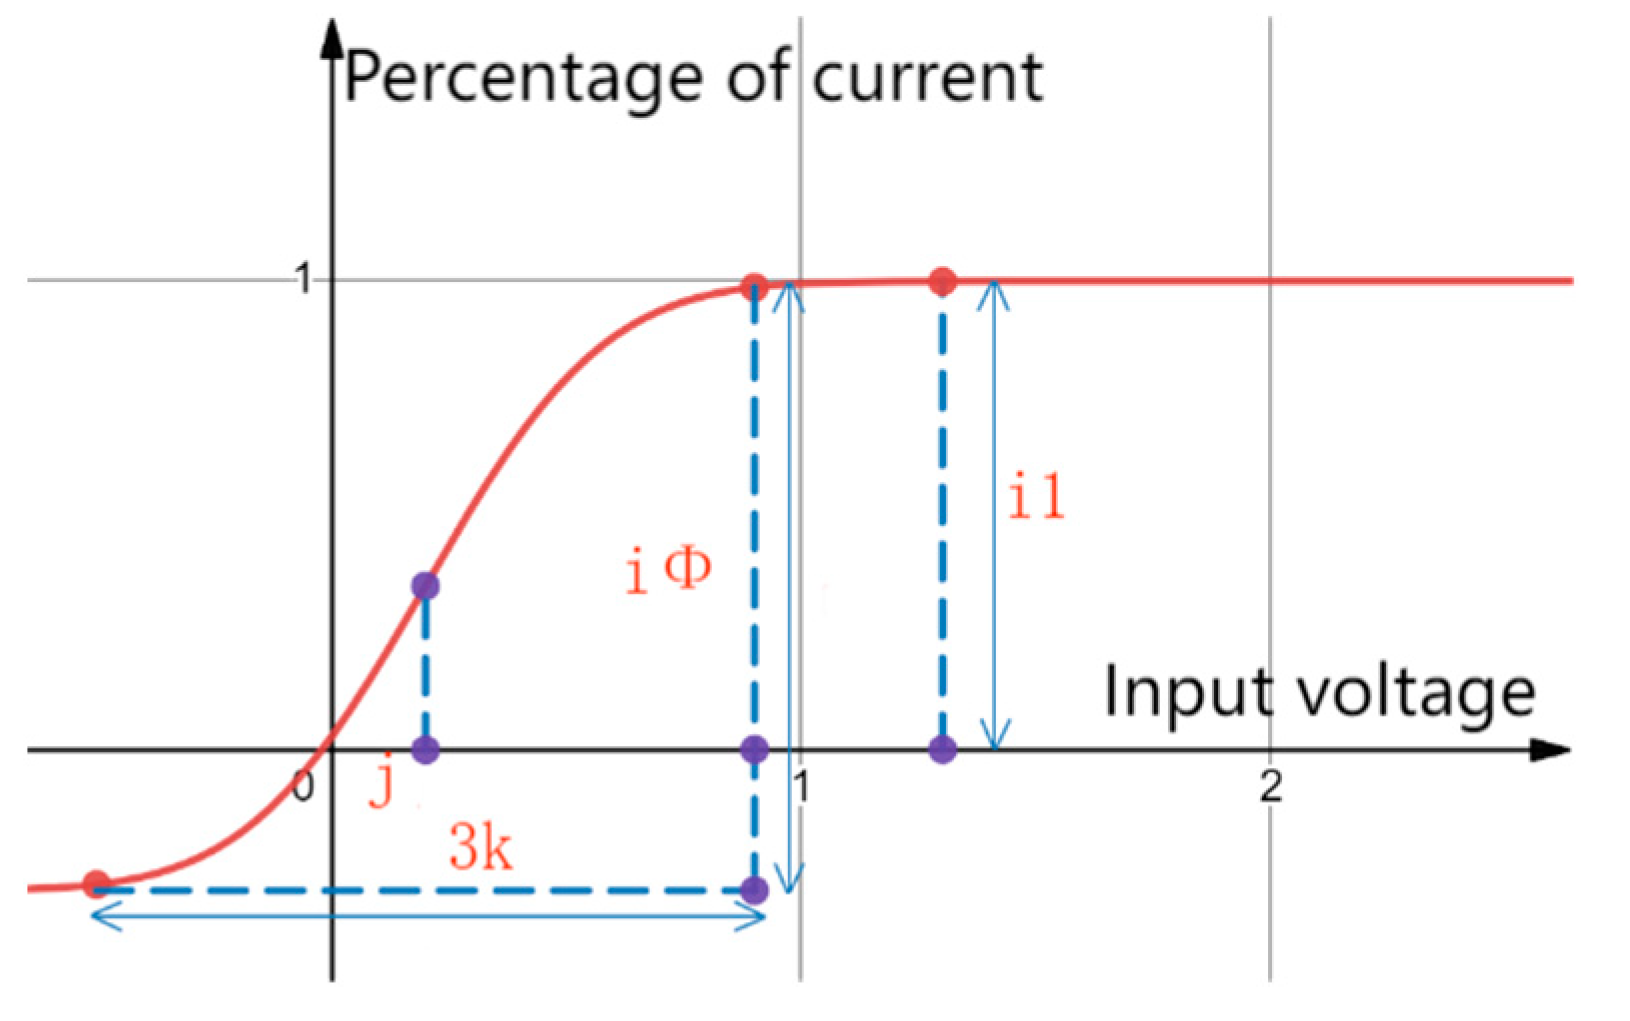
There are three parameters i, j, and k in the fitting process of Φ(x), where i = the maximum drop of the Φ curve/maximum current in the recombination region, i.e., the ratio of the actual maximum number of particles to the number of particles received by the detector. j stands for the value of x when Φ(x) = 1/2 of the maximum, which is the position of the symmetry axis, i.e., the variation of the parameter μ with respect to the criterion. k stands for the width of the 3sigma region of Φ(x), i.e., the variation of the parameter σ with respect to the the variation of the standard. The three parameters i, j, and k are initially set, and their meanings are shown in Figure 11:
The red curve in the figure is Φ(x) with parameter i= i Φ i 1 The reason for the existence of the i parameter is that: the first point is because the pulse of charged particles arriving at the pole plate needs a certain intensity to be recognised and converted into current, and the subtraction of part of it represents the minimum pulse energy needed to be detected arriving at the pole plate; the second point is that the last data or several data before the point of inflection may be in error, which makes the maximum value of the overall normal curve large, and by analysing it together with the previous data makes the maximum value can be in a certain By analysing the data together with the previous data, the maximum value can fluctuate within a certain range, which makes the slope of the ping curve and the calculation of the inflection point more accurate and close to the data.
The reason for the existence of the j parameter is that there is an initial energy for the thermal motion of the particles, which makes the extra energy provided between the polar plates, i.e., the voltage values are shifted to the left as a whole, whereas for the negative high voltage electrodes they will be shifted to the right as a whole.
The k-parameter exists because the speed of the voltage change corresponding to the current change generally conforms to the Φ(x) distribution, but the width of the 3sigma region, i.e., the curvature of the curve, etc., varies with reality.
From Eq. 14 above, it can be seen that the motion loss is related to the strength of the electric field between the polar plates and the initial energy of the particles, and the correction of the motion loss contains two parameters, l and sv02.
The reason for the existence of the parameter sv02 is that: due to the initial energy of the particle for the normal distribution, the vast majority of the initial energy of the particle is distributed in its median around a small part of the region. And the magnitude of its initial energy value has a small effect on the ionisation loss. For the sake of simplicity of the calculation, might as well be regarded as a particle of the initial energy of the constant, for which the median, recorded as the parameter V0. Because of the equation 14 in S for the distance between the pole plate is a constant value, then the combined as the parameter sv02.
The parameter "l" exists because the initial energy of the particles is assumed to be uniformly distributed within a certain range around the median. This means that the number of particles with different energies in the region can be considered equal. Particles whose initial energy, plus the work done by the electric field, minus the energy loss, is greater than the minimum energy required to reach the pole plate, can be detected and recorded as pulses. Therefore, as the energy loss changes, i.e., the minimum energy threshold required to reach the plate also changes, the number of particles unable to reach the plate due to energy loss between the original threshold and the increased threshold is linearly related to the value of energy loss due to the uniform distribution of the number of particles, and the coefficient of this linear function is represented by 'l'.
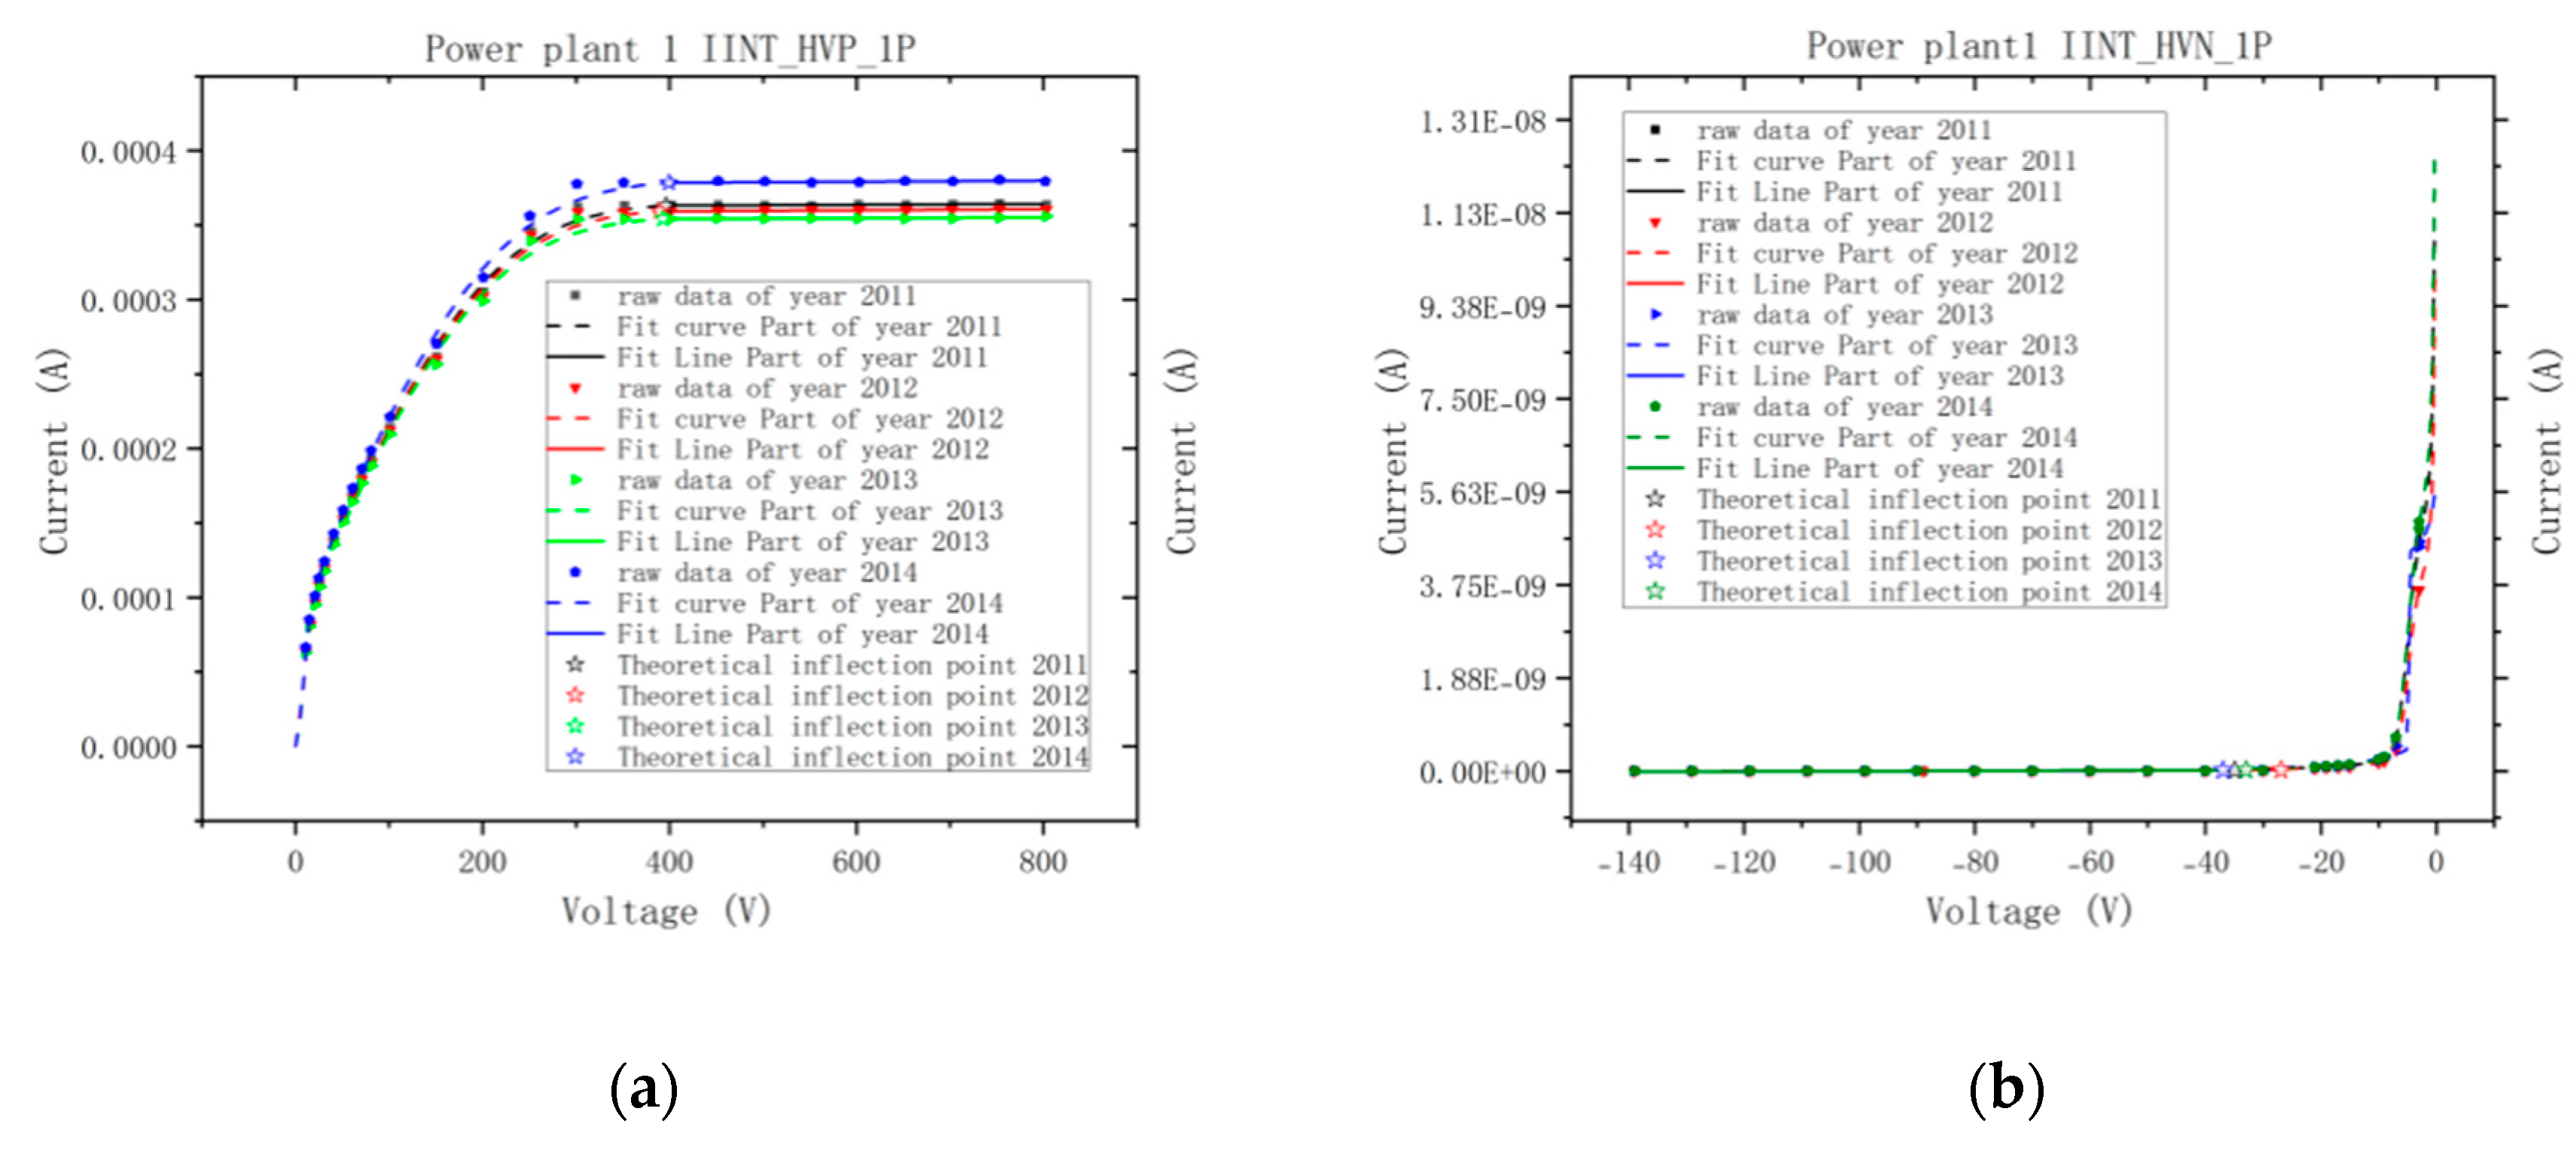
A total of five parameters were used in fitting the final expression of the curve Φ(i, j, k) - f(sv02, l) by least squares. The results are presented in Figure 12. The same color in the figure represents the same set of time data, along with the specific parameter values of the ping curve expression, the five parameters of the modified normal curve, and the coordinates of the intersection point, which are presented in Table 1 and Table 2. By analyzing the values of SSE and Figure 12, it is evident that the fitted curves closely resemble the original data.

3.4. Analysis of Results and Performance Evaluation

By intersecting the ping curve with the corrected Φ(x) curve, we can obtain two key pieces of data: the exact inflection point and the slope of the ping curve. The position of the y-axis of the inflection point gradually decreases with time, meaning the inflection point current becomes smaller. The current decreased by approximately 1.5% per year from 2011 to 2013. The replacement of the detector in 2014 resulted in the loss of comparability of the data. The voltage at the inflection point remained relatively stable or shifted slightly to the right each year, staying within the range of 385 V to 400 V.
The decrease in current is attributed to the nuclear reaction that occurs during the detector's operation, which consumes the boron coating. As a result, reactivity decreases, leading to a lower number of cations produced by the nuclear reaction for the same neutron flux. This reduction ultimately causes a decrease in the maximum current. According to the operating instructions, the detector should be replaced when the voltage corresponding to 1/5 of the current value of I600V is greater than 70 V. In this case, the detector's corresponding value is approximately 15 V, which is within the normal range. The corresponding value and its annual rate of change can be more accurately determined by fitting the function equation.
The change in voltage is relatively small, and the decrease may be due to air leakage. This leads to a decrease in gas pressure inside the detector, resulting in a reduction in the energy loss of the particles traveling through it. The increase from year to year may be due to the fact that the material reacts with neutron rays to produce α particles and helium. This reaction causes the energy required to cross the gas between the plates to rise, necessitating a higher voltage between the plates to overcome the energy loss. As the detector ages, it fails if a stable ping curve of length 100 V cannot be found between voltages of 400 V and 900 V [15].
The slope of the ping curve remains basically the same. The slope of HVP is around 3 x 10-13, and the intercept is around 3 x 10-11. If the slope changes significantly by an order of magnitude, it can directly indicate that the detector resistance has changed. This change is typically attributed to the presence of water vapor between the plates due to gas leakage, leading to a shift in gas resistance.
In specific working conditions, the current detector status can be evaluated based on parameters such as inflection point current, inflection point voltage, voltage corresponding to 1/5 of the I600V current value, length of the voltage area of the ping curve meeting requirements, slope of the ping curve, etc. Scoring and replacement criteria can be established with specific weights to enhance the safety and reliability of operation and maintenance.

4. Summary

The main conclusions obtained from the analyses of the nuclear reactions occurring in the detector and the distribution of the energy of the particles moving between the plates, as well as the acceleration and resistance to which they are subjected, and from the experimental studies carried out in the field, are as follows:
(1) The relationship between the resistance of a particle and its initial energy and its mathematical model were deduced by studying the functional relationship between the current in the recombination region and the ionisation region involved in the actual working conditions as a function of the increase in voltage between the pole plates.
(2) Field experiments were carried out on the detector to obtain monitoring data for several operating cycles, and the data were analysed and corrected on the basis of considering the energy-loss inventory to obtain a better-fitting functional expression and its corresponding data segmentation points.
(3) From the HVP detector inflection point position can be seen, with the increase in time, the inflection point gradually moved downward, deduced that the reason for the decrease in current is due to boron coating loss, the existence of air leakage and other factors that make the inflection point of the voltage change, while the ping curve slope and intercept basically maintained at a value near the same.
(4) A mathematical model of the slope of the ping curve and the location of the inflection point, determined theoretically, can be used to assess detector performance. The fitting algorithm obtained from this model can automatically obtain the key numerical results, which have been applied through software deployment in actual overhauling conditions and provide reference and assistance for detector localisation.

Funding

This research received no external funding

Acknowledgments

Thanks my Teammates.

Conflicts of Interest

The authors declare no conflicts of interest.

References

  1. LIU Yangyang,LI Wenping. Design of nuclear instrumentation system for Qinshan nuclear power plant phase II project. Nuclear Power Engineering 2003, 24, 238–240,248.
  2. Huang GQ,Lai W,Chen YZ,et al. Design of TMSR off-heap nuclear measurement system. Instrumentation User 2018, 25, 73–75.
  3. WEN Yanhui,GUO Guoyun,SHA Hongwei. Analysis and treatment of aging trend of power range detector for off-heap neutron flux measurement system in nuclear power plants. Instrumentation User 2017, 24, 76–81.
  4. Chi Yukai,Wu Pintao. A method for supervising the performance of intermediate-range detectors in RPN systems. Nuclear Electronics and Detection Technology 2021, 41, 528–532.
  5. Arbitrary. Research and design of commissioning programme for nuclear measurement instrumentation outside the third generation pressurized water reactor. Automation Instrumentation 2021, 42, 237–241.
  6. CHEN Siming,SHI Xuefeng,XIU Luqian. Application analysis of off-heap nuclear measurement instrumentation in the start-stop process of pressurised water reactor nuclear power plant. Shandong Industrial Technology 2018, 98.
  7. MENG Fanfeng,GENG Fei,CAI Guangming. Dynamic stick-carving test based on intermediate range measurement of off-heap nuclear instrumentation system at Fuqing Nuclear Power Plant. Nuclear Power Engineering 2020, 41, 30–33.
  8. HU Chuxuan,LI Shucheng. Calculation of combustion consumption of off-heap nuclear measurement detector assembly in nuclear power plants. Nuclear Electronics and Detection Technology 2018, 38, 326–329.
  9. LU Jian, HUANG Jing, CAI Haoting, et al. Research on overhaul method of detector of off-heap nuclear measurement system. Instrumentation User 2023, 30, 57–61.
  10. LU Jian, HUANG Jing, CAI Haoting, et al. Design and overhaul maintenance of the detector of off-heap nuclear power measurement system in Qinshan nuclear power plant phase II. Instrumentation user 2019, 26, 48–52.
  11. WU Pingtao. Application of nuclear detection technology in nuclear power plants. Electrotechnology 2022, 37–39.
  12. Zhao, R. Shun. Distribution law of ideal gas molecules by potential energy in a conservative force field. Journal of Liaoning University (Natural Science Edition) 2002, 29, 121–126. [Google Scholar]
  13. Yuki Sato, A. Taketani, N. Fukuda, et al. Energy resolution of gas ionisation chamber for high-energy heavy ions. Japanese Journal of Applied Physics. 2013, 53, 016401–016401. [Google Scholar]
  14. ZHU Pengfei,LU Jian,HUANG Jing,et al. FMEA analysis and equipment classification of the off-heap nuclear measurement system of Qinji plant. Instrumentation User 2022, 29, 53–56.
  15. LU Jian, TONG Jie, ZHOU Chenhao, et al. Mid- and long-term management and optimisation of an off-heap nuclear measurement system for a nuclear power plant. Science and Innovation 2022, 115-118.
  16. Zou Cheng, Zhang Mi, Chen Lei, et al. Research on the technical scheme of automatic test device for signal processing cabinet of off-heap nuclear measurement system. Nuclear Electronics and Detection Technology 2022, 42, 435–439.
  17. LU Jian, LI Jiayuan, GE Meng, et al. Research on project management and implementation of technical transformation of nuclear measurement system. Instrumertation User 2022, 29, 44–48.
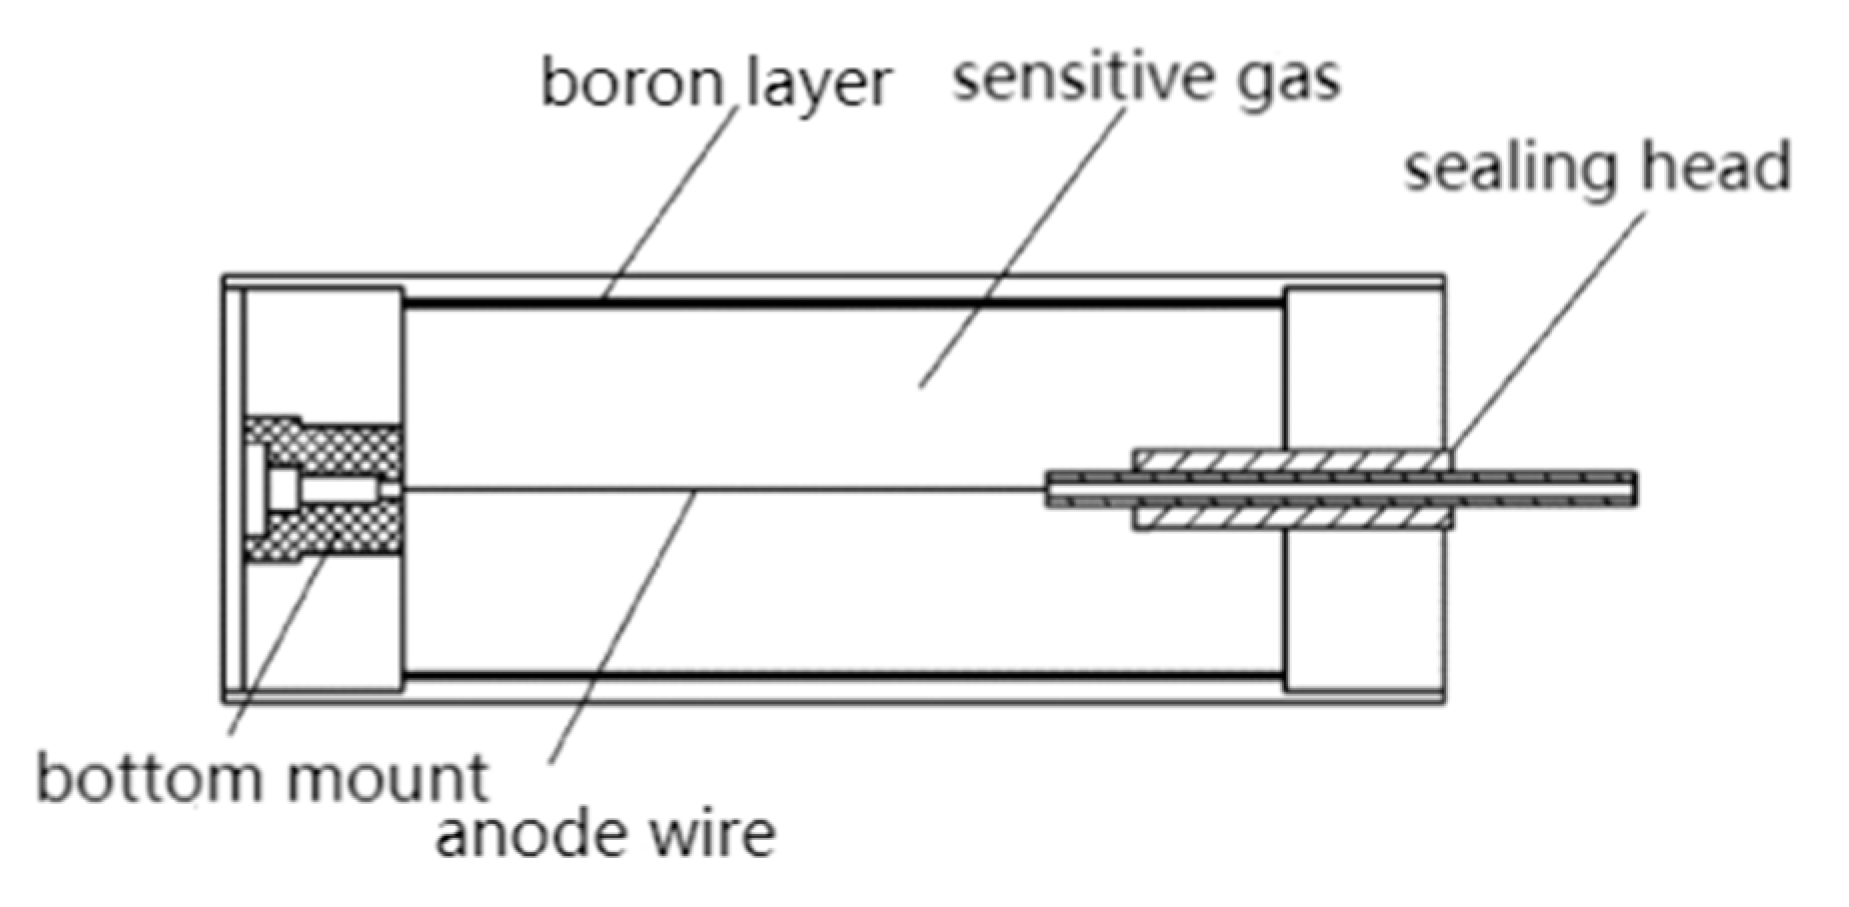
Figure 1. Schematic diagram of gas ionisation chamber detector.
Preprints 109491 g001
Figure 2. Cylindrical compensated ionisation chamber diagram.
Preprints 109491 g002
Figure 3. Gas Ionisation Chamber Detector Voltage and Pulse Height Relationships.
Preprints 109491 g003
Figure 4. Time-voltage-current variation of two detectors HVP and HVN for IIT unit IIINT.
Preprints 109491 g004
Figure 5. Figure 5. Plot of raw HVN data for two sets of detectors in the middle range of a major overhaul
Preprints 109491 g005
Figure 6. Raw HVP data for two sets of detectors in the middle range of an overhaul
Preprints 109491 g006
Figure 7. Plot of HVN SSE and k versus data point accession for an overhauled intermediate range detector
Preprints 109491 g007
Figure 8. Plot of HVP SSE and k with data point accession for an overhauled intermediate range detector
Preprints 109491 g008
Figure 9. Mapping of Loss values for a particular set of data as a function of the start and end points of the ping curves.
Preprints 109491 g009
Figure 10. Contour plot of the change in Loss value with the start and end points of the ping curve for a certain set of data
Preprints 109491 g010
Figure 11. Meaning diagram of i, j, k parameters
Preprints 109491 g011
Figure 12. Figure 12. Fitted curves of HVP detector and HVN detector for unit II
Preprints 109491 g012
Table 1. Datasheet of fitted curves for HVP detector 1 for unit 2
Curve Colour green blue orange greenish black
data time 2011-01-09 2012-2-20 2013-03-26 2014-04-01
Slope of the ping curve 2.739e-9 3.924e-9 2.474e-9 3.493e-9
Ping curve intercept 0.0003621 0.0003577 0.0003532 0.0003771
The normal fit parameter i 0.9444 0.9947 0.9957 0.9942
The normal fit parameter j 0.4557 0.4522 0.4500 0.4671
The normal fitting parameter k 2.467 2.465 2.437 2.529
Normal fit parameters l 2.384e-6 2.314e-6 2.197e-6 2.392e-6
Normal fit parameters sv02 4.1188e+156 1.7562e+160 1.6777e+160 1.8435e+160
Precise inflection point voltage 396.2 389.5 393.2 399.2
Precise inflection point current 3.632e-4 3.593e-4 3.542e-4 3.785e-4
Table 2. Datasheet of fitted curves for HVN detector 1 for unit 2
Curve Colour blue green orange greenish black
data time 2011-01-10 2012-3-10 2013-03-30 2014-04-08
Slope of the ping curve 2.358e-13 3.172e-13 2.762e-13 3.127e-13
Ping curve intercept 2.458e-11 3.281e-11 2.881e-11 3.260e-11
The normal fit parameter i 1.090 1.089 1.151 1.089
The normal fit parameter j 0.5637 0.6195 0.5298 0.5848
The normal fitting parameter k 0.4752 0.4884 0.025 0.4847
Normal fit parameters l 8.739e-12 6.835e-12 1.525e-9 9.808e-12
Normal fit parameters sv02 1.567e+158 7.882e+157 1.029 1.574e+158
Precise inflection point voltage -34.95 -26.92 -36.95 -32.99
Precise inflection point current 1.633e-11 2.427e-11 1.861e-11 2.228e-11
Disclaimer/Publisher’s Note: The statements, opinions and data contained in all publications are solely those of the individual author(s) and contributor(s) and not of MDPI and/or the editor(s). MDPI and/or the editor(s) disclaim responsibility for any injury to people or property resulting from any ideas, methods, instructions or products referred to in the content.
Copyright: This open access article is published under a Creative Commons CC BY 4.0 license, which permit the free download, distribution, and reuse, provided that the author and preprint are cited in any reuse.
Prerpints.org logo

Preprints.org is a free preprint server supported by MDPI in Basel, Switzerland.

Subscribe

© 2024 MDPI (Basel, Switzerland) unless otherwise stated