1. Introduction
Flapping wing aircraft represent a promising bioinspired approach to aerial vehicle design, with the potential to offer high maneuverability and agility compared to traditional fixed-wing designs[
1]. Researchers have developed various flapping wing aircraft [
2,
3,
4,
5,
6,
7,
8,
9,
10], but there still exist differences in morphology and structure forms compared to real bird wings. These differences may contribute to the key problem of low lift generation in some flapping wing aircraft in hovering situations. Hence, this paper aims to investigate the influence of wing morphology and structural flexibility to overcome the aerodynamic efficiency challenges.
Flapping wing design is the new trend in bird-inspired Unmanned Aerial Vehicles (UAVs) area. Fritz-Olaf Lehmann et al. [
11] found that the wing area and aspect ratio are two important parameters that affect the wing-wake interaction. Stewart et al. [
12] studied the airfoil in hovering state, optimized the plane shape of the rigid flapping wing by using the improved Zimmerman wing plane shape design method, obtained the aerodynamic force by using the quasi-steady aerodynamic calculation method, and designed and optimized the structure of a flexible flapping wing. Stanford et al. [
13,
14] parameterized the shape and structure composition of the wing, optimized the shape, structure layout and motion parameters of the hovering flexible flapping wing, and proposed the analysis method of the parametric flapping wing skeleton. Muniappan et al. [
15] studied the effects of wing aspect ratio, wing plane shape and wing twist flexibility on lift and thrust at different flapping frequencies, and the results showed that an increase in aspect ratio would increase lift, while thrust hardly changed. Yuan et al. [
16] studied the effects of different aspect ratios on the propulsive performance of bionic flapping wings at low Reynolds number, and the results showed that the propulsive performance first increased and then decreased with the increase of aspect ratio.
However, most of the current studies only consider the flutter of rigid wings, ignoring the structural changes caused by changing wing area and aspect ratio. Some researchers have explored flexible flapping wings as the theme. For example, Wu[
17] et al. studied the relationship between the aerodynamic characteristics of flapping wings and their flexible deformation, and found that the structural characteristics of flapping wings have a great impact on aerodynamic characteristics. Wang Liguang et al. [
18] have realized the simultaneous measurement of aerodynamic force and structural deformation of flexible flapping wings, and the results show that there is a strong correlation between structural deformation and thrust. Yoon Sang-Hoon et al. studied the unsteady aerodynamic characteristics of a flapping wing with curvature while hovering, and conducted simulation and experimental research on the structure of a flapping wing with large deformation at high frequency [
19], which verified that the camber Angle during deformation plays a great role in improving the aerodynamic performance of the wing.
To understand the aerodynamic characteristics of flexible airfoils with different morphological parameters and fin structure, this paper takes a bionic micro-flapping wing as the research object and mainly studies the aerodynamic structural characteristics of flexible flapping wings with various parameters in a hover state. Using Transient Structural and Fluent modules, the bidirectional fluid-structure coupling numerical model was established to analyze the micro-bionic flapping wing, and the numerical simulation of the influence parameters of the micro-flexible flapping wing was carried out. The aerodynamic and structural stress and deformation characteristics of the flapping wing are studied under certain flapping frequency and amplitude. The influence of morphological parameters such as area and aspect ratio on aerodynamic and structural characteristics of flapping wings is studied. The influence of fin distribution on flexibility, aerodynamic and structural characteristics of flapping wing is studied. Furthermore, the structure layout is proposed and verified in aerodynamics and structure.
2. Methods
2.1. Flapping Wing Model Establish
The flapping wing is composed of a rectangle and a quarter circle, as shown in
Figure 1. This wing structure is made with ribs.
where l is the 1.5mm wide wing spar, c is the chord, b is the wing span, r is the arc radius consistent with the chord, and S is the wing area. The thickness of the flapping wing membrane is 0.3mm. The wing area and aspect ratio can be illustrated in Eq. (1) and Eq. (2).
2.2. Fluid Analysis Model Establish
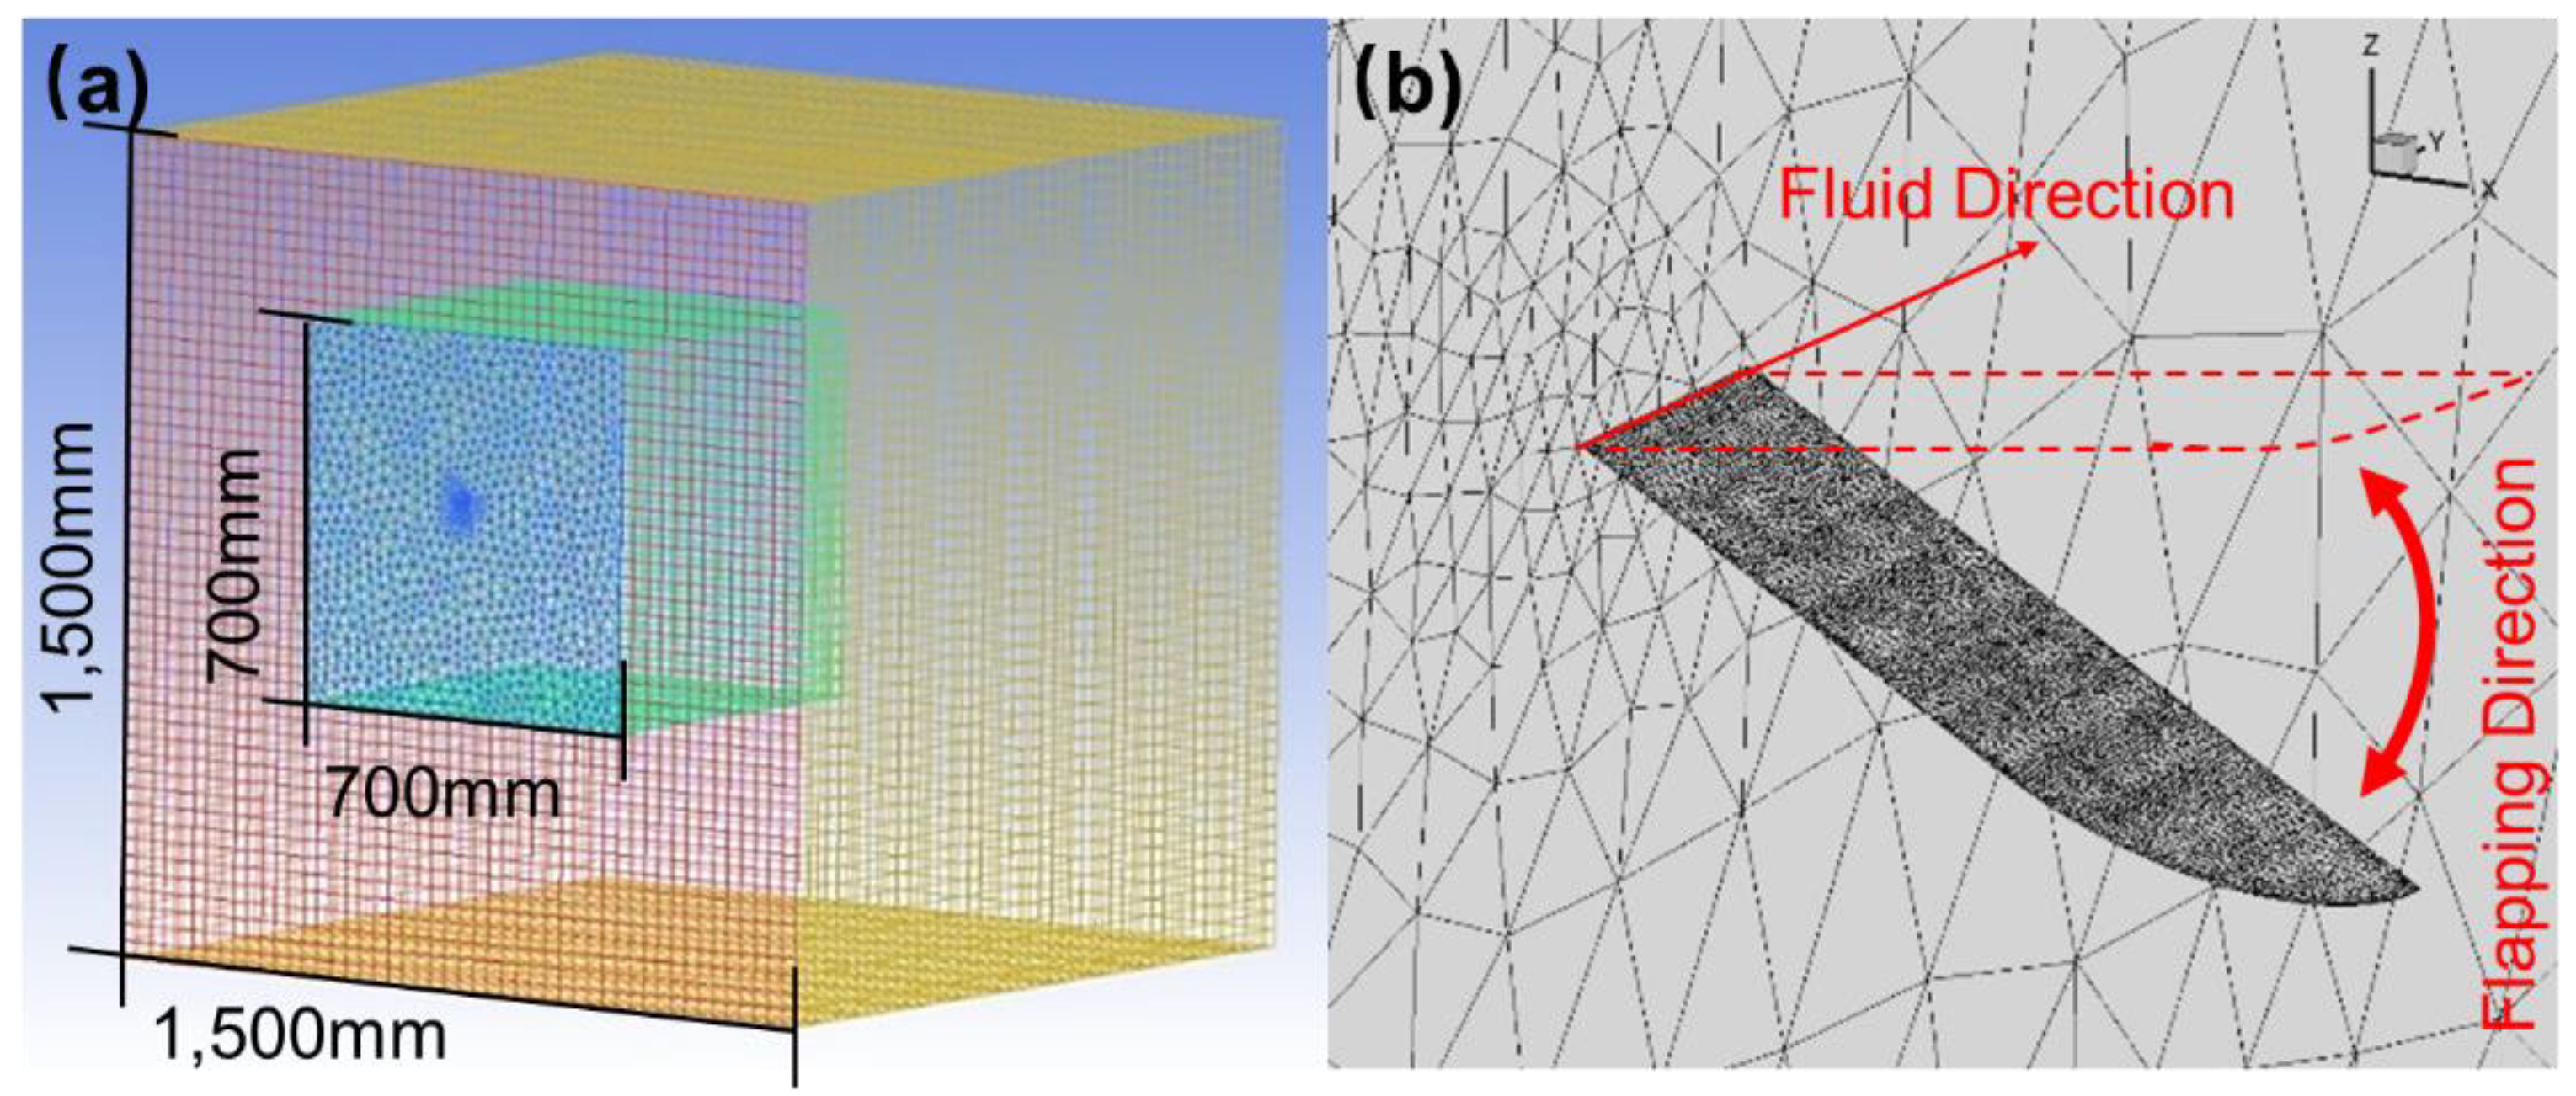
To calculate the fluid dynamics working on the wing, the Computational Fluid Dynamics (CFD) method is involved. The overall computational domain setup is shown in
Table 1.
The external flow field grid is divided into the structural grid, which has a high grid quality while ensuring sufficient flow field volume. To ensure that the grid size near the interface between the internal and external flow fields is consistent, the external flow field body grid is also set to 40 mm
3. Subsequently, the internal and external grids are merged, and the interface is merged with the grid nodes. After merging, the grid quality is checked. It is found that the grid quality at the interface is poor due to the transition between the unstructured grid and the structural grid. The Smoothing grid processing method is adopted to adjust the grid quality to more than 0.2, of which 80 % of the grid quality is above 0.72. The illustration of the computational domain and detailed wing mesh are shown in
Figure 2.
2.3. Structure Analysis Model Establish
The structure model includes spar, rib, and wing membranes. The spar and rib are formed as the same part and separated from the wing membrane, which is convenient for subsequent grid division and connection constraint setting. The mesh solution method is selected as mechanical, and the divided solid mesh is shown in
Figure 3.
Because the wing spar bears the bending stress under flapping and the twist shear stress under passive twist. The difference in stiffness in these two directions should be considered when defining the material properties. The wing spar material is defined as an orthogonal anisotropic material. The specific material properties are shown in
Table 2.
The equation of flapping motion is shown in Eq. (3).
where theta is pitching angle, f is flapping frequency, t is flapping time.
In this study, six wing surfaces are selected as coupling surfaces in fluid-structure interaction analysis. The total deformation, deformation in z-axis, equivalent stress, and the wing spar stress are calculated.
2.3. Model Verification
This study uses a standard case to verify the calculation setting. The standard case is based on an experimental model of S. Heathcote's extensional flexibility on the thrust of a flapping wing[
20]. The model wing profile is the NACA0012 with a flat plate consisting of PDMS material and steel plates. The motion law of the wing root is shown in Eq. (4).
where S is the wingtip vertical displacement, t is flapping time.
The chord flow velocity is 0.303m/s and the calculation mesh is shown in
Figure 4.
First, the mesh independence verification is needed. This study has divided three different meshes in the same setting with different grid numbers, as shown in
Table 3.
The calculated results of deformation and stress change with time are shown in
Figure 5.
The results show that the deformation curves are almost coincident, and the peak value of the stress curve will be affected by the grid amount, otherwise, the influence is very small, which meets the verification of grid independence on the whole, so the first set of grids is selected.
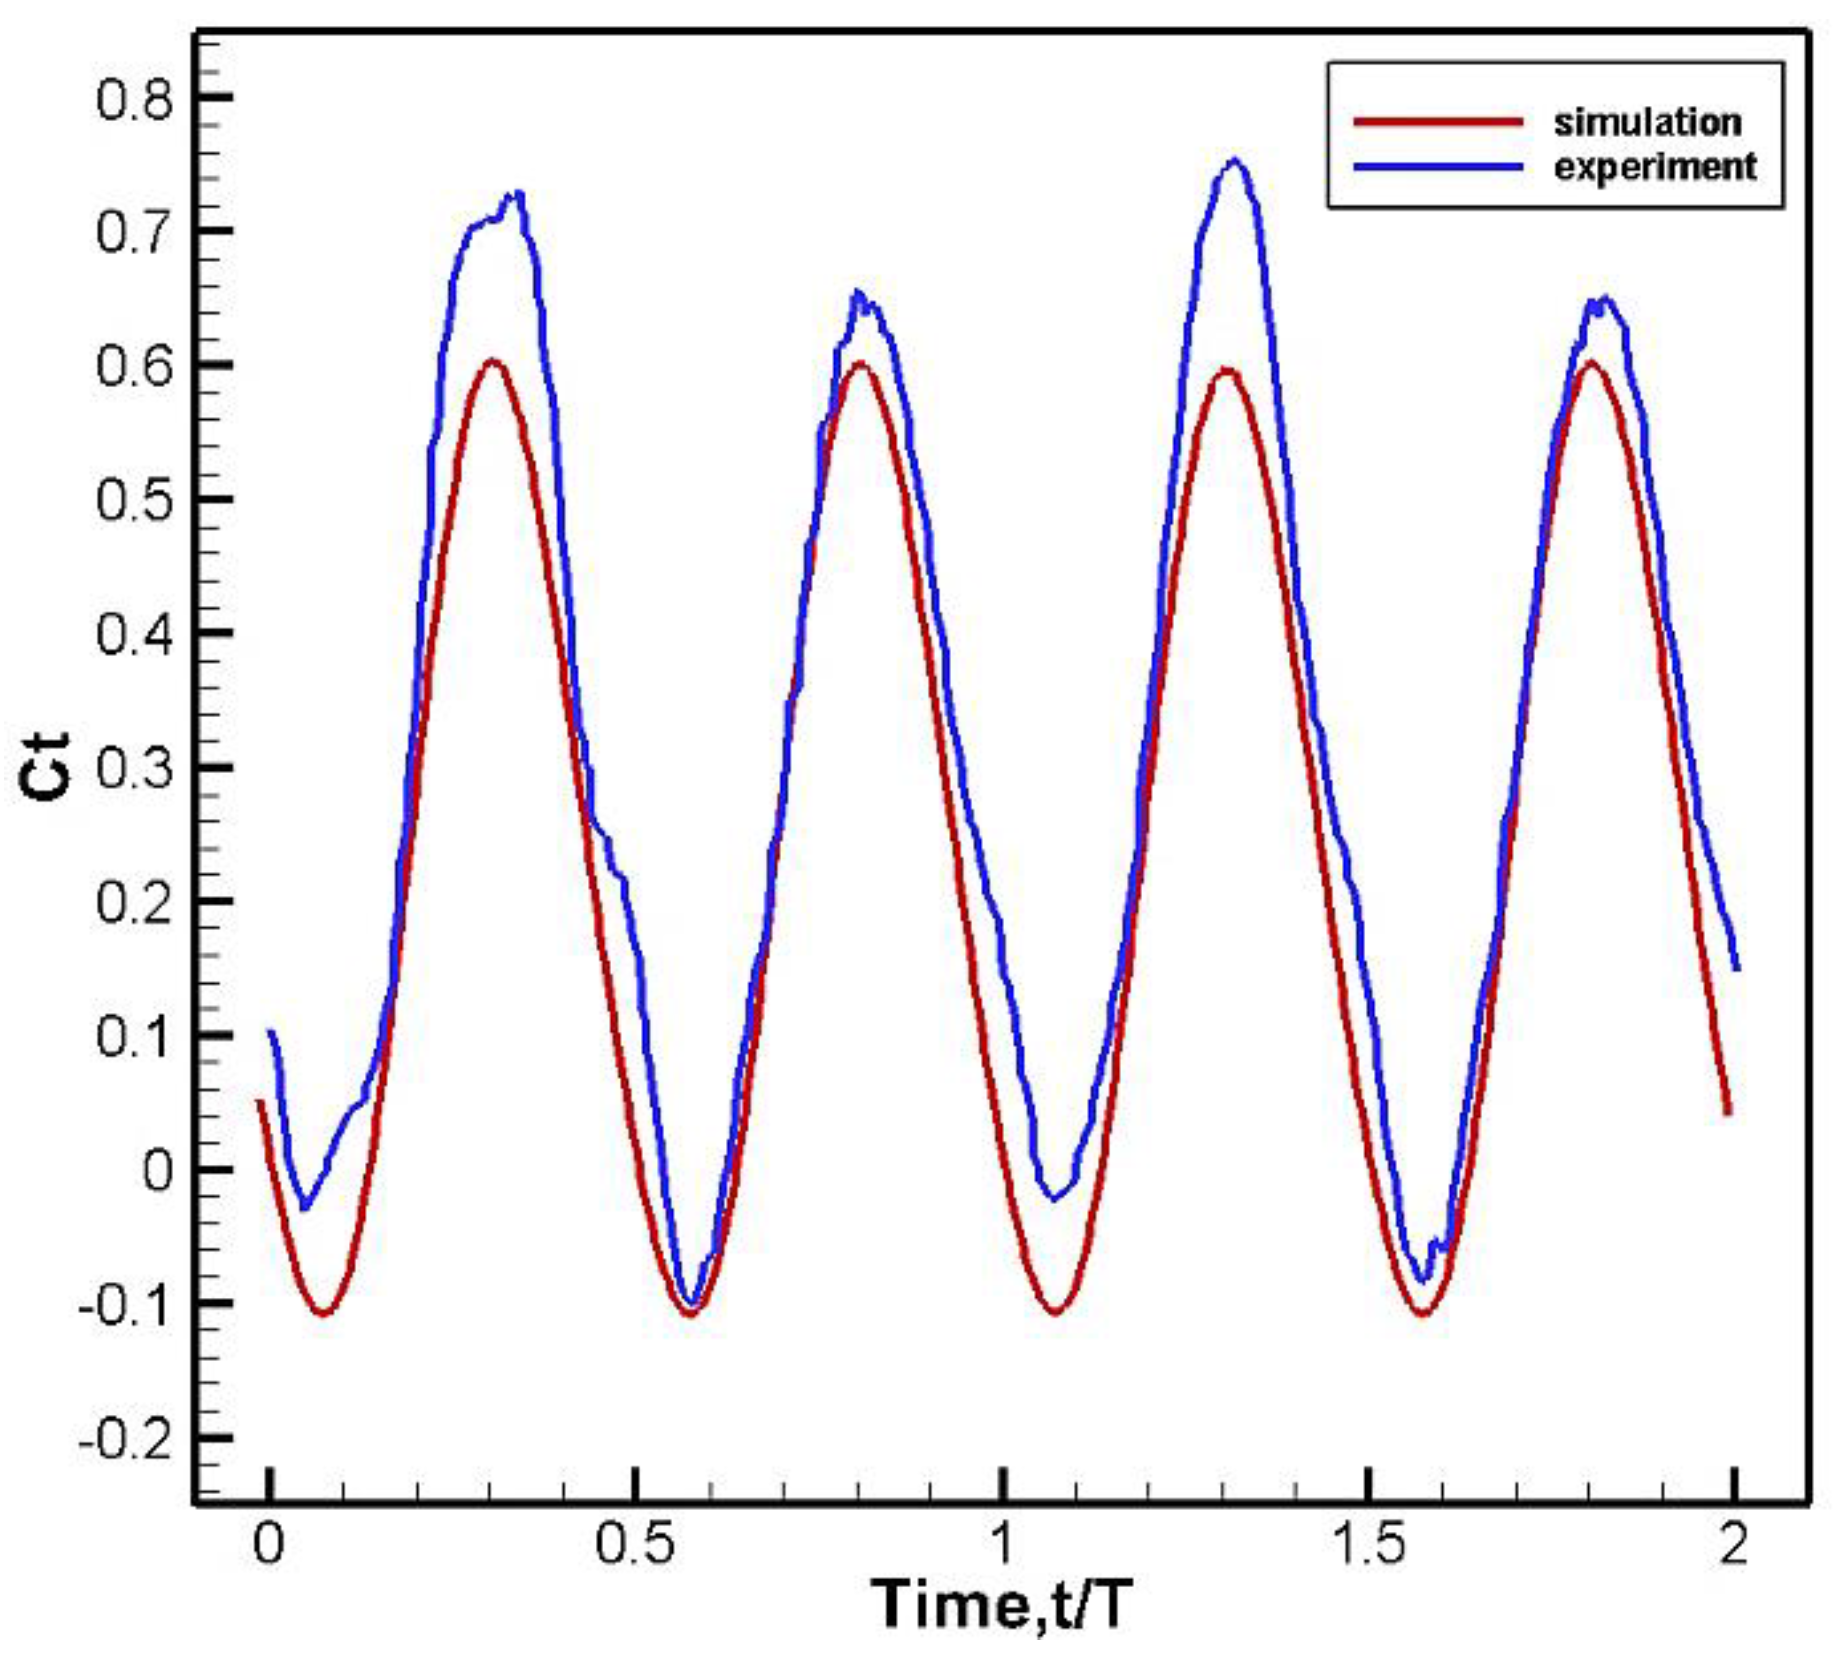
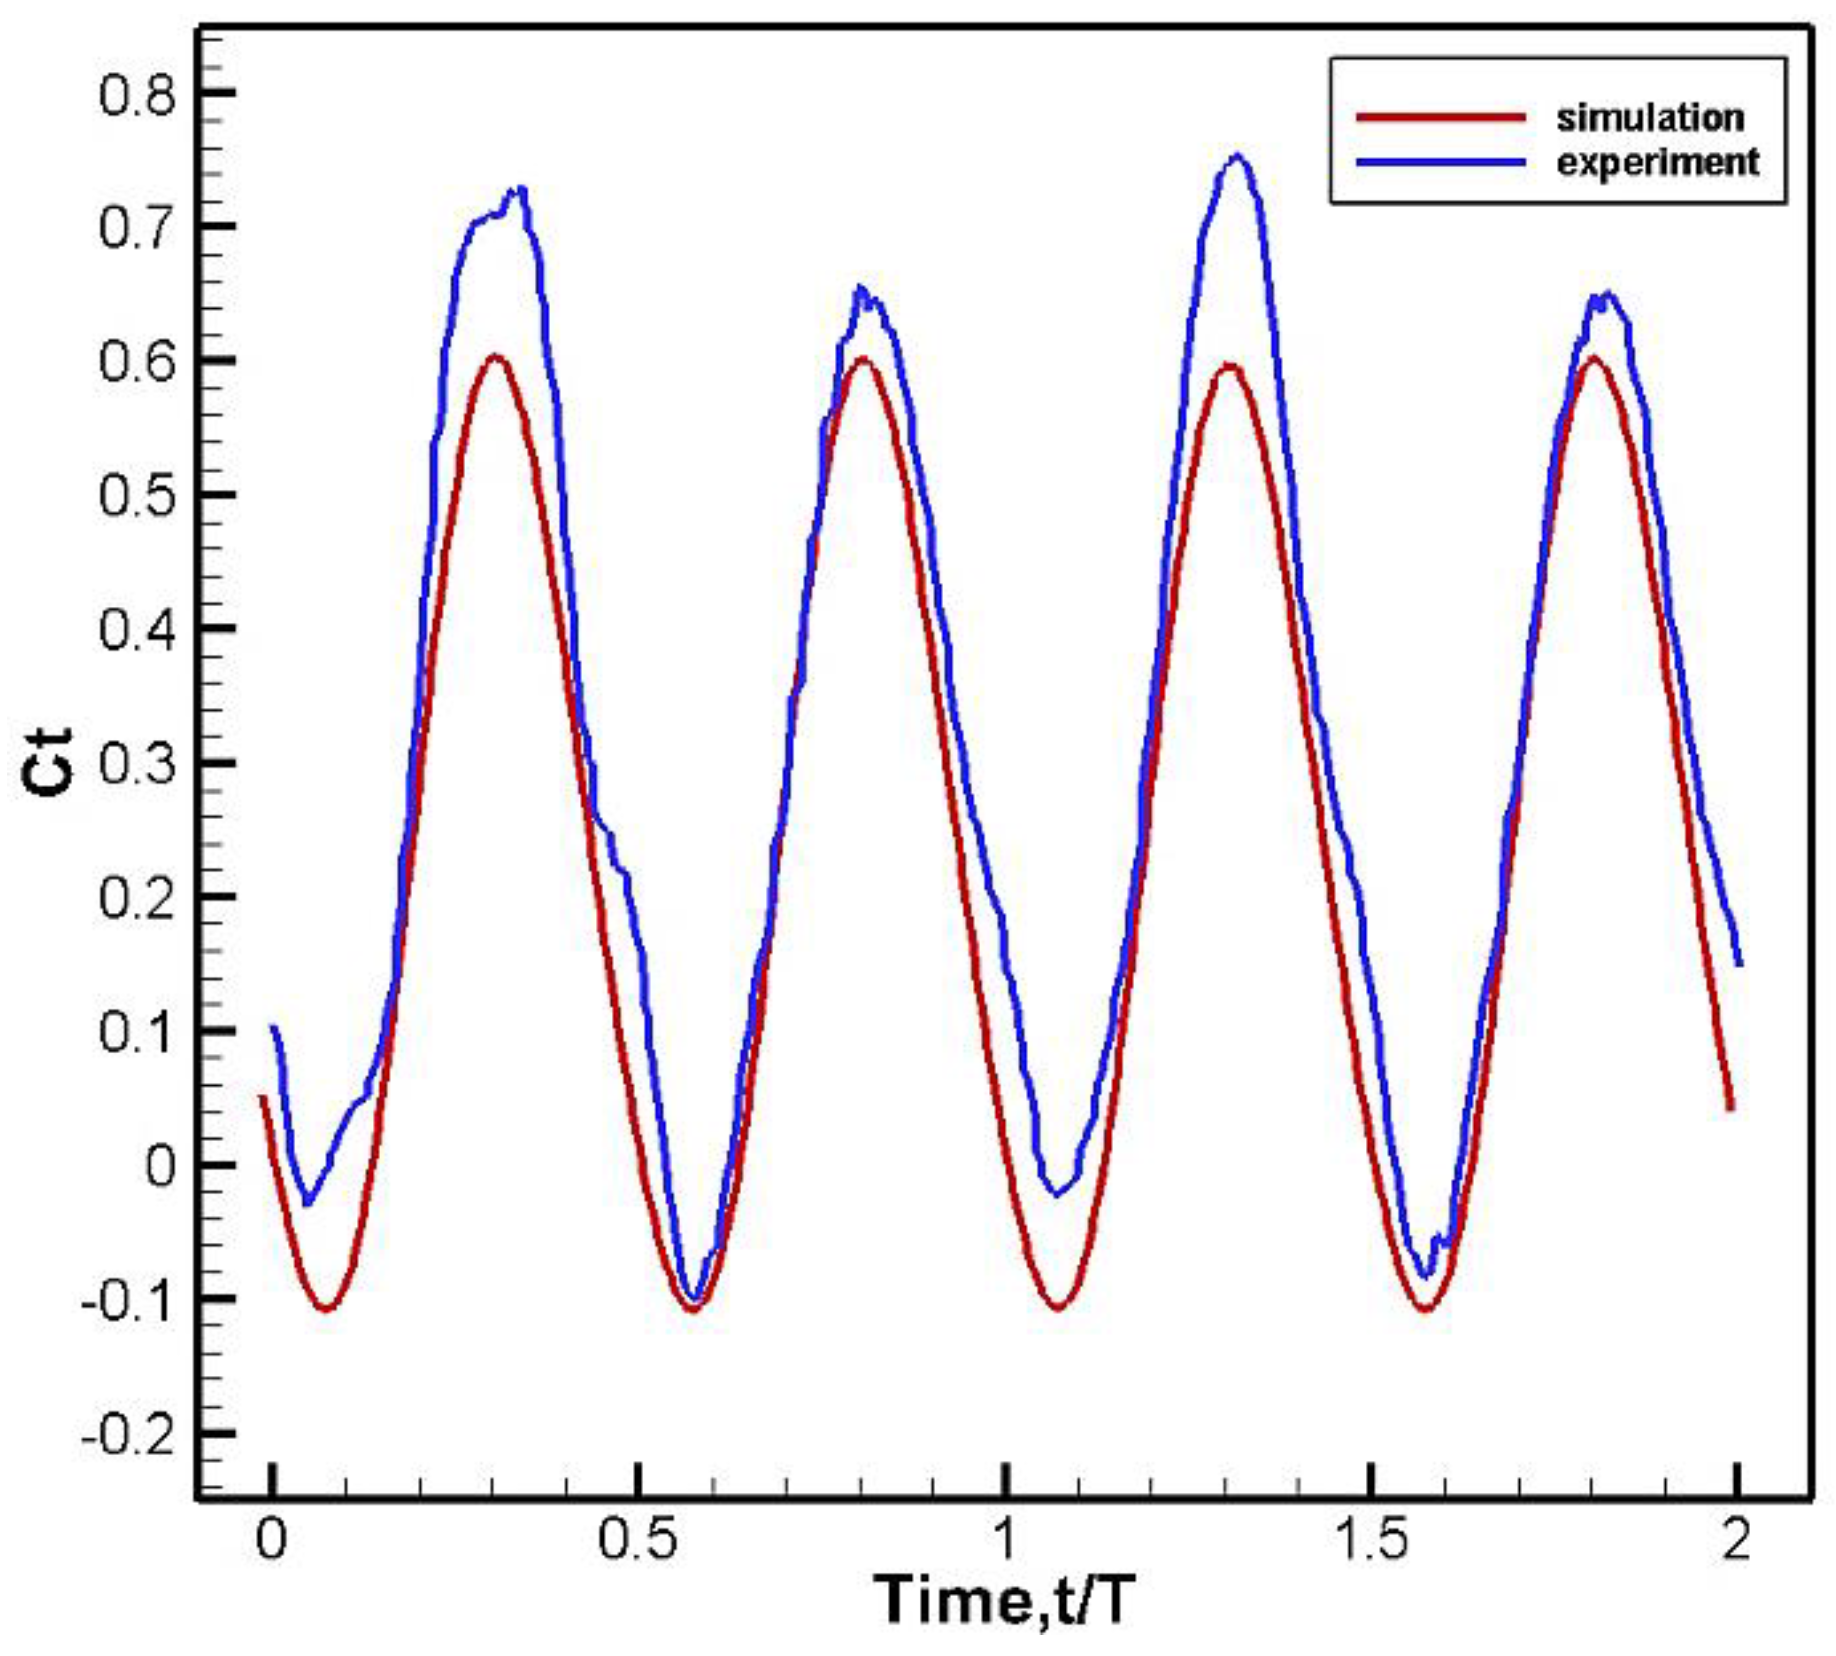
Based on the verified mesh setting, the thrust coefficient in this case can be calculated and compared with the previous study. The result is shown in
Figure 6.
The thrust coefficients obtained from this study and the previous results are in good agreement, except for a slight difference in amplitude. However, consider that the previous study was set in a water tank, and the wall effect was not taken into account in the simulation. The results are similar to Raymond’s study[
21].
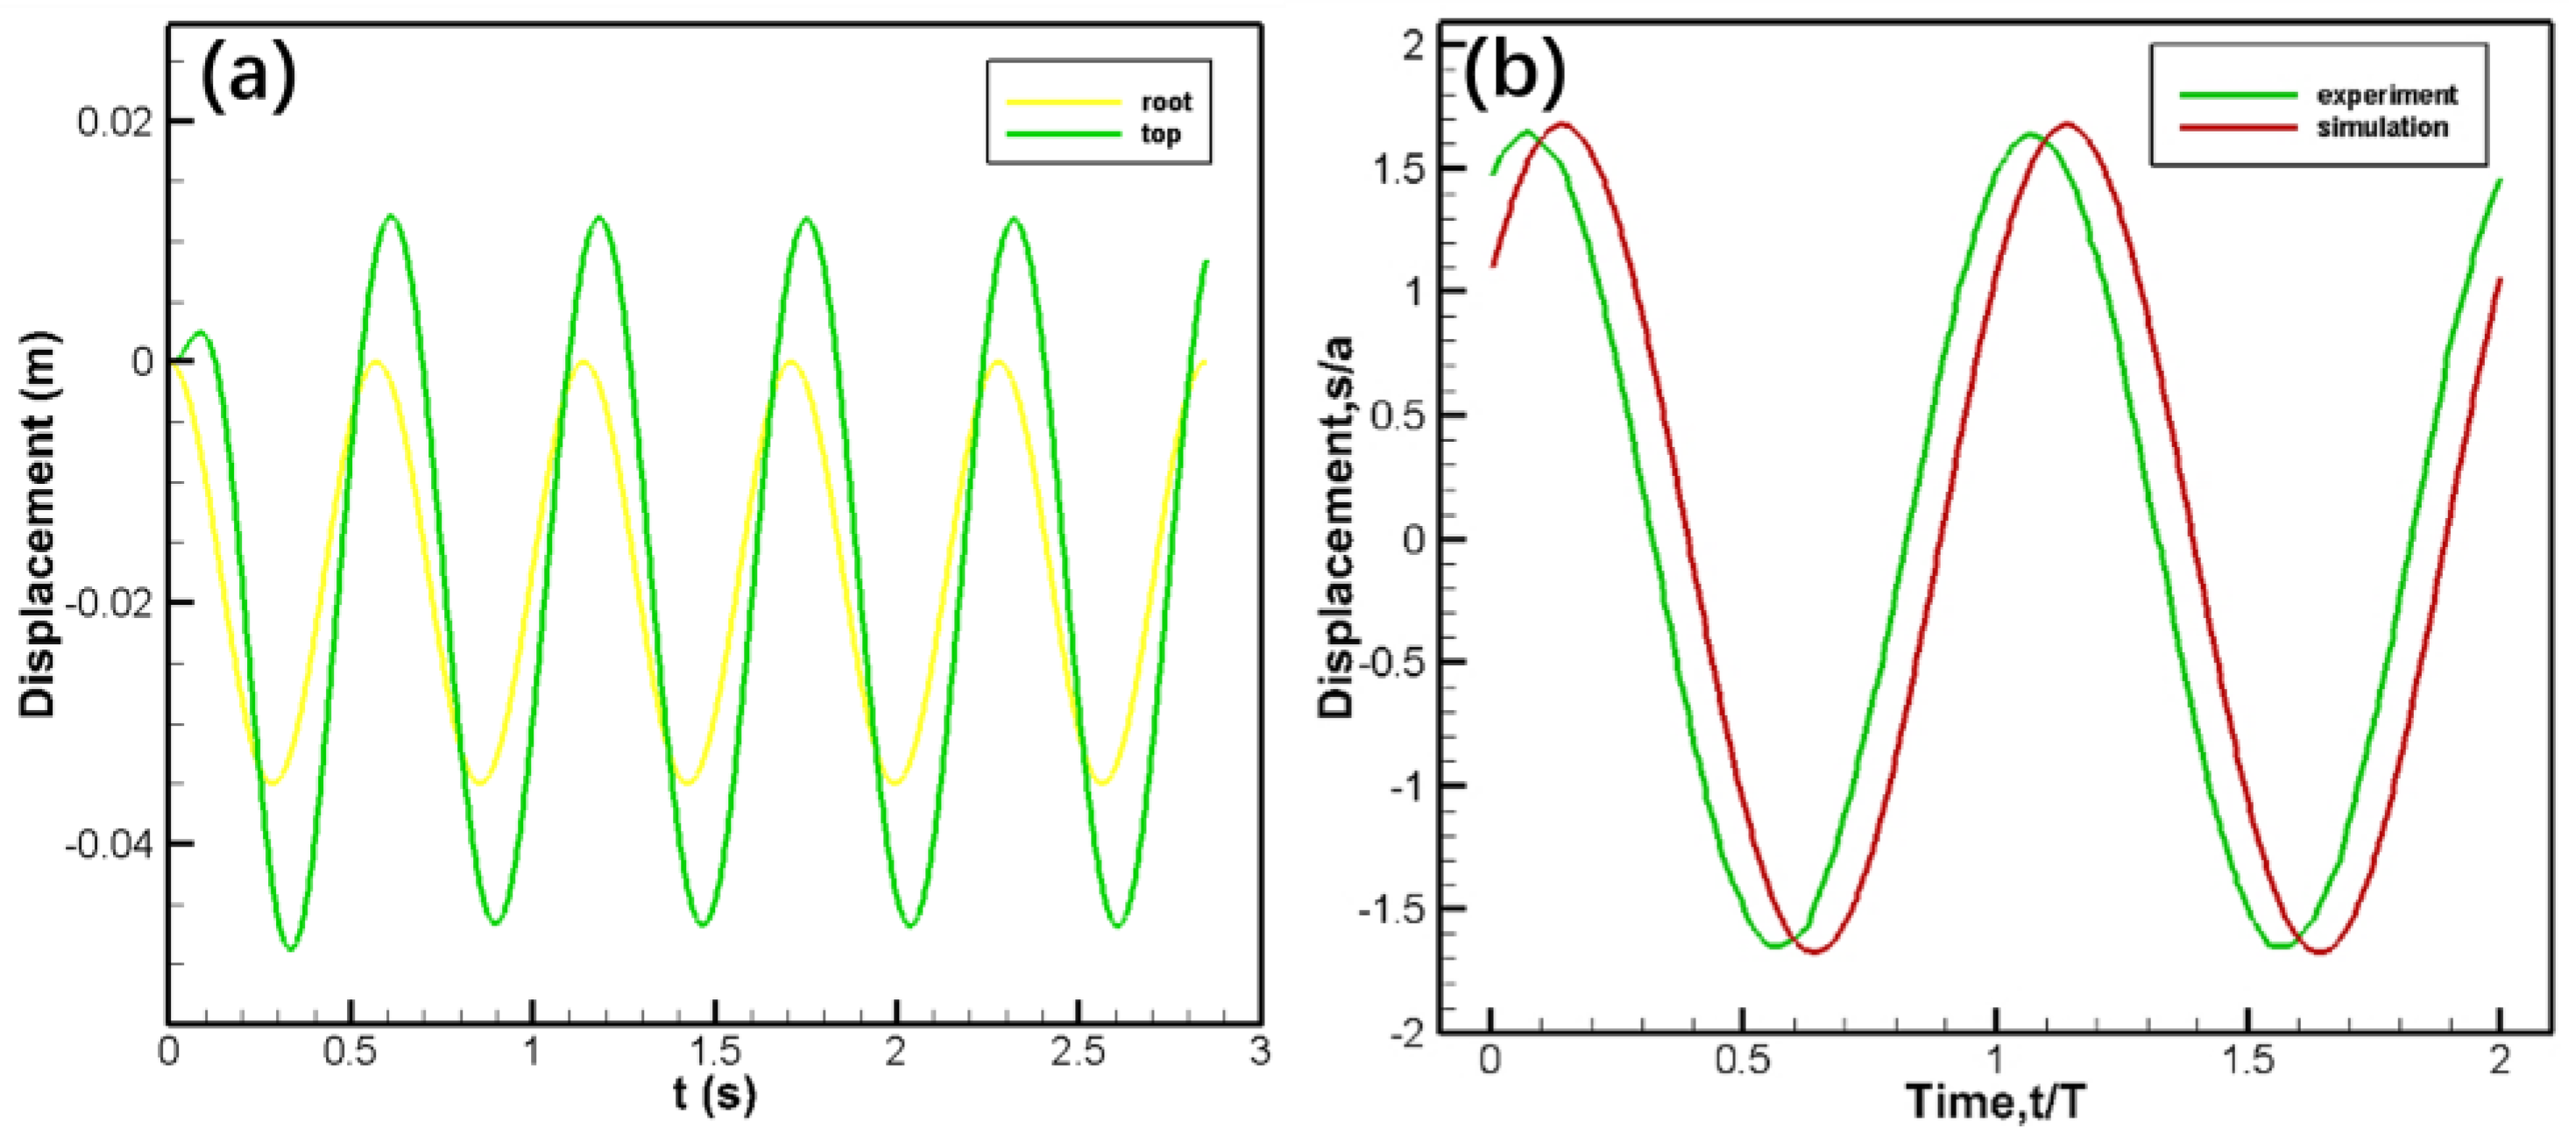
The displacement between the wing root and the wing tip is obtained by fluid-solid coupling simulation, and the comparison results of the displacement between the wing tip and the wing root obtained by simulation and experiment are shown in
Figure 7.
Because the motion is applied to the wing root, the amplitude will increase because of the flexibility of the model, and the time will delay, leading to the phase difference. Hence, the simulation results are similar to the experimental results. Considering the aerodynamic results comprehensively, it can be considered that the case verification in this paper is successful and the method is effective and feasible.
3. Influence of Wing Parameters on Aerodynamic and Structure
3.1. Wing Parameters Establish
This study chose wing area and aspect ratio as the main parameters to identify the influence of flexible wings on both the aerodynamic side and the structure side. The main spar and rib structure, the distance between the wing root and the rotating shaft, flapping amplitude, and frequency remain unchanged. When studying the influence of wing area, the aspect ratio(AR) remains 4, other parameters are shown in
Table 4. When studying the influence of aspect ratio, the wing area(S) remains 2500mm
2, and the wing surface parameters are shown in
Table 5.
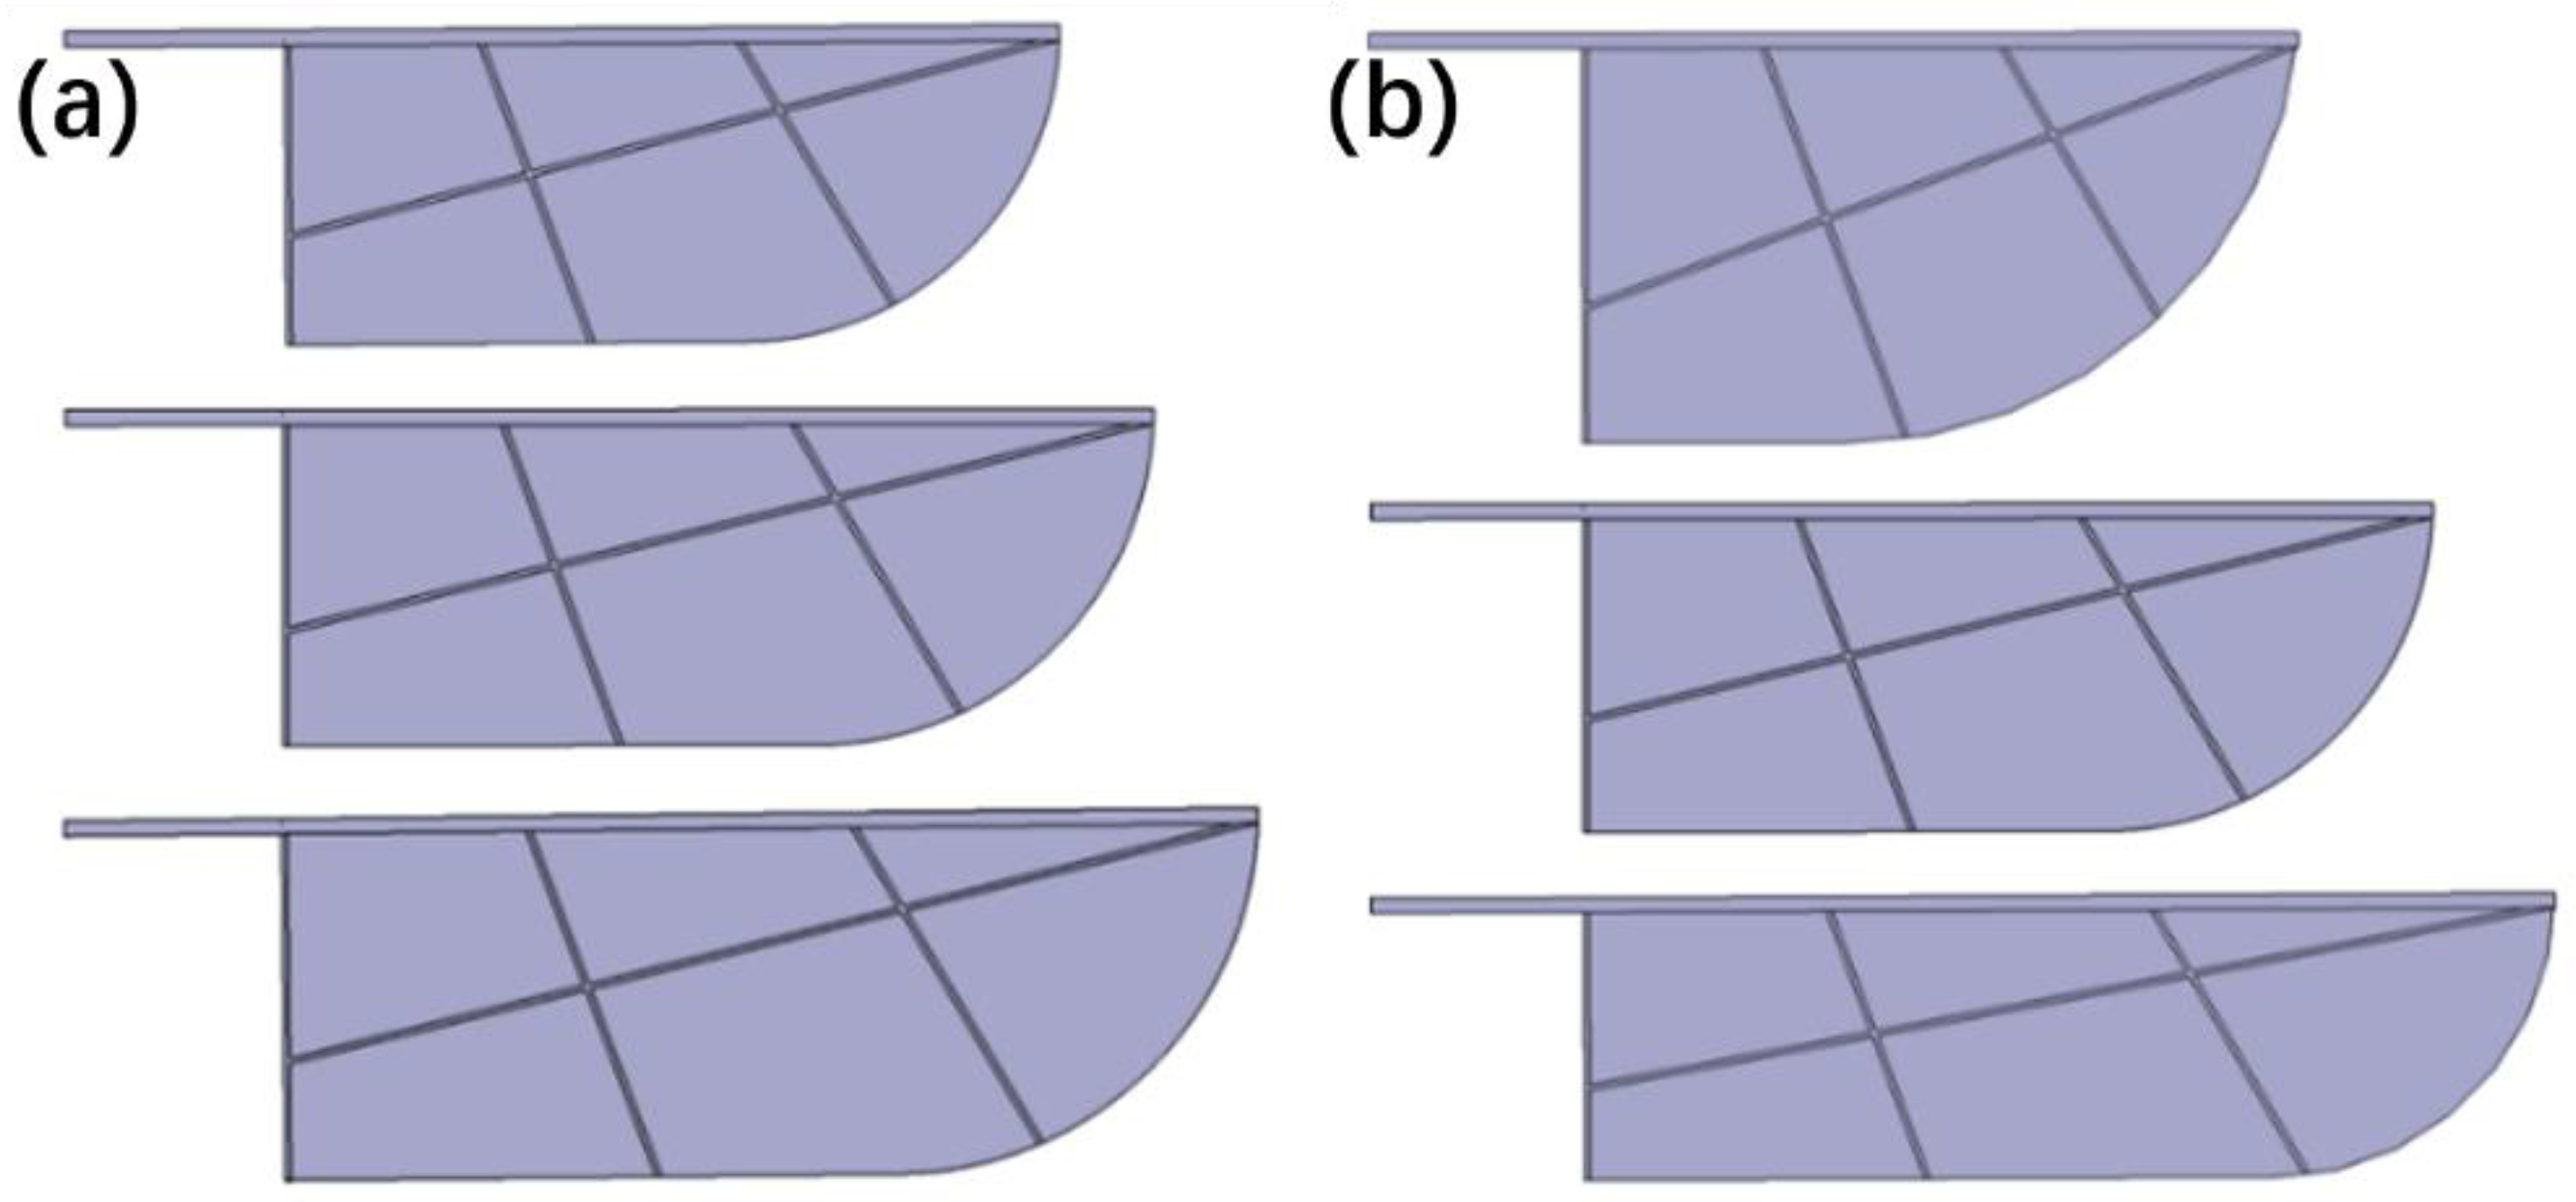
Based on the above conditions, the modeling of flapping-wing structures with different wing areas and aspect ratios is shown in
Figure 8.
3.2. Influence of Wing Area Variation
The wing area variation has a significant influence on the wing's aerodynamics. The lift coefficient with wingtip velocity is defined in Eq. (5).
where
is the lift coefficient,
is the lift,
is the air density,
is the flapping frequency,
is the twist angle,
is the second moment,
is the wing area.
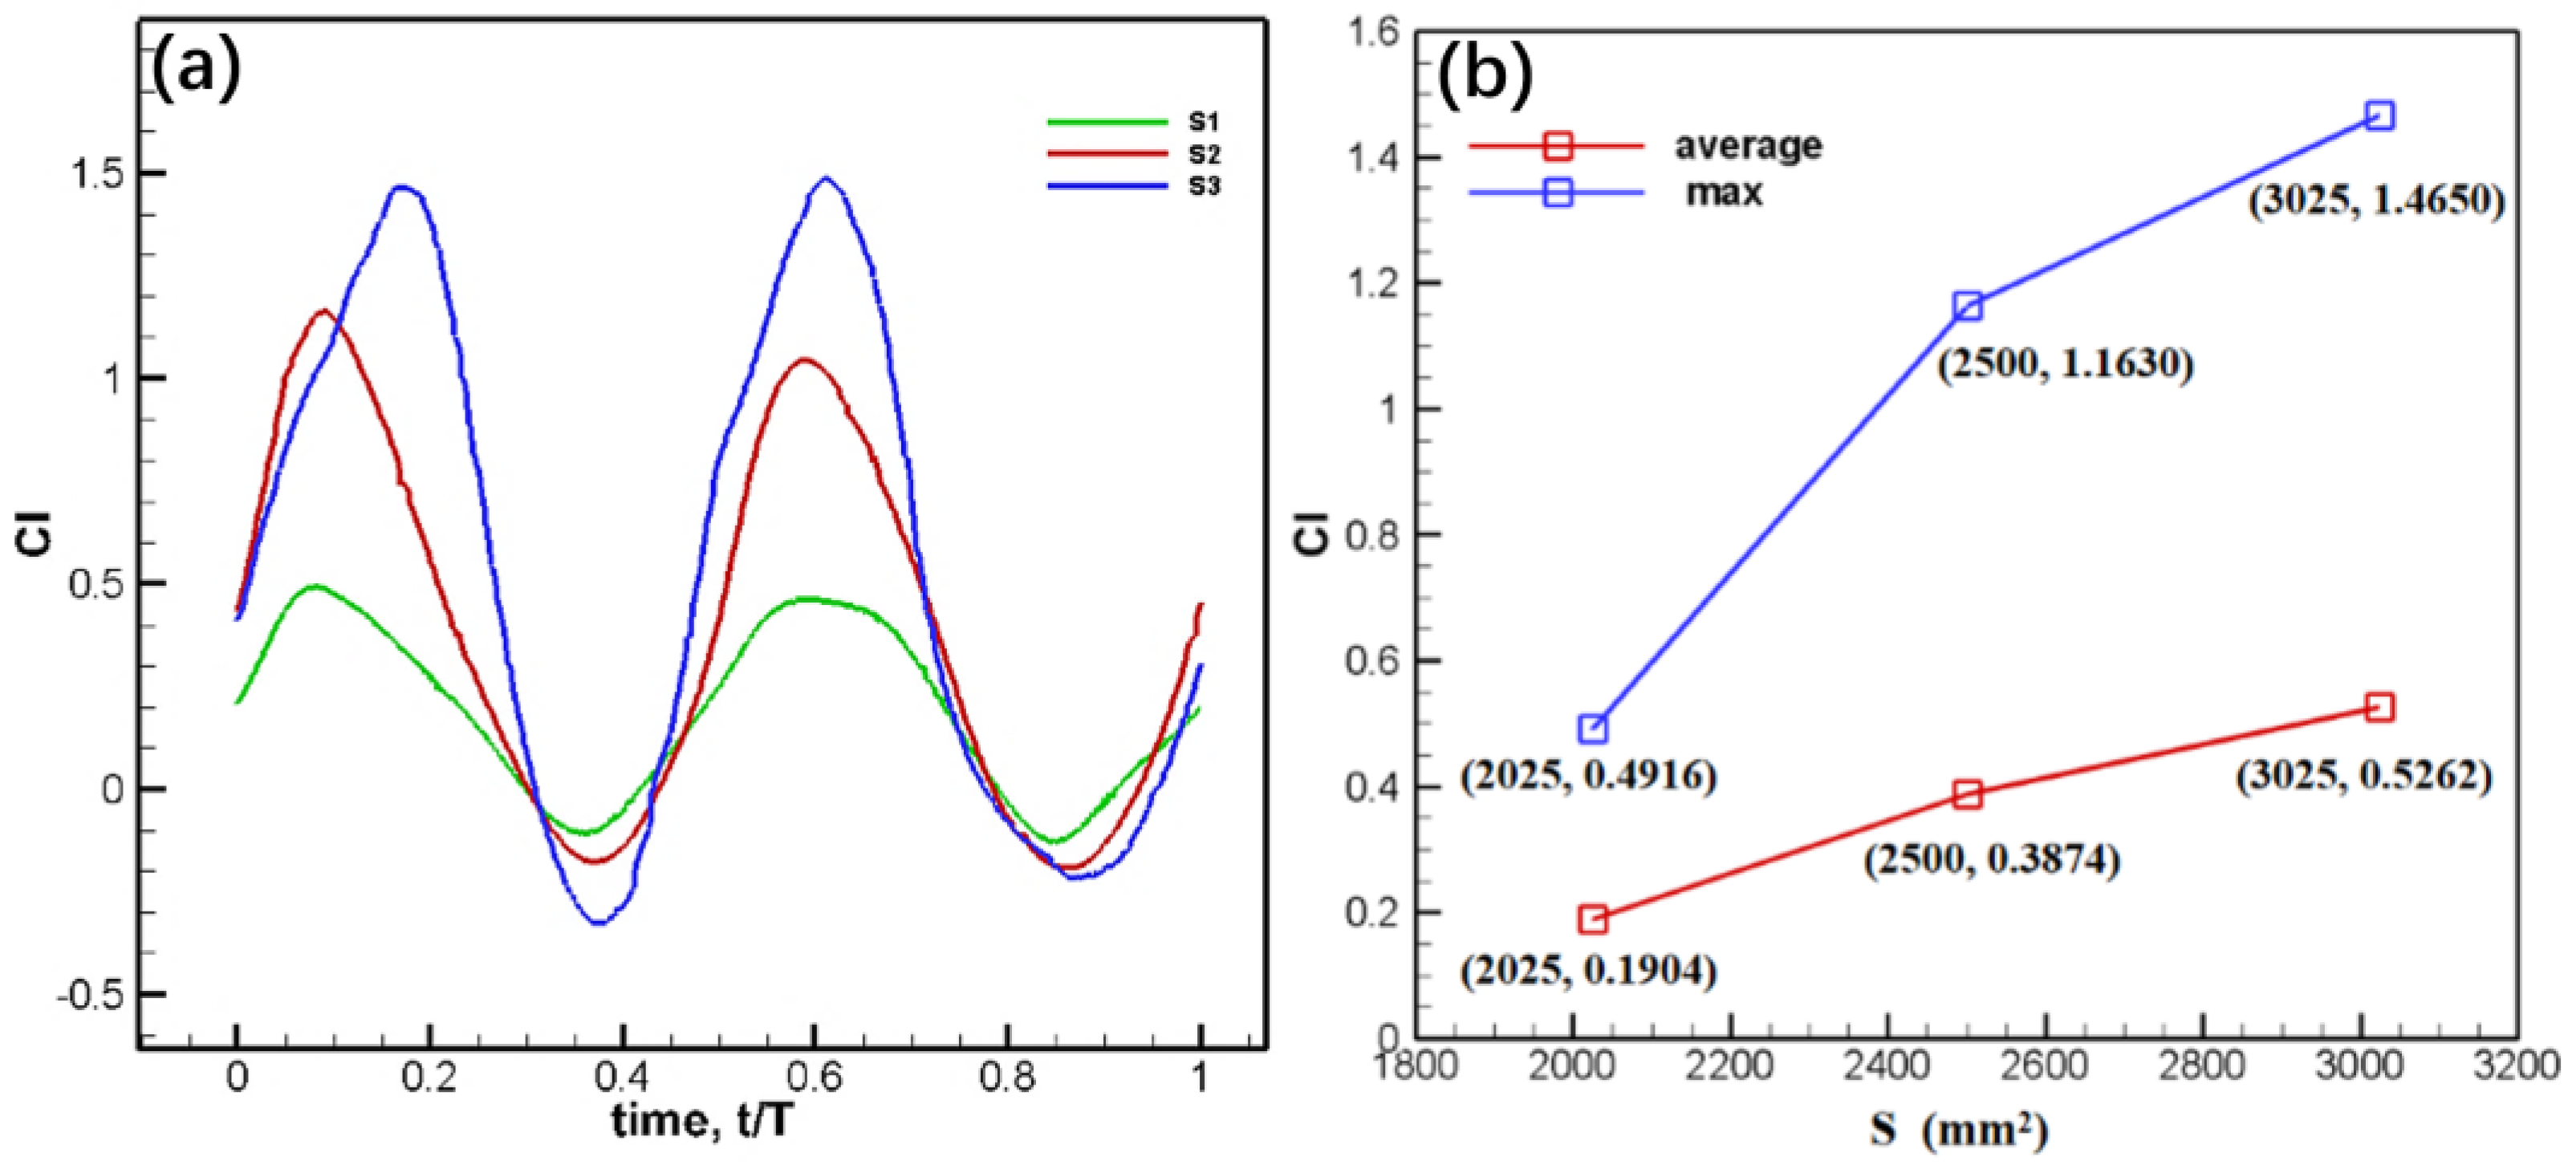
Eq. (5) is used to calculate the variation of the lift coefficient with wing area within one phase, the time-averaged lift coefficient and maximum lift coefficient under each wing area are as shown in
Figure 9.
The results show that the lift coefficient changes sinusoidally with time, and there are two peaks and valleys in a period. With the increase of wing area, the peaks and valleys move to the right, and the time-averaged lift coefficient and the maximum lift coefficient increase slowly. The lift coefficient peak of the maximum area is about three times higher than the minimum area.
Moreover, to avoid differences in coefficient calculations due to different wing areas, this study uses a non-dimensional pressure coefficient for analysis, as shown in Eq. (6).
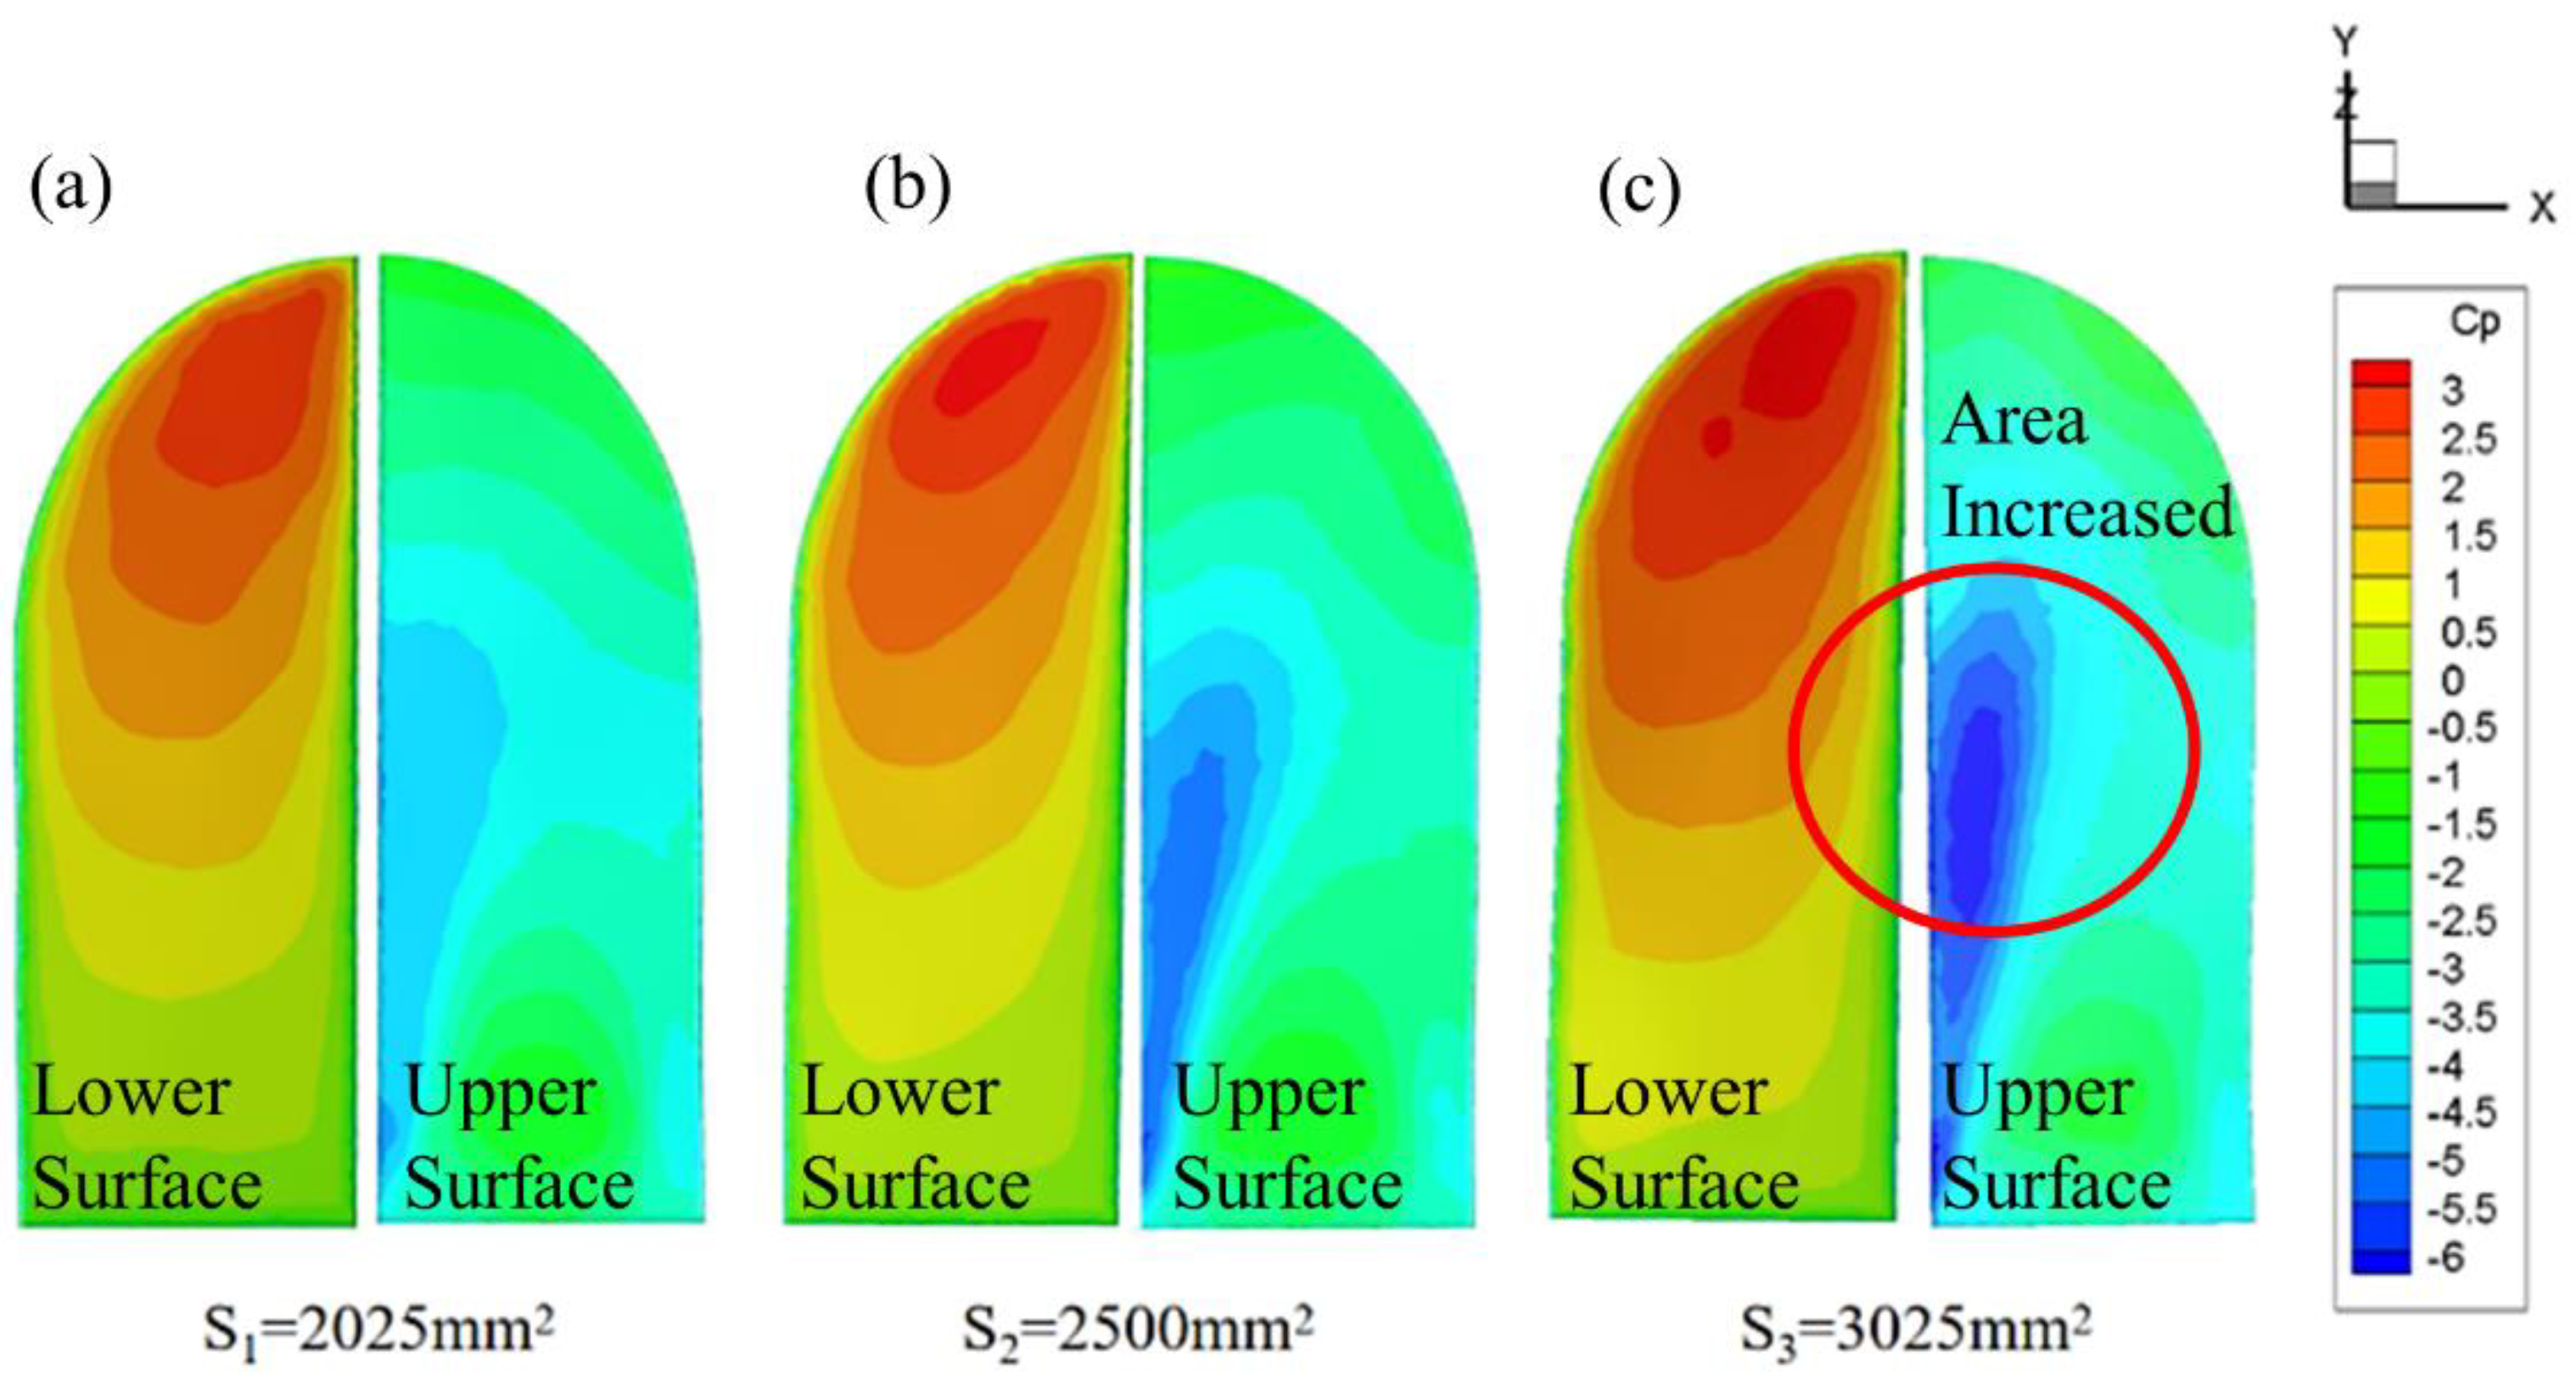
The maximum motion speed is t/T=0.75, and the pressure coefficient contour on both sides of the wing under each area is shown in
Figure 10.
The results show that the high-pressure area is concentrated in the wing tip and the low-pressure area is concentrated in the leading edge. With the increase of wing area, the differential pressure increases, which is more conducive to the generation of lift. It is consistent with the phenomenon that the peak value of the lift coefficient increases with the increase of wing area in
Figure 10(a). In addition, with the increase in wing area, the high-pressure area is still concentrated at the wing tip, and the low-pressure area gradually moves from the leading edge of the wing root to the wing tip.
In terms of structural deformation, the overall deformation under three wing areas is calculated. The deformation contour is shown in
Figure 11.
The results show that with the increase of wing area, the flexible deformation will increase, and the passive twist is more obvious. In the same time period, the position of maximum deformation is the same, focusing on the wingtip. Consider a wing area, the position of the maximum deformation moves with time. At t/T=0.5, the maximum deformation occurs between the wing tip and the rib near the wing tip, as shown in
Figure 11(a). At t/T=0.75, the maximum deformation is concentrated at the leading edge of the wing tip. At t/T=1.0 moment, the maximum deformation location is at the end of the rib near the wing tip, with a larger distribution range, near the trailing edge.
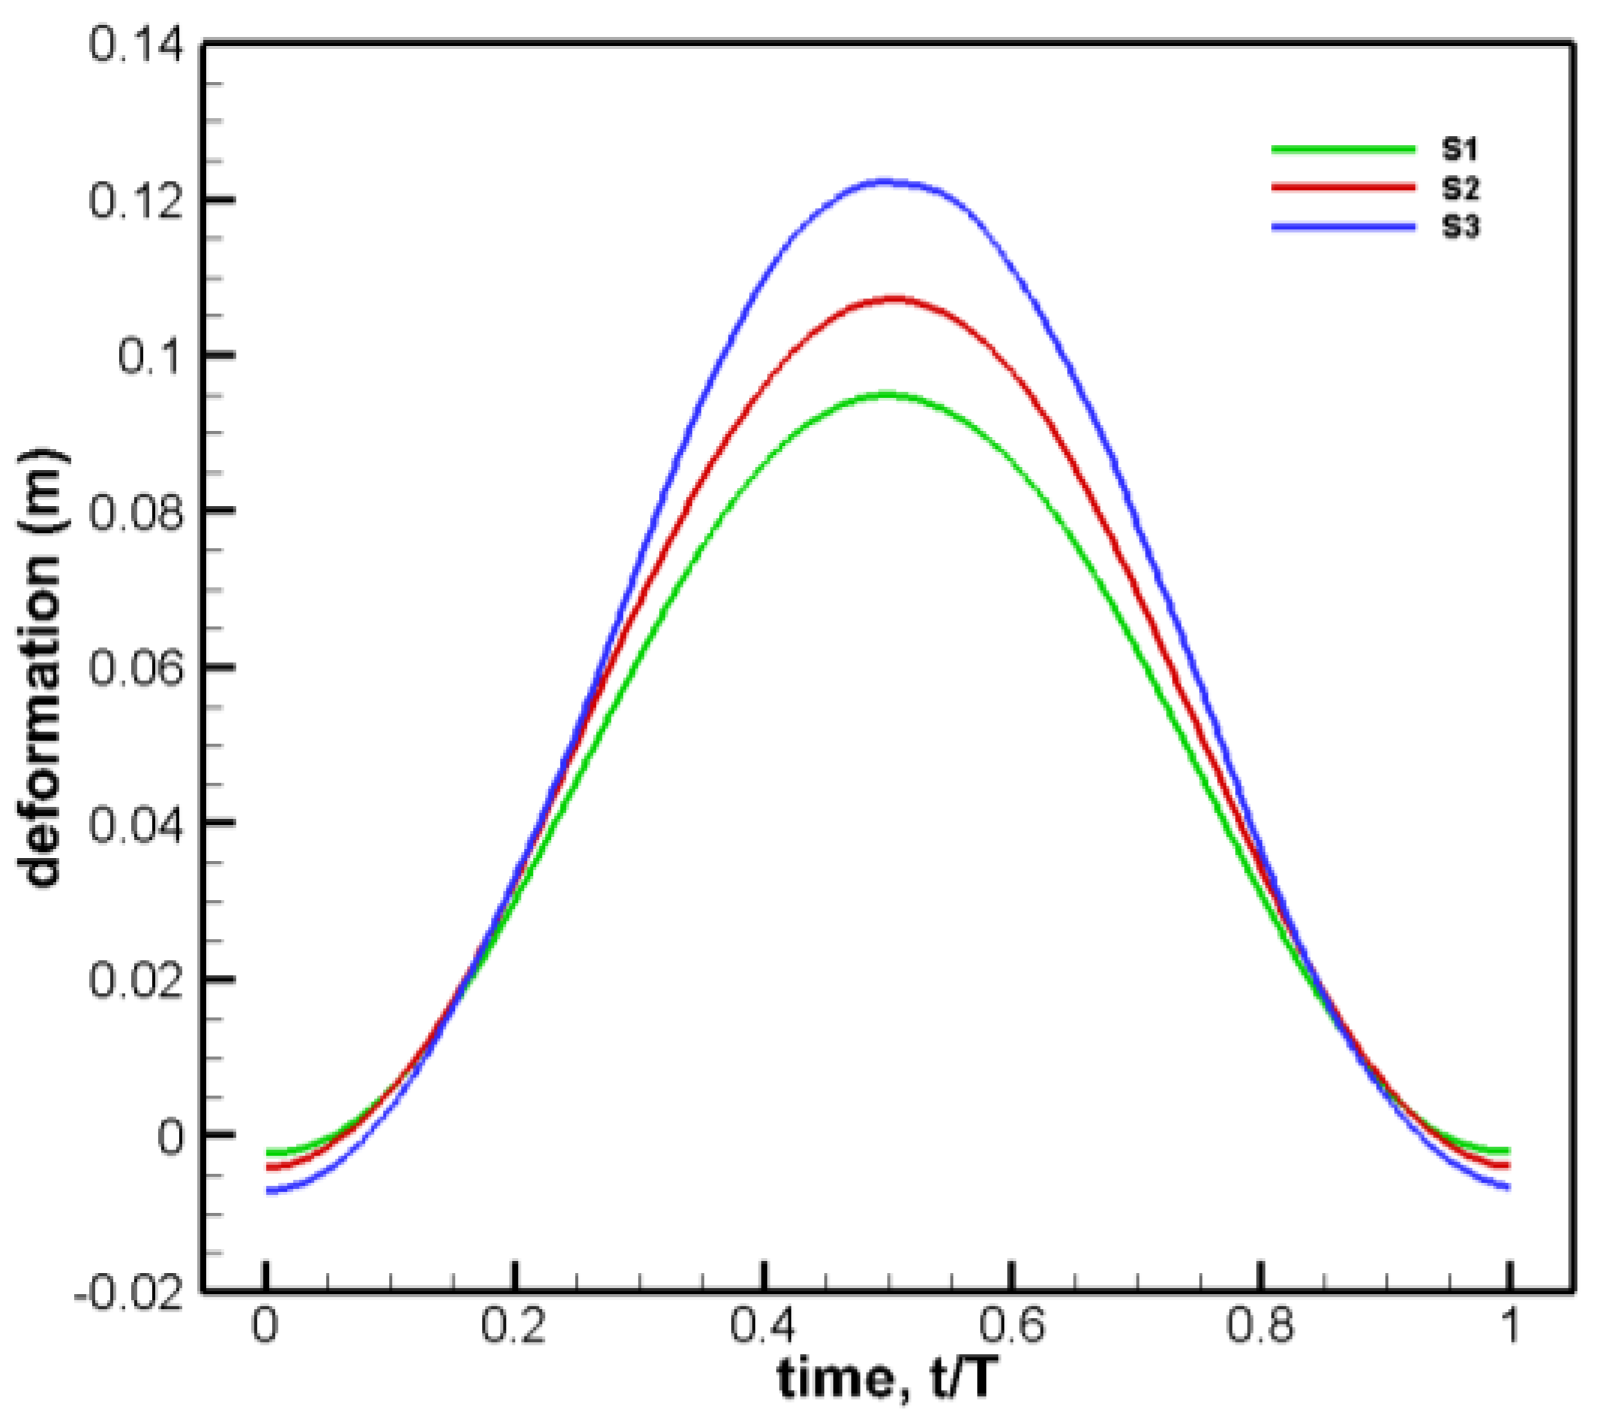
Further, focus on the quarter-circular surface of the wing tip for analysis due to the deformation occurs mainly at this position. The maximum deformation of this part varies with the wing area as shown in
Figure 12.
Figure 12 shows that the wing tip deformation increases significantly with the increase of the area, with a maximum of 26.3% larger, which is consistent with the overall deformation law. The wing tip deformation presents a sinusoidal change within the period, and there is a peak value at t/T=0.5.
The simulation results show that the transmitted load is mainly borne by the spar and the rib, and reaches the maximum stress at the limit positions at both ends, and the stress concentration position hardly changes with time. The equivalent stress results of the spar and rib in the 2500 mm
2 wing area are drawn in
Figure 13.
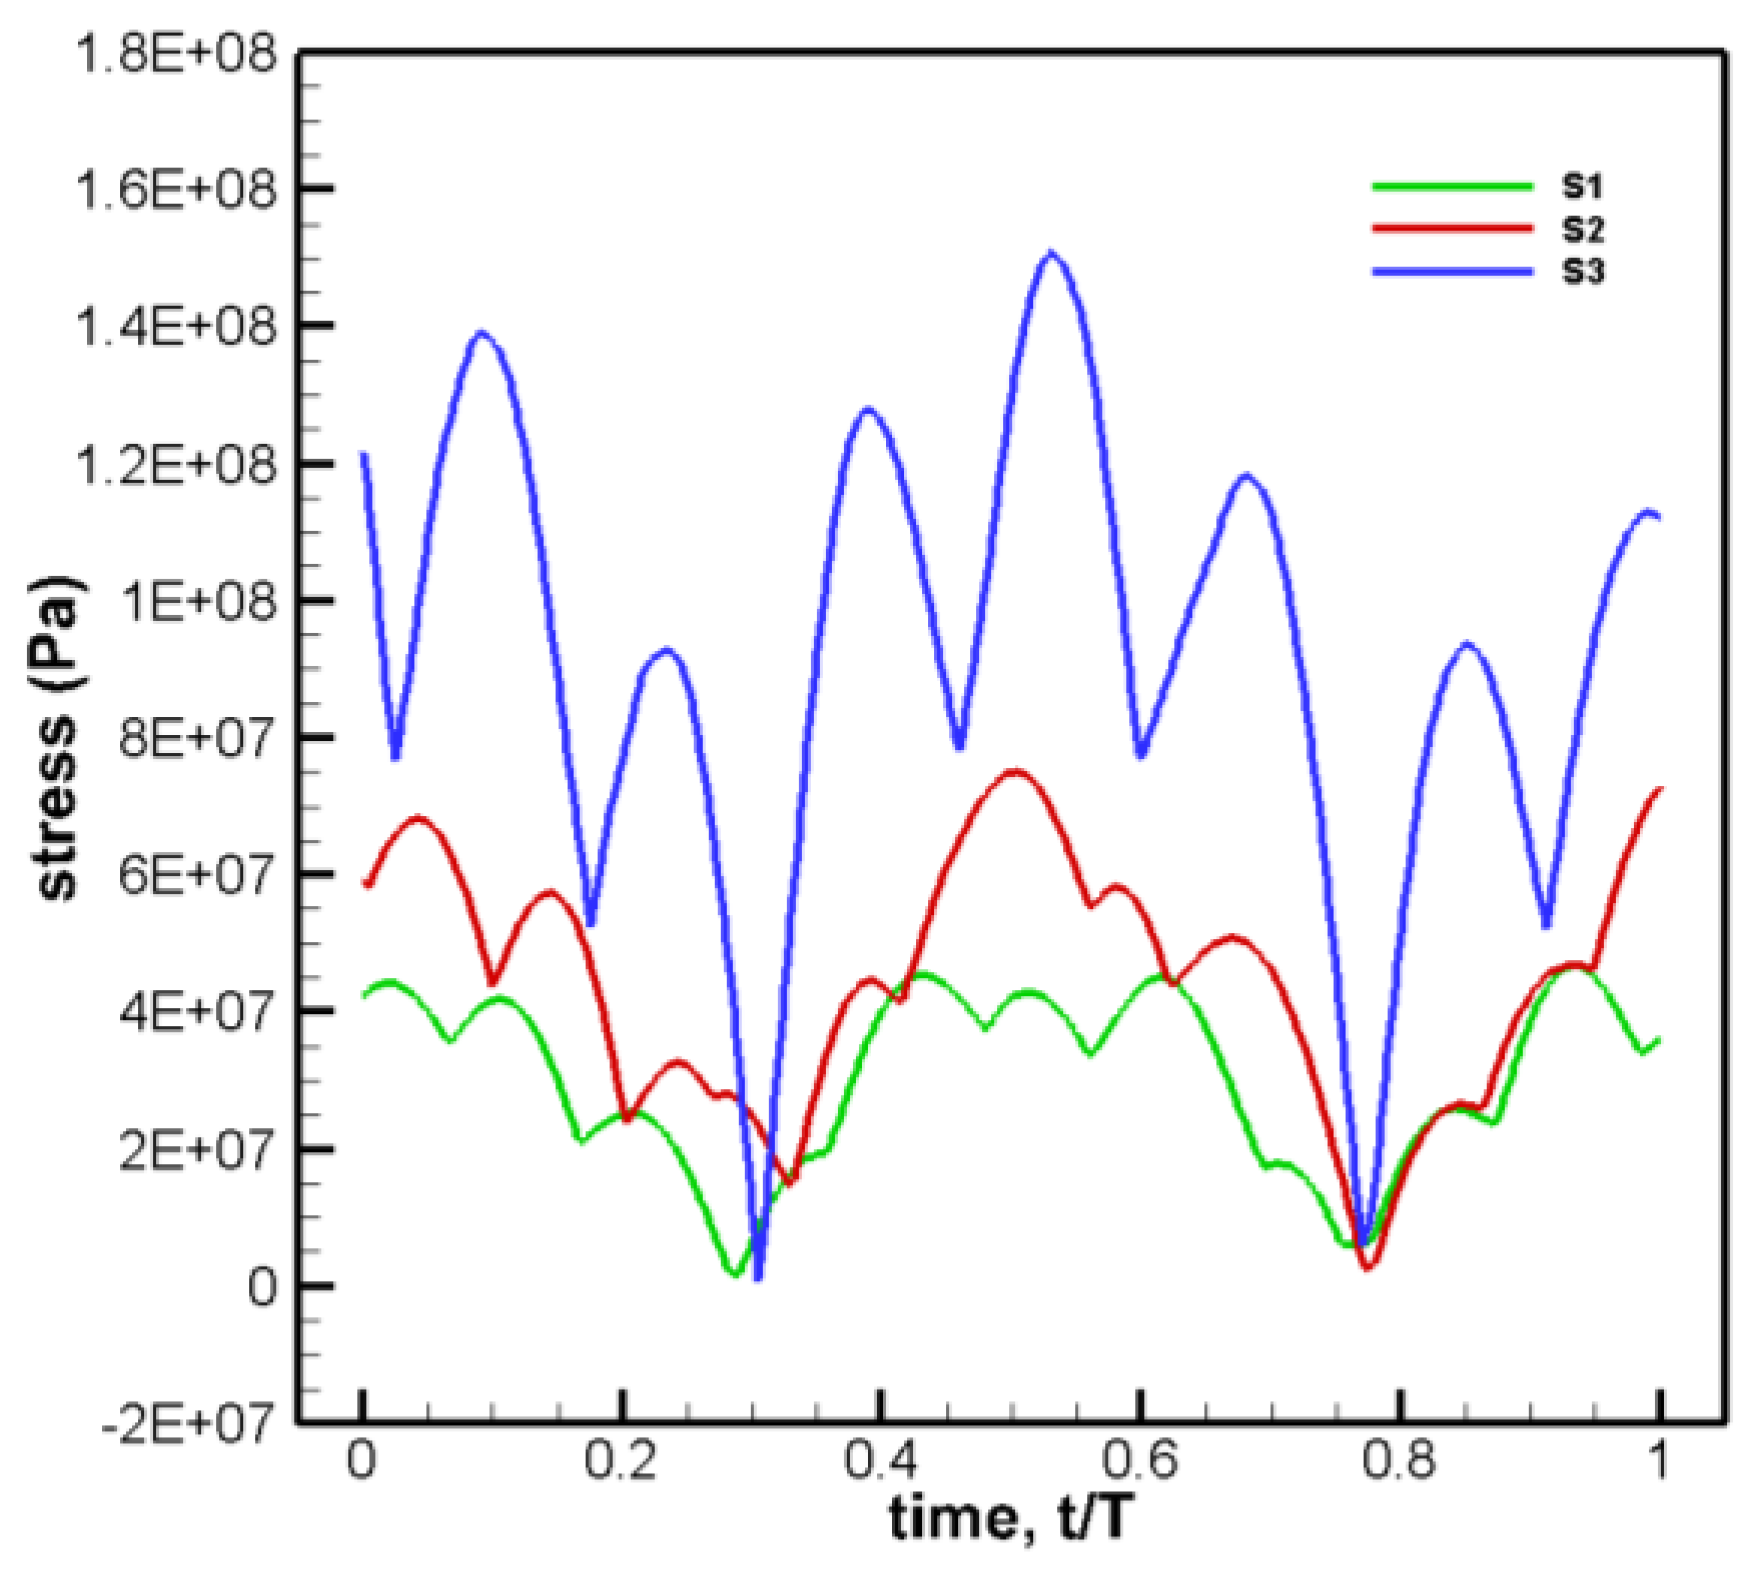
Figure 13 shows that the stress varies greatly along the chord, increasing gradually from the wing tip to the wing root The stress mainly concentrates on the joint of the wing spar and rib and the root of the spar, especially at the connection of the third chord rib at the distance from the wing root, the joint of the rib, the tip of the wing spar, and the root of the main spar. To facilitate subsequent studies of different spar forms, the maximum equivalent stress of the wing spar root section with the wing area is analyzed, as shown in
Figure 14.
The results show that with the increase in wing area, the stress at the root of the spar obviously increases, and the stress also changes periodically. However, stress varies in a non-standard sine way. There are many extreme points in the stress curve (average 108.3% higher), and the law of the stress curve is not completely the same, which shows that the wing area not only affects the maximum stress but also affects the parameters such as the time and location when the maximum stress occurs. The average stress is 139.53% larger than wing areas S2 and S3.
In summary, based on the curve of lift coefficient and structural stress deformation. The results show that the increase in wing area will promote 26.3% of the flexible deformation and passive twist of the wing, and then increase the lift coefficient about 3 times higher. It is beneficial to improve the aerodynamic characteristics of flexible flapping wings in a hovering state. But at the same time, the spar and rib will also bear greater stress, so the flapping wing design should be considered according to the actual situation.
3.3. Influence of Aspect Ratio Variation
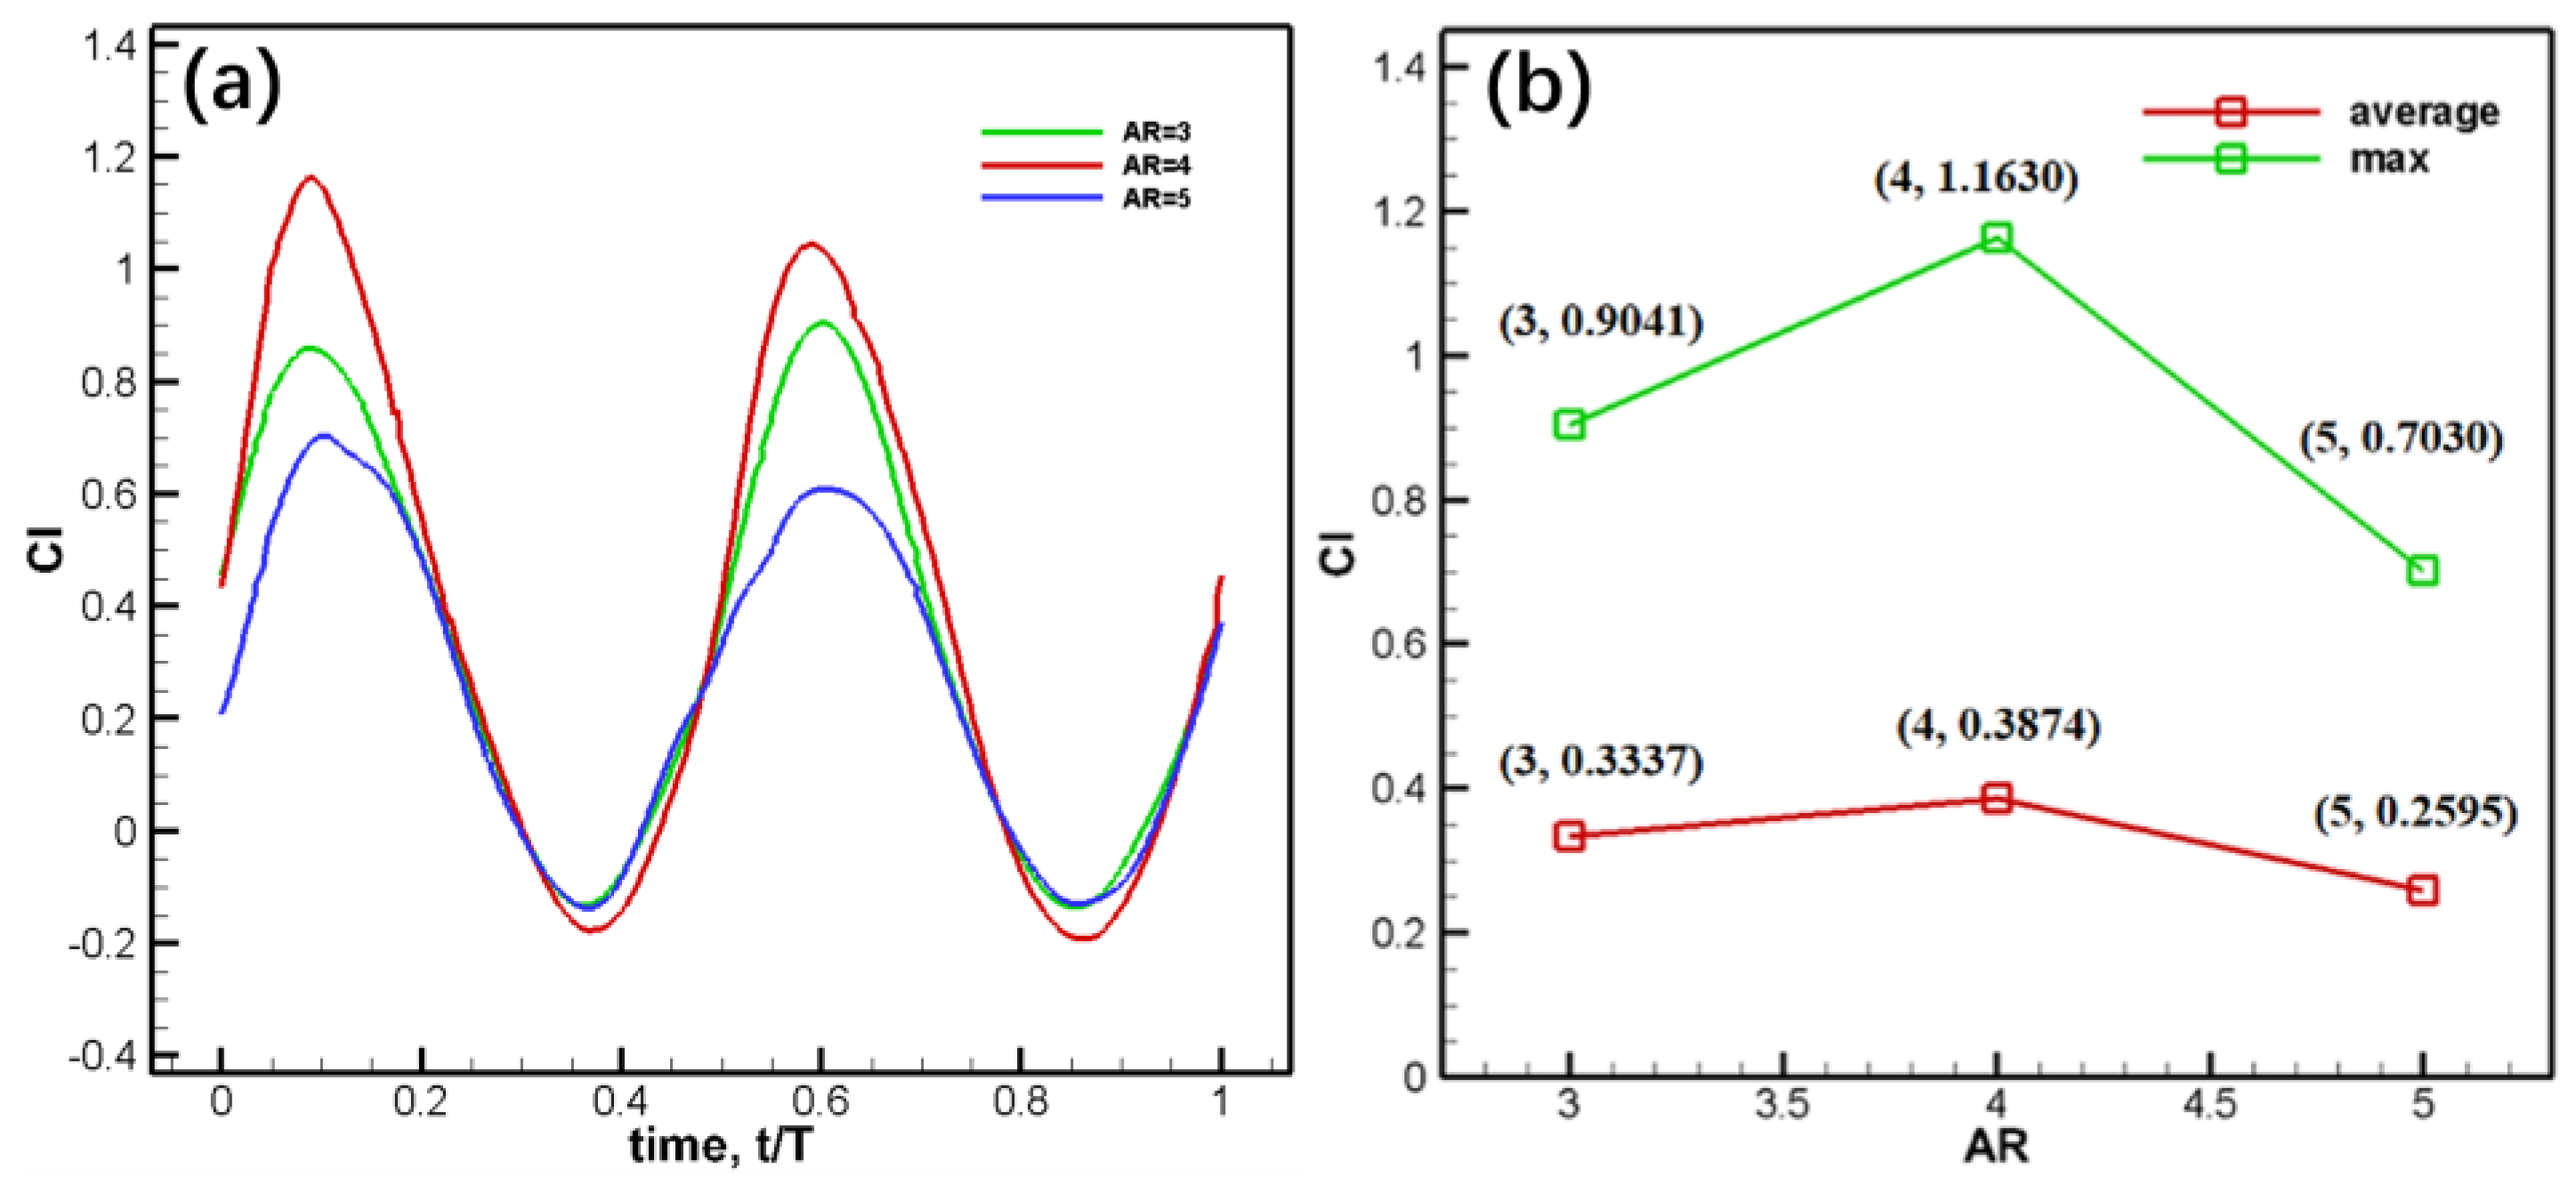
The lift coefficient, time-averaged lift coefficient, and maximum lift coefficient at various aspect ratios(AR) in the period are shown in
Figure 15.
Based on
Figure 15, it can be found that the lift coefficient changes sinusoidally with time. The larger the peak value of the lift coefficient (maximum 91.94%), the more the peak moves to the left, which is contrary to the conclusion obtained under the condition of variable area. With the increase of aspect ratio, the time-averaged lift coefficient and the maximum lift coefficient first increase and then decrease. When AR is 4, the time-averaged lift coefficient and the maximum lift coefficient reach the maximum, and when AR is 5, the lift coefficient decreases sharply.
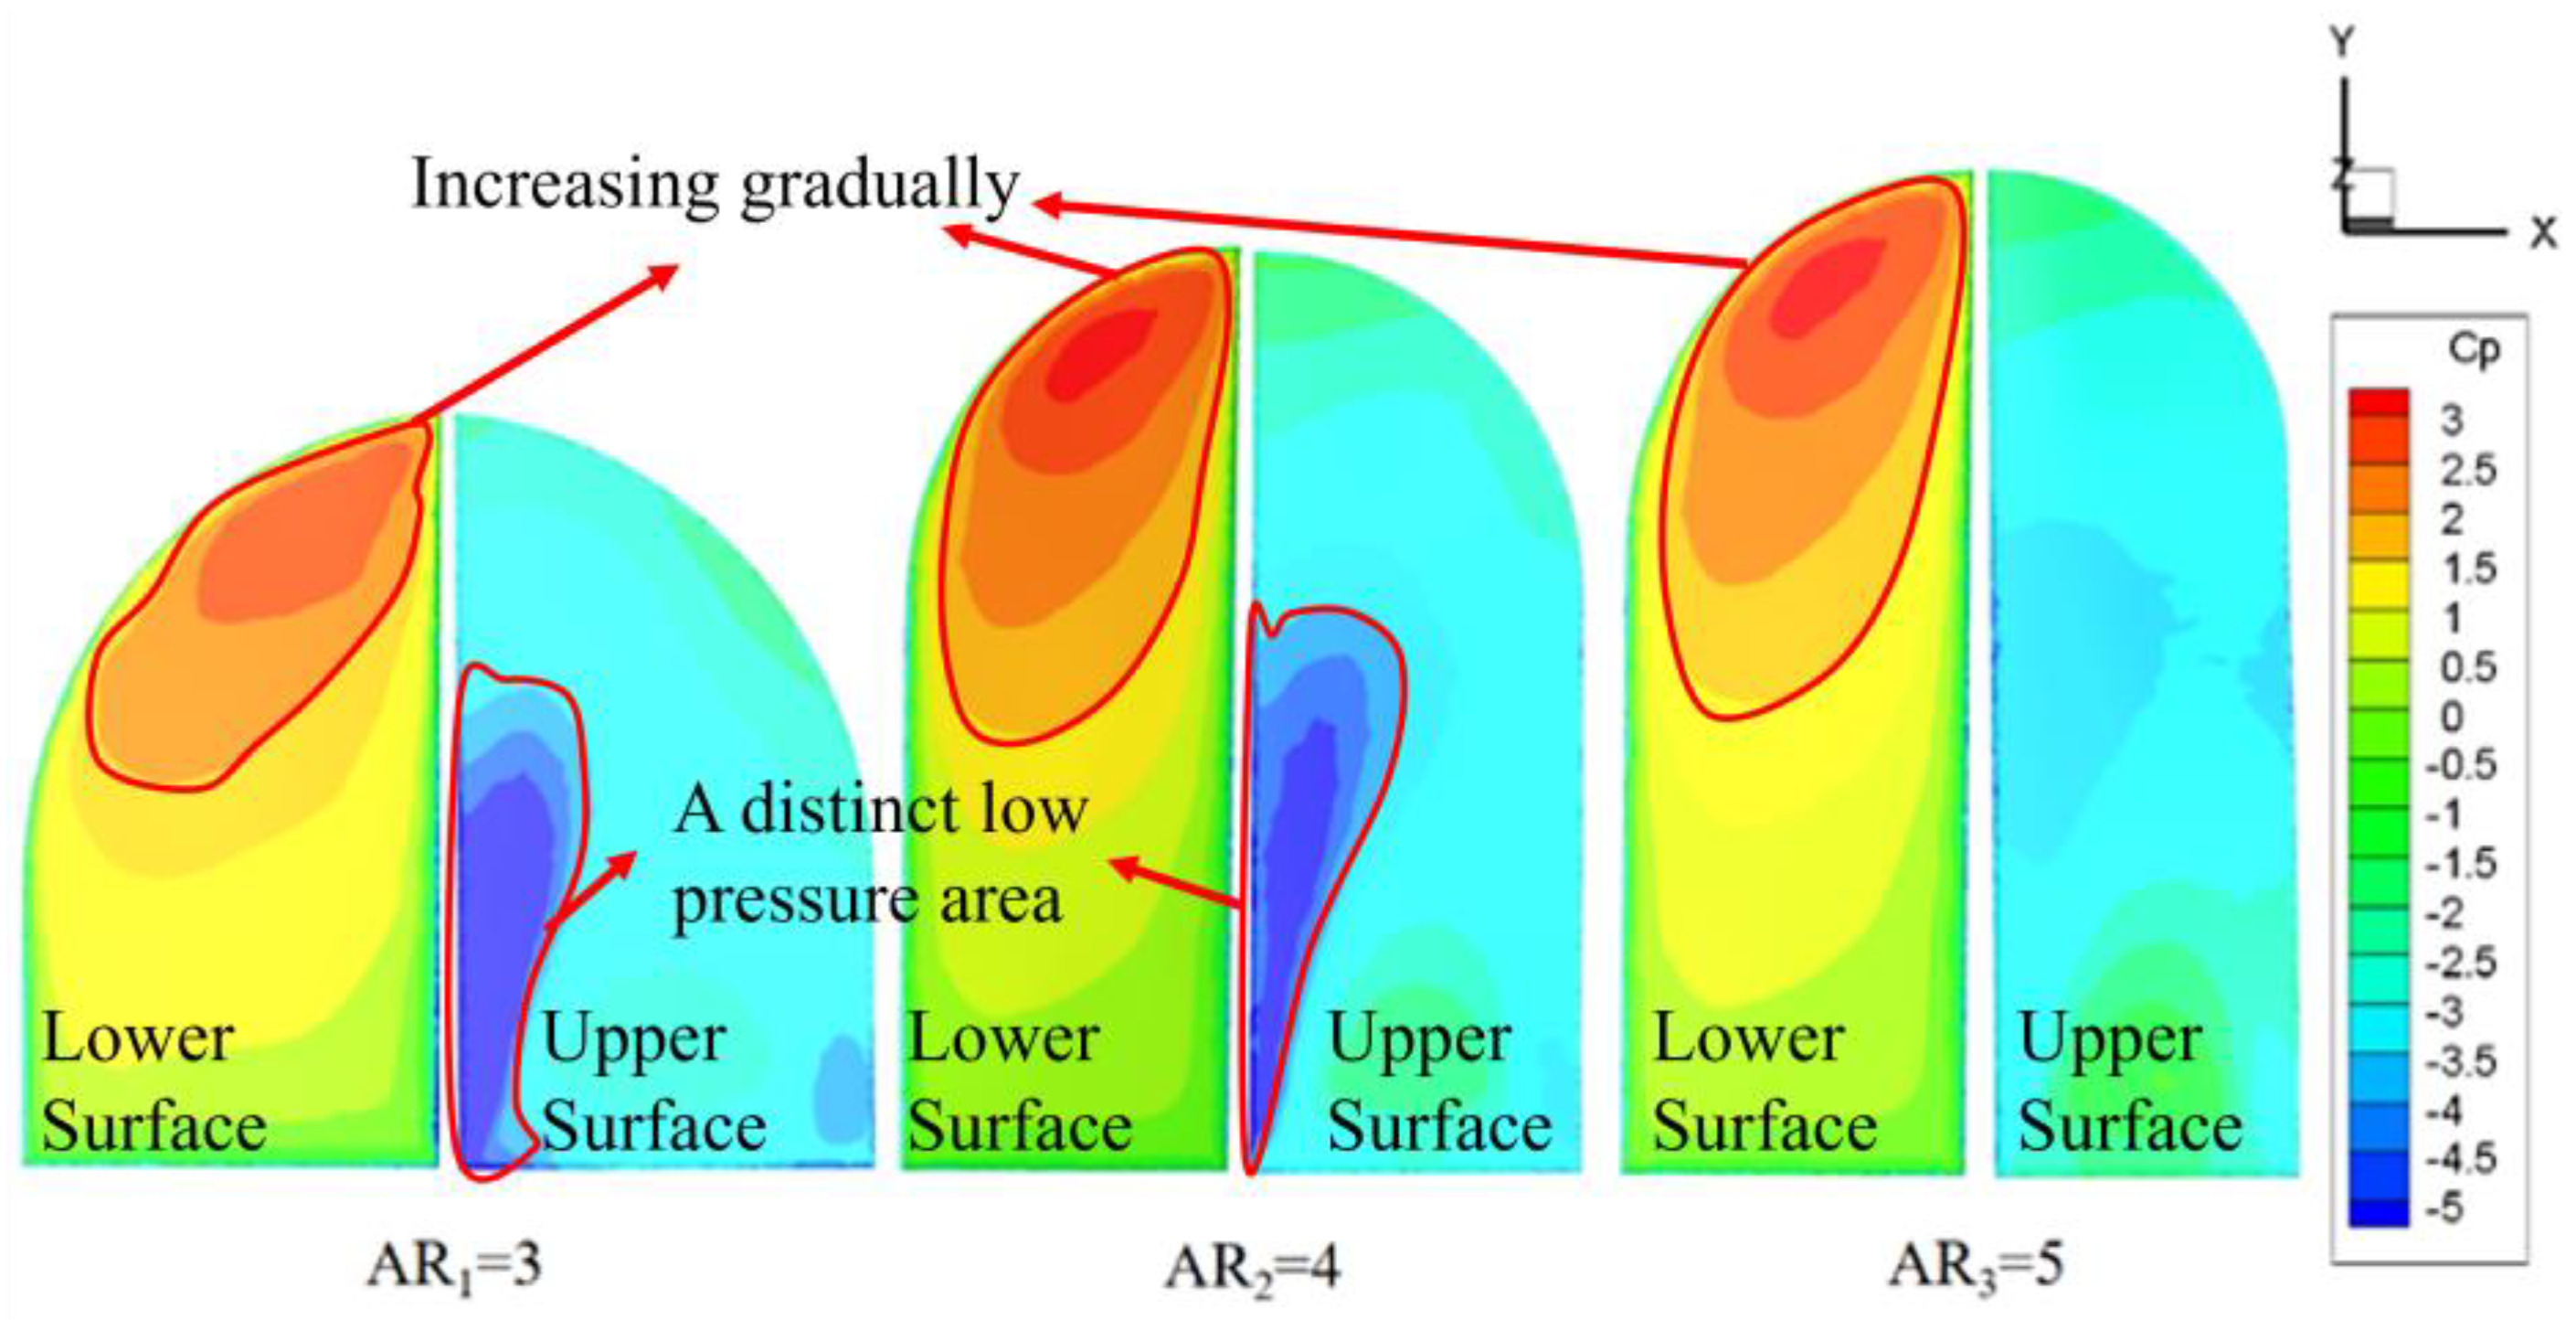
Under different aspect ratios, the pressure distribution of forward flapping and backward flapping in one cycle is similar with time. At t/T=0.75, the cloud diagram of the wing pressure coefficient under various aspect ratios is shown in
Figure 16.
Figure 16 shows that the high-pressure area is concentrated at the tip. When AR is 4, the pressure difference between the two wings is the largest, which is beneficial to the generation of lift. It also explains the conclusion that the lift coefficient is the largest when AR is 4. With the increase in aspect ratio, the high-pressure area is still concentrated at the wing tip, and its value will change but its position will hardly change. The low-pressure area is at the leading edge, moving from the wing root to the middle. When AR is 5, the pressure coefficient of the low-pressure part increases, and the low-pressure area spreads from the middle of the leading edge, and there is no obvious low-pressure area.
As for the wing deformation. The wing deformation at the trailing edge will change with the aspect ratio, as shown in
Figure 17.
Compared with the three aspect ratios in
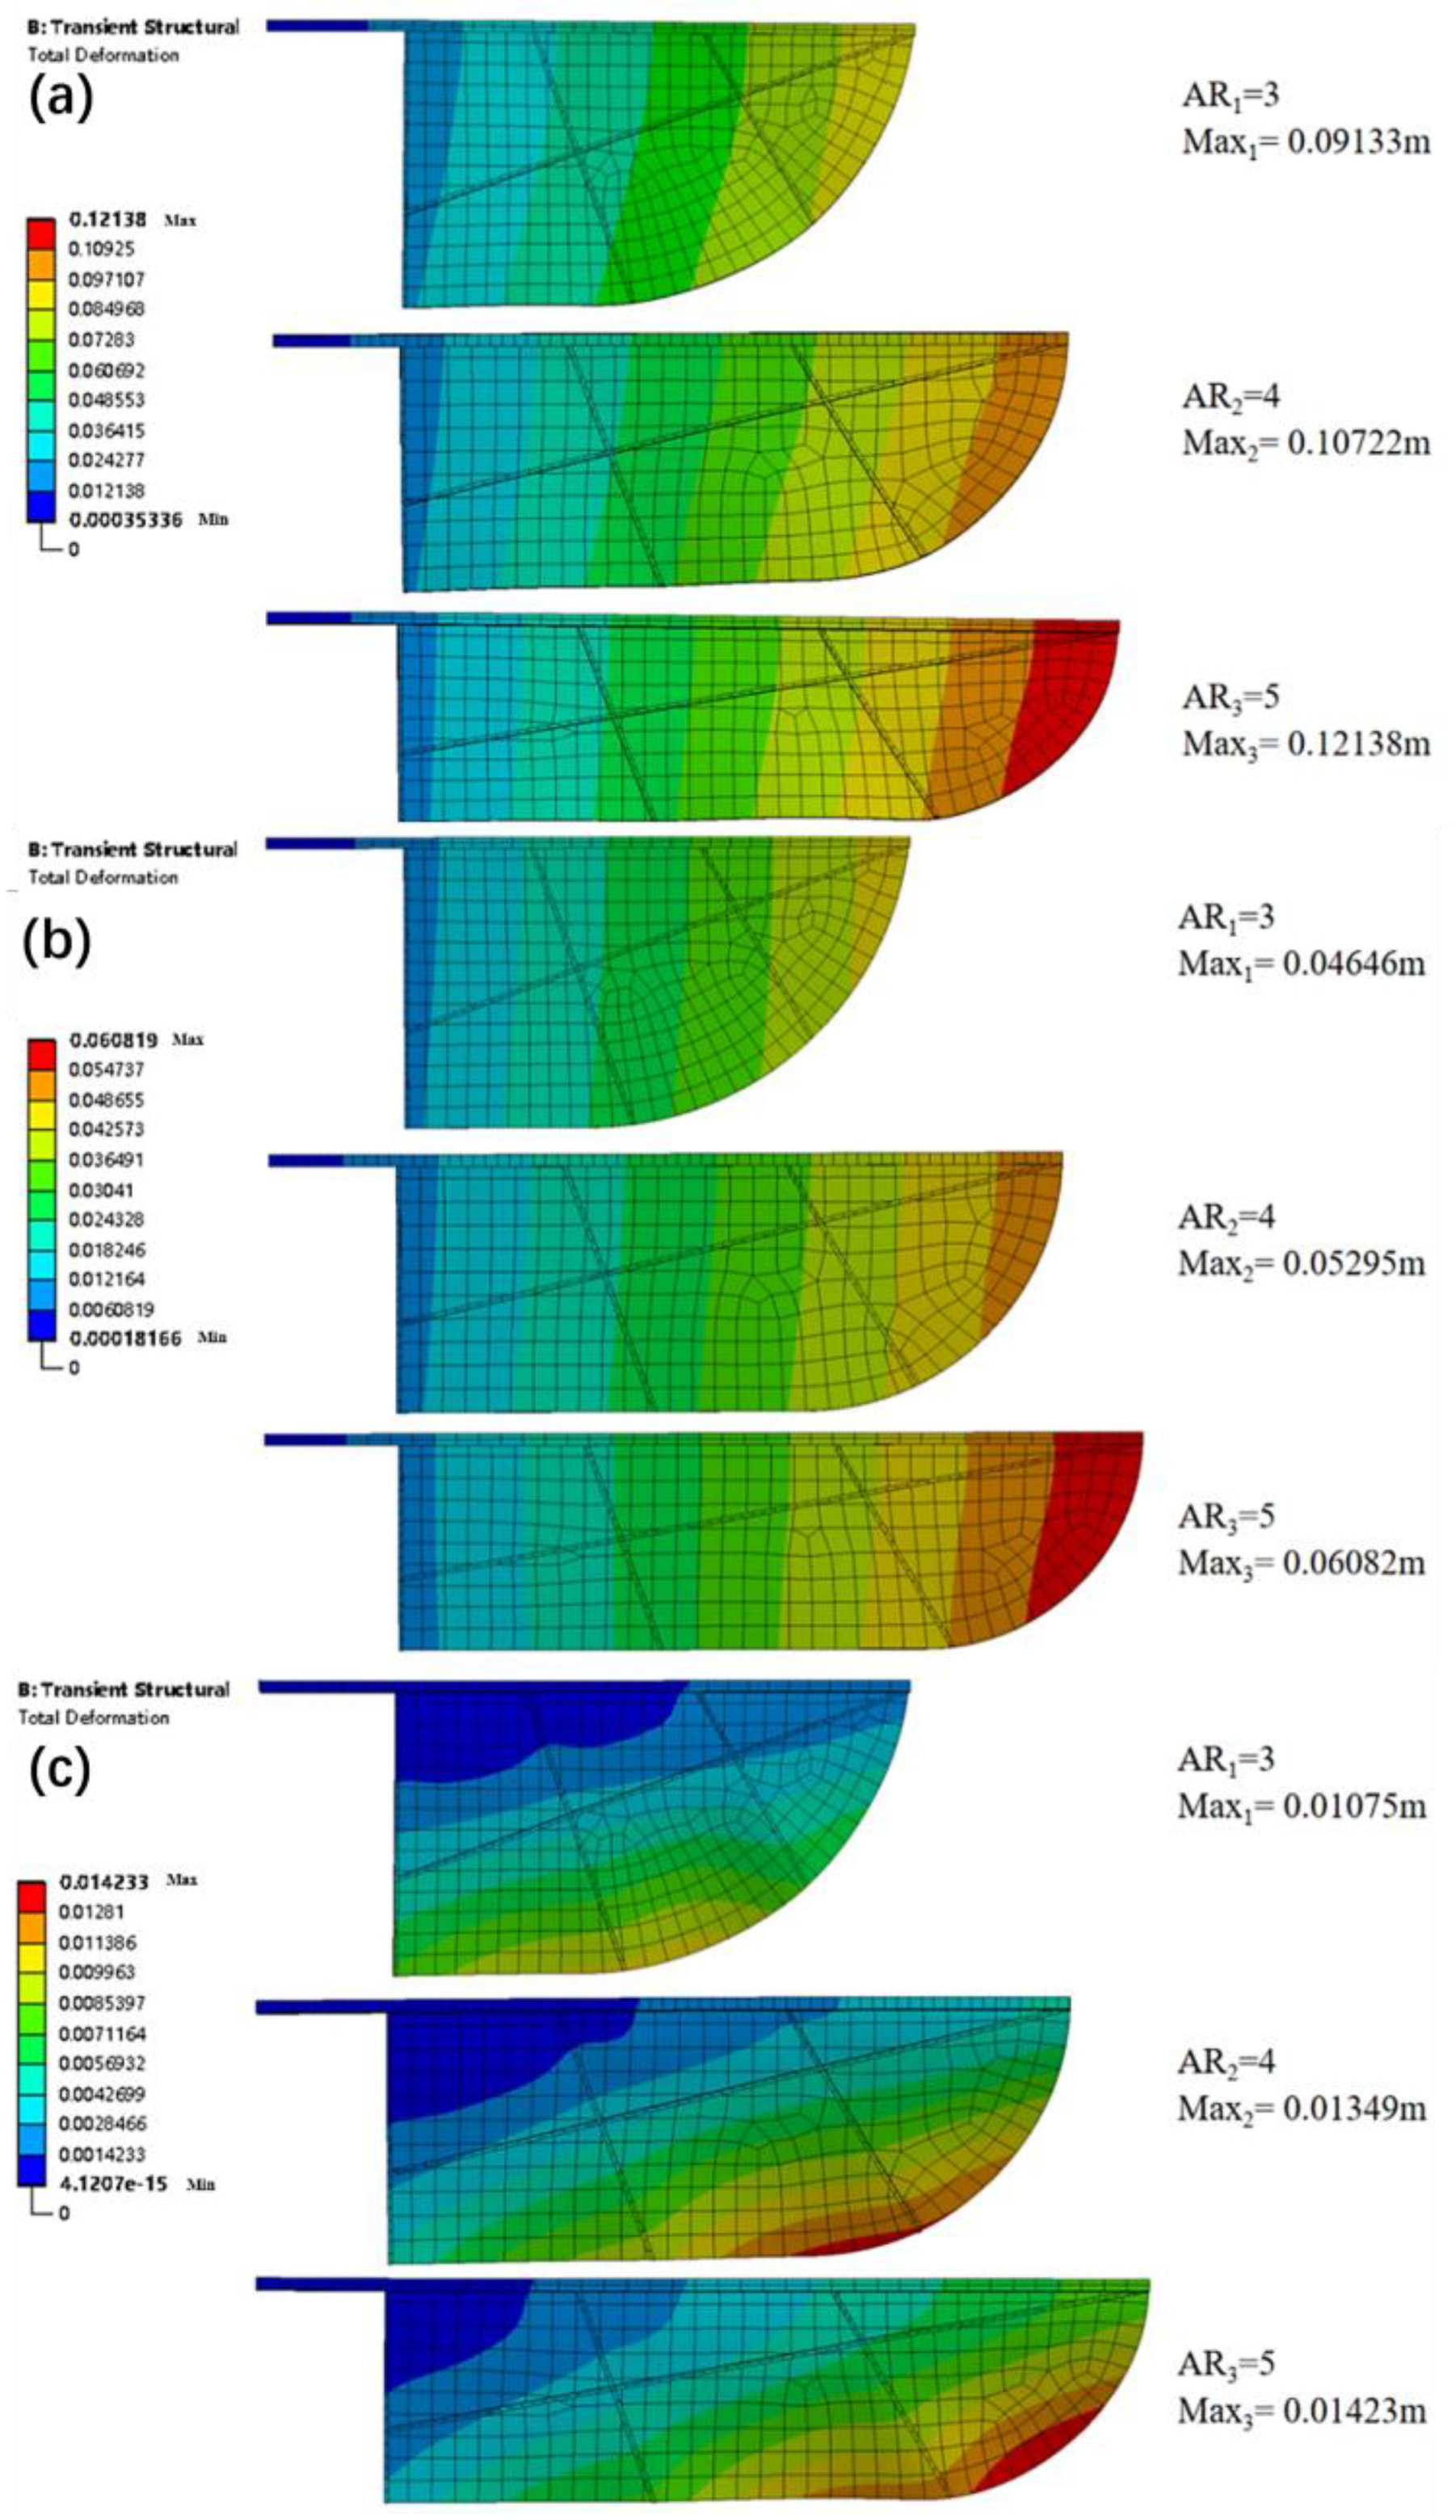
Figure 17, it can be found that the smaller the aspect ratio, the more obvious the passive twist of the wing. With the increase in aspect ratio, the maximum twist position gradually changes from the middle of the trailing edge to the wing tip. Taking the total deformation of the last cycle at three special moments of t/T=0.5, t/T=0.75, and t/T=1.0 as shown in
Figure 18.
With the increase in aspect ratio, the flexible deformation will increase at every moment. At t/T=0.5 and t/T=0.75, the location of the maximum deformation is basically at the wing tip, which is less affected by the aspect ratio. But at t/T=1.0, the location of the maximum deformation is more affected by the aspect ratio. When AR is 3, the maximum deformation was near the rib at the trailing edge near the root. For AR is 4 the maximum deformation is between the two chord spars at the trailing edge and closer to the right rib. And for AR is 5 the maximum deflection is between the right rib and the wing tip at the trailing edge. In the longitudinal comparison, the maximum deformation moves with time, the maximum deformation is obviously concentrated in the leading edge of the wing tip from t/T=0.5 to t/T=0.75. From t/T=0.75 to t/T=1.0, the maximum deformation gradually moves towards the trailing edge and the root, and it moves more obviously under the small aspect ratio. This indicates that the smaller the aspect ratio, the more significant the flexible change of the flapping wing.
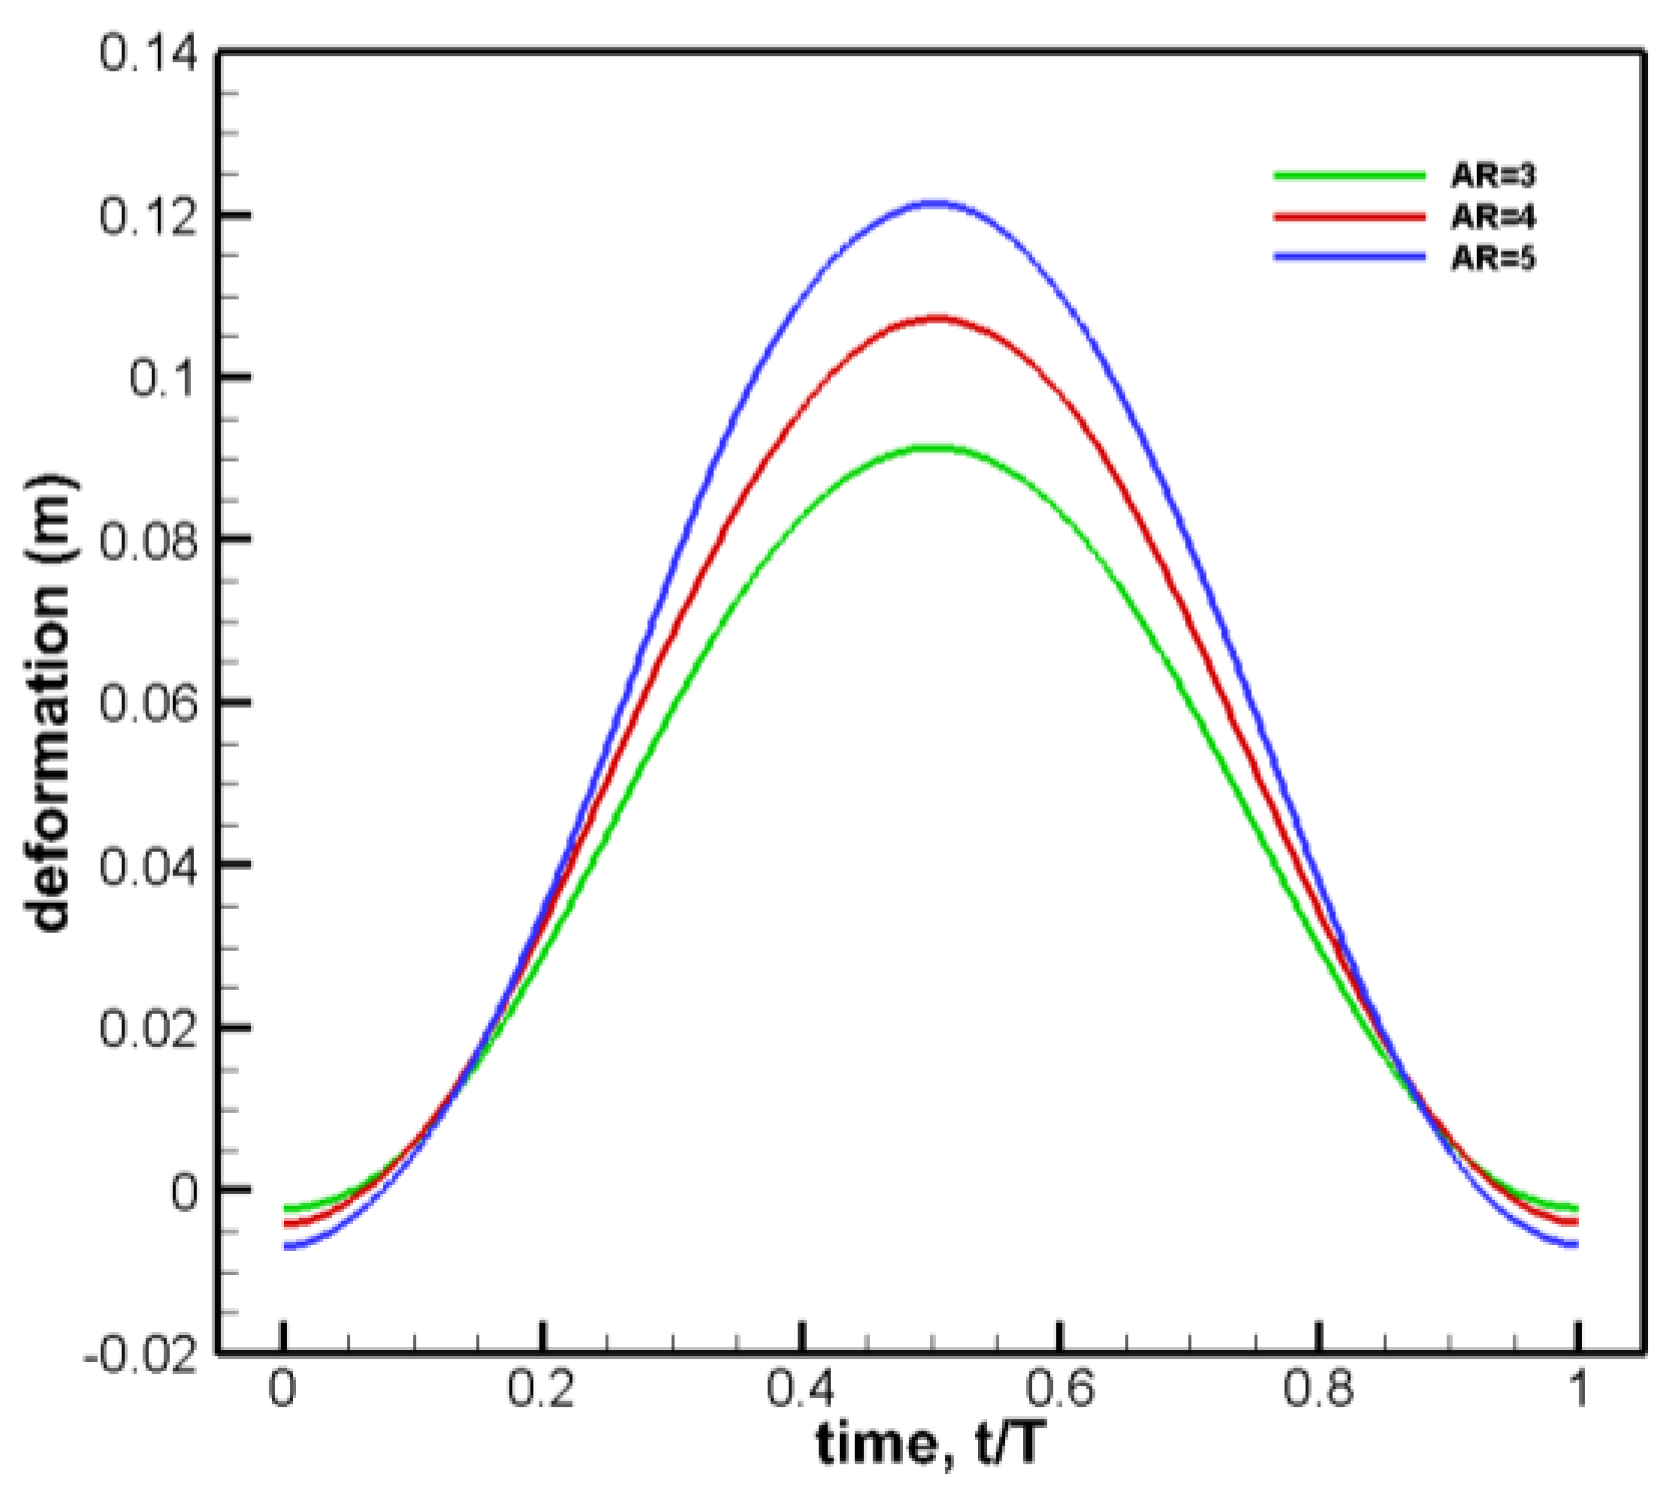
In conclusion, the maximum deformation varies from the leading edge to the trailing edge of the wing tip within a quarter arc. Therefore, the corresponding surface of the arc is selected for further analysis. The maximum deformation of the surface varies with the wing area, as shown in
Figure 19.
With the increase of aspect ratio, the deformation of the arc part of the wing tip becomes larger obviously, which is consistent with the overall deformation law. The deformation of the wing tip also changes sinusoidally during the period, and there is a peak at t/T=0.5. The peak value of the maximum aspect ratio is about 30% larger than that of the minimum aspect ratio. However, the deformation results can only reflect the influence of flapping-wing flexibility deformation to a certain extent based on relative displacement, and quantitative analysis of twist change is needed to reflect the influence of flapping-wing flexibility more accurately.
The load after the same transfer is mainly borne by the spar and rib, the stress in this part is greater than that in the wing surface, and reaches the maximum stress at the limit position. Under the same stress scale range, the equivalent stress results of the spars and ribs of flapping-wing models with AR=3 and AR=5 at the t/T=1.0 limit moment are shown in
Figure 20. And compared with the stress results of the flapping wing model with AR=4 in
Figure 13.
It is found that the stress under each aspect ratio is the same because the stress changes greatly along the chord direction, and the stress increases obviously from the wing tip to the root. The root of the spar is the stress concentration place. The difference is that the overall stress distribution is small when AR is 3, and the overall stress value is large when AR is 4. When AR is 3 and AR is 5, the maximum stress is concentrated at the root of the spar. As can be seen from
Figure 13 above, when AR is 4, there are three obvious places of maximum stress concentration.
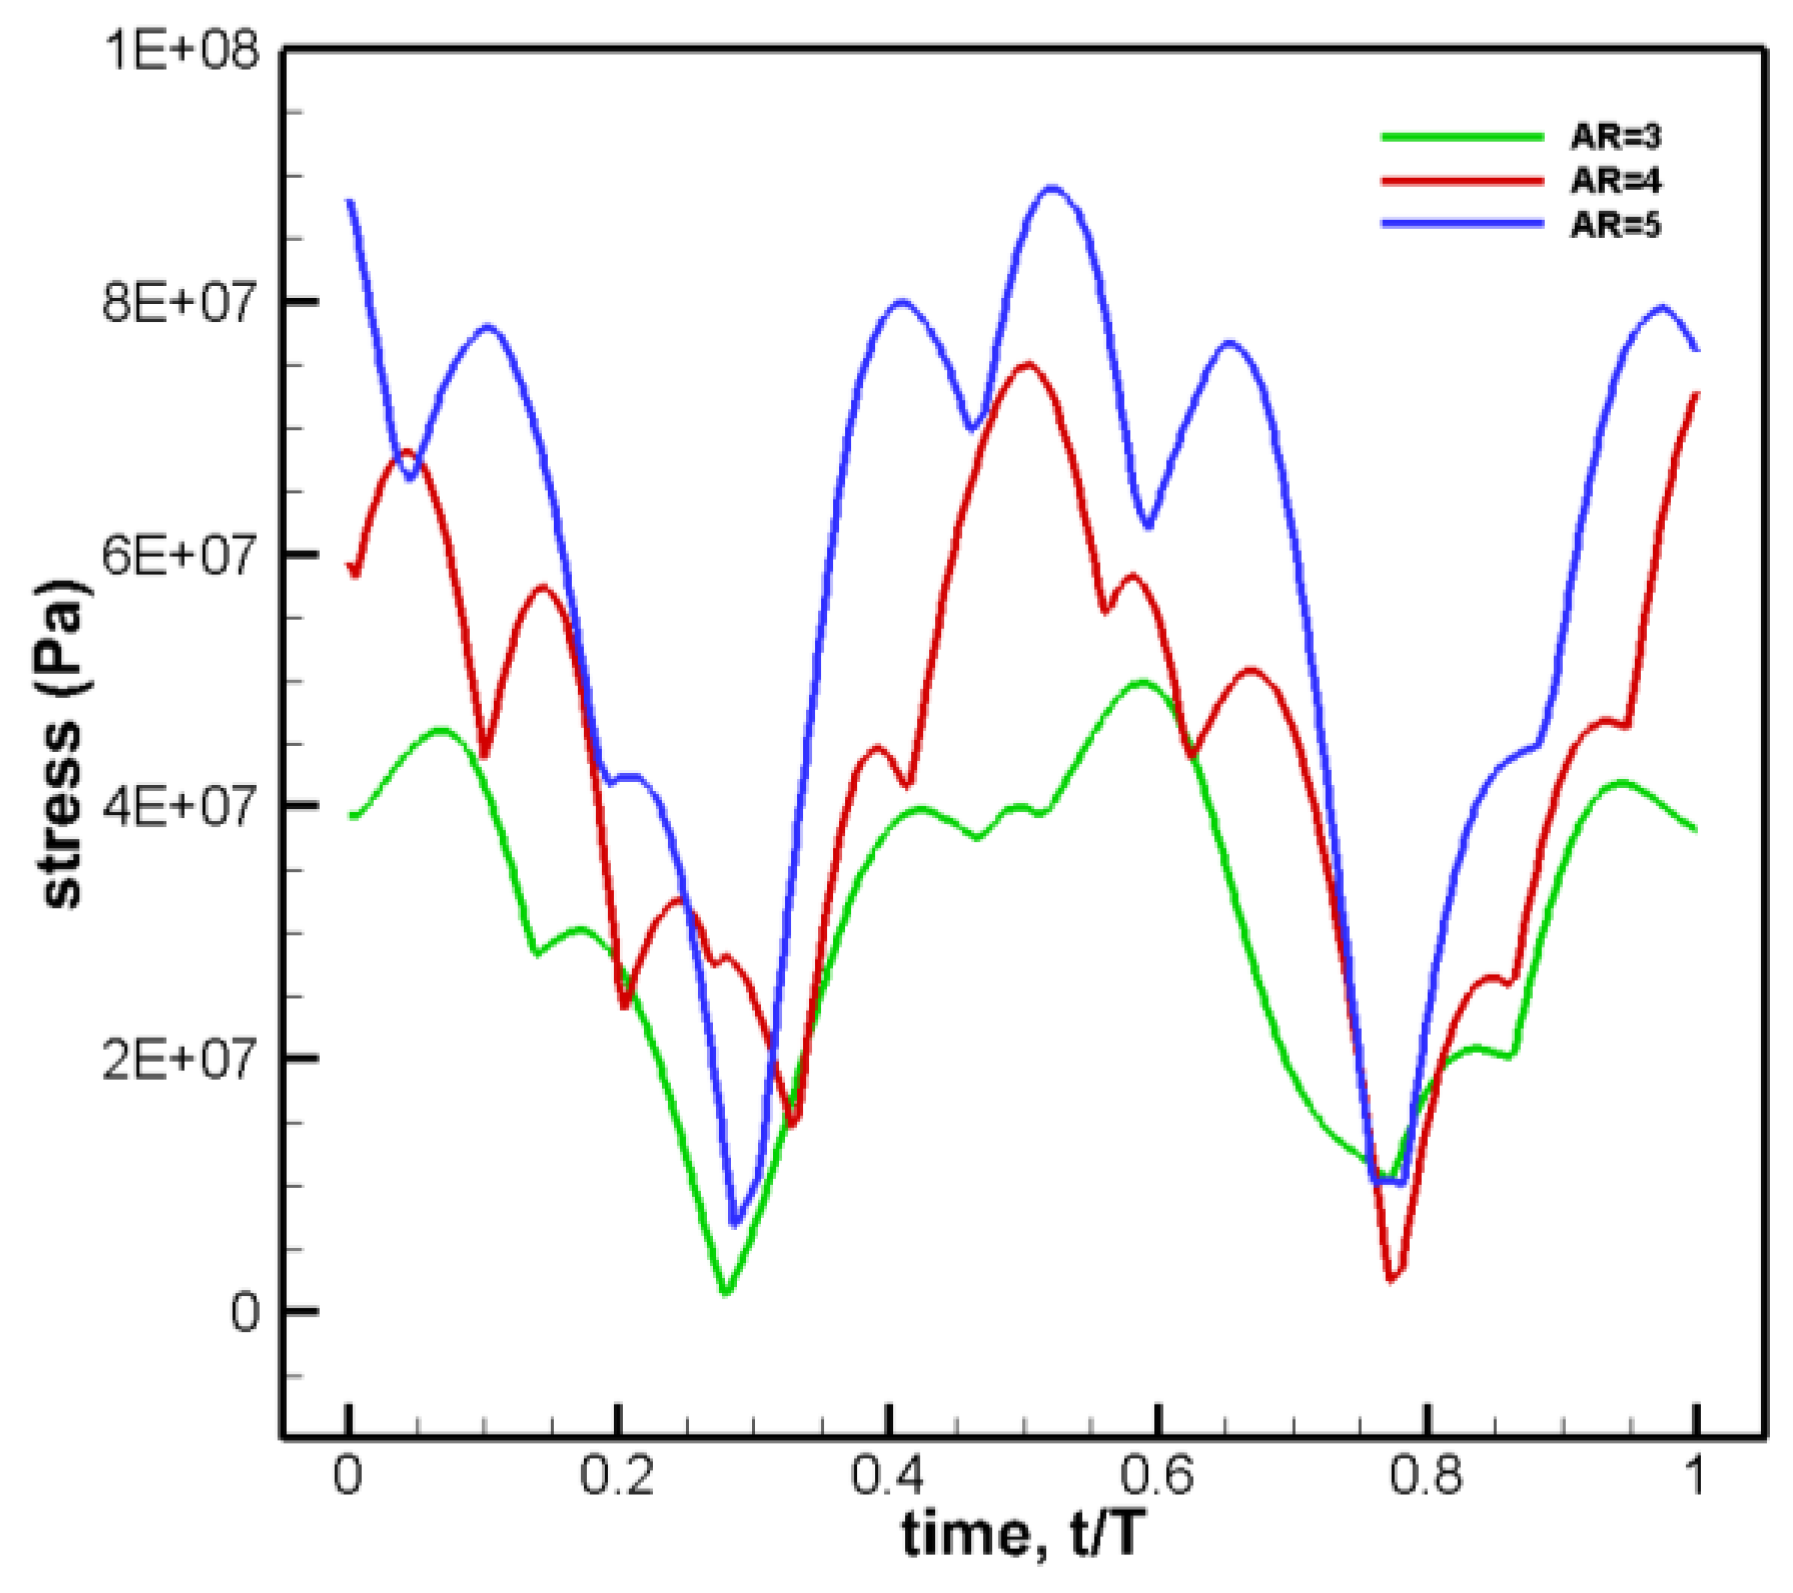
Analyze the variation of the maximum equivalent stress of the wing spar root section with the aspect ratio, as shown in
Figure 21.
Figure 21 shows that if only the stress of the root section of the spar is concerned, the stress of the root section of the spar will increase with the increase of the aspect ratio. When AR is 4, the root of the spar is the most prone to fracture. The number of extreme points of curves with different aspect ratios is the same in one period, but the peak value changes differently, which shows that the aspect ratio not only affects the maximum stress but also affects the parameters such as the time and location of the maximum value. If the stress at the joint between spar and rib is considered, the stress value will increase obviously when AR is 4, which shows that the part that is more prone to fracture is at the joint between spar and rib, which is not conducive to structural bearing capacity.
Therefore, combined with the analysis of the lift coefficient, the results show that for aspect ratio, the wing that is too soft or too rigid is not conducive to the increase of lift coefficient. The wing with AR=4 is more beneficial to improving the aerodynamic characteristics of the flexible flapping wing in a hovering state. But at the same time, the joint between spar and rib will also bear greater stress, which will increase the risk of fracture at the joint.
4. Design of Flapping Wing Structure
Based on the previous study, the influence of wing area and aspect ratio on flapping wing aerodynamics and structure are summarized. In this section, the detailed flapping wing structure layout is designed and analyzed.
4.1. Wing Parameters and Structure Layout Selection
In
Section 3, the flapping wing with a 2500mm
2 wing area and a 4 aspect ratio shows exhibited excellent aerodynamic performance and structural strength. Hence this wing parameter is selected for the flapping wing design. The structural form studied in this paper mainly refers to the geometric structure of the ribs. The geometric parameters of the spar and the wing membrane remain unchanged, and the number and distribution of the ribs change under the condition that the cross-sectional form, thickness, and material remain unchanged.
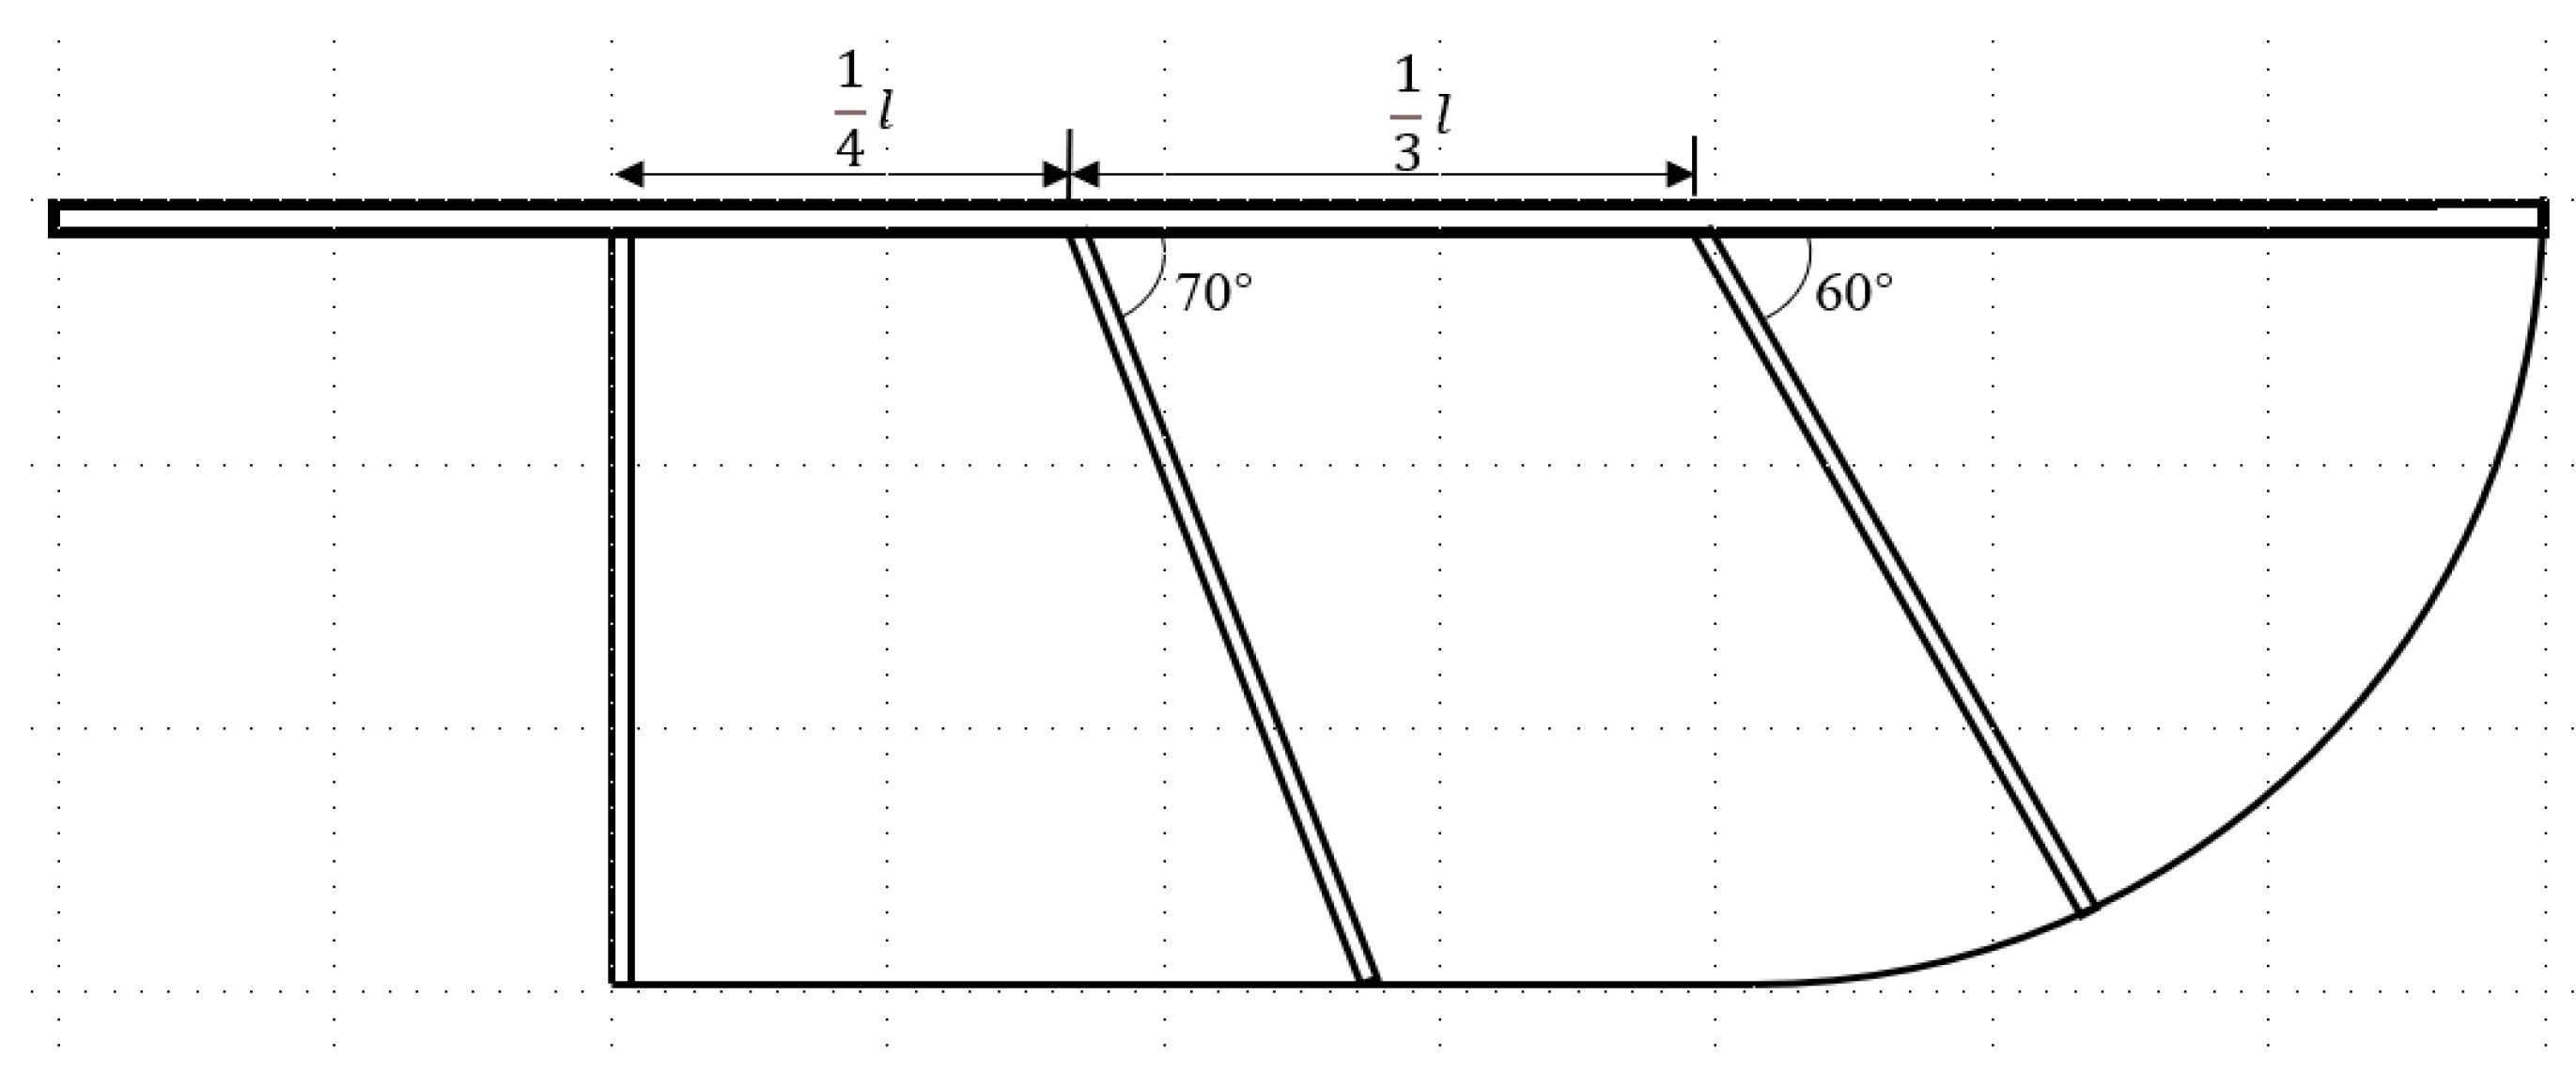
Take
Figure 1. as the basic structural form one, and reduce the spanwise ribs based on form one to obtain the structural form two, as shown in
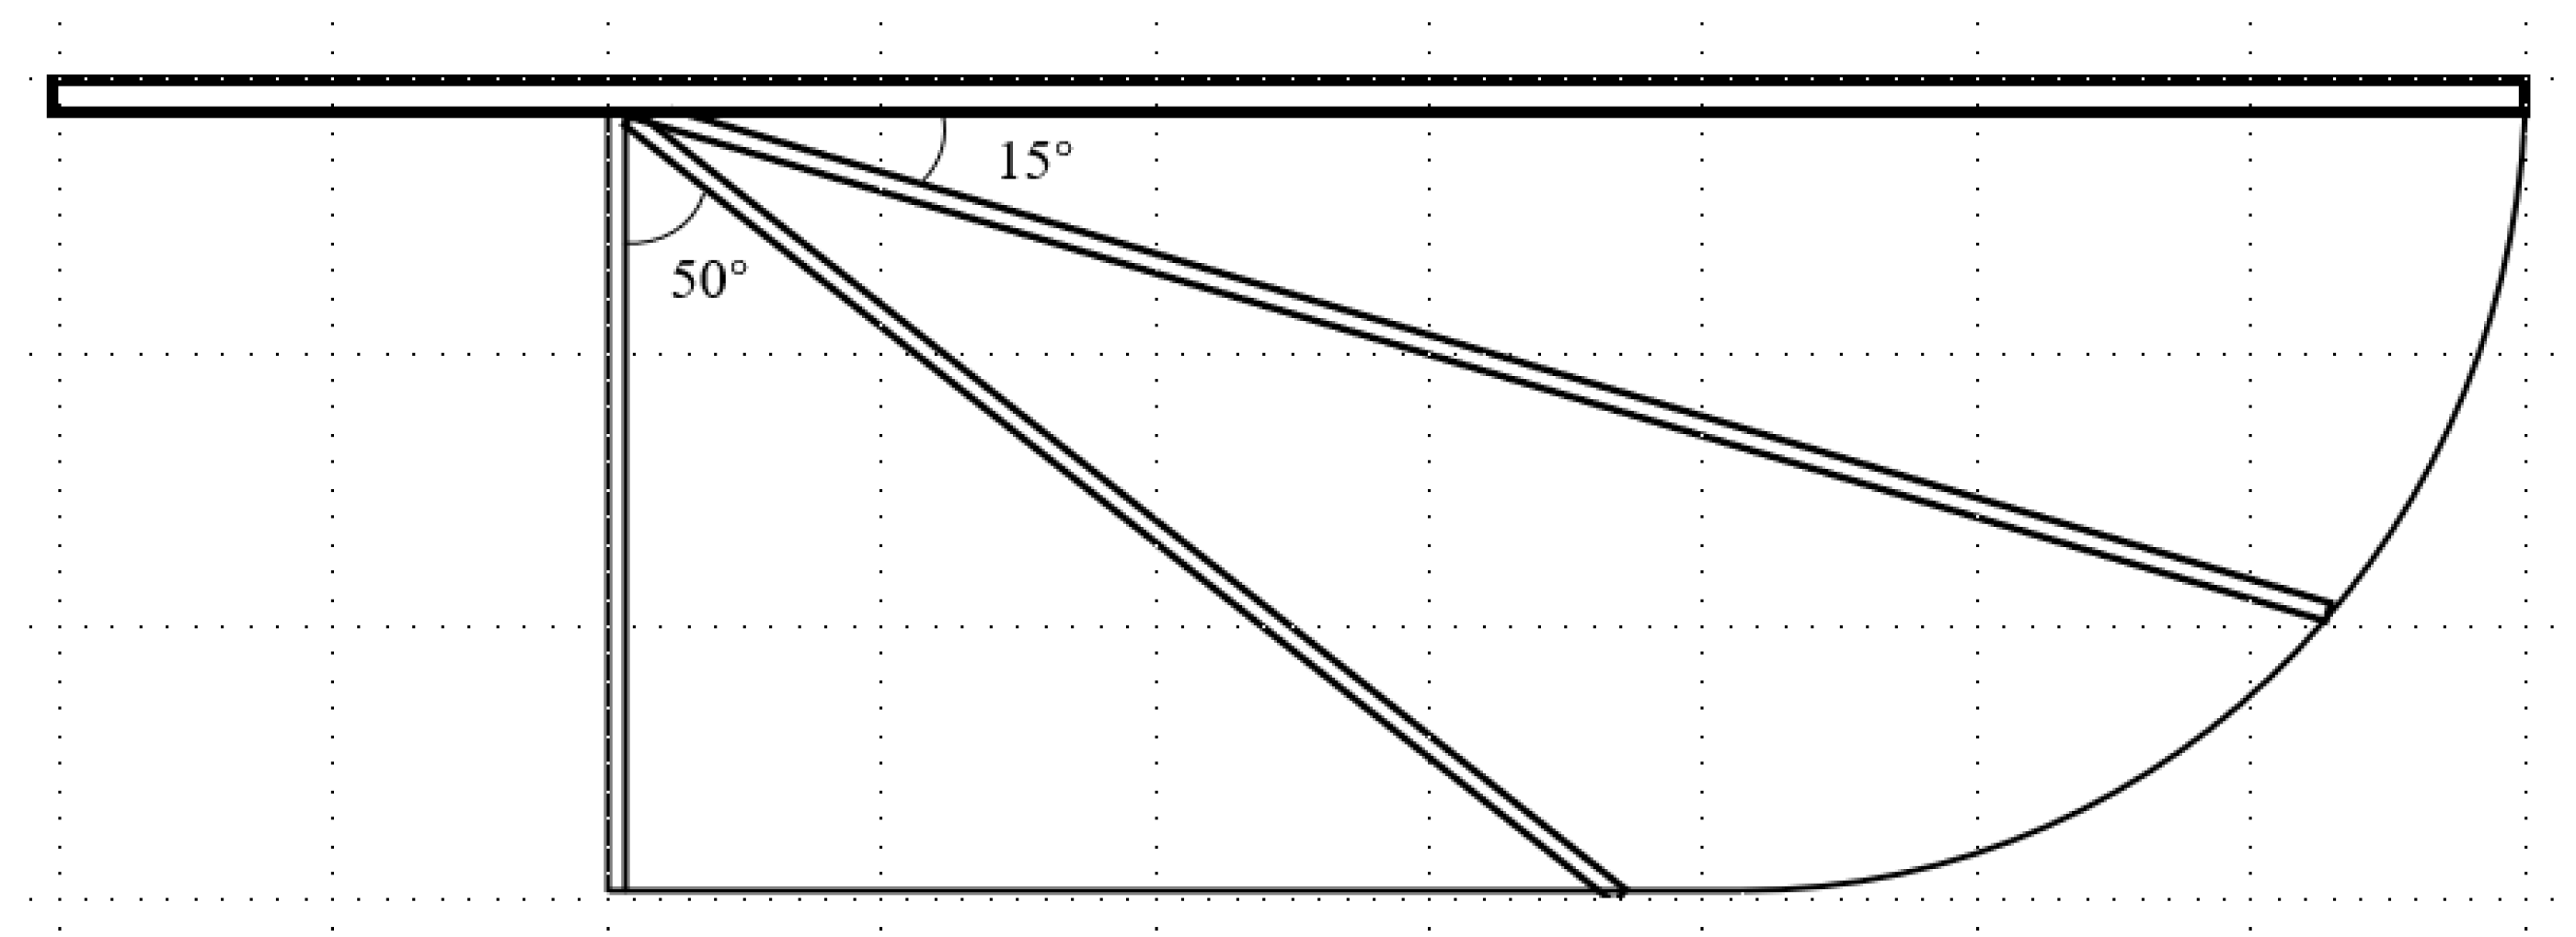
Figure 22. Further imitate the structure of the dragonfly to improve the flapping flexibility, concentrate the initial ends of the three ribs at one point, and change the angle of the ribs to the main spar to obtain the structural form three as shown in
Figure 23. Compared with Structure One, Structure Two reduces spanwise spars.
4.2. Influence of Aerodynamic in Different Layout
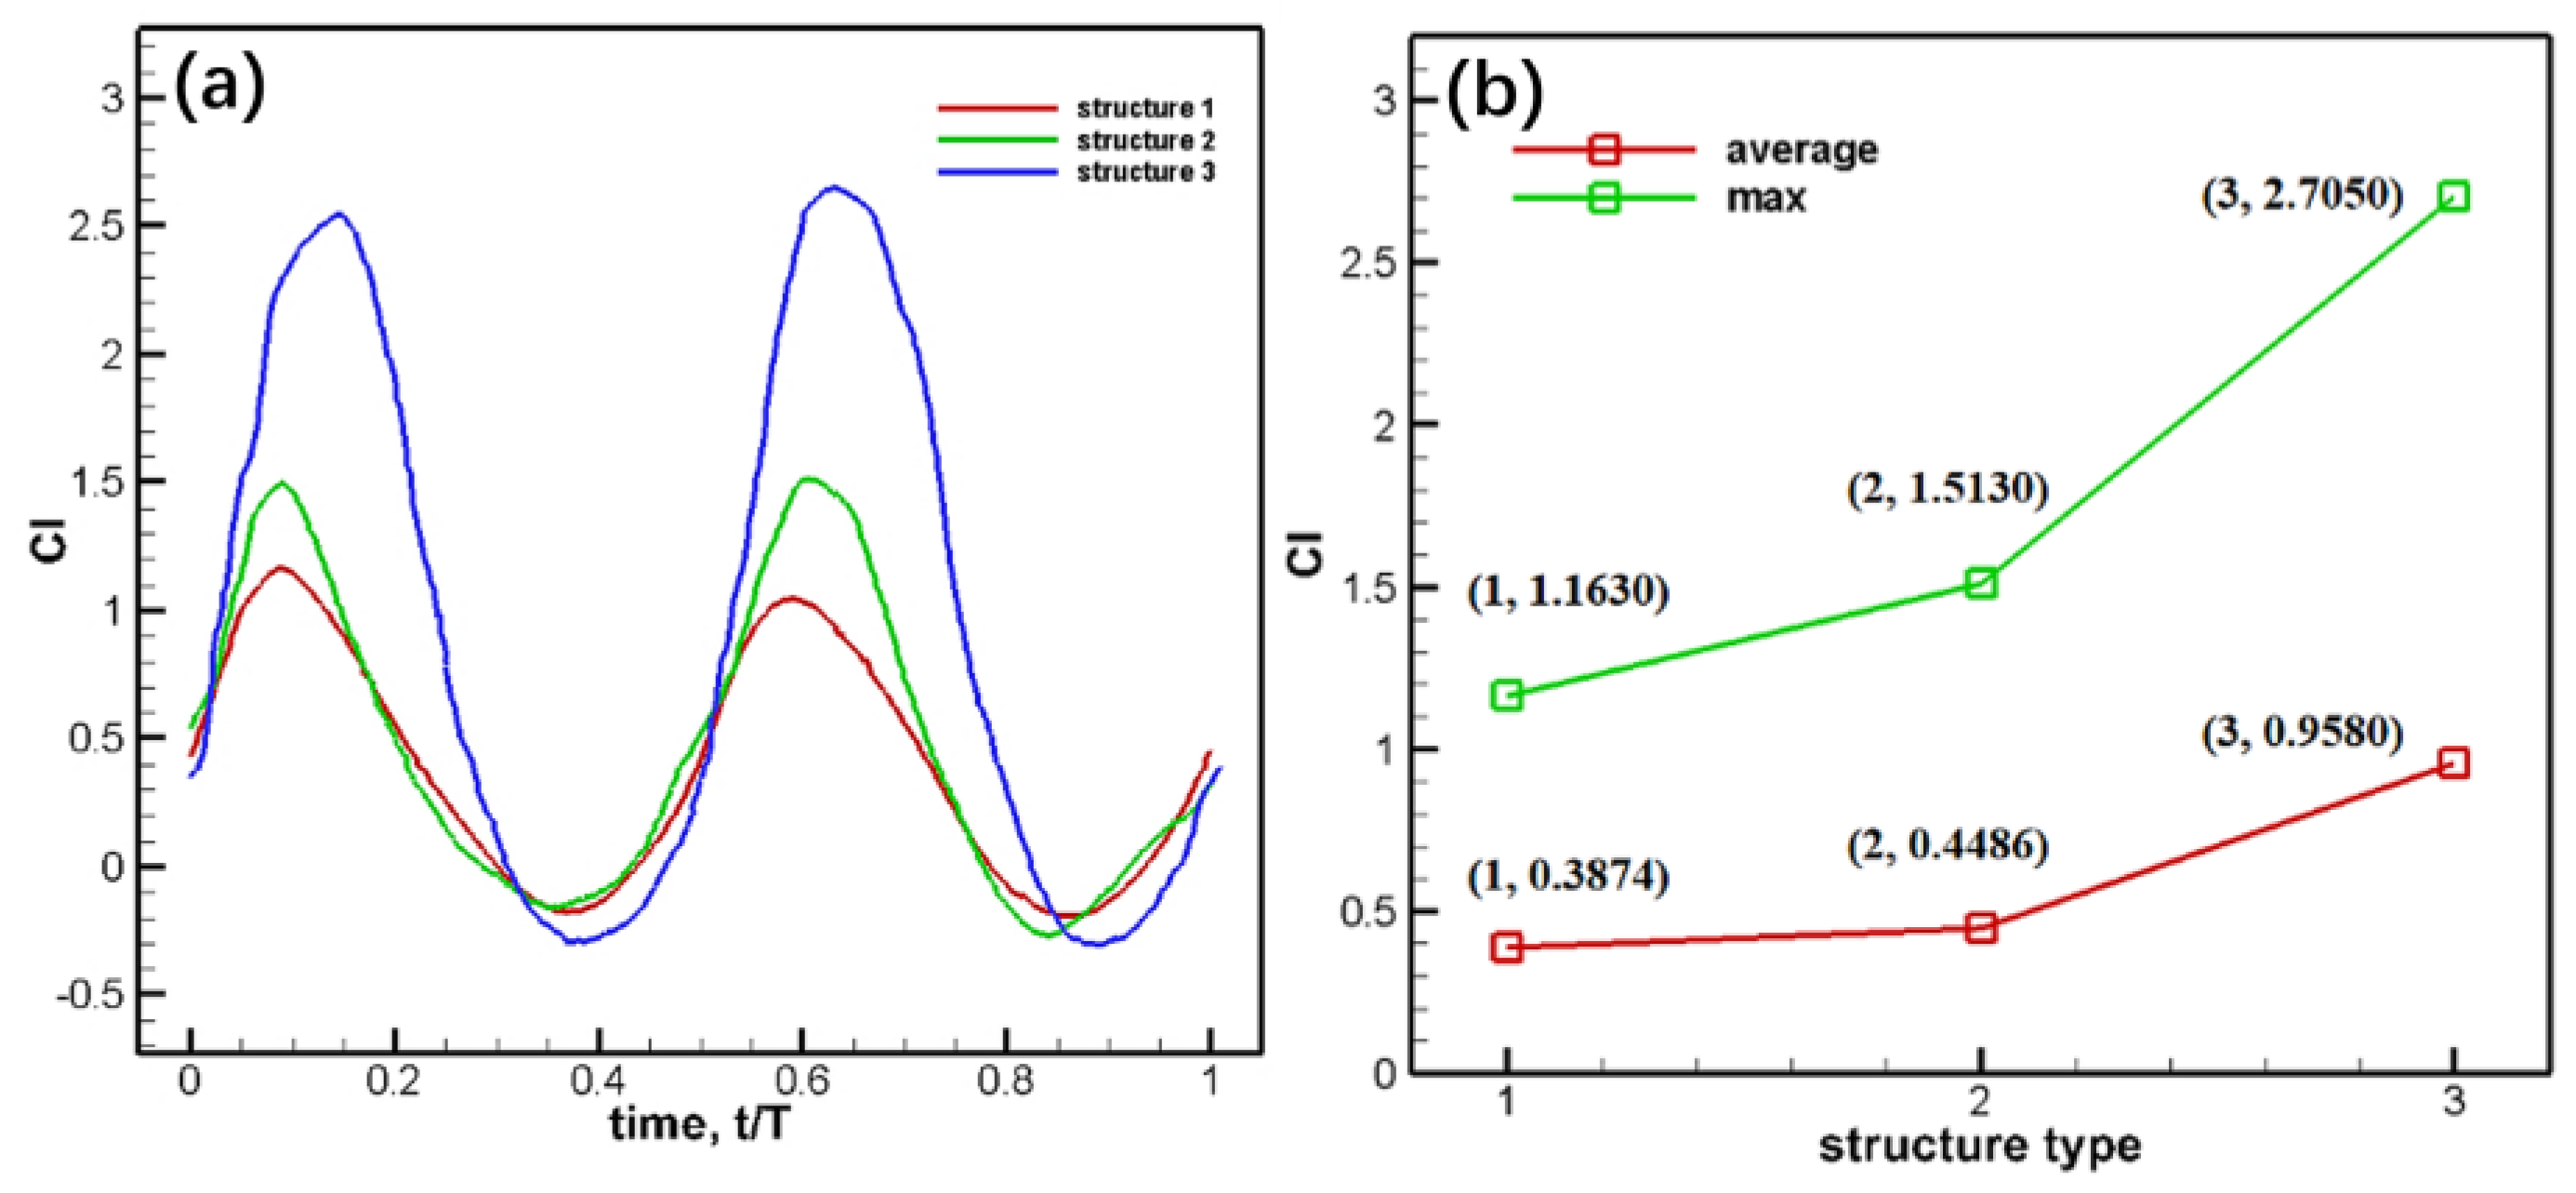
The lift coefficient, time-averaged lift coefficient, and maximum lift coefficient of different structures in one cycle are shown in
Figure 24.
Figure 24 shows that the structural form has a great influence on the lift coefficient. Comparing the results of lift coefficients, it can be found that there is little difference between the peak value and average value of Structure Two and that of Structure One. Compared with the two structures, Structure Three has a great change, which not only reduces the spanwise ribs but also changes the positions and angles of the two chordwise ribs. Furthermore, the flexibility of the structure is enhanced, which is more conducive to twist deformation. The time-average lift of Structure Three is 1.3 times and 0.78 times higher than that of Structure One and Structure Two, respectively. The structure can be further improved based on structural form three, and better aerodynamic performance can be obtained within the material bearing range.
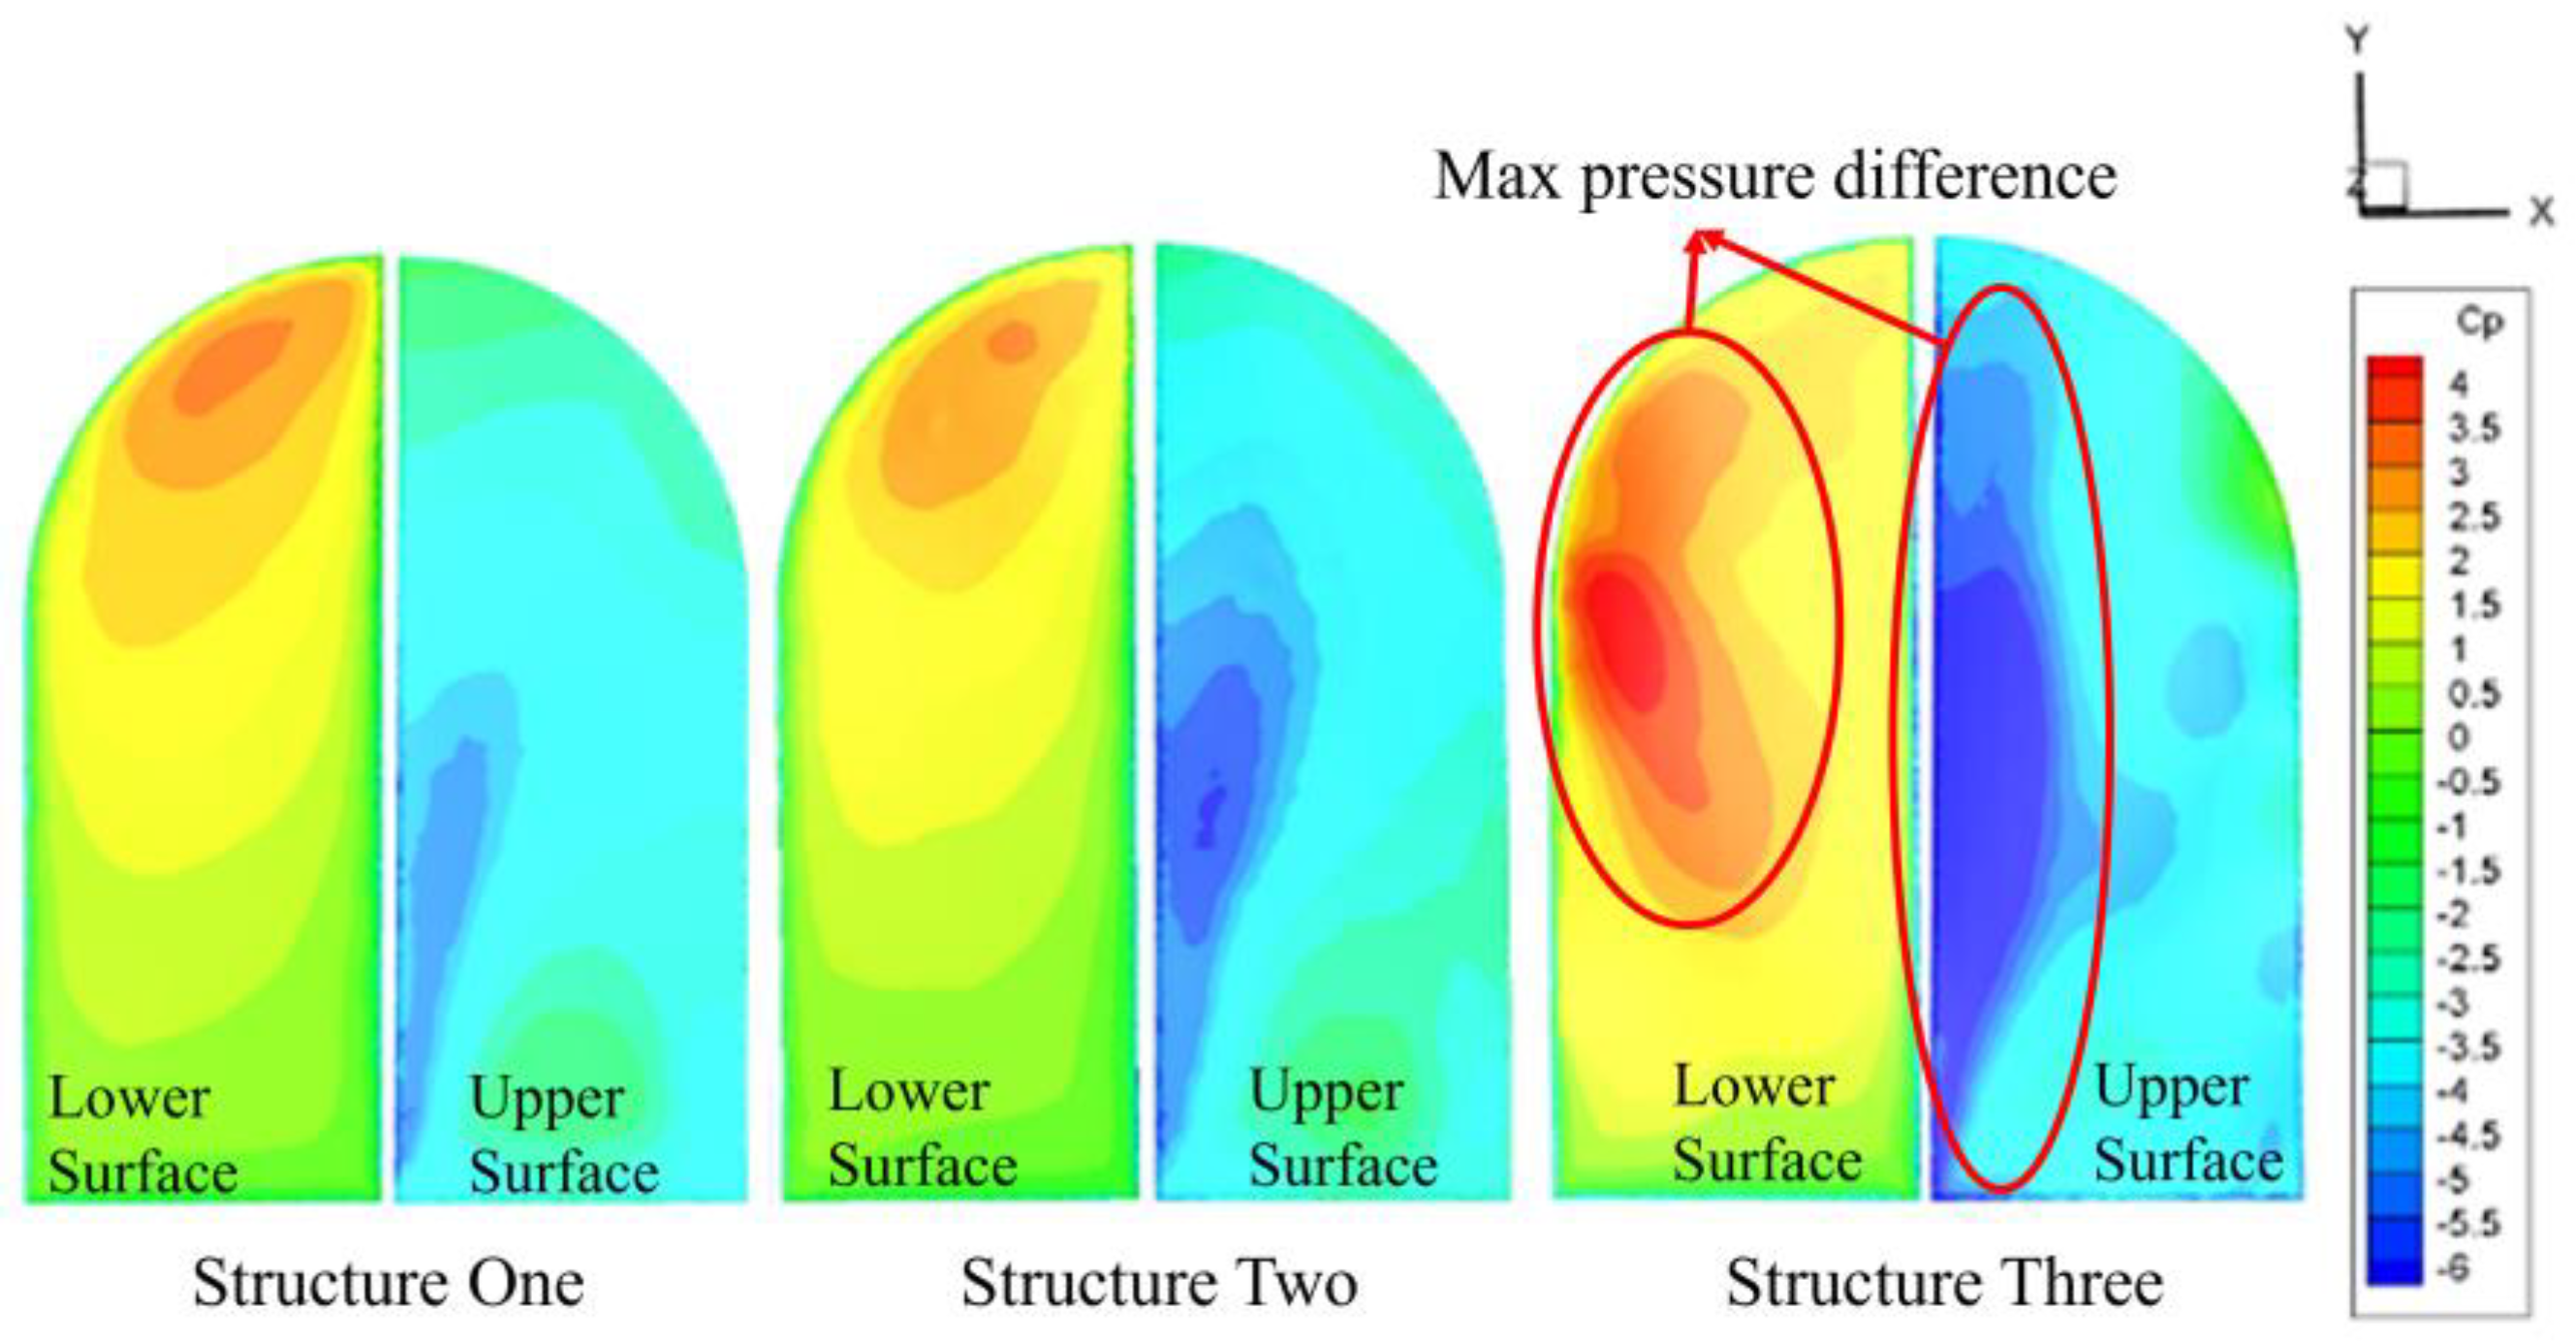
The structural form will affect the flexible distribution, resulting in different degrees of bending, twist, and other deformation at different times, and the pressure distribution on the wing will change, which is macroscopically manifested as the increase or decrease of aerodynamic force. The pressure coefficient contour under various structural forms at t/T=0.75 time is shown in
Figure 25.
By analyzing the above figure, it is found that the maximum and minimum pressure coefficients are generated in Structure Three. The pressure distributions in Structure One and Two are similar, with the maximum pressure near the wing tip and the minimum pressure in the middle of the leading edge. In addition, the maximum pressure in structural form one is greater than that in structural form two, and the minimum pressure in Structure Two is less than that in structural form one. However, the pressure distribution in Structure Three is different from that in Structure One and Structure Two. The maximum pressure is located in the middle of the trailing edge and the minimum pressure is located in the middle of the leading edge, and the pressure difference is larger, which is more conducive to the generation of lift.
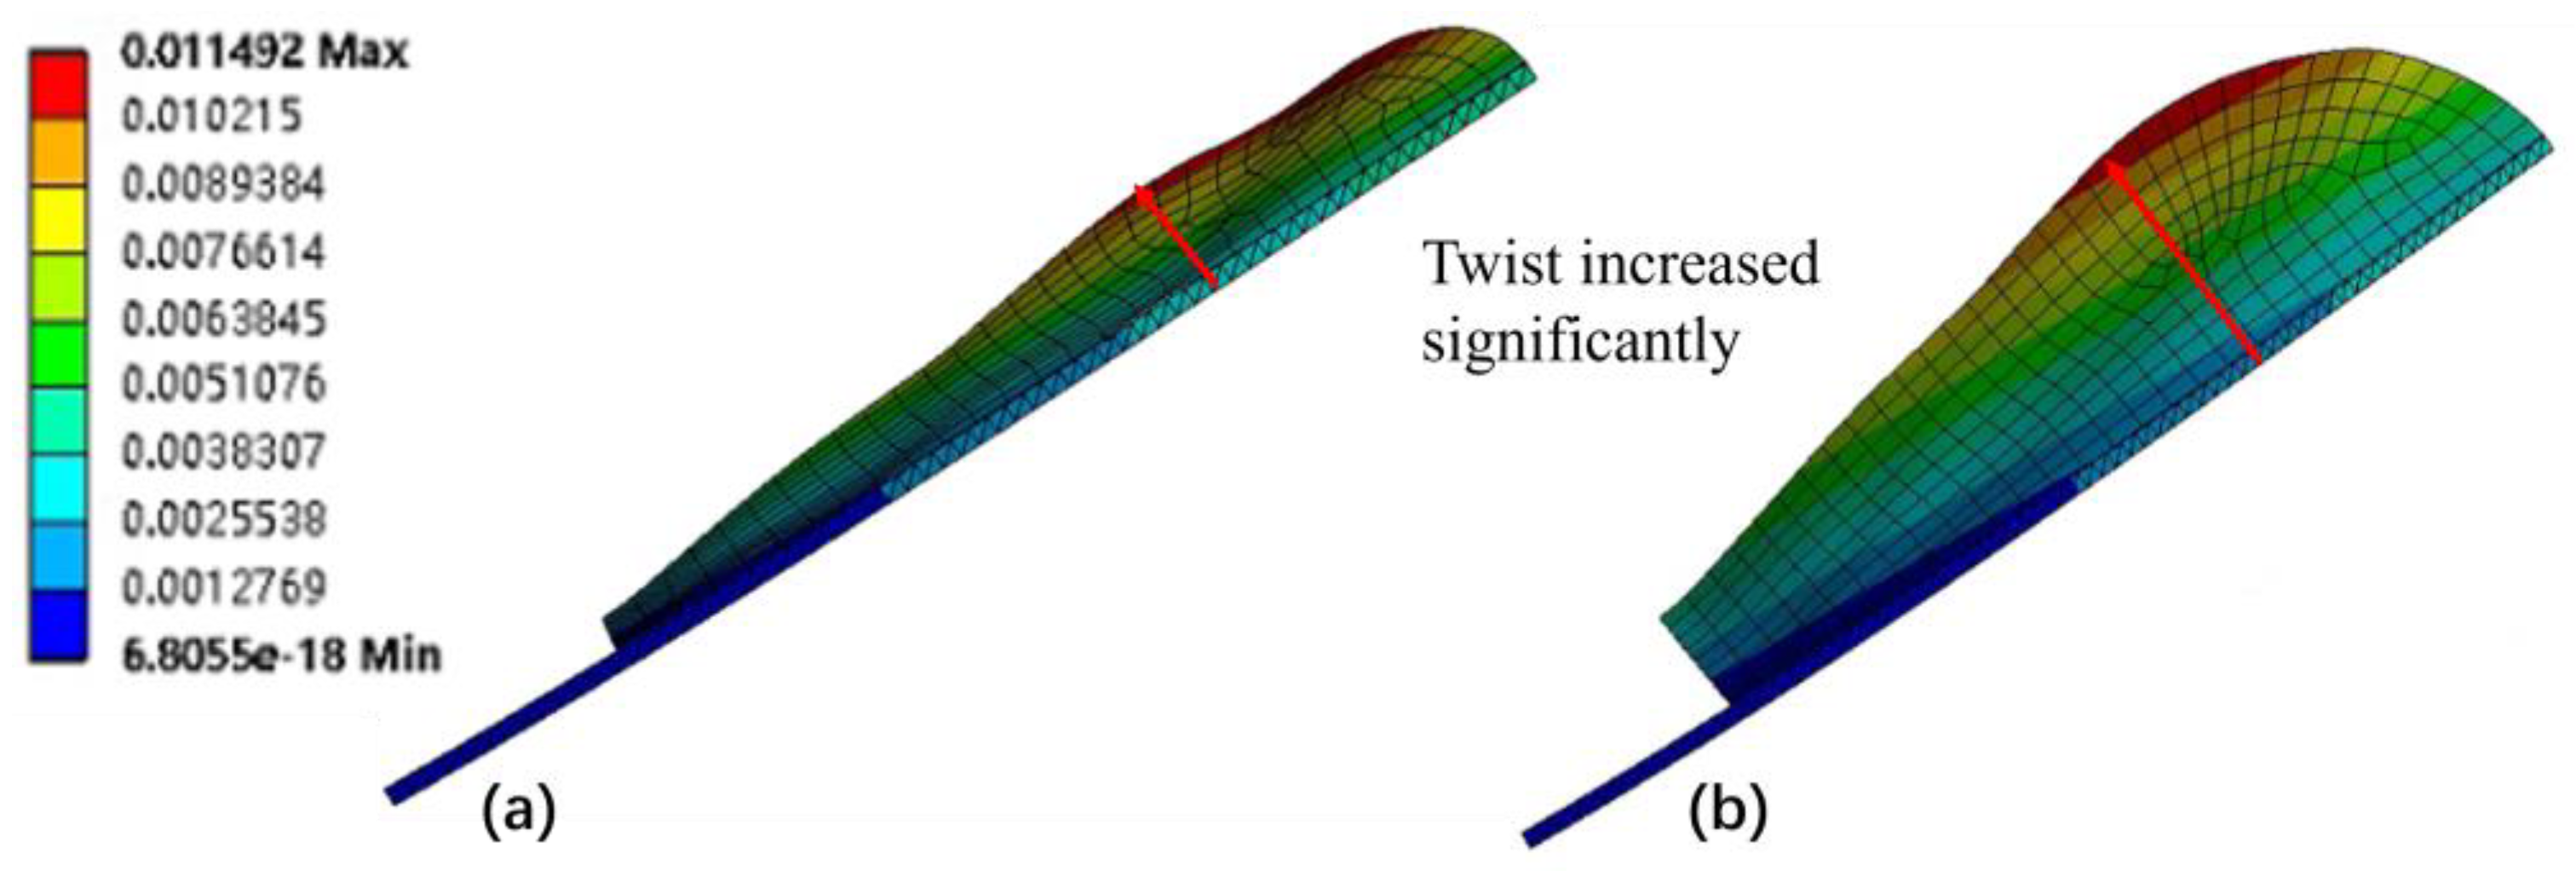
Due to the different forms of the rib structure and the flexible deformation of the flapping motion, the wing twist will vary accordingly. At time t/T=1.0, the wing surface twist and deformation under Structure Two and Three are shown in
Figure 26.
It is found that the twist deformation of Structure Two is not much different from that of Structure One after the spanwise ribs are removed compared with
Figure 17(b). However, the deformation and passive twist under Structure Three are increased, which shows that the flexible deformation and passive twist can be increased by using Structure Three. In addition, the position of maximum deformation under the three structural forms is similar, all near the trailing edge of the wing tip.
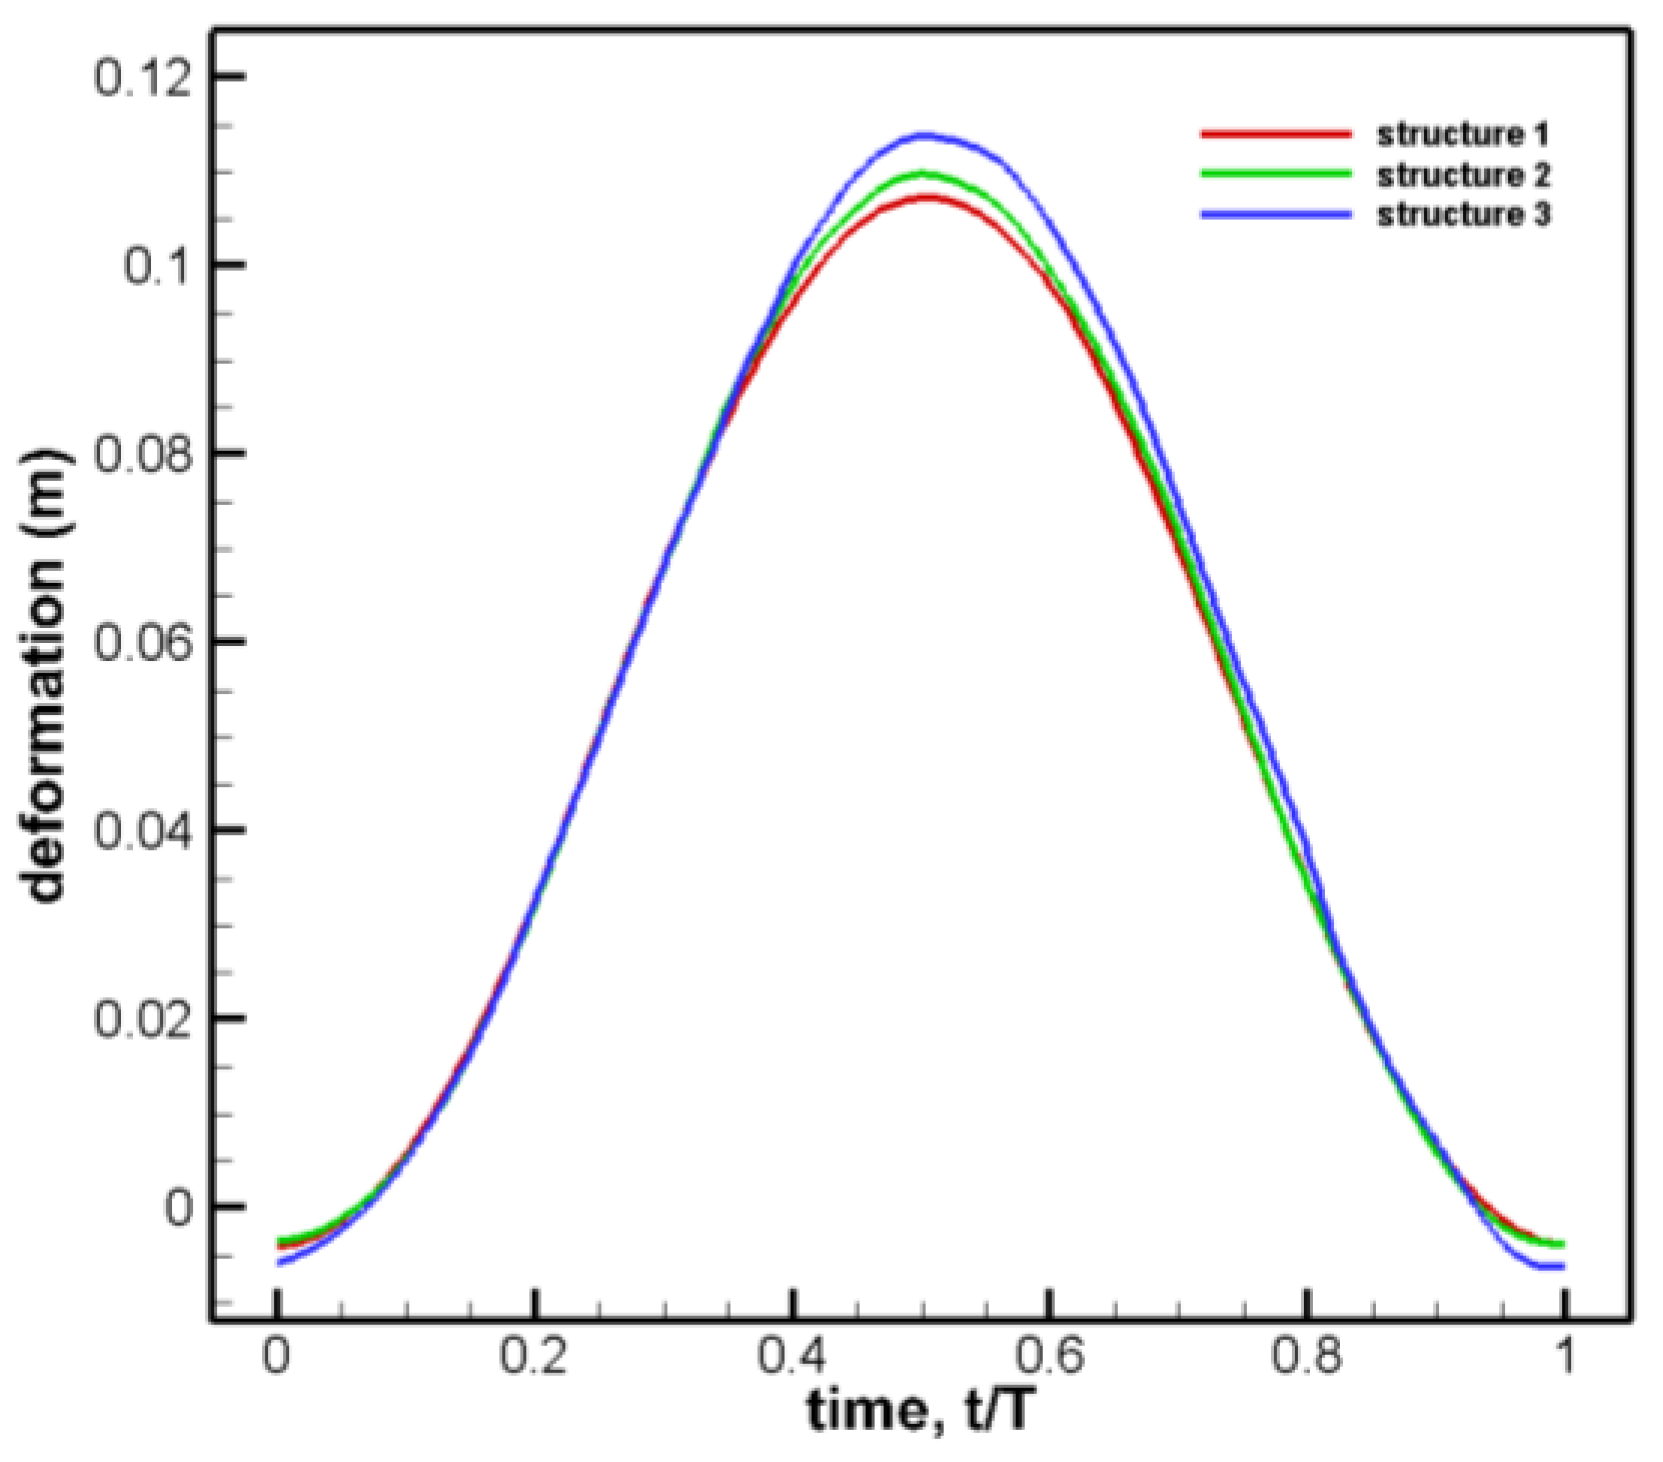
The maximum deformation changes in the quarter arc from the leading edge to the trailing edge of the wing tip. The maximum deformation of the circular arc side surface under three structural forms is shown in
Figure 29.
The result shows that the deformation of the flapping wing from large to small is Structure Three, Structure Two, and Structure One. The sine law and peak value of the curve are not affected by the structural form. In addition, from the numerical analysis of deformation, the influence of structural form is obviously less than that of flapping wing morphological parameters.
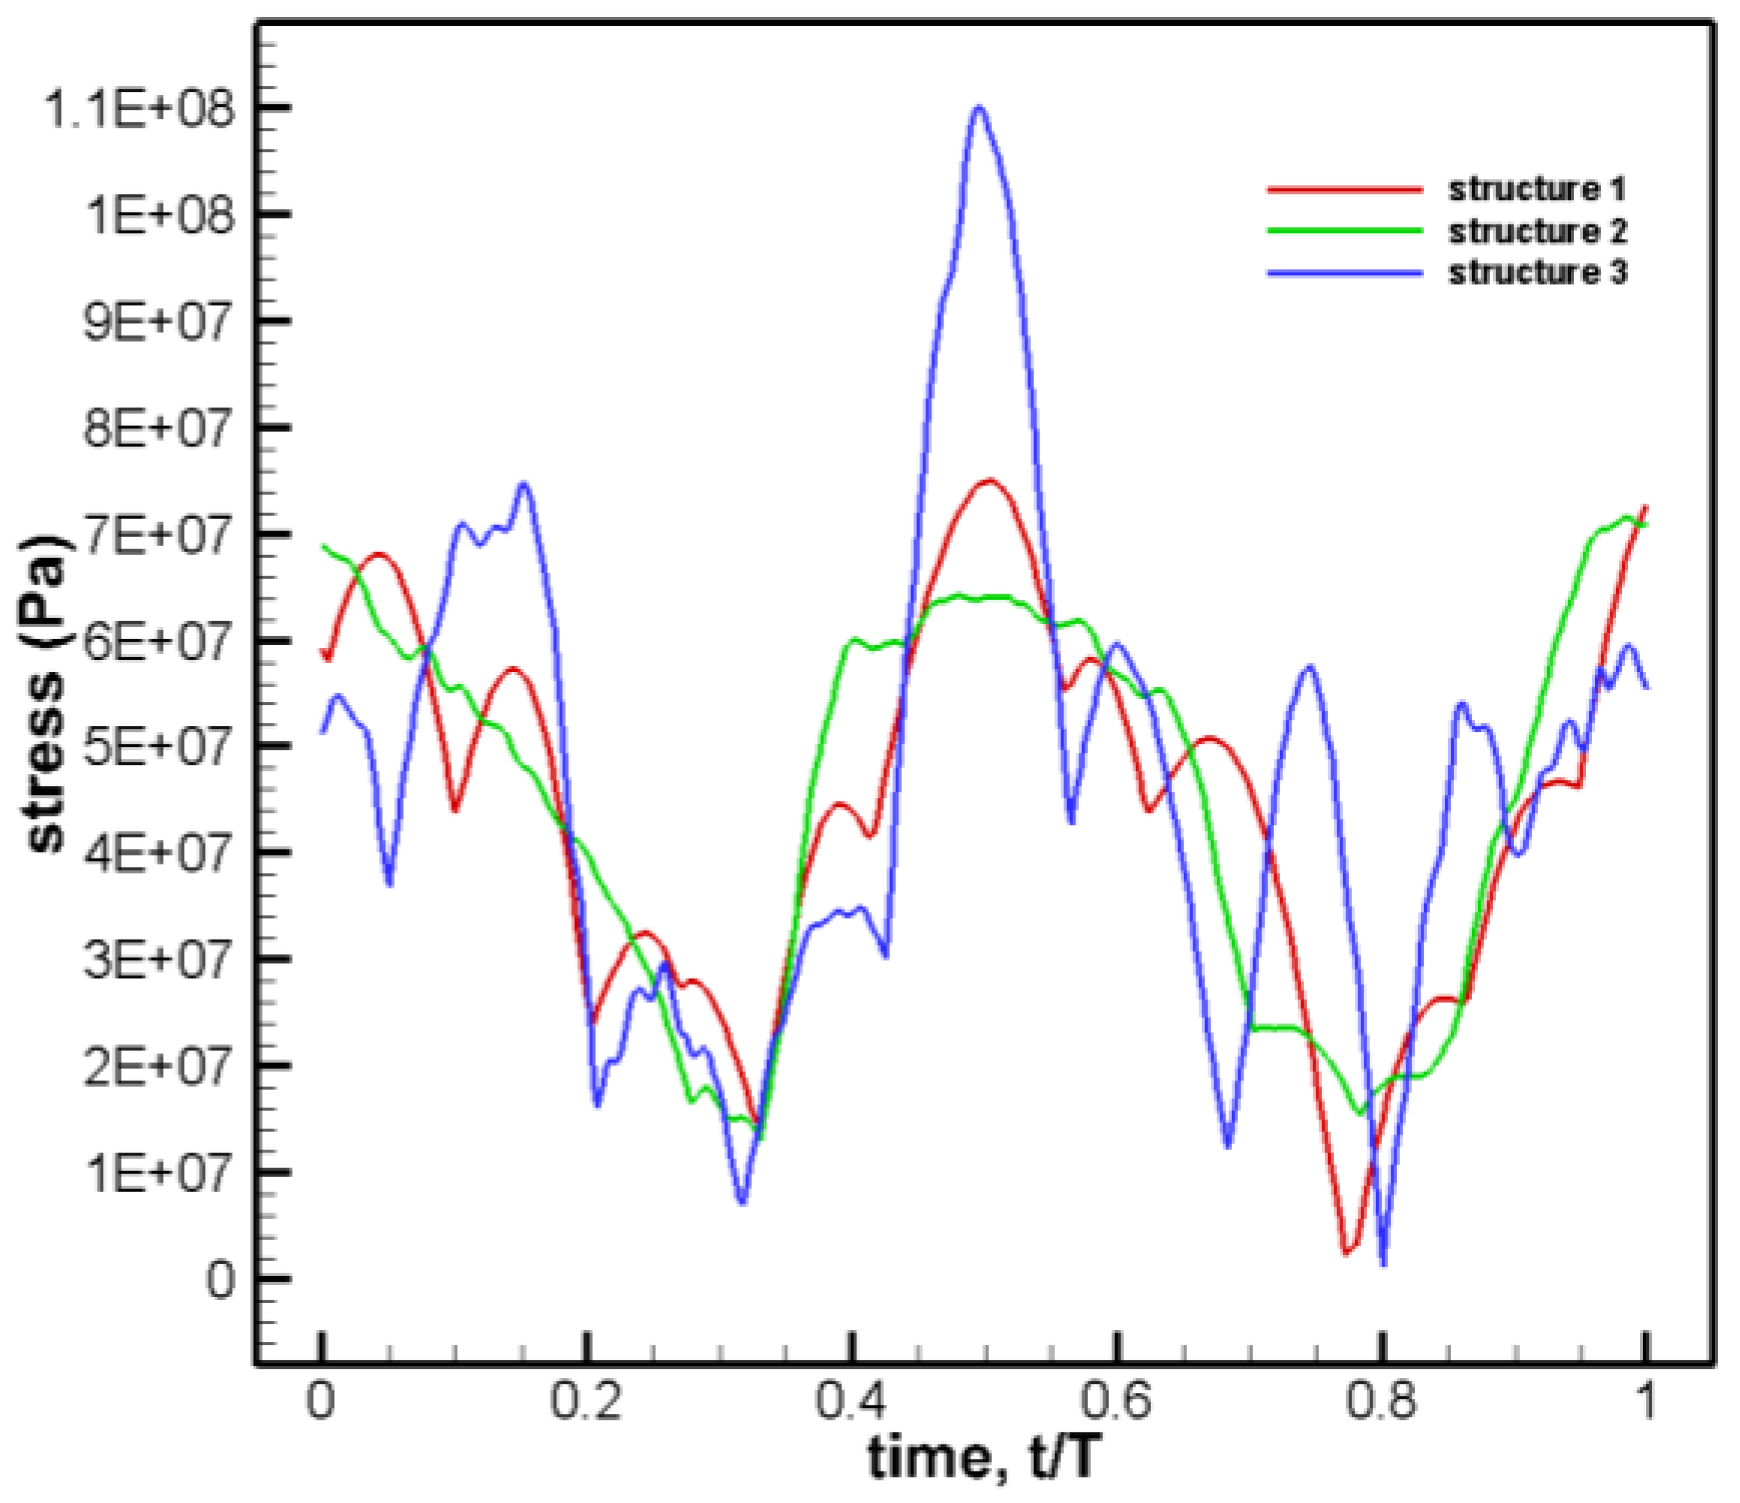
The maximum equivalent stress of the wing beam root section under three structural forms is analyzed, as shown in
Figure 31.
The result shows that the stress peak value in the cycle of Structure Three is the highest considering the root section of the spar. In addition, the variation law of the stress curve is different under different structural forms, and the stress fluctuation in Structure Three is the largest, while that in Structure Two is stable. In summary, the structural form has a significant influence on the maximum value and fluctuation of the stress curve at the root of the spar. The Structure Two is the suitable layout for the flapping wing.
5. Conclusion
This paper is focusing on the flapping wing design of bionic aircraft. The influence of wing parameters and structure layout on the aerodynamic and structure performance are studied. The conclusions are summarized as follows.
1)With the increase of wing area, the overall flexible deformation and local wing tip deformation increase, with the maximum of 26.3% larger. The overall stress and the root stress of the spar increased average of 139.53%. The most significant influence is on the time-average lift coefficient and the maximum lift coefficient, with over 300% increases. Increasing the wing area will promote the flexible deformation and passive twist of the wing, and then increase the lift coefficient, which is beneficial to improve the aerodynamic characteristics of the flexible flapping wing in the hovering state, but the structural stress will also increase accordingly, which needs to be considered.
2) With the increase of aspect ratio, the total deformation and tip deformation increase, 30% larger than the minimum aspect ratio. The greater the aspect ratio, the greater the stress at the root of the spar, with 124.39% higher. Because there are other stress concentration positions, it is easier to break when the aspect ratio is 4. When the aspect ratio is 4, the aerodynamic characteristics is the best, but the risk of fracture at the joint between the spar and rib becomes greater.
3) The design of the wing structure layout about ribs are verified. The structural form has a great influence on the passive twist, the influence on the deformation of the wing tip is less than the wing areas and aspect ratios. The stress concentration at the joint between wing ribs is greater, the maximum stress value at the root of spar and the fluctuation of stress curve are greater, and the lift coefficient is greater. There is little difference in aerodynamic and structure performance between Structure One and Two. In Structure Three, the flexible deformation and twist are greater (132.18%). and the lift characteristics are obviously improved, with 127.27%. However, there is a greater stress concentration and fracture risk. When considering the aerodynamic structural performance comprehensively, Structure Two is more suitable.
In summary, this study provides the theoretical basis for the optimal design of a flapping wing. To obtain better lift performance, the wing area can be increased within the structural stress tolerance range, and the optimal design of the flapping wing shape can be selected between the aspect ratio of 3 and 4. In the stress-bearing range, to obtain greater flexibility and better aerodynamic performance, the rib arrangement similar to Structure Three is recommended. To improve the lift and reduce the risk of fracture, Structure Two is recommended.
Author Contributions
Validation, Wei Wang; Writing – original draft, Yang Luo; Writing – review & editing, Wei Wang, XinYu Lang and ZhangRui Du; Supervision, XiaoJun Yang.
Data Availability Statement
The original contributions presented in the study are included in the article/supplementary material, further inquiries can be directed to the corresponding author/s.
Acknowledgments
This work is financially supported by the Shenzhen Science and Technology Program and Research under Grant No. JCYJ20220530161808018, and Guangdong Basic and Applied Basic Research Foundation under Grant No. 2023A1515010776. Key R&D Program in Shaanxi Province of China under Grant No. 2023-YBGY-372. Sponsored by Innovation Foundation for Doctor Dissertation of Northwestern Polytechnical University (CX2024037).
References
- Wenqing Y.; Bifeng S; Wenping S. Research progress and challenges of aerodynamic problems in bionic micro flapping-wing aircraft. Experimental fluid mechanics, 2015, (3): 1-10. [CrossRef]
- Weis F. Quick estimates of flight fitness in hovering animals, including novel mechanism for lift production. Journal of Experimental Biology, 1973, 59: 169-230. [CrossRef]
- Sane S. P. The aerodynamics of insect flight. Journal of Experimental Biology, 2003, 206(23): 4191-4208. [CrossRef]
- Dickinson M.H.; Lehmann F.O.; Sane S.P. Wing rotation and the aerodynamic basis of insect flight. Science, 1999, 284(5422): 1954-1960. [CrossRef]
- Lehmann F.O.; Sane S.P.; Dickinson M.H. The aerodynamiceffects of wing-wing interaction in flapping insect wings. Journal of Experimental Biology, 2005,208: 3075-3092. [CrossRef]
- Pornsin-sirirak T.N.; Lee S.W.; Nassef H.; Grasmeyer J.; Tai Y.C.; Ho C.M.; Keennon M. MEMS wing technology for a battery-powered ornithopter. Proc.IEEE 13th Annual Int. Conf. Micro Electro Mechanical System, Miyazaki, Japan, Jan.23-27, 2000, pp.799-804. [CrossRef]
- De Croon G.C.H.E.; Groen M.A,; De Wagter C,; et al. Design,aerodynamics and autonomy of the DelFly. Bioinspiration & biomimetics, 2012, 7(2): 025003-1-025003-16. [CrossRef]
- Keennon M.; Klingebiel K.; Won H. Development of the Nano Hummingbird: A Tailless Flapping Wing Micro Air Vehicle. Aiaa Aerospace Sciences Meeting Including the New Horizons Forum and Aerospace Exposition, Nashville, Tennessee, AIAA, 2012-0588. [CrossRef]
- Send W.; Fischer M.; Jebens K.; et al. Artificial hinged-wing bird with active torsion and partially linear kinematics. 28th International Congress of the Aeronautical Sciences. 2012-053.
- Jianlin X.; Bifeng S.; Wenping S.; Wenqing Y.; Dong X.; Shaoran L. Research progress of homing pigeon flapping-wing aircraft in China and the future development of bird flight mechanism and application system. Transactions of Nanjing University of Aeronautics and Astronautics, 2020, 37(05):663-675.
- Lehmann F.O.; Wehmann H.N. Aerodynamic interference depends on stroke plane spacing and wing aspect ratio in damselfly model wings. International Journal of Odonatology, 2020, 23(1): 51-61. [CrossRef]
- Stewart E.; Patil M.; Canfield R.; et al. Parametric Representation and Shape Optimization of a Wing for Flapping Micro Air Vehicles. International Journal of Micro Air Vehicles, 2012, 4(4): 179–202. [CrossRef]
- Stanford B.; Beran P.; Kobayashi M. Aeroelastic Optimization of Flapping Wing Venation: A Cellular Division Approach. AIAA Journal, 2015, 50(4): 938-951. [CrossRef]
- Stanford B.; Kurdi M.; Beran P.; et al. Shape, Structure, and Kinematic Parameterization of a Power-Optimal Hovering Wing. Journal of Aircraft, 2015, 49(6): 1687-1699. [CrossRef]
- Muniappan A.; Baskar V.; Duriyanandhan V. Lift and Thrust Characteristics of Flapping Wing Micro Air Vehicle (MAV). 43rd AIAA Aerospace Sciences Meeting and Exhibit. 2005. [CrossRef]
- Zongjing Y.; Jiakun H.; Gang C. Investigation on the influence of aspect ratio on the thrust performance of bionic motion wing under low Reynolds number. Acta Aerodynamica Sinica, 2018, 36(1): 156-162. [CrossRef]
- Wu P.; Ifju P.; Stanford B.; et al. A multidisciplinary experimental study of flapping wing aeroelasticity in thrust production. 50th AIAA/ ASME/ ASCE/ AHS/ ASC Structures, Structural Dynamics, and Materials Conference, California: Palm Springs 4-7 May 2009, 2009-2413. [CrossRef]
- Wang L.; Song B.; Yang W.; et al. Experimental characterization of a flexible membrane flapping-wing in forward flight. ICAS2014, St. Petersburg. Russia, Sep 7-12, 2014.
- Yoon S.H.; Cho H.; Lee J.; et al. Effects of camber angle on aerodynamic performance of flapping-wing micro air vehicle. Journal of Fluids and Structures, 2020, 97: 103101. [CrossRef]
- Heathcote S.; Wang Z.; Gursul I. Effect of spanwise flexibility on flapping wing propulsion. Journal of Fluids and Structures, 2008, 24(2): 183-199. [CrossRef]
- Raymond E .G.; Satish K.C.; Carlos E.S.C.; et al. High-fidelity aeroelastic computations of a flapping wing with spanwise flexibility. Journal of Fluids and Structures, 2013, 40:86-104. [CrossRef]
Figure 1.
Flapping wing configuration.
Figure 1.
Flapping wing configuration.
Figure 2.
Illustration of computational domain and wing. (a) Computational domain size and mesh. (b) wing surface mesh and motion direction.
Figure 2.
Illustration of computational domain and wing. (a) Computational domain size and mesh. (b) wing surface mesh and motion direction.
Figure 3.
Mesh for structure analysis.
Figure 3.
Mesh for structure analysis.
Figure 4.
Mesh for case verification model.
Figure 4.
Mesh for case verification model.
Figure 5.
Mesh independence verification results. (a) Comparison of deformation. (b) Comparison of stress.
Figure 5.
Mesh independence verification results. (a) Comparison of deformation. (b) Comparison of stress.
Figure 6.
Comparison of thrust coefficient in this study and previous study.
Figure 6.
Comparison of thrust coefficient in this study and previous study.
Figure 7.
(a) The displacement between wing root and wing tip; (b) Comparison of displacement between wing tip and wing root.
Figure 7.
(a) The displacement between wing root and wing tip; (b) Comparison of displacement between wing tip and wing root.
Figure 8.
(a) Flapping wing models with different wing area; (b) Flapping wing models with different aspect ratios.
Figure 8.
(a) Flapping wing models with different wing area; (b) Flapping wing models with different aspect ratios.
Figure 9.
(a) Lift coefficient curves of different wing areas; (b) Time-average and maximum lift coefficient under each wing area.
Figure 9.
(a) Lift coefficient curves of different wing areas; (b) Time-average and maximum lift coefficient under each wing area.
Figure 10.
Pressure coefficient contour of different wing areas at t/T=0.75 time.
Figure 10.
Pressure coefficient contour of different wing areas at t/T=0.75 time.
Figure 11.
Deformation contour of wing at different areas.(a) t/T=0.5; (b) t/T=0.75; (c) t/T=1.0.
Figure 11.
Deformation contour of wing at different areas.(a) t/T=0.5; (b) t/T=0.75; (c) t/T=1.0.
Figure 12.
The curve of the maximum deformation of wing tip arc with the wing area.
Figure 12.
The curve of the maximum deformation of wing tip arc with the wing area.
Figure 13.
Stress distribution.
Figure 13.
Stress distribution.
Figure 14.
Maximum stress variation curve of wing spar section.
Figure 14.
Maximum stress variation curve of wing spar section.
Figure 15.
(a) Lift coefficient curves of different aspect ratios; (b)Time-average and maximum lift coefficient under each aspect ratio.
Figure 15.
(a) Lift coefficient curves of different aspect ratios; (b)Time-average and maximum lift coefficient under each aspect ratio.
Figure 16.
Pressure coefficient contour of different aspect ratio at t/T=0.75 time.
Figure 16.
Pressure coefficient contour of different aspect ratio at t/T=0.75 time.
Figure 17.
Twist deformation of flapping wing with different aspect ratios. (a) AR=3; (b) AR=4; (c) AR=5.
Figure 17.
Twist deformation of flapping wing with different aspect ratios. (a) AR=3; (b) AR=4; (c) AR=5.
Figure 18.
Deformation contour at different aspect ratios. (a) t/T=0.5; (b) t/T=0.75;(c) t/T=1.0.
Figure 18.
Deformation contour at different aspect ratios. (a) t/T=0.5; (b) t/T=0.75;(c) t/T=1.0.
Figure 19.
The curve of the maximum deformation of wing tip arc with aspect ratio.
Figure 19.
The curve of the maximum deformation of wing tip arc with aspect ratio.
Figure 20.
Stress distribution of spar(a)AR=3;(b)AR=5.
Figure 20.
Stress distribution of spar(a)AR=3;(b)AR=5.
Figure 21.
The curve of maximum stress of spar root section.
Figure 21.
The curve of maximum stress of spar root section.
Figure 22.
Structure Two.
Figure 22.
Structure Two.
Figure 23.
Structure Three.
Figure 23.
Structure Three.
Figure 24.
(a) Lift coefficient of different structural forms; (b) Time-averaged and maximum lift coefficients of various structural forms.
Figure 24.
(a) Lift coefficient of different structural forms; (b) Time-averaged and maximum lift coefficients of various structural forms.
Figure 25.
Pressure coefficient contour of different structural form at t/T=0.75 time.
Figure 25.
Pressure coefficient contour of different structural form at t/T=0.75 time.
Figure 26.
Twist deformation of Structure Two and Three.
Figure 26.
Twist deformation of Structure Two and Three.
Figure 29.
Variation curve of maximum deformation of the wing tip.
Figure 29.
Variation curve of maximum deformation of the wing tip.
Figure 31.
Variation curve of maximum stress of spar root section.
Figure 31.
Variation curve of maximum stress of spar root section.
Table 1.
Computational Domain Setup.
Table 1.
Computational Domain Setup.
| Total Mesh Elements |
Element Type |
Number of Boundary Layer |
First Layer Thickness |
| 530,000 |
Tetrahedral |
20 |
0.8mm |
Table 2.
Flapping Wing Material Properties.
Table 2.
Flapping Wing Material Properties.
| |
Wing Membrane |
Rib |
Wing Spar |
| Type |
Polyester Film |
Carbon Fiber 1 (Isotropic) |
Carbon Fiber 2 (Orthotropic) |
| Density |
1.38 g/cm3 |
1.5 g/cm3 |
1.5 g/cm3 |
| Young's Modulus |
20 MPa |
5000 MPa |
103300 MPa |
11800 MPa |
| Poisson's Ratio |
0.4 |
0.34 |
0.34 |
0.34 |
Table 3.
Mesh Inforrmation.
Table 3.
Mesh Inforrmation.
| |
Mesh 1 |
Mesh 2 |
Mesh 3 |
| Grid Quantity |
25,944 |
34,046 |
52,800 |
Table 4.
Wing Parameters in Different Wing Area Conditions.
Table 4.
Wing Parameters in Different Wing Area Conditions.
| |
S /mm2
|
b /mm |
l /mm |
c /mm |
| 1 |
2025 |
90 |
74 |
29.97 |
| 2 |
2500 |
100 |
84 |
32.45 |
| 3 |
3025 |
110 |
94 |
34.97 |
Table 5.
Wing Parameters in Different Aspect Ratios Conditions.
Table 5.
Wing Parameters in Different Aspect Ratios Conditions.
| |
AR |
b /mm |
l /mm |
c /mm |
| 1 |
3 |
86.60 |
70.60 |
40.36 |
| 2 |
4 |
100 |
84 |
32.45 |
| 3 |
5 |
111.80 |
95.80 |
27.83 |
|
Disclaimer/Publisher’s Note: The statements, opinions and data contained in all publications are solely those of the individual author(s) and contributor(s) and not of MDPI and/or the editor(s). MDPI and/or the editor(s) disclaim responsibility for any injury to people or property resulting from any ideas, methods, instructions or products referred to in the content. |
© 2024 by the authors. Licensee MDPI, Basel, Switzerland. This article is an open access article distributed under the terms and conditions of the Creative Commons Attribution (CC BY) license (http://creativecommons.org/licenses/by/4.0/).

