Preprint
Article

Intraoperative Hearing Monitoring Using ABR and TT-ECochG and Hearing Preservation during Vestibular Schwannoma Resection

Submitted:

17 June 2024

Posted:

18 June 2024

You are already at the latest version

A peer-reviewed article of this preprint also exists.

Abstract
Quick and appropriate diagnostics and the use of intraoperative monitoring (IM) of hearing during vestibular schwannoma (VS) resection increase the likelihood of hearing preservation. During surgery, various methods of IM can be used, i.e. auditory brainstem responses (ABR), transtympanic electrocochleography (TT-ECochG) and direct cochlear nerve action potentials. The aim of the study was to evaluate the prognostic values of IM of hearing using ABR and TT-ECochG in predicting postoperative hearing preservation, as well as to evaluate relationships between them during various stages of surgery. This retrospective study presents the pre- and postoperative audiological test results and IM of hearing records (TT-ECochG and ABR) in 75 (43 women, 32 men, aged 18-69) patients with diagnosed VS. The preoperative pure tone average hearing threshold was 25.02 dB HL, while after VS resection it worsened on average by 30.03 dB HL. According to the American Academy of Otolaryngology-Head and Neck Surgery (AAO-HNS) Hearing Classification, before and after (pre/post) the surgery, there were 47/24 patients in hearing class A, 9/8-B, 2/1-C, and 17/42-D. In speech audiometry, the average preoperative speech discrimination score at an intensity of 60 dB SPL was 70.93%, and after VS resection it worsened to 38.93%. The analysis of electrophysiological tests showed that before the tumor removal the I-V ABR interlatencies was 5.06 ms, and after VS resection it was 6.43 ms. The study revealed correlations between worse postoperative hearing and changes in intraoperatively measured ABR and TT-ECochG. IM of hearing is very useful in predicting postoperative hearing in VS patients and increases the chance of postoperative hearing preservation in these patients.
Keywords: 
Subject: 
Medicine and Pharmacology  -   Otolaryngology

1. Introduction

Vestibular Schwannoma (VS) are histologically benign, slow-growing tumors developing from the Schwann sheath. Most often, they occur unilaterally, but sometimes they may appear on both sides and are usually associated with the clinical picture of type 1 or type 2 neurofibromatosis [1]. Żurek et al. report that the average incidence of VS is 1.99 per 100,000 residents per year and that women are affected in more often (61.64%) [2]. The treatment strategy in the case of VS depends on various factors (e.g. tumor size, patient's age, condition of the hearing organ) influencing the final choice of therapy among three possible ones: microsurgery, stereotactic radiotherapy or observation [2,3,4,5,6]. According to the recommendations of the National Institutes of Health Consensus Development Conference on Acoustic Neuroma in 1991 [4], the best VS treatment method is microsurgery. Its goal is to completely remove the tumor while preserving the neurological functions of adjacent structures. VS microsurgery by the middle fossa approach (MFA) or posterior fossa approach (PFA) enables complete VS resection and hearing functions preservation. To maximize the likelihood of hearing preservation with both of these surgical approaches, intraoperative hearing monitoring (IM) is used [7]. The mostly used electrophysiological tests for IM of hearing are: auditory brainstem responses (ABR) [8,9,10,11,12,13,14,15,16,17,18,19,20,23,24,25,26,28,30,31], transtympanic electrocochleography (TT-ECochG) [8,9,11,12,13,17,18,21,22] and direct cochlear nerve action potential (CNAP) [8,10,11,13,14,16,17,18,20,23,25,26,27,28,29,30,31,32]. Each of the mentioned electrophysiological techniques has advantages and disadvantages. The most frequently used test is ABR, which is a non-invasive far field technique, but recording auditory potentials requires several hundred averages to make the recording repeatable, legible and interpretable. Consequently, the obtained result usually has a time delay of several dozen seconds at critical stages of the surgery, so it is difficult to say that the test is carried out in real time, which may turn out to be a critical element for preserving hearing [8,9,10,12]. TT-ECochG and CNAP are invasive and technically more difficult to perform, that is why some surgeons do not use them for IM of hearing. With readings from the near field the amplitudes of the auditory potentials are higher and usually averaging several dozen responses is sufficient to obtain clear, repeatable recordings. It can therefore be said that for IM of hearing takes place in real time domain [8,9,10,11,12,13,14,16,17,18,19,20,21,22,23,25,26,27,28,29,30,31,32].
The authors of this study evaluate the prognostic values of IM of hearing using ABR and TT-ECochG in predicting postoperative hearing preservation and analyze the relationships between them during IM at various stages of surgery.

2. Material and Methods

2.1. Patients’ Presentation

Seventy-five patients were included in the study (43 women (57.33%), 32 men (42.66%)). The age of the patients ranged from 18 to 69 years (average 46.44; median 48.00, first quartile (Q1) 36.00; third quartile (Q3) 58.00; standard deviation (SD) 14.04). All VS patients were diagnosed and confirmed clinically and radiologically in magnetic resonance imaging (MRI) with contrast; the tumor was filling the internal auditory canal (IAC), not exceeding 2.5 cm in the longitudinal axis of the IAC, and in some cases protruding beyond the border of the IAC by no more than 1.5 cm. In the presented patients, the average tumor size in the longitudinal axis was 10.26 mm (median 10.00; min-max 4.0-20.00; Q1 7.00; Q3 14.00; SD 4.77). According to the Koos Grading Scale [33], 51 patients classified as grade I, 22 of them as grade II, and only 2 as grade III. According to the Matthies' guidelines [35], T1 intracanal tumor occurred in 51 patients, T2 in 22 and T3 in 2 patients. In 42 patients, the VS was located on the right side and in 33 on the left.

2.2. Audiological Tests Methodology

All presented patients had audiological tests performed 1-7 days before surgery and up to 30 days after VS resection. In the case of deaf for individual frequencies in pure tone audiometry (TA), a value of 130 dB HL (decibel hearing loss) was assumed as the maximum for statistical calculation purposes. The obtained results were calculated, analyzed and classified according American Academy of Otolaryngology Head and Neck Surgery (AAO-HNS) Hearing Classification [35]. Preoperative (preop) and postoperative (postop) hearing was evaluated using TA tested at 125-8000 Hz frequency band and speech audiometry (SA) to evaluate speech discrimination in monosyllabic verbal tests. For statistical calculations the preop and postop hearing threshold was expressed according to formula (0.5kHz+1.0kHz+2.0kHz+3.0kHz)/4)(PTA-4) while SA was presented as a percentage correctly repeated monosyllabic words presented at an intensity of 60 dB SPL (Sound Pressure Level); (SA-60dB SPL). Postop hearing changes in TA were presented as a difference between postop and preop PTA-4 (Post-Pre PTA-4). Postop hearing changes in SA were presented as a difference between postop and preop SA-60dB SPL (Post-Pre SA-60 dB SPL). Postop hearing worsening evaluated according to AAO-HNS Hearing Classification also were showed as a difference Post–Pre AAO-HNS. PTA-4 in 71 patients did not exceed 50 dB HL, and in SA-60dB SPL speech discrimination was at least 50%. Four patients, despite a slightly worse hearing threshold and speech discrimination, were also qualified for VS resection through the MFA due to a tumor of grade I or II of the Koos Grading Scale. Therefore, according to the American Academy of Otolaryngology-Head and Neck Surgery (AAO-HNS) Hearing Classification [35], 47 patients classified as class A, 9 as class B, while 2 patients were in hearing class C, and 17 in D. All patients were qualified for tumor resection by the MFA with accompanying IM of hearing.

2.3. Methodology of Intraoperative Hearing Monitoring

To perform hearing IM during VS removal, ABR and TT-ECochG tests were used.
A two-channel Smart Box device with Smart EP software (Intelligent Hearing Systems, FL, Miami, USA) was used to perform IM of hearing. In each case, at the beginning of the surgery the needle electrode (-) for TT-ECochG and ABR responses was inserted through the posteroinferior quadrant of the tympanic membrane and supported by the promontory. The grounding needle electrode is normally placed in the midline at the border of the forehead and scalp, and the reference (+) needle electrode is placed on the top of the head. The acoustic stimulus was an 80 dB nHL click alternating polarization and delivered through ER3 insert earphones (Etymotic Research, Elk Grove Village, IL). Each time the stimulus presentation rate was 21.17/s, the number of averaged samples ranged between 64-256, thus enabling clear and repeatable responses to be obtained with both TT-ECochG and ABR. The parameters of acquisition are typical: amplification - 100k gain, filtering 30-3000 Hz, the time window of the analyzes 12.8 ms.
In TT-ECochG, the latency and amplitude of the Action Potential (AP; AP-Lat, AP-Amp) were assessed. In the case of lack of AP due to the loss of auditory functions after AS resection, the AP-Lat value for statistical calculations was assumed to be 5.6 ms, i.e. the last possible measurable AP peak, and for the AP-Amp the value was 0.00 µV. In ABR, the latencies of waves I, III, V and the values of individual time interlatencies I-III, III-V and I-V were assessed. In the absence of a recorded ABR response for wave V in a patient after tumor removal, a latency value of 12.8 ms was assumed for statistical calculations - as the last measurable value of the analyzed time window. Also, for this reason, the value of the I-V interlatencies after surgery was assumed to be 12.8 ms.
Intraoperative electrophysiological recordings were performed during the entire surgery but for statistical purposes recordings from 3 stages of surgery were analyzed: during the tumor approach preparation (Stage-1); during manipulation on VS and its resection (Stage-2), and after VS resection (Stage-3).
Electrophysiological responses were recorded in real time every 5-6 seconds with TT-ECochG and with a slightly usually twice longer time with ABR. By combining these two techniques, it is possible to verify the condition of the hearing organ relatively quickly and inform the surgeon about any changes in the morphology of the TT-ECochG and ABR. After assembling the research group, all electrophysiological responses were subjected to detailed analyzes and calculations.

2.4. Statistical Analyses

Due to the lack of normal data distributions, small subgroup sizes and the lack of meeting other criteria for the use of parametric tests, it was decided to use their non-parametric equivalents. The Wilcoxon Test was used to compare changes in values observed in audiological and electrophysiological tests before and after surgery. The Spearman's Rank Correlation Test (R) was used to assess the correlations between various parameters. The Pearson χ2 Test of Maximum Likelihood was used to analyze the distribution of qualitative characteristics. A p-value<0.05 was considered statistically significant.

3. Results

3.1. Analysis of Audiological Tests Before and After the Vestibular Schwannoma Removal

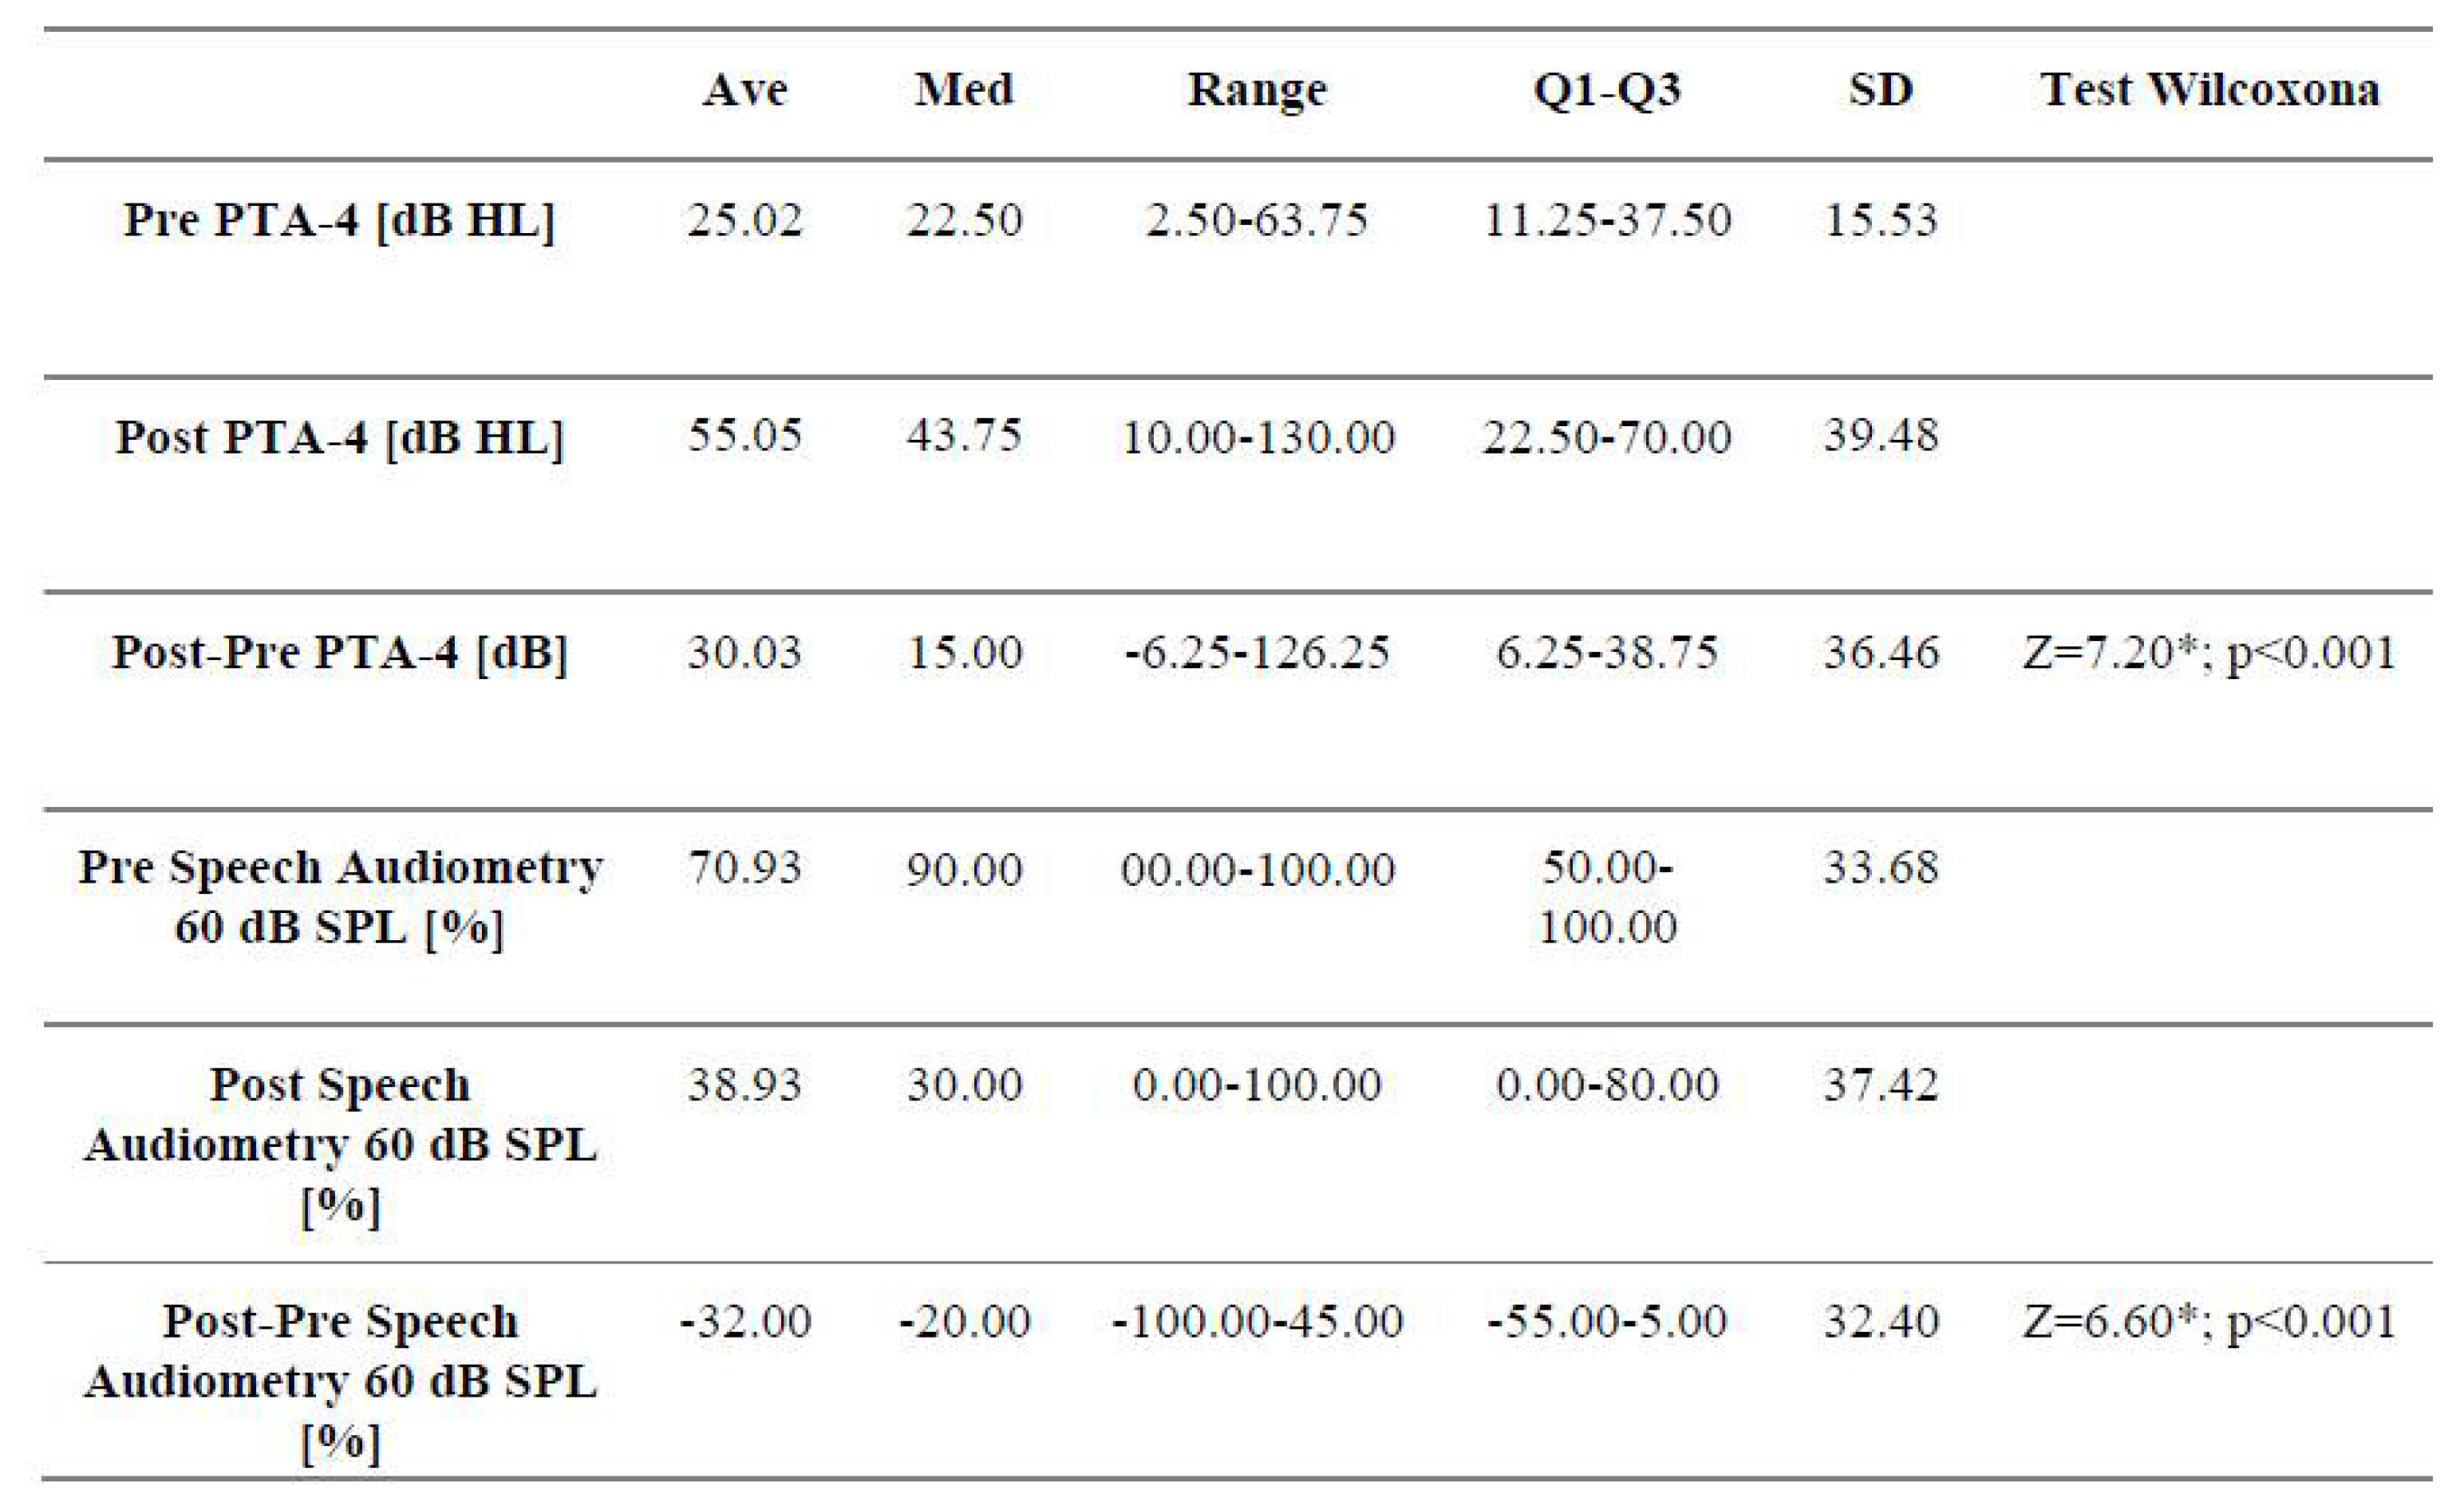
Pre- and postoperative TA and SA were performed in all 75 patients included in the project. Table 1 presents the individual results of the statistical analyzes of these audiological tests.
PTA-4: tonal audiometry calculated in formula (0.5kHz+1.0kHz+2.0kHz+3.0kHz)/4); dB HL: decibel hearing level; dB SPL: decibel sound pressure level; Pre: before surgery; Post: after surgery; Post-Pre: difference between the results after and before surgery (for PTA-4, a positive value – hearing deterioration; negative – hearing improvement; for speech audiometry 60 dB SPL, a negative value means deterioration of speech discrimination; positive – speech discrimination improvement; (*): statistically significant; Ave: average (mean); Med: median; Range: min-max; Q1-Q3: First Quartile-Third Quartile; SD: standard deviation.
Pre PTA-4 values were found to range from 2.50 to 63.75 dB HL (median 22.5). After VS removal, hearing deteriorated and ranged from 10.00 to 130.00 dB HL (median 30.03). The median value of postoperative hearing was significantly worse was reaching 15 dB (Wilcoxon test: Z=7.20; p<0.001). Detailed results are presented in Table 1.
The analysis of the distribution of hearing deterioration values showed that in 31 (41.33%) patients the postop hearing threshold for PTA-4 did not deteriorate more than 10 dB HL, and in 55 (73.33%) patients it did not deteriorate more than 30 dB HL. Among the remaining 20 patients whose hearing threshold deteriorated by more than 30 dB HL, there were also 13 (17.33%) patients who completely lost hearing functions after VS resection.
Figure 1 shows also changes in the hearing thresholds for individual frequencies. It can be seen that the most serious hearing loss occurred after the surgery for the highest frequencies. In turn, the hearing threshold deteriorated the least was observed for low frequencies.
In preop SA-60 dB SPL, speech discrimination ranged from 0 to 100% (median 90%). In 7 cases for which speech discrimination at 60 dB SPL was 0%, for higher levels of 70-120 dB SPL this value reached levels of 65-100%. Analogous postop values decreased and although they ranged from 0 to 100%, the median was 30%. In 28 cases, postop speech discrimination at a level of 60 dB SPL was 0%, however, at levels 100-120 dB SPL, 0% was observed in 14 cases. Postoperative analysis of the deterioration of speech discrimination showed statistical significance in the Wilcoxon test (Z = 6.60; p < 0.001). Detailed analysis values are included in Table 1.
Additional analysis of the distribution of speech discrimination values showed that in 26 (34.66%) patients the postop speech discrimination values at an intensity of 60 dB SPL deteriorated by no more than 10%, while in 41 (54.66%) patients speech discrimination did not deteriorate more than by the average deterioration of 32%.
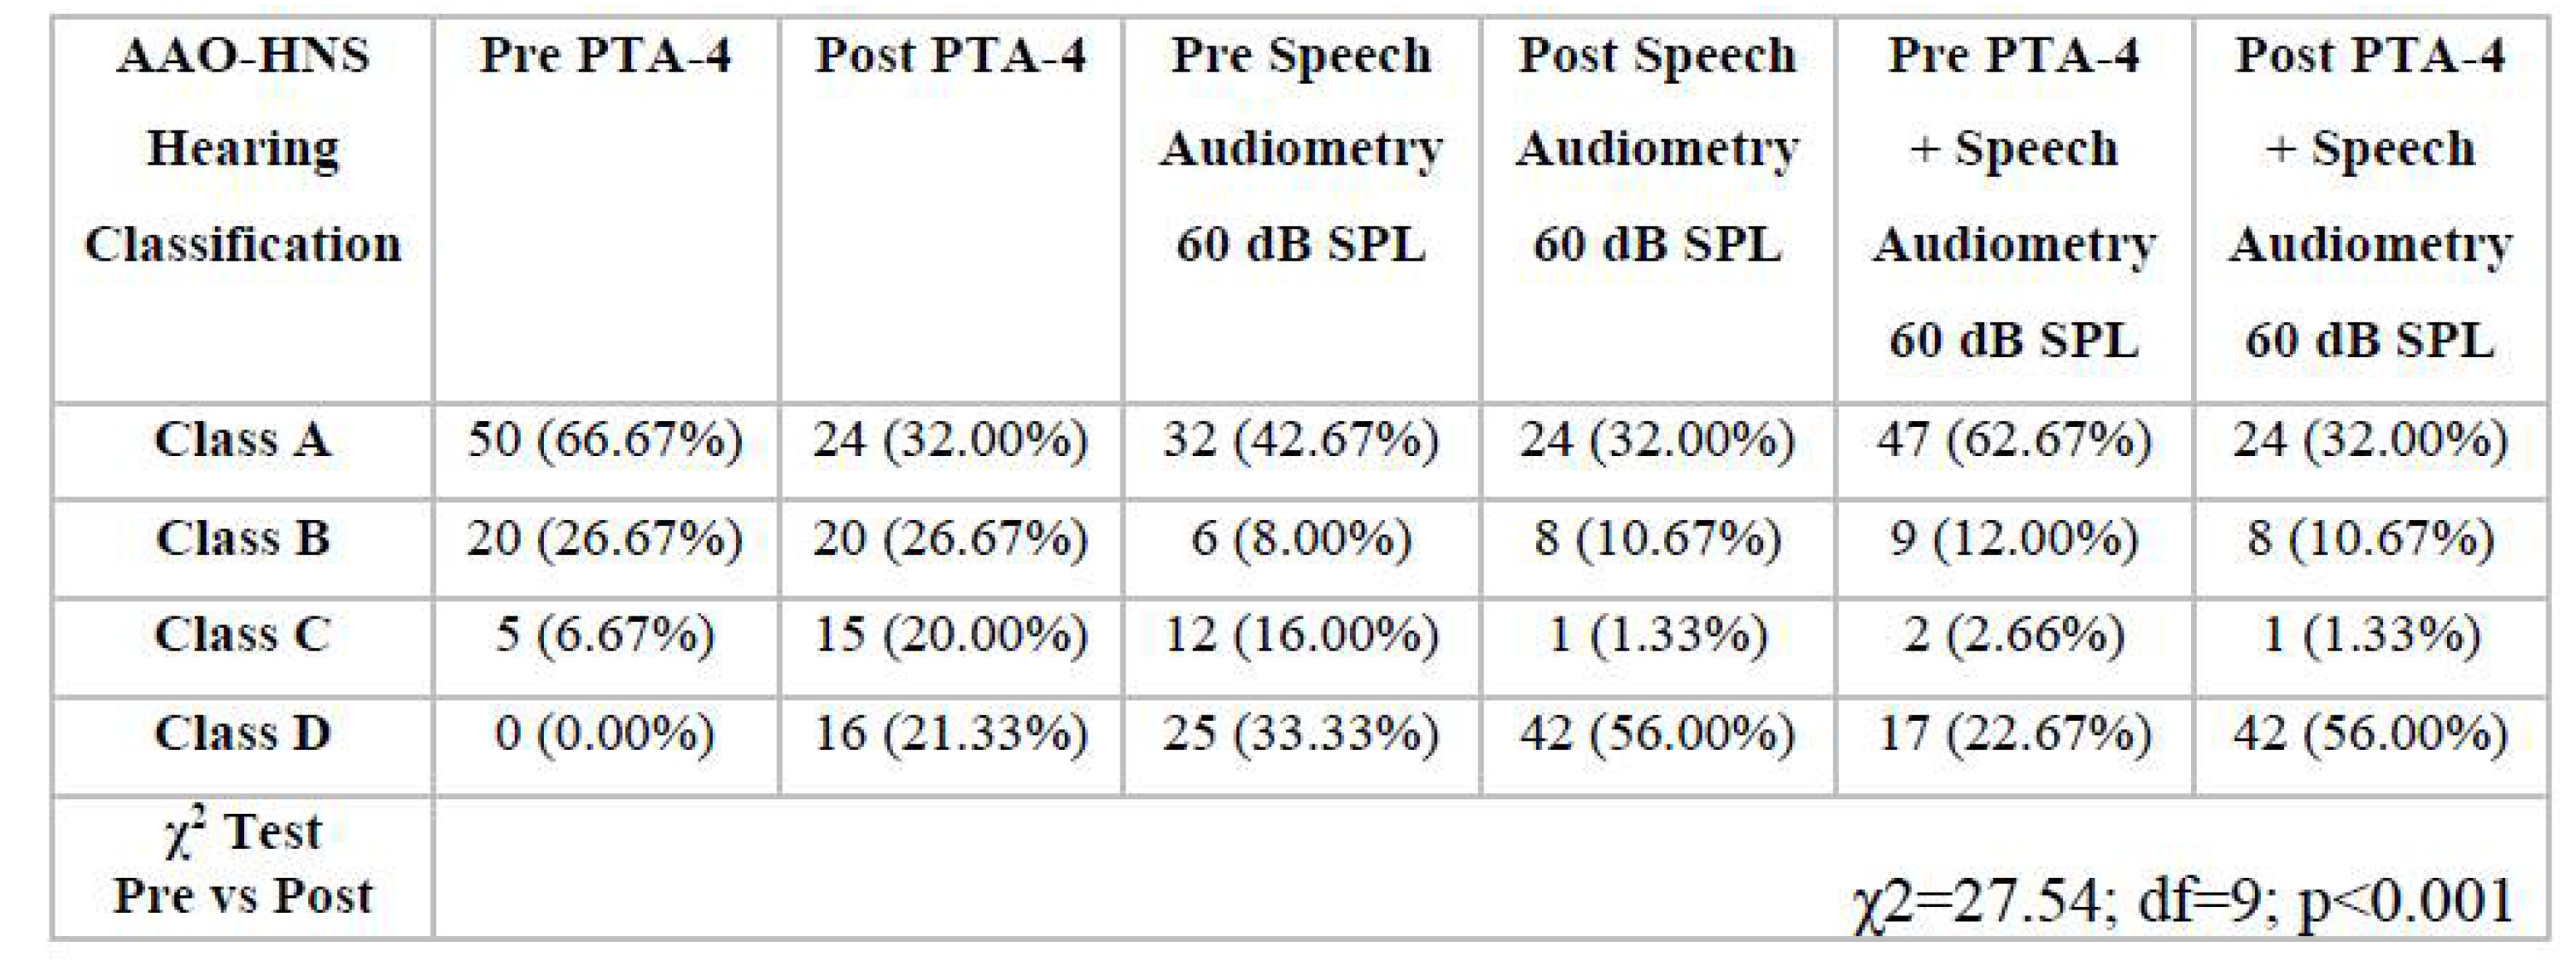
The analysis of the change in the distribution of hearing classes according to AAO-HNS [35], considering PTA-4 and speech discrimination for an intensity of 60 dB SPL, showed that before the surgery, 47 patients were in hearing class A, and after the surgery, 24 patients were in this class. In hearing class B, the number of patients before the procedure was 9, and after the procedure, 8. In hearing class C, there were only 2 patients before the surgery, and only 1 after it. In turn, in class D, after the surgery, the number of patients increased from 17 to 42, including 13 patients who suffered from complete hearing loss. A detailed quantitative distribution for hearing classes according to AAO-HNS is provided in Table 2. The AAO-HNS hearing classes before and after surgery were also analyzed using the Maximum Likelihood χ2 test, obtaining a statistically significant deterioration in hearing and speech discrimination at an intensity of 60 dB SPL (χ2= 27.54; df=9; p<0.001).

3.2. Characteristics of Electrophysiological Tests

3.2.1. Auditory Brainstem Responses – ABR

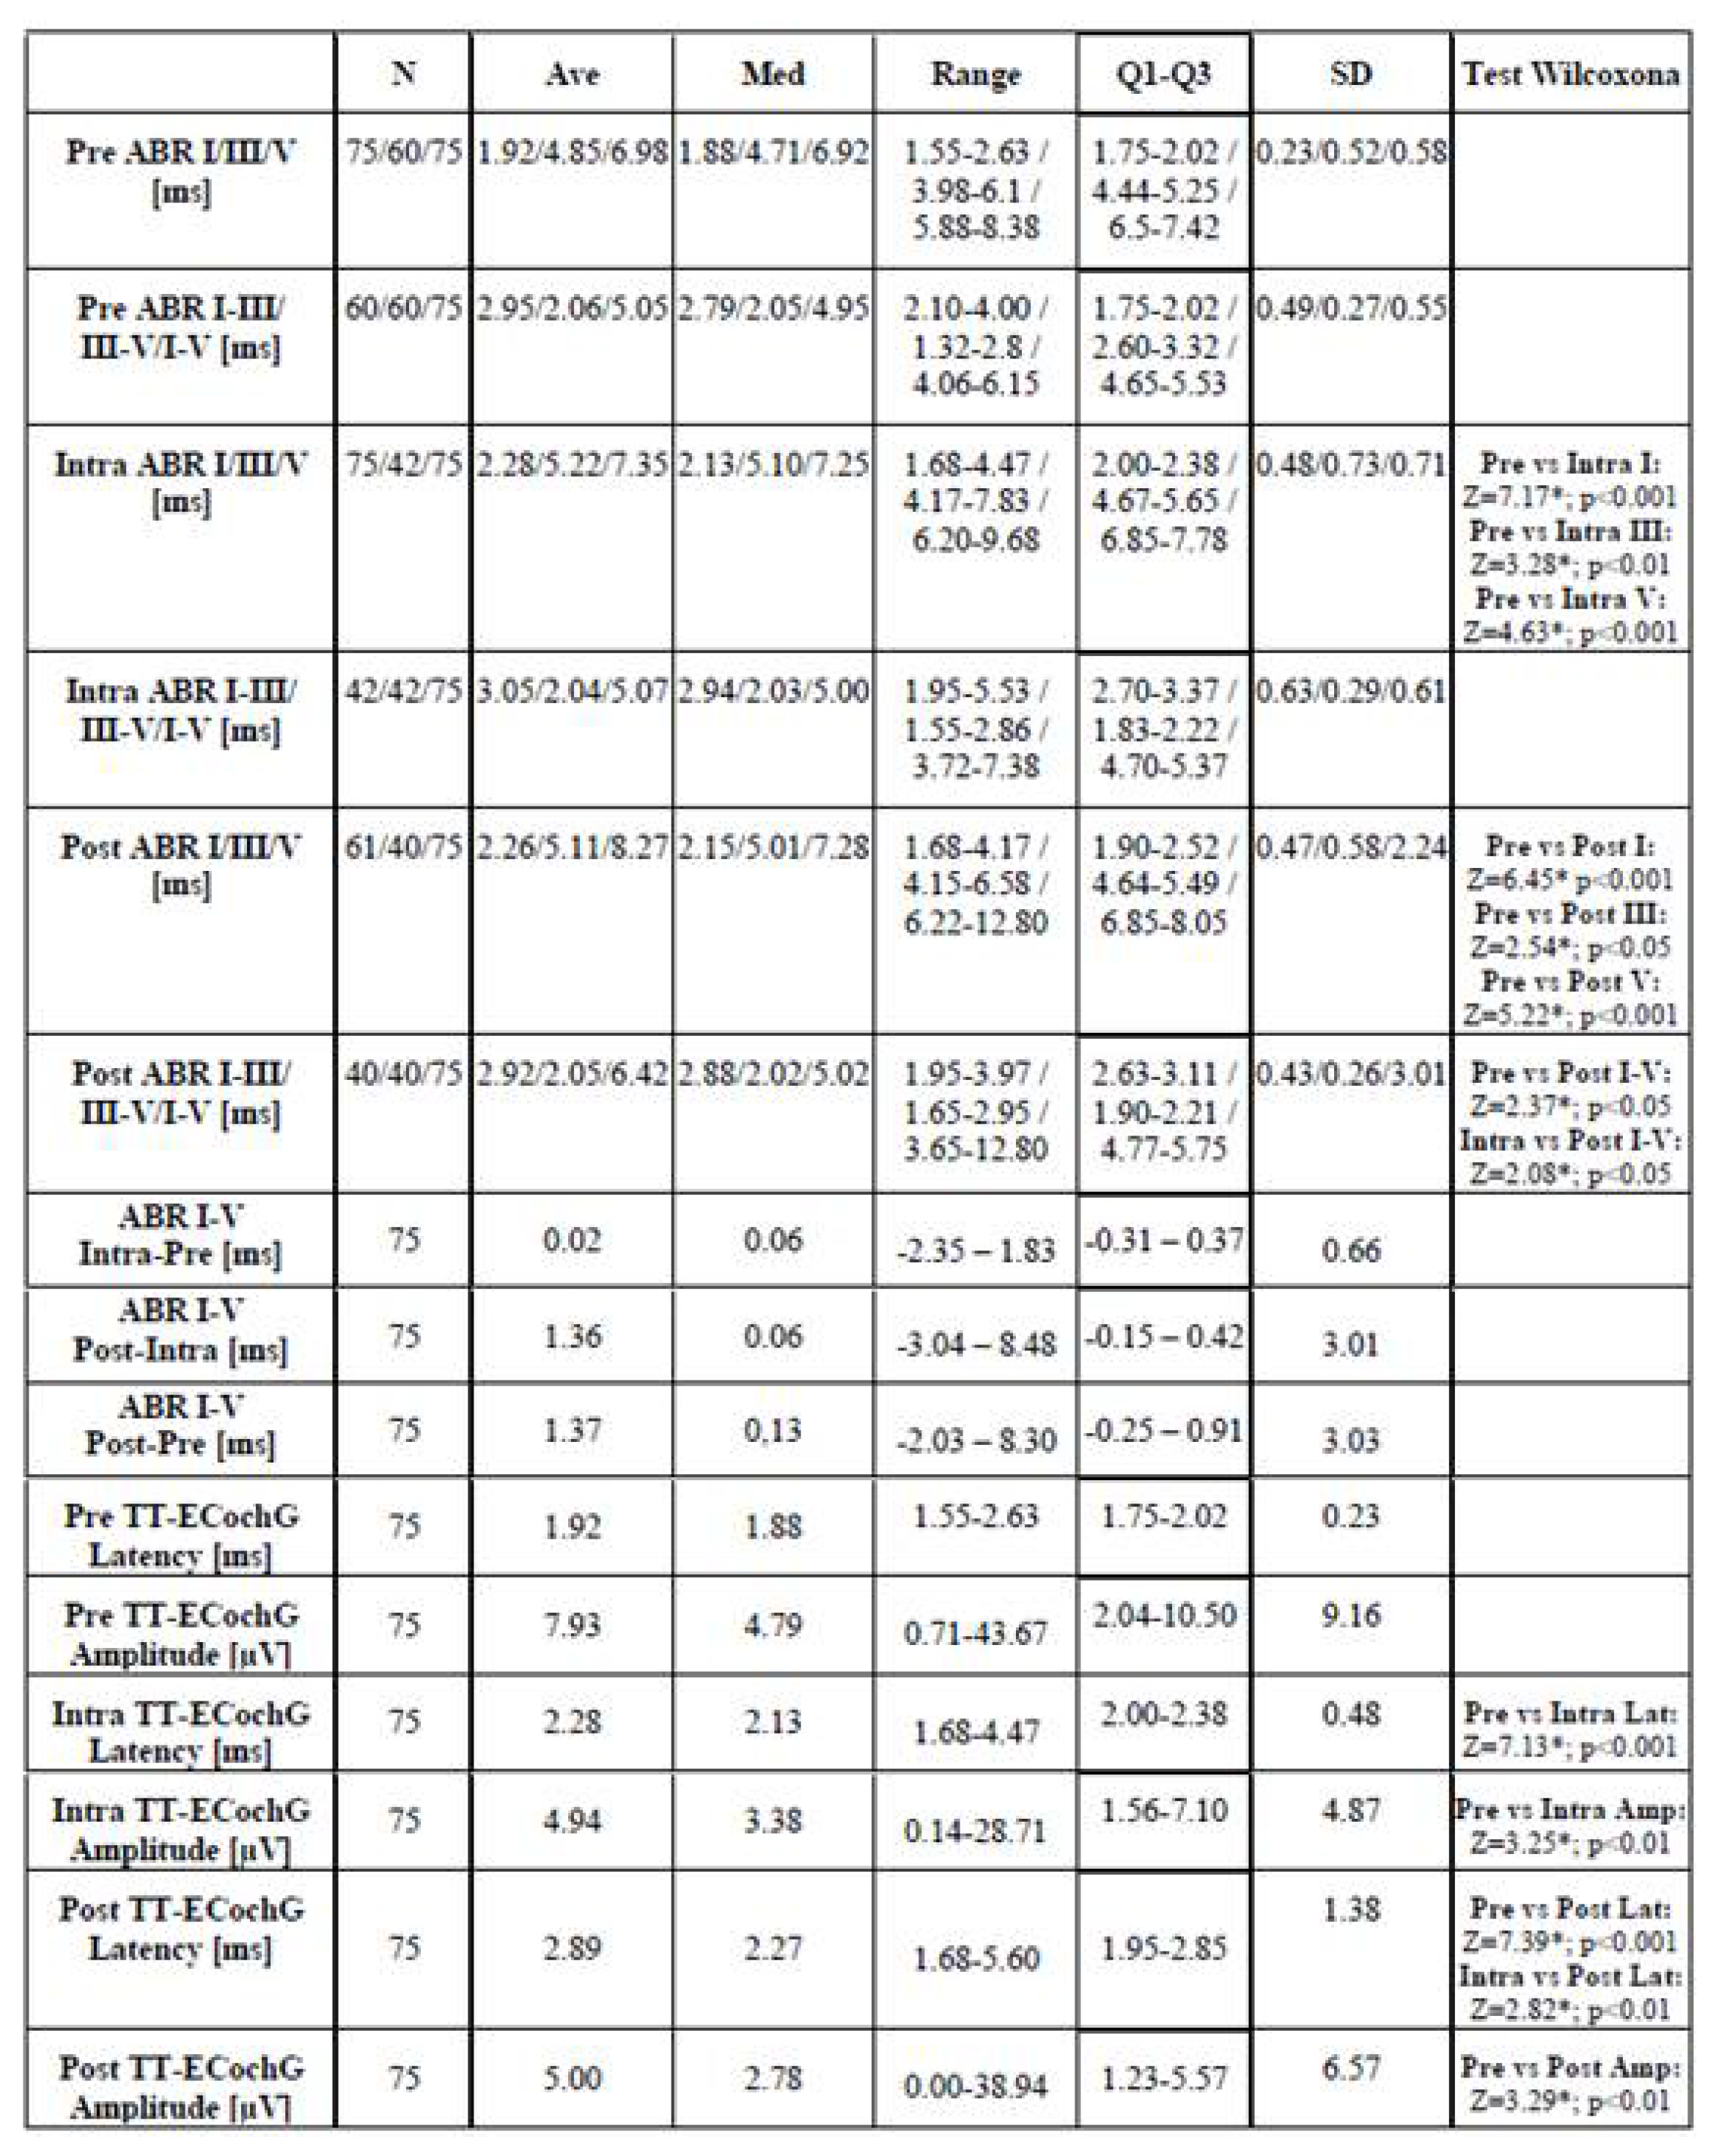
The location of VS and the possible cochlear nerve and the brainstem compression may sometimes cause desynchronization of the ABR response, which is manifested by the disappearance of selected waves I, III, V. This is one of the reasons why individual ABR waves could not be recorded in some of the described patients. In all 75 patients, latencies of waves I and V were determined; in some cases, most often during VS resection, it was not possible to identify wave III; therefore, the I-V interlatencies, which was determined in 75 patients in each of the cases, could be used for a more accurate assessment at each of the 3 stages of the surgery. Nevertheless, as described in the methodology, the values of all I-III, III-V and I-V interlatencies were analyzed and these values are presented in Table 3. Intraoperative dynamic changes of the measured ABR parameters mentioned above observed before (Pre), during (Intra) and after (Post) VS resection are expressed as a difference Post-Pre, Post-Intra, Intra-Pre. Before the start of the VS resection, the I-V interlatencies ranged from 4.06 to 6.15 ms and only in 3 cases this value exceeded 6 ms (average 5.06; median 4.95; min-max: 4.06-6.15; Q1 4.65; Q3 5.53; SD 0.55). During removal, the value of the I-V intetlatencies ranged from 3.72 to 7.38 ms, but values above 6 ms were observed only for 4 cases (average 5.07; median 5.00; min-max 3.72-7.38; Q1 4.7; Q3 5.37; SD 0.61). The observed values after VS resection showed that in 2 cases the value of the I-V interlatencies was higher than 6 ms, but in as many as 14 cases this value was undetectable (for the purposes of this study, the value of 12.8 ms was assumed). Therefore, on average, a significant extension of the I-V interlatencies value was observed, which reached the value of 6.43 ms (median 5.02; min-max 3.65-12.80; Q1 4.77; Q3 5.75; SD 3.11). Table 3 contains all individual values for waves I, III, V and for their interlatencies I-III, III-V, and I-V. On its basis, after tumor removal, the largest wave V was prolonged by an average of 1.29 ms and reached the value 8.27 ms (median 7.28; min-max 6.20-12.80; Q1 = 6.85; Q3 8.05; SD 2.24).
Statistical analysis using the Wilcoxon Test showed statistically significant changes in the values of waves I, III, V before and during tumor removal, as well as before and after removal of the VS, which is described in detail in Table 3. In turn, changes after VS resection in relation to the surgical manipulations stage was observed only for wave V (Post vs Intra: Z=2.30; p<0.05). Statistically significant changes were also obtained at the same time of surgery for the I-V interval (Post vs Intra: Z=2.08; p<0.05). The Wilcoxon Test also showed statistically significant changes in the values of the I-V interlatencies after surgery compared to those from before VS resection (Post vs Pre: Z=2.37; p<0.05).

3.2.2. Transtympanic Electrocochleography

TT-ECochG responses were recorded in all 75 patients at three stages of the surgery. The following intraoperative dynamic changes of the TT-ECochG parameters were measured: AP-Amp and AP-Lat observed before (Pre), during (Intra) and after (Post) VS resection are expressed as a difference Post-Pre, Post-Intra, Intra-Pre. AP-Lat values at the beginning of the surgery ranged from 1.55 ms to 2.63 ms (average 1.92; median 1.88; Q1 1.75; Q3 2.02; SD 0.23), while the corresponding amplitude values were 0.71 µV to 43.66 µV, respectively (average 7.93; median 4.79; Q1 43.66; Q3 2.04; SD 9.16). During intraoperative manipulations at the stage of the VS resection, AP-Lat values increased while the AP-Amp was significantly reduced, reaching the lowest values of median 3.38 µV during the entire surgery (average 4.94; min-max: 0.14 -28.71; Q1 1.56; Q3 7.10; SD 4.88). After VS resection, the greatest delay of the AP-Lat occurred (average 2.89 ms; median 2.27; min-max 1.68-5.60; Q1 1.95; Q3 2.85; SD 1.38). In this stage of the surgery, a decrease in AP-Amp was also observed (average 5.00 µV; median 2.78 µV; min-max 0.00-38.94; Q1 1.23; Q3 5.57; SD 6.57). Detailed latency and amplitude values of TT-ECochG are provided in Table 3.
Statistical analysis using the Wilcoxon Test showed a statistically significant increase of AP-Lat post VS resection compared to the pre VS resection (Post vs Pre: Z=7.31; p<0.001) and a reduction in AP-Amp (Z=3.29; p<0.001). In a statistical analysis using the same test, comparing Intra and Pre VS resection AP parameters a statistically significant delay of AP-Lat ( Intra vs Pre: Z=7.14; p<0.001) as well as a decrease in amplitude (Z=3.25; p<0.001) were demonstrated for data recorded during VS resection. The Wilcoxon Test also showed a statistically significant extension of the AP-Lat after VS resection compared to the data recorded during VS resection (Post vs Intra: Z=2.18; p<0.005). Details in Table 3.

3.3. Assessment of the Relationship Between Audiological Tests and Electrophysiological Tests Used For Intraoperative Hearing Monitoring

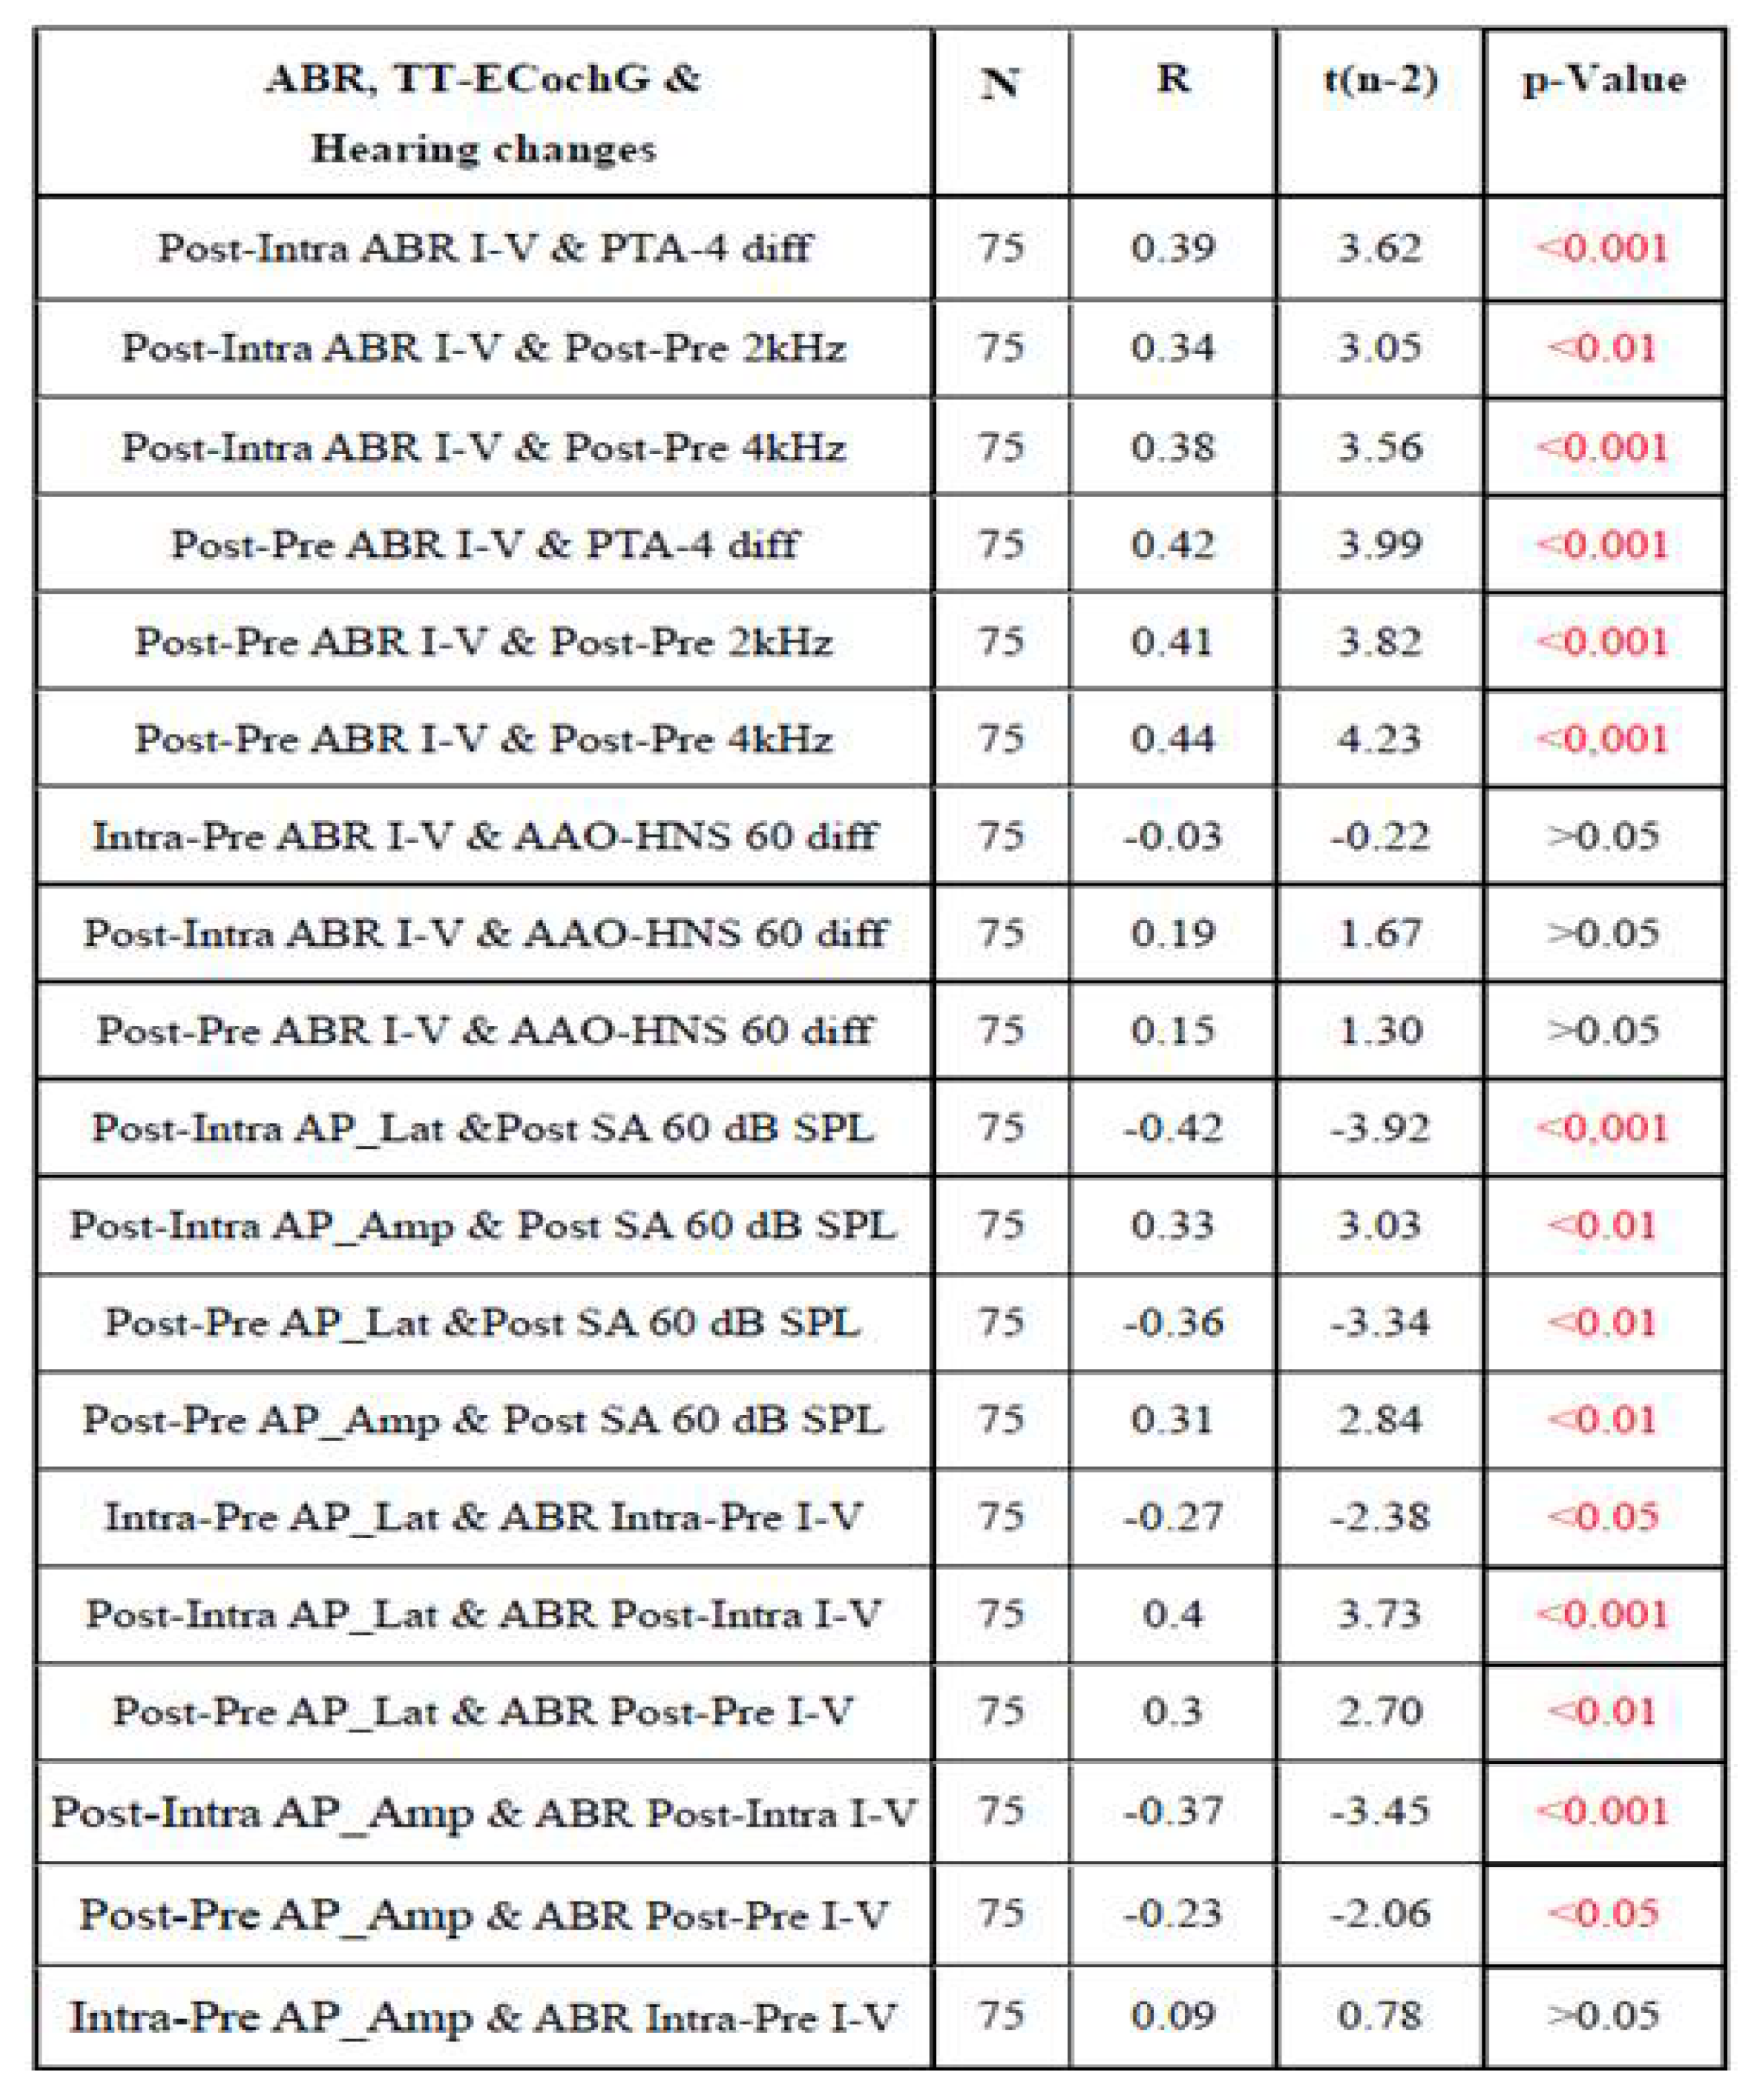
Based on statistical analysis using the Spearman’s Test, several correlations were demonstrated between hearing deterioration after surgery expressed as Post-Pre PTA-4, deterioration of speech discrimination for SA-60 dB SPL presented as Post-Pre SA-60 dB SPL, AAO-HNS hearing classes changes expressed also as a difference of Post-Pre AAO-HNS classification (Table 4) and electrophysiological tests measured intraoperatively - ABR and TT-ECochG. Some of them will be described below while details are presented in Figure 2 and Table 1, 2 and 4. The Spearman’s Test showed a statistically significant correlation between the Post-Pre PTA-4 and differences between postop and intraop values of the ABR I-V interlatencies (R=+0.39) (Post-Intra ABR I-V). Also, a statistically significant correlation was revealed between the Post-Pre PTA-4 and differences between Pre and Post values of the ABR I-V interlatencies (R=+0.42) (Post-Pre ABR I-V). Similar results revealed for 2- and 4-kHz in tonal audiometry (look Table 5). Analogous analyses for speech discrimination expressed as Post–Pre SA-60 dB SPL showed no significant correlations (details in Table 5).
The Spearman’s Test also showed a statistically significant correlation between Postop SA-60 dB SPL and the Post-Intra ABR I-V (R=-0.23). The same tendency was observed for Post-Pre ABR I-V (R=-0.19) although with no significance. Correlations were also obtained between Postop SA-60 dB SPL and the Post-Intra AP-Lat (R=-0.42) as well as for Post-Intra AP-Amp (R=0.33) (details in Table 5).
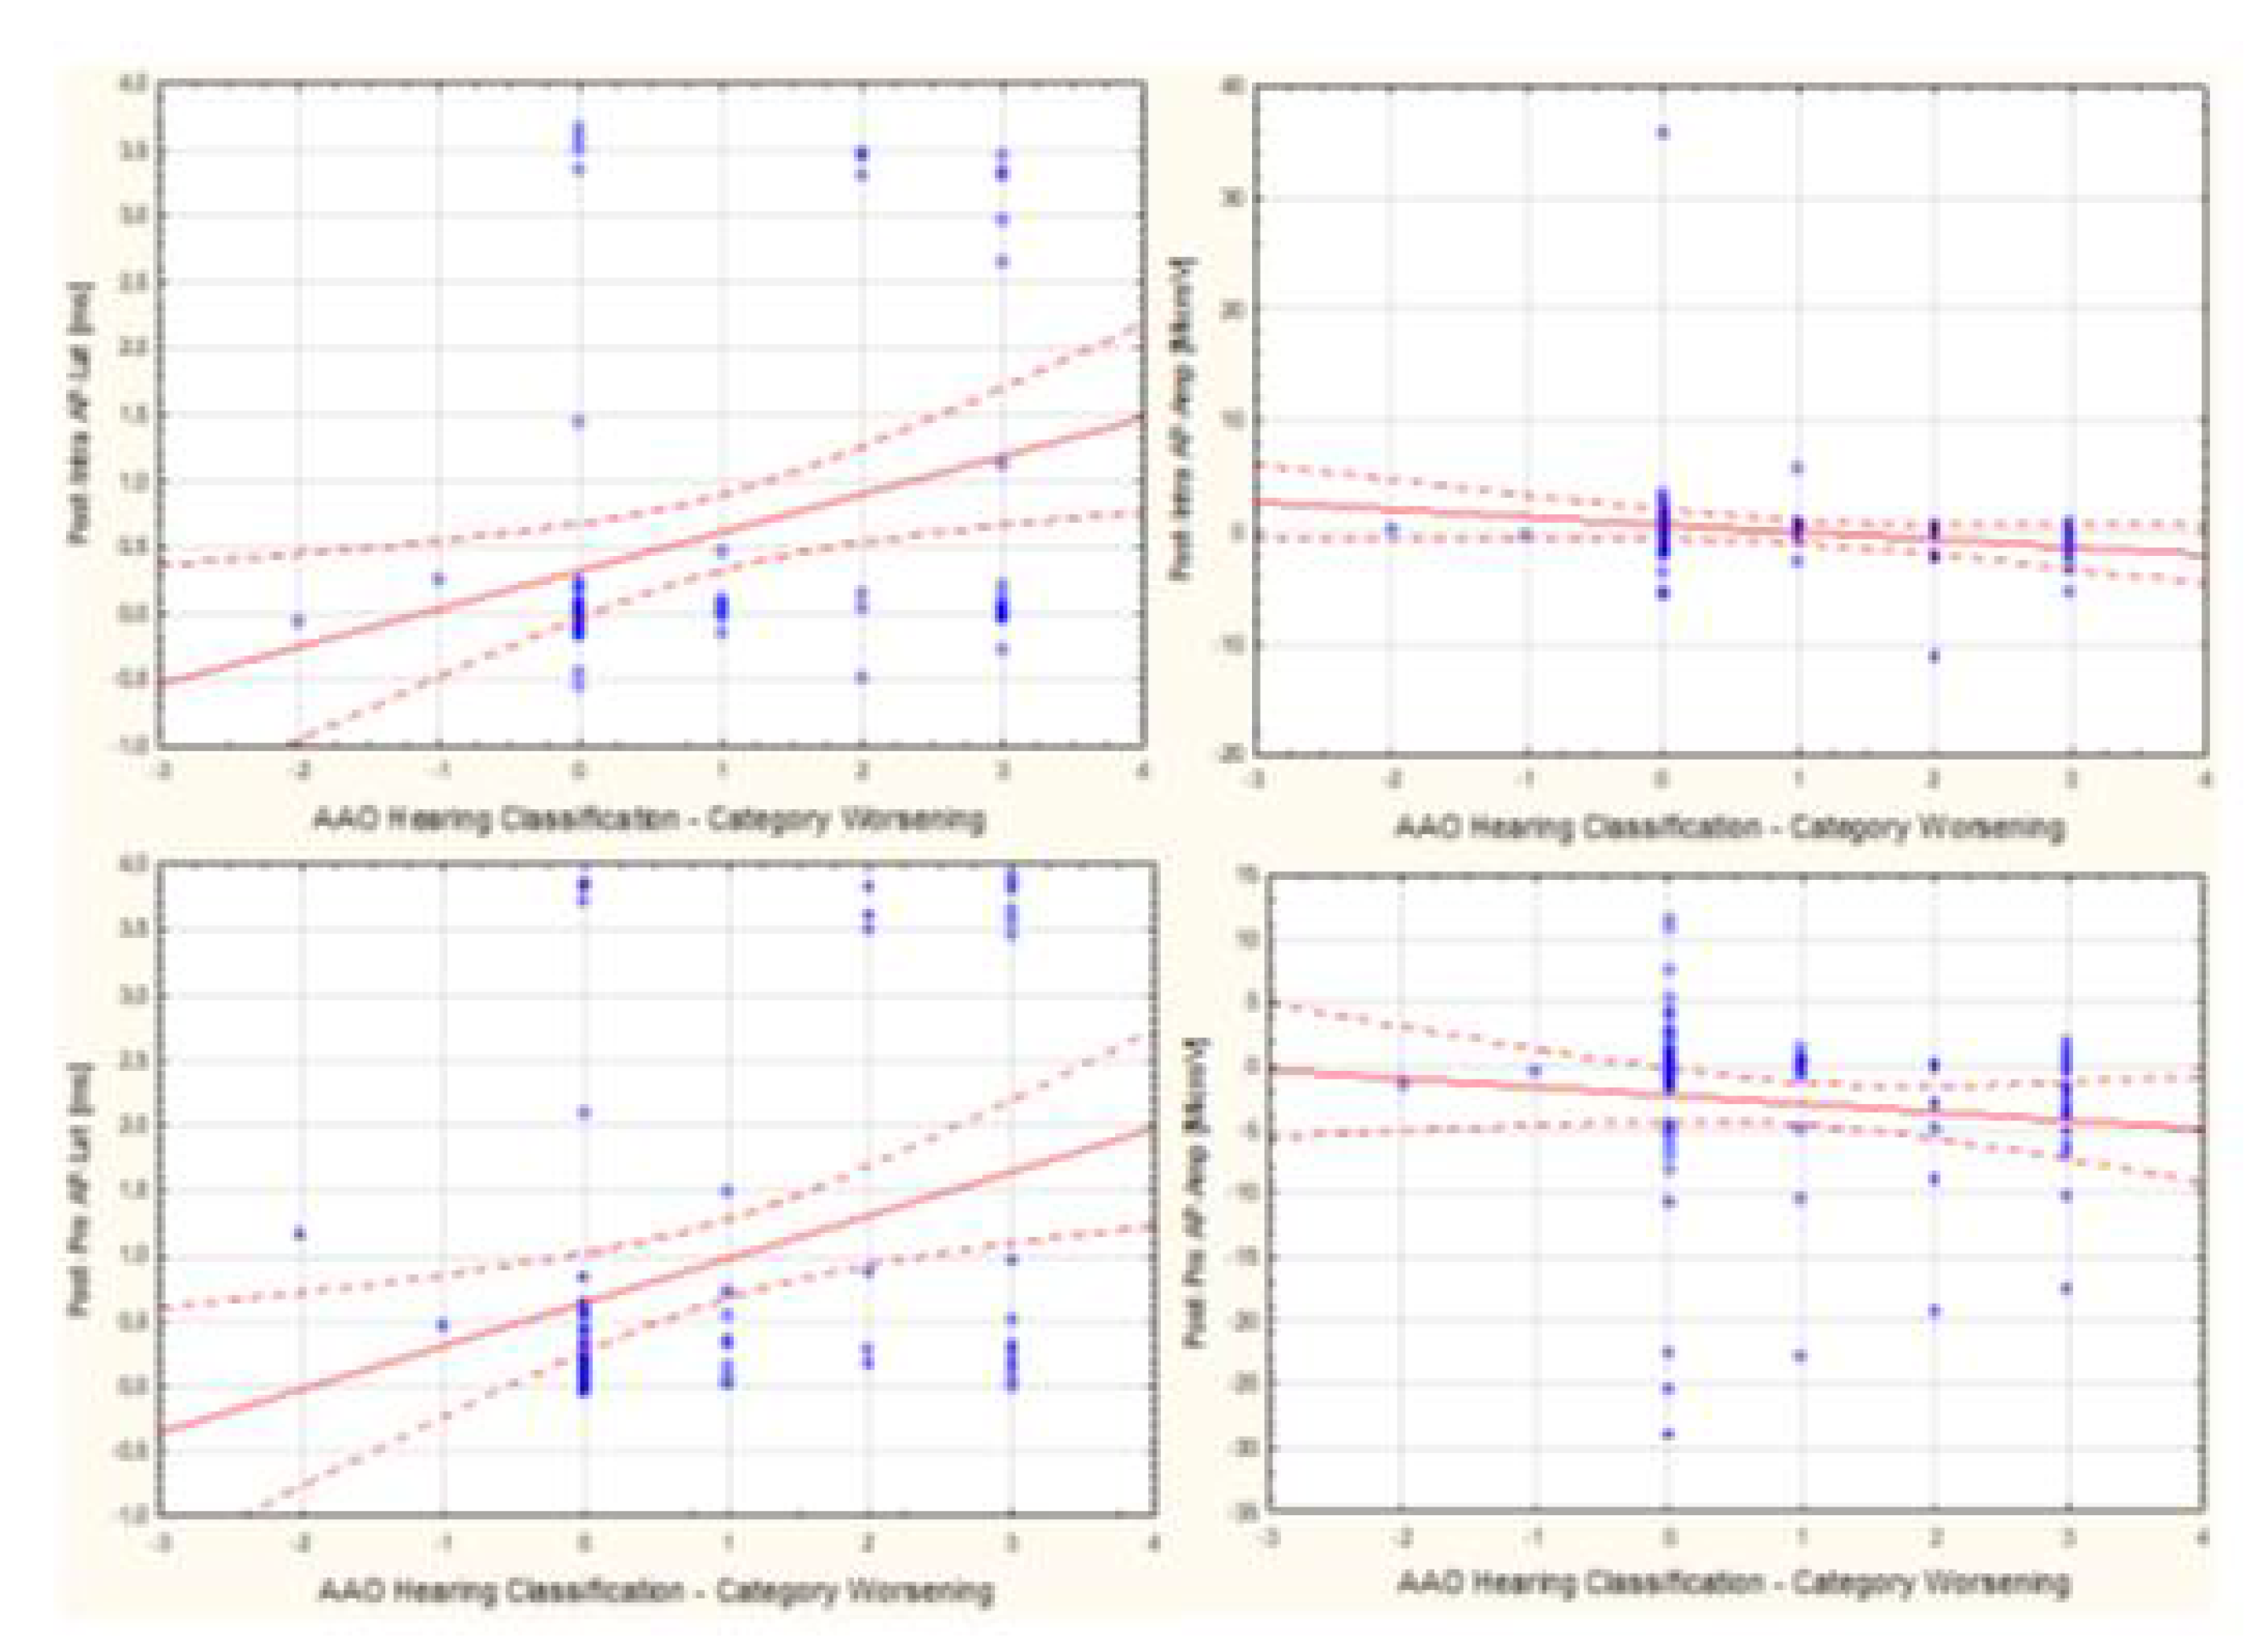
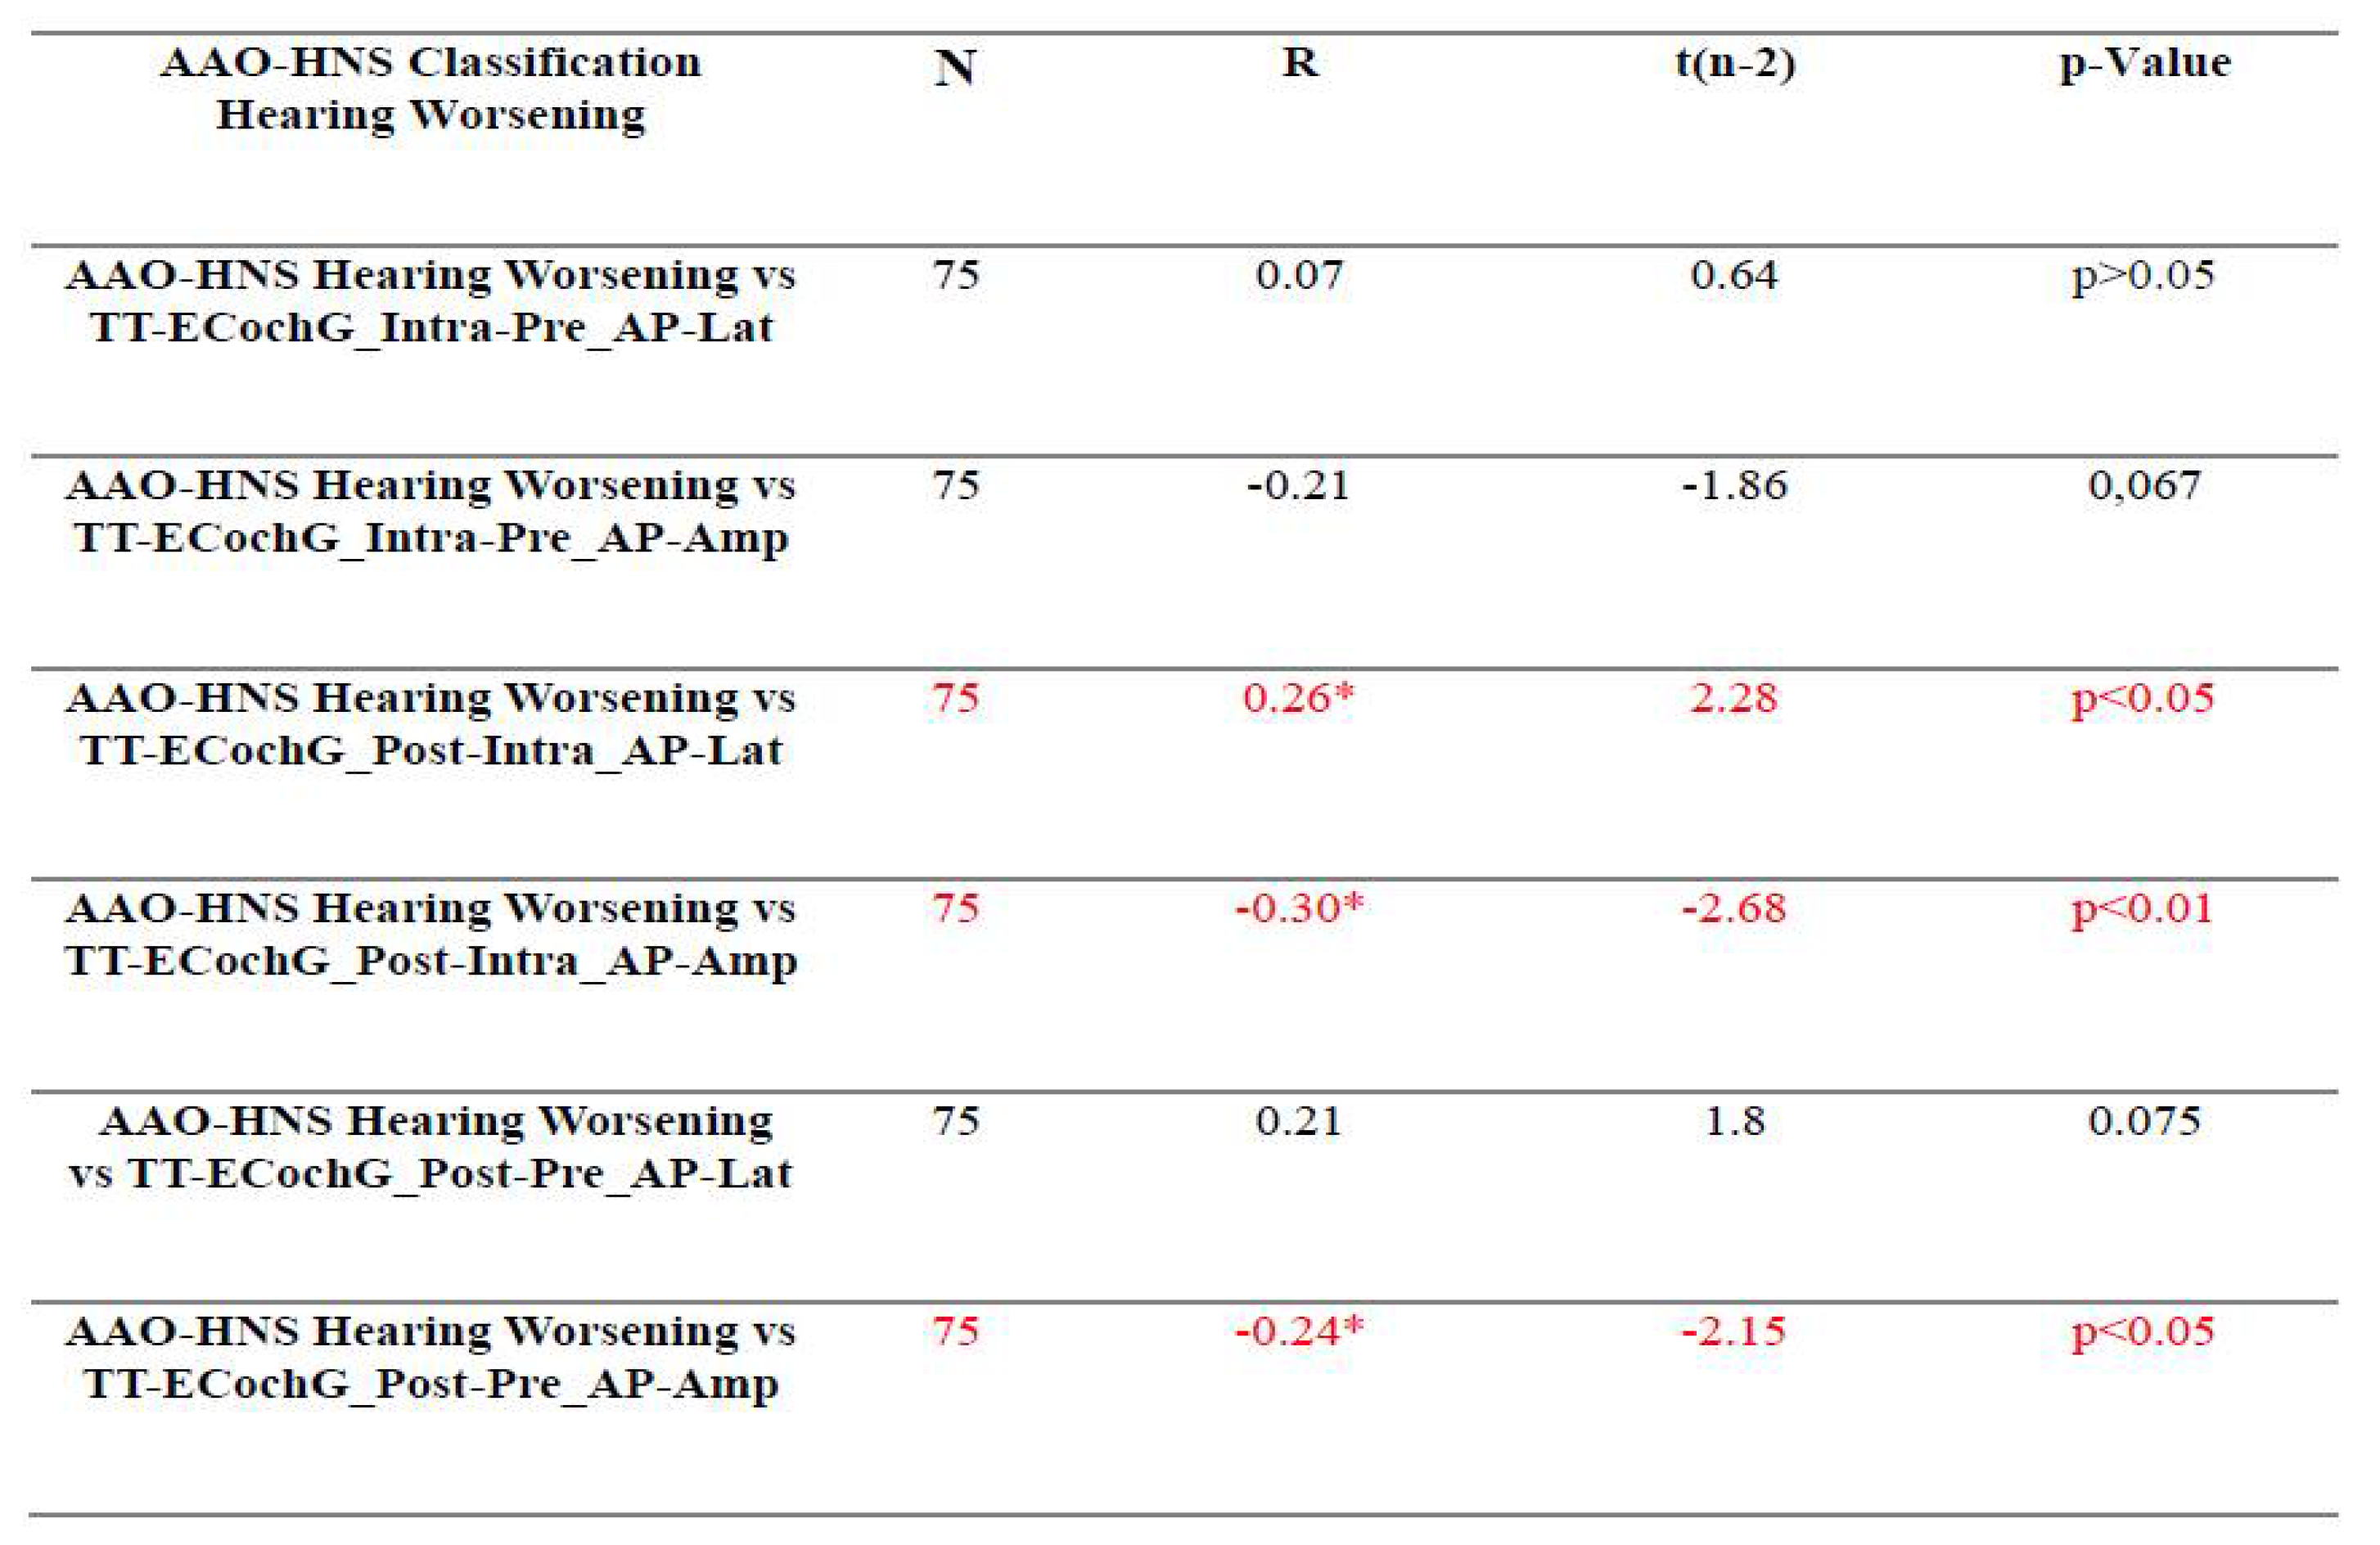
The same statistical correlations performed between intraoperative electrophysiological tests and hearing status evaluated according to AAO-HNS hearing classes. Majority of tests showed significant correlation between hearing worsening expressed as a difference in AAO-HNS hearing classes before and after surgery and the prolongation of Post-Intra AP-Lat (R=+0.26) and analogously the reduction of the Post AP-Amp (R=-0.3). A correlation using the same test also demonstrated dependences of AAO-HNS hearing classes before and after VS resection and prolongation of AP-Lat or reduction of AP-Amp (respectively R=0.19 and R=-0.24) (details in Table 4 and Figure 2).

3.4. Assessment of the Relationship Between ABR and TT-ECochG During Intraoperative Hear-ing Monitoring

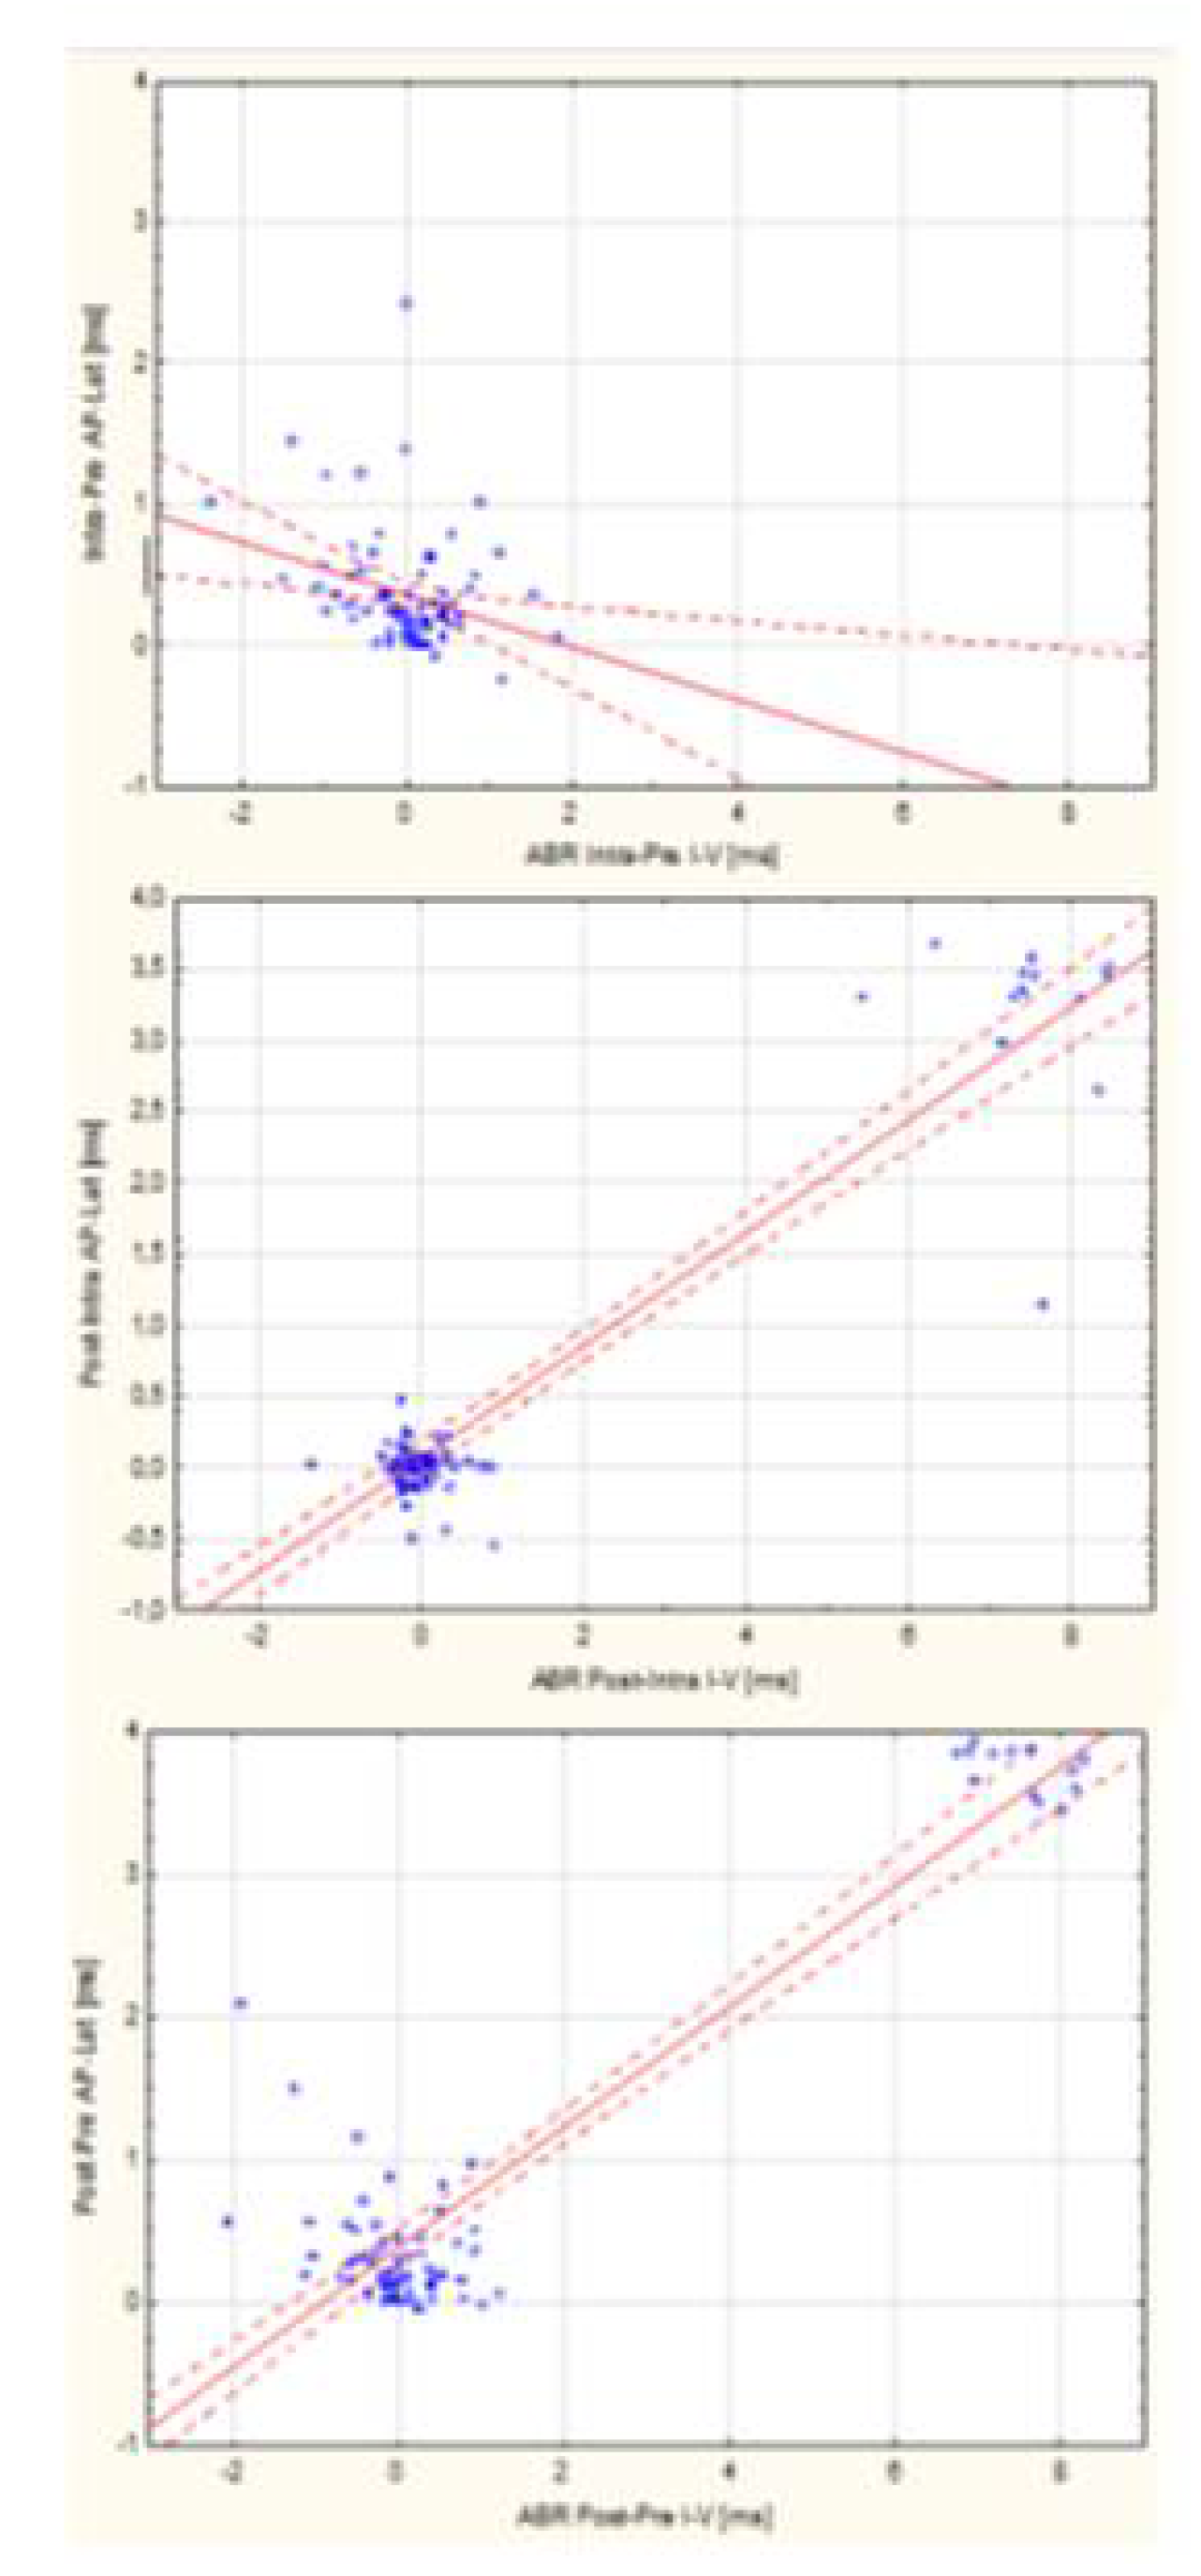
Statistical analyses showed some significant correlations between ABR and TT-ECochG during IM of hearing during VS resection. The Spearman’s Test revealed that the prolongation of Post AP-Lat in relation to Intraop AP-Lat (Post-Intra AP-Lat) correlates with the Post-Intra ABR I-V (R=+0.4). Similar analysis correlation between Post-Pre AP-Lat and Post-Pre ABR I-V also revealed significance (R=+0.3). Different tendency was observed for analysis of correlation between Intra-Pre AP-Lat and Intra-Pre ABR I-V (R=-0.27). In the next analysis, Spearman Test showed correlations between Post-Intra AP-Amp and Post-Intra ABR I-V (R=-0.37). Some correlations were also observed between the reduction of the amplitude of the action potential after surgery (Post-Pre AP-Amp) and Post-Pre ABR I-V (R=-0.23). Details are presented in Table 5 and Figure 3.

4. Discussion

The most common pathological change in the cerebellopontine angle that affects hearing is VS. Its occurrence is estimated at 85-90% of tumors located in this area. Meningiomas and other cranial nerve schwannomas (of the VII or V nerve) or so-called non-acoustic CPATs are much less frequently observed [2,9]. According to Żurek et al. the incidence of vestibular schwannoma in Poland is 1.99 cases per 100,000 people per year, and the average incidence is 19.87 per 1,000,000 people and ranged from 6.41 to 35.07 depending on the age group [2]. From long-term research conducted by Larjavaar et al. in the Scandinavian countries (Denmark, Finland, Norway, Sweden) shows that in the years 1987-2007 the incidence rates ranged from 6.10-11.60 per 1,000,0000 person-years. These studies showed an increase in the incidence of VS mainly in the mid-1990s. The greatest increase in the detection of acoustic neuromas was observed in Denmark, while in Finland it was infinitesimal [37]. In turn, other studies conducted in Denmark in 2003-2012 showed that the VS incidence rate was 22.1 per 1,000,000 person-years [38].
Many authors list unilateral, progressive hearing loss, tinnitus, and transient dizziness as the main symptoms of vestibular schwannoma [2,39,40]. In the present study, only 1 out of 75 patients did not report any symptoms before the diagnosis of VS and it was detected accidentally during MRI after a head injury. In turn, the remaining 74 patients most often reported the following symptoms, which occurred individually or together: unilateral sensorineural hearing loss (60%), tinnitus (66%), and transient dizziness (44%). In research conducted by Żurek et al. it has been shown that women are more predisposed to developing VS (61.46%) [2]. Also in the analyzed study, women constitute a larger proportion of patients (57.33%) than men (42.67%).
Intraoperative hearing monitoring is used to increase the likelihood of hearing preservation during resection of VS through the middle cranial fossa or retrosigmoid approach. Most often, they are performed using ABR or TT-ECochG [8,9,12,13,14,15,17,19,20,22]. The available literature also includes reports on IM using a combination of ABR and CNAP tests [8,10,11,13,16,17,18,20,21,23,25,26,28,30,31] or TT-ECochG and CNAP [8,10,11,13,14,16,17,18,20,21,23,25,26,27,28,29,30,31,32].
The ABR test assesses neuronal conduction in the peripheral part of the auditory pathway and in the brainstem. The test is widely known and non-invasive, that is why it is the most frequently used IM of hearing option during VS resection. However, a significant limitation of the ABR method for IM is the need to average many samples (several hundred repetitions) of the recorded electrophysiological signal to obtain an optimal Signal-to-Noise Ratio (SNR) and thus obtain clear and repeatable responses. ABR testing involves far-field recordings with low-amplitude responses, which is often challenging in the operating room due to the presence of numerous devices generating electromagnetic fields and, consequently, requires an increase in the number of averages to obtain reliable results. Thus, the ABR technique has limited value to provide information about the hearing condition in real time [13,25,30]. Although the ABR technique does not monitor auditory functions in real time and usually at critical moments of the tumor resection it takes about 1 minute (minimum 20-30 seconds) to confirm the hearing status, ABRs reflect responses from the entire auditory pathway. This enables the identification of the "disconnected ear" effect, which is observed in the case of selective damage of the cochlear part of the VIII nerve with the preserved function of the spiral ganglion [12]. Despite the above-mentioned limitations of ABR tests used for IM, they have been the most frequently used method of intraoperative hearing monitoring in recent years [8,9,10,11,12,13,14,15,16,17,18,19,20,23,24,25,26,28,30,31].
Based on research conducted by Yamakami et al., it appears that TT-ECochG more often provides better IM of hearing than ABR. According to their research, during the VS resection, as many as 20 out of 22 patients, representing 91% of the total, had correct responses from IM of hearing with the use of TT-ECochG, while only 9 out of 22 patients (41%) achieved ABR responses [16]. The latency value of wave V from the moment of surgical manipulations in their study was on average 6.94 ms [16], and in the described work 7.35 ms. In the present study, it was also not possible to obtain the latency values of ABR waves I, III and V in all 75 patients. Only waves I and V were identified in all subjects at each of the three stages of surgery (before tumor removal, during and after), while wave III before VS removal was legible and repeatable in 78% of the total, during tumor removal only in 54.67%, while at the end of the procedure it was identifiable in 53.3% of the operated patients. Schlakel et al. also believe that slightly more reliable IM results are obtained using TT-ECochG [9]. These authors showed similar trends in results to ours, showing that the value of the I-V interlatencies at the beginning of the procedure was on average 5.41 ms, and after tumor removal it ranged from 5.96-7.85 ms. In turn, in the analyzed group, the average value of the I-V interlatencies before VS removal was 5.05 ms, and at the end of the operation it extended to 6.42 ms.
A test that helps to solve the problems and limitations of the ABR method during intraoperative hearing monitoring is the recording of auditory potentials from the promontory, i.e. TT-ECochG. This technique, due to the recordings of potentials close to their generation source (near field technique), provides electrophysiological responses that have an amplitude several times higher than ABR, therefore it is much easier to achieve a favorable SNR coefficient to obtain a readable functional potential from the VIII nerve. Since a relatively small number of samples is required to obtain a clear, repeatable, and averaged reading, and responses are sent on average every few seconds (5-6 s), it can be assumed that monitoring using TT-ECochG takes place in real time with minimal time delay [13,21,22]. The intraoperative TT-ECochG test is characterized by high frequency specificity, high sensitivity, and readable responses with a relatively small number of averaged repetitions (64-256). However, since the answers come only from the peripheral parts of the VIII cranial nerve, TT-ECochG is not able to register the so-called "disconnected ear" effect. Schlake et al. report that occasionally TT-ECochG responses were recorded intraoperatively, and postoperative hearing tests revealed that a complete hearing loss occurred in the operated ear [9]. Despite this very rarely observed phenomenon, most authors believe that real-time response registration, high sensitivity to even small changes in auditory functions, as well as the possibility of online analysis make TT-ECochG a very useful tool for IM during otoneurological operations [8,9,11,12,13,17,18,19,21,22]. Therefore, it should be remembered that TT-ECochG provides information only about the auditory nerve and cochlea, therefore its use as the only test is not an optimal IM method. For this reason, it seems more rational to combine at least two electrophysiological test methods to conduct IM [8,11,12,13,16,17,18,21].
In most studies that analyzed individual parameters of the action potential, i.e., amplitude and latency, during intraoperative hearing monitoring, frequently repeated results were observed, namely: after VS resection, the AP amplitude is reduced, and its latency is prolonged [8,11,12,13,16,17,18,21]. Yamakami et al. [16] and Colleti et al. [8] described changes in the morphology of TT-ECochG, i.e. the AP amplitude decreased slightly (by 1 μV), and the latency increased by 0.07 ms. Similar changes were observed by Morawski et al. [22], i.e. the amplitude did not decrease by more than 25% and the latency did not extend beyond 0.2 ms. In a 2016 study analyzing 15 patients, Pobożny et al. [12] described that the AP latency value before tumor removal was 2.15 ms, and at the end of the operation it increased to 2.73 ms. In turn, the amplitude of the action potential decreased from the initial value of 1.94 µV to 1.43 µV. In the currently studied group, this time 75 patients, an extension of the AP latency from 1.92 ms to 2.89 ms after the operation was also demonstrated, as well as a simultaneous decrease in its amplitude before the start of VS removal - 7.93 µV to the value obtained at the end of the operation - 4.94 µV.
In most of the scientific studies conducted, a characteristic common feature of the results is that hearing impairment or complete deafness are common phenomena in patients after the VS removal surgery, even if it was performed with the use of intraoperative hearing monitoring [8,9,10,12,16,22,28,30]. During this type of surgery, the morphology of the ABR or TT-ECochG response may change at different stages of the surgery, which often translates into poor postoperative audiological test results. Schlake et al. in their study, they showed that there was no correlation between postoperative audiological results and the latency values of ABR waves I, III, V. In turn, a highly significant correlation was detected between pre- and postoperative AP latency values with hearing before and after VS removal [9]. The study by Morawski et al. [22] showed a high correlation between intraoperative changes in the morphology of TT-ECochG and the postoperative hearing threshold (R=+0.93; p<0.0001). The analyzed study, using the Spearman’s Test, showed a correlation between changes in the distribution of AAO-HNS hearing classes before and after the surgery and a decrease in the amplitude of the action potential (R=-0.24; p<0.05) and an increase in AP latency relative to the moment of its removal (R=0.26; p<0.05). Changes in the morphology of TT-ECochG and ABR caused by surgical manipulations during tumor removal are a common phenomenon [8,9,10,12,21,28,30]. Particularly precarious moments of the operation are bleeding from the tumor and the need to use bipolar coagulation [16,22,28]. It is also observed that after long-term milling of the internal auditory canal or traction of the auditory nerve during tumor removal, changes in the morphology of the TT-ECochG response occur [8,16,28,30] with a subsequent decrease in the AP amplitude and/or extension of latency [8,12,16,22]. The above translates to substantially poorer audiological results after surgery [11,12,21]. Based on research conducted in 2016 by Pobożny et al. a correlation was detected that with the postoperative extension of AP latency, the hearing threshold deteriorates and the action potential amplitude decreases [12]. Similar results were also obtained in the presented work, as discussed in the Results.
There are many studies dedicated to the preservation of hearing in patients undergoing surgery for VS using intraoperative hearing monitoring. To analyze changes in audiological results and predict hearing preservation after surgery, authors most often use hearing classes according to AAO-HNS [7,10,16,18,20,23,25,43,44], the Garden-Robertson Scale [41] or assess hearing preservation using hearing threshold values PTA equal to or better than 40 dB and a Speech Detection Threshold (SDT) of 70% or better [34]. Many factors influence the preservation of hearing in patients after VS removal surgery. Morawski et al. [11] in their work include: the choice of surgical approach, preoperative hearing threshold not worse than 50 dB HL at 1000 Hz or PTA-4 better than 60 dB HL, as well as speech intelligibility at an intensity of 60 dB SPL not worse than 60%. They mention, among the factors determining postoperative hearing preservation, the size of the tumor and its location in relation to the cerebellopontine angle (smaller tumors, intraductal, less than 20 mm in the long axis allow a greater chance of preserving hearing). Similar observations were also described by Concheri et al. [42]. The use of intraoperative hearing monitoring during surgery also has a tremendous impact on increasing the probability of hearing preservation in patients operated on for VS. Factors influencing postoperative hearing preservation also include age below 50 years, female gender, and the place of tumor origin: the lower or upper vestibular nerve [3,11,42].
In their study Yancey et al. analyzed 130 patients, including 45 patients operated on using the MFA. In 55.6% of patients, hearing was maintained at a useful hearing level (hearing class A/B according to AAO-HNS) [43]. In the analyzed study, after surgery, 32 patients (42.67%) were in hearing classes A and B, and before surgery it was 56 patients (74.67%). In turn, another study [44] showed that 49 out of 50 patients included in the study were classified in hearing classes A and B, and after surgery, 37 of them remained in the same hearing classes. In the presented study, the average hearing threshold for 75 patients before surgery was 25.02 ± 15.53 dB HL, and after surgery it decreased by 30.03 dB HL. Interestingly, in a similar study by the same authors, but in a smaller study group (15 patients), it was also shown that the hearing threshold deteriorated postoperatively by 30.07 dB HL [12]. Kosty et al. analyzed a group of 63 patients operated on for VS through the middle cranial fossa approach. Based on preoperative analysis according to AAO-HNS, 32 (52%) patients were in hearing class A, 15 (24%) were in class B, 9 (14%) were in class C, and only 5 (9%) were in hearing class D. In the postoperative analyses, 5 patients from class D were excluded, so that only those whose hearing was at least at a useful level remained. Of the group of patients from classes A-C, in one from class B postoperative results had improved and the patient was transferred to hearing class A. 18 patients from hearing classes A-C remained in their preoperative classes. In 6 of them their postoperative results worsened by 1 class. However, 24 patients from preoperative hearing classes A-C qualified for hearing class D after surgery. In their opinion, the MFA provides good control during the removal of the VS, facial nerve and VIII nerve, which translates into good postoperative hearing preservation results. They believe that even in the case of patients with less useful hearing, they can derive auditory benefits from preserved low frequencies [26]. In the analyzed group of 75 patients operated on due to VS, 47 of them were in hearing class A before the operation, and after VS removal, 23 of them remained in this class. Also, in 1 patient from preoperative hearing class B the audiological results improved after the procedure and allowed to qualify the patient for hearing class A. Seven patients from preoperative hearing classes A-B obtained worse hearing tests results which placed them down 1 class (A->B – 6 people; B->C – 1 person). Interestingly, in 1 patient who qualified for hearing class D before the surgery the results improved by 2 classes after the surgery and the patient was transferred to class B. As we know, the operation to remove VS carries the risk of hearing deterioration or complete hearing loss, even with the use of intraoperative hearing monitoring in 18 patients from hearing class A, after the surgery significantly poorer audiological results were obtained, and thus, they were moved into hearing class D. From the hearing class B - 6 patients moved to class D, and from the preoperative hearing class C - 2 people. Sixteen patients remained in hearing class D after surgery. In the described group, 13 patients completely lost their hearing functions after surgery. Six of them were classified in group A before the operation, 3 of them were in hearing class B, and 4 in class D. Despite different postoperative results, 62 patients (82.67%) have preserved hearing after surgery (hearing classes A-D), and at the level of useful hearing, 33 (44%) of them.
Hearing deterioration or complete hearing loss is one of the most common complications of VS removal surgery [8,9,10,12,13,16,22,23,26,28,30]. Thanks to the continuous development of medicine and bioengineering, patients can receive help in the form of various types of hearing aids. The hearing rehabilitation process is extremely important for all VS patients to improve their hearing, which translates into a better quality of life. Currently, patients after VS removal surgery who have hearing loss or deterioration as a result of the surgery can be provided with numerous methods supporting auditory rehabilitation. Among them, we can distinguish typical hearing aids, hearing aids with Contralateral Routing of Signal (CROS) or Bilateral Contralateral Routing of Signal (BiCROS), Bone-Anchored Hearing Systems (BAHSs) and Cochlear Implants (CI) [45]. Thanks to increasingly new methods and hearing supporting devices, patients after VS surgery, in the event of hearing deterioration, do not have to worry that they have lost it irreversibly. It is important to offer all patients the best possible treatment method for VS and to provide the best possible assistance after surgery in terms of auditory, facial nerve and balance organ rehabilitation.

5. Conclusions

IM of hearing using ABR, TT-ECochG increases the chance of preserving hearing in patients during VS resection. It is worth remembering that despite the use of IM of hearing during VS resection, there is no full guarantee that the hearing will not be affected. Choosing a combination of IM methods as ABR+TT-ECochG as well as good communication between surgeon and audiologist monitoring intraoperatively hearing significantly improve audiological postoperative results since quickly detecting abnormalities in the cochlea, the eight nerve and auditory pathway let avoid irreversible changes. In the last few years, current guidelines have emerged confirming that monitoring the function of the VIII nerve should be used during VS resection when an attempt is made to preserve hearing [7,18].

Author Contributions

Conceptualization, I.P., K.N., K.M. and R.B.; methodology, I.P. and K.M.; software, I.P. and K.M..; validation, I.P., K.N., K.M. and R.B ; formal analysis, K.M. and I.P.; investigation, I.P. and K.M.; resources, I.P., K.N., K.M. and R.B.; data curation, I.P. and K.M.; writing—original draft preparation, I.P., K.N. and K.M.; writing—review and editing, I.P., K.N., K.M. and R.B.; visualization, I.P., K.M.; supervision, K.N., K.M. and R.B.; project administration, I.P., K.N., K.M. and R.B. All authors have read and agreed to the published version of the manuscript.

Funding

This research received no external funding.

Institutional Review Board Statement

The study was reviewed and approved by the local Institutional Ethics Committee (KB/142/2017 and KB/11/A/2019). All patients gave written and informed consent to participate. The research design complies with The Code of Ethics of the World Medical Association (Declaration of Helsinki).

Informed Consent Statement

Informed consent was obtained from all subjects involved in the study.

Data Availability Statement

Dataset available on request from the authors.

Conflicts of Interest

The authors declare no conflicts of interest.

Acknowledgments

We are grateful to Magdalena Szpilman for the linguistic translation of the text.

References

  1. Brackmann, D.; Arriaga, M. ; Differential diagnosis of neoplasmas of the posterior fossa. In Cummings Otolaryngology – Head and Neck Surgery, Ear and cranial base. Publisher: Mosby; 1993; Volume 4, pp. 3271–3291.
  2. Żurek, M.; Wojciechowski, T.; Niemczyk, K. Nationwide clinico-epidemiological treatment analysis of adult patients with tumors of cerebellopontine angle and internal acoustic meatus in Poland during 2011–2020. BMC Public Health 2023, 23, 1735–1745. [Google Scholar] [CrossRef] [PubMed]
  3. AL-Shudifat, A.R.; Kahlon, B.; Höglund, P.; Soliman, A.Y.; Lindskog, K.; Peter Siesjo, P. Age, gender and tumour size predict work capacity after surgical treatment of vestibular schwannomas. J Neurol Neurosurg Psychiatry 2014, 85, 106–111. [Google Scholar] [CrossRef] [PubMed]
  4. Eldridge, R.; Parry, D. Vestibular schwannoma (acoustic neuroma). Consensus development conference. Neurosurgery. 1992, 30, 962–964. [Google Scholar] [PubMed]
  5. Arthurs, B.J.; Fairbanks, R.K.; Demakas, J.J.; Lamoreaux, W.T.; Giddings, N.A.; Mackay, A.R.; Cooke, B.S.; Elaimy, A.L.; Lee, Ch.M. A review of treatment modalities for vestibular schwannoma. Neurosurg Rev. 2011, 34, 265–77. [Google Scholar] [CrossRef] [PubMed]
  6. Gupta, V.K.; Thakker, A.; Gupta, K.K. Vestibular Schwannoma: What We Know and Where We are Heading. Head and Neck Pathology 2020, 14, 1058–1066. [Google Scholar] [CrossRef] [PubMed]
  7. Goldbrunner, R.; Weller, M.; Regis, J.; Lund-Johansen, M.; Stavrinou, P.; Reuss, D.; Evans, G. , Florence Lefranc.; Kita Sallabanda et al. EANO guideline on the diagnosis and treatment of vestibular schwannoma. Neuro Oncol 2020, 22, 31–45. [Google Scholar] [CrossRef] [PubMed]
  8. Colletti, V.; Fiorino, F.G.; Mocella, S.; Policante, Z. ECochG, CNAP and ABR monitoring during vestibular Schwannoma surgery. Audiology. 1998, 37, 27–37. [Google Scholar] [CrossRef] [PubMed]
  9. Schlake, H.P.; Milewski, C.; Goldbrunner, R.H.; et al. Combined intra-operative monitoring of hearing by means of auditory brainstem responses (ABR) and transtympanic electrocochleography (ECochG) during surgery of intra- and extrameatal acoustic neurinomas. Acta Neurochir. 2001, 143, 985–995. [Google Scholar] [CrossRef] [PubMed]
  10. Danner, C.; Mastrodimos, B.; Cueva, R.A. A comparison of direct eighth nerve monitoring and auditory brainstem response in hearing preservation surgery for vestibular schwannoma. Otol Neurotol. 2004, 25, 826–832. [Google Scholar] [CrossRef]
  11. Morawski, KF.; Hryciuk, A.; Morawski, R.; Niemczyk, K. Wstęp do elektrofizjologii klinicznej obwodowej części narządu słuchu. Pol Otorhino Rev. 2012, 1, 51–57. [Google Scholar] [CrossRef]
  12. Pobożny, I.; Morawski, K.; Pierchała, K.; Bartoszewicz, R.; Niemczyk, K. Prognostic value of ABR-ECochG intraoperative morphology changes in term of hearing preservation in patients with vestibular schwannoma. Pol Otorhino Rev. 2016, 5, 15–23. [Google Scholar]
  13. Battista, R.A.; Wiet, R.J.; Paauwe, L. Evaluation of three intraoperative auditory monitoring techniques in acoustic neuroma surgery. Am J Otol. 2000, 21, 244–248. [Google Scholar] [CrossRef] [PubMed]
  14. Moller, A.R.; Jannetta, P.J. Compound action potentials recorded intracranially from the auditory nerve in man. Exp Neurol. 1981, 74, 862–874. [Google Scholar] [CrossRef] [PubMed]
  15. Moller, A.R.; Jannetta, P.; Moller, M.B. Intracranially recorded auditory nerve response in man. New interpretations of BSER. Arch Otolaryngol. 1982, 108, 77–82. [Google Scholar] [CrossRef] [PubMed]
  16. Yamakami, I.; Yoshinori, H.; Saeki, N.; Wada, M.; Oka, N. Hearing preservation and intraoperative auditory brainstem response and cochlear nerve compound action potential monitoring in the removal of small acoustic neurinoma via the retrosigmoid approach. J Neurol Neurosurg Psychiatry. 2009, 80, 218–227. [Google Scholar] [CrossRef] [PubMed]
  17. Youssef, A.S.; Downes, A.E. Intraoperative neurophysiological monitoring in vestibular schwannoma surgery: advances and clinical implications. Neurosurg Focus 2009, 27, E9. [Google Scholar] [CrossRef] [PubMed]
  18. Oh, T.; Nagasawa, D.T.; Fong, B.M.; Trang, A.; Quinto n Gopen, Parsa, A. Yang, I. Intraoperative neuromonitoring techniques in the surgical management of acoustic neuromas. Neurosurg Focus 2012, 33, E6. [Google Scholar] [CrossRef] [PubMed]
  19. Matsushima, K.; Kohno, M. Intraoperative Neuromonitoring in Vestibular Schwannoma Surgery. No Shinkei Geka 2023, 51, 490–499. [Google Scholar]
  20. Silverstein, H.; McDaniel, A.; Norrell, H.; Haberkamp, T. Hearing preservation after acoustic neuroma surgery with intraoperative direct eighth cranial nerve monitoring: Part II. A classification of results. Otolaryngol Head Neck Surg. 1986, 95(3 Pt 1) Pt 1, 285–291. [Google Scholar] [CrossRef]
  21. Pobożny, I.; Lachowska, M.; Bartoszewicz, R.; Niemczyk, K. Detailed insight into transtympanic electrocochleography (TT-ECochG) and direct cochlear nerve action potential (CNAP) for intraoperative hearing monitoring in patients with vestibular schwannoma – methodology of measurements and interpretation of results. Otolaryngol Pol 2020, 74, 1–8. [Google Scholar] [CrossRef]
  22. Pobożny, I.; Morawski, K.; Pierchała, K.; Bartoszewicz, R.; Niemczyk, K. Prognostic value of ABR-ECochG intraoperative morphology changes in term of hearing preservation in patients with vestibular schwannoma. Pol Otorhino Rev. 2016, 5, 15–23. [Google Scholar]
  23. Sun, D.Q.; Sullivan, C.; Kung, R.W.; Asklof, M.; Hansen, M.R.; Gantz, B.J. How Well Does Intraoperative Audiologic Monitoring Predict Hearing Outcome During Middle Fossa Vestibular Schwannoma Resection? Otology & Neurotology 2018, 39, 908–915. [Google Scholar]
  24. Abou-Al-Shaar, H.; Abunimer, A.M.; Whit, T.G.; Dehdashti, A.R. Hearing preservation after removal of small vestibular schwannomas: the role of ABR neuromonitoring. Acta Neurochirurgica 2019, 161, 85–86. [Google Scholar] [CrossRef] [PubMed]
  25. Saliba, J.; Friedman, R.A.; Cueva, R.A. Hearing Preservation in Vestibular Schwannoma Surgery. J Neurol Surg B 2019, 80, 149–155. [Google Scholar] [CrossRef] [PubMed]
  26. Kosty, J.A.; Stevens, S.M.; Gozal, Y. M,; DiNapoli, Aatel V.; et al. Middle Fossa Approach for Resection of Vestibular Schwannomas: A Decade of Experience. Middle Fossa Approach for Resection of Vestibular Schwannomas: A Decade of Experience. Operative Neurosurgery 2019, 16, 147–158. [Google Scholar] [CrossRef] [PubMed]
  27. Roberson, J.; Senne, A.; Brackmann, D.; Hitselberger, W.E.; Saunders, J. Direct cochlear nerve action potentials as an aid to hearing preservation in middle fossa acoustic neuroma resection. Am J Otol. 1996, 17, 653–657. [Google Scholar] [PubMed]
  28. Colletti, V.; Bricolo, A.; Fiorino, F.G.; Bruni, L. Changes in directly recorded cochlear nerve compound action potentials during acoustic tumor surgery. Skull Base Surg. 1994, 4, 1–9. [Google Scholar] [CrossRef] [PubMed]
  29. Cueva, R.A.; Morris, G.F.; Prioleau, G.R. Direct cochlear nerve monitoring: first report on a new atraumatic, self-retaining electrode. Am J Otol. 1998, 19, 202–207. [Google Scholar] [PubMed]
  30. Aihara, N.; Murakami, S.; Watanabe, N.; et al. Cochlear nerve action potential monitoring with the microdissector in vestibular schwannoma surgery. Skull Base. 2009, 19, 325–332. [Google Scholar] [CrossRef]
  31. Ishikawa, M.; Kojima, A.; Terao, S.; Nagai, M.; Kusaka, G.; Naritaka, H. Cochlear Nerve Action Potential Monitoring for Preserving Function of an Unseen Cochlear Nerve in Vestibular Schwannoma Surgery. World Neurosurg, 1: 106, 2017; 106:1057, e1051–1057. [Google Scholar]
  32. Hochet, B.; Daoudi, H.; Lefevre, E.; Nguyen, Y.; Bernat, I.; Sterkers, O.; Lahlou, G. and Michel Kalamarides. Monitoring Cochlear Nerve Action Potential for Hearing Preservation in Medium/Large Vestibular Schwannoma Surgery: Tips and Pitfalls. J. Clin. Med. 2023, 12, 6906. [Google Scholar] [CrossRef]
  33. Koos, W.T.; Day, J.D.; Matula, C.; Levy, D.I. Neurotopographic considerations in the microsurgical treatment of small acoustic neurinomas. J Neurosurg. 1998, 88, 506–512. [Google Scholar] [CrossRef] [PubMed]
  34. Matthies, C.; Samii, M. Management of vestibular schwannomas (acoustic neuromas): the value of neurophysiology for evaluation and prediction of auditory function in 420 cases. Neurosurgery. 1997, 40, 919–929. [Google Scholar] [CrossRef]
  35. Committee on Hearing and Equilibrium: Committee on Hearing and Equilibrium guidelines for the evaluation of hearing preservation in acoustic neuroma (vestibular schwannoma). Otolaryngol Head Neck Surg. 1995, 113, 179–180. [CrossRef]
  36. Silk, P.S.; Lane, J.I.; Driscoll, C.L. Surgical approaches to vestibular schwannomas: what the radiologist needs to know. Radiographics. 2009, 29, 1955–70. [Google Scholar] [CrossRef]
  37. Larjavaara, S.; Feychting, M.; Sankila, R.; Johansen, S.; Klaeboe, L.; Schüz, Auvinen, A. Incidence trends of vestibular schwannomas in Denmark, Finland, Norway and Sweden in 1987–2007. Br J Cancer. 2011, 105, 1069–75. [Google Scholar] [CrossRef] [PubMed]
  38. Stepanidis, K.; Stepanidis, K.; Kessel, M.; Caye-Thomasen, P.; Sven-Eric. Stangerup Socio-demographic distribution of vestibular schwannomas in Denmark. Acta Otolaryngol. 2014, 134, 551–6. [Google Scholar] [CrossRef]
  39. N. L.B. Thai et al. 2022.
  40. Zanoletti, E.; Concheri, S.; Tealdo, G. , Cazzador, D.; Denaro L.; d’Avella, D.; Mazzoni A. Early surgery and definitive cure in small sporadic vestibular schwannoma. Acta Otorhinolaryngol Ital 2022, 42, 481–486. [Google Scholar] [CrossRef]
  41. Gardner, G.; Robertson, J.H. Hearing preservation in unilateral acoustic neuroma surgery. Ann Otol Rhinol Laryngol 1988, 97, 55–66. [Google Scholar] [CrossRef]
  42. Concheri, S.; Deretti, A.; Tealdo, G.; Zanoletti, E. Prognostic Factors for Hearing Preservation Surgery in Small Vestibular Schwannoma. Audiol Res. 2023, 13, 473–483. [Google Scholar] [CrossRef]
  43. Yancey, K.; Barnett, SL.; Kutz, W.; Isaacson, B.; Wardak, Z.; Micke, B.; Hunter, J.B. Hearing Preservation After Intervention in Vestibular Schwannoma. Otology & Neurotology 2022, 43, e846–e855. [Google Scholar]
  44. Welch, Ch.M.; Mannarelli, G.; Koehler, L.; Telian, S.T. Intraoperative Auditory Brainstem Response Results Predict Delayed Sensorineural Hearing Loss After Middle Cranial Fossa Resection of Vestibular Schwannoma. Otol Neurotol 2021, 42, e771–e778. [Google Scholar] [CrossRef] [PubMed]
  45. Mankekar, G.; Holmes, S. Hearing Rehabilitation in Vestibular Schwannoma. Audiol. Res. 2023, 13, 357–366. [Google Scholar] [CrossRef]
  46. Vivas, E.X.; Carlson, M.L.; Neff, B.A.; et al. Congress of Neurological Surgeons Systematic Review and Evidence-Based Guidelines on Intraoperative Cranial Nerve Monitoring in Vestibular Schwannoma Surgery. Neurosurgery 2018, 82, E44–E46. [Google Scholar] [CrossRef] [PubMed]
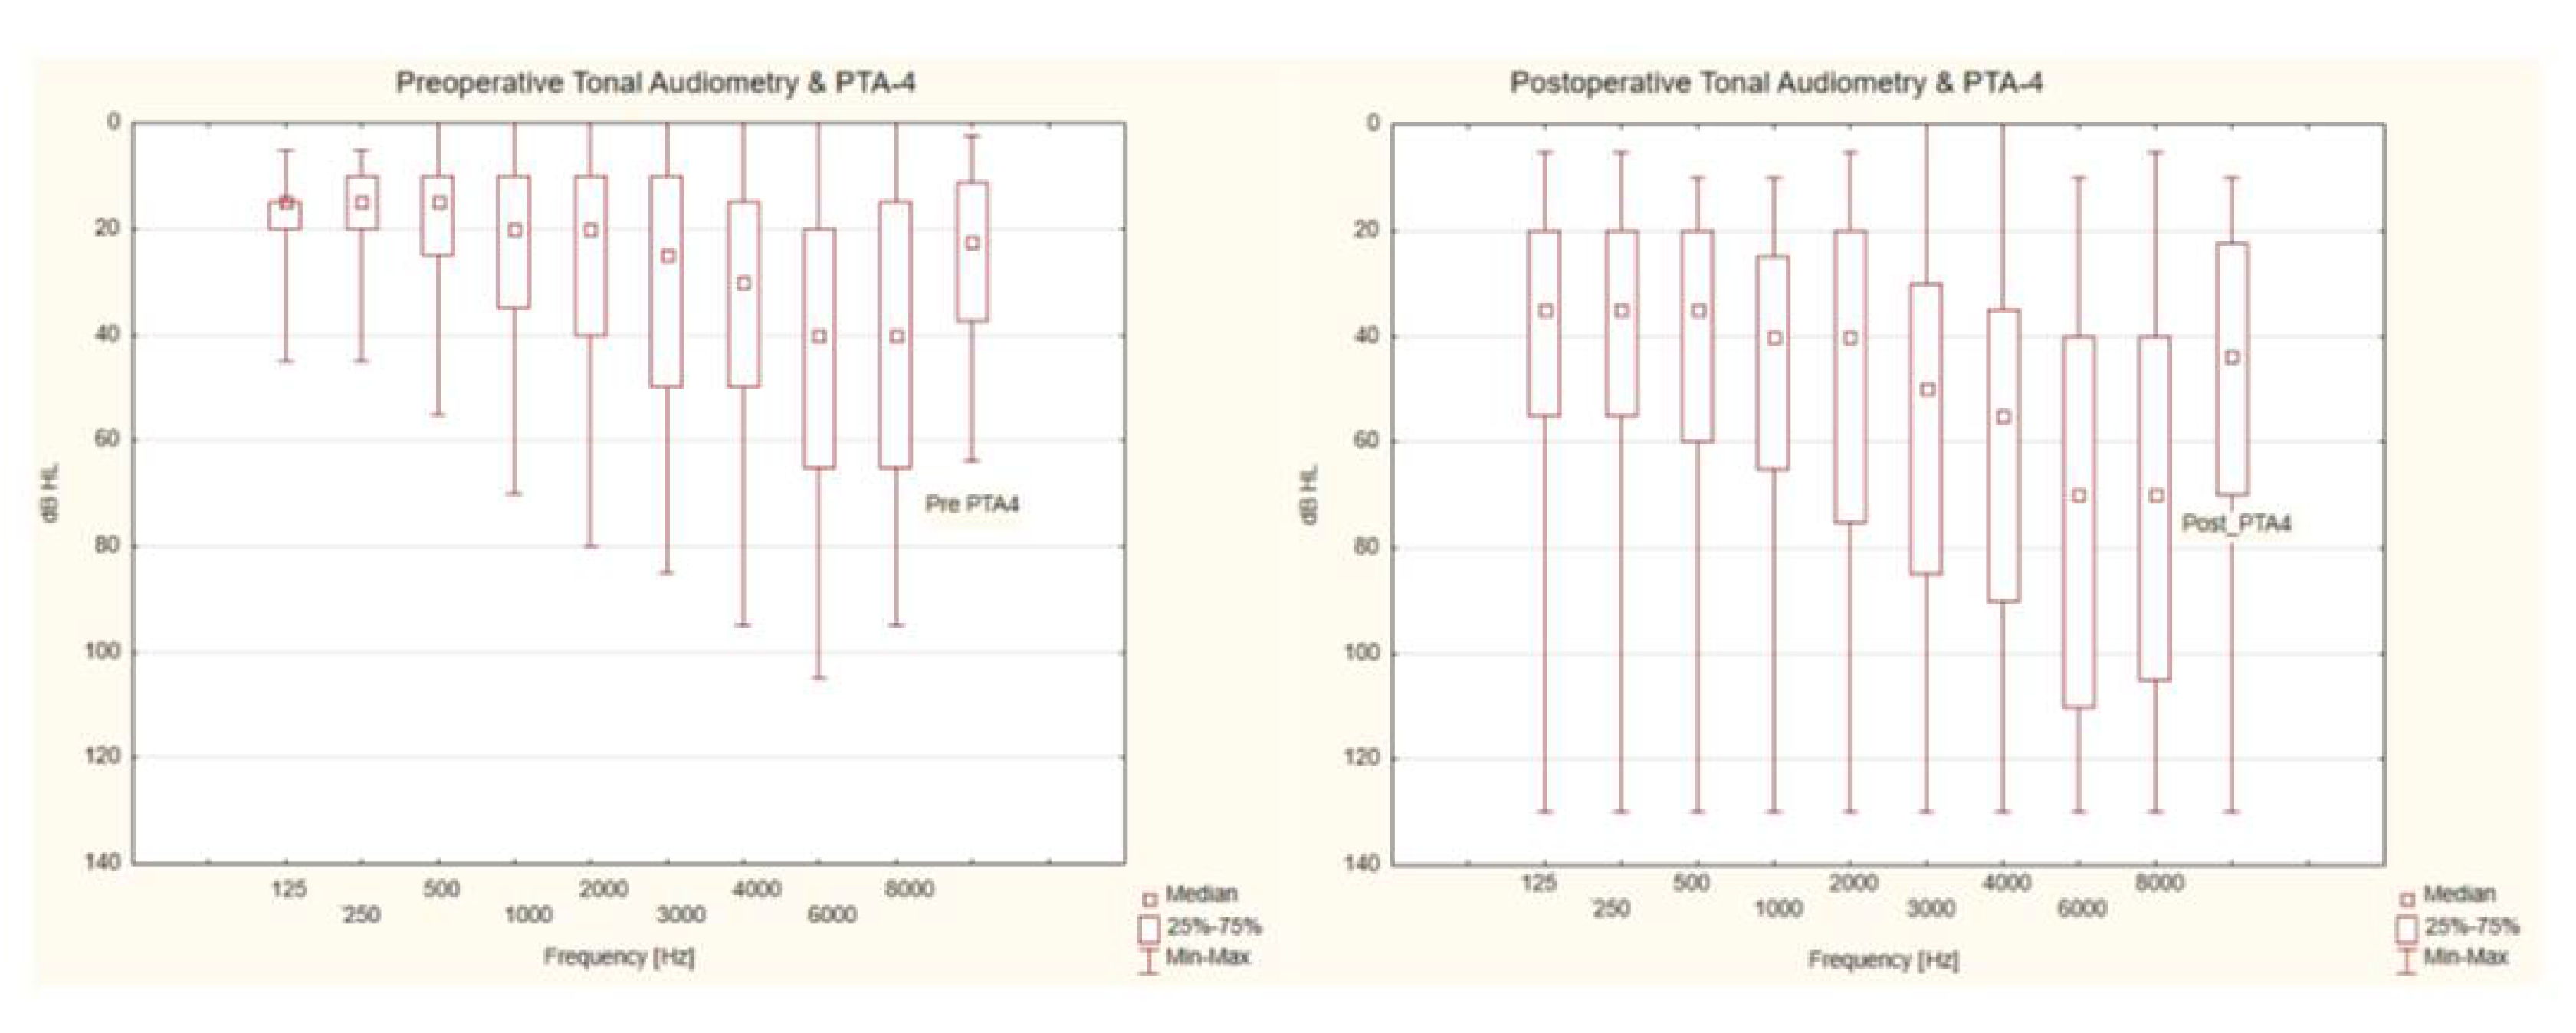
Figure 1. Preoperative and postoperative tonal audiometry as well as pre- and postoperative tonal audiometry calculated in option (0.5kHz+1.0kHz+2.0kHz+3.0kHz)/4)(PTA-4). dB HL: decibel hearing level; Hz: Hertz; PTA-4: tonal audiometry calculated in option (0.5kHz+1.0kHz+2.0kHz+3.0kHz)/4).
Preprints 109536 g001
Figure 2. Correlation between American Academy of Otolaryngology-Head and Neck Surgery Hearing Classification (difference between post- and preoperative hearing category) and intraoperative changes of parameters describing transtympanic electrocochleography parameters (action potential latency and amplitude) during three stages of the surgery. AAO-HNS: American Academy of Otolaryngology-Head and Neck Surgery; ms: milliseconds; AP_Lat: action potential latency; AP_Amp: action potential amplitude; Post-Intra: difference between the results after and during surgery; Post-Pre: difference between the results after and before surgery.
Preprints 109536 g002
Figure 3. Correlation between auditory brainstem responses interlatencies I-V and action potential latency changes during vestibular schwannoma resection calculated in various options: Intra–Pre; Post–Intra and Post–Pre. ABR I-V: auditory brainstem responses interlatencies I-V; AP_Latency: action potential latency; ms: milliseconds; Intra-Pre: difference between the results during and before surgery; Post-Intra: difference between the results after and during surgery; Post-Pre: difference between the results after and before surgery.
Preprints 109536 g003
Table 1. Results of descriptive statistical analyzes for tonal audiometry calculated in formula (0.5kHz+1.0kHz+2.0kHz+3.0kHz)/4)(PTA-4) and speech audiometry presented at an intensity of 60 dB SPL obtained before and after surgery in 75 patients included in the study.
Preprints 109536 i001
Table 2. Hearing classes according to the American Academy of Otolaryngology-Head and Neck Surgery Hearing Classification for the tonal audiometry calculated in option (0.5kHz+1.0kHz+2.0kHz+3.0kHz)/4)(PTA-4) and speech discrimination (60 dB SPL) obtained in pre- and postoperative hearing tests in 75 patients operated for the vestibular schwannoma through the middle fossa approach.
Preprints 109536 i002
AAO-HNS: American Academy of Otolaryngology-Head and Neck Surgery; PTA-4: tonal audiometry calculated in option (0.5kHz+1.0kHz+2.0kHz+ 3.0kHz)/4); Pre: before surgery; Post: after surgery.
Table 3. Latencies of waves I, III, V and interlatencies I-III, III-V, I-V of auditory brainstem responses and values of action potential latency and amplitude of transtympanic electrocochleography obtained at the beginning, during and at the end of the surgery of the vestibular schwannoma resection through the middle fossa approach.
Preprints 109536 i003
ABR: auditory brainstem responses; TT-ECochG: transtympanic electrocochleography; ABR I/III/V: auditory brainstem responses latencies of wave I/III/V; ABR I-III/III-V/I-V: auditory brainstem responses interlatencies I-III/III-V/I-V; ms: milliseconds; µV: millivolts; Pre: before surgery; Intra: during surgery; Post: after surgery; Intra-Pre: difference between the results during and before surgery (for ABR/TT-ECochG, a positive value – prolongation of latency/interlatencies value/s; negative – reduction of latency/interlatencies value/s; for TT-ECochG - a positive value - increasing of amplitude; negative - decreasing of amplitude); Post-Pre: difference between the results after and before surgery; Post-Intra: difference between the results after and during surgery; (*): statistically significant; N: total number of research group; Ave: average (mean); Med: median; Range: min-max; Q1-Q3: First Quartile-Third Quartile; SD: standard deviation.
Table 4. The Spearman Test revealing correlations performed between intraoperative transtympanic electrocochleography parameters (action potential latency and amplitude) measured in three stages of the surgery (Pre-, Intra- and Post- vestibular schwannoma resection) and postoperation hearing worsening evaluated according to American Academy of Otolaryngology-Head and Neck Surgery Hearing Classification in 75 patients included in the study.
Preprints 109536 i004
AAO-HNS: American Academy of Otolaryngology-Head and Neck Surgery; TT-ECochG: transtympanic electrocochleography; AP_Lat: action potential latency; AP_Amp: action potential amplitude; Intra-Pre: difference between the results during and before surgery; Post-Intra: difference between the results after and during surgery; Post-Pre: difference between the results after and before surgery; N: total number of research group; statistical analyses were performed using the Spearman Test.
Table 5. Correlations between audiological tests performed before and after surgery and intraoperatively measured auditory brainstem responses and transtympanic electrocochleography parameters action potential latency and amplitude measured in three stages of the surgery (Pre-, Intra- and Post- vestibular schwannoma resection) and hearing postoperative worsening evaluated according to American Academy of Otolaryngology-Head and Neck Surgery Hearing Classification.
Preprints 109536 i005
ABR: auditory brainstem responses; TT-ECochG: transtympanic electrocochleography; ABR I-V: auditory brainstem responses interlatencies I-V; diff: difference; AP_Latency: action potential latency; AP_Amp: action potential amplitude; PTA-4: tonal audiometry calculated in option (0.5kHz+1.0kHz+2.0kHz+ 3.0kHz)/4); SA: speech audiometry; AAO-HNS: American Academy of Otolaryngology-Head and Neck Surgery; dB SPL: decibel sound pressure level; Intra-Pre: difference between the results during and before surgery; Post-Intra: difference between the results after and during surgery; Post-Pre: difference between the results after and before surgery; N: total number of research group; statistical analyses were performed using the Spearman Test.
Disclaimer/Publisher’s Note: The statements, opinions and data contained in all publications are solely those of the individual author(s) and contributor(s) and not of MDPI and/or the editor(s). MDPI and/or the editor(s) disclaim responsibility for any injury to people or property resulting from any ideas, methods, instructions or products referred to in the content.
Copyright: This open access article is published under a Creative Commons CC BY 4.0 license, which permit the free download, distribution, and reuse, provided that the author and preprint are cited in any reuse.
Alerts
Prerpints.org logo

Preprints.org is a free preprint server supported by MDPI in Basel, Switzerland.

Subscribe

© 2025 MDPI (Basel, Switzerland) unless otherwise stated