
You are currently viewing a beta version of our website. If you spot anything unusual, kindly let us know.
Preprint
Article
Hybrid Energy Optimization for Efficient Distributed Energy Resources Management in Green Building Environment
Altmetrics
Downloads
76
Views
27
Comments
0
A peer-reviewed article of this preprint also exists.


This version is not peer-reviewed
Abstract
Without an established energy management plan, human lifestyle improvement is incomprehensible. Adequate energy assets are the key to human lifestyle development, however, energy assets are restricted and exorbitant too. In this paper, an energy control system for a green environment called PMC (Power Management and Control) is proposed. The system is based on hybrid energy optimization, energy prediction, and multi-preprocessing. The blend of GA (Genetic Algorithm) and PSO (Particle Swarm Optimization) is utilized to make a fusion methodology to improve occupant comfort index (OCI) and decrease energy utilization. The main theme of the proposed PMC technique is to improve OCI and decrease energy utilization. The proposed framework gives better OCI when compared with its counterpart Ant Bee Colony along with Knowledge Base framework (ABCKB), GA-based prediction framework (GAP), Hybrid Prediction with Single Optimization framework (SOHP), and PSO-based power consumption framework. Compared with the existing AEO framework, the proposed PMC methodology gives practically the same OCI, but consumes less energy. The proposed PMC methodology additionally accomplished the most extreme OCI (i-e 1) when compared with the existing model FA-GA (i-e 0.98). The proposed PMC model consumed less energy as compared to existing models ABCKB, GAP, PSO and AEO. The proposed model consumed more energy than SOHP but provided better OCI. The comparative outcomes show the viability of the proposed PMC framework in lessening energy utilization and improving the OCI. Unlike other existing mythologies except for the AEO framework, the proposed PMC technique is additionally confirmed through a simulated climate by controlling indoor climate using actuators, like Fan, light, AC and boiler.
Keywords:
Subject: Computer Science and Mathematics - Computer Science
1. Introduction
The two prime design goals in the upcoming smart building sector are the user’s comfort and energy management. The cradle cause is that power consumption utilization rises every day due to enormous growth in domestic applications while its homes of peers are restricted and inflated as well. The customer plans to utilize minimum power without compromising the OCI which constitutes lightning, air quality and temperature. The essential of little power utilization without disturbing the user’s comfort is an attractive issue for the researchers to manage. This creates a big trade-off between power utilization and user comfort [1,2,3,4,5,6,7,8,9,10]. To grip this compromise, a smart, keen and streamlined power control approach is anticipated to retain power usage and OCI at a functional and good level.
In inhabited sustainable buildings, the important constraints that constitute customers’ prominence of lives are air quality, thermal comfort and visual comfort [11].
Temperature identifies the indoor updraft comfort of the users in smart residential buildings. The cooling and heating scheme is practised to preserve the hotness in the smart building’s comfort zone. The illumination index is considered to identify the optical ease of the users in smart and sustainable buildings [12]. The electrical igniting scheme is used to provide visual comfort in energy-efficient smart buildings. CO2 concentration is considered a measure of an index to quantify the air quality in residential and smart buildings. The ventilation system is considered to preserve low CO2 absorption [13]. Proper arrangement of the environmental parameters serves as the user’s comfort in smart and sustainable residential buildings. We selected the three environmental parameters to assess the user’s comfort and energy efficiency in smart and sustainable residential buildings.
This paper presented, PMC, an up-to-date optimized power consumption and prediction framework, which is based on the combination of PSO and GA for OCI and power saving in conjunction with the application of an emulator to adjust the indoor environment. The proposed PMC model is intelligent and addresses both energy saving and OCI at the same time along with control of the indoor environment. The whole existing study discussed above apart from [1,2,3,4,5,6,7,8,9,10,18] either addressed the consumer’s comfort of the building or utilized minimum power, but did not control both at the same time.
The PMC framework is much better as compared to existing frameworks [3,4,5,9,10]. The proposed PMC framework outperforms the existing GAP framework [3], SOHP framework [4], PSO framework [5], ABCKB framework [9] and FA-GA framework [10] in terms of OCI. The proposed framework is verified via an emulator while the existing framework discussed in [1,2,3,4,5,6,7,9,10,11,12,13,14,15,16,17,18,19] does not.
As compared to the previous AEO model [8], the proposed PMC model is designed in such a way as to achieve better results in terms of its defined goals (Energy consumption reduction without compromising users’ OCI). The proposed PMC model improves the results significantly as compared to the previous AEO model as described below.
First, if we talk about the difference in the architectures, then the main component in the proposed model and the previous AEO model is the optimization component. The proposed PMC framework optimizes the input parameters much better than the existing AEO framework. The reason behind this is that in the previous AEO framework, the input data is optimized simultaneously by both the PSO algorithm and GA algorithm, while in the proposed PMC framework the input data is first optimized by the PSO algorithm and then its output parameters are given to the GA algorithm to refine the selected individuals further and give the resultant optimized output. That is why the proposed PMC framework optimizes the parameters much better and provides optimized values to the next component in the architecture.
Second, in terms of energy consumption, the proposed PMC framework consumed less power in case of temperature consumption as compared to its counterpart AEO-based temperature consumption. Additionally, in the case of Illumination, the proposed PMC framework devoured less power when contrasted with the past AEO framework. Similarly, regarding power utilization in the event of air quality, the proposed PMC framework devoured less power when contrasted with the past AEO framework. The total power devoured by the proposed PMC framework is substantially less than the total power usage of the existing AEO framework. This is a significant difference in terms of power consumption between the two frameworks.
The third achievement in this connection is that in the proposed PMC framework the OCI is not disturbed and achieved its high level of OCI as did in the existing AEO model. This implies that the proposed PMC model decreased energy utilization without compromising users’ OCI which is the fundamental objective set and accomplished by the proposed PMC framework when contrasted with the past AEO framework and other existing frameworks [3,4,5,9,10].
2. Related Work
In the past uncountable mechanisms and tools presented in the field of energy efficiency for ecological buildings, and some well-known optimized energy proficient procedures have been presented for smart inhabited buildings. Frameworks dependent on conventional control issues have been introduced in previous works [14,15,16]. These state-of-the-art controllers cover Proportional Integral Derivative (PID) controllers, optimal energy controllers and adaptive energy controllers. The designer used these controllers to overwhelm the overpass of the temperature. There are some genuine imperfections in these controllers, for example, these controllers need a model of the building under consideration and these controllers are not user-friendly as occupants are not involved in choosing the occupant’s comfort. Different troubles that were seen are checking and observing the parameters that are brought about by nonlinear developments. The control of the interior environment of the building at different zone levels has been presented in [17]. The controller is enhanced and the tenant’s tendencies are seen through a smart card segment.
In the comparative issue area, different control applications frameworks are offered which depend on climate assessment [18,19]. The climate assessment has been judicious in the warming, ventilating and cooling framework. Another plan, which depends on a multi-specialist control strategy with data integration, has been introduced in [20]. The multi-specialist-based energy productive framework presents a building interior power and comfort conservation approach built on data merging using order weighted averaging (OWA) accumulation. The multi-specialist-based model accomplished an extraordinary degree of comfort with the least energy usage.
A few individual, public and building features effectively affect clear comfort in places of office areas. The association amongst these variables are especially diverse, so to improve comprehension of the relationship between these elements a model has been introduced in [21]. A multi-environmental approach is introduced in [22] which is appropriate for a particular region in the building as well as in the entire building. The approach emphasizes OCI to give an improved building climate. The approach additionally allows the assessment of both energy utilization and contaminating effects and considers occupants’ comfort in indoor and open-air climates. Artificial neural networks (ANN) have been presented to streamline and control the power consumption [23]. The neural organization-based framework affirms power efficiency and gives better manoeuvres of solar, wind, and hydrogen energy-based hybrid sustainable independent construction. GA is applied for power effectiveness and saving in various ways, for example, GA is implemented for warming, ventilation and cooling issues [24]. The same technique was rehearsed on the control issues of power frameworks, comprising power modules, warm capacity, and warmth siphons [25].
Energy conservation estimating strategies are classified into twofold curricula. One represents time series information gauging frameworks and the second is power assessment procedures based on ANN. The ANN’s framework which keeps magnificent strength and inaccuracy resistance is a compelling framework to take care of complex nonlinear issues. ANN has gotten consideration from analysts because of its unmistakable model and great presentation in taking care of non-linear issues, however, it is difficult to set up an efficient framework for every building.
Formerly ANN has been implemented for energy prediction in indoor environments [26,27,28,29,30,31,32,33]. These mechanisms often put on a neural organization approach, which encompasses numerous parameters. These parameters are consistently decided by knowledge and the framework turns out to be hard to set up [34]. That is why it is hard to make a framework, which is based on the concept of ANN. Besides, it has also been seen that although the neural network (NN) offers little inaccuracy throughout training, the inaccuracy for testing is normally of a bigger order [35]. At the end of the day, when this procedure is applied in real-world scenarios, the forecast precision is not adequate. In addition, the algorithm is expected to change the characters of the multitude of issues into mathematical numbers and modify every interpretation into mathematical computation. There is no doubt that it causes the deficiency of some data, which affects the precision of the prediction. Even though ANN-based price guessing strategies can likewise be utilized for power estimating, however, its drawbacks argued above for price estimating confine its supplementary implementation for energy forecasting.
A procedure dependent on Hidden Markov Model (HMM) is introduced for estimating energy utilization [36]. The technique performs well when contrasted with fundamental forecast frameworks like classification and regression trees, support vector machine and ANN, however, selection of the best HMM model is a tedious cycle.
Fixed time series methodologies, for example, autoregressive (AR) [37], Dynamic Regression (DR), Transfer Function (TF) [38], and non-fixed time series frameworks like Autoregressive Integrated Moving Average (ARIMA) [39] have been contrived to predict power costs previously. These techniques can likewise be carried out for energy estimation as well. A few techniques integrate ANN and autoregressive models to foresee the thermal comportment of business offices [38]. A procedure dependent on autoregressive with exogenous input is proposed to anticipate a 1-hour ahead building energy load [41]. In most recent energy arcades the series of energy depicts the accompanying features: high recurrence, non-consistent mean and fluctuation, day by day and week after week, month to month, irregularity, schedule impact on the end of the week and public occasions, high unpredictability and high level of uncommon energy usage. It is difficult to estimate energy precisely; therefore; it needs to require special supervision in the event of assessing energy changes. Table 1 shows the notations and their meanings used in this paper.
In the same problem area, some evolutionary procedures are also being utilized for assessment in various fields of study which can also be used for energy forecasting. For example, a strategy called the sunflower optimization technique is utilized for forecasting of circuit-based model known as a proton exchange membrane fuel cell (PEMFC) [42]. The model is utilized to lessen the inaccuracy of the amount of squared of anticipated and genuine yield voltage. Another strategy proposed for the decrease of the amount of the squared mistake for PEMFC is introduced in [41]. The two models accomplished satisfactory outcomes and limited the hole between real parameters and anticipated parameters. A hybrid framework for the optimization of cost is introduced in [44]. The approach accomplished better outcomes when contrasted with existing philosophies. A multi-target optimization technique for the heat siphon issue is proposed in [45]. The model delivers better outcomes.
3. Proposed Hybrid Green Energy Efficient System Model
A. System Model
In Figure 1 we show the proposed upgraded energy efficient system model for energy conservation and proficiency in green building climate. Principally, the real input parameters are handed over to the smoothing segment for preprocessing. Afterward, the smoothed parameters and user set parameters are conceded to PSO based optimization part of the system model to develop optimal parameters (OP). The enhanced OP once more passed to the GA segment to further improve the OP. The enhanced OP are utilized as OCI to assess the green buildings’ indoor environment. The reason behind optimizing the parameters twice is to get a much better comfort index with minimum energy consumption. Then the post-processing is carried out to disseminate, analyze and share the outcomes with the consumers. At this point, the OP are once more preprocessed before it can be progressed to the control component. The fundamental objective to smooth and preprocess at this level is to additionally work on the OP and OCI. The OCI is determined yet again by utilizing refreshed OP to improve OCI. This further develops and improves the occupant’s OCI.
Three fuzzy-dependent controllers are used to update the indoor illumination, air quality and temperature. Each fuzzy regulator takes as input, the error difference between smoothed ecological parameters and refreshed OP.
The agent-based coordinator fine-tuned the energy based on optimal and required power from the fuzzy-based regulators and existing power from the external energy grid source or inside residential energy sources. The agent-based controller performs the duty of coordinator between the fuzzy regulators and the available power of the building. The devoured power is again post-processed and the results are distributed and shared with the consumers.
The indoor consumed power (CP) is then preprocessed and it is forwarded to the forecast segment. Smoothing is performed again at this stage to eradicate any lasting exceptions. In the wake of preprocessing the CP is refreshed with amended and smoothed power usage. At this point refreshed and updated CP is forwarded to the Kalman filter component to foresee energy usage. Towards the end, the post-processing technique is again applied to the predicted power to examine the outcomes and share these outcomes with the consumers. The building actuators got message data (MI) given anticipated power utilization to turn ON/OFF.
3.1. Multi-Processing
The multi-preprocessing is carried out for every primary module to preprocess the input data employing a smoothing technique.
The sensing information is additionally monitored to avoid the anomalies of outliers, empty cell information, abnormal structure of the information and irregularity. In case the information is discovered to be anomalous, then merely eliminates the anomaly’s information, zero cell information and brings the information into a standard structure. At the point when the sensing information becomes handled and in the standard structure, it is formerly forwarded to the next component of the framework called optimization.
After optimization, smoothing is once more carried out to smooth the OP, however, this time provisional smoothing is carried out. Provisional smooth indicates, that if the smooth parameters result in debasing OCI, then those parameters are not contenders to make them smooth, else, the parameters are smooth when it brings about improvement in OCI. After smoothing OP, the refreshed OP further developed the OCI. The inaccuracy covariance between smooth real data and refreshed OP is forwarded to the next component called the fuzzy controller. The process of preprocessing/post-preparing is carried out for each part of the model until the data is reached to be offered over to the actuators.
3.2. Optimization
Steps for parameter optimizations and OCI based on PSO and GA [46].
PSO steps for parameters optimizations and OCI are:
-
Initialization
- Setting constants k max, c1, c2, r1, r2, w0
- Random initialization of particle positions xi Є D in Rn for i = 1…p
- Random initialization of particle velocities
- 0 <= v0i<= v0max for i = 1…p
- Set k = 1
-
Optimize
- Evaluate fki for particle X ik
- If f ik <= f ibest then f ibest = f ik, pi = x ik
- If f ik <= f gbest then f gbest = f ik, pg = xik
- Once the stopping norm is reached then move to step iii
- Revise particle velocity vector vik+1
- Updating particle position vector xik+1
- Increasing i (index for particles). If i > pop then increase k (index for iterations), and after this keep i = 1
- Jump to 2 (i)
- Share outcomes
- Dismiss PSO optimization and get OP.
Vi (k+1) = αVi (k) + m1r1 [Pbest(i)(k)] + m2r2[Gbest(k)-xi(k)]
Xi (k+1) = (xi (k) + Vi (k+1))/2
GA phases for OCI and optimization:
- A randomized initial population is defined
- The objective function is calculated for OCI using “(3)”
- Select the best candidates based on the rank-based selection method.
- ‘One point’ crossover is performed
- We get off-springs after crossover
- Comfort for the off-springs is calculated
- Populations of steps (3) and (5) are combined
- Perform mutation, if mutation criteria meet
- The steps from 1 to 8 are frequently repeated up to the required number of iterations
- Select the best-fitted chromosome, after the arrival of termination criteria.
The parameters are chosen by experimenting with the program for λ times to accomplish optimum output. GA breaks when the maximum number of generations is Ģ met, or no substantial variation is detected in the fitness for µ generations. The maximum size of the population is 100. The single point crossover with 0.9 probability and 0.1 rate of mutation is selected. GA stochastic operators (population size, crossover rate and mutation rate) have been set after running GA for λ times. The investigations are accomplished using Intel(R) Core(TM)i3-2130 3.40 GHz with 8GB RAM. The C # 2012 is used for the simulation. When the GA assessment procedure ends, the finest fitted individuals are selected to get OP and OCI.
3.3. Comfort
The user OCI can be determined Use “(3)” [1]
where “OCI” is the targeted fitness function and the objective is to get the maximal value for this function. It designates the complete OCI and it comprises of illumination, temperature and air quality. The OCI shifts somewhere in the range of ‘0’ and ‘1’. ‘0’ signifies least or least OCI and ‘1’ signifies most noteworthy or greatest OCI. β1, β2 and β3 are the consumer distinct factors which settle any probable conflicts between the three occupant’s comfort factors. β1+β2+β3 = 1 at any time. In “(1)” eT is the inaccuracy variance between OP of cutting-edge energy optimization (temperature in this state) and real sensor temperature. The least inaccuracy variance, the extreme will be the OCI. So it can be deducted here that there is an opposite association between OCI and inaccuracy variance of the parameters (T, L, A). As the inaccuracy variance is the input to the fuzzy regulator which affirms, the less inaccuracy variance, the less will be the CP. So in this angle, OCI has a converse relationship with power utilization. The lower the CP, the more elevated will be the OCI.
OCI = β1 [1-(eT/Tset)2] + β2 [1-(eL/Lset)2] + β3 [1-(eA/Aset)2]
So the OCI relies upon the inaccuracy variance for each of the (T, L A) set points. If the inaccuracy variance for each of the defined set points minimizes, the much better will be the OCI and the other way around. This satisfies our essential design targets to limit the power utilization and progress the OCI.
errL is the inaccuracy variance for illumination between OP and real sensor illumination. errA is the inaccuracy variance for air quality between OP and real sensor air quality. Tset, Lset, and Aset are the user set points of temperature, light and air quality.
3.4. Coordinating Agent
The coordinating agent gets the OP of the building from the fuzzy controllers. The agent then updates the power requirements of the building based on existing energy and optimized required power to accomplish the OCI. The acclimated building power is matched with the required power to achieve the actual power utilization. The resultant power of the agent is then forwarded to the subsequent module known as prediction.
PT(k+1) = PT(k)
PL(k+1) = PL(k)
PA(k+1) = PA(k)
PT(k)+PL(k)+PA(k)=Pavailable(k)
Pavailable ≤ Pmax
Equations “(4)”, “(5)”, and “(6)” are available in [3]. Where total energy is P (k) which is equal to the sum of energy load used for illumination, temperature and air quality. Representation of total available power sources is Pavailable, the maximum power which we are using for input to the building from the grid station or local micro power sources is indicated by Pmax (k).
3.5. Fuzzy Logic Controllers
A mathematician Lotfi Aliasker Zadeh who is a well famous scientist at California University at Berkley [47] introduced the theory of fuzziness.
The OP, real parameters and the change of rate in the parameters can be given as input to the fuzzy logic. The power controllers provide output power based on the membership functions. The resultant output of the fuzzy-based controller(s) is the required energy to control the building lighting, temperature and quality of air.
We set three controllers for temperature, lighting and air quality. The input for the temperature controller is the error difference in optimized parameters and real smooth environmental parameters. Besides this, the error in the rate of change ceT in temperature is also considered as input to the temperature controller for efficiency. The fuzzy logic-based illumination, temperature and air-quality controller’s rules and their corresponding input/output membership functions for each of the three controllers i-e illumination, temperature and air-quality are presented in earlier work [2].
In “(9)”, “(10)” and “(11)” [3] γA, γT, and γL are the increment association with utilized energy P in time k for each of the air quality, temperature and illumination. θ signifies the weight factor to balance the corresponding associations.
The value of θ is in between [0, 1] while “d” represents the fundamental operation power of the ventilator.
γT = θ * PT / K
γL = θ * PL / K
γA = θ * PA / K * d
3.6. Kalman Filter
It is one of the best estimators, which can be used for time series data. Naturally, Kalman filter is a recursive technique so that new quantities can be treated, as they are available to use. This filter tackled the overall problem of prediction by trying to predict the state xЄRn of a discrete-time controlled procedure, which is controlled by the standard linear stochastic difference equation. In “(12)” and “(13)”, the random normal distribution variables mt and nt denote the process and measurement noise correspondingly.
The measurement noise covariance R and process noise covariance Q matrices are altered with each time step. In our case, it is assumed constant. In “(12)”, the matrix A relates the state at the last time step t – 1 to the state at the present step t in the lack of process noise. In general, the value of A may vary with each time step t, but here it is assumed as constant. The matrix P relates the optional control input to the state x. The matrix H in “(13)” relates the state to the measurement zt. In general, the value of H may vary with each time step t, but here it is assumed as constant.
Xt = Ax (t-1) + P + m (t-1)
Zt = Hx (t) + nt
m ~ N(0,Q)
n ~ N(0,R)
3.7. Message Information (MI)
Figure 2 and Figure 3 show message information (MI) to switch on/off the cooler and boiler correspondingly. Assuming the MI value is zero, it implies that the indoor temperature environment and optimal temperature are identical, and the respective actuator ought to be shut down. If the MI value is somewhere in the range of 0 & 3, a particular actuator will be switched on in a slow mood. Assume MI brings about value somewhere in the range of 3 & 6 then the actuator will be switched on in medium mood.
If the MI value is more than 6, then the actuator will be switched on at high speed. Figure 2 shows MI to turn on/off the cooler. Here we can see that MI for air-con brings about a value more than zero between 6hrs to 17hrs, so the air-con for this situation is turned on during all levels between these hours, while for the remainder of the time, air-con remains closed including 6hrs and 16hrs. In Figure 3 we can see that the kettle is turned on between 0hrs to 7hrs and between 15hrs to 23hrs. For the remainder of the time, it is turned off due to either running of air-con or environmental parameters and optimal parameters persist identical which means that the indoor environment is enough comfortable. Figure 4 and Figure 5 show MI’s to switch on/off lights and fan correspondingly. For the light, we can see that the MI value results in the middle of 1 and 17 which implies that the light is switched on throughout 24hrs. The light utilization diminishes as the daylight time shows up and upsurges as the daylight time wraps up. As far as the activation of the fan is concerned in Figure 5, we can see that the MI results in a value more than zero i-e between 0hr to 23hrs, so the fan is switched on throughout 24hrs.
3.8. Switching Regulator
The switching regulator oversees the existing power sources. For instance, if the outer energy source is unfit to transfer adequate energy to the building or if the energy is more expensive, then the framework will shift to the in-home power sources and vice versa.
3.9. Building Devices/Gadgets
The building gadgets are the devices, which utilize the power in an indoor environment. The well-known devices used are AC, which is used to make the indoor environment cool, and the boiler is used to make the indoor atmosphere warm and cooler keeping the palatable things at a suitable and ideal temperature. The sensor gadgets are utilized to record environmental information identified with temperature, enlightenment and air quality. In the proposed framework, the actuators got signals displayed in Figure 2, Figure 3, Figure 4 and Figure 5 respectively.
Every actuator has four levels. Level 0, level 1, level 2 and level 3. Level 0 means turn off, level 1 means turn on at slow speed, level 2 means turn on actuator at medium speed and level 3 means turn it on at high speed.
Every emulator got MI to change its present status inside the residential building. At the point when these actuator emulators get MI then the relevant state is altered to refresh the internal environmental conditions. Control signals characterized in subsection 2.1.7 utilized as MI’s to trigger corresponding actuators at various levels.
4. System Implementation and Result Analysis
Simulink and Matlab have been used for input and output membership function formation. The concrete simulation conceded in C# 2012. End-user preference set points range is Lset = [720, 880] (lux), Tset = [66, 78] (Kelvin) and Aset = [700, 880] (ppm). Figure 6, Figure 7, Figure 8 and Figure 9 describes the comparisons of energy consumption. The X-axis demonstrates the time in minutes, while the Y-axis demonstrates the predicted energy consumption in kilowatts/hours. OCI between 0.0 and 1.0 shows the minimum and maximum user OCI correspondingly.
From the results of Figure 6 it can be observed that in the case of power consumption for temperature, the anticipated PMC framework utilized a smaller amount of power as opposed to the GAP framework [3], PSO-based framework [5] and AEO framework [8]. As environmental disruption occurs, the proposed PMC framework utilises a smaller amount of power by comparing it with the GAP framework [3] and PSO framework [5] where no hybrid optimization and multi-preprocessing are involved. Optimized parameters and controllers achieve a lesser amount of power usage. Power consumption in the case of illumination is presented in Figure 7.
The proposed PMC framework utilized the lowermost power by comparing it with its corresponding GAP framework [3], PSO framework [5], and AEO framework [8]. Figure 8 presents the effect of power consumption in the case of air quality. Here the PMC framework utilized lowermost power as compared to its corresponding GAP framework [3], PSO-based framework [5] and AEO framework [8].
Figure 9 demonstrates the total predicted power usage for the proposed PMC framework, GA-based power consumption prediction with no hybrid optimization and multi-preprocessing framework (GAP) [3], SOHP framework [4], PSO-based optimization framework [5], AEO framework [8] and ABCKB framework [9]. The total consumed power of the proposed PMC framework is much less than its counterpart models [3, 5 and 8]. The proposed optimized PMC framework consumes more power as compared to the SOHP framework [4] and ABCKB framework [9] but provides much better OCI.
The power aggravation first time emerges at 82min. The OCI of the proposed PMC model with prediction and multi-preprocessing goes down to 0.97, which is the same to GA based predicted framework GAP [3]. At the point when second-time power unsettling influence happens, the GAP framework quickly goes down when contrasted with the proposed PMC framework. At the time, 114min proposed PMC framework tarnished to 0.999 when contrasted with 0.992 for the SOHP framework [4] and 0.974 for each of the GAP framework [3], PSO framework [5] and ABCKB framework [9].
Essentially in all instances of debasement in power, the proposed PMC framework offers improved OCI when contrasted with existing methodologies GAP [3], SOHP [4], PSO [5], ABCKB [9] and FA-GA framework [10] where no multi-preprocessing applied. So at whatever point there is an environmental aggravation, the proposed PMC framework recuperates OCI soon when contrasted with existing frameworks [3,4,5,8,9,10].
Figure 10 shows the results of OCI for the proposed PMC framework, ABCKB framework, GAP framework, SOHP framework, AEO framework and PSO framework. The proposed PMC framework gives better and more conspicuous OCI when contrasted with existing frameworks [3,4,5,8,9,10]. The horizontal lines here demonstrate the baseline OCI provided by all frameworks during various intervals.
However, in the proposed PMC model, less power is utilized in contrast with that of the GAP framework, PSO framework and AEO framework, yet the proposed PMC model accomplished extraordinary and better OCI. In existing frameworks, the SOHP framework is much better than the GAP framework, PSO framework, ABCKB framework and FA-GA framework as far as OCI is concerned.
5. Conclusions
In this research paper, a hybrid power optimization and control methodology for OCI and energy conservation using intelligent algorithms GA and PSO in conjunction with multi-preprocessing called PMC is introduced. The paper tends to address both the energy effectiveness and OCI in a green environment. To affirm the user’s contact with the framework, the user’s set points are considered in characterizing the OCI. The distinction of the proposed work is to upsurge OCI according to user preferences and abate energy usage. The proposed PMC framework depends on hybrid energy optimization and multi-preprocessing together with the control of building actuators. The actuators of the building got message data from the proposed PMC framework and worked likewise. The proposed PMC framework utilized hybrid optimization based on GA and PSO techniques to optimise the environmental parameters and afterwards foresee power utilization using Kalman filter. The parameters we improved are temperature, lightning and air quality, which reveal the OCI in a smart environment.
The proposed PMC model is compared with recent existing methodologies GA-based forecast GAP framework [3], SOHP framework [4], PSO framework [5], AEO framework [8], ABCKB framework [9] and FA-GA framework [10]. The proposed optimization and power control PMC framework contributes unique and better OCI when compared with its partners GAP framework [3], SOHP framework [4], PSO framework [5], ABCKB framework [9] and FA-GA framework [10]. The proposed PMC framework additionally accomplished (greatest OCI as 1, average OCI as 0.99 and least OCI as 0.970) when compared with the existing FA-GA framework [10] (greatest OCI as 0.987, average OCI as 0.965, and least OCI as 0.957). The proposed PMC framework devoured substantially less power as compared with its partner GAP framework [3], PSO framework [5] and AEO framework [8]. The PMC framework gives practically the same OCI when compared with the AEO framework [8], however, consumes substantially less power than AEO. Using the proposed PMC power control framework for a smart environment, the building’s indoor environment can be made pleasant according to user-set points. The proposed PMC intelligent methodology is also confirmed through an emulator as compared to existing frameworks [3,4,5,9,10]. For real applications, the PMC framework can be incorporated with the SCADA software of buildings.
In future, we plan to further improve the occupant’s comfort index and minimize energy consumption by applying ensembles of other evolutionary techniques such as Ant Colony Optimization (ACO) with GA, and ACO with PSO.
Author Contributions
Conceptualization, D.K. and S.A.; methodology, S.A.; software, S.A.; validation, D.K. and S.A.; formal analysis, S.A.; investigation, S.A and K.H.; resources, D.K.; data curation, D.K.; writing—original draft preparation, S.A.; writing—review and editing, S.A., K.H., A.k and I.H; visualization, S.A. and A.K.; supervision, D.K.; project administration, D.K.; funding acquisition, D.K. All authors have read and agreed to the published version of the manuscript.
Funding
This work was supported by Institute of Information & communications Technology Planning & Evaluation (IITP) grant funded by the Korea government(MSIT) (No.2021-0-02068, Artificial Intelligence Innovation Hub) and this research was supported by “Regional Innovation Strategy (RIS)” through the National Research Foundation of Korea(NRF) funded by the Ministry of Education(MOE) (2023RIS-009) Corresponding author: Dohyeun Kim (e-mail: kimdh@jejunu.ac.kr)
Acknowledgements
We would like to present a bundle of thanks to the Institute of Information & communications Technology Planning & Evaluation (IITP) grant funded by the Korea government(MSIT) (No.2021-0-02068, Artificial Intelligence Innovation Hub) and this research was supported by “Regional Innovation Strategy (RIS)” through the National Research Foundation of Korea(NRF) funded by the Ministry of Education(MOE) (2023RIS-009) Corresponding author: Dohyeun Kim (e-mail: kimdh@jejunu.ac.kr)
Conflicts of Interest
Authors have no conflict of interest.
References
- Ali, S.; Kim, DH. Optimized power control and comfort management in building environment. FTRA-AIM Advanced IT, Engineering and Management Conference, 2013, pp. 145-146.
- Ali, S.; Kim, D.-H. Effective and Comfortable Power Control Model Using Kalman Filter for Building Energy Management. Wirel. Pers. Commun. 2013, 73, 1439–1453. [CrossRef]
- Ali, S.; Kim, D.-H. Optimized Power Control Methodology Using Genetic Algorithm. Wirel. Pers. Commun. 2015, 83, 493–505. [CrossRef]
- Ali, S.; Kim, D. Enhanced power control model based on hybrid prediction and preprocessing/post-processing. J. Intell. Fuzzy Syst. 2016, 30, 3399–3410. [CrossRef]
- Wang, Z.; Yang, R.; Wang, L. Multi-agent control system with intelligent optimization for smart and energy-efficient buildings. In Proceedings of the IECON 2010—36th Annual Conference on IEEE Industrial Electronics Society, Glendale, AZ, USA, 7–10 November 2010; pp. 1144–1149. [CrossRef]
- Dounis, A.; Caraiscos, C. Advanced control systems engineering for energy and comfort management in a building environment—A review. Renew. Sustain. Energy Rev. 2008, 13, 1246–1261. [CrossRef]
- Wang, Z.; Yang, R.; Wang, L. Multi-agent intelligent controller design for smart and sustainable buildings. In Proceedings of the 2010 IEEE International Systems Conference, San Diego, CA, USA, 5–8 April 2010.
- Ali, S.; Kim, D.-H. Simulation and Energy Management in Smart Environment Using Ensemble of GA and PSO. Wirel. Pers. Commun. 2020, 114, 49–67. [CrossRef]
- Wahid, F.; Ghazali, R.; Ismail, L.H. An Enhanced Approach of Artificial Bee Colony for Energy Management in Energy Efficient Residential Building. Wirel. Pers. Commun. 2018, 104, 235–257. [CrossRef]
- Wahid, F.; Fayaz, M.; Aljarbouh, A.; Mir, M.; Aamir, M.; Imran Energy Consumption Optimization and User Comfort Maximization in Smart Buildings Using a Hybrid of the Firefly and Genetic Algorithms. Energies 2020, 13, 4363. [CrossRef]
- Emmerich, S. J.; Persily, A. K. State-of-the-art review of CO2 demand controlled ventilation technology and application. National Institute of Standards and Technology, Technology Administration, US, Department of Commerce, 2001.
- Levermore, G. J. Building Energy Management Systems: An Application to Heating, Natural Ventilation, Lighting and Occupant Satisfaction, 2nd ed., London, E & FN SPON, 1992.
- Bernard, C.; Guerrier, B.; Rasset-Louerant, M. M. Optimal building energy management. Part II: Control. ASME Journal of Solar Energy Engineering 1982, 114, 13–22. [CrossRef]
- Curtis, P. S.; Shavit, G.; Kreider, K. Neural networks applied to buildings—a tutorial and case studies in prediction and adaptive control. ASHRAE Transactions 1996, 102, 732–737.
- Kolokotsa, D.; Stavrakakis, G.; Kalaitzakis, K.; Agoris, D. Genetic algorithms optimized fuzzy controller for the indoor environmental management in buildings implemented using PLC and local operating networks. Eng. Appl. Artif. Intell. 2002, 15, 417–428. [CrossRef]
- Kusiak, A.; Li, M.; Zhang, Z. A data-driven approach for steam load prediction in buildings. Appl. Energy 2010, 87, 925–933. [CrossRef]
- Široký, J.; Oldewurtel, F.; Cigler, J.; Prívara, S. Experimental analysis of model predictive control for an energy efficient building heating system. Appl. Energy 2011, 88, 3079–3087. [CrossRef]
- Mossolly, M.; Ghali, K.; Ghaddar, N. Optimal control strategy for a multi-zone air conditioning system using a genetic algorithm. Energy 2009, 34, 58–66. [CrossRef]
- Wang, Z.; Wang, L.; Dounis, A.I.; Yang, R. Multi-agent control system with information fusion based comfort model for smart buildings. Appl. Energy 2012, 99, 247–254. [CrossRef]
- Bluyssen, P.M.; Aries, M.; van Dommelen, P. Comfort of workers in office buildings: The European HOPE project. J. Affect. Disord. 2011, 46, 280–288. [CrossRef]
- Marino, C.; Nucara, A.; Pietrafesa, M. Proposal of comfort classification indexes suitable for both single environments and whole buildings. J. Affect. Disord. 2012, 57, 58–67. [CrossRef]
- Yumurtaci, R. Role of Energy Management in Hybrid Renewable Energy Systems: Case Study Based Analysis Considering Varying Seasonal Conditions. Turk. J. Electr. Eng. Comput. Sci. 2013, 21, 1077–1091. [CrossRef]
- Huang, W.; Lam, H. Using genetic algorithms to optimize controller parameters for HVAC systems. Energy Build. 1997, 26, 277–282. [CrossRef]
- Obara, S.; Kudo, K. Multiple-purpose operational planning of fuel cell and heat pump compound system using genetic algorithm. Transaction of the Society of Heating, Air-Conditioning and Sanitary Engineers of Japan 2003, 9, 65–75.
- Radisa, Z. J.; Aleksandra, A. S.; Branislav, D. Z. Ensemble of various neural networks for prediction of heating energy consumption. Energy and Buildings 2015, 94, 189–199. [CrossRef]
- Kangji, Li.; Chenglei, Hu.; Guohai, Liu.; Wenping, Xue. Building’s electricity consumption prediction using optimized artificial neural networks and principal component analysis. Energy and Buildings 2015, 108, 106–113. [CrossRef]
- Betul, B. E.; Aksoy, U. T. Prediction of building energy consumption by using artificial neural networks. Energy and Buildings 2009, 40, 356–362. [CrossRef]
- Wong, S.; Wan, K.K.; Lam, T.N. Artificial neural networks for energy analysis of office buildings with daylighting. Energy and Buildings 2010, 87, 551–557. [CrossRef]
- Melek, Y. Energy-savings predictions for building-equipment retrofits. Energy and Buildings 2008, 40, 2111–2120. [CrossRef]
- Sandels, C.; Widén, J.; Nordström, L.; Andersson, E. Day-ahead predictions of electricity consumption in a Swedish office building from weather, occupancy, and temporal data. Energy Build. 2015, 108, 279–290. [CrossRef]
- Lapedes, R.; Farber, R. Nonlinear signal processing using neural networks: prediction and system modeling, Technical report LA-VR87-2662. Los Alamos, New Mexico: Los Alamos National Laboratory, 1987.
- Jin, X.-B.; Zheng, W.-Z.; Kong, J.-L.; Wang, X.-Y.; Bai, Y.-T.; Su, T.-L.; Lin, S. Deep-Learning Forecasting Method for Electric Power Load via Attention-Based Encoder-Decoder with Bayesian Optimization. Energies 2021, 14, 1596. [CrossRef]
- William, G.; Fu-Kwun W.; Zemenu, E. A.; “Electricity Load and Price Forecasting Using a Hybrid Method Based Bidirectional Long Short-Term Memory with Attention Mechanism Model,” international journal of energy research, 2023. [CrossRef]
- Van, E. R. J. The application of neural network in the forecasting of share prices, Finance and Technology Publishing, 1996.
- Rodriguez, C.; Anders, G. Energy Price Forecasting in the Ontario Competitive Power System Market. IEEE Trans. Power Syst. 2004, 19, 366–374. [CrossRef]
- Ullah, I.; Ahmad, R.; Kim, D. A Prediction Mechanism of Energy Consumption in Residential Buildings Using Hidden Markov Model. Energies 2018, 11, 358. [CrossRef]
- Li, G.; Liu, C.-C.; Mattson, C.; Lawarree, J. Day-Ahead Electricity Price Forecasting in a Grid Environment. IEEE Trans. Power Syst. 2007, 22, 266–274. [CrossRef]
- Hong, Y.-Y.; Lee, C.-F. A neuro-fuzzy price forecasting approach in deregulated electricity markets. Electr. Power Syst. Res. 2005, 73, 151–157. [CrossRef]
- Mustafaraj, G.; Lowry, G.; Chen, J. Prediction of room temperature and relative humidity by autoregressive linear and nonlinear neural network models for an open office. Energy Build. 2011, 43, 1452–1460. [CrossRef]
- Kyungtae, Y.; Rogelio, L.; Pedro, J. M.; Heejin, C. Building hourly thermal load prediction using an indexed ARX model. Energy and Buildings 2012, 54, 225–233. [CrossRef]
- Kim, Y.; Son, H.-G.; Kim, S. Short term electricity load forecasting for institutional buildings. Energy Rep. 2019, 5, 1270–1280. [CrossRef]
- Yuan, Z.; Wang, W.; Wang, H.; Razmjooy, N. A new technique for optimal estimation of the circuit-based PEMFCs using developed Sunflower Optimization Algorithm. Energy Rep. 2020, 6, 662–671. [CrossRef]
- Yang, Z.; Liu, Q.; Zhang, L.; Dai, J.; Razmjooy, N. Model parameter estimation of the PEMFCs using improved Barnacles Mating Optimization algorithm. Energy 2020, 212, 118738. [CrossRef]
- Guo, Y.; Dai, X.; Jermsittiparsert, K.; Razmjooy, N. An optimal configuration for a battery and PEM fuel cell-based hybrid energy system using developed Krill herd optimization algorithm for locomotive application. Energy Rep. 2020, 6, 885–894. [CrossRef]
- Fan, X.; Sun, H.; Yuan, Z.; Li, Z.; Shi, R.; Razmjooy, N. Multi-objective optimization for the proper selection of the best heat pump technology in a fuel cell-heat pump micro-CHP system. Energy Rep. 2020, 6, 325–335. [CrossRef]
- Holland, J. H. Adaptation in natural and artificial systems, Ann Arbor, MI, the University of Michigan Press, 1975.
- Zadeh, L. A. Fuzzy algorithms. Information and Control 1968. 12, 94-102.
Figure 1.
Hybrid energy optimization model.
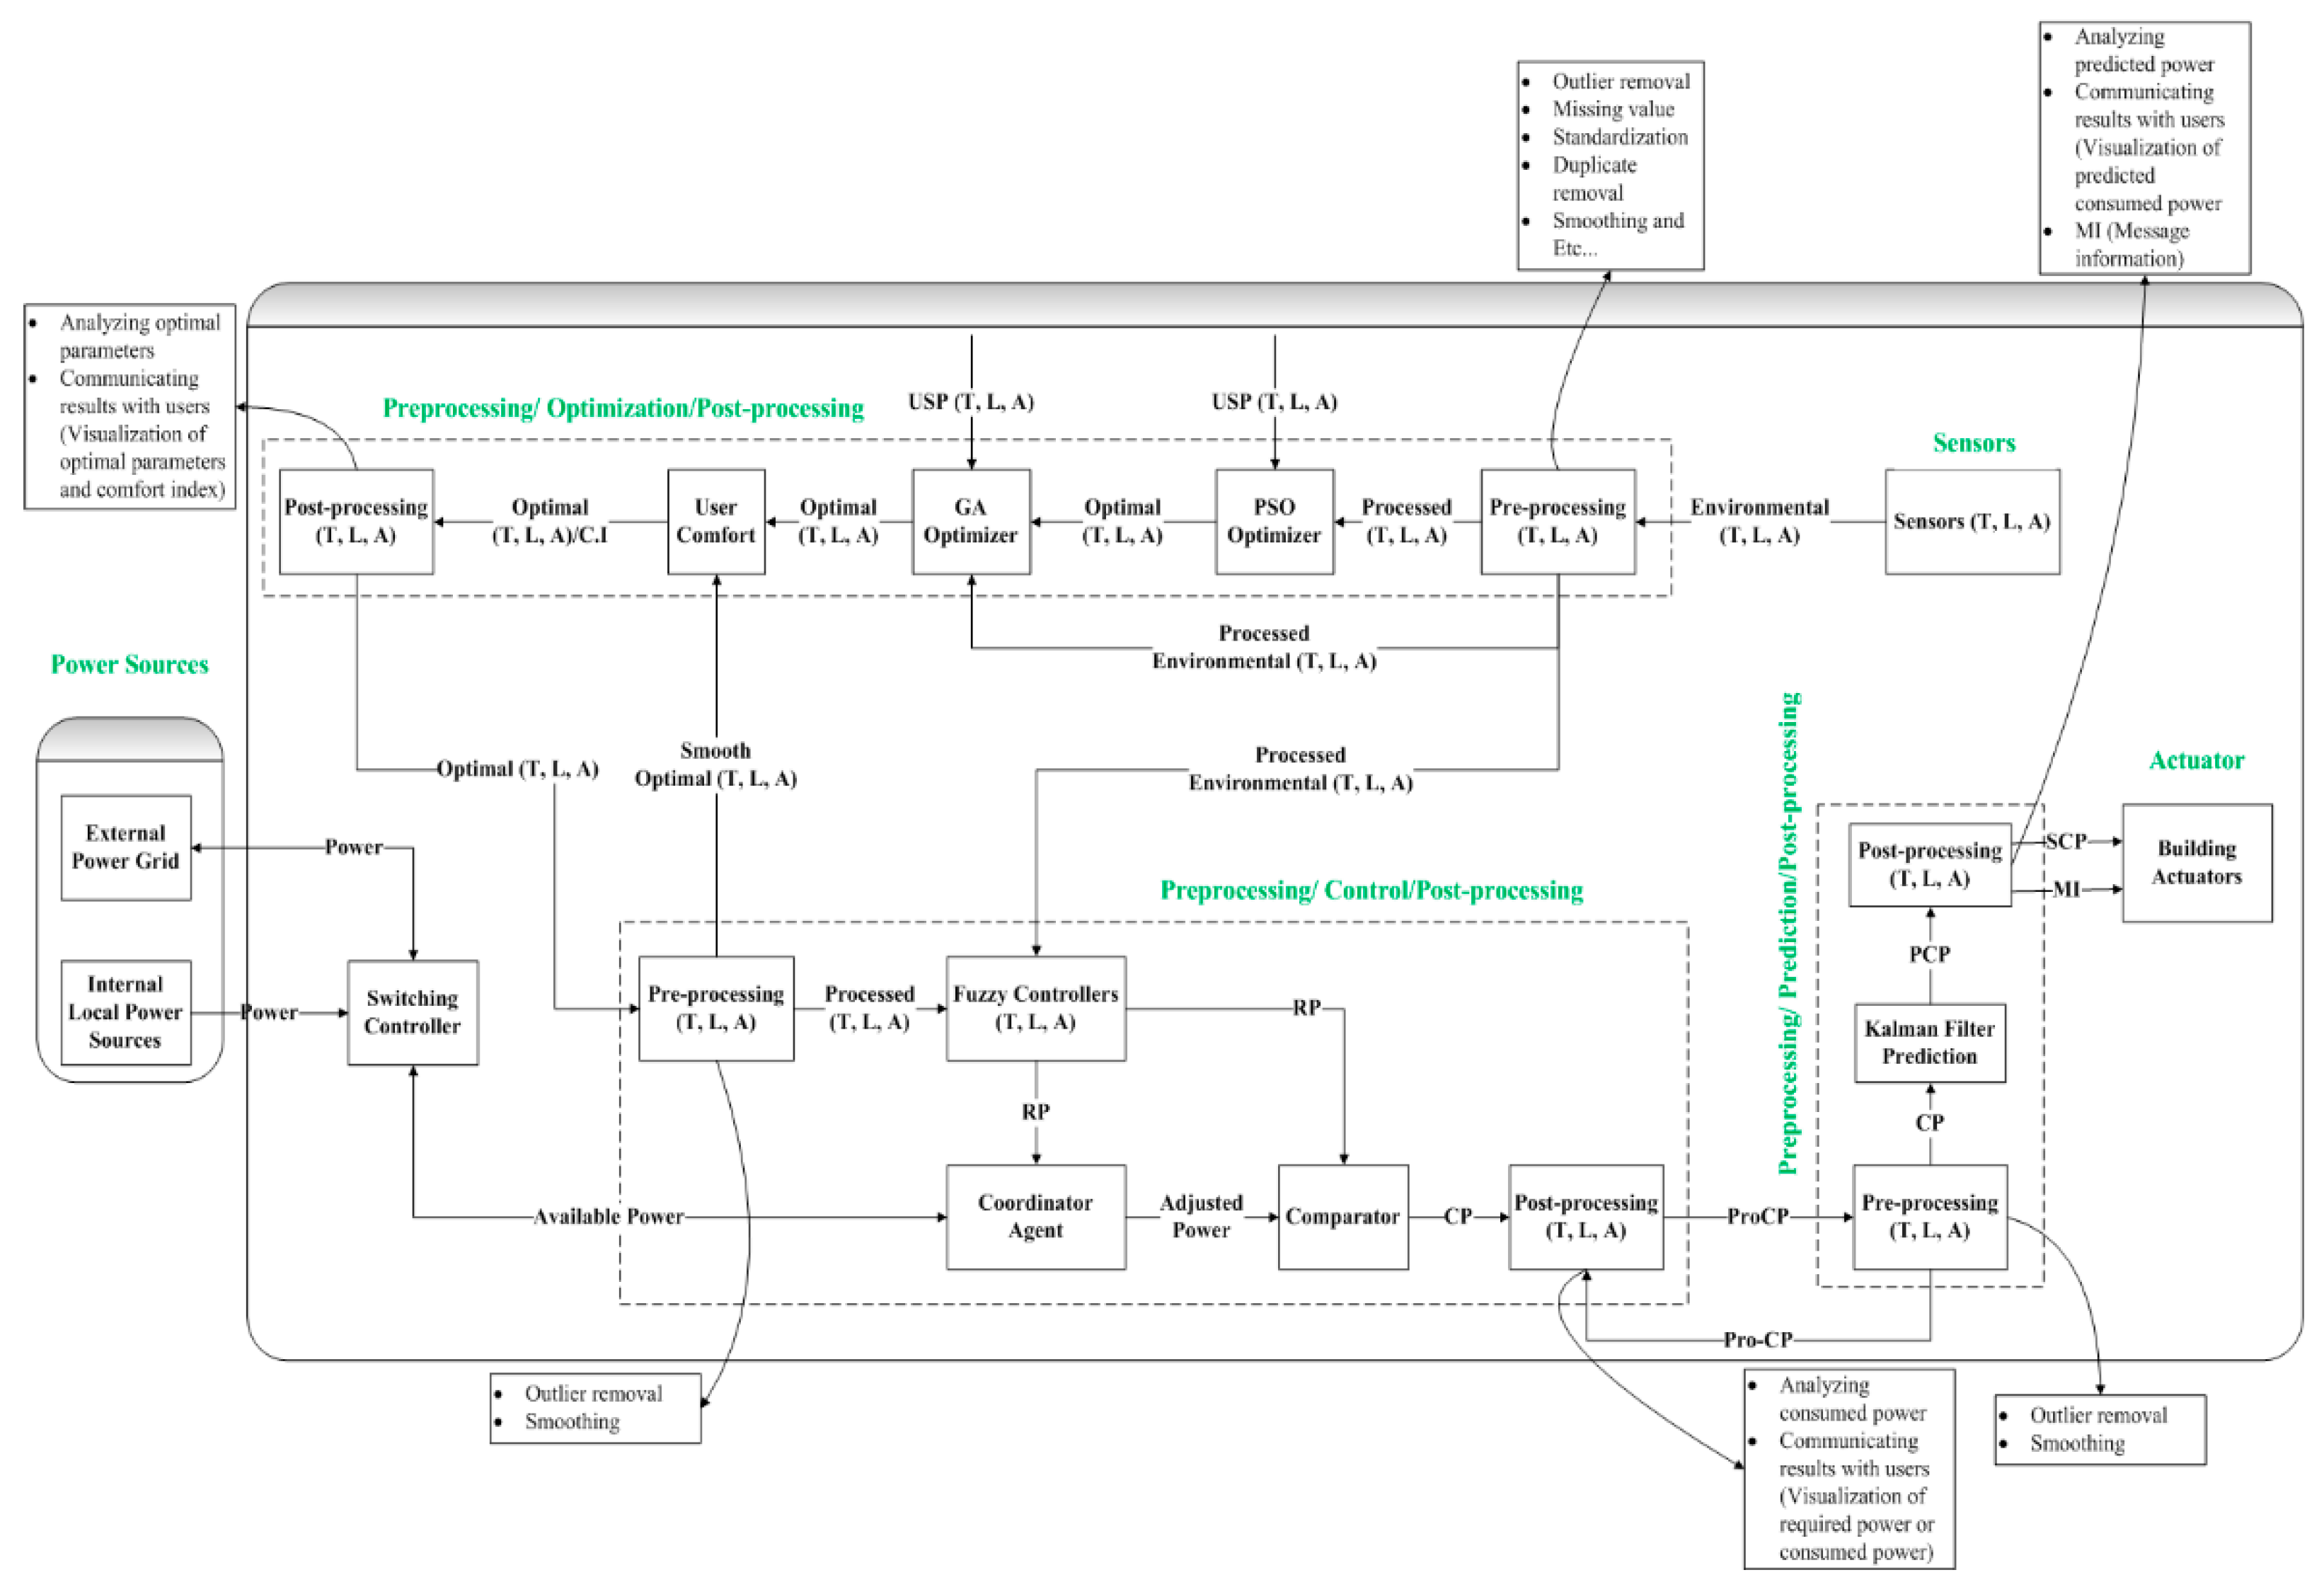
Figure 2.
Control messages for air-con based on the proposed framework.
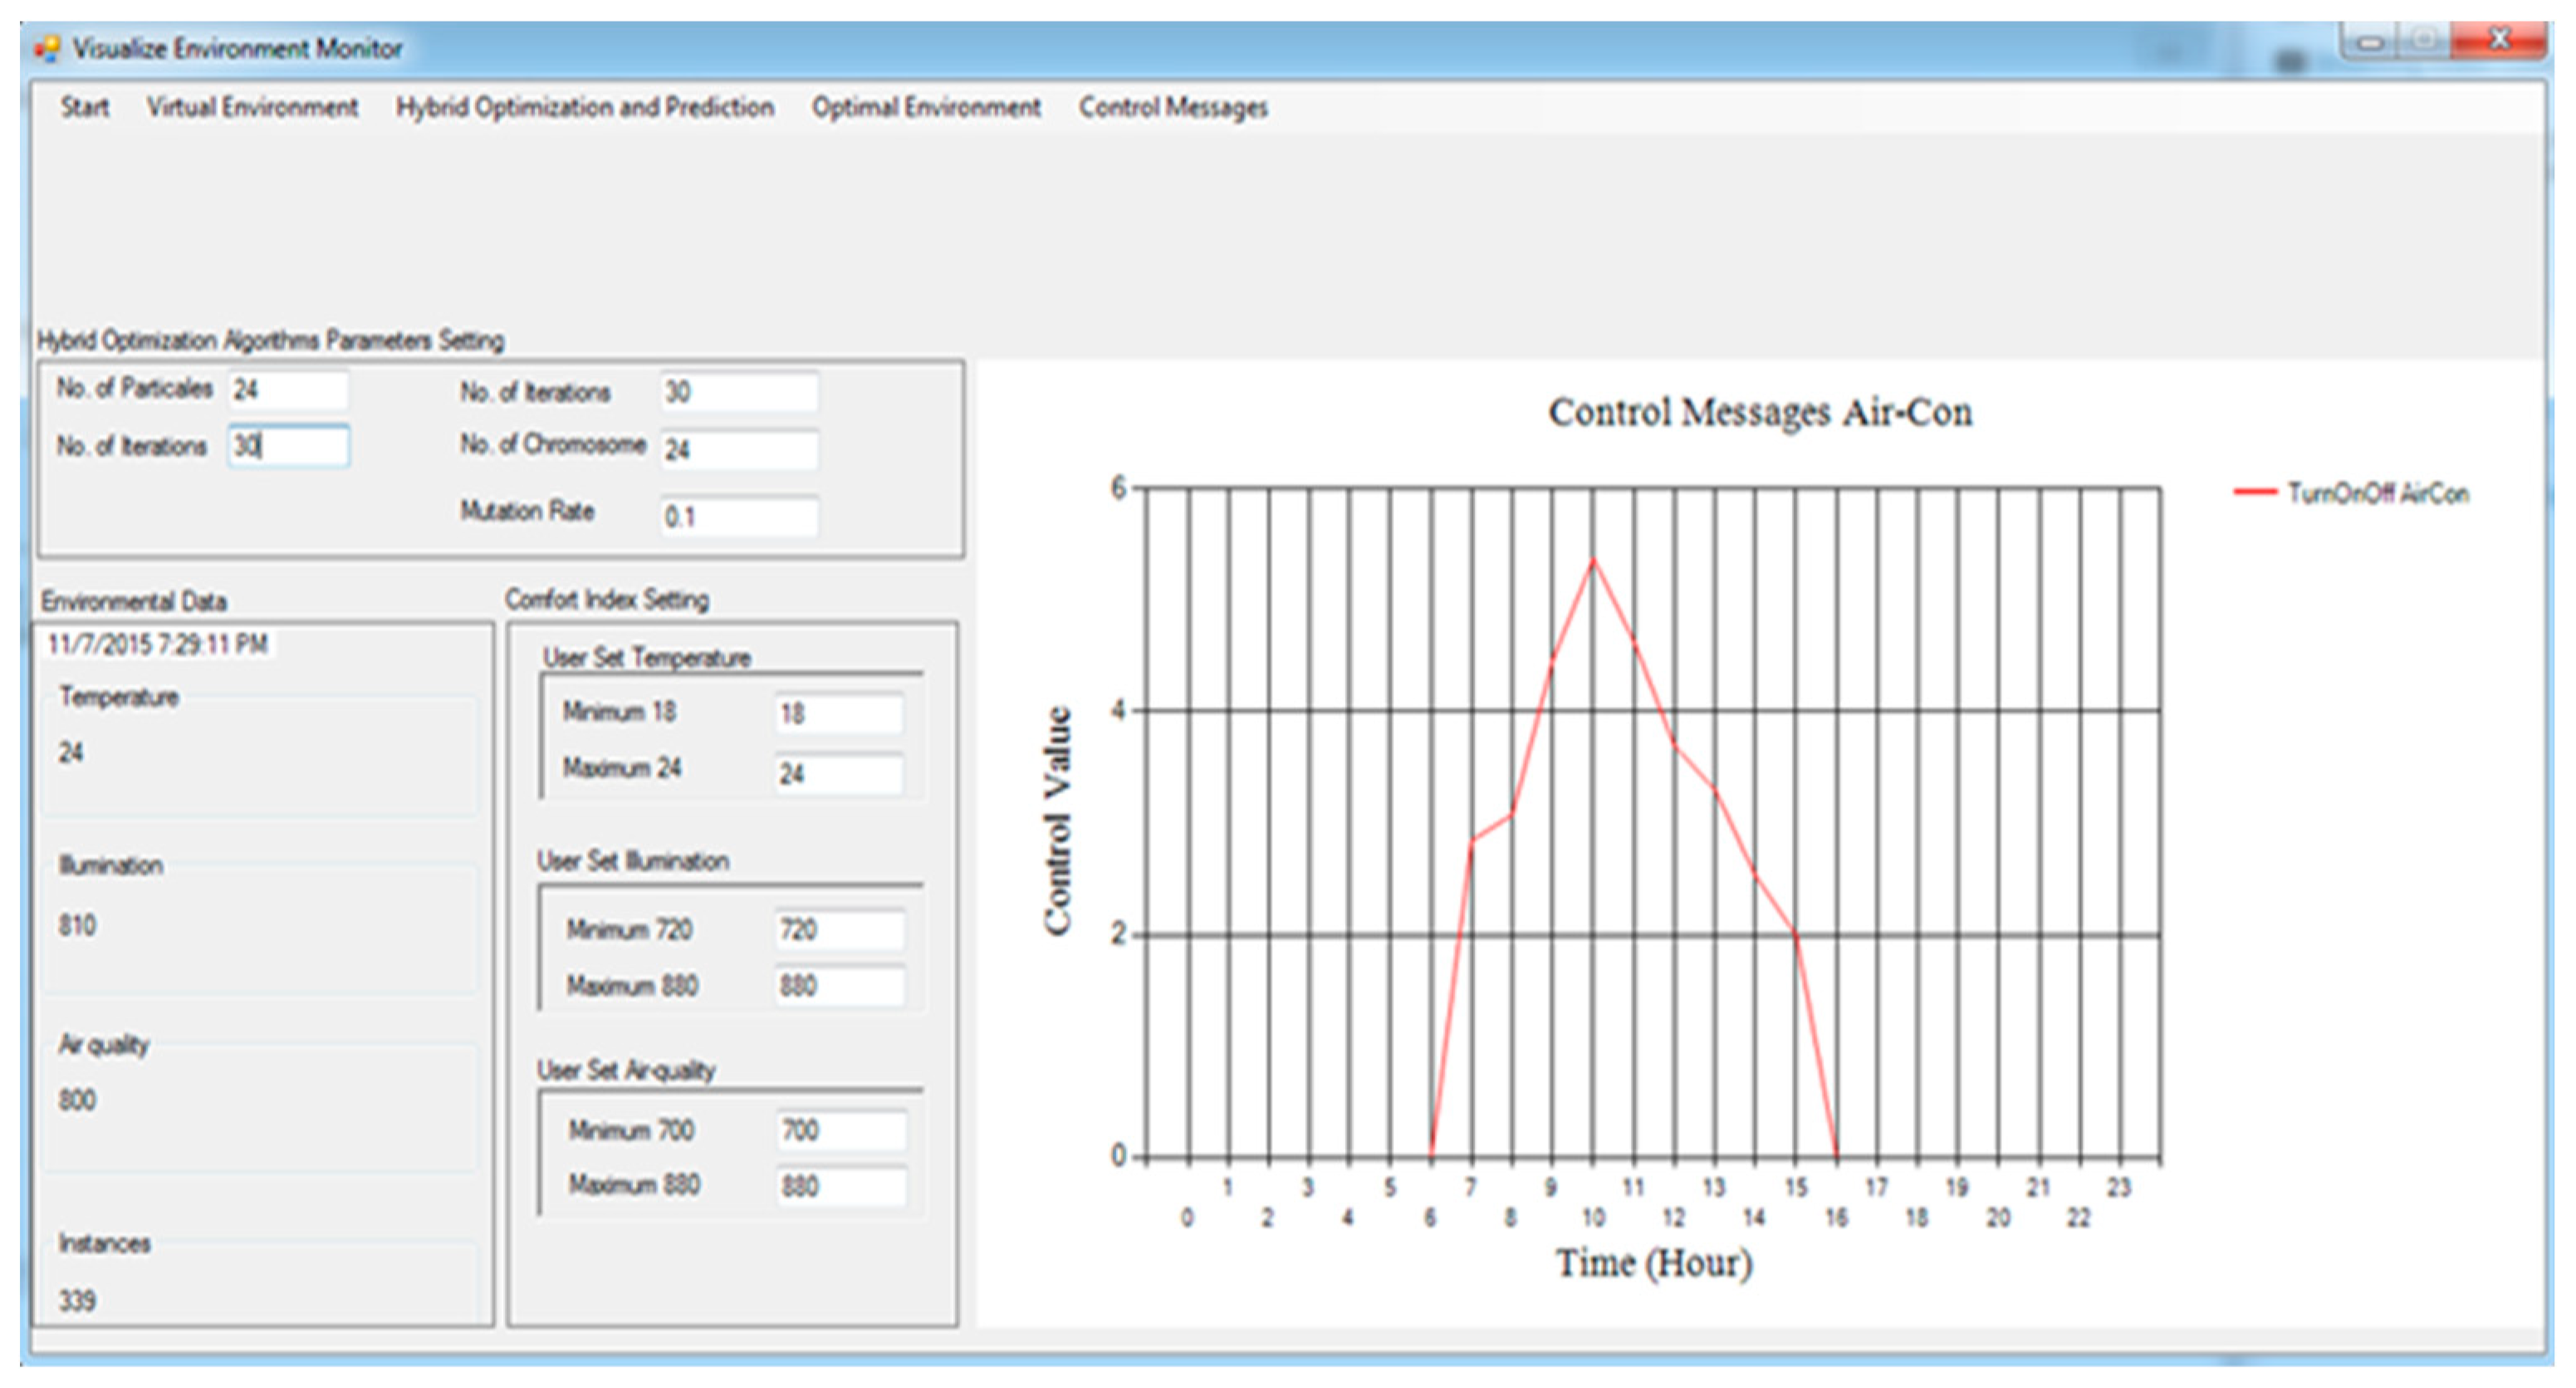
Figure 3.
Control messages for boiler based on the proposed framework.
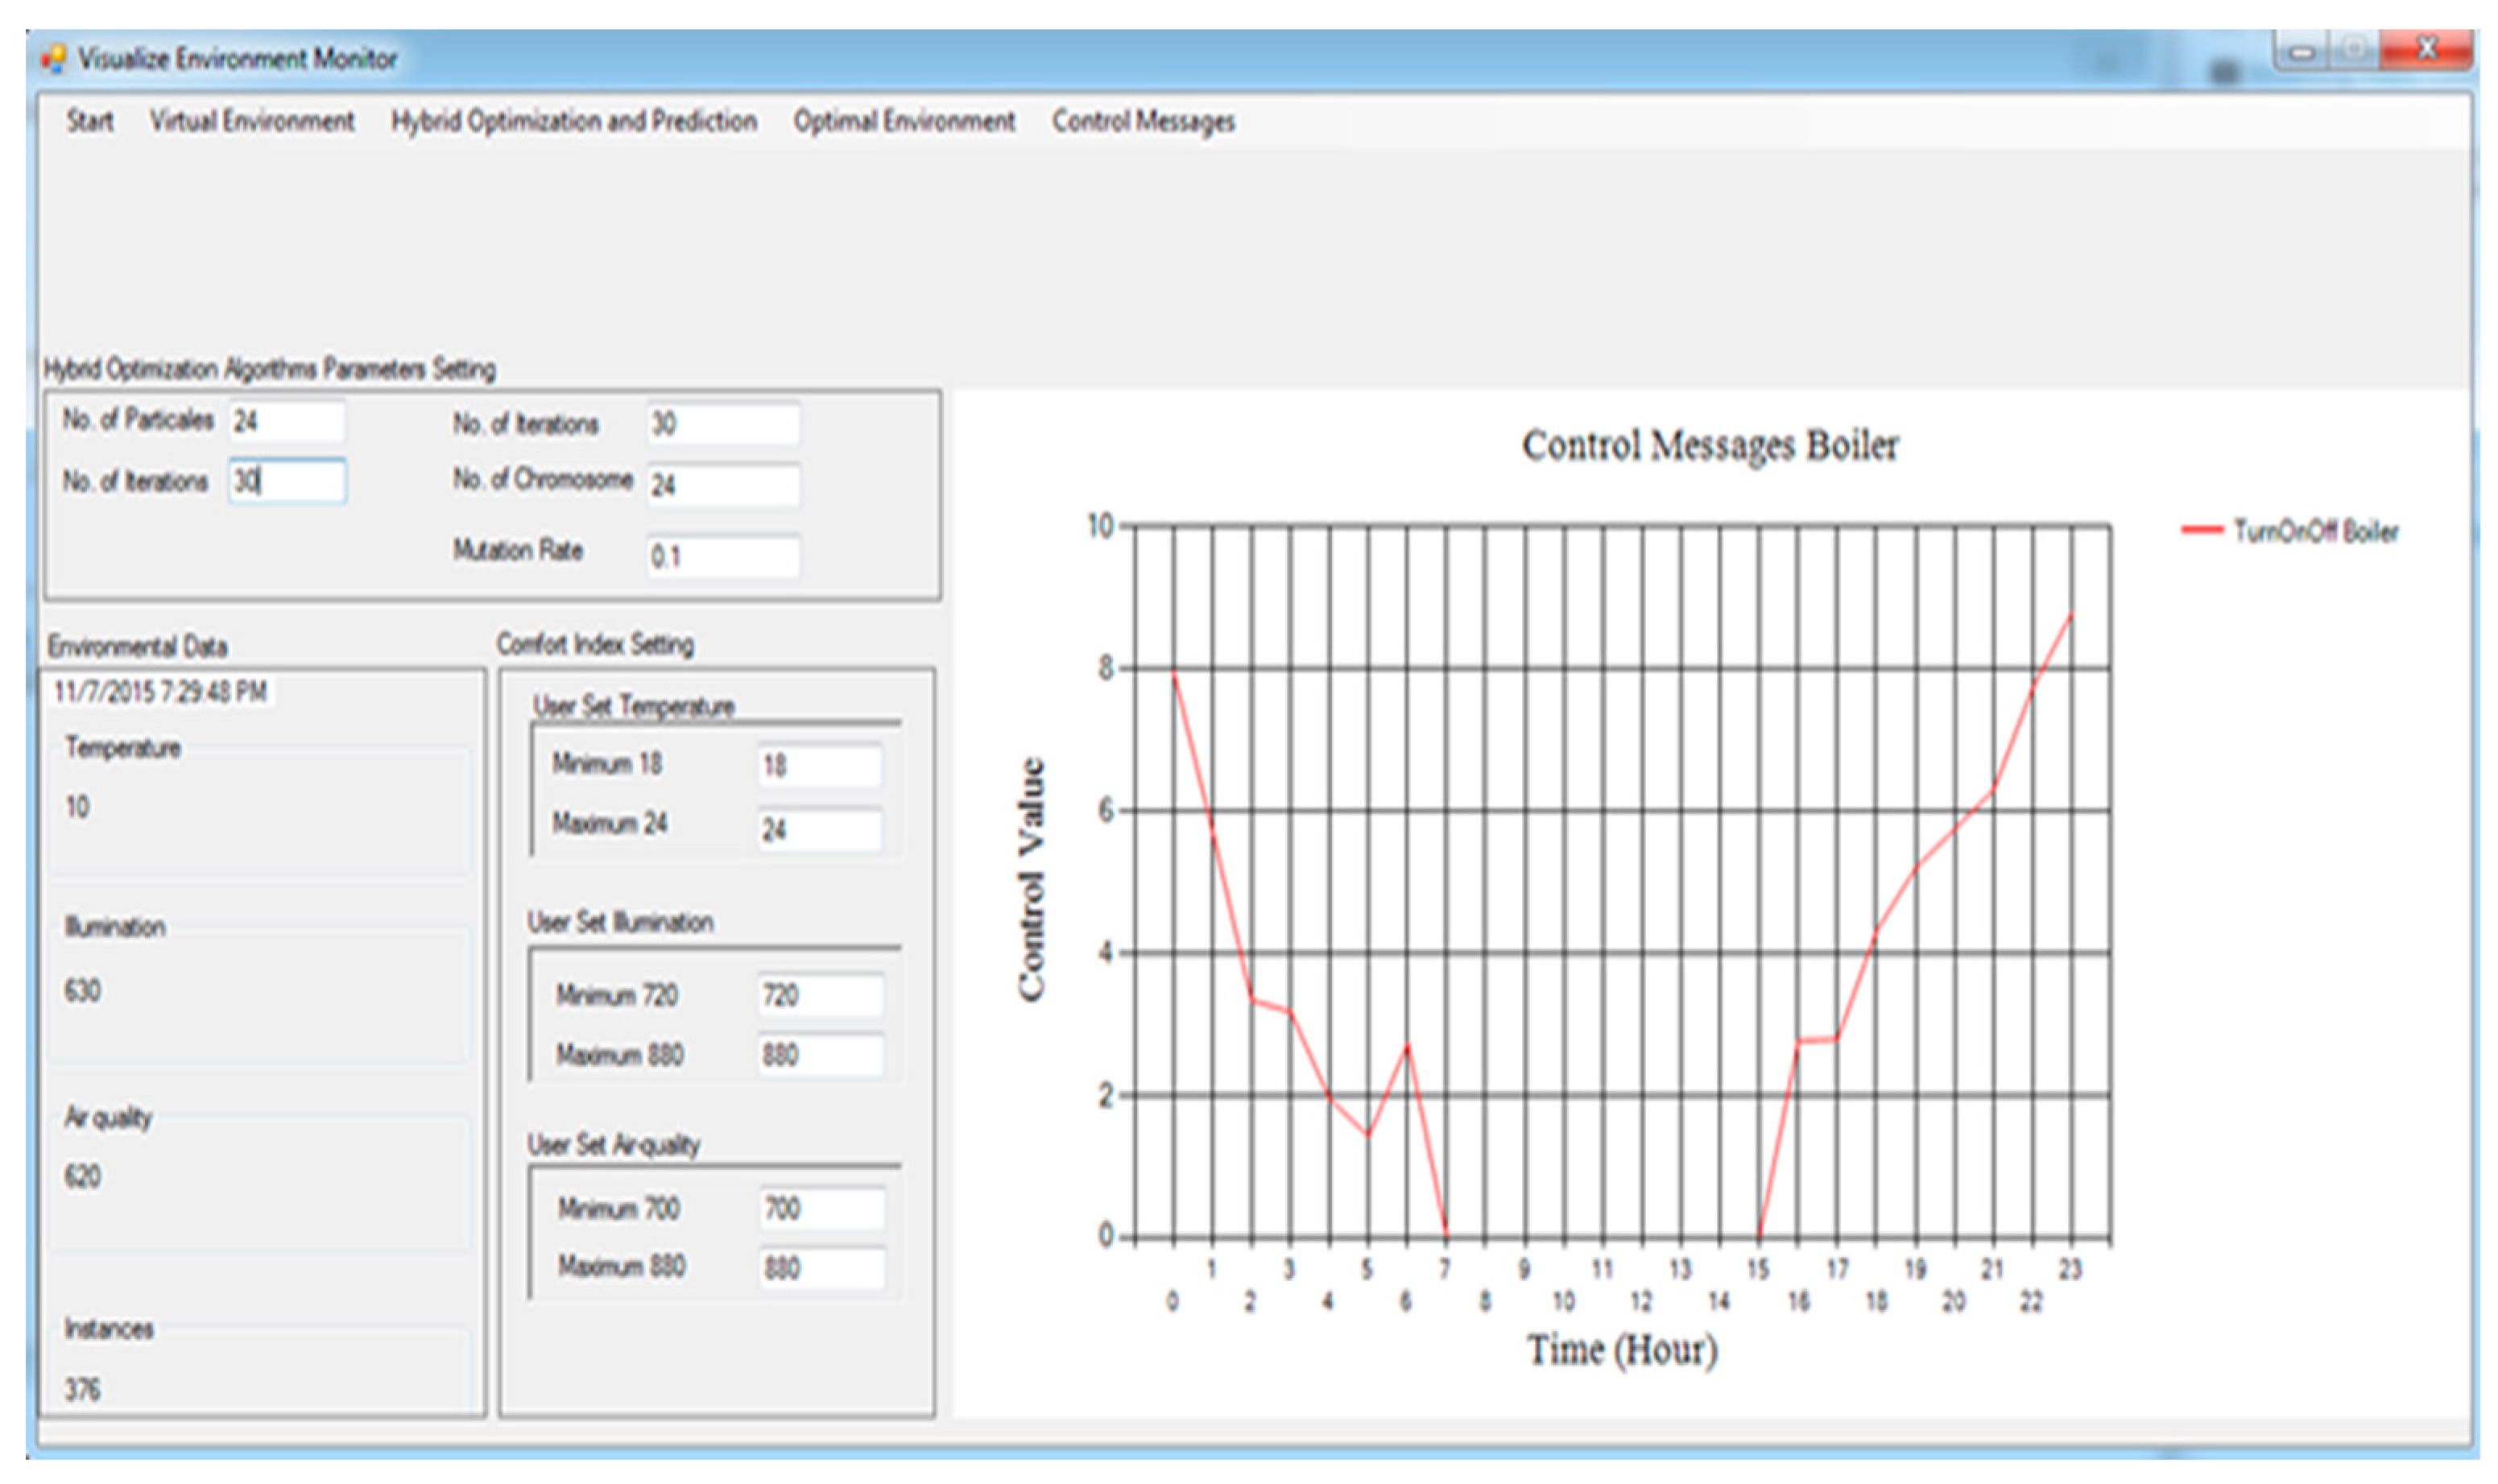
Figure 4.
Control messages for light based on the proposed framework.
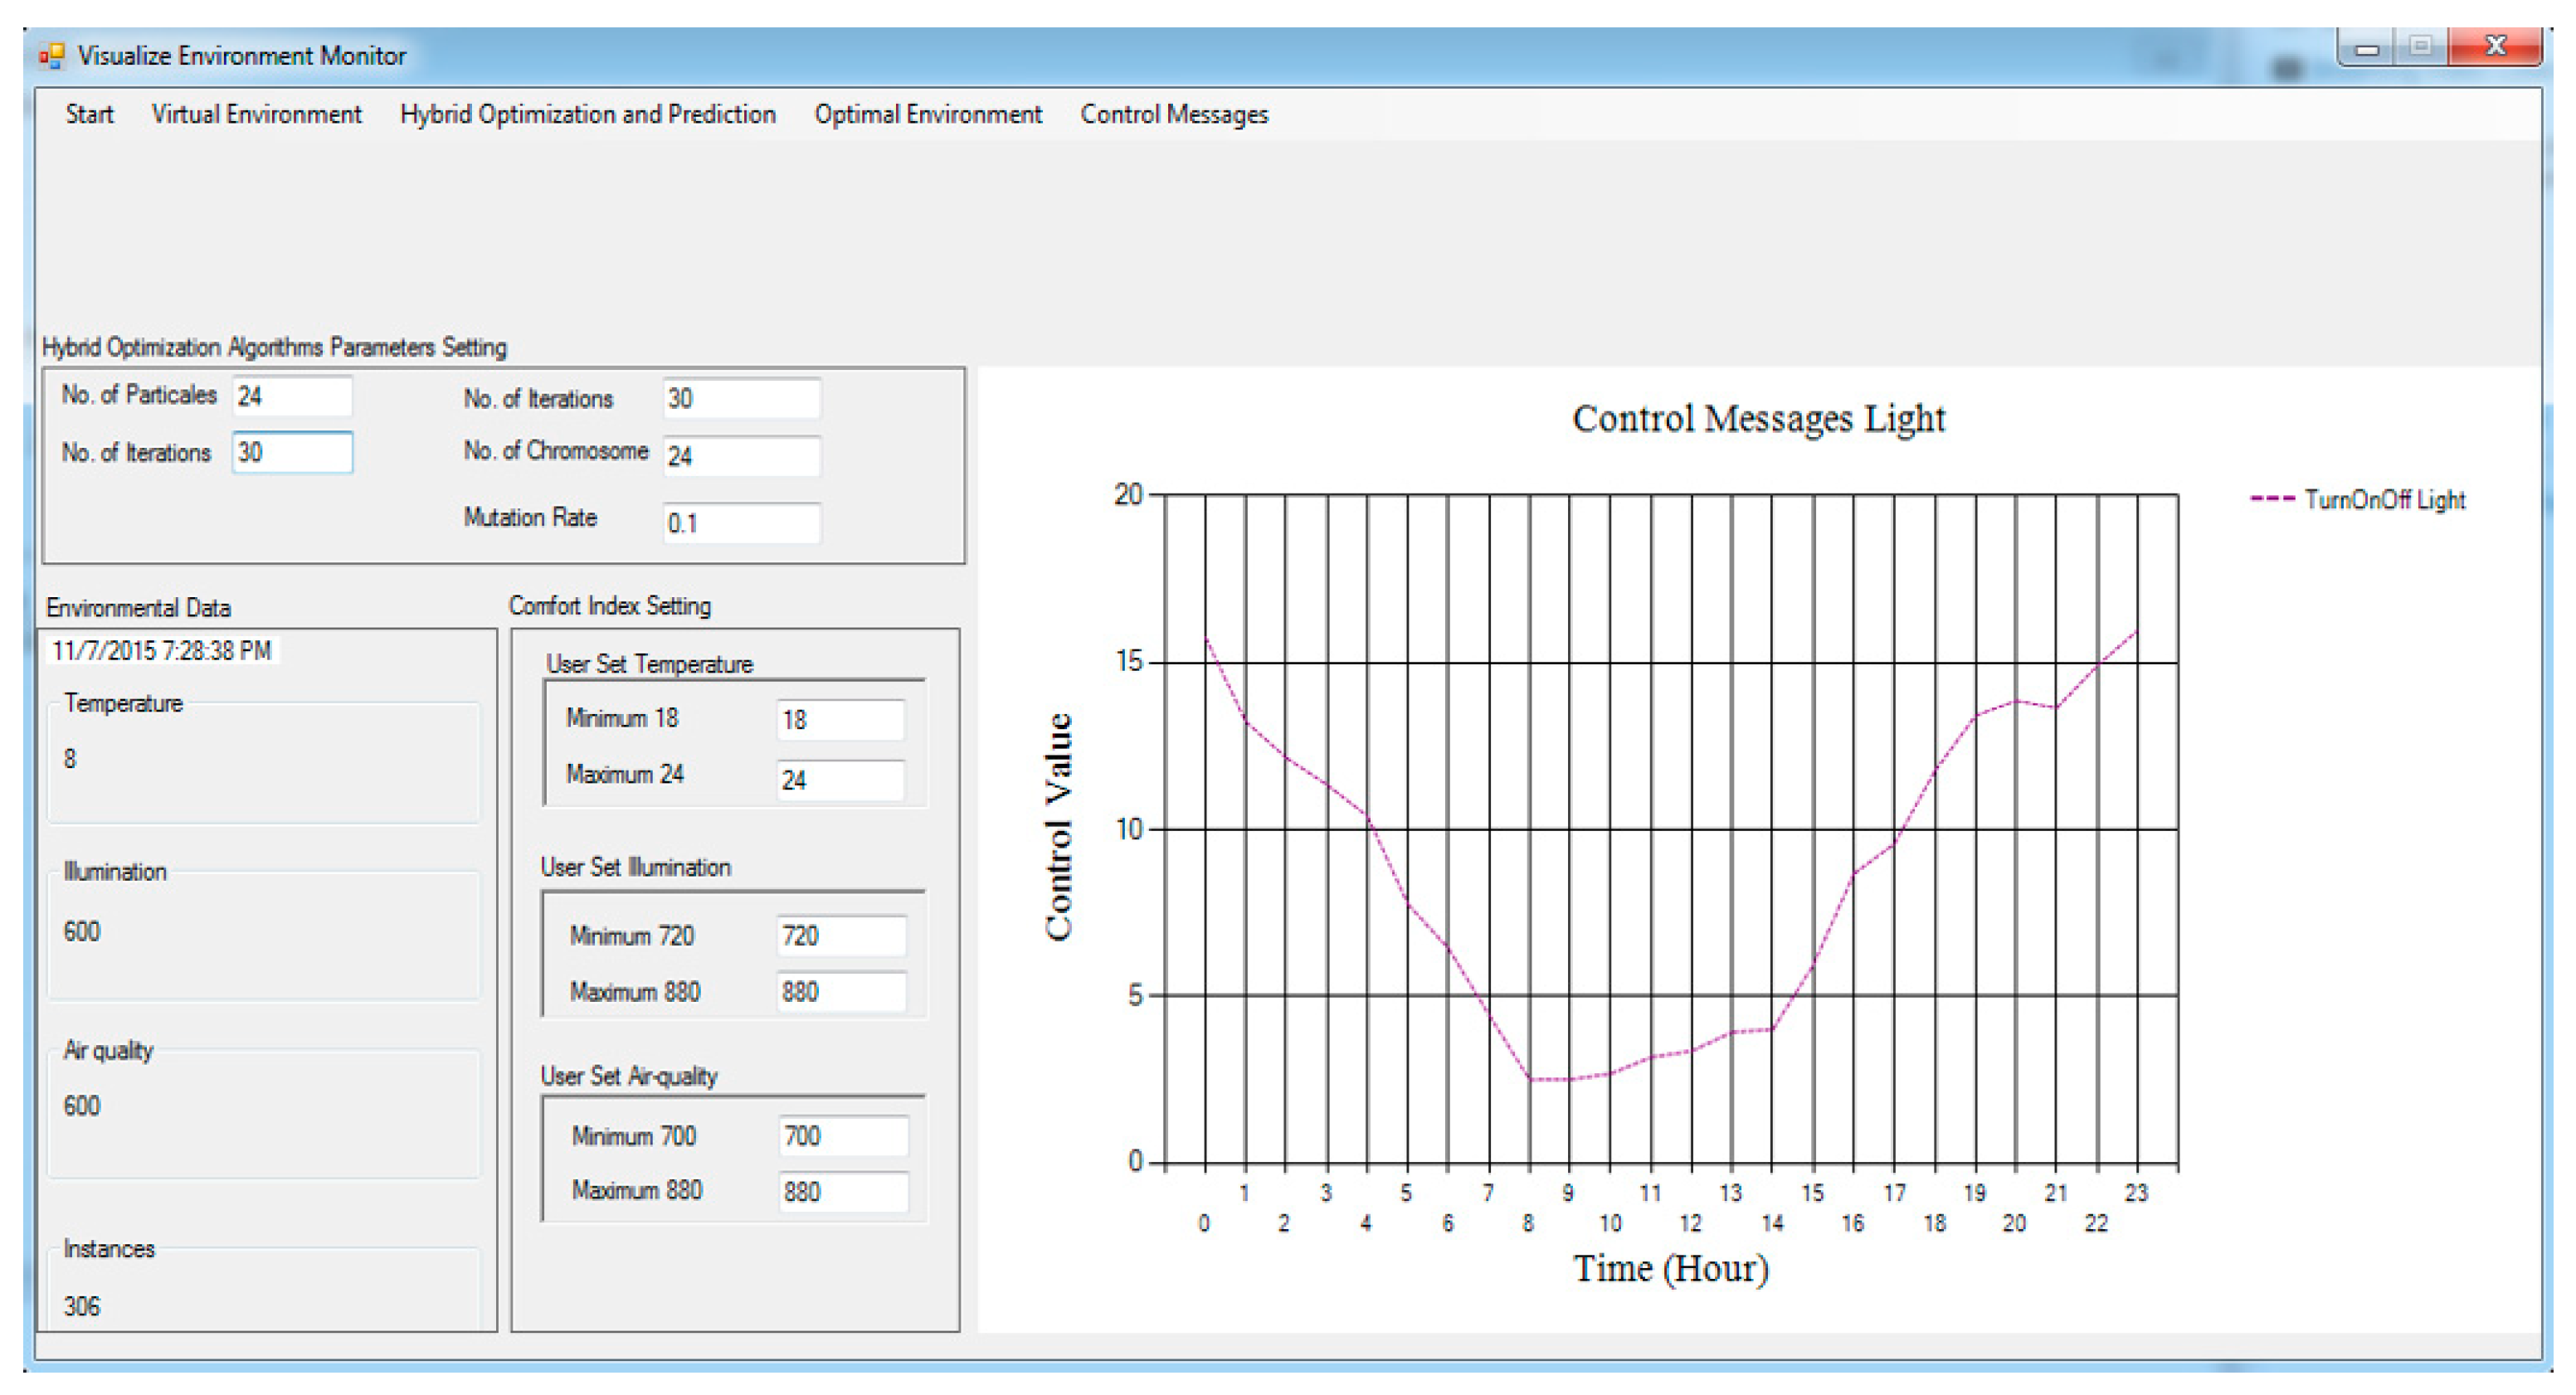
Figure 5.
Control messages for fan based on the proposed framework.
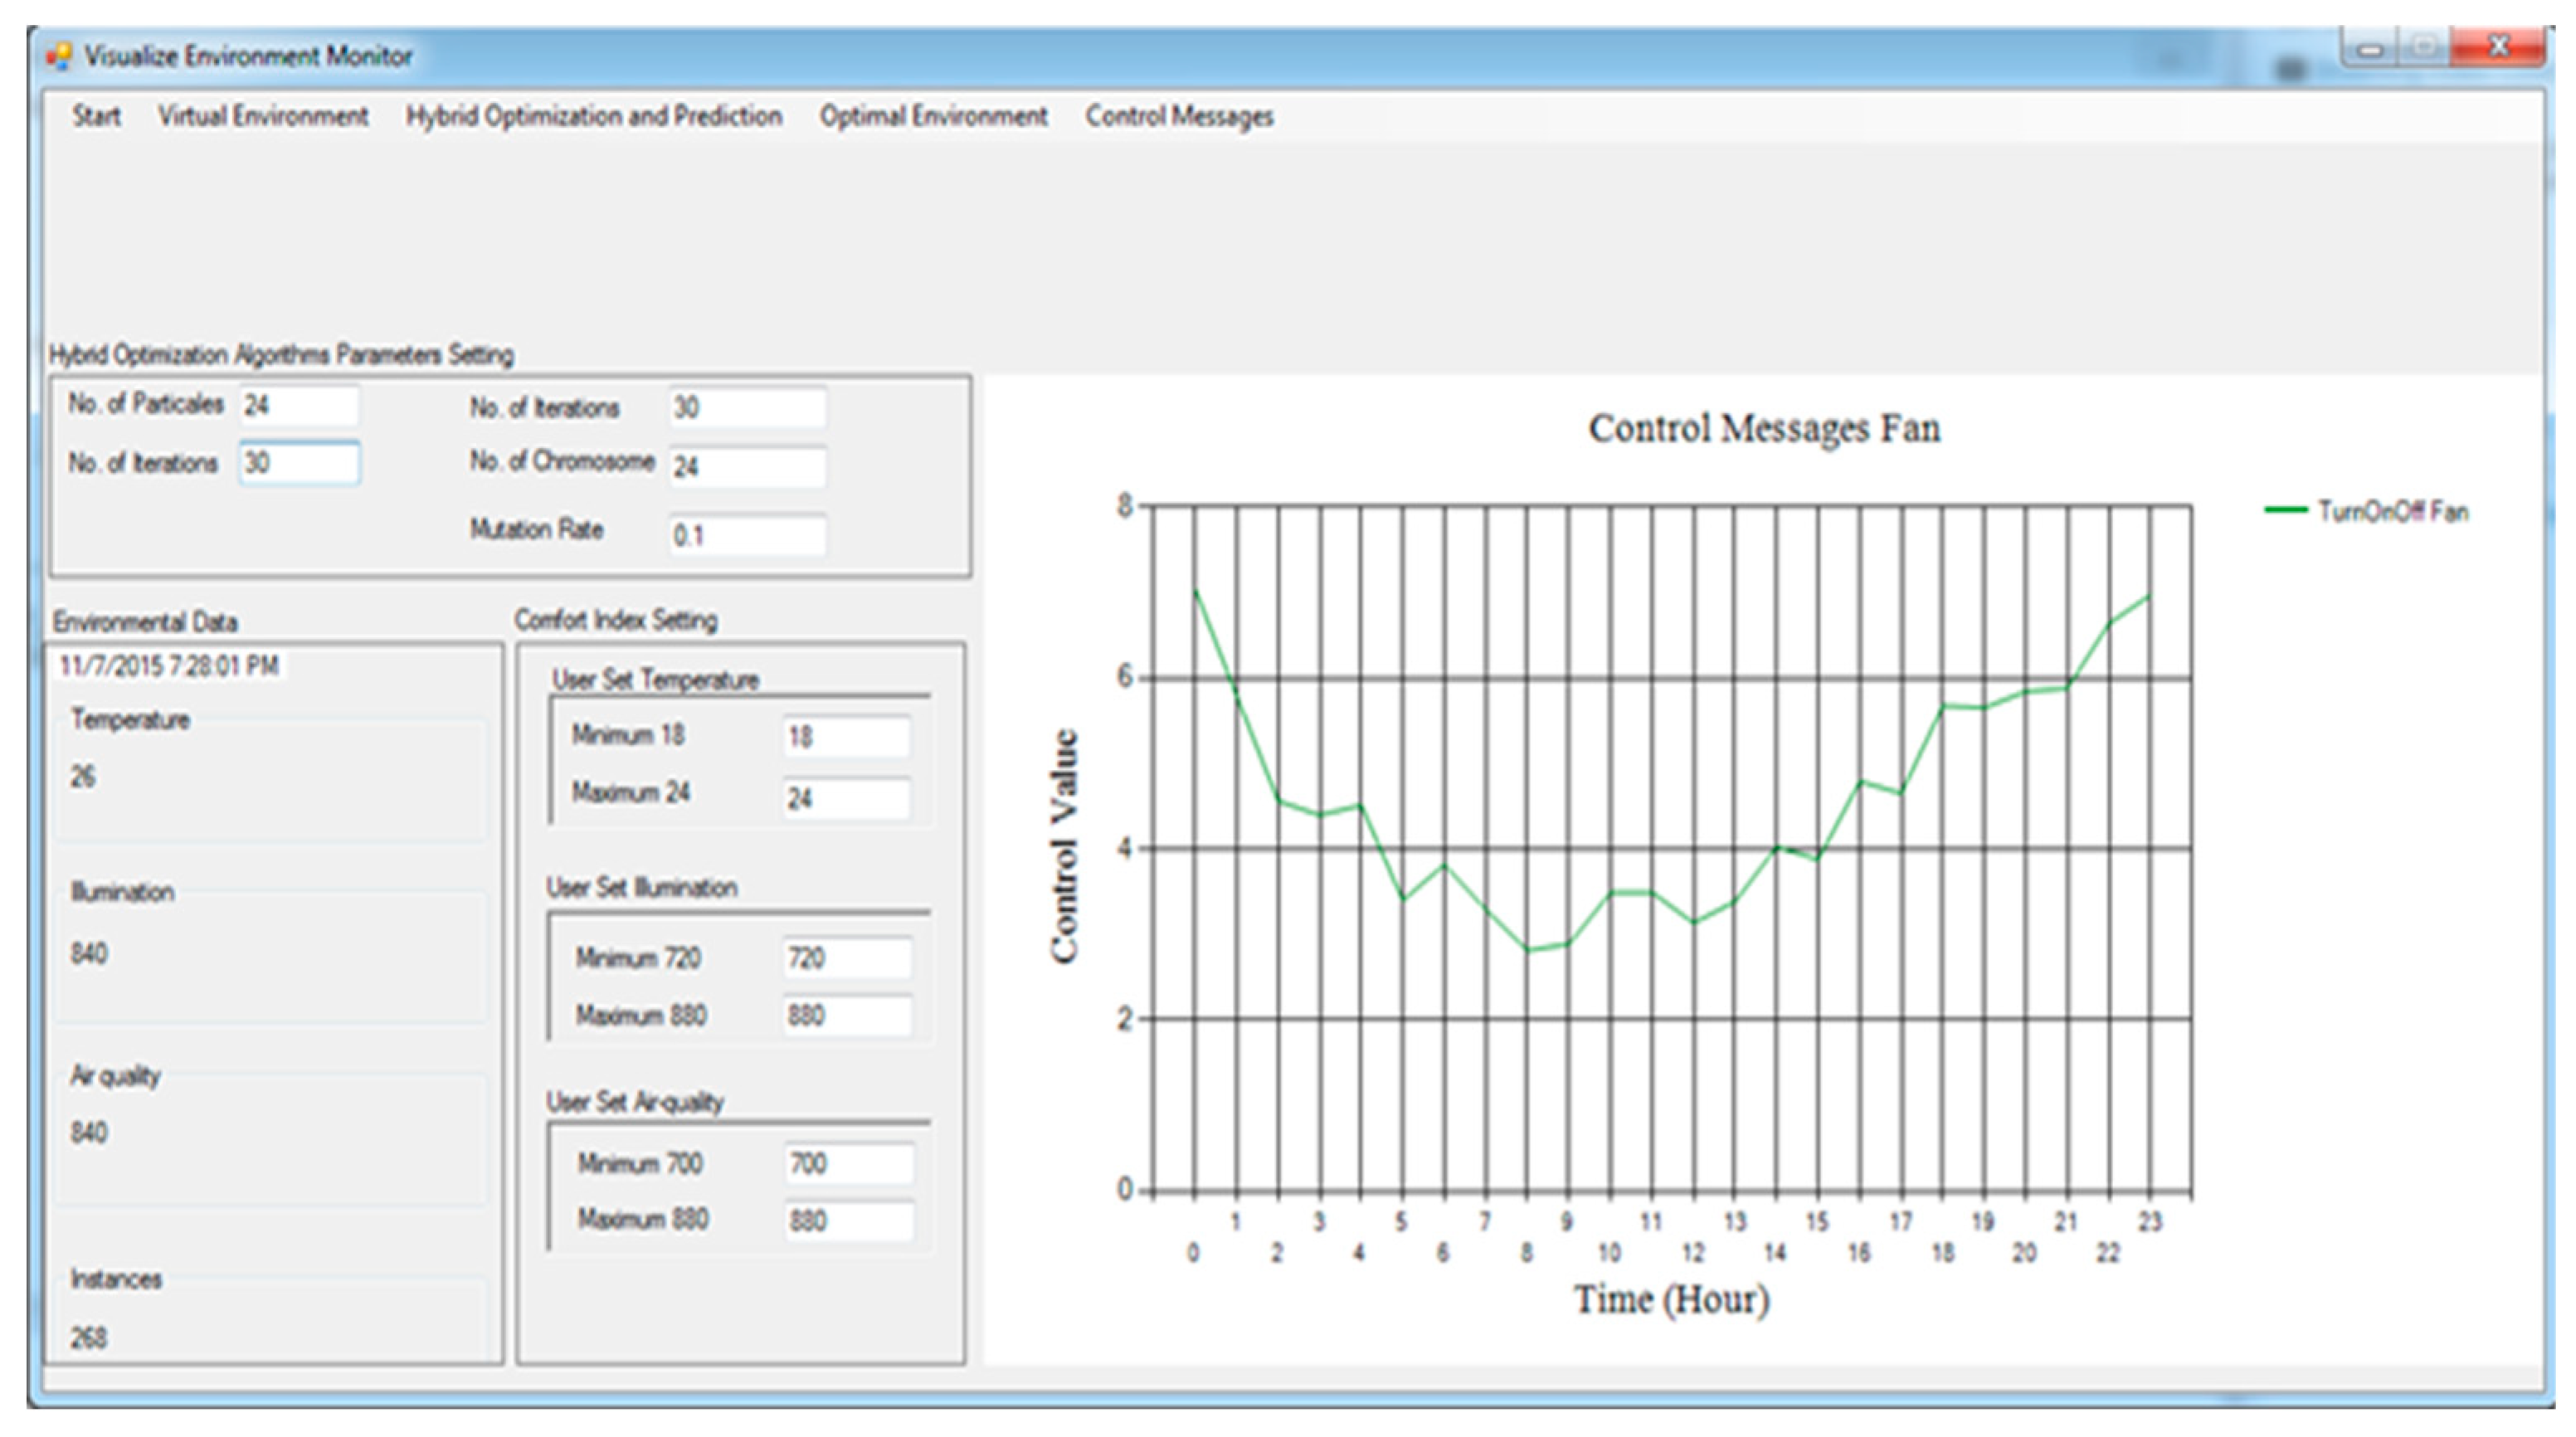
Figure 6.
Proposed PMC framework based on predicted power consumption vs. ABCKB vs. GAP versus SOHP vs. PSO vs. AEO framework for temperature.
Figure 6.
Proposed PMC framework based on predicted power consumption vs. ABCKB vs. GAP versus SOHP vs. PSO vs. AEO framework for temperature.
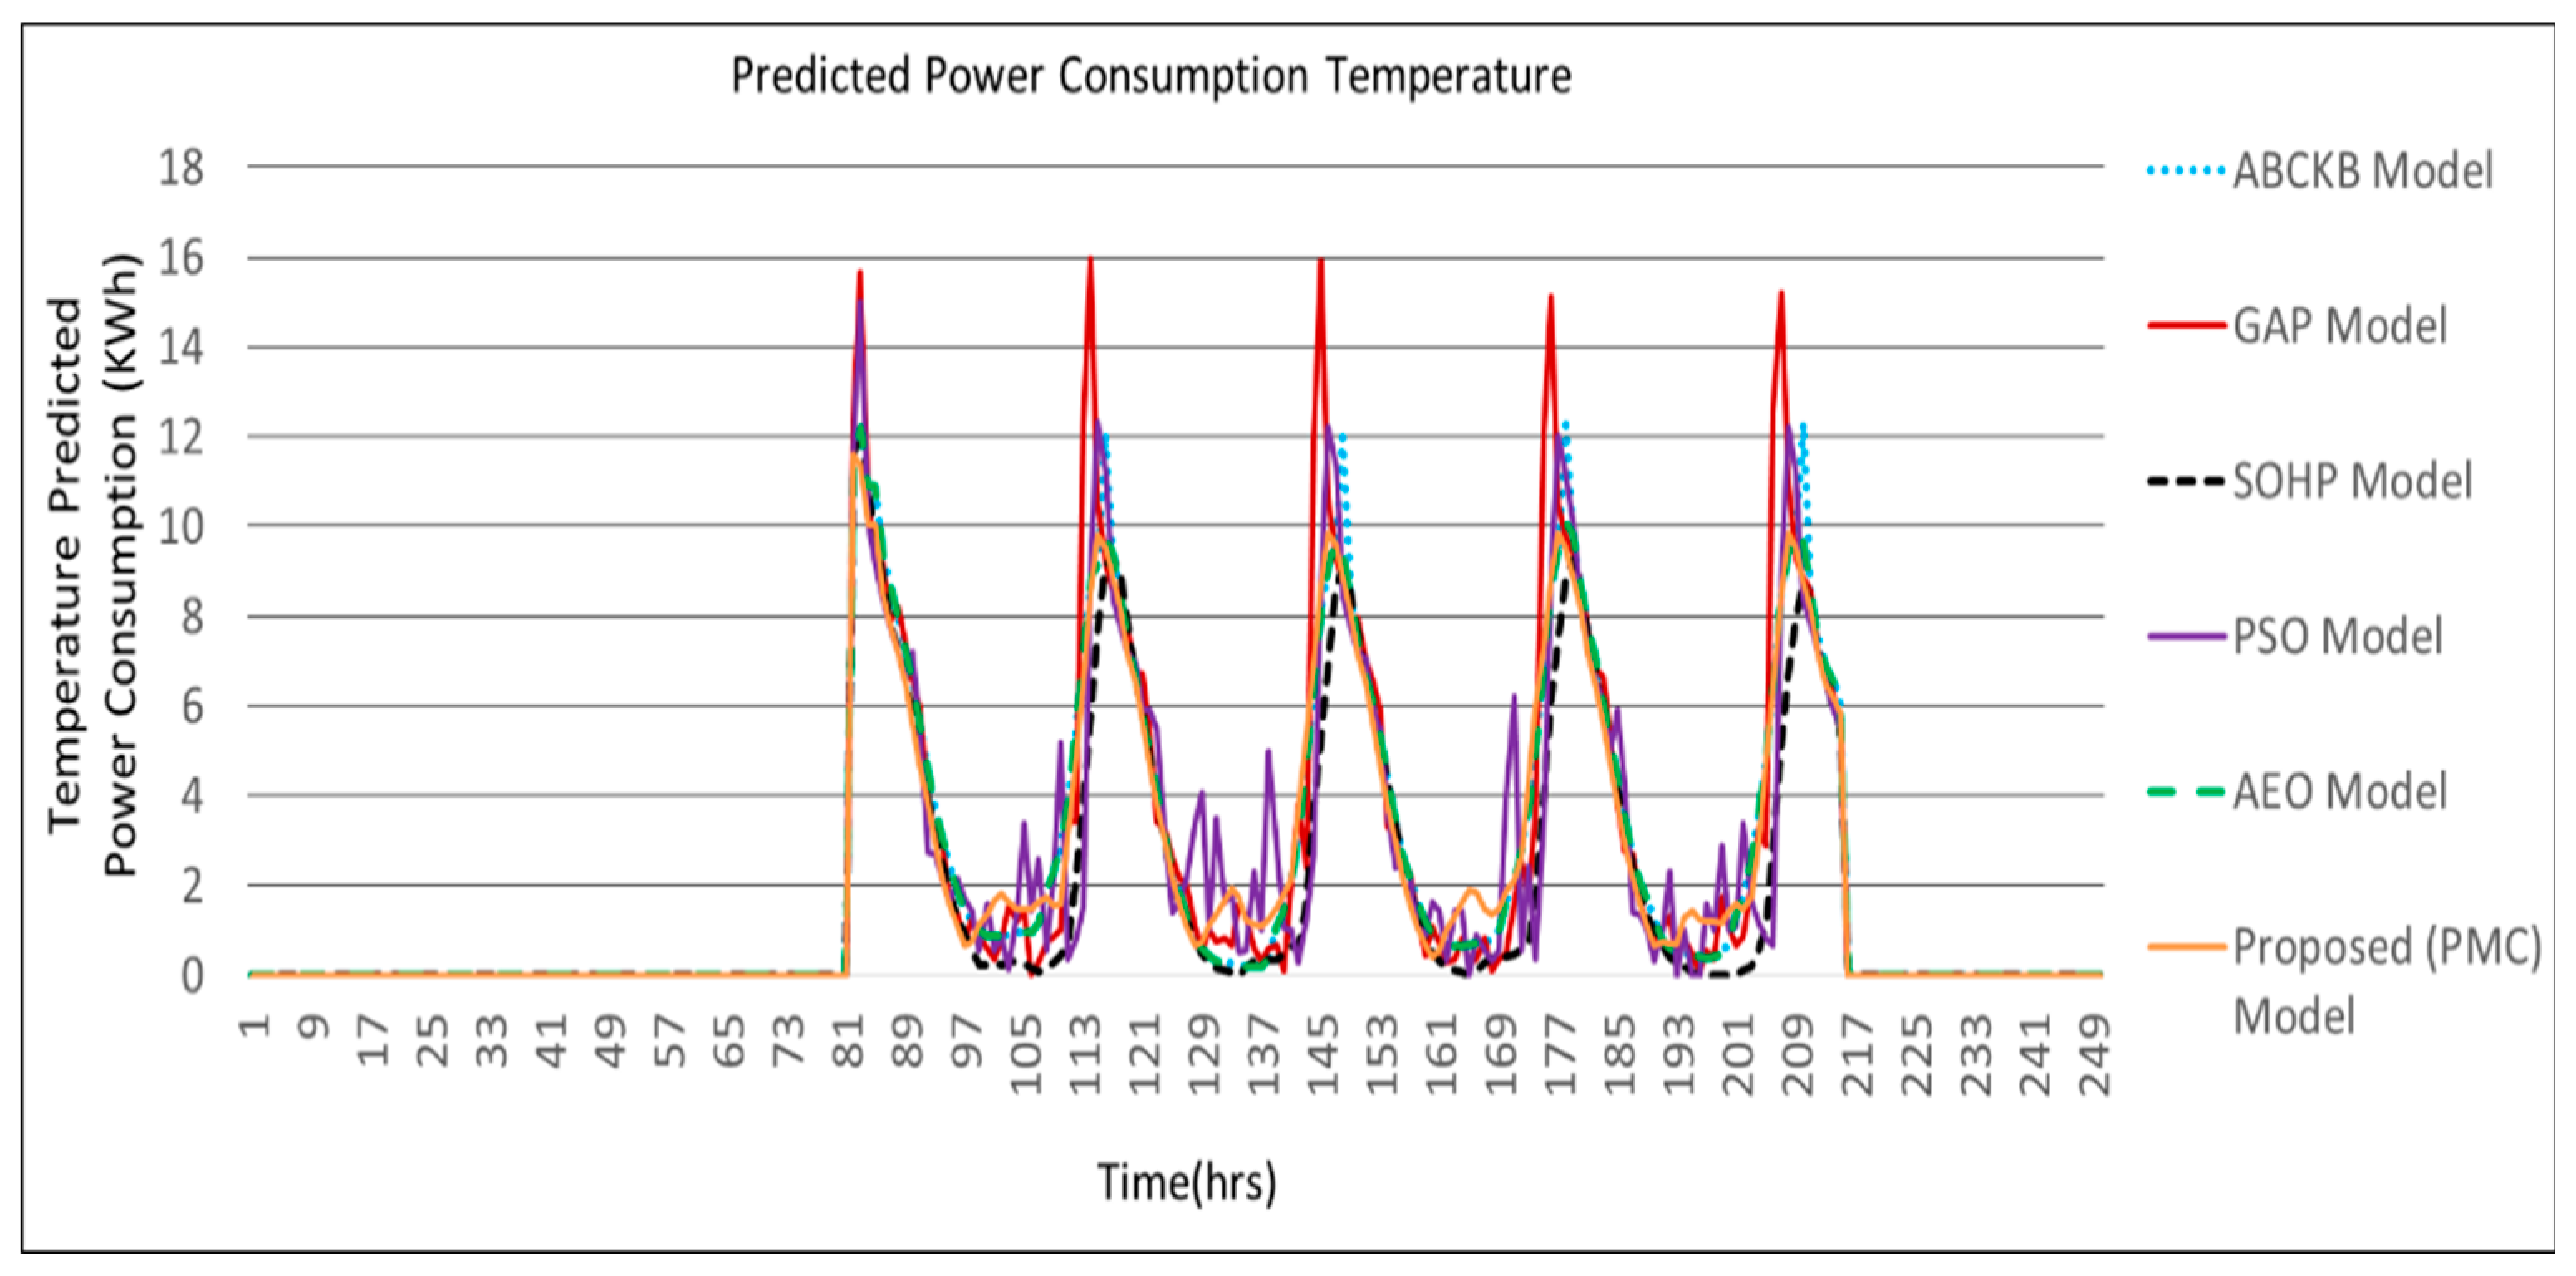
Figure 7.
Proposed PMC framework based on predicted power consumption vs. ABCKB vs. GAP vs. SOHP vs. PSO vs. AEO model for illumination.
Figure 7.
Proposed PMC framework based on predicted power consumption vs. ABCKB vs. GAP vs. SOHP vs. PSO vs. AEO model for illumination.
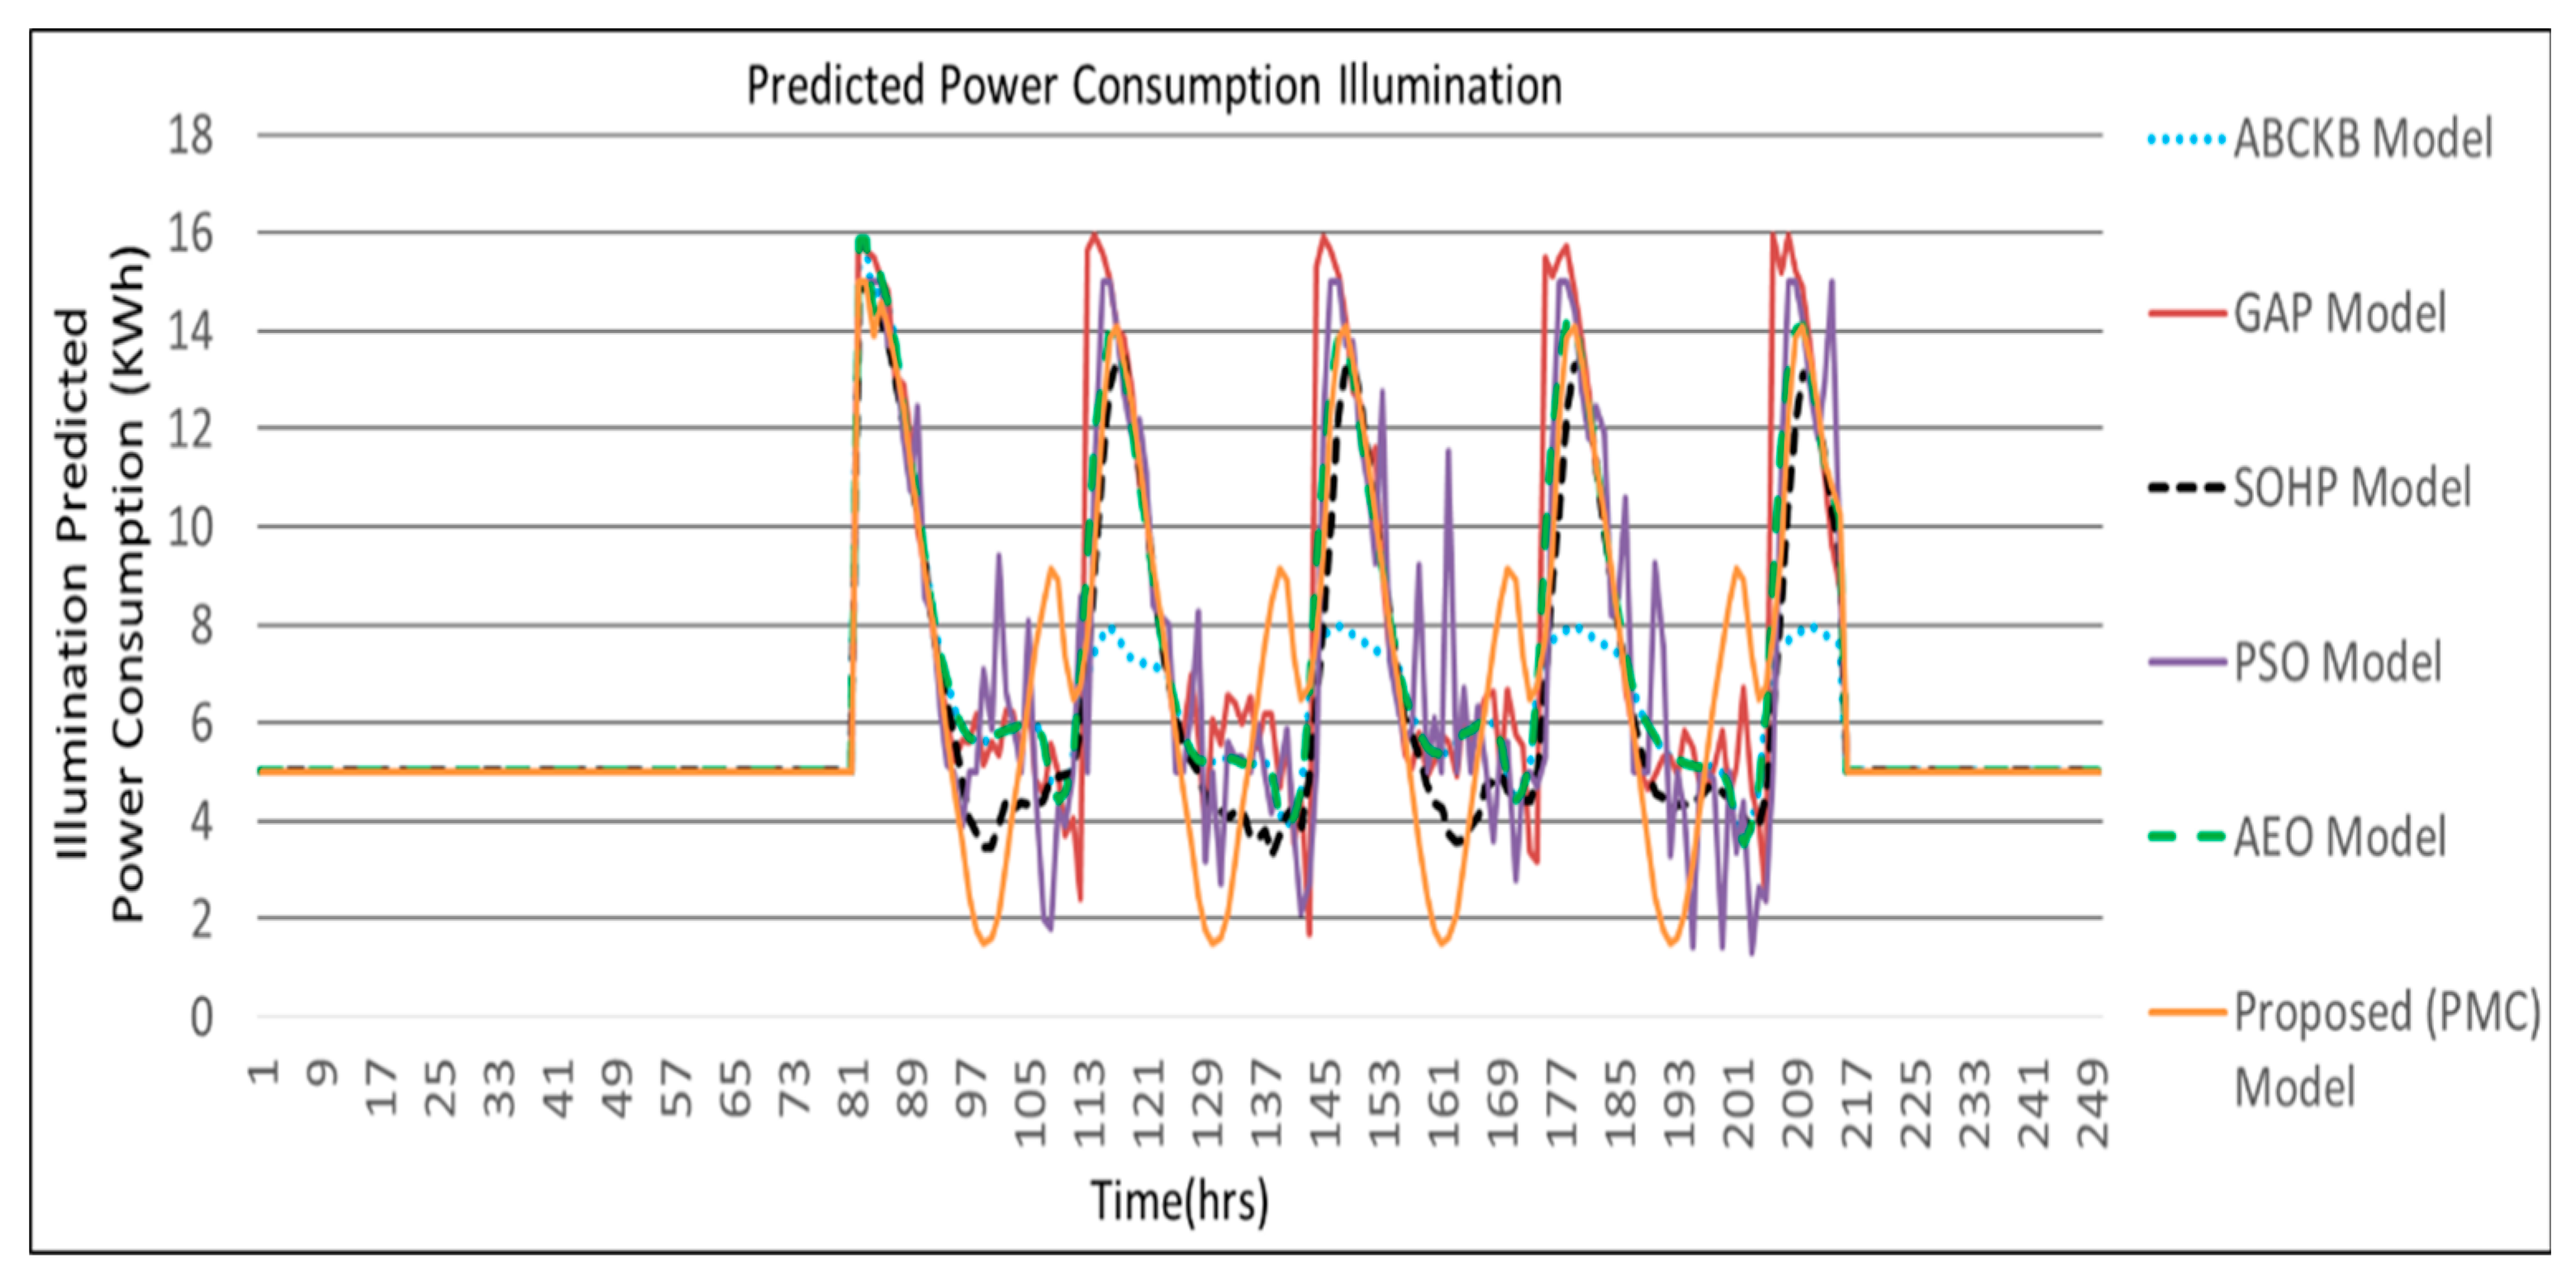
Figure 8.
Proposed PMC framework based on predicted power consumption vs. ABCKB vs. GAP versus SOHP vs. PSO vs. AEO framework for air quality.
Figure 8.
Proposed PMC framework based on predicted power consumption vs. ABCKB vs. GAP versus SOHP vs. PSO vs. AEO framework for air quality.
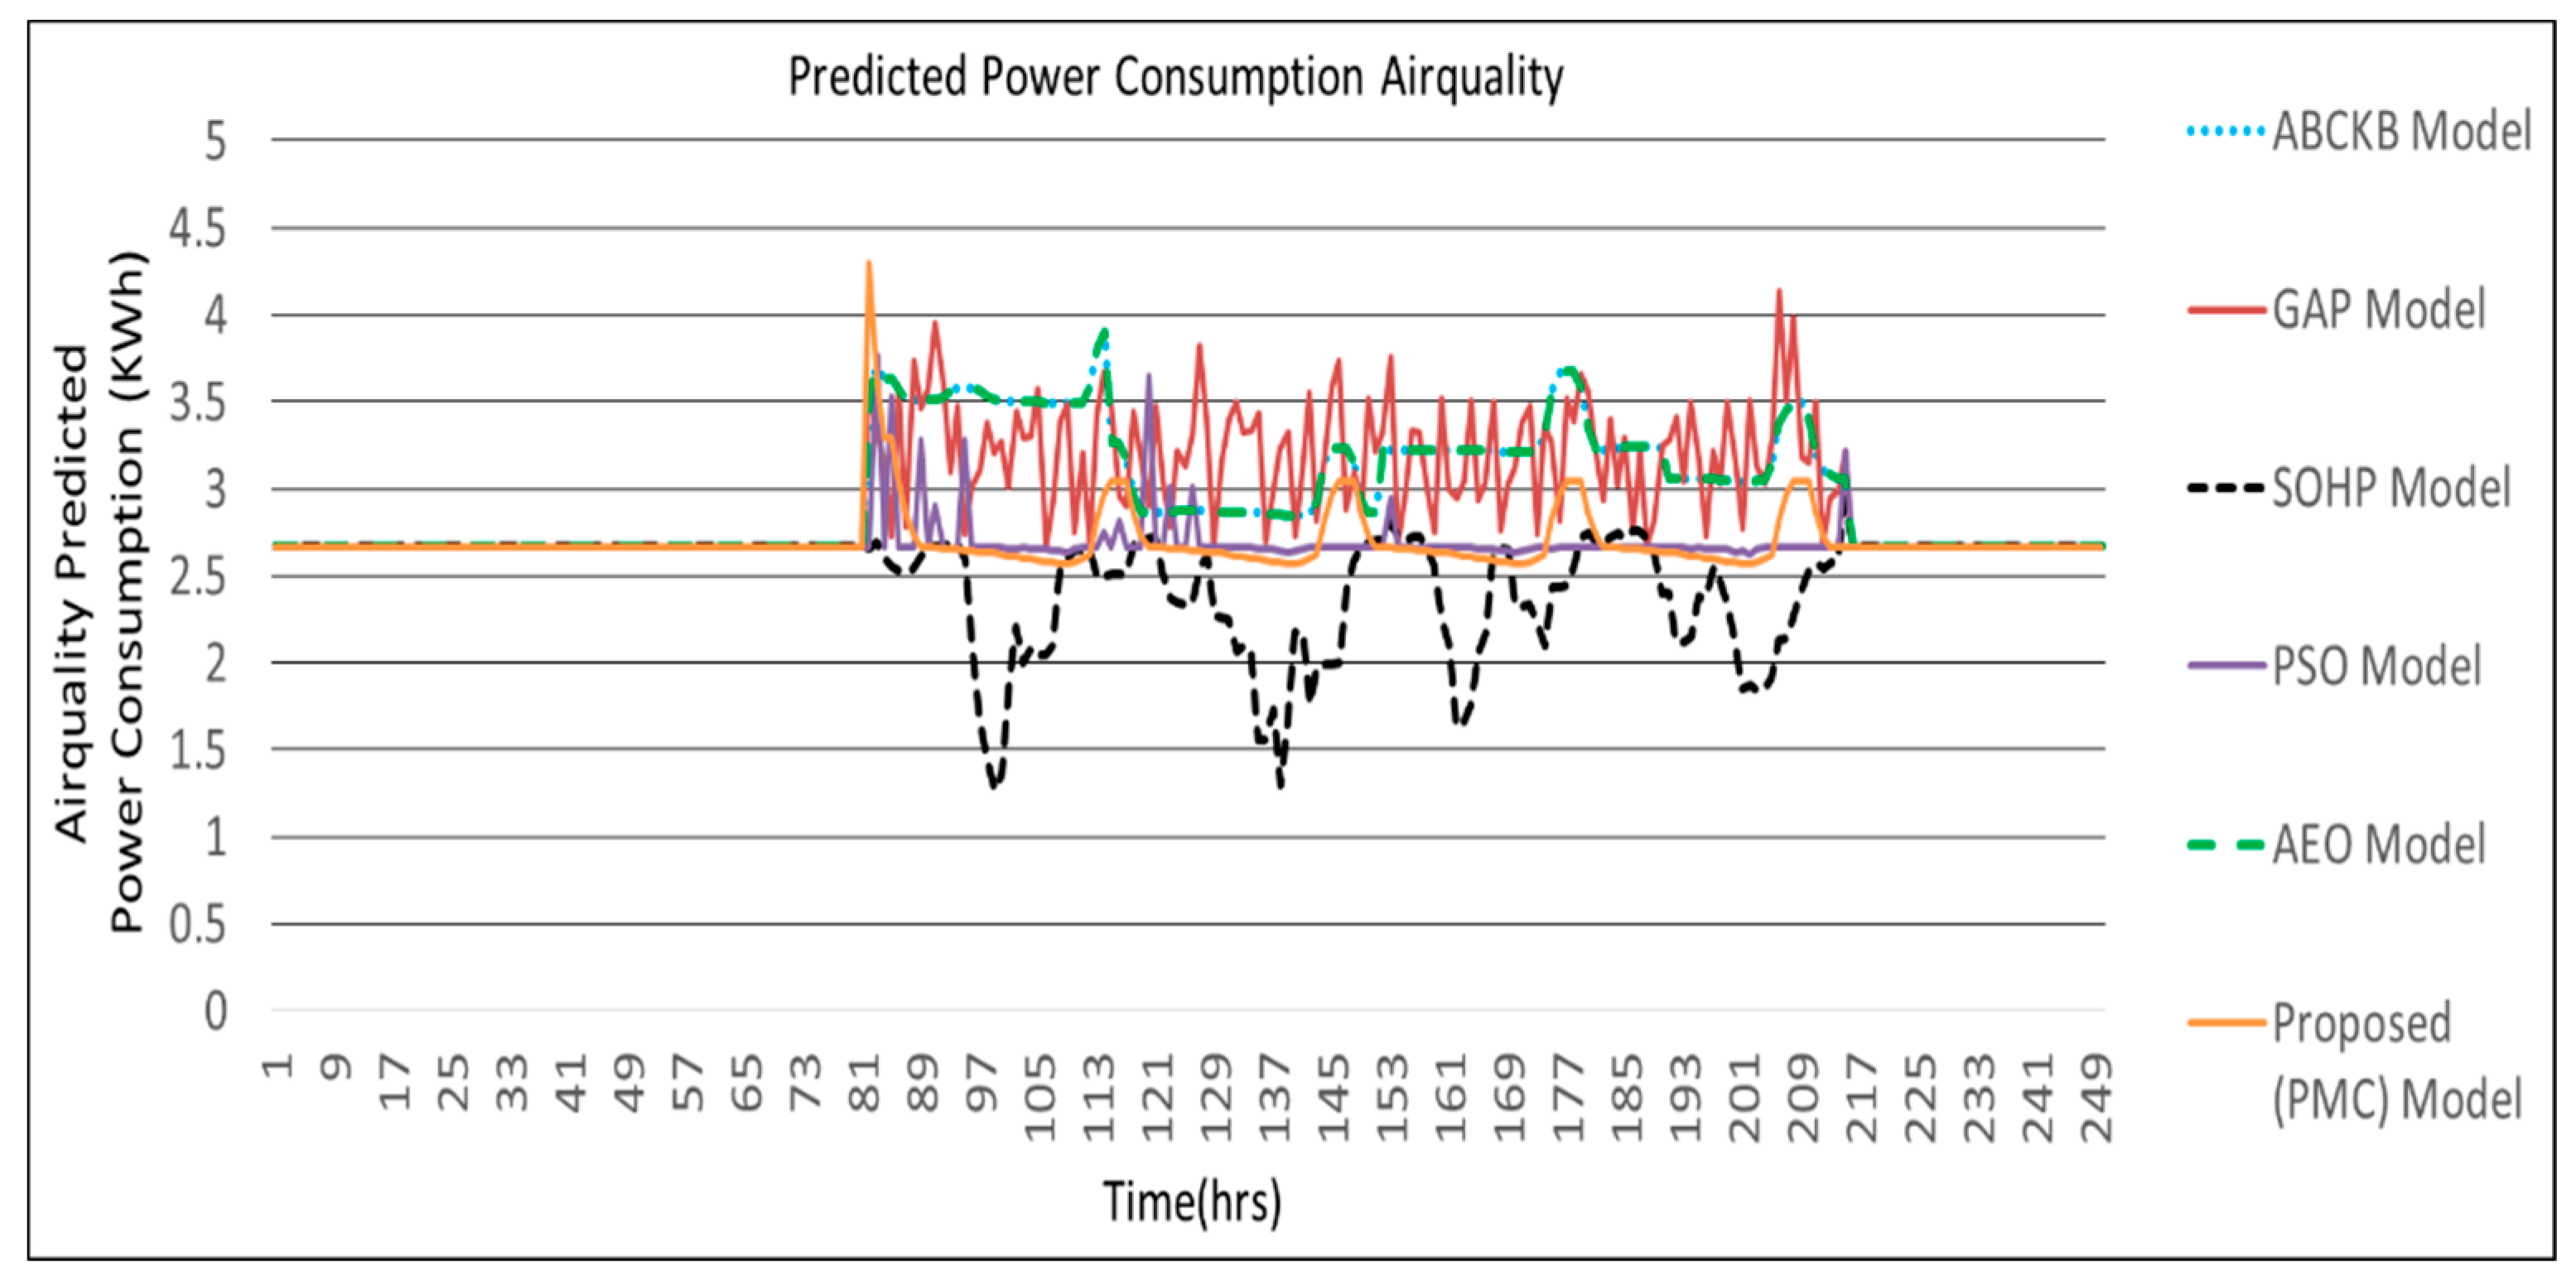
Figure 9.
Proposed PMC framework based on total predicted power consumption vs. ABCKB vs. GAP vs. SOHP vs. PSO vs. AEO framework.
Figure 9.
Proposed PMC framework based on total predicted power consumption vs. ABCKB vs. GAP vs. SOHP vs. PSO vs. AEO framework.
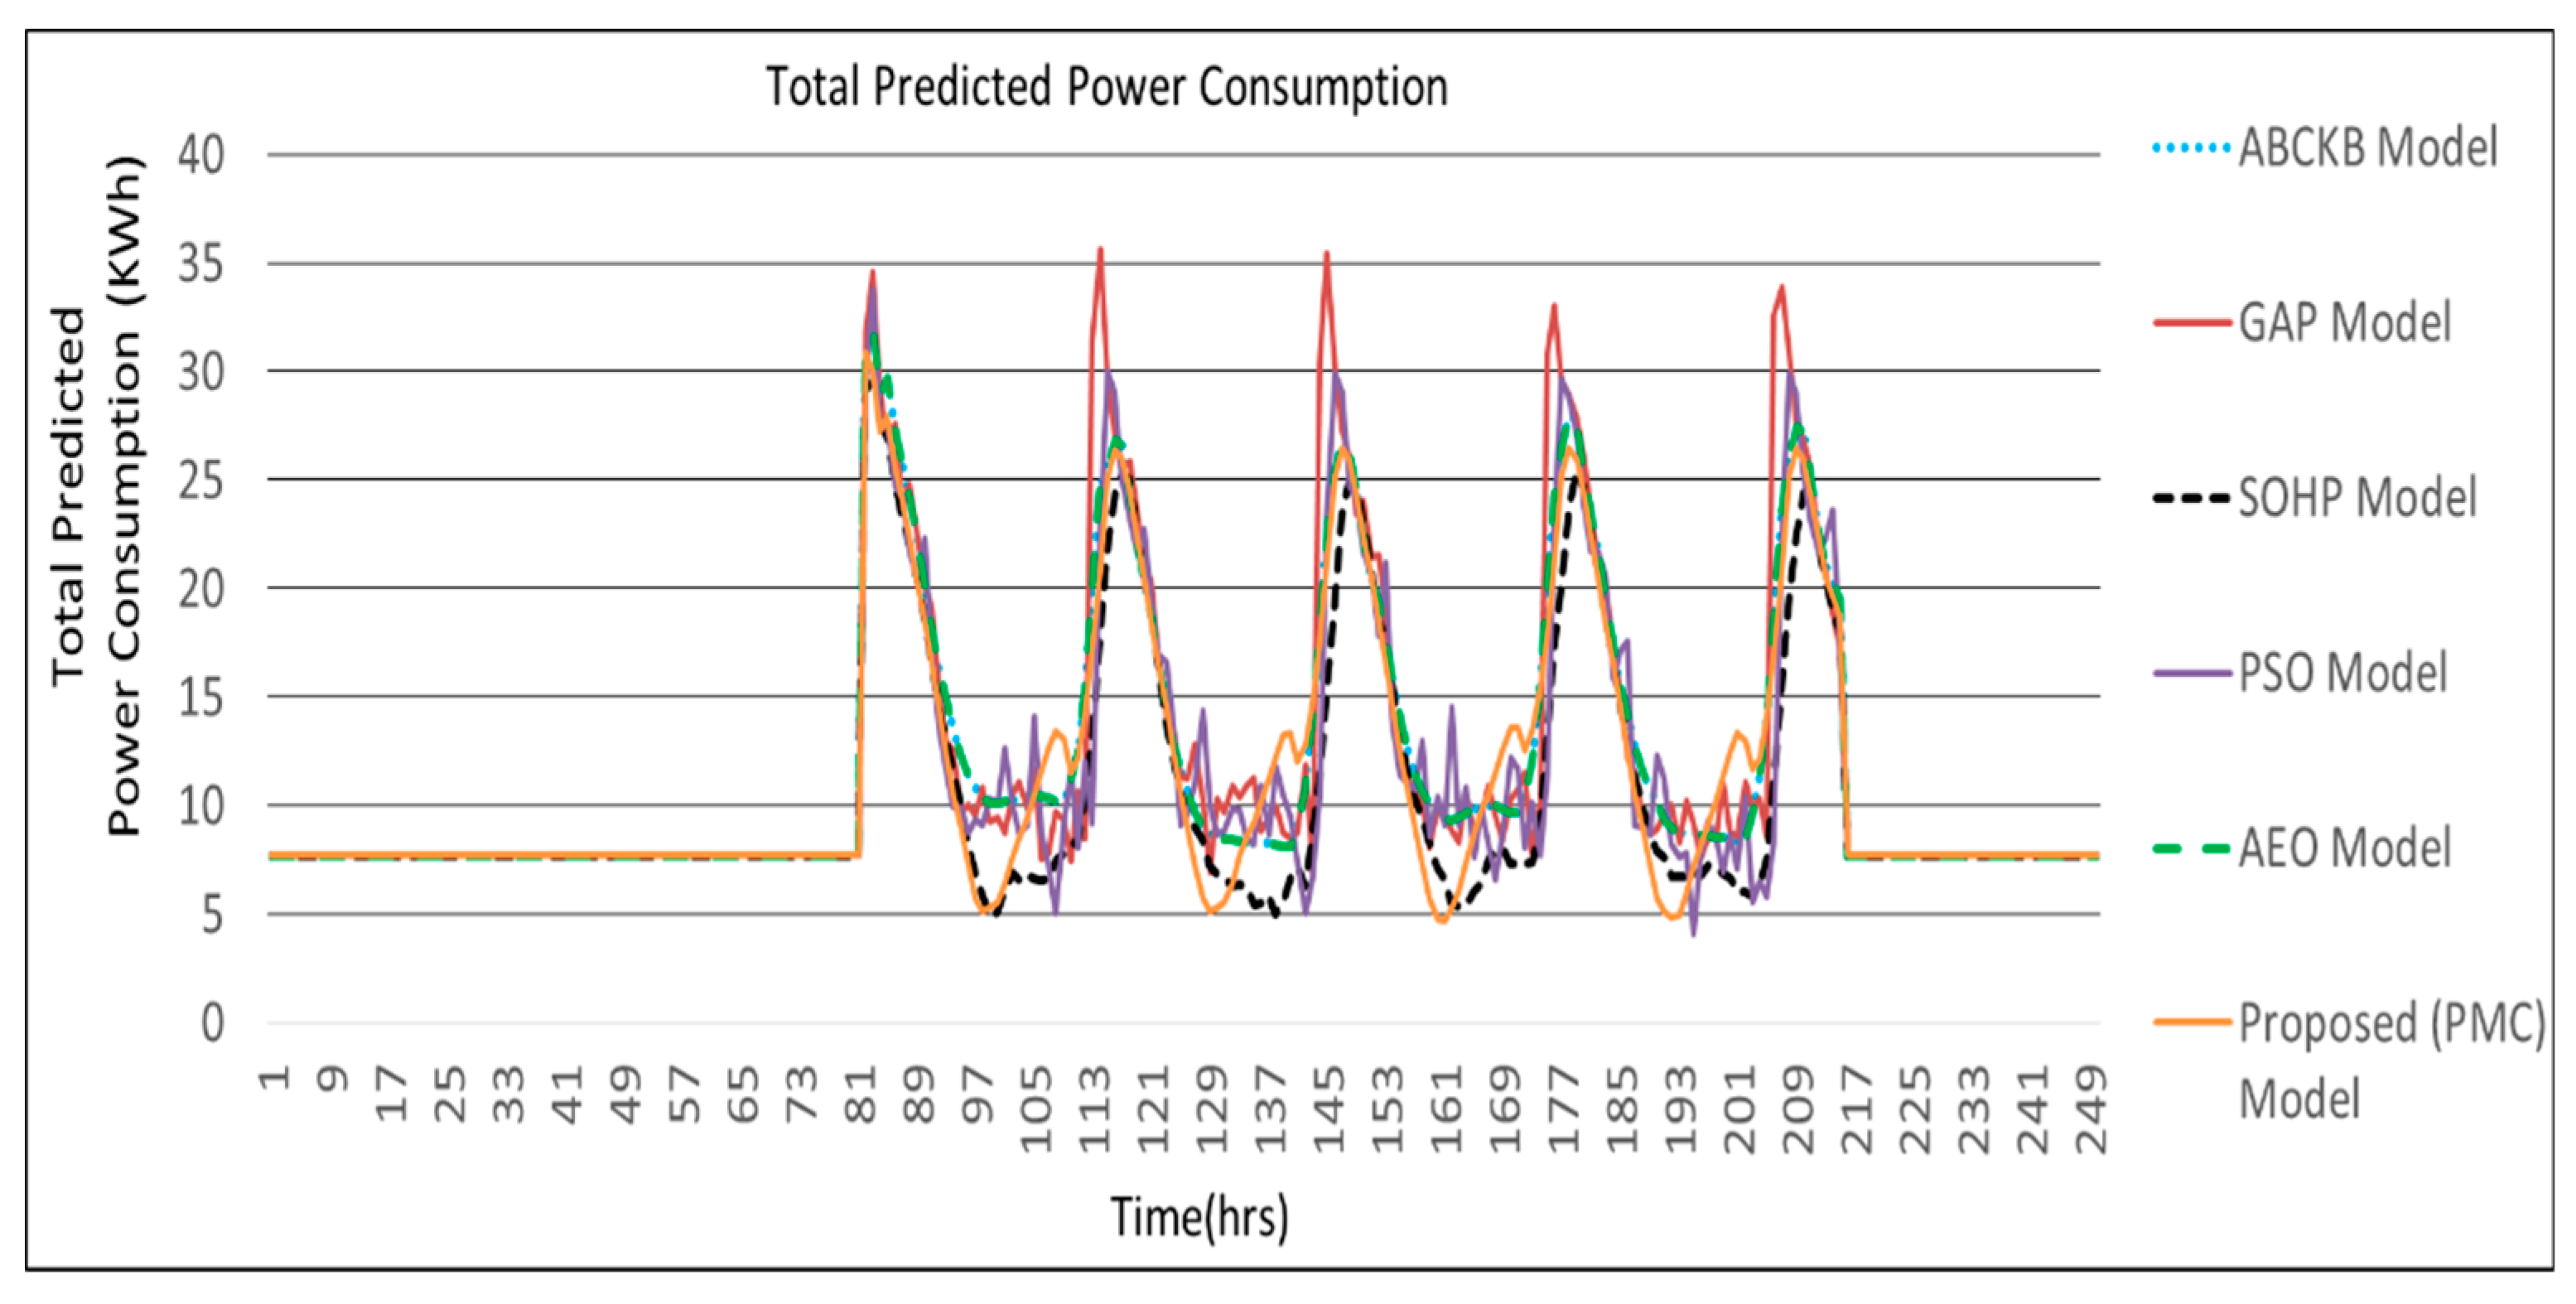
Figure 10.
Comfort value comparisons of frameworks presented in [3,4,5,8,9,10] vs. proposed PMC framework.
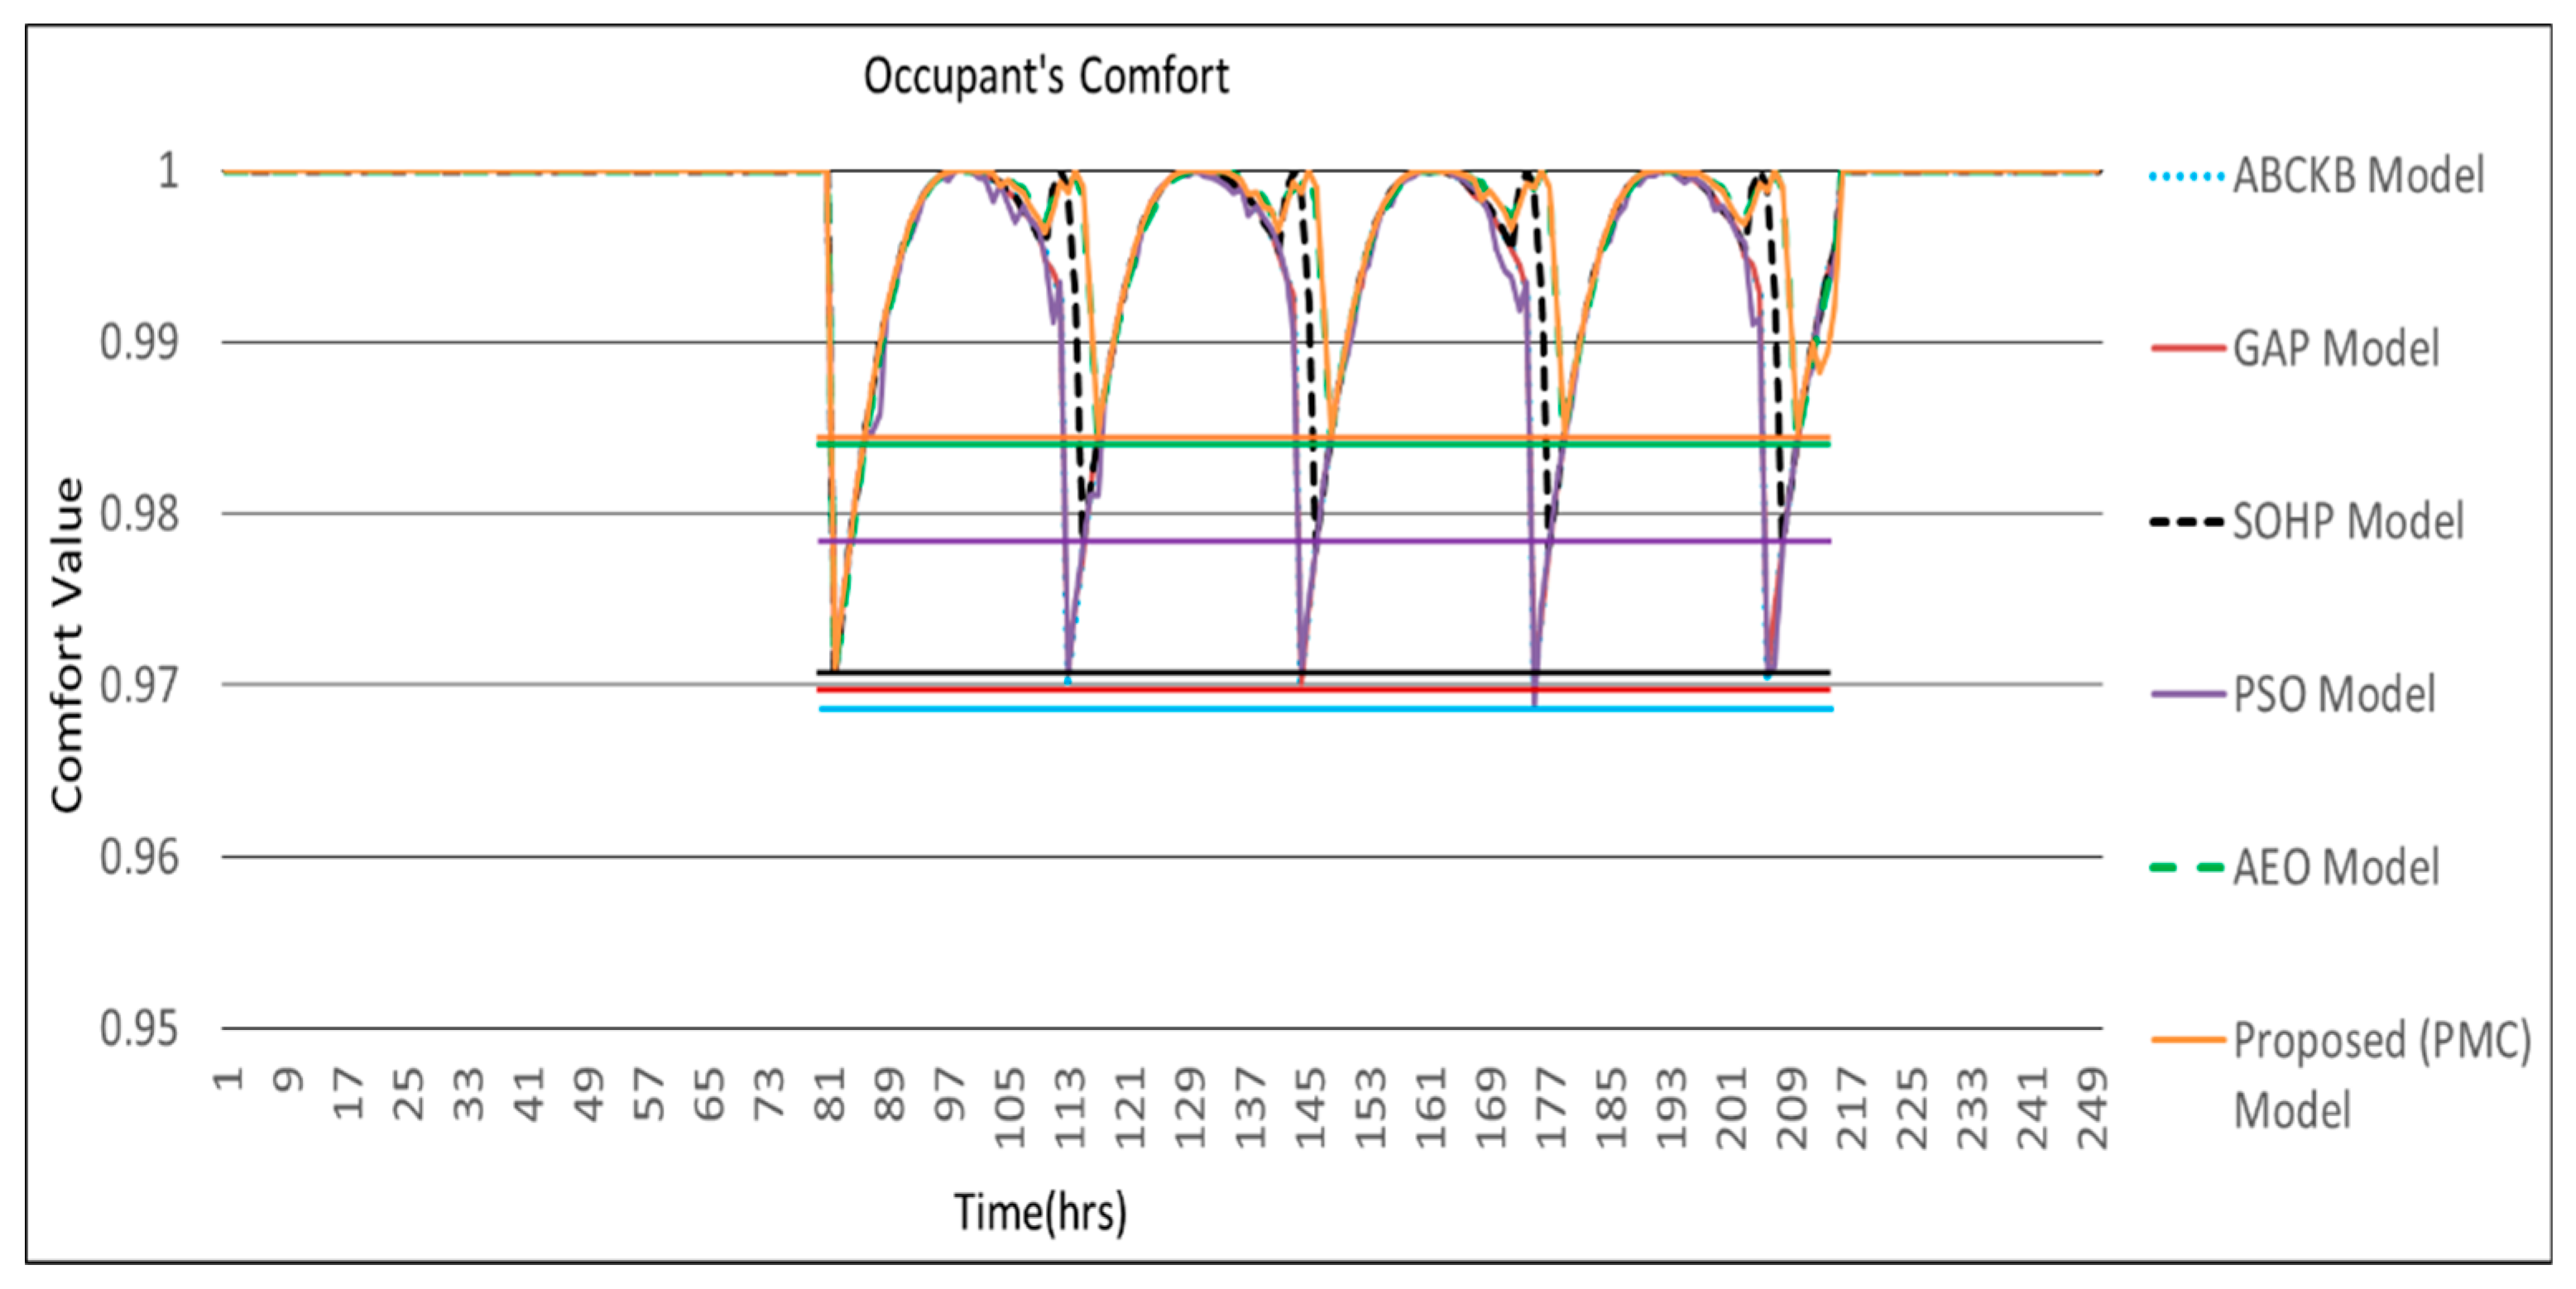

Table 1.
Notations and their descriptions.
| Symbol | Description |
|---|---|
| T | Temperature |
| A | Air-quality |
| L | Illumination |
| SCP | Smooth consumed power |
| CP | Consumed power |
| P(k) | Aggregated power |
| RP | Required power |
| Ω | Total No. of generations |
| eT | Inaccuracy variance in temperature |
| eL | Inaccuracy variance in illumination |
| eA | Inaccuracy variance in air quality |
| ceT | Adjustment of error difference in temperature |
| Tset,, Lset, Aset, | Parameters set by users |
| Pavailable(k) | Aggregated power resources (outside and inside) |
| USP | User set points |
| PCP | Predicted consumed power |
| K | Time |
| OCI | Occupant’s comfort index |
| D | Process power for air quality |
| Pmax(k) | Overall power provided by the outside or inside power sources |
| OP | Optimal P |
| Ģ | Number of successive generations |
| ϴ | Weight element |
Disclaimer/Publisher’s Note: The statements, opinions and data contained in all publications are solely those of the individual author(s) and contributor(s) and not of MDPI and/or the editor(s). MDPI and/or the editor(s) disclaim responsibility for any injury to people or property resulting from any ideas, methods, instructions or products referred to in the content. |
© 2024 by the authors. Licensee MDPI, Basel, Switzerland. This article is an open access article distributed under the terms and conditions of the Creative Commons Attribution (CC BY) license (http://creativecommons.org/licenses/by/4.0/).
Copyright: This open access article is published under a Creative Commons CC BY 4.0 license, which permit the free download, distribution, and reuse, provided that the author and preprint are cited in any reuse.
Submitted:
17 June 2024
Posted:
18 June 2024
You are already at the latest version
Alerts
A peer-reviewed article of this preprint also exists.
This version is not peer-reviewed
Submitted:
17 June 2024
Posted:
18 June 2024
You are already at the latest version
Alerts
Abstract
Without an established energy management plan, human lifestyle improvement is incomprehensible. Adequate energy assets are the key to human lifestyle development, however, energy assets are restricted and exorbitant too. In this paper, an energy control system for a green environment called PMC (Power Management and Control) is proposed. The system is based on hybrid energy optimization, energy prediction, and multi-preprocessing. The blend of GA (Genetic Algorithm) and PSO (Particle Swarm Optimization) is utilized to make a fusion methodology to improve occupant comfort index (OCI) and decrease energy utilization. The main theme of the proposed PMC technique is to improve OCI and decrease energy utilization. The proposed framework gives better OCI when compared with its counterpart Ant Bee Colony along with Knowledge Base framework (ABCKB), GA-based prediction framework (GAP), Hybrid Prediction with Single Optimization framework (SOHP), and PSO-based power consumption framework. Compared with the existing AEO framework, the proposed PMC methodology gives practically the same OCI, but consumes less energy. The proposed PMC methodology additionally accomplished the most extreme OCI (i-e 1) when compared with the existing model FA-GA (i-e 0.98). The proposed PMC model consumed less energy as compared to existing models ABCKB, GAP, PSO and AEO. The proposed model consumed more energy than SOHP but provided better OCI. The comparative outcomes show the viability of the proposed PMC framework in lessening energy utilization and improving the OCI. Unlike other existing mythologies except for the AEO framework, the proposed PMC technique is additionally confirmed through a simulated climate by controlling indoor climate using actuators, like Fan, light, AC and boiler.
Keywords:
Subject: Computer Science and Mathematics - Computer Science
1. Introduction
The two prime design goals in the upcoming smart building sector are the user’s comfort and energy management. The cradle cause is that power consumption utilization rises every day due to enormous growth in domestic applications while its homes of peers are restricted and inflated as well. The customer plans to utilize minimum power without compromising the OCI which constitutes lightning, air quality and temperature. The essential of little power utilization without disturbing the user’s comfort is an attractive issue for the researchers to manage. This creates a big trade-off between power utilization and user comfort [1,2,3,4,5,6,7,8,9,10]. To grip this compromise, a smart, keen and streamlined power control approach is anticipated to retain power usage and OCI at a functional and good level.
In inhabited sustainable buildings, the important constraints that constitute customers’ prominence of lives are air quality, thermal comfort and visual comfort [11].
Temperature identifies the indoor updraft comfort of the users in smart residential buildings. The cooling and heating scheme is practised to preserve the hotness in the smart building’s comfort zone. The illumination index is considered to identify the optical ease of the users in smart and sustainable buildings [12]. The electrical igniting scheme is used to provide visual comfort in energy-efficient smart buildings. CO2 concentration is considered a measure of an index to quantify the air quality in residential and smart buildings. The ventilation system is considered to preserve low CO2 absorption [13]. Proper arrangement of the environmental parameters serves as the user’s comfort in smart and sustainable residential buildings. We selected the three environmental parameters to assess the user’s comfort and energy efficiency in smart and sustainable residential buildings.
This paper presented, PMC, an up-to-date optimized power consumption and prediction framework, which is based on the combination of PSO and GA for OCI and power saving in conjunction with the application of an emulator to adjust the indoor environment. The proposed PMC model is intelligent and addresses both energy saving and OCI at the same time along with control of the indoor environment. The whole existing study discussed above apart from [1,2,3,4,5,6,7,8,9,10,18] either addressed the consumer’s comfort of the building or utilized minimum power, but did not control both at the same time.
The PMC framework is much better as compared to existing frameworks [3,4,5,9,10]. The proposed PMC framework outperforms the existing GAP framework [3], SOHP framework [4], PSO framework [5], ABCKB framework [9] and FA-GA framework [10] in terms of OCI. The proposed framework is verified via an emulator while the existing framework discussed in [1,2,3,4,5,6,7,9,10,11,12,13,14,15,16,17,18,19] does not.
As compared to the previous AEO model [8], the proposed PMC model is designed in such a way as to achieve better results in terms of its defined goals (Energy consumption reduction without compromising users’ OCI). The proposed PMC model improves the results significantly as compared to the previous AEO model as described below.
First, if we talk about the difference in the architectures, then the main component in the proposed model and the previous AEO model is the optimization component. The proposed PMC framework optimizes the input parameters much better than the existing AEO framework. The reason behind this is that in the previous AEO framework, the input data is optimized simultaneously by both the PSO algorithm and GA algorithm, while in the proposed PMC framework the input data is first optimized by the PSO algorithm and then its output parameters are given to the GA algorithm to refine the selected individuals further and give the resultant optimized output. That is why the proposed PMC framework optimizes the parameters much better and provides optimized values to the next component in the architecture.
Second, in terms of energy consumption, the proposed PMC framework consumed less power in case of temperature consumption as compared to its counterpart AEO-based temperature consumption. Additionally, in the case of Illumination, the proposed PMC framework devoured less power when contrasted with the past AEO framework. Similarly, regarding power utilization in the event of air quality, the proposed PMC framework devoured less power when contrasted with the past AEO framework. The total power devoured by the proposed PMC framework is substantially less than the total power usage of the existing AEO framework. This is a significant difference in terms of power consumption between the two frameworks.
The third achievement in this connection is that in the proposed PMC framework the OCI is not disturbed and achieved its high level of OCI as did in the existing AEO model. This implies that the proposed PMC model decreased energy utilization without compromising users’ OCI which is the fundamental objective set and accomplished by the proposed PMC framework when contrasted with the past AEO framework and other existing frameworks [3,4,5,9,10].
2. Related Work
In the past uncountable mechanisms and tools presented in the field of energy efficiency for ecological buildings, and some well-known optimized energy proficient procedures have been presented for smart inhabited buildings. Frameworks dependent on conventional control issues have been introduced in previous works [14,15,16]. These state-of-the-art controllers cover Proportional Integral Derivative (PID) controllers, optimal energy controllers and adaptive energy controllers. The designer used these controllers to overwhelm the overpass of the temperature. There are some genuine imperfections in these controllers, for example, these controllers need a model of the building under consideration and these controllers are not user-friendly as occupants are not involved in choosing the occupant’s comfort. Different troubles that were seen are checking and observing the parameters that are brought about by nonlinear developments. The control of the interior environment of the building at different zone levels has been presented in [17]. The controller is enhanced and the tenant’s tendencies are seen through a smart card segment.
In the comparative issue area, different control applications frameworks are offered which depend on climate assessment [18,19]. The climate assessment has been judicious in the warming, ventilating and cooling framework. Another plan, which depends on a multi-specialist control strategy with data integration, has been introduced in [20]. The multi-specialist-based energy productive framework presents a building interior power and comfort conservation approach built on data merging using order weighted averaging (OWA) accumulation. The multi-specialist-based model accomplished an extraordinary degree of comfort with the least energy usage.
A few individual, public and building features effectively affect clear comfort in places of office areas. The association amongst these variables are especially diverse, so to improve comprehension of the relationship between these elements a model has been introduced in [21]. A multi-environmental approach is introduced in [22] which is appropriate for a particular region in the building as well as in the entire building. The approach emphasizes OCI to give an improved building climate. The approach additionally allows the assessment of both energy utilization and contaminating effects and considers occupants’ comfort in indoor and open-air climates. Artificial neural networks (ANN) have been presented to streamline and control the power consumption [23]. The neural organization-based framework affirms power efficiency and gives better manoeuvres of solar, wind, and hydrogen energy-based hybrid sustainable independent construction. GA is applied for power effectiveness and saving in various ways, for example, GA is implemented for warming, ventilation and cooling issues [24]. The same technique was rehearsed on the control issues of power frameworks, comprising power modules, warm capacity, and warmth siphons [25].
Energy conservation estimating strategies are classified into twofold curricula. One represents time series information gauging frameworks and the second is power assessment procedures based on ANN. The ANN’s framework which keeps magnificent strength and inaccuracy resistance is a compelling framework to take care of complex nonlinear issues. ANN has gotten consideration from analysts because of its unmistakable model and great presentation in taking care of non-linear issues, however, it is difficult to set up an efficient framework for every building.
Formerly ANN has been implemented for energy prediction in indoor environments [26,27,28,29,30,31,32,33]. These mechanisms often put on a neural organization approach, which encompasses numerous parameters. These parameters are consistently decided by knowledge and the framework turns out to be hard to set up [34]. That is why it is hard to make a framework, which is based on the concept of ANN. Besides, it has also been seen that although the neural network (NN) offers little inaccuracy throughout training, the inaccuracy for testing is normally of a bigger order [35]. At the end of the day, when this procedure is applied in real-world scenarios, the forecast precision is not adequate. In addition, the algorithm is expected to change the characters of the multitude of issues into mathematical numbers and modify every interpretation into mathematical computation. There is no doubt that it causes the deficiency of some data, which affects the precision of the prediction. Even though ANN-based price guessing strategies can likewise be utilized for power estimating, however, its drawbacks argued above for price estimating confine its supplementary implementation for energy forecasting.
A procedure dependent on Hidden Markov Model (HMM) is introduced for estimating energy utilization [36]. The technique performs well when contrasted with fundamental forecast frameworks like classification and regression trees, support vector machine and ANN, however, selection of the best HMM model is a tedious cycle.
Fixed time series methodologies, for example, autoregressive (AR) [37], Dynamic Regression (DR), Transfer Function (TF) [38], and non-fixed time series frameworks like Autoregressive Integrated Moving Average (ARIMA) [39] have been contrived to predict power costs previously. These techniques can likewise be carried out for energy estimation as well. A few techniques integrate ANN and autoregressive models to foresee the thermal comportment of business offices [38]. A procedure dependent on autoregressive with exogenous input is proposed to anticipate a 1-hour ahead building energy load [41]. In most recent energy arcades the series of energy depicts the accompanying features: high recurrence, non-consistent mean and fluctuation, day by day and week after week, month to month, irregularity, schedule impact on the end of the week and public occasions, high unpredictability and high level of uncommon energy usage. It is difficult to estimate energy precisely; therefore; it needs to require special supervision in the event of assessing energy changes. Table 1 shows the notations and their meanings used in this paper.
In the same problem area, some evolutionary procedures are also being utilized for assessment in various fields of study which can also be used for energy forecasting. For example, a strategy called the sunflower optimization technique is utilized for forecasting of circuit-based model known as a proton exchange membrane fuel cell (PEMFC) [42]. The model is utilized to lessen the inaccuracy of the amount of squared of anticipated and genuine yield voltage. Another strategy proposed for the decrease of the amount of the squared mistake for PEMFC is introduced in [41]. The two models accomplished satisfactory outcomes and limited the hole between real parameters and anticipated parameters. A hybrid framework for the optimization of cost is introduced in [44]. The approach accomplished better outcomes when contrasted with existing philosophies. A multi-target optimization technique for the heat siphon issue is proposed in [45]. The model delivers better outcomes.
3. Proposed Hybrid Green Energy Efficient System Model
A. System Model
In Figure 1 we show the proposed upgraded energy efficient system model for energy conservation and proficiency in green building climate. Principally, the real input parameters are handed over to the smoothing segment for preprocessing. Afterward, the smoothed parameters and user set parameters are conceded to PSO based optimization part of the system model to develop optimal parameters (OP). The enhanced OP once more passed to the GA segment to further improve the OP. The enhanced OP are utilized as OCI to assess the green buildings’ indoor environment. The reason behind optimizing the parameters twice is to get a much better comfort index with minimum energy consumption. Then the post-processing is carried out to disseminate, analyze and share the outcomes with the consumers. At this point, the OP are once more preprocessed before it can be progressed to the control component. The fundamental objective to smooth and preprocess at this level is to additionally work on the OP and OCI. The OCI is determined yet again by utilizing refreshed OP to improve OCI. This further develops and improves the occupant’s OCI.
Three fuzzy-dependent controllers are used to update the indoor illumination, air quality and temperature. Each fuzzy regulator takes as input, the error difference between smoothed ecological parameters and refreshed OP.
The agent-based coordinator fine-tuned the energy based on optimal and required power from the fuzzy-based regulators and existing power from the external energy grid source or inside residential energy sources. The agent-based controller performs the duty of coordinator between the fuzzy regulators and the available power of the building. The devoured power is again post-processed and the results are distributed and shared with the consumers.
The indoor consumed power (CP) is then preprocessed and it is forwarded to the forecast segment. Smoothing is performed again at this stage to eradicate any lasting exceptions. In the wake of preprocessing the CP is refreshed with amended and smoothed power usage. At this point refreshed and updated CP is forwarded to the Kalman filter component to foresee energy usage. Towards the end, the post-processing technique is again applied to the predicted power to examine the outcomes and share these outcomes with the consumers. The building actuators got message data (MI) given anticipated power utilization to turn ON/OFF.
3.1. Multi-Processing
The multi-preprocessing is carried out for every primary module to preprocess the input data employing a smoothing technique.
The sensing information is additionally monitored to avoid the anomalies of outliers, empty cell information, abnormal structure of the information and irregularity. In case the information is discovered to be anomalous, then merely eliminates the anomaly’s information, zero cell information and brings the information into a standard structure. At the point when the sensing information becomes handled and in the standard structure, it is formerly forwarded to the next component of the framework called optimization.
After optimization, smoothing is once more carried out to smooth the OP, however, this time provisional smoothing is carried out. Provisional smooth indicates, that if the smooth parameters result in debasing OCI, then those parameters are not contenders to make them smooth, else, the parameters are smooth when it brings about improvement in OCI. After smoothing OP, the refreshed OP further developed the OCI. The inaccuracy covariance between smooth real data and refreshed OP is forwarded to the next component called the fuzzy controller. The process of preprocessing/post-preparing is carried out for each part of the model until the data is reached to be offered over to the actuators.
3.2. Optimization
Steps for parameter optimizations and OCI based on PSO and GA [46].
PSO steps for parameters optimizations and OCI are:
-
Initialization
- Setting constants k max, c1, c2, r1, r2, w0
- Random initialization of particle positions xi Є D in Rn for i = 1…p
- Random initialization of particle velocities
- 0 <= v0i<= v0max for i = 1…p
- Set k = 1
-
Optimize
- Evaluate fki for particle X ik
- If f ik <= f ibest then f ibest = f ik, pi = x ik
- If f ik <= f gbest then f gbest = f ik, pg = xik
- Once the stopping norm is reached then move to step iii
- Revise particle velocity vector vik+1
- Updating particle position vector xik+1
- Increasing i (index for particles). If i > pop then increase k (index for iterations), and after this keep i = 1
- Jump to 2 (i)
- Share outcomes
- Dismiss PSO optimization and get OP.
Vi (k+1) = αVi (k) + m1r1 [Pbest(i)(k)] + m2r2[Gbest(k)-xi(k)]
Xi (k+1) = (xi (k) + Vi (k+1))/2
GA phases for OCI and optimization:
- A randomized initial population is defined
- The objective function is calculated for OCI using “(3)”
- Select the best candidates based on the rank-based selection method.
- ‘One point’ crossover is performed
- We get off-springs after crossover
- Comfort for the off-springs is calculated
- Populations of steps (3) and (5) are combined
- Perform mutation, if mutation criteria meet
- The steps from 1 to 8 are frequently repeated up to the required number of iterations
- Select the best-fitted chromosome, after the arrival of termination criteria.
The parameters are chosen by experimenting with the program for λ times to accomplish optimum output. GA breaks when the maximum number of generations is Ģ met, or no substantial variation is detected in the fitness for µ generations. The maximum size of the population is 100. The single point crossover with 0.9 probability and 0.1 rate of mutation is selected. GA stochastic operators (population size, crossover rate and mutation rate) have been set after running GA for λ times. The investigations are accomplished using Intel(R) Core(TM)i3-2130 3.40 GHz with 8GB RAM. The C # 2012 is used for the simulation. When the GA assessment procedure ends, the finest fitted individuals are selected to get OP and OCI.
3.3. Comfort
The user OCI can be determined Use “(3)” [1]
where “OCI” is the targeted fitness function and the objective is to get the maximal value for this function. It designates the complete OCI and it comprises of illumination, temperature and air quality. The OCI shifts somewhere in the range of ‘0’ and ‘1’. ‘0’ signifies least or least OCI and ‘1’ signifies most noteworthy or greatest OCI. β1, β2 and β3 are the consumer distinct factors which settle any probable conflicts between the three occupant’s comfort factors. β1+β2+β3 = 1 at any time. In “(1)” eT is the inaccuracy variance between OP of cutting-edge energy optimization (temperature in this state) and real sensor temperature. The least inaccuracy variance, the extreme will be the OCI. So it can be deducted here that there is an opposite association between OCI and inaccuracy variance of the parameters (T, L, A). As the inaccuracy variance is the input to the fuzzy regulator which affirms, the less inaccuracy variance, the less will be the CP. So in this angle, OCI has a converse relationship with power utilization. The lower the CP, the more elevated will be the OCI.
OCI = β1 [1-(eT/Tset)2] + β2 [1-(eL/Lset)2] + β3 [1-(eA/Aset)2]
So the OCI relies upon the inaccuracy variance for each of the (T, L A) set points. If the inaccuracy variance for each of the defined set points minimizes, the much better will be the OCI and the other way around. This satisfies our essential design targets to limit the power utilization and progress the OCI.
errL is the inaccuracy variance for illumination between OP and real sensor illumination. errA is the inaccuracy variance for air quality between OP and real sensor air quality. Tset, Lset, and Aset are the user set points of temperature, light and air quality.
3.4. Coordinating Agent
The coordinating agent gets the OP of the building from the fuzzy controllers. The agent then updates the power requirements of the building based on existing energy and optimized required power to accomplish the OCI. The acclimated building power is matched with the required power to achieve the actual power utilization. The resultant power of the agent is then forwarded to the subsequent module known as prediction.
PT(k+1) = PT(k)
PL(k+1) = PL(k)
PA(k+1) = PA(k)
PT(k)+PL(k)+PA(k)=Pavailable(k)
Pavailable ≤ Pmax
Equations “(4)”, “(5)”, and “(6)” are available in [3]. Where total energy is P (k) which is equal to the sum of energy load used for illumination, temperature and air quality. Representation of total available power sources is Pavailable, the maximum power which we are using for input to the building from the grid station or local micro power sources is indicated by Pmax (k).
3.5. Fuzzy Logic Controllers
A mathematician Lotfi Aliasker Zadeh who is a well famous scientist at California University at Berkley [47] introduced the theory of fuzziness.
The OP, real parameters and the change of rate in the parameters can be given as input to the fuzzy logic. The power controllers provide output power based on the membership functions. The resultant output of the fuzzy-based controller(s) is the required energy to control the building lighting, temperature and quality of air.
We set three controllers for temperature, lighting and air quality. The input for the temperature controller is the error difference in optimized parameters and real smooth environmental parameters. Besides this, the error in the rate of change ceT in temperature is also considered as input to the temperature controller for efficiency. The fuzzy logic-based illumination, temperature and air-quality controller’s rules and their corresponding input/output membership functions for each of the three controllers i-e illumination, temperature and air-quality are presented in earlier work [2].
In “(9)”, “(10)” and “(11)” [3] γA, γT, and γL are the increment association with utilized energy P in time k for each of the air quality, temperature and illumination. θ signifies the weight factor to balance the corresponding associations.
The value of θ is in between [0, 1] while “d” represents the fundamental operation power of the ventilator.
γT = θ * PT / K
γL = θ * PL / K
γA = θ * PA / K * d
3.6. Kalman Filter
It is one of the best estimators, which can be used for time series data. Naturally, Kalman filter is a recursive technique so that new quantities can be treated, as they are available to use. This filter tackled the overall problem of prediction by trying to predict the state xЄRn of a discrete-time controlled procedure, which is controlled by the standard linear stochastic difference equation. In “(12)” and “(13)”, the random normal distribution variables mt and nt denote the process and measurement noise correspondingly.
The measurement noise covariance R and process noise covariance Q matrices are altered with each time step. In our case, it is assumed constant. In “(12)”, the matrix A relates the state at the last time step t – 1 to the state at the present step t in the lack of process noise. In general, the value of A may vary with each time step t, but here it is assumed as constant. The matrix P relates the optional control input to the state x. The matrix H in “(13)” relates the state to the measurement zt. In general, the value of H may vary with each time step t, but here it is assumed as constant.
Xt = Ax (t-1) + P + m (t-1)
Zt = Hx (t) + nt
m ~ N(0,Q)
n ~ N(0,R)
3.7. Message Information (MI)
Figure 2 and Figure 3 show message information (MI) to switch on/off the cooler and boiler correspondingly. Assuming the MI value is zero, it implies that the indoor temperature environment and optimal temperature are identical, and the respective actuator ought to be shut down. If the MI value is somewhere in the range of 0 & 3, a particular actuator will be switched on in a slow mood. Assume MI brings about value somewhere in the range of 3 & 6 then the actuator will be switched on in medium mood.
If the MI value is more than 6, then the actuator will be switched on at high speed. Figure 2 shows MI to turn on/off the cooler. Here we can see that MI for air-con brings about a value more than zero between 6hrs to 17hrs, so the air-con for this situation is turned on during all levels between these hours, while for the remainder of the time, air-con remains closed including 6hrs and 16hrs. In Figure 3 we can see that the kettle is turned on between 0hrs to 7hrs and between 15hrs to 23hrs. For the remainder of the time, it is turned off due to either running of air-con or environmental parameters and optimal parameters persist identical which means that the indoor environment is enough comfortable. Figure 4 and Figure 5 show MI’s to switch on/off lights and fan correspondingly. For the light, we can see that the MI value results in the middle of 1 and 17 which implies that the light is switched on throughout 24hrs. The light utilization diminishes as the daylight time shows up and upsurges as the daylight time wraps up. As far as the activation of the fan is concerned in Figure 5, we can see that the MI results in a value more than zero i-e between 0hr to 23hrs, so the fan is switched on throughout 24hrs.
3.8. Switching Regulator
The switching regulator oversees the existing power sources. For instance, if the outer energy source is unfit to transfer adequate energy to the building or if the energy is more expensive, then the framework will shift to the in-home power sources and vice versa.
3.9. Building Devices/Gadgets
The building gadgets are the devices, which utilize the power in an indoor environment. The well-known devices used are AC, which is used to make the indoor environment cool, and the boiler is used to make the indoor atmosphere warm and cooler keeping the palatable things at a suitable and ideal temperature. The sensor gadgets are utilized to record environmental information identified with temperature, enlightenment and air quality. In the proposed framework, the actuators got signals displayed in Figure 2, Figure 3, Figure 4 and Figure 5 respectively.
Every actuator has four levels. Level 0, level 1, level 2 and level 3. Level 0 means turn off, level 1 means turn on at slow speed, level 2 means turn on actuator at medium speed and level 3 means turn it on at high speed.
Every emulator got MI to change its present status inside the residential building. At the point when these actuator emulators get MI then the relevant state is altered to refresh the internal environmental conditions. Control signals characterized in subsection 2.1.7 utilized as MI’s to trigger corresponding actuators at various levels.
4. System Implementation and Result Analysis
Simulink and Matlab have been used for input and output membership function formation. The concrete simulation conceded in C# 2012. End-user preference set points range is Lset = [720, 880] (lux), Tset = [66, 78] (Kelvin) and Aset = [700, 880] (ppm). Figure 6, Figure 7, Figure 8 and Figure 9 describes the comparisons of energy consumption. The X-axis demonstrates the time in minutes, while the Y-axis demonstrates the predicted energy consumption in kilowatts/hours. OCI between 0.0 and 1.0 shows the minimum and maximum user OCI correspondingly.
From the results of Figure 6 it can be observed that in the case of power consumption for temperature, the anticipated PMC framework utilized a smaller amount of power as opposed to the GAP framework [3], PSO-based framework [5] and AEO framework [8]. As environmental disruption occurs, the proposed PMC framework utilises a smaller amount of power by comparing it with the GAP framework [3] and PSO framework [5] where no hybrid optimization and multi-preprocessing are involved. Optimized parameters and controllers achieve a lesser amount of power usage. Power consumption in the case of illumination is presented in Figure 7.
The proposed PMC framework utilized the lowermost power by comparing it with its corresponding GAP framework [3], PSO framework [5], and AEO framework [8]. Figure 8 presents the effect of power consumption in the case of air quality. Here the PMC framework utilized lowermost power as compared to its corresponding GAP framework [3], PSO-based framework [5] and AEO framework [8].
Figure 9 demonstrates the total predicted power usage for the proposed PMC framework, GA-based power consumption prediction with no hybrid optimization and multi-preprocessing framework (GAP) [3], SOHP framework [4], PSO-based optimization framework [5], AEO framework [8] and ABCKB framework [9]. The total consumed power of the proposed PMC framework is much less than its counterpart models [3, 5 and 8]. The proposed optimized PMC framework consumes more power as compared to the SOHP framework [4] and ABCKB framework [9] but provides much better OCI.
The power aggravation first time emerges at 82min. The OCI of the proposed PMC model with prediction and multi-preprocessing goes down to 0.97, which is the same to GA based predicted framework GAP [3]. At the point when second-time power unsettling influence happens, the GAP framework quickly goes down when contrasted with the proposed PMC framework. At the time, 114min proposed PMC framework tarnished to 0.999 when contrasted with 0.992 for the SOHP framework [4] and 0.974 for each of the GAP framework [3], PSO framework [5] and ABCKB framework [9].
Essentially in all instances of debasement in power, the proposed PMC framework offers improved OCI when contrasted with existing methodologies GAP [3], SOHP [4], PSO [5], ABCKB [9] and FA-GA framework [10] where no multi-preprocessing applied. So at whatever point there is an environmental aggravation, the proposed PMC framework recuperates OCI soon when contrasted with existing frameworks [3,4,5,8,9,10].
Figure 10 shows the results of OCI for the proposed PMC framework, ABCKB framework, GAP framework, SOHP framework, AEO framework and PSO framework. The proposed PMC framework gives better and more conspicuous OCI when contrasted with existing frameworks [3,4,5,8,9,10]. The horizontal lines here demonstrate the baseline OCI provided by all frameworks during various intervals.
However, in the proposed PMC model, less power is utilized in contrast with that of the GAP framework, PSO framework and AEO framework, yet the proposed PMC model accomplished extraordinary and better OCI. In existing frameworks, the SOHP framework is much better than the GAP framework, PSO framework, ABCKB framework and FA-GA framework as far as OCI is concerned.
5. Conclusions
In this research paper, a hybrid power optimization and control methodology for OCI and energy conservation using intelligent algorithms GA and PSO in conjunction with multi-preprocessing called PMC is introduced. The paper tends to address both the energy effectiveness and OCI in a green environment. To affirm the user’s contact with the framework, the user’s set points are considered in characterizing the OCI. The distinction of the proposed work is to upsurge OCI according to user preferences and abate energy usage. The proposed PMC framework depends on hybrid energy optimization and multi-preprocessing together with the control of building actuators. The actuators of the building got message data from the proposed PMC framework and worked likewise. The proposed PMC framework utilized hybrid optimization based on GA and PSO techniques to optimise the environmental parameters and afterwards foresee power utilization using Kalman filter. The parameters we improved are temperature, lightning and air quality, which reveal the OCI in a smart environment.
The proposed PMC model is compared with recent existing methodologies GA-based forecast GAP framework [3], SOHP framework [4], PSO framework [5], AEO framework [8], ABCKB framework [9] and FA-GA framework [10]. The proposed optimization and power control PMC framework contributes unique and better OCI when compared with its partners GAP framework [3], SOHP framework [4], PSO framework [5], ABCKB framework [9] and FA-GA framework [10]. The proposed PMC framework additionally accomplished (greatest OCI as 1, average OCI as 0.99 and least OCI as 0.970) when compared with the existing FA-GA framework [10] (greatest OCI as 0.987, average OCI as 0.965, and least OCI as 0.957). The proposed PMC framework devoured substantially less power as compared with its partner GAP framework [3], PSO framework [5] and AEO framework [8]. The PMC framework gives practically the same OCI when compared with the AEO framework [8], however, consumes substantially less power than AEO. Using the proposed PMC power control framework for a smart environment, the building’s indoor environment can be made pleasant according to user-set points. The proposed PMC intelligent methodology is also confirmed through an emulator as compared to existing frameworks [3,4,5,9,10]. For real applications, the PMC framework can be incorporated with the SCADA software of buildings.
In future, we plan to further improve the occupant’s comfort index and minimize energy consumption by applying ensembles of other evolutionary techniques such as Ant Colony Optimization (ACO) with GA, and ACO with PSO.
Author Contributions
Conceptualization, D.K. and S.A.; methodology, S.A.; software, S.A.; validation, D.K. and S.A.; formal analysis, S.A.; investigation, S.A and K.H.; resources, D.K.; data curation, D.K.; writing—original draft preparation, S.A.; writing—review and editing, S.A., K.H., A.k and I.H; visualization, S.A. and A.K.; supervision, D.K.; project administration, D.K.; funding acquisition, D.K. All authors have read and agreed to the published version of the manuscript.
Funding
This work was supported by Institute of Information & communications Technology Planning & Evaluation (IITP) grant funded by the Korea government(MSIT) (No.2021-0-02068, Artificial Intelligence Innovation Hub) and this research was supported by “Regional Innovation Strategy (RIS)” through the National Research Foundation of Korea(NRF) funded by the Ministry of Education(MOE) (2023RIS-009) Corresponding author: Dohyeun Kim (e-mail: kimdh@jejunu.ac.kr)
Acknowledgements
We would like to present a bundle of thanks to the Institute of Information & communications Technology Planning & Evaluation (IITP) grant funded by the Korea government(MSIT) (No.2021-0-02068, Artificial Intelligence Innovation Hub) and this research was supported by “Regional Innovation Strategy (RIS)” through the National Research Foundation of Korea(NRF) funded by the Ministry of Education(MOE) (2023RIS-009) Corresponding author: Dohyeun Kim (e-mail: kimdh@jejunu.ac.kr)
Conflicts of Interest
Authors have no conflict of interest.
References
- Ali, S.; Kim, DH. Optimized power control and comfort management in building environment. FTRA-AIM Advanced IT, Engineering and Management Conference, 2013, pp. 145-146.
- Ali, S.; Kim, D.-H. Effective and Comfortable Power Control Model Using Kalman Filter for Building Energy Management. Wirel. Pers. Commun. 2013, 73, 1439–1453. [CrossRef]
- Ali, S.; Kim, D.-H. Optimized Power Control Methodology Using Genetic Algorithm. Wirel. Pers. Commun. 2015, 83, 493–505. [CrossRef]
- Ali, S.; Kim, D. Enhanced power control model based on hybrid prediction and preprocessing/post-processing. J. Intell. Fuzzy Syst. 2016, 30, 3399–3410. [CrossRef]
- Wang, Z.; Yang, R.; Wang, L. Multi-agent control system with intelligent optimization for smart and energy-efficient buildings. In Proceedings of the IECON 2010—36th Annual Conference on IEEE Industrial Electronics Society, Glendale, AZ, USA, 7–10 November 2010; pp. 1144–1149. [CrossRef]
- Dounis, A.; Caraiscos, C. Advanced control systems engineering for energy and comfort management in a building environment—A review. Renew. Sustain. Energy Rev. 2008, 13, 1246–1261. [CrossRef]
- Wang, Z.; Yang, R.; Wang, L. Multi-agent intelligent controller design for smart and sustainable buildings. In Proceedings of the 2010 IEEE International Systems Conference, San Diego, CA, USA, 5–8 April 2010.
- Ali, S.; Kim, D.-H. Simulation and Energy Management in Smart Environment Using Ensemble of GA and PSO. Wirel. Pers. Commun. 2020, 114, 49–67. [CrossRef]
- Wahid, F.; Ghazali, R.; Ismail, L.H. An Enhanced Approach of Artificial Bee Colony for Energy Management in Energy Efficient Residential Building. Wirel. Pers. Commun. 2018, 104, 235–257. [CrossRef]
- Wahid, F.; Fayaz, M.; Aljarbouh, A.; Mir, M.; Aamir, M.; Imran Energy Consumption Optimization and User Comfort Maximization in Smart Buildings Using a Hybrid of the Firefly and Genetic Algorithms. Energies 2020, 13, 4363. [CrossRef]
- Emmerich, S. J.; Persily, A. K. State-of-the-art review of CO2 demand controlled ventilation technology and application. National Institute of Standards and Technology, Technology Administration, US, Department of Commerce, 2001.
- Levermore, G. J. Building Energy Management Systems: An Application to Heating, Natural Ventilation, Lighting and Occupant Satisfaction, 2nd ed., London, E & FN SPON, 1992.
- Bernard, C.; Guerrier, B.; Rasset-Louerant, M. M. Optimal building energy management. Part II: Control. ASME Journal of Solar Energy Engineering 1982, 114, 13–22. [CrossRef]
- Curtis, P. S.; Shavit, G.; Kreider, K. Neural networks applied to buildings—a tutorial and case studies in prediction and adaptive control. ASHRAE Transactions 1996, 102, 732–737.
- Kolokotsa, D.; Stavrakakis, G.; Kalaitzakis, K.; Agoris, D. Genetic algorithms optimized fuzzy controller for the indoor environmental management in buildings implemented using PLC and local operating networks. Eng. Appl. Artif. Intell. 2002, 15, 417–428. [CrossRef]
- Kusiak, A.; Li, M.; Zhang, Z. A data-driven approach for steam load prediction in buildings. Appl. Energy 2010, 87, 925–933. [CrossRef]
- Široký, J.; Oldewurtel, F.; Cigler, J.; Prívara, S. Experimental analysis of model predictive control for an energy efficient building heating system. Appl. Energy 2011, 88, 3079–3087. [CrossRef]
- Mossolly, M.; Ghali, K.; Ghaddar, N. Optimal control strategy for a multi-zone air conditioning system using a genetic algorithm. Energy 2009, 34, 58–66. [CrossRef]
- Wang, Z.; Wang, L.; Dounis, A.I.; Yang, R. Multi-agent control system with information fusion based comfort model for smart buildings. Appl. Energy 2012, 99, 247–254. [CrossRef]
- Bluyssen, P.M.; Aries, M.; van Dommelen, P. Comfort of workers in office buildings: The European HOPE project. J. Affect. Disord. 2011, 46, 280–288. [CrossRef]
- Marino, C.; Nucara, A.; Pietrafesa, M. Proposal of comfort classification indexes suitable for both single environments and whole buildings. J. Affect. Disord. 2012, 57, 58–67. [CrossRef]
- Yumurtaci, R. Role of Energy Management in Hybrid Renewable Energy Systems: Case Study Based Analysis Considering Varying Seasonal Conditions. Turk. J. Electr. Eng. Comput. Sci. 2013, 21, 1077–1091. [CrossRef]
- Huang, W.; Lam, H. Using genetic algorithms to optimize controller parameters for HVAC systems. Energy Build. 1997, 26, 277–282. [CrossRef]
- Obara, S.; Kudo, K. Multiple-purpose operational planning of fuel cell and heat pump compound system using genetic algorithm. Transaction of the Society of Heating, Air-Conditioning and Sanitary Engineers of Japan 2003, 9, 65–75.
- Radisa, Z. J.; Aleksandra, A. S.; Branislav, D. Z. Ensemble of various neural networks for prediction of heating energy consumption. Energy and Buildings 2015, 94, 189–199. [CrossRef]
- Kangji, Li.; Chenglei, Hu.; Guohai, Liu.; Wenping, Xue. Building’s electricity consumption prediction using optimized artificial neural networks and principal component analysis. Energy and Buildings 2015, 108, 106–113. [CrossRef]
- Betul, B. E.; Aksoy, U. T. Prediction of building energy consumption by using artificial neural networks. Energy and Buildings 2009, 40, 356–362. [CrossRef]
- Wong, S.; Wan, K.K.; Lam, T.N. Artificial neural networks for energy analysis of office buildings with daylighting. Energy and Buildings 2010, 87, 551–557. [CrossRef]
- Melek, Y. Energy-savings predictions for building-equipment retrofits. Energy and Buildings 2008, 40, 2111–2120. [CrossRef]
- Sandels, C.; Widén, J.; Nordström, L.; Andersson, E. Day-ahead predictions of electricity consumption in a Swedish office building from weather, occupancy, and temporal data. Energy Build. 2015, 108, 279–290. [CrossRef]
- Lapedes, R.; Farber, R. Nonlinear signal processing using neural networks: prediction and system modeling, Technical report LA-VR87-2662. Los Alamos, New Mexico: Los Alamos National Laboratory, 1987.
- Jin, X.-B.; Zheng, W.-Z.; Kong, J.-L.; Wang, X.-Y.; Bai, Y.-T.; Su, T.-L.; Lin, S. Deep-Learning Forecasting Method for Electric Power Load via Attention-Based Encoder-Decoder with Bayesian Optimization. Energies 2021, 14, 1596. [CrossRef]
- William, G.; Fu-Kwun W.; Zemenu, E. A.; “Electricity Load and Price Forecasting Using a Hybrid Method Based Bidirectional Long Short-Term Memory with Attention Mechanism Model,” international journal of energy research, 2023. [CrossRef]
- Van, E. R. J. The application of neural network in the forecasting of share prices, Finance and Technology Publishing, 1996.
- Rodriguez, C.; Anders, G. Energy Price Forecasting in the Ontario Competitive Power System Market. IEEE Trans. Power Syst. 2004, 19, 366–374. [CrossRef]
- Ullah, I.; Ahmad, R.; Kim, D. A Prediction Mechanism of Energy Consumption in Residential Buildings Using Hidden Markov Model. Energies 2018, 11, 358. [CrossRef]
- Li, G.; Liu, C.-C.; Mattson, C.; Lawarree, J. Day-Ahead Electricity Price Forecasting in a Grid Environment. IEEE Trans. Power Syst. 2007, 22, 266–274. [CrossRef]
- Hong, Y.-Y.; Lee, C.-F. A neuro-fuzzy price forecasting approach in deregulated electricity markets. Electr. Power Syst. Res. 2005, 73, 151–157. [CrossRef]
- Mustafaraj, G.; Lowry, G.; Chen, J. Prediction of room temperature and relative humidity by autoregressive linear and nonlinear neural network models for an open office. Energy Build. 2011, 43, 1452–1460. [CrossRef]
- Kyungtae, Y.; Rogelio, L.; Pedro, J. M.; Heejin, C. Building hourly thermal load prediction using an indexed ARX model. Energy and Buildings 2012, 54, 225–233. [CrossRef]
- Kim, Y.; Son, H.-G.; Kim, S. Short term electricity load forecasting for institutional buildings. Energy Rep. 2019, 5, 1270–1280. [CrossRef]
- Yuan, Z.; Wang, W.; Wang, H.; Razmjooy, N. A new technique for optimal estimation of the circuit-based PEMFCs using developed Sunflower Optimization Algorithm. Energy Rep. 2020, 6, 662–671. [CrossRef]
- Yang, Z.; Liu, Q.; Zhang, L.; Dai, J.; Razmjooy, N. Model parameter estimation of the PEMFCs using improved Barnacles Mating Optimization algorithm. Energy 2020, 212, 118738. [CrossRef]
- Guo, Y.; Dai, X.; Jermsittiparsert, K.; Razmjooy, N. An optimal configuration for a battery and PEM fuel cell-based hybrid energy system using developed Krill herd optimization algorithm for locomotive application. Energy Rep. 2020, 6, 885–894. [CrossRef]
- Fan, X.; Sun, H.; Yuan, Z.; Li, Z.; Shi, R.; Razmjooy, N. Multi-objective optimization for the proper selection of the best heat pump technology in a fuel cell-heat pump micro-CHP system. Energy Rep. 2020, 6, 325–335. [CrossRef]
- Holland, J. H. Adaptation in natural and artificial systems, Ann Arbor, MI, the University of Michigan Press, 1975.
- Zadeh, L. A. Fuzzy algorithms. Information and Control 1968. 12, 94-102.
Figure 1.
Hybrid energy optimization model.
Figure 2.
Control messages for air-con based on the proposed framework.
Figure 3.
Control messages for boiler based on the proposed framework.
Figure 4.
Control messages for light based on the proposed framework.
Figure 5.
Control messages for fan based on the proposed framework.
Figure 6.
Proposed PMC framework based on predicted power consumption vs. ABCKB vs. GAP versus SOHP vs. PSO vs. AEO framework for temperature.
Figure 6.
Proposed PMC framework based on predicted power consumption vs. ABCKB vs. GAP versus SOHP vs. PSO vs. AEO framework for temperature.
Figure 7.
Proposed PMC framework based on predicted power consumption vs. ABCKB vs. GAP vs. SOHP vs. PSO vs. AEO model for illumination.
Figure 7.
Proposed PMC framework based on predicted power consumption vs. ABCKB vs. GAP vs. SOHP vs. PSO vs. AEO model for illumination.
Figure 8.
Proposed PMC framework based on predicted power consumption vs. ABCKB vs. GAP versus SOHP vs. PSO vs. AEO framework for air quality.
Figure 8.
Proposed PMC framework based on predicted power consumption vs. ABCKB vs. GAP versus SOHP vs. PSO vs. AEO framework for air quality.
Figure 9.
Proposed PMC framework based on total predicted power consumption vs. ABCKB vs. GAP vs. SOHP vs. PSO vs. AEO framework.
Figure 9.
Proposed PMC framework based on total predicted power consumption vs. ABCKB vs. GAP vs. SOHP vs. PSO vs. AEO framework.
Figure 10.
Comfort value comparisons of frameworks presented in [3,4,5,8,9,10] vs. proposed PMC framework.
Table 1.
Notations and their descriptions.
| Symbol | Description |
|---|---|
| T | Temperature |
| A | Air-quality |
| L | Illumination |
| SCP | Smooth consumed power |
| CP | Consumed power |
| P(k) | Aggregated power |
| RP | Required power |
| Ω | Total No. of generations |
| eT | Inaccuracy variance in temperature |
| eL | Inaccuracy variance in illumination |
| eA | Inaccuracy variance in air quality |
| ceT | Adjustment of error difference in temperature |
| Tset,, Lset, Aset, | Parameters set by users |
| Pavailable(k) | Aggregated power resources (outside and inside) |
| USP | User set points |
| PCP | Predicted consumed power |
| K | Time |
| OCI | Occupant’s comfort index |
| D | Process power for air quality |
| Pmax(k) | Overall power provided by the outside or inside power sources |
| OP | Optimal P |
| Ģ | Number of successive generations |
| ϴ | Weight element |
Disclaimer/Publisher’s Note: The statements, opinions and data contained in all publications are solely those of the individual author(s) and contributor(s) and not of MDPI and/or the editor(s). MDPI and/or the editor(s) disclaim responsibility for any injury to people or property resulting from any ideas, methods, instructions or products referred to in the content. |
© 2024 by the authors. Licensee MDPI, Basel, Switzerland. This article is an open access article distributed under the terms and conditions of the Creative Commons Attribution (CC BY) license (http://creativecommons.org/licenses/by/4.0/).
Copyright: This open access article is published under a Creative Commons CC BY 4.0 license, which permit the free download, distribution, and reuse, provided that the author and preprint are cited in any reuse.
An Improved Optimization Function for Maximizing User Comfort with Minimum Energy Consumption in Smart Homes
Israr Ullah
et al.
Energies,
2017
Time-Constrained Nature-Inspired Optimization Algorithms for an Efficient Energy Management System in Smart Homes and Buildings
Ibrar Ullah
et al.
Applied Sciences,
2019


MDPI Initiatives
Important Links
© 2024 MDPI (Basel, Switzerland) unless otherwise stated