
Submitted:
17 June 2024
Posted:
18 June 2024
You are already at the latest version
Abstract
The rapid urbanization in China has significantly contributed to the vast expansion of urban built-up areas. Precisely extracting and monitoring these areas is crucial for understanding and optimizing the developmental process and spatial attributes of smart, compact cities. However, most existing studies tend to focus narrowly on a single city or global scale with a single dimension, often ignoring mesoscale analysis across multiple urban agglomerations. In contrast, our study employs GIS and image processing techniques to integrate multi-source data for the identification of built-up areas. We specifically compare and analyze two representative urban agglomerations in China: the Yangtze River Delta (YRD) in the east and the Chengdu-Chongqing (CC) region in the west. We use different methods to extract built-up areas from socio-economic factors, natural surfaces, and traffic network dimensions. Additionally, we utilize a high-precision built-up area dataset of China as a reference for verification and comparison. Our findings reveal several significant insights: (1) The multi-source data fusion approach effectively enhances the extraction of built-up areas within urban agglomerations, achieving higher accuracy than previously employed methods. (2) Our research methodology performs particularly well in the CC urban agglomeration. The average precision rate in CC is 96.03%, while the average precision rate in YRD is lower at 80.33%. This study provides an objective and accurate assessment of distribution characteristics and internal spatial structure of built-up areas within urban agglomerations. This method offers a new perspective for identifying and monitoring built-up areas in Chinese urban agglomerations.
Keywords:
urban cluster
; nighttime light (NTL) data
; point of interest (POI) data
; built-up area identification
1. Introduction
Currently, China is experiencing rapid urbanization growth. However, urban development is encountering increasingly prominent issues, such as disordered spatial distribution, lack of synergy between regional development, and significant pressure on natural resources and the environment [1]. Urban agglomeration in China serves as the primary form of new-type urbanization and the spatial carrier to address the new economic normal [2]. It accommodates over 80 percent of the population and contributes nearly 90 percent of the GDP. City clusters will continue to play a crucial role in high-quality development in this new era. Therefore, scientifically identifying built-up area boundaries is essential for understanding the development patterns of urban agglomerations, diagnosing urban system problems, and achieving efficient layout of regional functional space through scientific development planning.
The concept of an urban built-up area refers to an area within an urban administrative region that has been developed and constructed with basic municipal public facilities available. In practical terms, it represents a densely constructed surface space with both municipal public facilities and supporting public facilities simultaneously present [3]. When delineating the scope of urban built-up areas, factors such as natural topography, landforms, management boundaries of grass-roots administrative units should be considered while maintaining consistency with geographical population statistics where possible [4]. The feature extraction method based on single dimension may have limitations when identifying built-up areas on city outskirts.
Domestic and foreign scholars have used different geographical spatial big data to study the boundary identification of built-up areas. It mainly includes the recognition method based on social and economic statistics data, the recognition method based on remote sensing image interpretation, and the fusion recognition method combining POI and remote sensing image [5,6]. However, at present, there is still a lack of urban identification analysis combining social economy, natural conditions and traffic network. In addition, most of the existing studies focus on a single city or global scale, and there is a lack of mesoscale studies for multiple urban agglomerations.
Traditional methods of urban agglomeration built-up area boundary research focus on the differentiation of urban levels, and select indicators related to urban development and establish an urban indicator system through qualitative evaluation with the help of basic geographical theories such as “pole-axis” theory, “center-periphery” theory and urban hinterland theory [7,8,9,10]. With the deepening of the research, other scholars determined the boundary from different angles through a combination of quantitative and qualitative methods, using POI data [11], population data [12] and land price [13]. The advantage of this method is that the indicators and data are easily available, and the disadvantage is that it is highly subjective.
With the rapid development of remote sensing technology and the updating of research methods, the traditional top-down approach using only socio-economic indicators to identify small metropolitan areas has been replaced by more advanced methods. This requires the definition of large-scale urban agglomerations and interconnected metropolitan areas based on remote sensing images [15]. Compared with traditional methods, remote sensing images provide better spatial characteristics of urban landscape and infrastructure [16], which helps to characterize the scope of human activities or the physical distribution pattern of cities and towns. Recent studies have focused on extracting impervious surfaces from satellite images to represent actual urban areas because they have higher resolution and lower threshold dependence [17]. In order to obtain a more objective understanding of urban built-up area boundaries, scholars have proposed morphological analysis methods based on remote sensing interpretation, such as identifying the actual scope of urban space through information such as night light intensity [18], land vegetation coverage rate or building coverage rate [19]. Indicators such as the density of economic activities, the intensity of economic ties with the central city, land use and building density are constructed as the reference basis for dividing the boundaries of urban built-up areas.
In general, the existing research has shifted from the identification of spatial scope to the detection of spatial pattern characteristics within urban agglomerations, and gradually shifted from single-dimensional feature analysis to the construction of multi-dimensional feature index. However, the research difficulties of multi-dimensional analysis, such as data fusion algorithm and multi-source data unification, have not been thoroughly developed [25]. In addition, the relevant research of developed urban agglomerations such as the eastern coastal areas of China is relatively abundant, while the research of developing urban agglomerations in the central and western regions is still vacant for the time being. In this study, the YRD and CC city clusters have been selected for comparative analysis. The main reason for this selection is that the YRD is situated on the east coast of China, with a flat terrain and strong economic vitality. In contrast, the CC is located in the central and western inland of China, characterized by mountains and hills, and relatively insufficient economic power [26,27,28,29]. The comparison of these representative urban agglomerations can enrich existing regional economic theory analysis and provide valuable insights for promoting high-quality development of urban agglomerations in China. The main purpose of our research is to explore a strategy for the recognition of built-up area with a shorter time update cycle on the premise of ensuring a certain accuracy. Our main research topics are:
(1) Urban agglomeration built-up area identification. The built-up area is identified from three dimensions: social economy, natural coverage and traffic accessibility.
(2) Delineate the evaluation of recognition results. We conduct qualitative and quantitative assessments reliability in terms of consistency and integrity of built-up area delineation results.
(3) Summarize the built-up area characteristics of urban agglomerations in different regions. Using spatial analysis techniques, we conduct a comparative analysis of representative urban agglomerations in eastern and western China.
The main innovations of this study are as follows:
(1) Quantitative and comparative analysis of the development status of the Yangtze River Delta and Chengdu-Chongqing urban agglomerations has broadened the scope of existing research and improved the lack of scientific data support for qualitative research on urban agglomerations development.
(2) Three different technical routes were adopted to determine the built-up area boundaries of the Yangtze River Delta and Chengdu-Chongqing urban agglomeration from multiple perspectives, which improved the problem that a single index could not accurately reflect the internal heterogeneity of the urban edge.
(3) Multi-source data fusion method is used to improve the accuracy of urban agglomeration built-up area identification.
2. Materials and Methods
2.1. Study Area
The study focuses on the urban agglomerations with the highest population density and economic activity in China. Specifically, the study areas selected are the Yangtze River Delta (YRD) urban agglomeration and the Chengdu–Chongqing urban agglomeration (CC) (Figure 1).
According to a Chinese government report in 2023, YRD’s GDP has consistently accounted for approximately 24% of China’s GDP, demonstrating a stable development trend. Despite occupying only 4% of the land area, YRD urban agglomeration has contributed nearly a quarter of the country’s economy. CC’s GDP has reached 819.88 billion yuan, representing 6.5% of China’s GDP and 30.4% of western China’s GDP respectively. Rapid urbanization has led to various issues such as low resource utilization rates, ecosystem degradation, and frequent natural disasters in many regions. As part of China’s 14th Five-Year Plan, there is an emphasis on reinforcing economic and population-carrying capabilities by focusing on central cities, city clusters, and other advantageous regions for economic development. The outline underscores the importance of YRD as a leading force for promoting high-quality development in China while also highlighting CC’s growth into “the fourth pole” of China’s economic growth. This illustrates their critical roles in China’s regional strategies and improving the spatial layout of urbanization process.
2.2. Study Data
2.2.1. Land Use Data
The China Land Cover Dataset is an annual land cover dataset of China produced by Wuhan University based on 335,709 Landsat data from Google Earth Engine. The data set contains yearly land improvement information in China from 1985 to 2020. Based on the Landsat data obtained, the research team constructed temporal and spatial characteristics, combined with the random forest classifier to obtain classification results, and proposed a post-processing method including temporal and spatial filtering and logical reasoning to further improve the temporal and spatial consistency of CLCD. The overall accuracy of this dataset is 80%.
The greatest strength of the dataset is the 30 meters of land use classification per year, which covers a continuous period of 30 years. Compared with other products such as GLC FCS30, Gobal30, FROM-GLC10, ESA10, ESRI10, CLCD has higher temporal resolution, and the current data set is only for China.
2.2.2. Nighttime Light Data
In 2012, Visible Infrared lmaging Radiometer Suite carried by National Polar-Orbiting Partnership System of the United States provided a new generation of night light remote sensing data. Compared with DMSP/OLS data, it has many advantages, such as high image resolution (about 500 m), eliminating the oversaturation phenomenon of light, and comparability of data at different times, which further expands the research and application field of nighttime light remote sensing. The 2020 NPP-VIIRS monthly composite data used in this study were downloaded from National Oceanic and Atmospheric Administration’s National Geophysical Data Center (https://www.ngdc.noaa.gov).
2.2.3. LST and NDVI Data
The Moderate-resolution Imaging Spectroradiometer (MODIS) is a primary sensor aboard the Terra and Aqua series of satellites. MODIS provided continuous spatial-temporal LST and NDVI datasets for this study. MOD11A2 eight days synthesized 1-km-resolution LST Day-and-Night data and Normalized Difference Vegetation Index (NDVI) band data were acquired from the United States Geological Survey (https://earthexplorer.usgs.gov/). To maintain the stability of the data, we calculated the 2020 annual weighted mean instead of emphasizing extreme values.
2.2.4. Road Network and POI Data
This study collected all types of POI data of Yangtze River Delta and Chengdu-Chongqing urban agglomeration in 2020 based on the AmAP platform. Each data contains attributes such as name, address, telephone number, type, latitude and longitude, city, county, township and postal number. Since the original POI data types are miscellaneous and the classification criteria are not clear, there is a phenomenon of overlapping among various data points. Through reclassification analysis, 49,908 pieces of data of Yangtze River Delta city cluster and 180,000 pieces of data of Chengdu-Chongqing city cluster were obtained. In addition, the land road network data were obtained from OSM maps (https://download.geofabrik.de/asia.html). OSM is currently the most extensive collaborative and publicly licensed collection of geospatial data, widely used as an alternative or supplement to authoritative data [34]. Based on the attribute information of the road network data, we extracted the high-speed rail, general rail, expressway, national highway, provincial highway, and other roads of each city group.
2.3. Method
This study used spatio-temporal big data, including POI, NDVI, luminous remote sensing, OSM data, etc., to extract built-up areas of urban agglomerations. The research scheme is divided into two parts (Figure 2). The first part is to extract the built-up area boundary from three dimensions respectively, and the second part is to fuse the results according to the fusion rules and complete the accuracy verification.
2.3.1. Recognition Method based on POI (POIM)
Due to aggregation effect and scale effect, all kinds of POI tend to gather in cities, making the density of POI in cities significantly higher than that in suburbs and rural areas, and the change rate of POI density is the largest at the junction of cities and rural areas.
Kernel density estimation (KED) was used to establish the probability density of POI. KED is one of the nonparametric test methods used to predict unknown density functions in probability theory. The formula is as follows:
In the formula, is the bandwidth; is the number of element points that are less than or equal to the distance from the location; is a spatial weight function.
Considering that POI data meet the requirements of this method in terms of data type, data amount and the proportion of various POI, this study chooses Densi-Graph method to extract the built-up area of toponymy address POI data. The Densi-Graph curve is drawn with the core density value d as the horizontal axis and the theoretical radius increment of the closed curve as the vertical axis. When the growth rate of the curve is greater than the preset threshold, the corresponding nuclear density value is the critical value of the urban built-up area boundary, and the contour line of nuclear density is determined as the urban built-up area boundary.
2.3.2. Recognition Method Based on Remote Sensing Data (RSM)
In this study, an NTL-based city index was selected to extract the built-up area boundary, which uses MODIS Land surface temperature (LST) and Normalized Vegetation Index (NDVI) images to adjust and compensate for the desaturation of NTL images obtained from the corresponding urban areas. The ratio between LST and NDVI has been shown to be an appropriate comprehensive measure of LST-NDVI feature spatial patterns and has been used to distinguish different land cover types.
Based on a common observation that the closer an area is to the city centre, the higher the LST is due to high population density, levels of human activity and the number of artificial structures. Vegetation cover decreases with the increase of impervious surface construction and urban population growth. Therefore, in this study, the ratio between LST and NDVI is combined with NTL data to construct the new city index LVTD. Considering that the ratio of LST and NDVI tends to have infinite values when the NDVI of some land cover types approaches zero, the inverse tangent of LST/NDVI is combined with the NTL data. Therefore, the proposed LVTD is expressed as:
According to the LVTD index, the built-up area boundary is extracted using the global fixed threshold. In the global fixed threshold method, a specified threshold for the NTL data is determined for the entire study area, which is set to minimize the difference between the extracted urban area and the reference data.
2.3.3. Recognition Method Based on Traffic Road (TRM)
In this study, cost-distance algorithm is used to measure the reachability of surface space in terms of time cost. The transportation network of urban agglomeration mainly includes railways, highways, expressways, national highways, provincial highways and other roads. Given the closed nature of the railway, it is necessary to “wrap” them, which includes enclosing the said road layer by building barrier layers on both sides of the line. Specifically, the grid speed value within the 500m buffer of the railway is defined as 1km/h, which indicates that the closed road cannot be passed directly. In addition, on both sides of the enclosed railway, high speed values are provided. In order to obtain a closed layer with open entrances and exits, the study adopted a railway station buffer to “erase” the closed road buffer, which indicates that the line can only be connected to the outside world through the entrance and exit of the railway station. Then, according to the existing research, the traffic speed is assigned to the traffic network layer. Each city in the study area is loaded as a target node and the minimum cumulative cost distance from each grid to the nearest target is calculated, which represents the spatial accessibility within the urban agglomeration. Finally, the corresponding urban built-up area is extracted based on the isochronous map.
2.3.4. Fusion Method of Multi-Source Data Extraction Results
The built-up area boundary extracted from POI data, night light data and traffic data is superimposed. The built-up area extracted from POI data is fragmented, but the boundary is smooth and rich in details. The built-up area extracted by night light data has good integrity, but due to the limitation of resolution, the boundary will show obvious zigzag shape. The built-up area data extracted from traffic data has good coherence, generally showing linear distribution, and the boundary is tortuous and complicated. In this study, the mathematical morphology method is used to combine the extraction results of the three kinds of data, combine the advantages of the three methods, make up for the shortcomings, and get a more accurate built-up area. The fusion and validation rules are shown in Figure 3.
2.3.5. Accuracy Test Method
In this study, China’s urban built-up area data (http://www.resdc.cn) produced by high-precision data sources and high-precision data products were used as the test reference data.
Overall accuracy (OA) is the percentage of the number of all random points successfully verified. The Kappa coefficient of consistency test can be used to measure the accuracy of classification.
Spatial consistency is assessed by comparing the classification results for a particular location with the corresponding points of the reference data. In this study, representative Kappa coefficient and overall accuracy (OA) were selected as evaluation indexes of confusion matrix to evaluate accuracy. Kappa coefficient and OA are calculated as follows:
In the formula, TP is the number of points in the correct built-up area part of the extraction result, FP is the number of points in the wrong part of the extraction result, FN is the number of points in the missing pixel extraction result, and TN is the number of points in the non-built-up area part of the extraction result.
3. Results
3.1. Identification Result
The results of the POIM are presented in Figure 4. The built-up area of YRD is 8012.73 , while the built-up area of CC is 3035.85. Based on an analysis of the built-up area boundaries of prefecture-level cities in China, a growth rate of 5% has been determined as the allowable value for the Density-Graph curve. As depicted in the figure, YRD reached a critical point when the nuclear density value was 42, whereas CC reached a critical point at a nuclear density value of 24. In YRD, due to a higher concentration of points-of-interest around Shanghai, the identification results indicate that the built-up area is more connected. Conversely, the built-up areas in CC are mostly scattered.
The RSM results are shown in Figure 5. The built-up area of YRD is 11592.07, the built-up area of CC is 4755.95 . We can find that the extraction results of built-up areas have a strong correlation with NPP-VIIRS data. At the same time, the natural land cover also affects the actual distribution of built-up areas, especially in CC.
The TRM results are depicted in Figure 6, showing that the built-up area of YRD is 19353.18
and CC is 3903.62. The transportation road infrastructure in the YRD is well-developed, providing accessibility to the transportation network, with a median travel time cost of 5.65 hours for the entire region. In contrast, CC’s transportation road infrastructure is primarily concentrated in the Chengdu-Chongqing economic circle and is still undergoing gradual improvements to its transportation network. The median travel time cost for this area is 32.15 hours. The extended travel time within the CC can be attributed mainly to the complex landform in western Sichuan province.
3.2. Fusion Result
In this study, an image morphology algorithm combined with a rational intersection algorithm was utilized for multi-source fusion. Following integration, the built-up area of YRD is 17,560.15and the area of CC is 4224.07.The comparison of the high-precision verification set and fusion experiment result results indicates a general consistency in the distribution of built-up areas. However, in the surrounding regions of economically developed cities such as Shanghai and Chongqing, the identified built-up area results exceed those of the verification set.
We employed the method of randomly sampling points within the region to validate the accuracy. In order to ensure the comprehensiveness and reliability of the experiment, 3000 and 10000 random points were used respectively. The average value was obtained through multiple samples and the results are presented in Table 2 and Table 3. The data indicates that in CC, the correct extraction rate of the four methods can exceed 95% at 3000 random points. Additionally, the correct extraction rate of RSM and fusion method can surpass 90% at 10000 random points. In contrast, in YRD, the correct extraction rate at 3000 random points is over 91% for all methods except TRM. However, only the fusion method achieves a correct extraction rate of more than 80% at 10000 random points. Overall, the correct extraction rate of the fusion method is higher than that of any single method.
When comparing three single-dimension methods, it is evident that RSM has the highest correct extraction rate while TRM has the lowest. The results demonstrate that in this study, all four extraction methods performed better in CC compared to YRD.
This study addresses classification issues in data science, emphasizing the importance of evaluating the performance of the research model. Therefore, accuracy (OA), precision (P), recall rate (R), F1 score, and kappa coefficient are selected as measures to assess the effectiveness of the model. With the exception of R value, a higher value for each index indicates more accurate extraction results. The P value represents accuracy rate, while the R value represents recall rate; these two values are often contradictory, with F1 representing a balance between them. According to the findings presented in Table 4 and Table 5, the extraction method utilized in this study can take both recall and precision into account. The average overall accuracy (OA) of the first three methods is respectively 86.08%,90.12% and 80.96%, and the average kappa coefficient is respectively 0.5646,0.7132 and 0.4112. After data fusion, the average overall accuracy (OA) is 91.35%, and the average Kappa coefficient is 0.7501. The performance effect of this research method in CC is better than that in YRD. The average precision rate in CC is 96.03%, the average recall rate is 82.03%; The average precision rate in YRD is 80.33%, and the average recall rate is 70.80%. The F1 value reaches 0.89 in CC and 0.77 in YRD. It is evident that combining three dimensions through fusion method yields superior extraction effects on various measurement indicators compared to single dimension methods. Notably, in CC, the kappa coefficient of the fusion method exceeds 0.85, indicating nearly complete consistency in extraction results; while in YRD it exceeds 0.61 signifying highly consistent extraction results.
4. Discussion
4.1. Comparison with Previous Studies
This study employs a multi-source data fusion method to identify the built-up areas of representative urban agglomerations in eastern and western China. After analysing the advantages and disadvantages of various data types and methods, GIS and image processing technology are utilized for data fusion. Random point verification further confirms that the data fusion method is more accurate than the single-dimension method and more effective in identifying urban agglomeration. The results of this study align with previous research findings. Wang et al.[37] discovered that the average kappa coefficient of the results of multi-method fusion can reach 0.7394, which accurately reflects the geographical scope of the three major urban agglomerations in China. He et al.[38] found that fusing multi-source big data can help accurately evaluate polycentric spatial structure within urban agglomeration.
In comparison to prior studies, this research takes into account triple attributes of built-up area including land cover, land use, and convenient transportation, forming a multi-source data fusion identification method. By combining the advantages of these three methods, it compensates for shortcomings while considering integrity and extracting details to obtain a more accurate built-up area scope. The boundary of built-up area for YRD and CC is determined from multiple angles, addressing issues where a single index cannot accurately reflect internal heterogeneity at an urban edge. According to the experimental results, we can find that the built-up area extracted in this study is highly consistent with the area shown in the Chinese urban built-up area data set, but the built-up area extracted in the experiment has higher adhesion and closer spatial connection. In the comparison of various methods, it is found that the accuracy of built-up area extracted by RSM and POIM is higher than TRM. Therefore, combined with theoretical model and practical exploration, the built-up area has a strong correlation with social and economic factors such as POI and population activities, and the influence of intra-city traffic road network on the built-up area is limited.
In terms of data fusion means, the main idea of extracting built-up area boundary based on multi-source data is low rough extraction and high refinement, that is, using low-resolution data to extract the rough boundary of the built-up area, and then using high-precision vector data such as accurate POI and traffic roads for fine extraction. Referring to the previous research, it is found that the difficulty of data fusion is that when the spatial resolution of the adopted data is very different, there will be a large gap between the intersection boundaries of different data extraction built-up areas. Therefore, this study adopts morphological image processing technology, smoothing rules or morphological optimization method to process the boundary, and maintains the overall shape of the built-up area and refines the internal structure.
4.2. Limits and Prospects
The development and change of the built-up areas of urban agglomerations in China have attracted extensive attention from scholars at home and abroad. It is believed that the local spatial dynamics of eastern China tend to be stable, while the local spatial dynamics of central and western China are beginning to increase [35,36]. In this study, we utilize multi-source open spatio-temporal data to investigate the built-up areas of representative urban agglomerations in both eastern and western China. This broadens the scope of the original research and addresses a gap in relevant research on urban agglomerations in central and western China. However, there are two major limitations in this study. Firstly, factors such as GDP, POI density, population density, and night lighting vary significantly among urban agglomerations. This may lead to a one-size-fits-all problem in threshold analysis of built-up areas around megacities or regional core cities. Therefore, it is necessary to further verify whether this method is applicable to urban agglomerations with large differences in development levels. Additionally, further improvements are needed for the classification and extraction of various threshold indicators. Secondly, there is also a need to enhance data quality and ensure accuracy, timeliness, and sustainability of data. For example, through the use of unmanned aerial vehicles (UAVs), autonomous vehicles, and other equipment for measuring urban ground construction; multi-angle high-dynamic imaging technology can play a practical role in detailed update monitoring of urban agglomeration.
5. Conclusions
We aim to explore a method for extracting the built-up area of urban agglomerations based on multi-source data and constructing a rule that can integrate multi-source data reasonably, taking into account the characteristics of the built-up area. The Density Graph analysis of POI was utilized to extract the built-up area based on socio-economic levels, resulting in an overall accuracy rate (OA) of 91.27% in the Chengdu-Chongqing region and 80.90% in the Yangtze River Delta region. Additionally, by using NPP-VIIRS luminous remote sensing data combined with LST and NDVI index, we constructed a unique LVTD coefficient and analysed thresholds by combining urban statistical yearbooks. Taking into consideration population distribution, land cover, and human activities, we achieved an overall accuracy (OA) of 95.50% in the Chengdu-Chongqing region and 84.74% in the Yangtze River Delta region. Furthermore, utilizing network data from OSM and railway station data in China, we calculated minimum cumulative time costs using raster analysis algorithms to extract built-up areas according to accessibility values while considering accessibility and connectivity factors. This approach resulted in an overall accuracy rate (OA) of 88.51% in the Chengdu-Chongqing area and 73.42% in the Yangtze River Delta area. Through numerous experiments, adjustments were made to further explore methods for fusing multi-source data. By verifying algorithm accuracy on high-precision datasets, our fused method achieved an overall accuracy of 91.35% with a kappa coefficient of 0.75. This precision result is higher than the overall accuracy of 85.34% and the kappa coefficient of 0.7394 of the built-up areas of the three major urban agglomerations studied by Wang et al. [37].
The method proposed in this paper partially addresses the limitation of using a single data source for built-up area extraction. It is particularly suitable for urban agglomeration scenarios that demand high extraction accuracy and scientific rigor. The method relies on heavy remote sensing imagery, requires access to recent luminous remote sensing data, depends on fast updates of POI data, and necessitates high openness of traffic network data to ensure the timeliness of built-up area extraction. The fusion extraction rule established in this paper offers a more comprehensive approach to extracting built-up areas, allowing for a more holistic reflection of regional construction, development, and public facilities. However, because this method is based on economic population distribution, land cover characteristics, and traffic network features to identify built-up areas, it not only enhances accuracy but also introduces challenges related to low efficiency in extraction. Additionally, there may be insufficient index analysis for urban agglomerations at different stages of development which could impact the applicability of this method in highly developed urban agglomerations. Future research should focus on refining integration rules and conducting application studies in urban agglomerations at different scales to further enrich the theory and methodology of urban built-up area extraction.
References
- Tan Minghong, Lu Changhe. Distribution of China City Size Expressed by Urban Built-up Area[J]. Acta Geographica Sinica, 2003, 58(2): 285-293.
- Fang Chuanglin. Progress and the future direction of research into urban agglomeration in China[J]. Acta Geographica Sinica, 2014, 69(8): 1130-1144.
- Tan Minghong, Li Xiubin, Lu Changhe. Analysis of the driving force of urban land expansion in China [J]. Economic geography,2003(05):635-639.
- Mei Zhuo. Research on the delineation method of built-up area under territorial spatial planning [C]. Urban Planning Society of China. People’s City, Planning Empowerment—Proceedings of China Urban Planning Annual Conference 2022,2023:8.
- Shi Kaifang, Huang Chang, Yu Bailang, Yin Bing, Huang Yixiu, Wu Jianping. Evaluation of NPP-VIIRS Night-Time Light Composite Data for Extracting Built-up Urban Areas[J]. Remote Sensing, 2014,5(4),358–66.
- Hu Ting, Huang Xin, Li Dongrui, Jin Shuanggen, Yan Qingyun. Comprehensive evaluation of the urban built-up areas mapping ability from Luojia 1-01 nighttime light imagery over China[J]. Acta Geodaetica et Cartographica Sinica, 2023, 52(3): 432-442.
- Ascher, C.S.; Geddes, P.; The Outlook Tower Association, E. Cities in Evolution[J]. Land Economics,1951,27(1),83-84.
- Phillip O’Neill. Global city-regions: trends, theory, policy[J]. Area, 2003, 35, 326–327.
- Yu Qianyu, Li Meng, Li Qiao, Wang Yanan, Chen Wei, Economic agglomeration and emissions reduction: Does high agglomeration in China’s urban clusters lead to higher carbon intensity? , Urban Climate, 2022, 43, 101174. [CrossRef]
- Denis, Paul-Yves Hall, Peter, The World Cities. London, Weidenfeld and Nicolson, Third Edition, 276 p. Cahiers de géographie du Québec 1985,29(78): 441–442.
- Ning Yue-Min. Definition of Chinese Metropolitan Areas and Large Urban Agglomerations: Role of Large Urban Agglomerations in Regional Development[J]. SCIENTIA GEOGRAPHICA SINICA,2011,31(3): 257-263.
- Xu Zening, Gao Xiaolu. A novel method for identifying the boundary of urban built-up areas with POI data[J]. Acta Geographica Sinica,2016,71(6): 928-939.
- Bode, E. Delineating metropolitan areas using land prices[J]. Reg.Sci, 2010, 48, 131–163. [Google Scholar] [CrossRef]
- Fang Chuanglin. The Basic Law of the Formation and Expansion in Urban Agglomerations[J]. Geographical Sciences, 2019, 29, 1699–1712.
- Li Kaike and Niu Xinyi. Delineation of the Shanghai Megacity Region of China from a Commuting Perspective: Study Based on Cell Phone Network Data in the Yangtze River Delta[J]. Urban Plan.Dev. 2021, 147, 04021022.
- Bosker, M.; Park, J.; Roberts, M. Definition matters. Metropolitan areas and agglomeration economies in a large-developing country[J]. Urban Econ. 2021, 125, 103275. [Google Scholar]
- Zhen Feng, Cao Yang, Qin Xiao and Wang Bo. Delineation of an urban agglomeration boundary based on Sina Weibo microblog ‘check-in’ data: A case study of the Yangtze River Delta[J]. Cities. 2017, 60, 180–191.
- Chen Jin, Zhuo Li, Shi Peijun, et al. The Study on Urbanization Process in China Based on DMSP/OLS Data: Development of a Light Index for Urbanization Level Estimation[J]. Journal of Remote Sensing, 2003,(3):168-175.
- Mu Fengyun, Zhang Zengxiang, Chi Yaobin, et al. Dynamic Monitoring of Built-up Area in Beijing during 1973—2005 Based on Multi-original Remote Sensed Images[J]. Journal of Remote Sensing, 2007,(2):257-268.
- Hu Shougeng, Tong Luyi, Amy E. Frazier, Liu Yansui. Urban boundary extraction and sprawl analysis using Landsat images: A case study in Wuhan, China[J]. Habitat International, 2015, 47, 183–195.
- Luqman, M. , Rayner, P. J., & Gurney, K. R. Combining Measurements of Built-up Area, Nighttime Light, and Travel Time Distance for Detecting Changes in Urban Boundaries: Introducing the BUNTUS Algorithm[J]. Remote Sensing,2019,11(24),2969.
- Zhao Weifeng, Li Qingquan, Li Bijun. Extracting hierarchical landmarks from urban POI data[J]. Journal of Remote Sensing, 2011,15(5):973-988.
- Li Fei, Yan Qingwu, Zou Yajing, Liu Baoli. Extraction Accuracy of Urban Built-up Area Based on Nighttime Light Data and POI: A Case Study of Luojia 1-01 and NPP/VIIRS Nighttime Light Images[J]. Geomatics and Information Science of Wuhan University, 2021, 46(6): 825-835.
- Meng Yingying, Zhou Size, Nie Yan, Zeng Huaiwen, Yu Jing. Spatial Delimitation of the Urban-Rural Fringe Based on POI and Nighttime Light Data: A Case Study of Wuhan City[J]. Geomatics and Information Science of Wuhan University.
- Lou Ge, Chen Qiuxiao, He Kang, Zhou Yue and Shi Zhou. Using Nighttime Light Data and POI Big Data to Detect the Urban Centers of Hangzhou[J]. Remote Sensing. 2019, 11, 1821.
- Liu Xinzhi, Zhang Pengfei, Shi Xiaoyu. Industrial Agglomeration, Technological Innovation and High-quality Economic Development: Empirical Research based on China’s Five Major Urban Agglomerations. Reform,2022, (04):68-87.
- Fang Chuanglin, Zhou Chenghu, Wang Zhenbo. Sustainable development strategy and priorities of spatially differentiated development of urban agglomerations along the Yangtze River Economic Belt[J]. PROGRESS IN GEOGRAPHY, 2015, 34(11): 1398-1408.
- Song Jitao, Fang Chuanglin, Song Dunjiang. Spatial Structure Stability of Urban Agglomerations in China[J]. Acta Geographica Sinica, 2006, 61(12): 1311-1325.
- Yao Zuolin, Tu Jianjun, Niu Huimin, Ha Lin, Li Jianbo. The Research on Urban Agglomeration Spatial Structure of Cheng-Yu Economic Zone. Economic Geography, 2017,37(01):82-89.
- Song Yanhua, Jiao Limin, Liu Jiafeng, Xu Gang. Analysis of the Factors Affecting the Degree of Urban Expansion: Taking Wuhan City as an Example[J]. Geomatics and Information Science of Wuhan University, 2021, 46(3): 417-426.
- Ministry of Construction of the People ’s Republic of China. Standard for basic terms of urban planning(GB/T 50280-98). Beijing: China Architecture & Building Press, 1998.
- Zhang Yang, Zheng Fengjiao, Liu Yanfang, Liu Ying, Hu Huiping, Xu Pengfei. Extracting Urban Built-up Area Based on Impervious Surface Area and POI Data[J]. SCIENTIA GEOGRAPHICA SINICA,2022,42(3): 506-514.
- Tan Yihua, Xiong Shengzhou, Li Yansheng. Automatic extraction of built-up areas from panchromatic and multispectral remote sensing images using double stream deep convolutional neural networks[J]. IEEE Journal of Selected Topics in Applied Earth Observations and Remote Sensing, 2018, 11(11): 3988-4004.
- Zhao Pengxiang, Jia Tao, Qin Kun, Shan Jie, Jiao Chenjing. Statistical Analysis on the Evolution of OpenStreetMap Road Networks in Beijing [J]. Physica A: Statistical Mechanics and its Applications, 2015, 420: 59-72.
- Hong Jiangtao, Li Xiaoshun, Wei Xuchen, Jiang Dongmei, Song Shuyan. Spatial and Temporal Pattern of Urban Built-up Areas in the Yangtze River Economic Belt Based on Data Fusion[J]. RESOURCES AND ENVIRONMENT IN THE YANGTZE BASIN, 2021, 30(10): 2325-2335.
- Zhou Yi, Xie Baopeng, Zhao Hongyan, Chen Ying,, Pei Tingting, Liu Shiqi. Study on Spatial-temporal Pattern and Dynamic Evolution of City Scale at County Level in China Based on Night-time Light Data[J]. RESOURCES AND ENVIRONMENT IN THE YANGTZE BASIN, 2019, 28(02): 250-260.
- Wang Gaoyuan, Wang Yixuan, Li Yangli, and Chen Tian. Identification of Urban Clusters Based on Multisource Data—An Example of Three Major Urban Agglomerations in China. Land 2023, 12, 1058.
- He, Xiong, Cao Yongwang, and Zhou Chunshan. Evaluation of Polycentric Spatial Structure in the Urban Agglomeration of the Pearl River Delta (PRD) Based on Multi-Source Big Data Fusion. Remote Sens. 2021, 13, 3639.
Figure 1.
Yangtze River Delta (YRD) Urban Agglomeration, Chengdu-Chongqing(CC) Urban Agglomeration, China.
Figure 1.
Yangtze River Delta (YRD) Urban Agglomeration, Chengdu-Chongqing(CC) Urban Agglomeration, China.
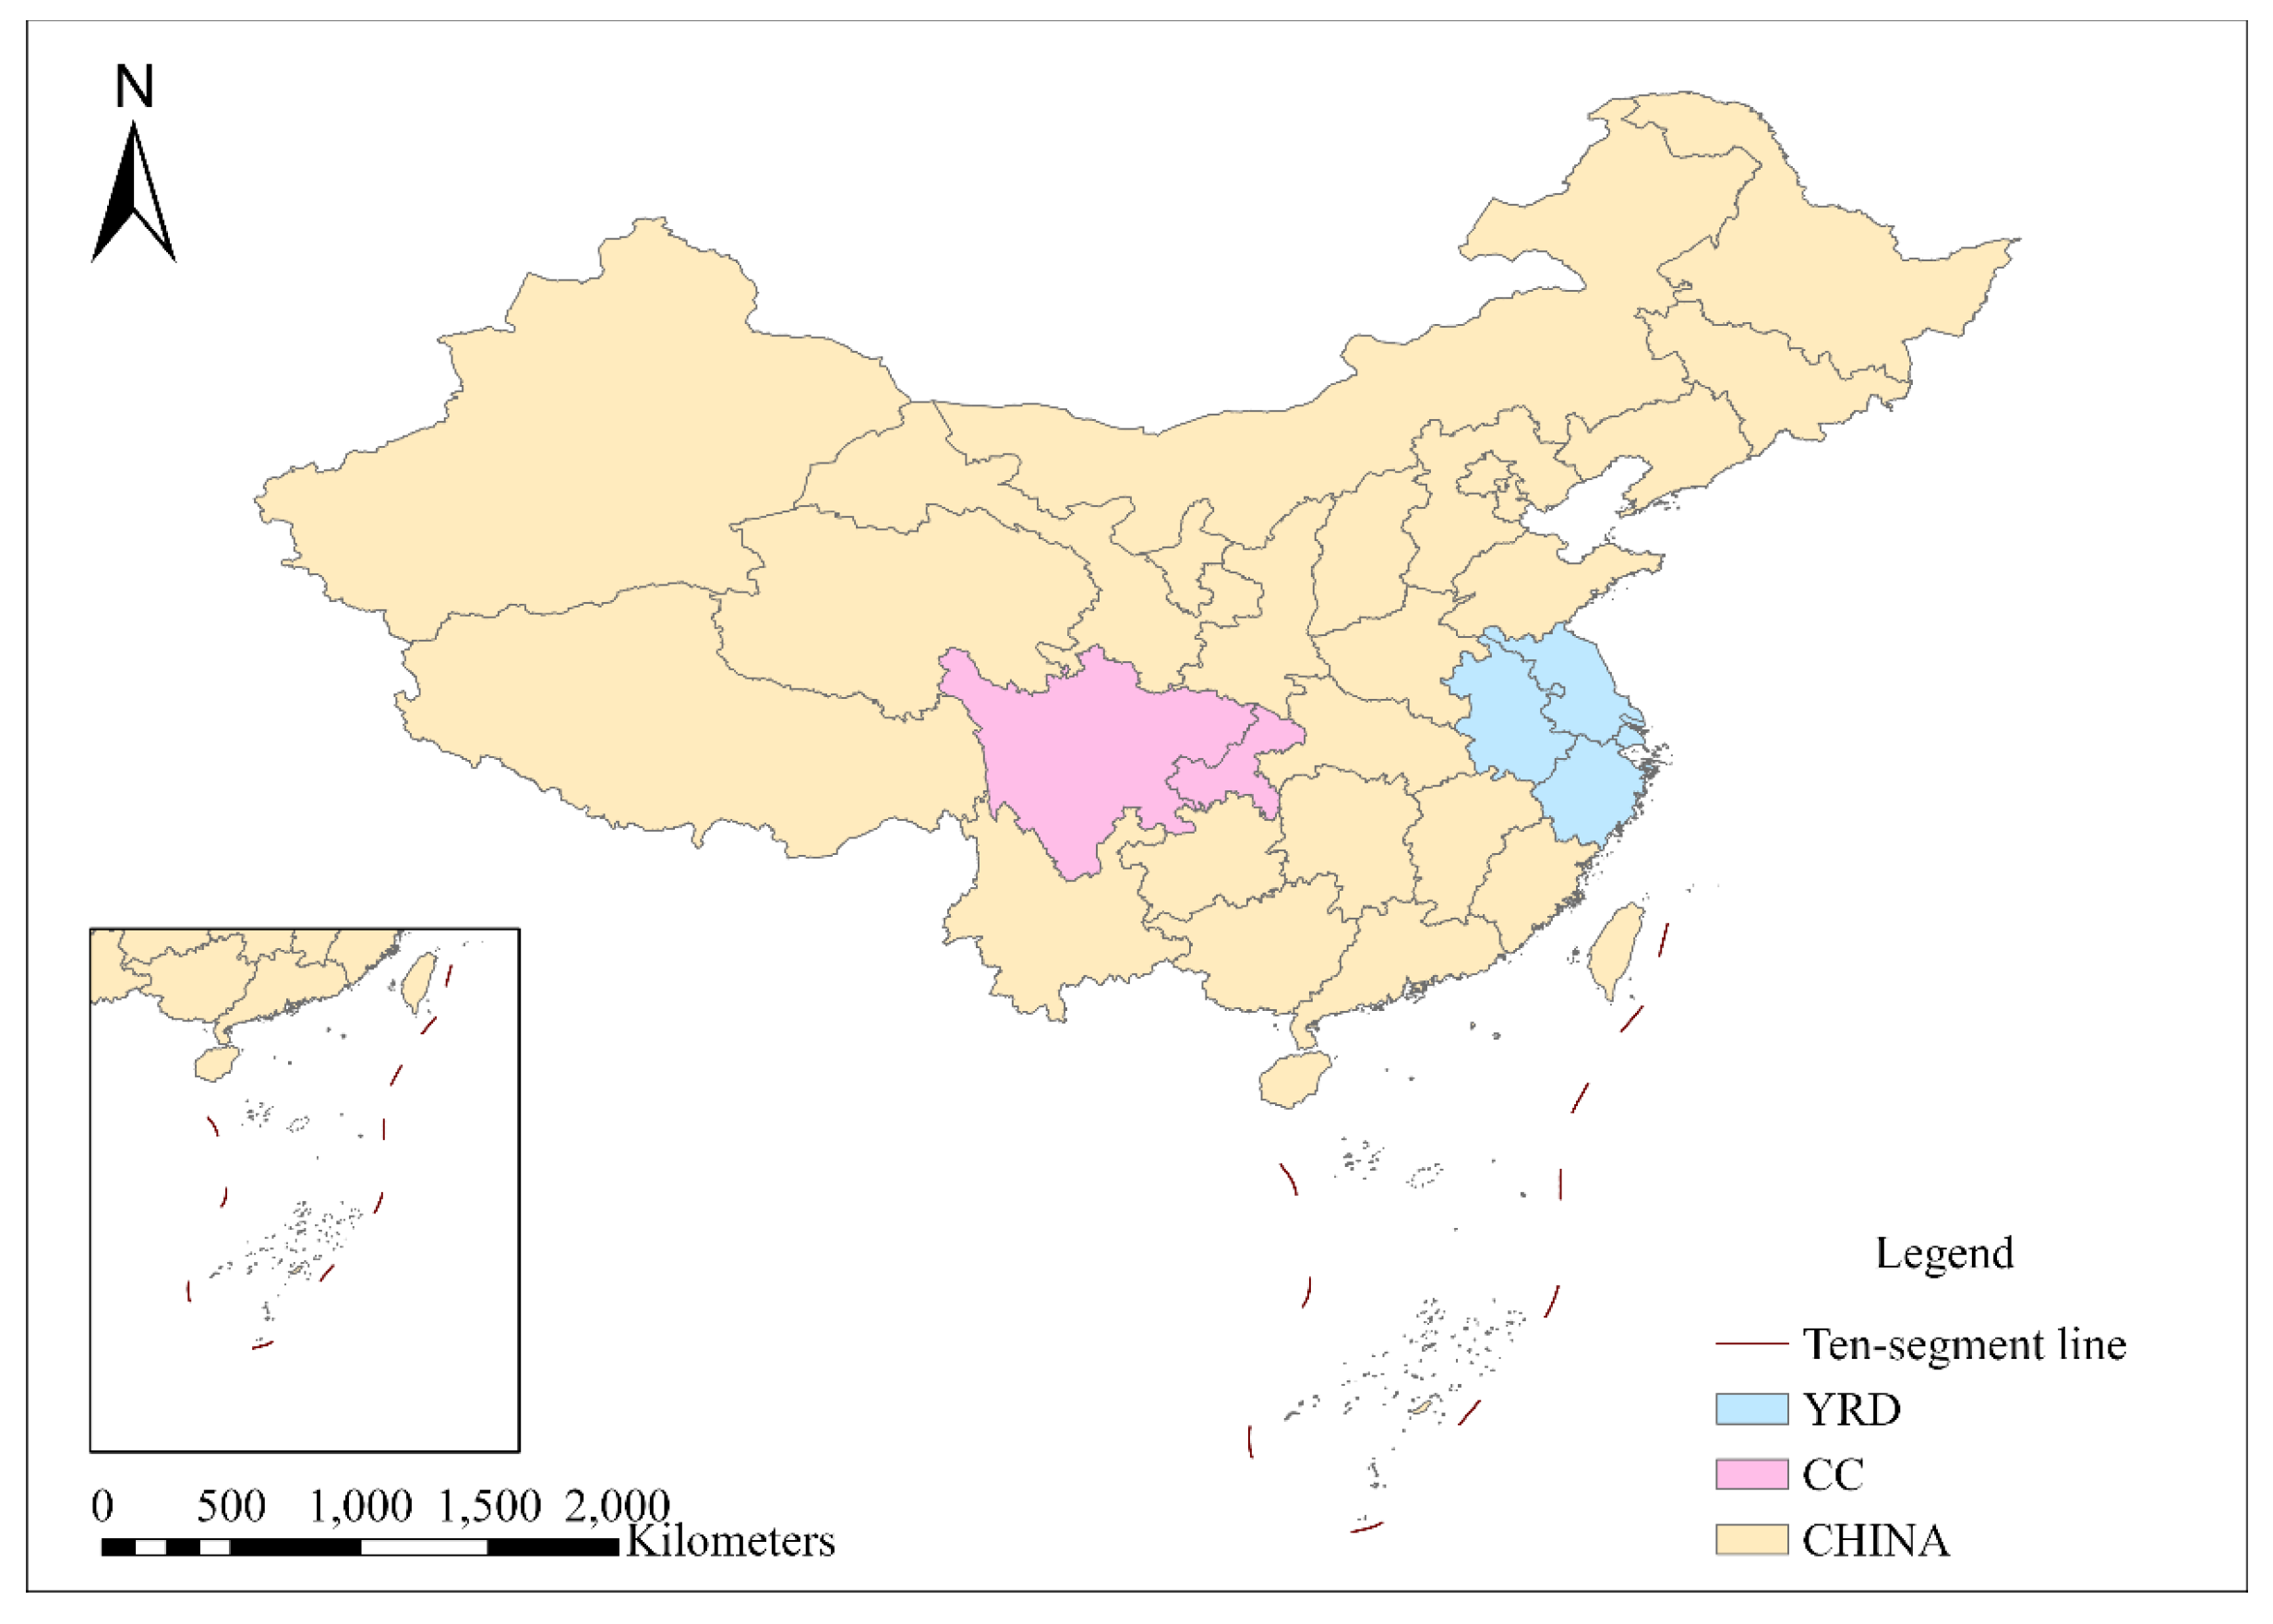
Figure 2.
Research Technology Route.
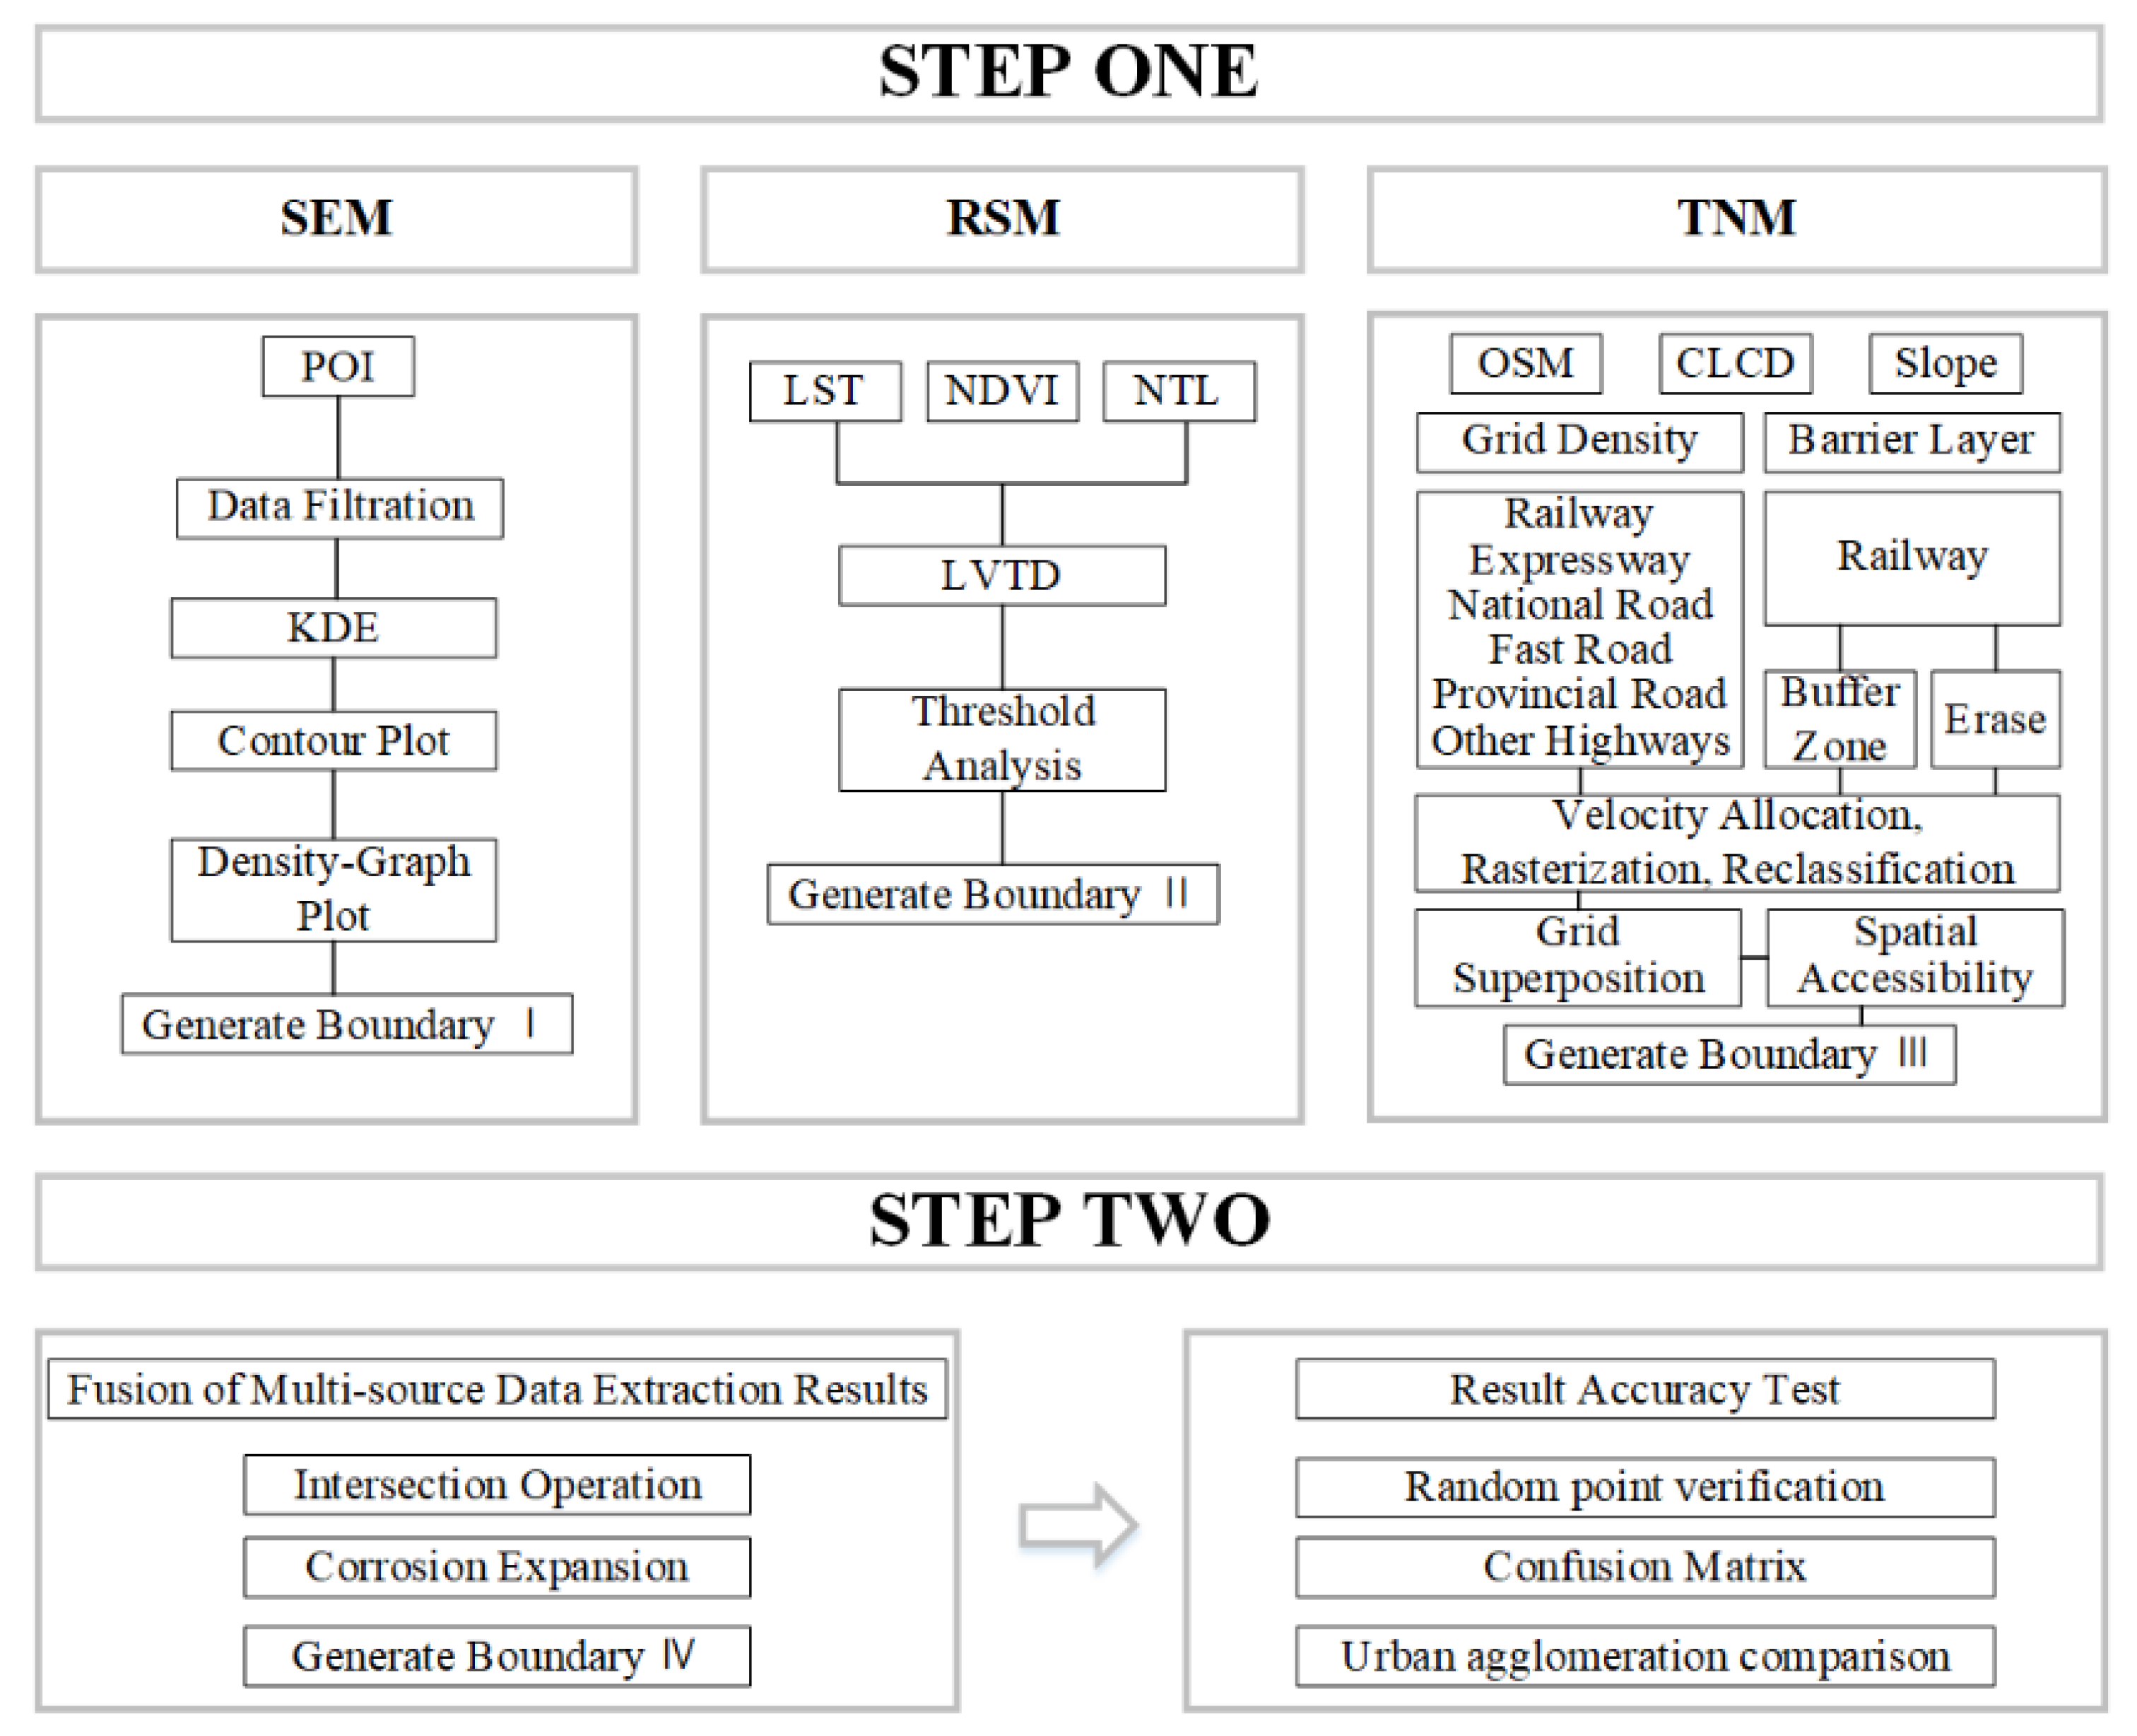
Figure 3.
Multi-source Data Fusion and Validation Rules.
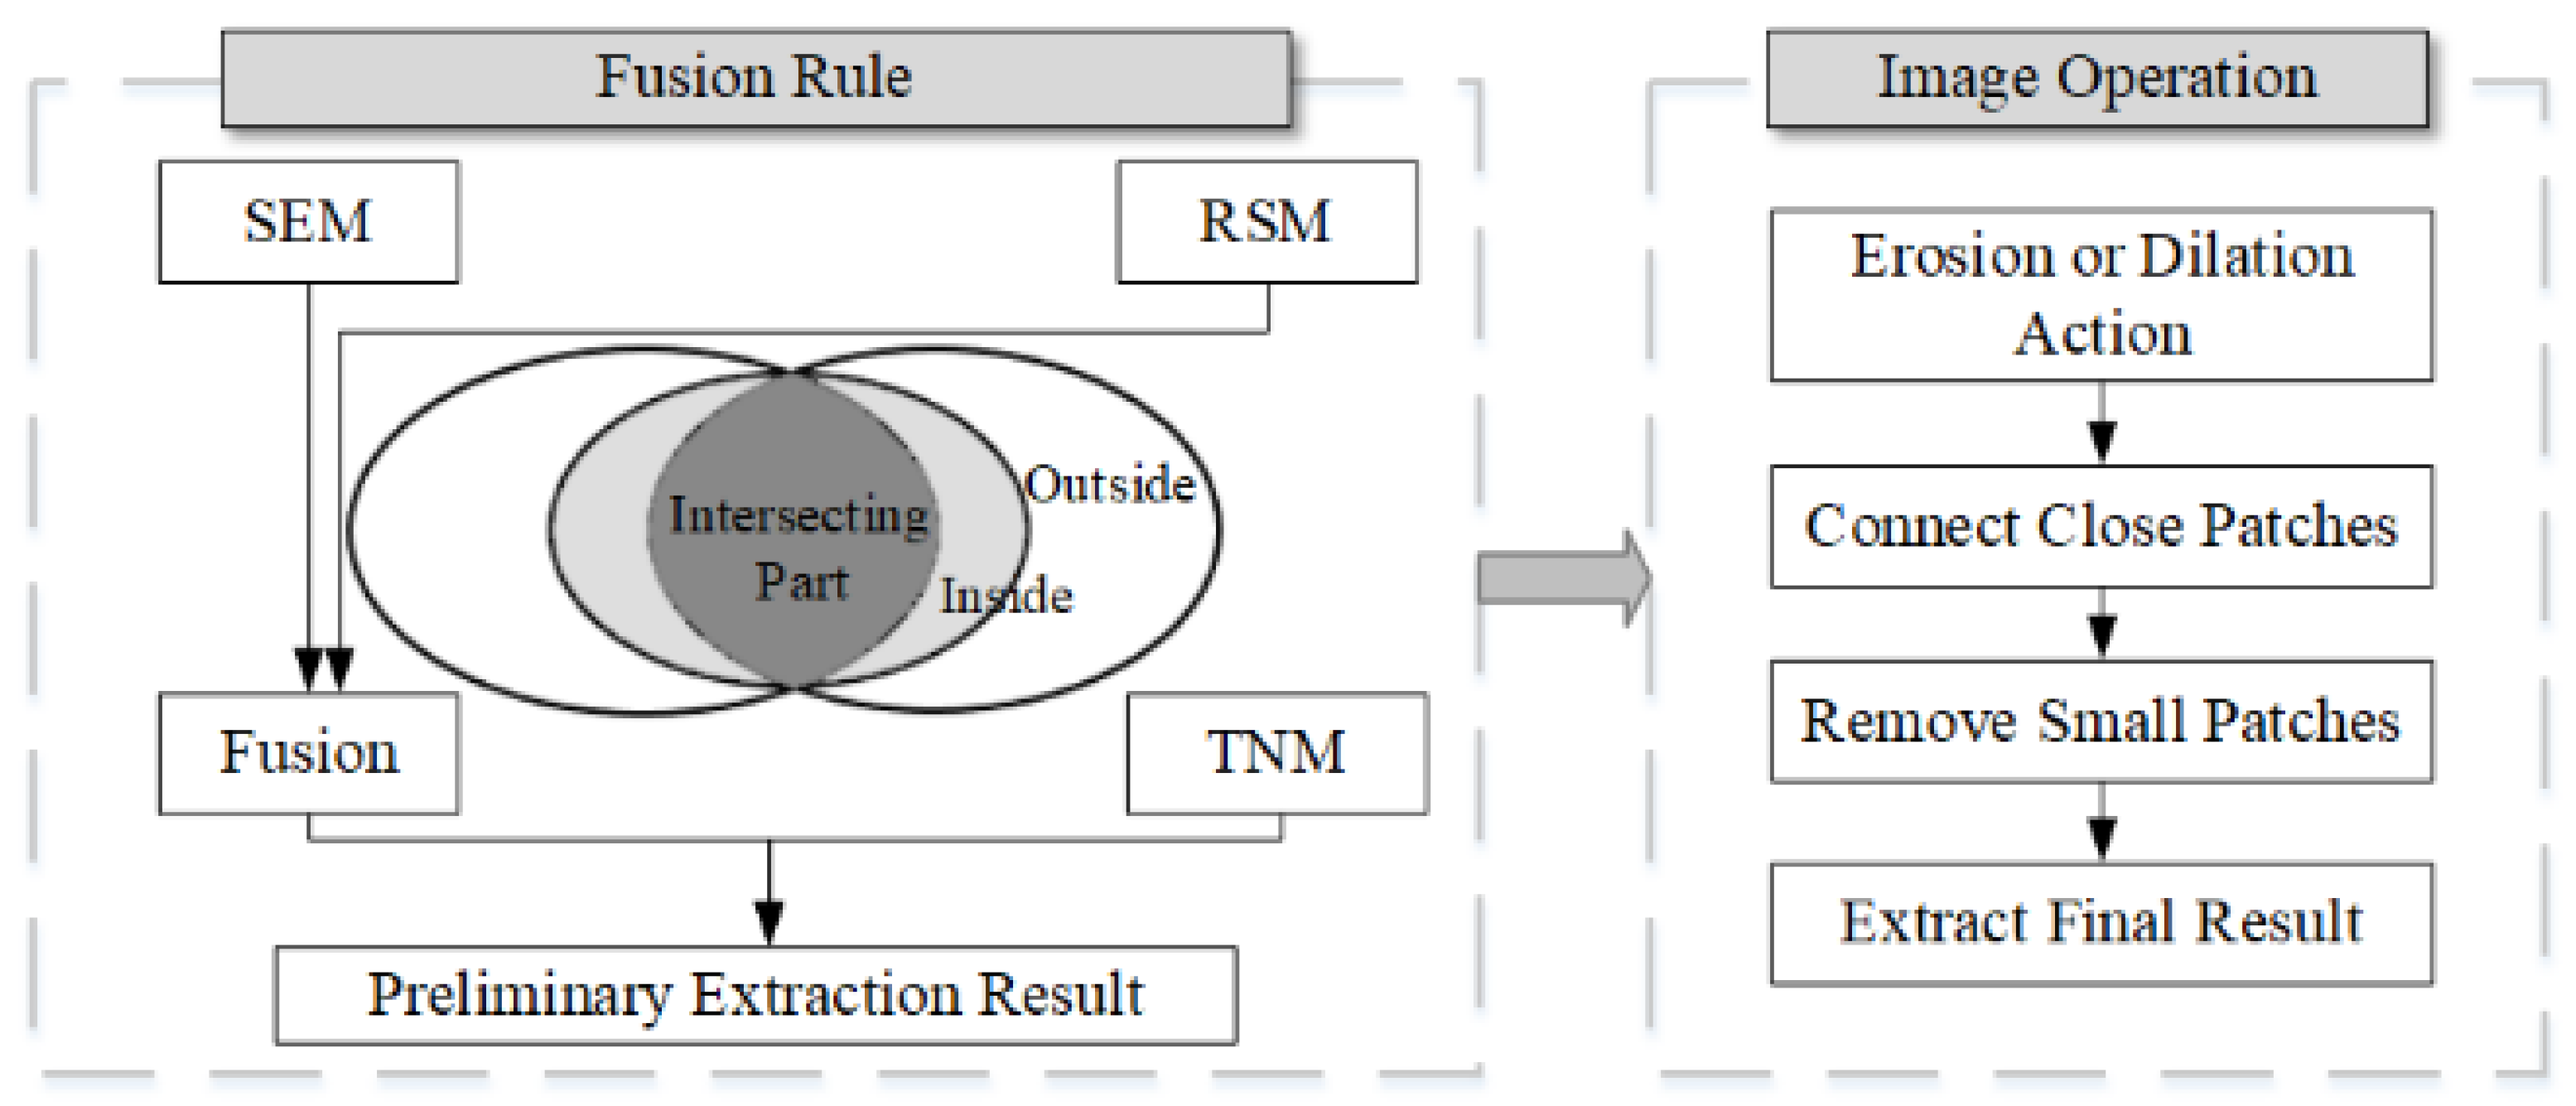
Figure 4.
This is a set of figures. (a) Description of YRD nuclear density analysis result; (b) Description of YRD Density-Graph Curves and threshold point; (c) Description of YRD extraction results using RSM method; (d) Description of result of CC nuclear density analysis; (e) Description of CC Density-Graph Curves and thresholds; (f) Description of CC extraction results using RSM method.
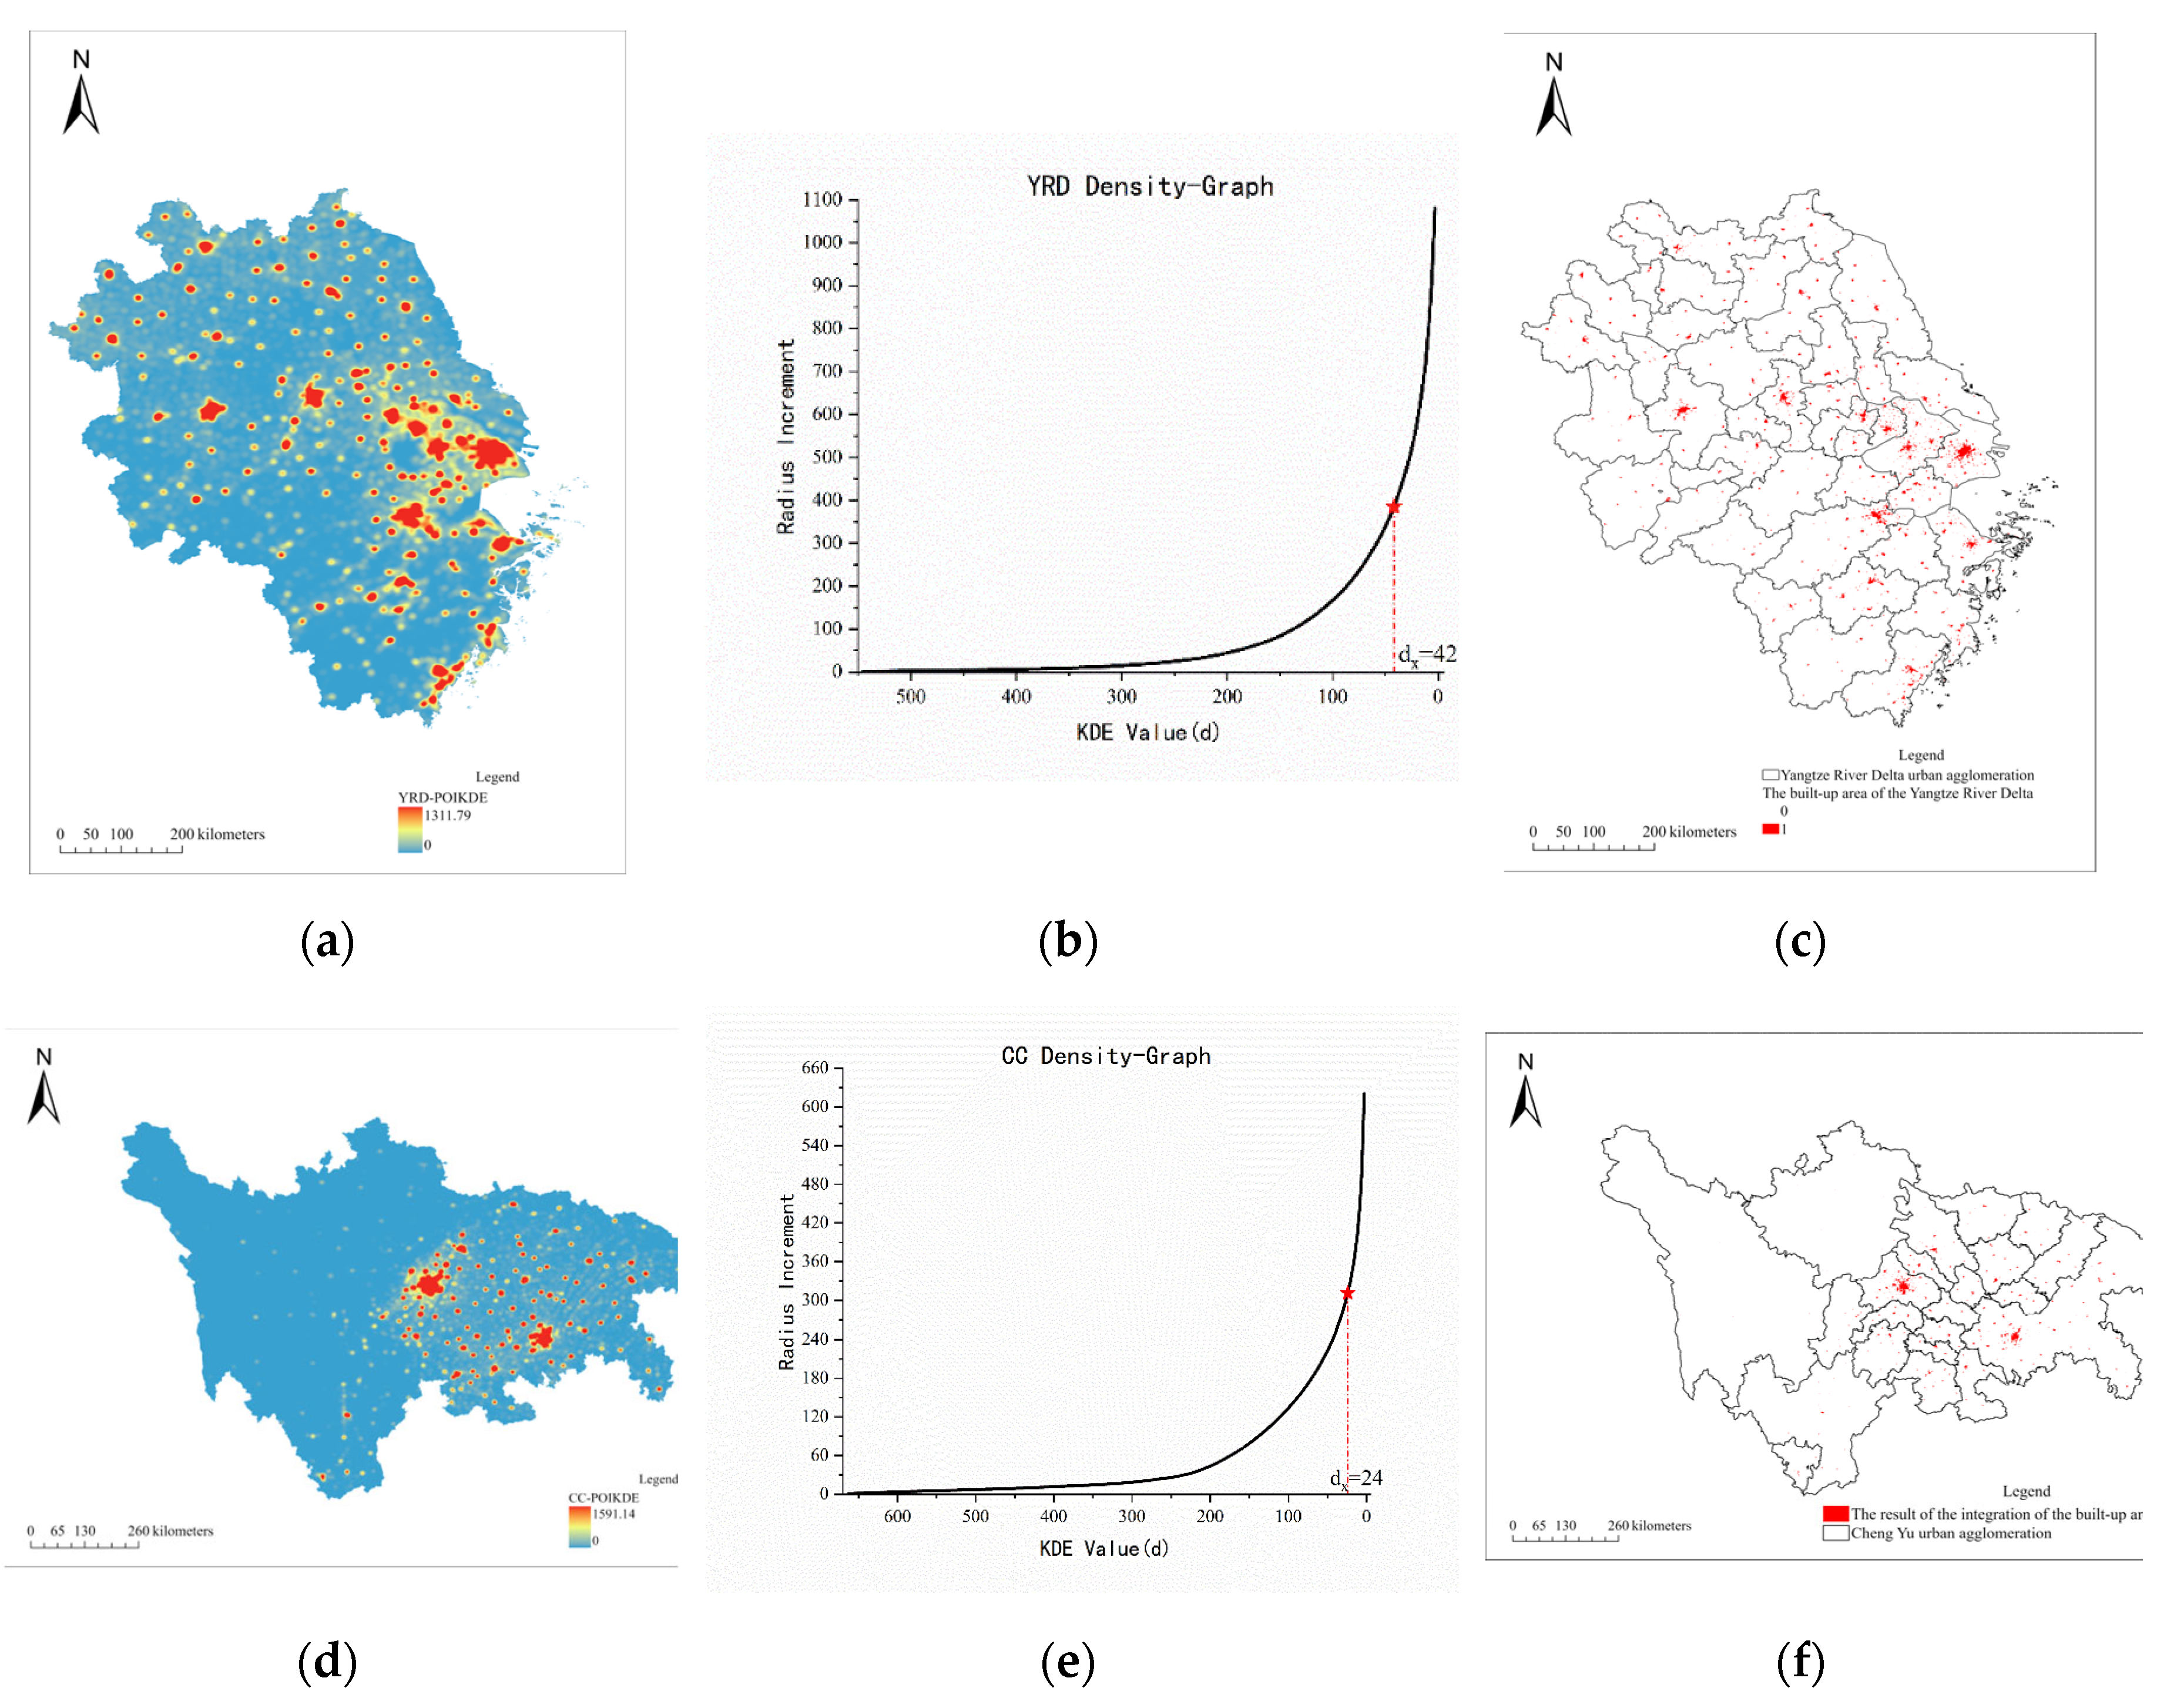
Figure 5.
This is a set of figures. (a) (b) Description of NPP-VIIRS data of night light index in two urban agglomerations; (c) (d) Description of LST data of land surface temperature in two urban agglomerations; (e) (f) Description of NDVI vegetation coverage in two urban agglomerations; (g) (h) Description of the built-up area results of two urban agglomerations extracted by RSM.
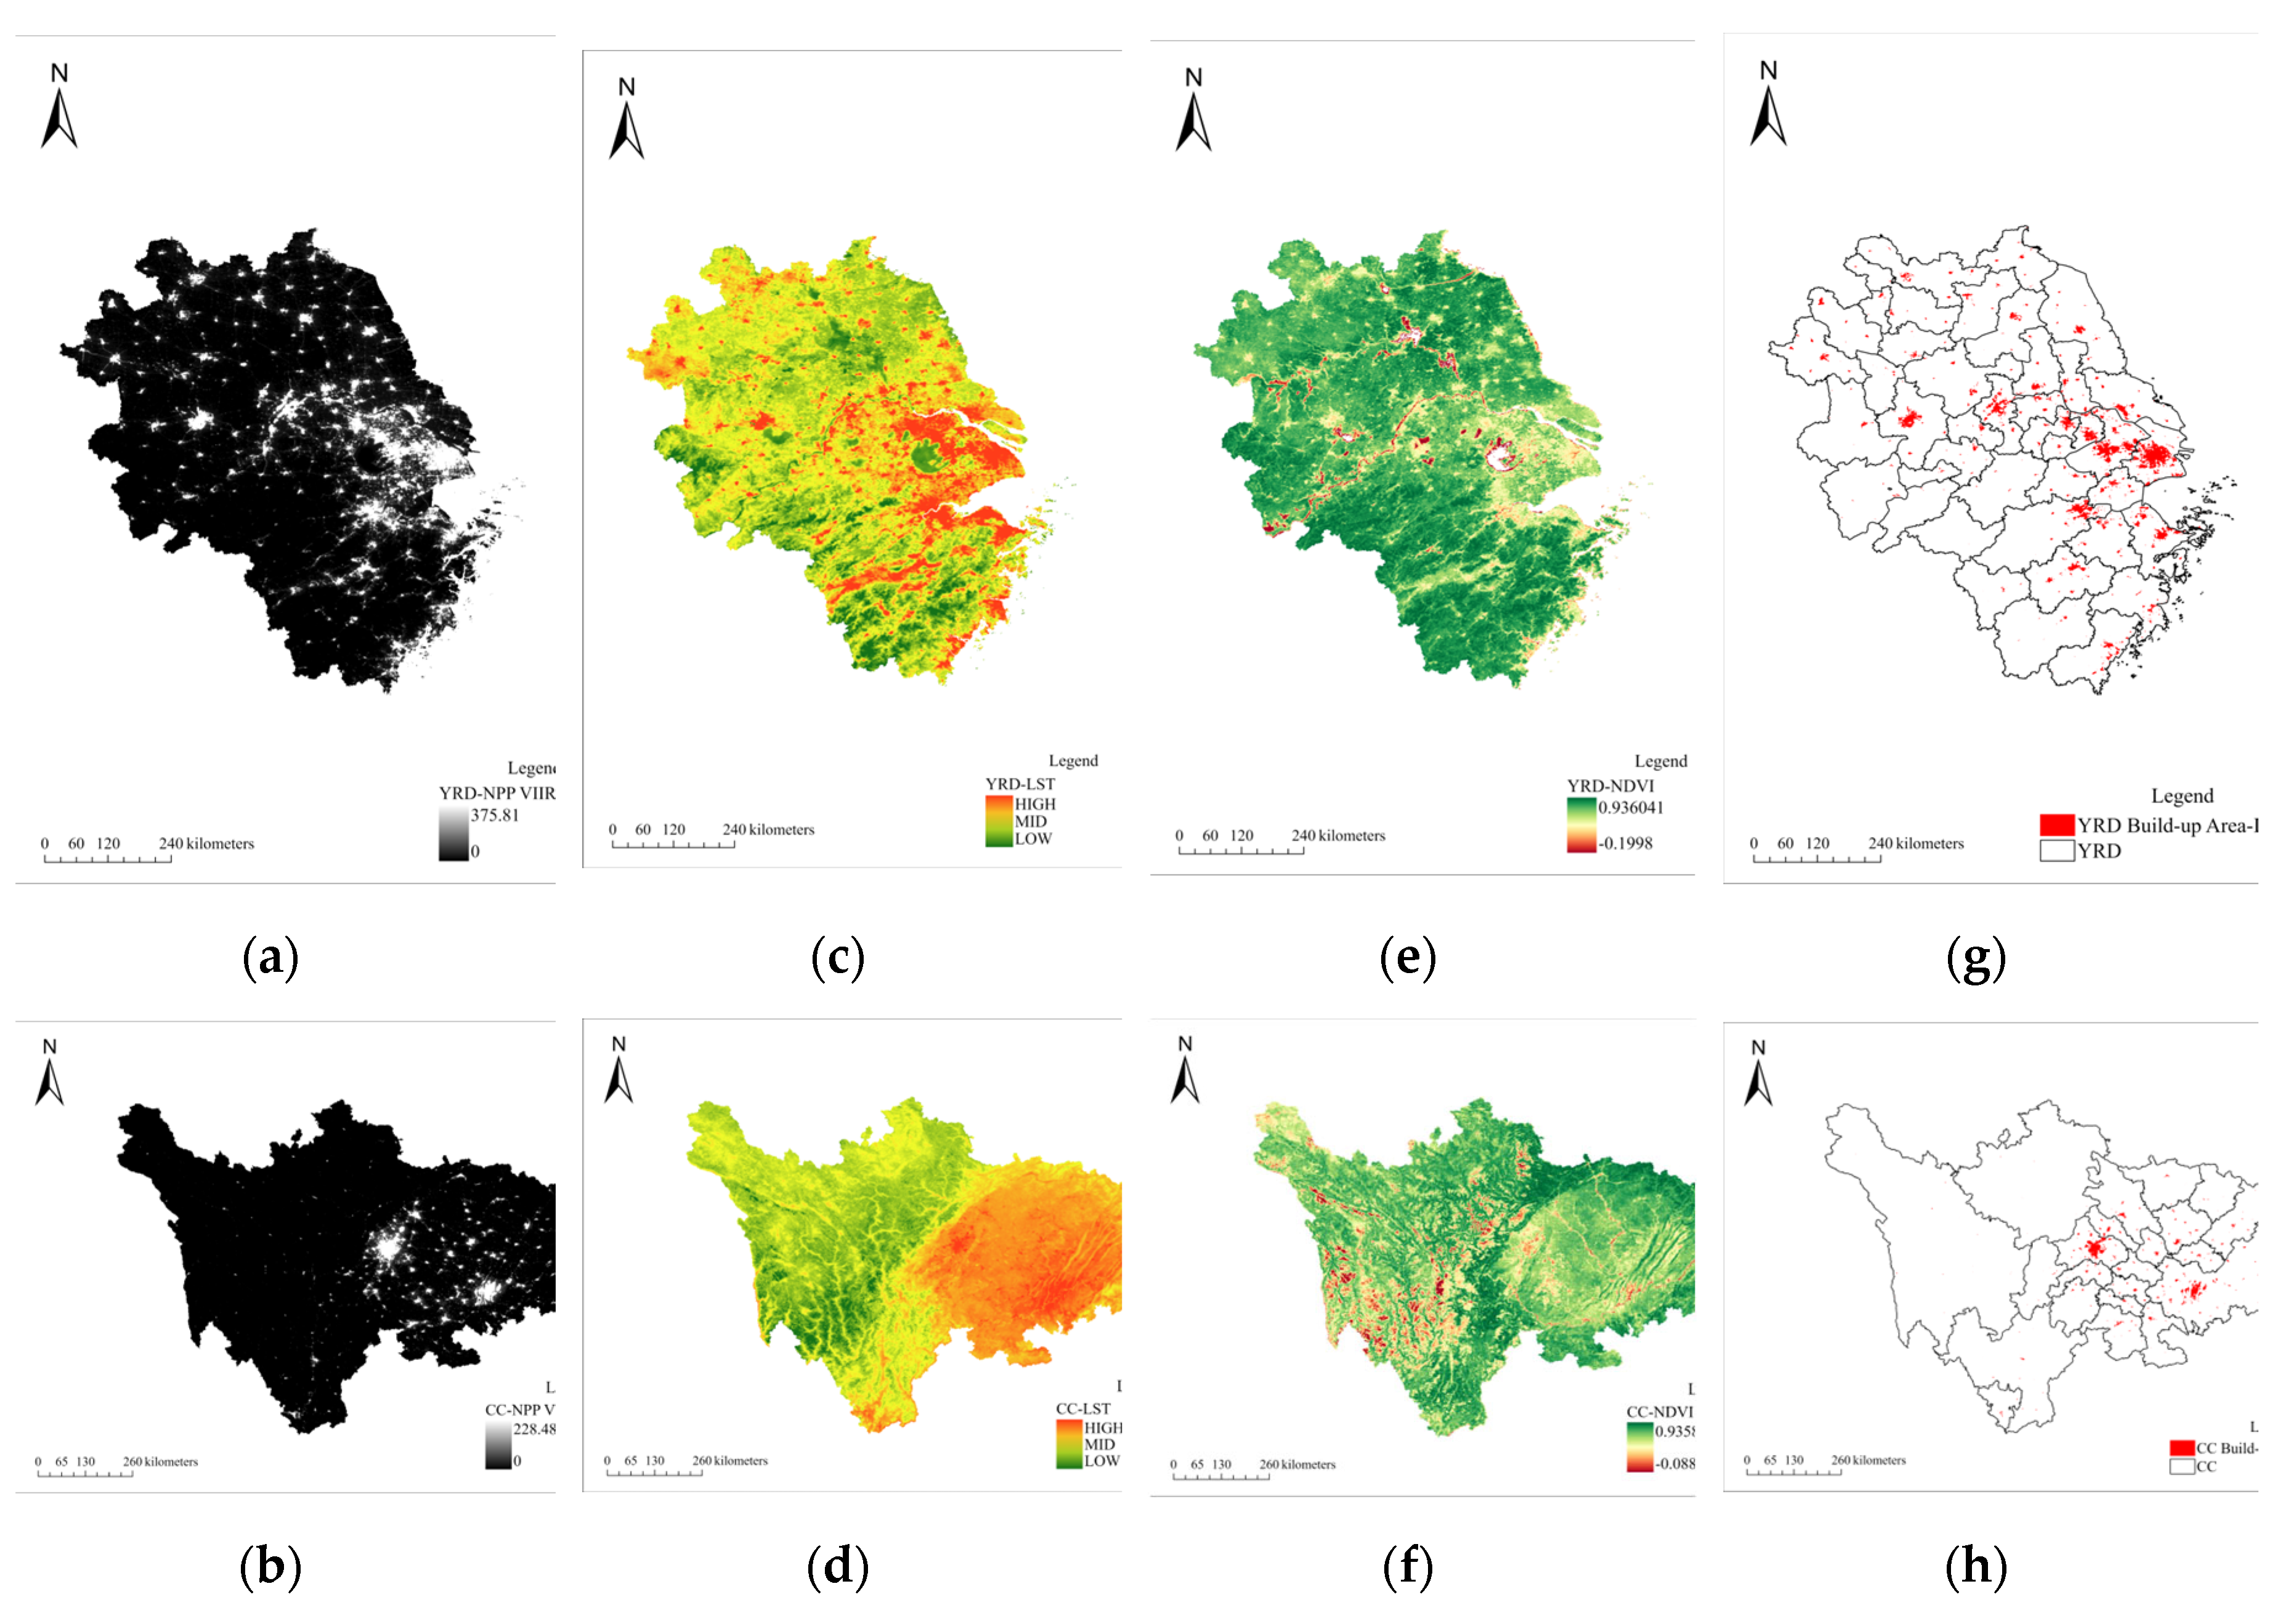
Figure 6.
This is a set of figures. (a) (b) Description of traffic accessibility distribution map of two urban agglomerations; (c) (d) Distribution of traffic passage time in two urban agglomerations; (e) (f) Description of the results of urban built-up areas extracted by TRM in two urban agglomerations.
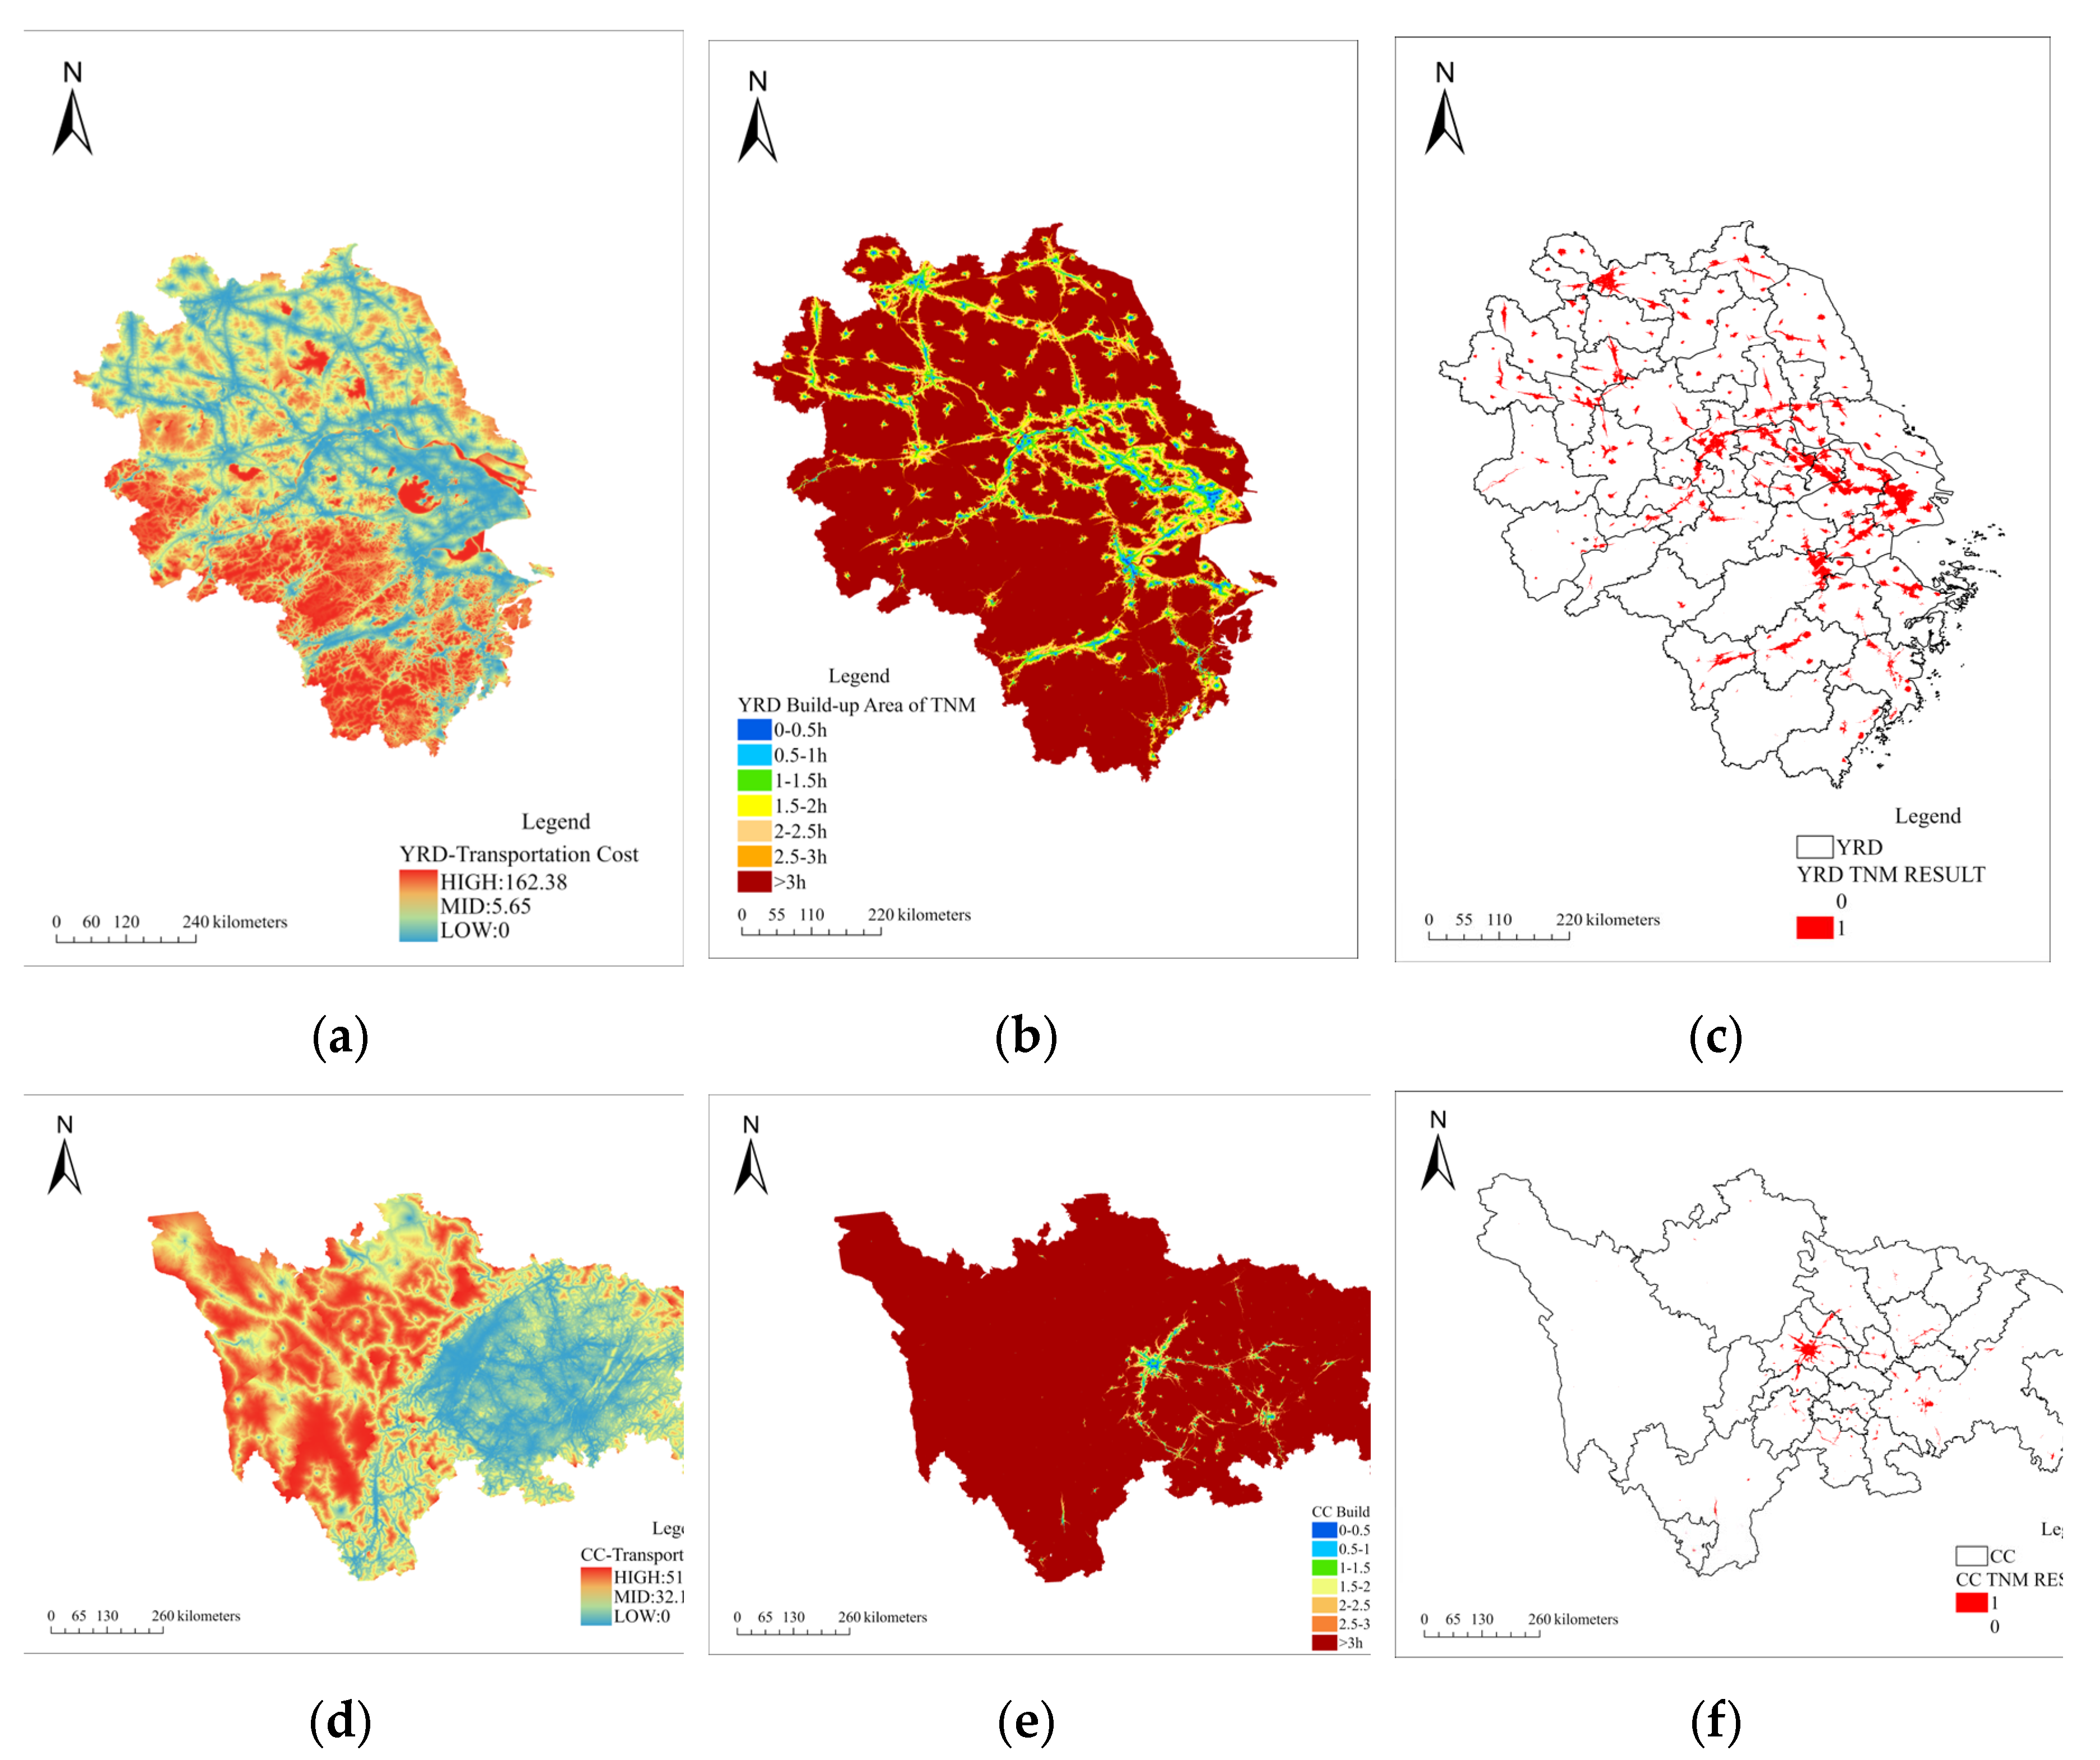
Figure 7.
The Overlay Effect of Fusion Experimental Results and High-precision Data Sets.
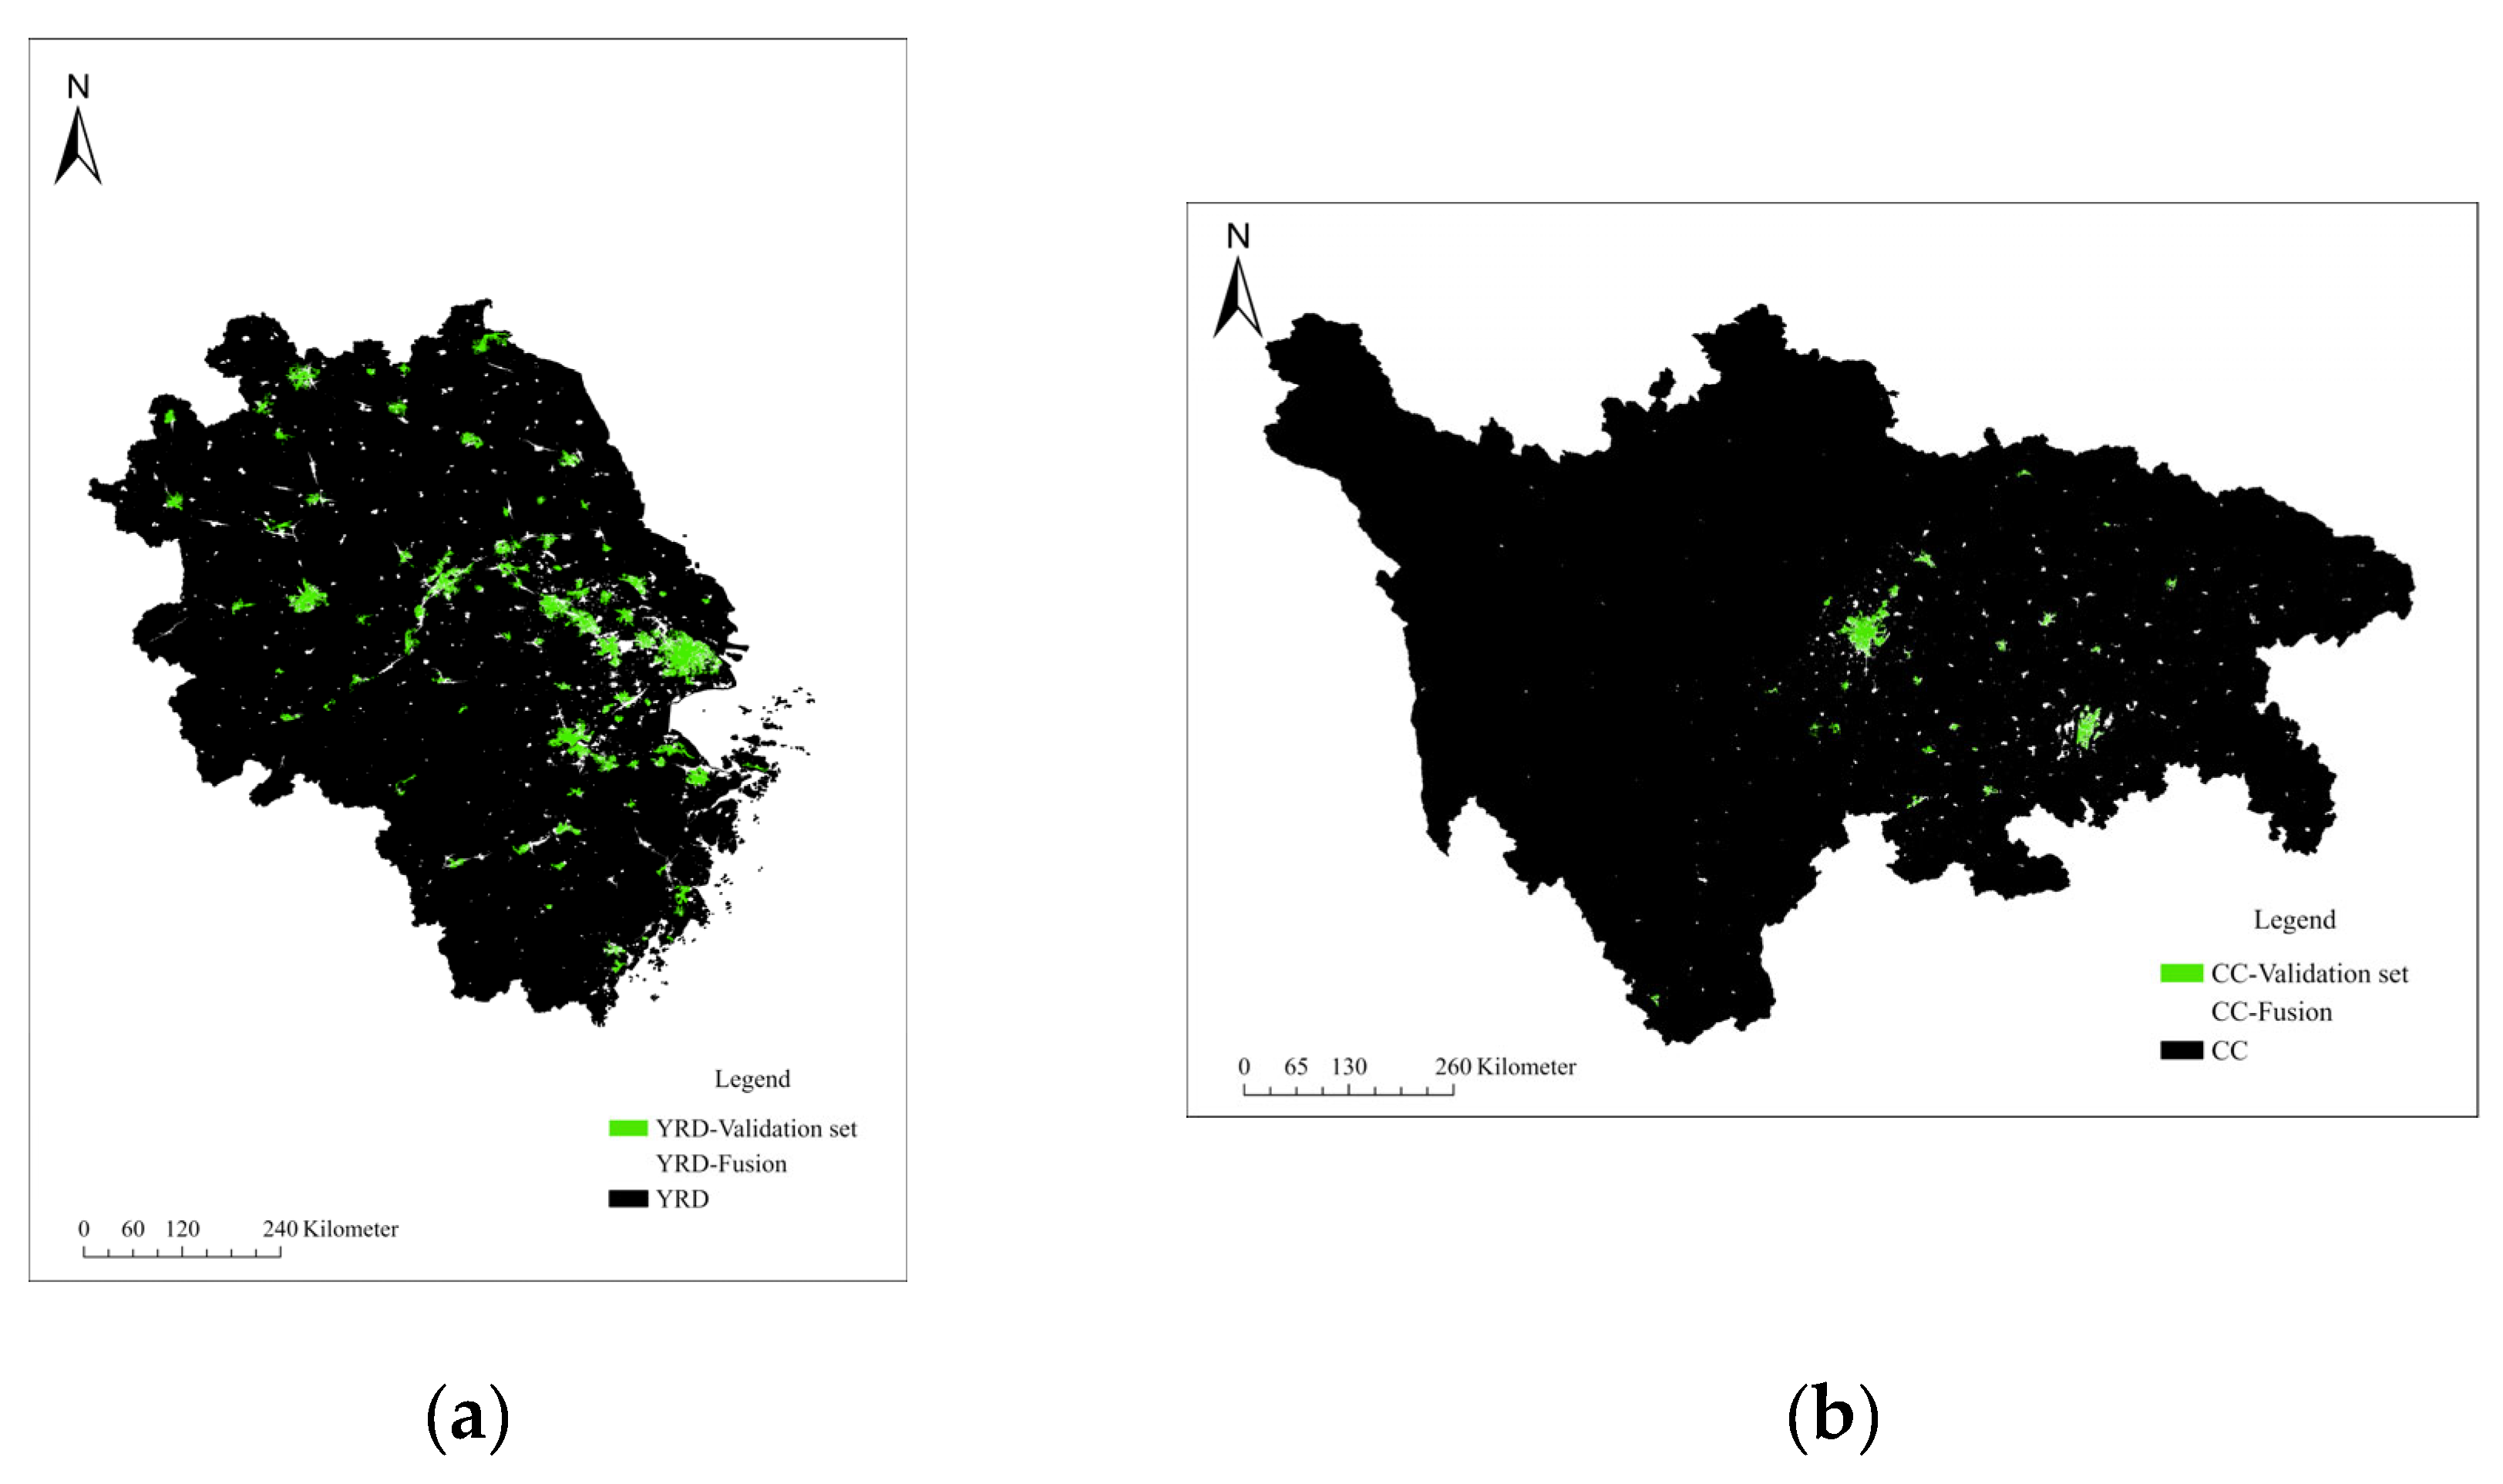

Table 1.
Unit travel speed and cost of different modes of transport.
| Road network type | Speed (km/h) | Speed cost (min) | Barrier |
|---|---|---|---|
| Railway | 300 | 0.2 | Station |
| Highroad | 120 | 0.5 | / |
| National road, Express road | 80 | 0.75 | |
| Provincial road | 60 | 1 | |
| Township road, County road | 40 | 1.5 | |
| Other roads | 30 | 2 |
Table 2.
Results of Random Point Verification in CC.
| TYPE | POIM | RSM | TRM | Fusion | ||||
|---|---|---|---|---|---|---|---|---|
| TN | 2784 | 92.80% | 2776 | 92.53% | 2767 | 92.23% | 2776 | 92.53% |
| TP | 118 | 3.93% | 166 | 5.53% | 84 | 2.80% | 175 | 5.83% |
| FN | 94 | 3.13% | 46 | 1.53% | 128 | 4.27% | 37 | 1.23% |
| FP | 4 | 0.13% | 12 | 0.40% | 21 | 0.70% | 12 | 0.40% |
| TN | 6956 | 69.56% | 6935 | 69.35% | 6935 | 69.35% | 6932 | 69.32% |
| TP | 1625 | 16.25% | 2358 | 23.58% | 1263 | 12.63% | 2470 | 24.70% |
| FN | 1405 | 14.05% | 672 | 6.72% | 1767 | 17.67% | 560 | 5.60% |
| FP | 14 | 0.14% | 35 | 0.35% | 35 | 0.35% | 38 | 0.38% |
Table 3.
Results of Random Point Verification in YRD.
| TYPE | POIM | RSM | TRM | Fusion | ||||
|---|---|---|---|---|---|---|---|---|
| TN | 2565 | 85.50% | 2549 | 84.97% | 2483 | 82.77% | 2504 | 83.47% |
| TP | 175 | 5.83% | 237 | 7.90% | 184 | 6.13% | 273 | 9.10% |
| FN | 13 | 0.43% | 29 | 0.97% | 95 | 3.17% | 74 | 2.47% |
| FP | 247 | 8.23% | 185 | 6.17% | 238 | 7.93% | 149 | 4.97% |
| TN | 4787 | 47.87% | 4754 | 47.54% | 4746 | 47.46% | 4680 | 46.80% |
| TP | 2259 | 22.59% | 2906 | 29.06% | 1048 | 10.48% | 3363 | 33.63% |
| FN | 2920 | 29.20% | 2273 | 22.73% | 4131 | 41.31% | 1816 | 18.16% |
| FP | 34 | 0.34% | 67 | 0.67% | 75 | 0.75% | 141 | 1.41% |
Table 4.
Accuracy Set of Random Points Verification in CC.
| POIM | RSM | TRM | Fusion | |||||
|---|---|---|---|---|---|---|---|---|
| 3000 | 10000 | 3000 | 10000 | 3000 | 10000 | 3000 | 10000 | |
| OA | 96.7333% | 85.8100% | 98.0667% | 92.9300% | 95.0333% | 81.9800% | 98.3667% | 94.0200% |
| P | 96.7213% | 99.1458% | 93.2584% | 98.5374% | 80.0000% | 97.3035% | 93.5829% | 98.4848% |
| R | 55.6604% | 53.6304% | 78.3019% | 77.8218% | 39.6226% | 41.6832% | 82.5472% | 81.5182% |
| F1 | 0.7066 | 0.6961 | 0.8513 | 0.8696 | 0.5300 | 0.5836 | 0.8772 | 0.8920 |
| KAPPA | 0.6906 | 0.6140 | 0.8410 | 0.8220 | 0.5069 | 0.4912 | 0.8685 | 0.8512 |
Table 5.
Accuracy Set of Random Points Verification in YRD.
| POIM | RSM | TRM | Fusion | |||||
|---|---|---|---|---|---|---|---|---|
| 3000 | 10000 | 3000 | 10000 | 3000 | 10000 | 3000 | 10000 | |
| OA | 91.3333% | 70.4600% | 92.8667% | 76.6000% | 88.9000% | 57.9400% | 92.5667% | 80.4300% |
| P | 41.4692% | 98.5172% | 56.1611% | 97.7464% | 43.6019% | 93.3215% | 64.6919% | 95.9760% |
| R | 93.0851% | 43.6185% | 89.0977% | 56.1112% | 65.9498% | 20.2356% | 78.6744% | 64.9353% |
| F1 | 0.5738 | 0.6047 | 0.6890 | 0.7130 | 0.5250 | 0.3326 | 0.7100 | 0.7746 |
| KAPPA | 0.5333 | 0.4204 | 0.6510 | 0.5387 | 0.4651 | 0.1815 | 0.6678 | 0.6127 |
Disclaimer/Publisher’s Note: The statements, opinions and data contained in all publications are solely those of the individual author(s) and contributor(s) and not of MDPI and/or the editor(s). MDPI and/or the editor(s) disclaim responsibility for any injury to people or property resulting from any ideas, methods, instructions or products referred to in the content. |
© 2024 by the authors. Licensee MDPI, Basel, Switzerland. This article is an open access article distributed under the terms and conditions of the Creative Commons Attribution (CC BY) license (http://creativecommons.org/licenses/by/4.0/).
Copyright: This open access article is published under a Creative Commons CC BY 4.0 license, which permit the free download, distribution, and reuse, provided that the author and preprint are cited in any reuse.


