Submitted:
18 June 2024
Posted:
18 June 2024
You are already at the latest version
Abstract
Keywords:
1. Introduction
2. Materials and Methods
2.1. Introduction of Pumping Probe
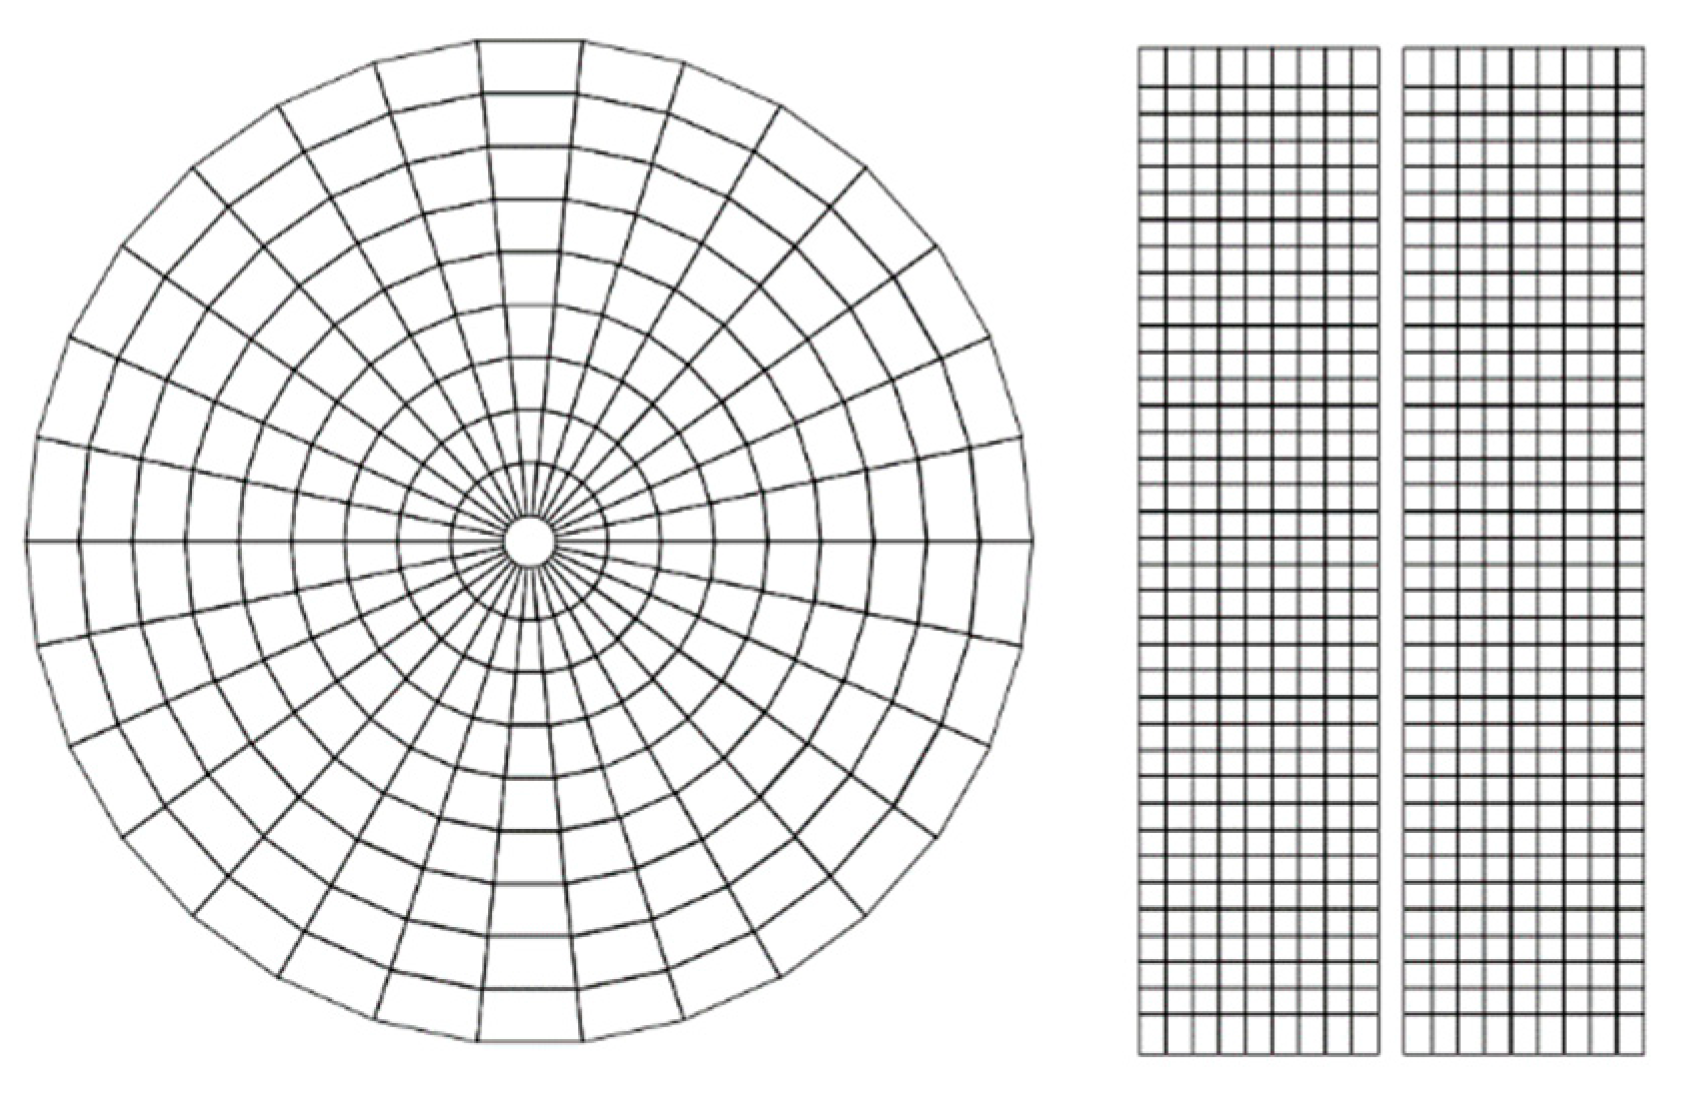
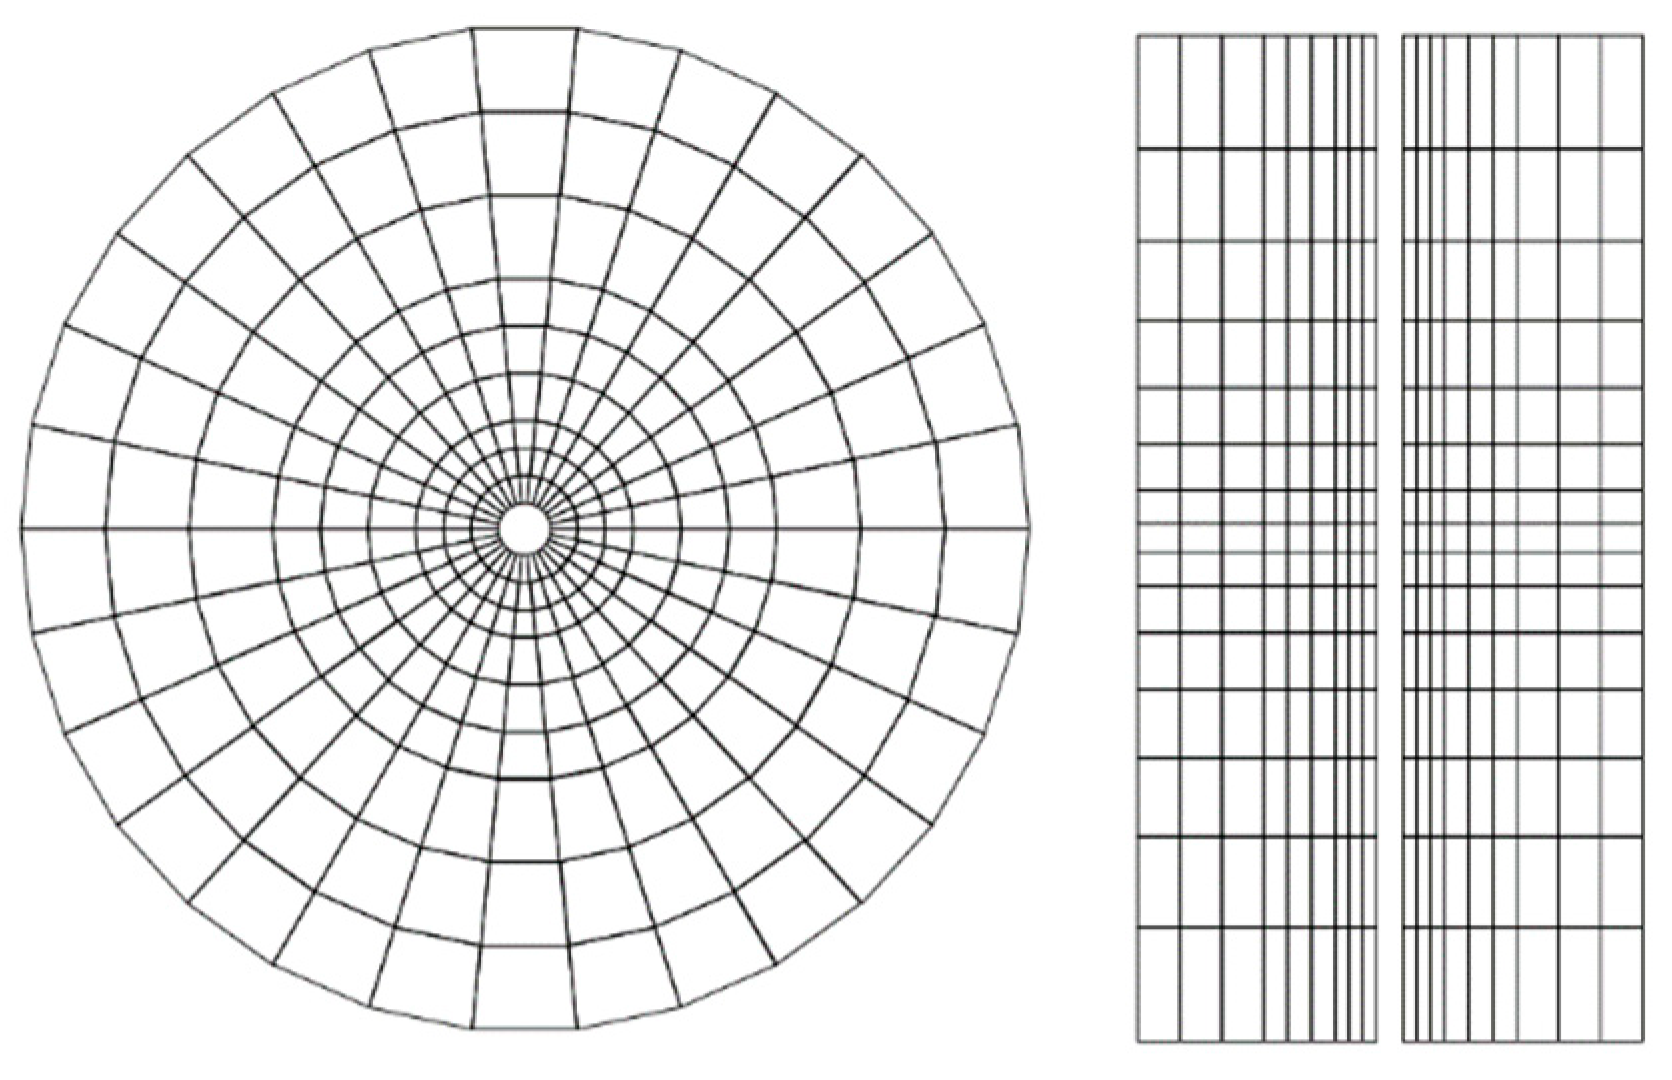
2.2. Meshing Model
2.3. Numerical Simulation Model
2.4. Target Parameter Calculation Model
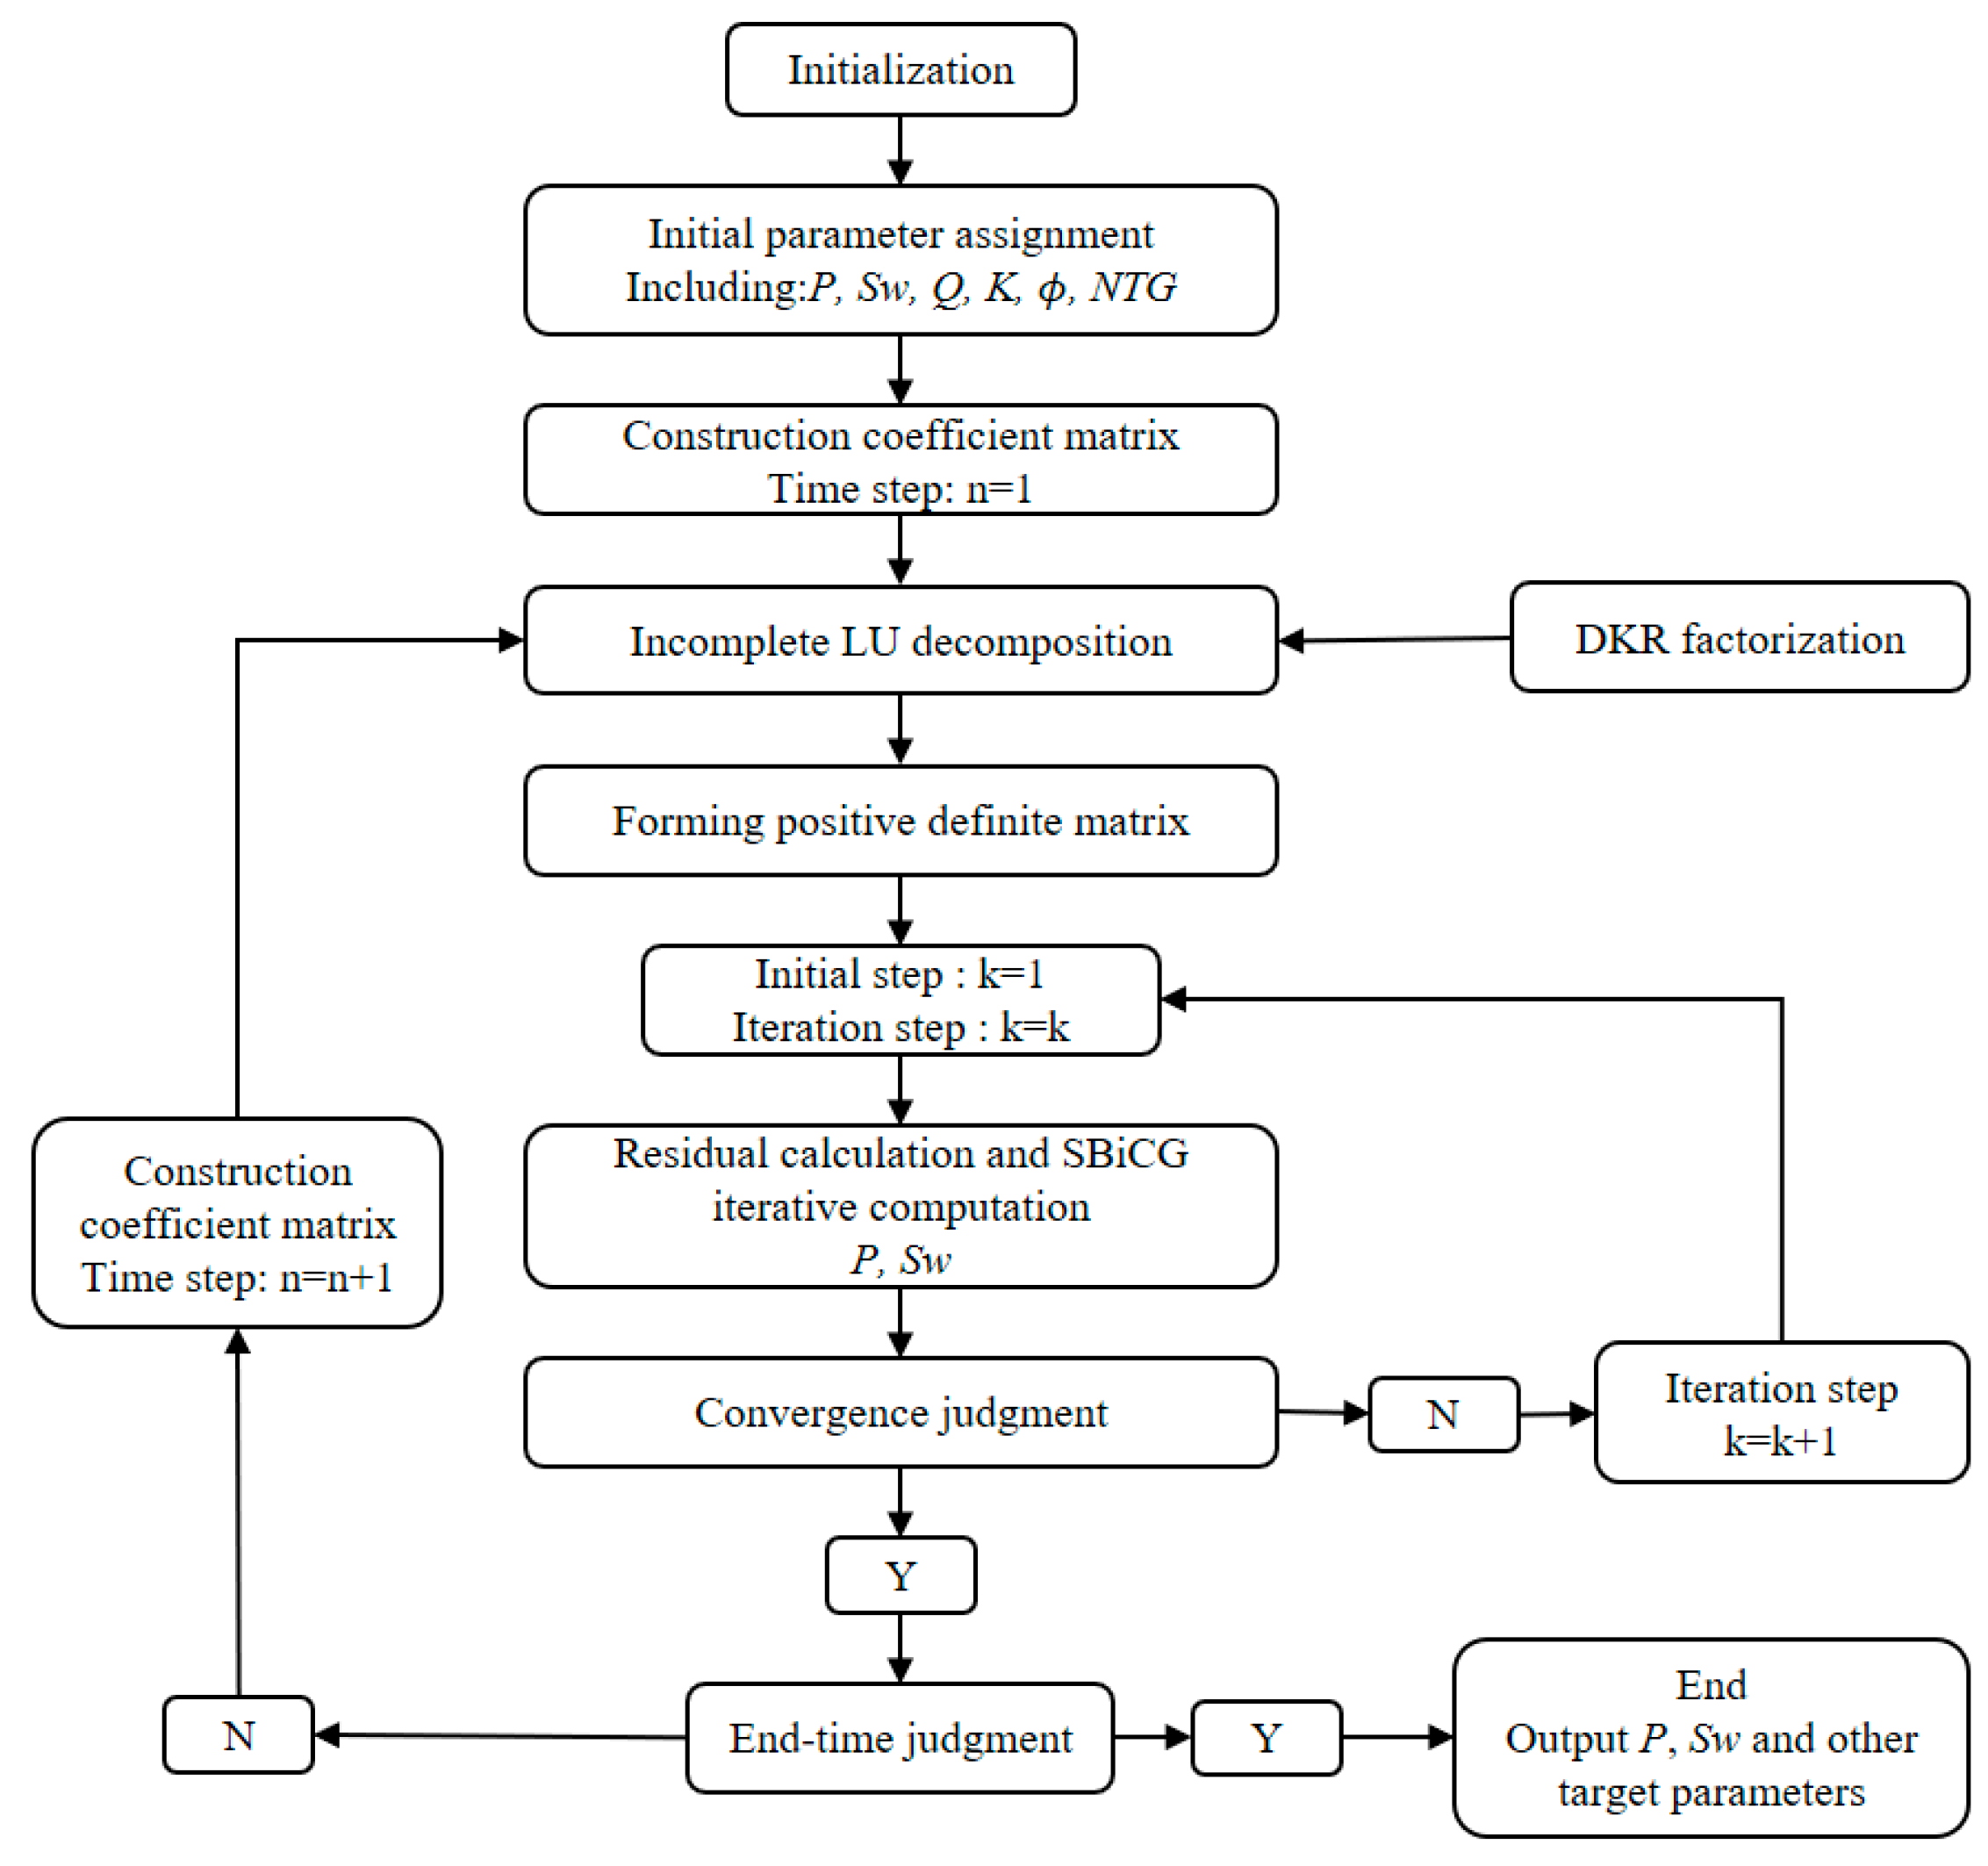
2.5. Solving Matrix Equation
2.6. Model Analysis
3. Results and Discussion
3.1. Parameters Sensitivity Analysis
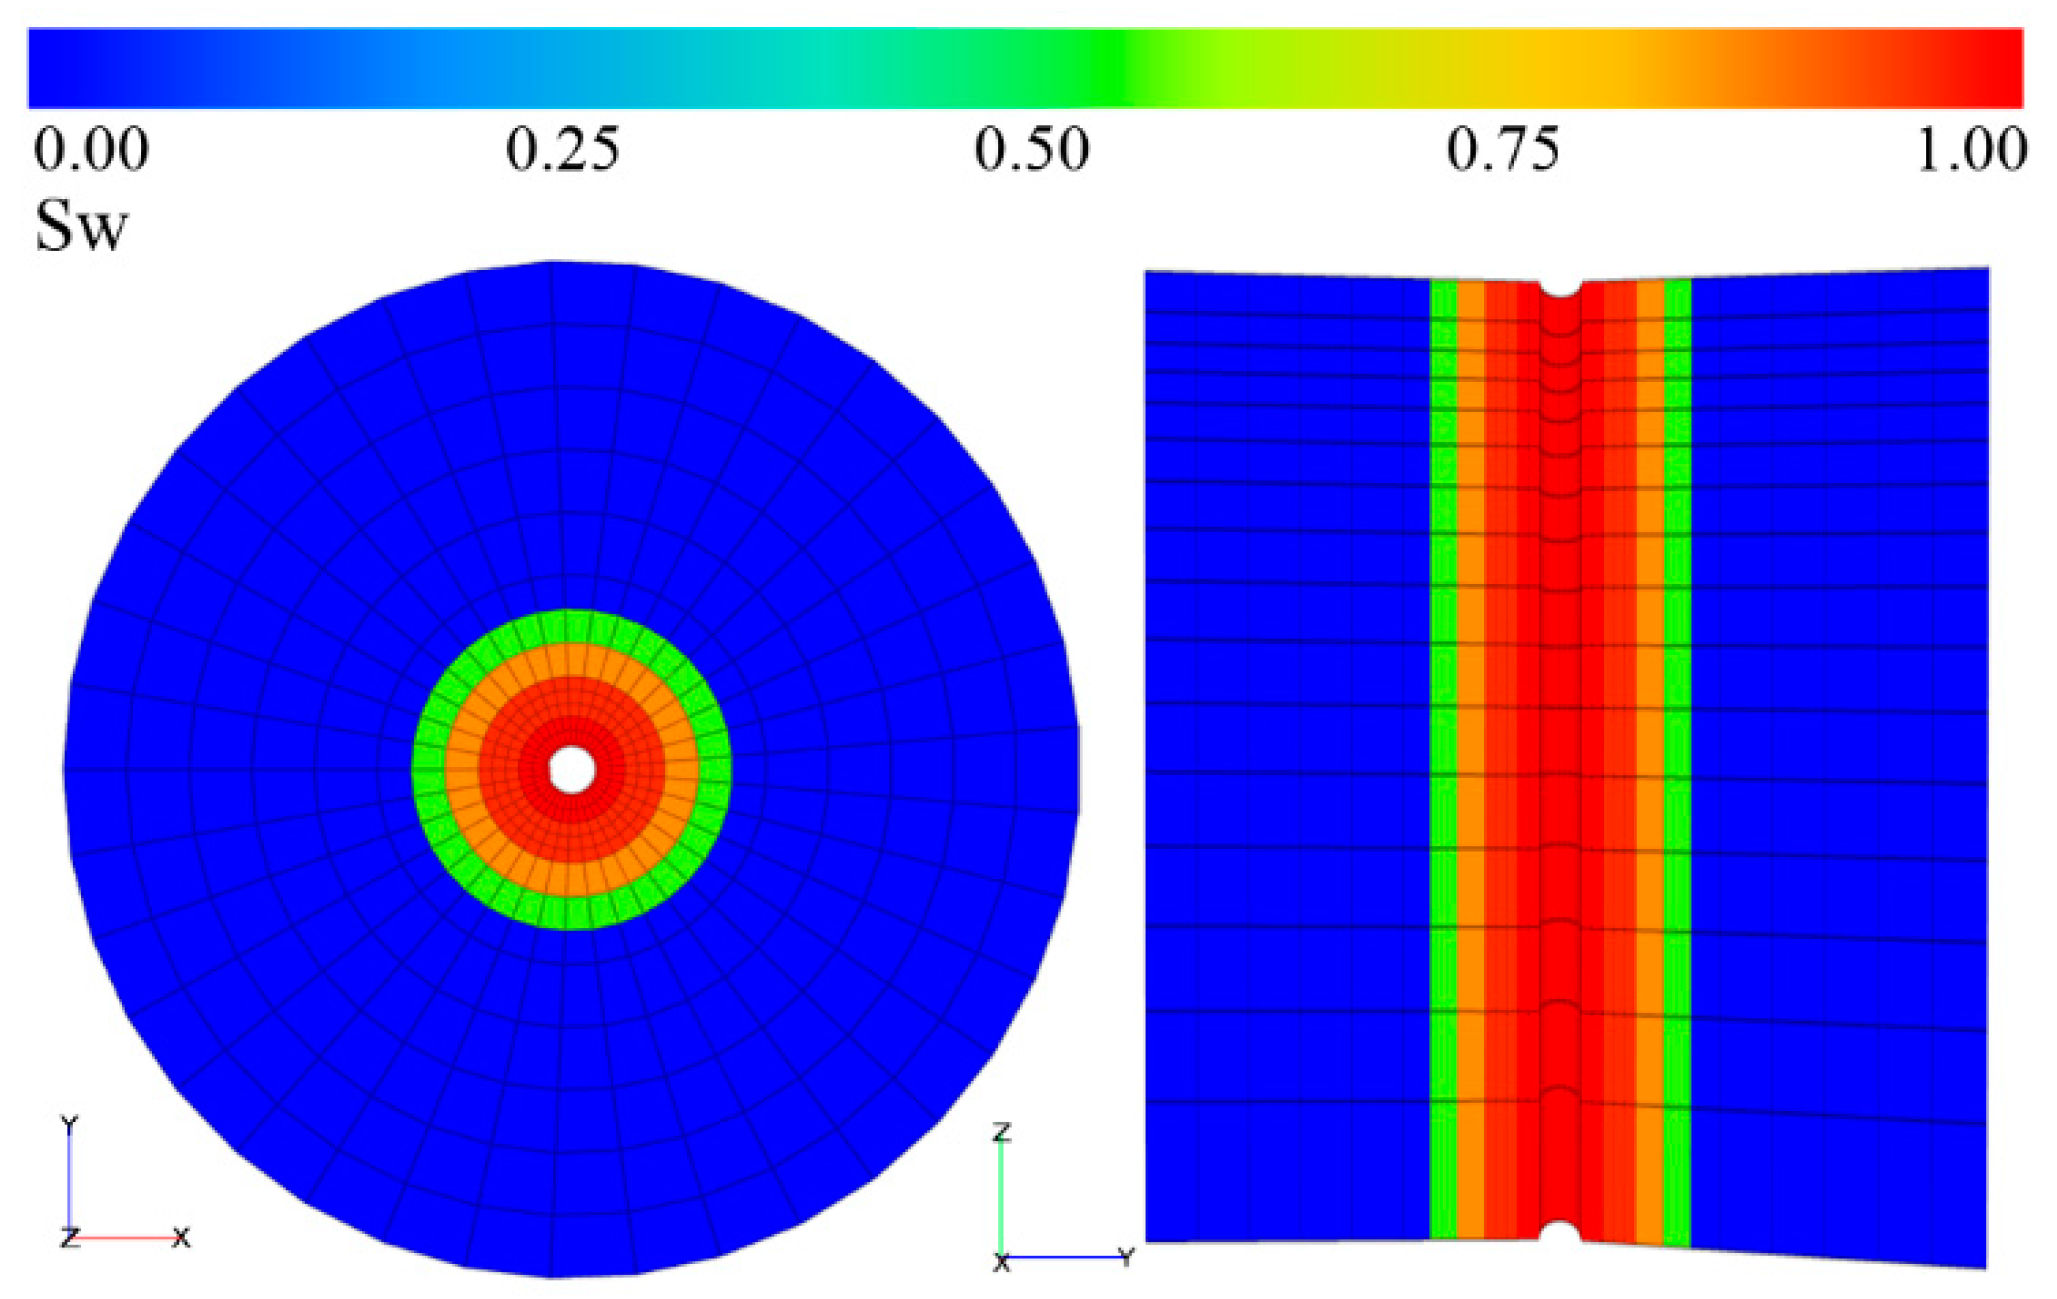
3.2. Probe Operation Analysis
3.3. Sampling Operations in Shallow Heavy Oil Formations
4. Conclusions
- Combining the variable step-size radial grid division technique considering the wellbore radius and the probe suction mouth size, a reasonable representation of the matching between the probe suction mouth and the grid model contact area can be achieved. By adopting a variable step-size grid model, not only can the permeation characteristics of the formation fluid into the sampling probe be reasonably represented locally, but it can also reduce the total number of grid models. This approach has a positive impact on the stability and timeliness of subsequent numerical simulation calculations.
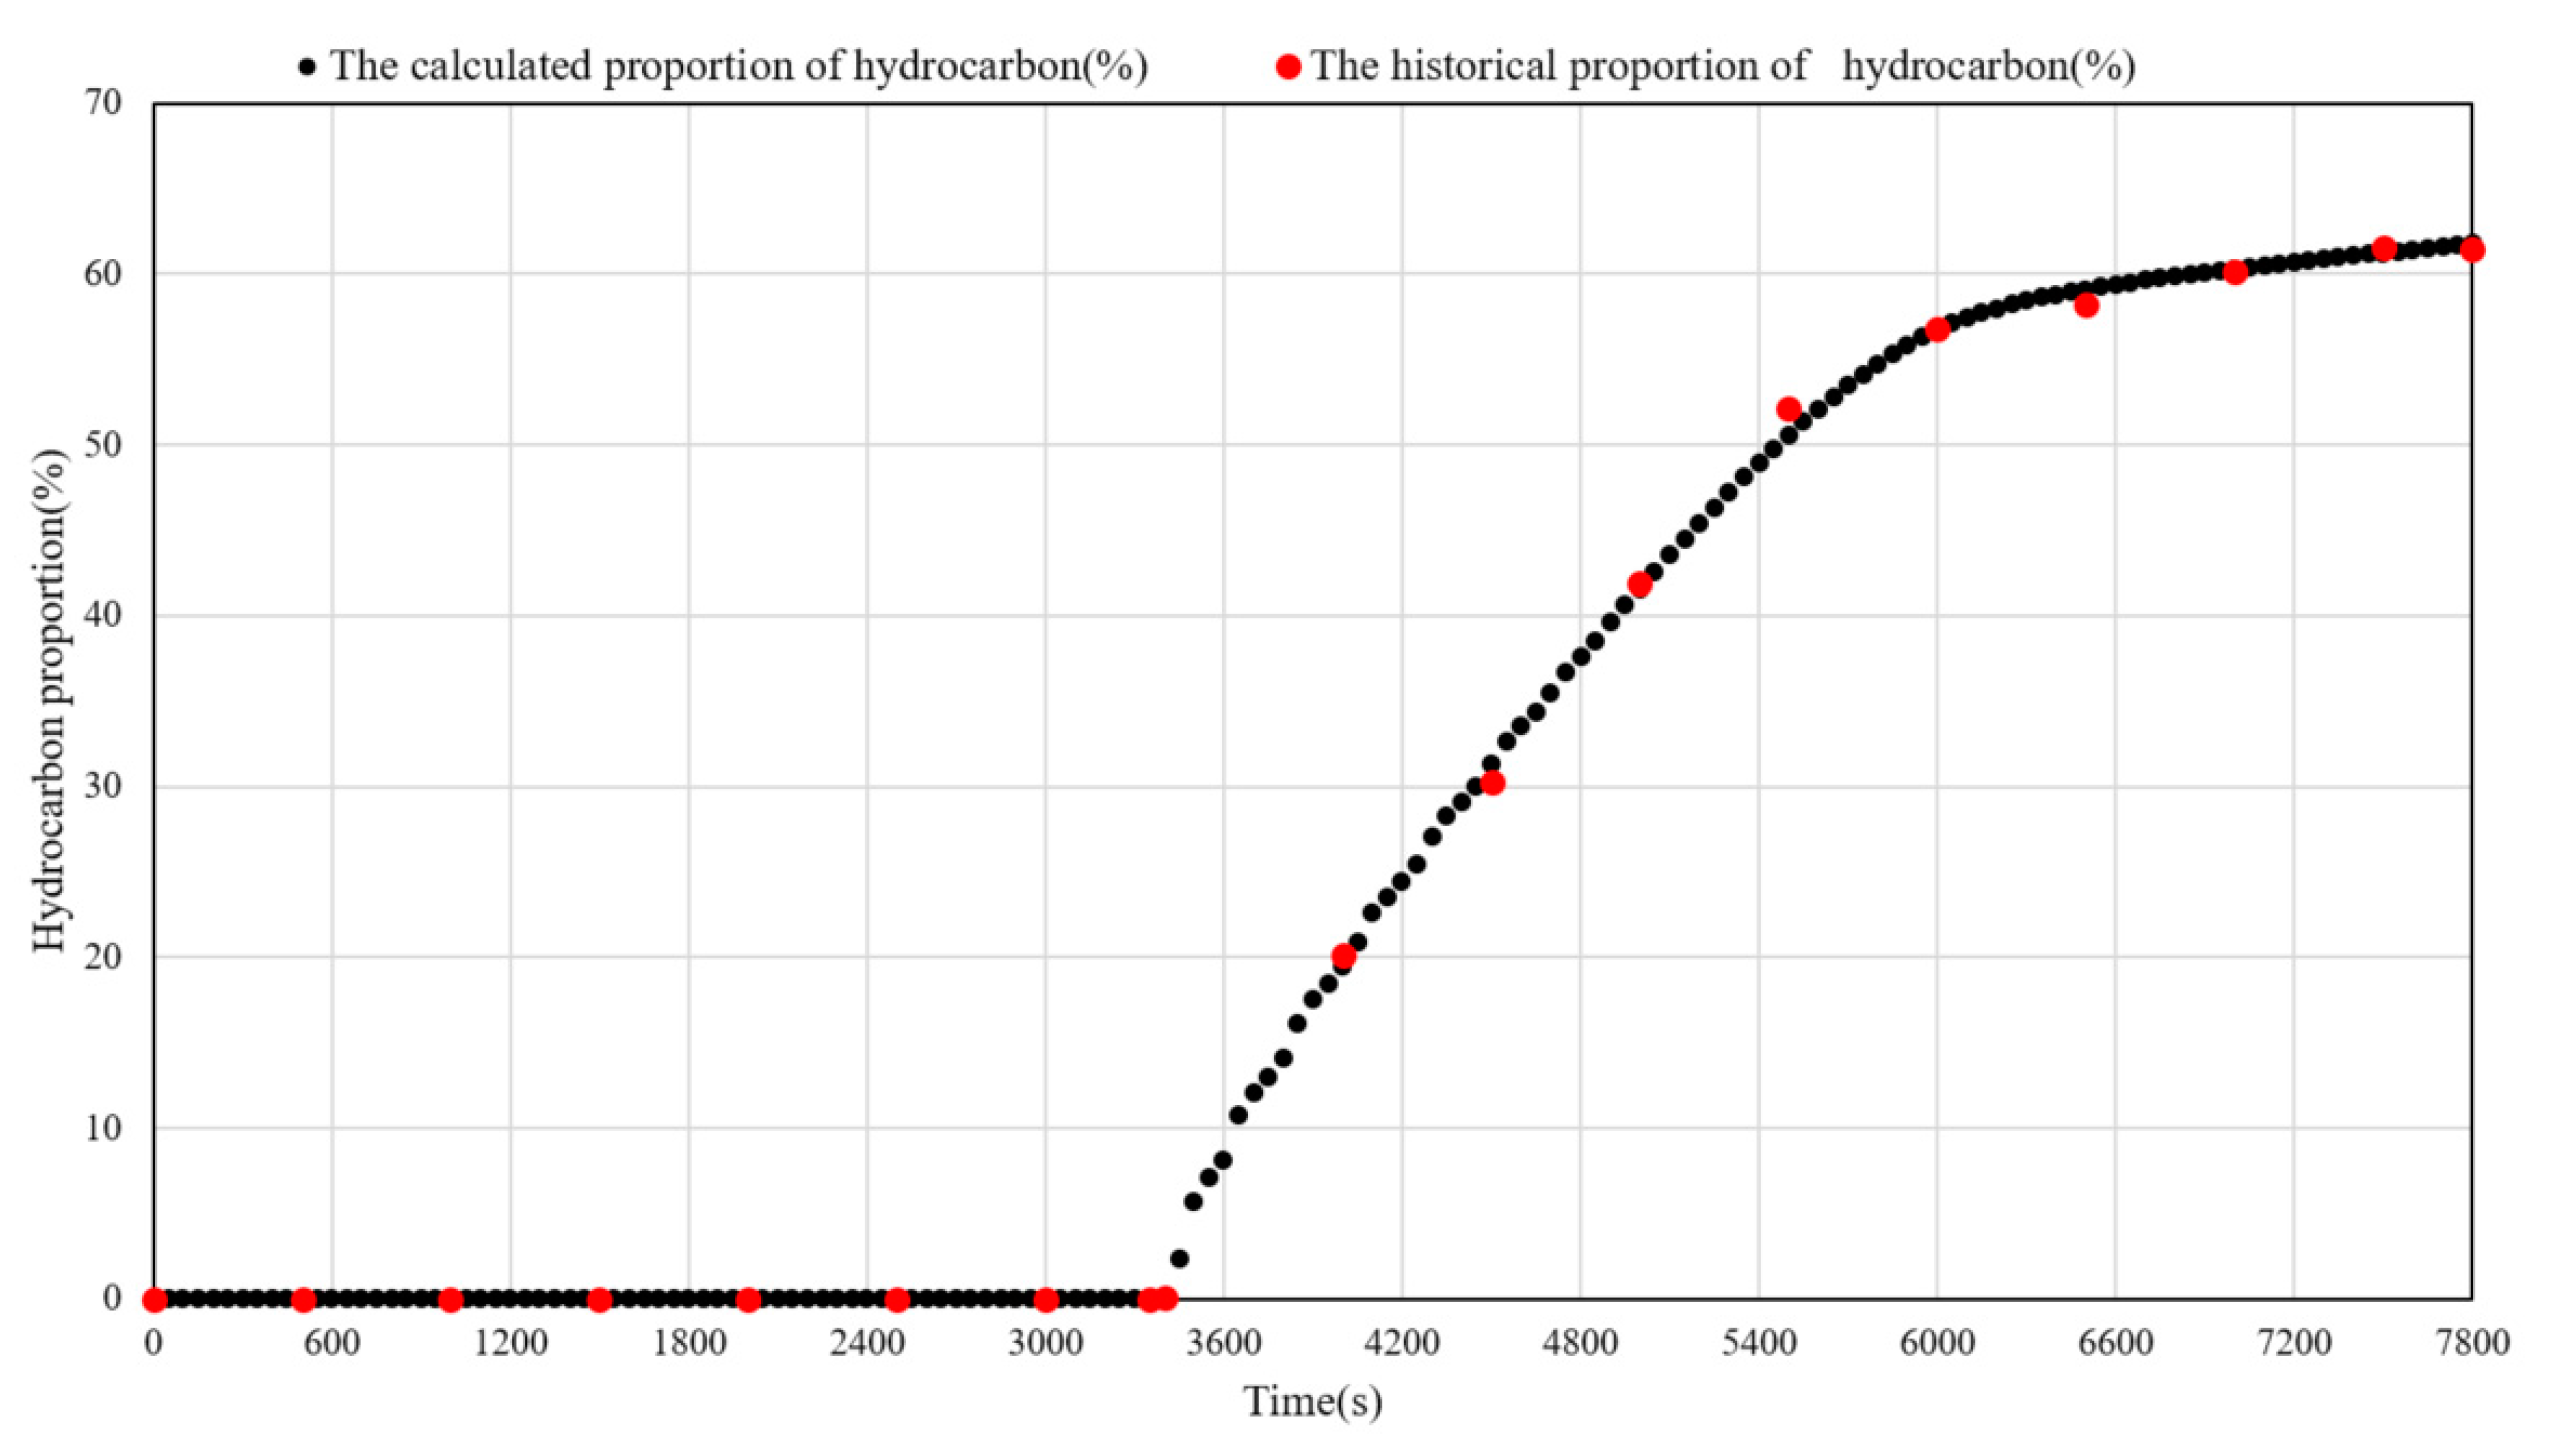
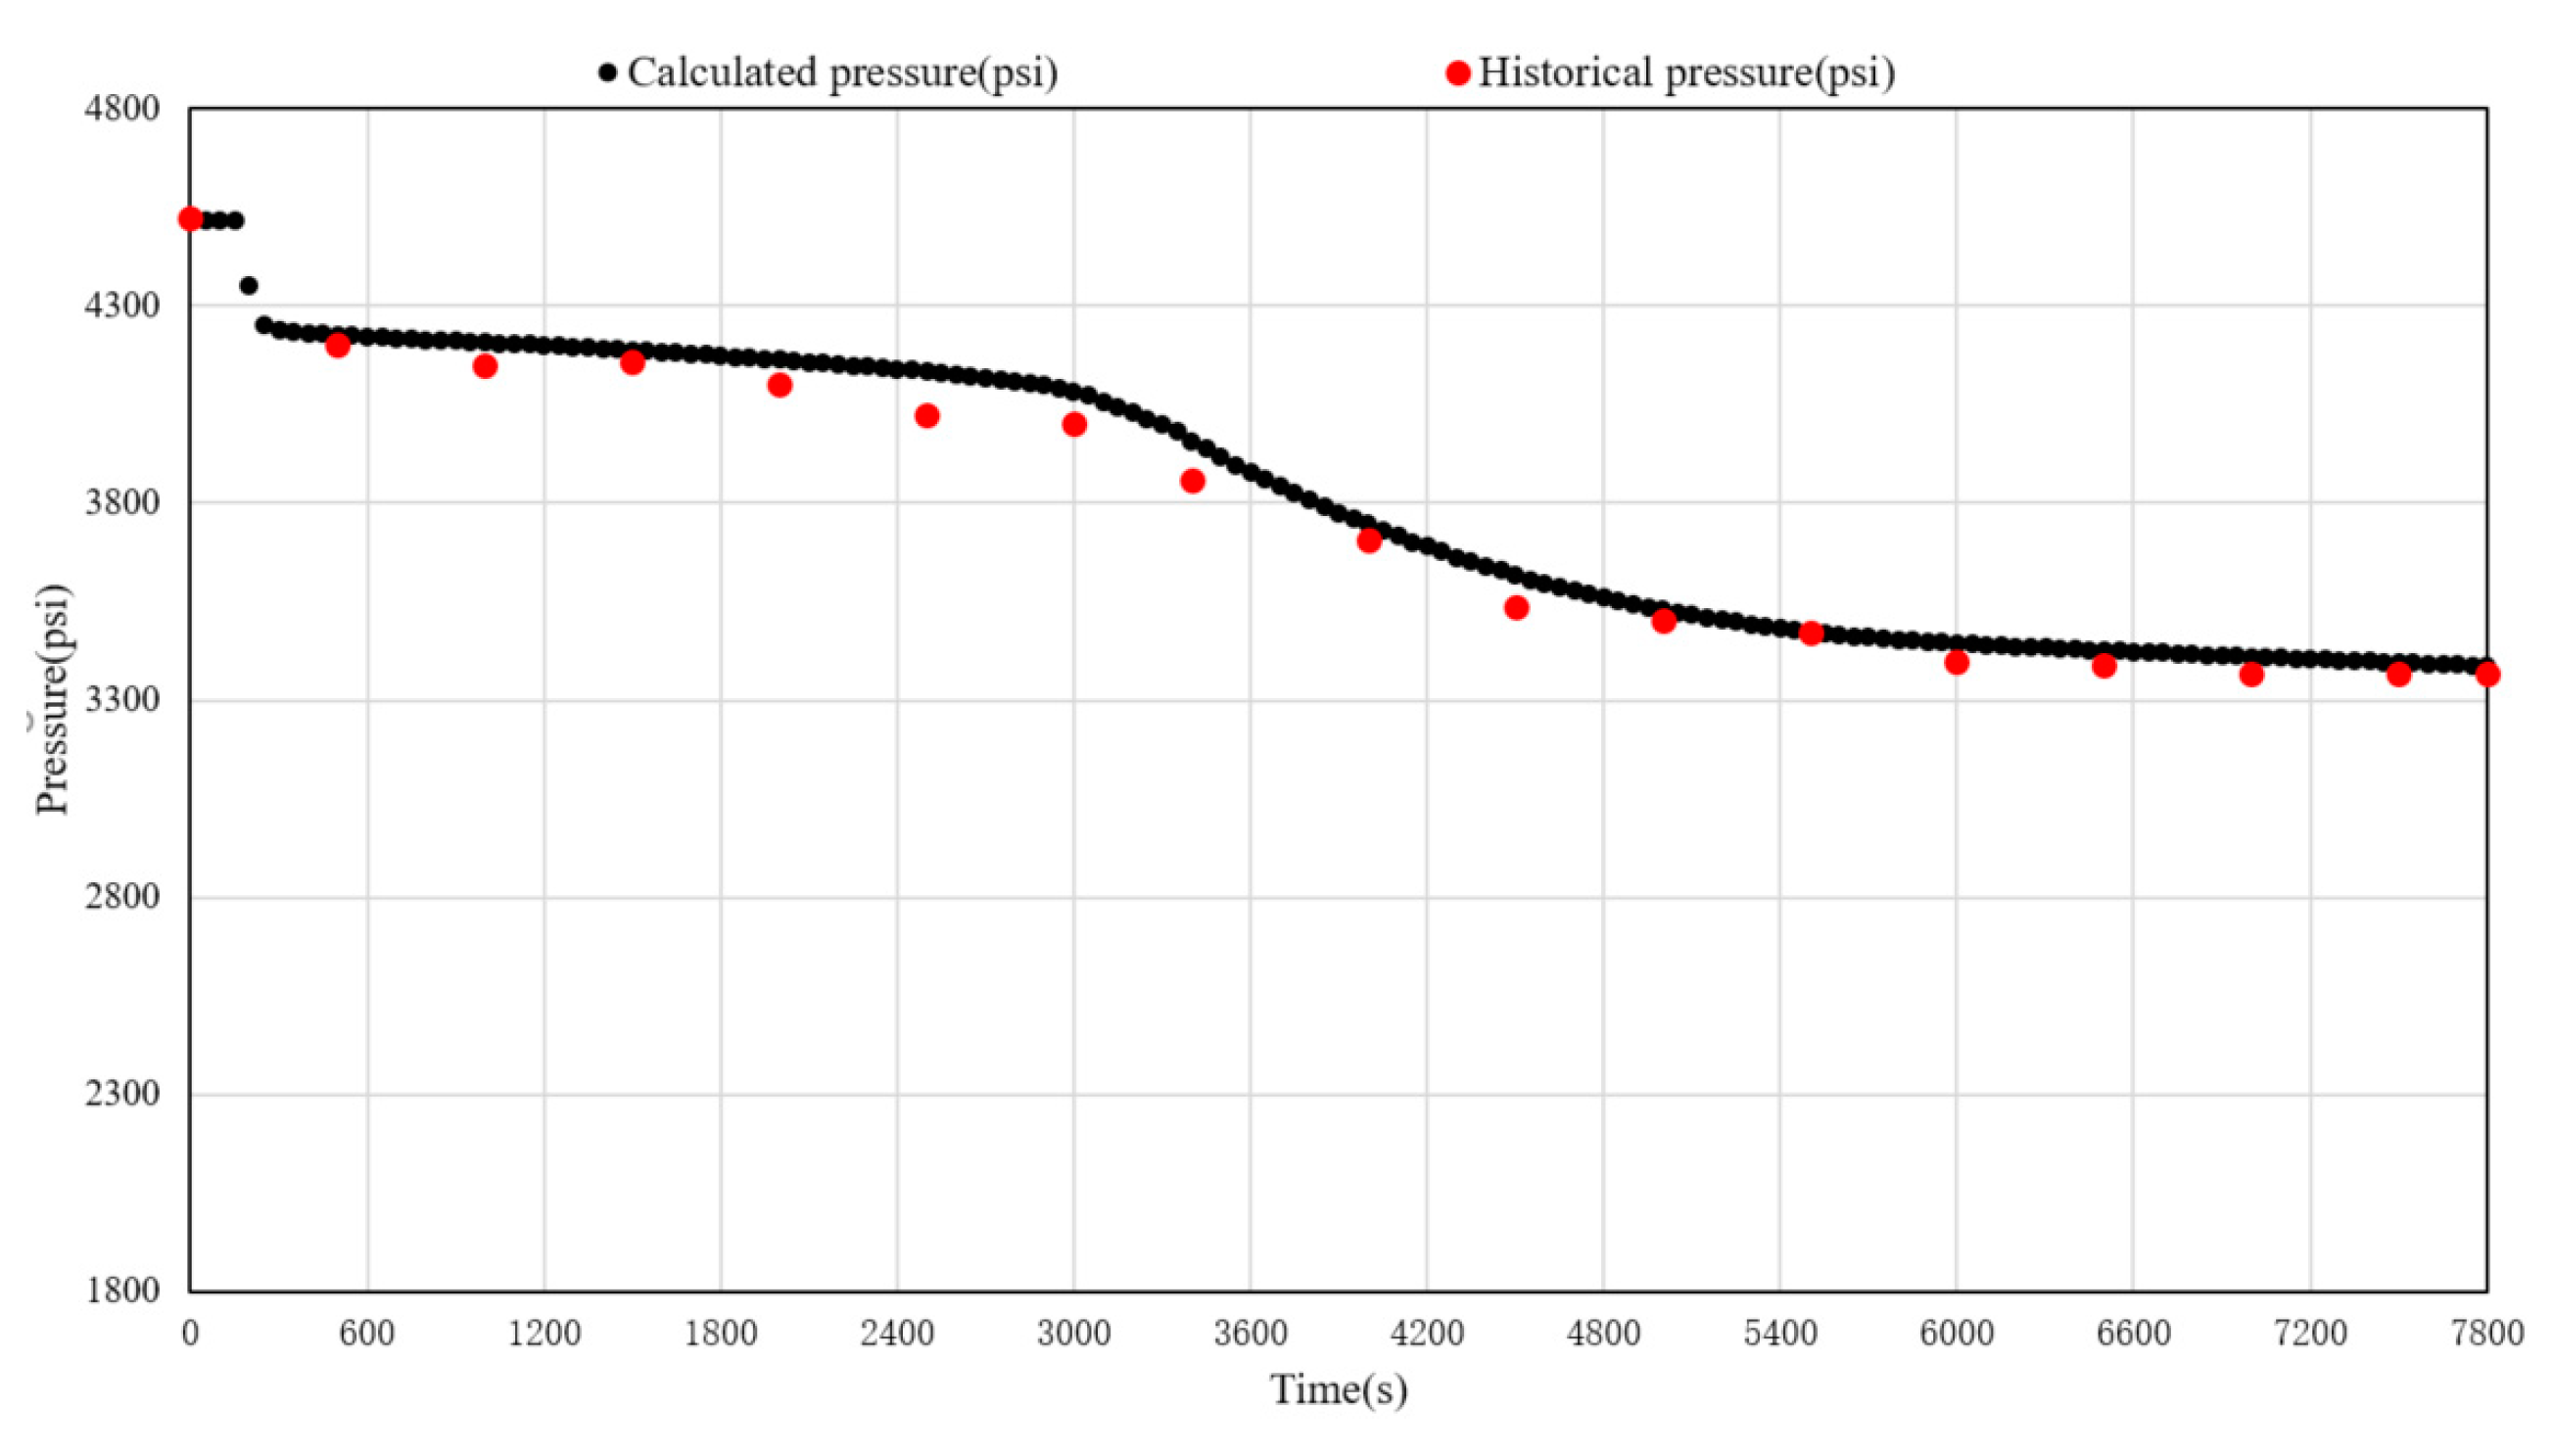
- Based on the principles of the finite volume method and considering the influence of the ratio of the probe suction area to the contact area of the geological formation grid, a numerical simulation model for fluid sampling in WTF was constructed. This model can incorporate conditions such as probe type and mud invasion. Additionally, by using incomplete LU decomposition matrix preprocessing and SBiCG, the rapid solution of model target parameters was achieved. The validation and comparison of simulated calculation results with actual sampling data were completed, providing important support for the optimization design of WFT operations during drilling processes.
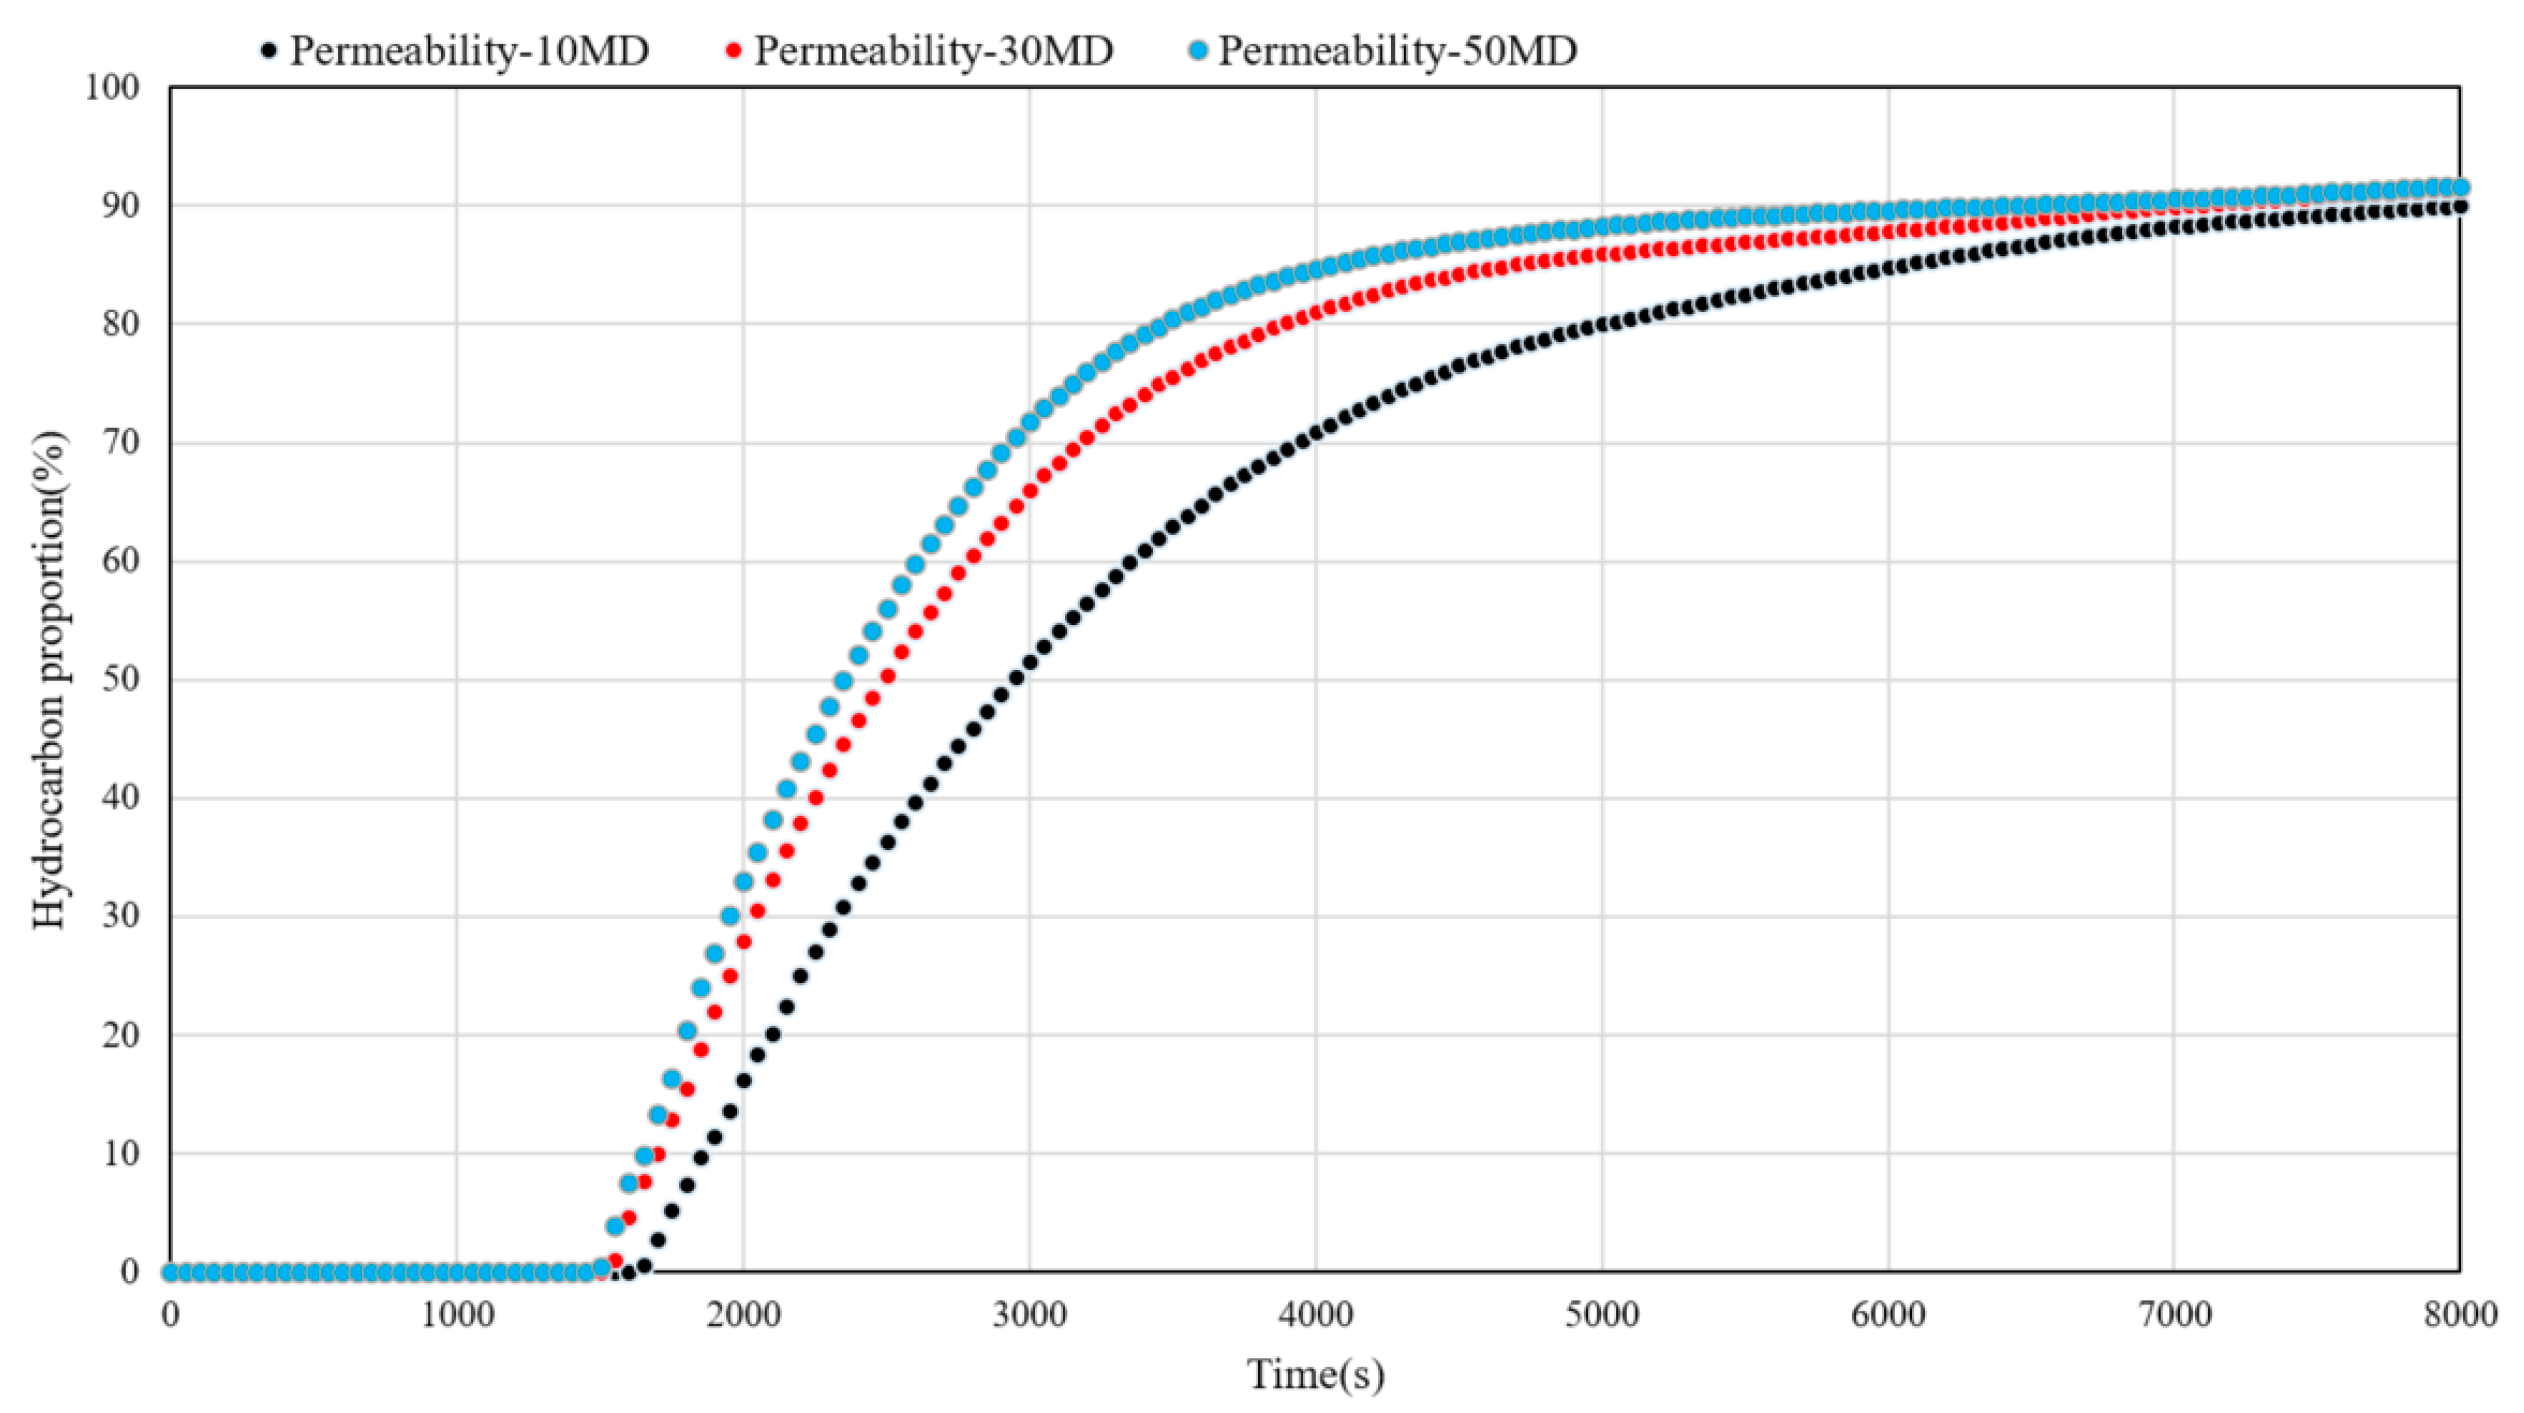
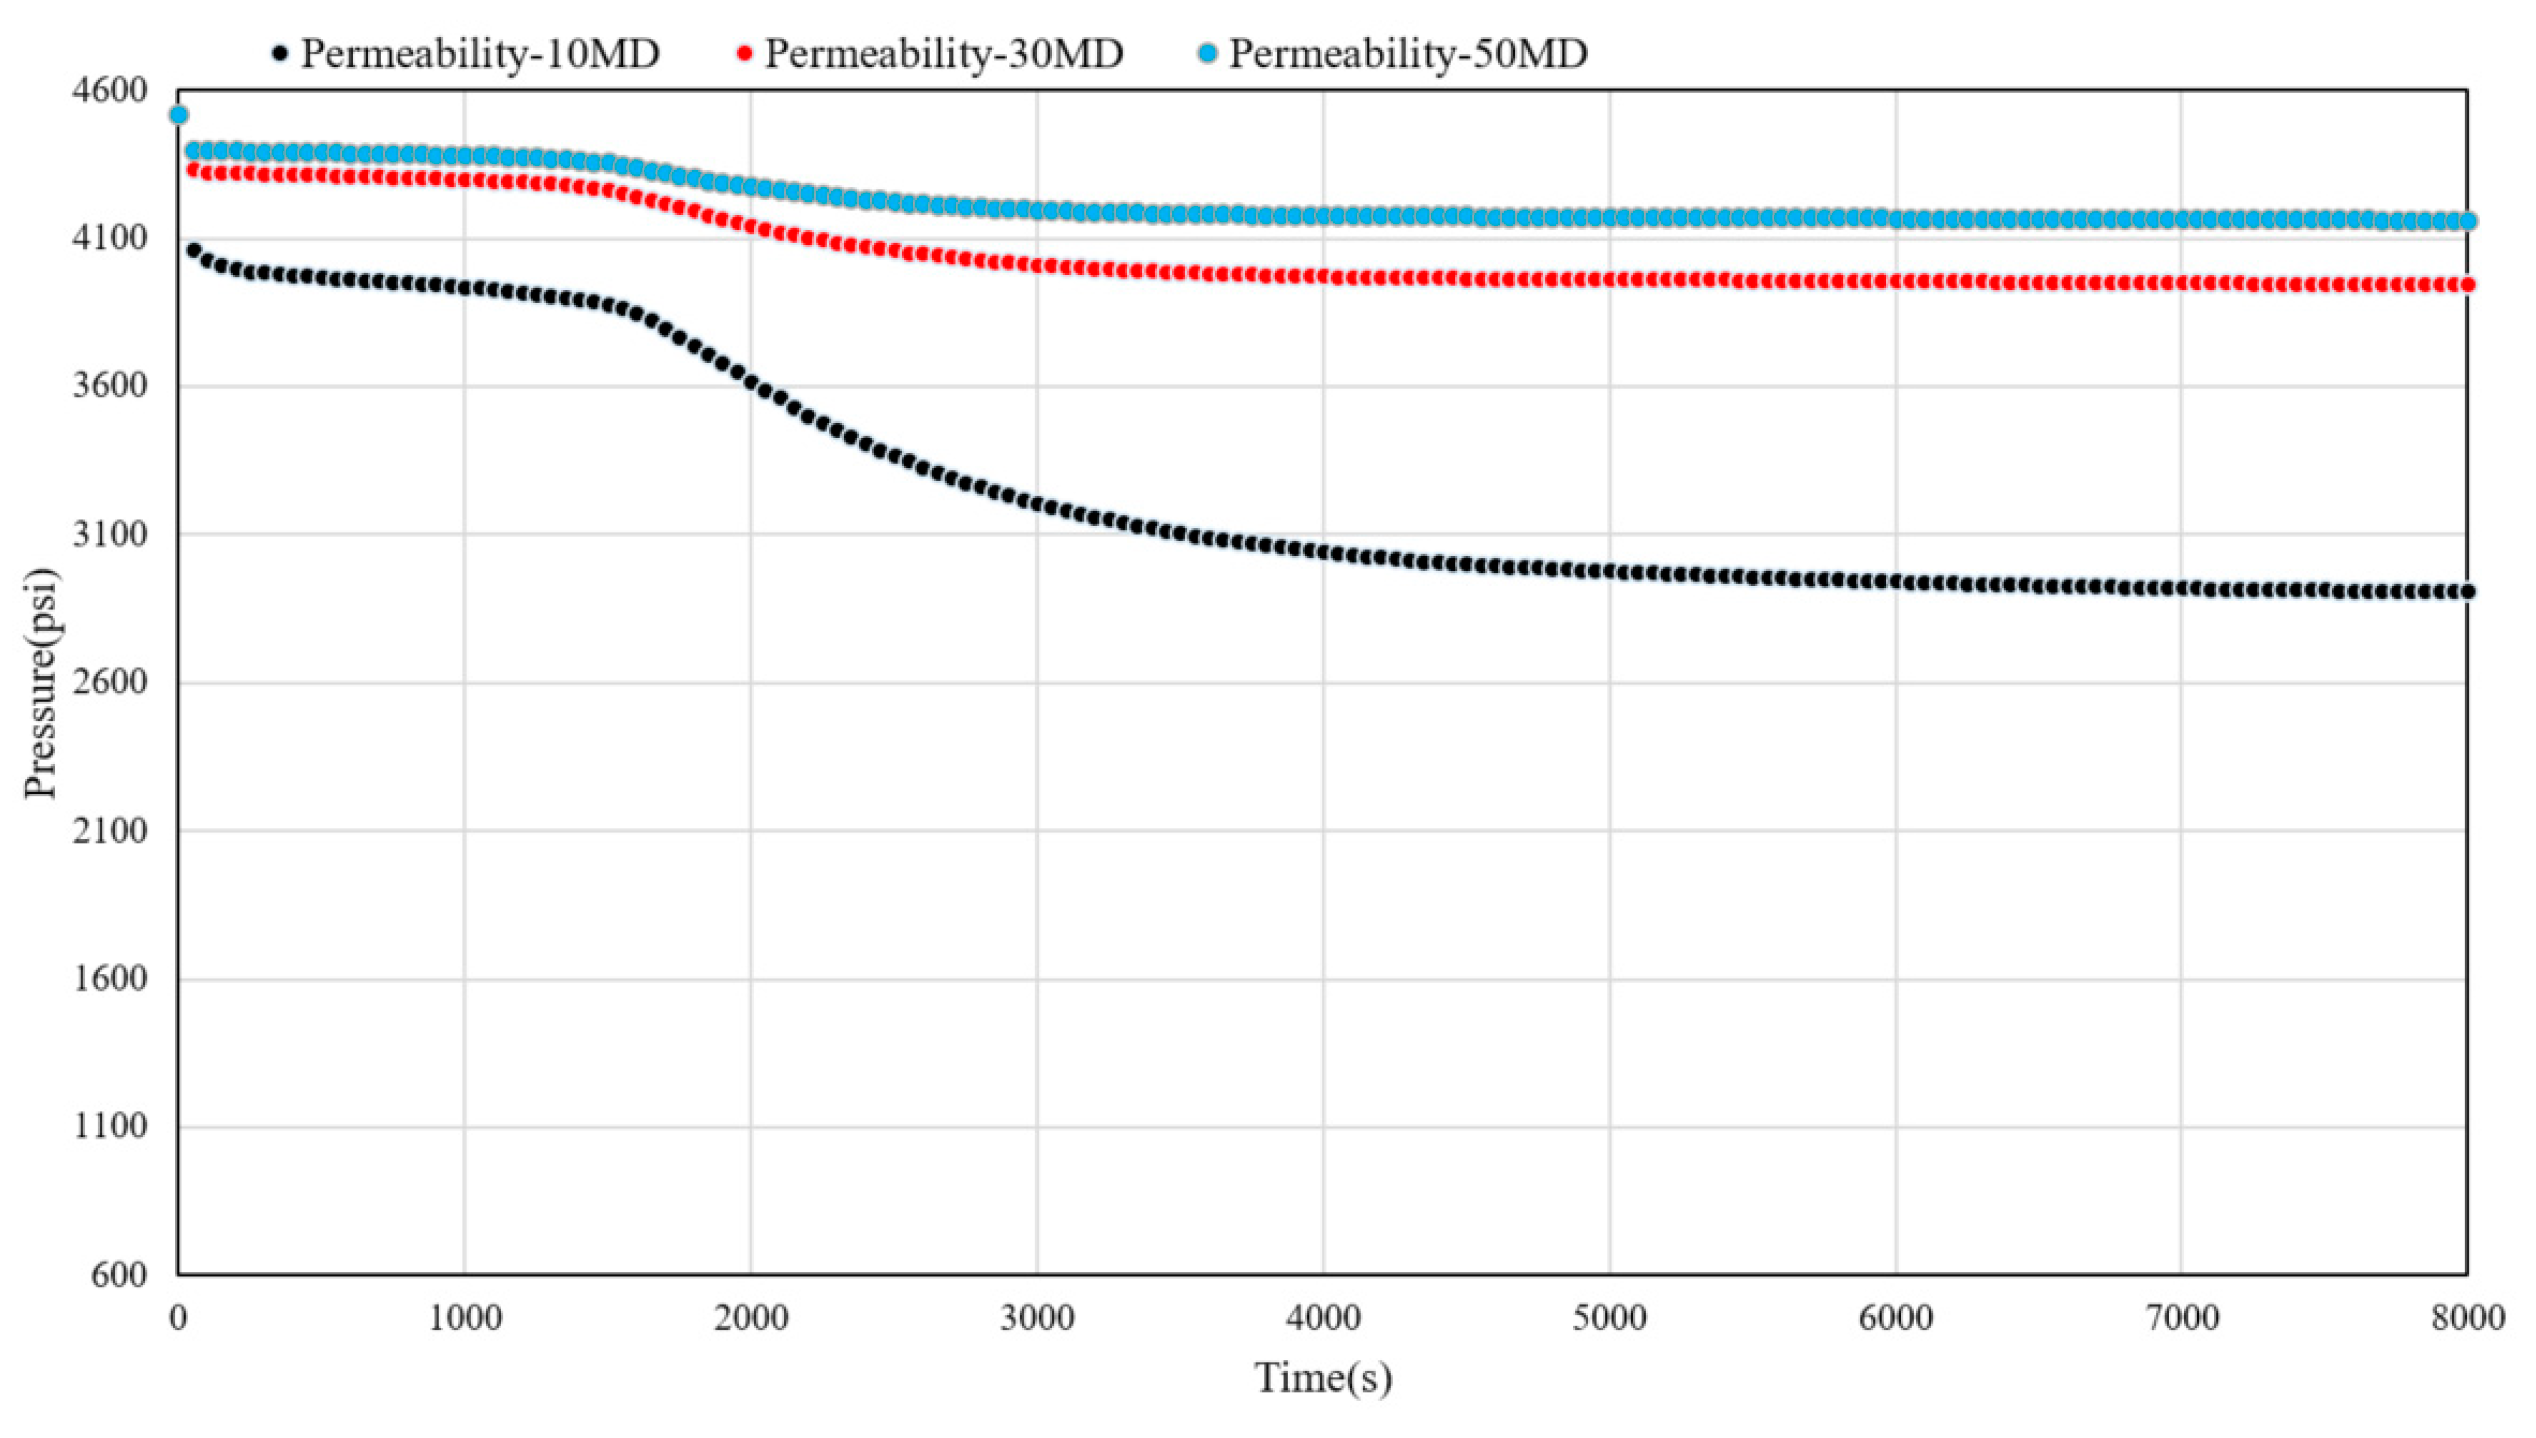
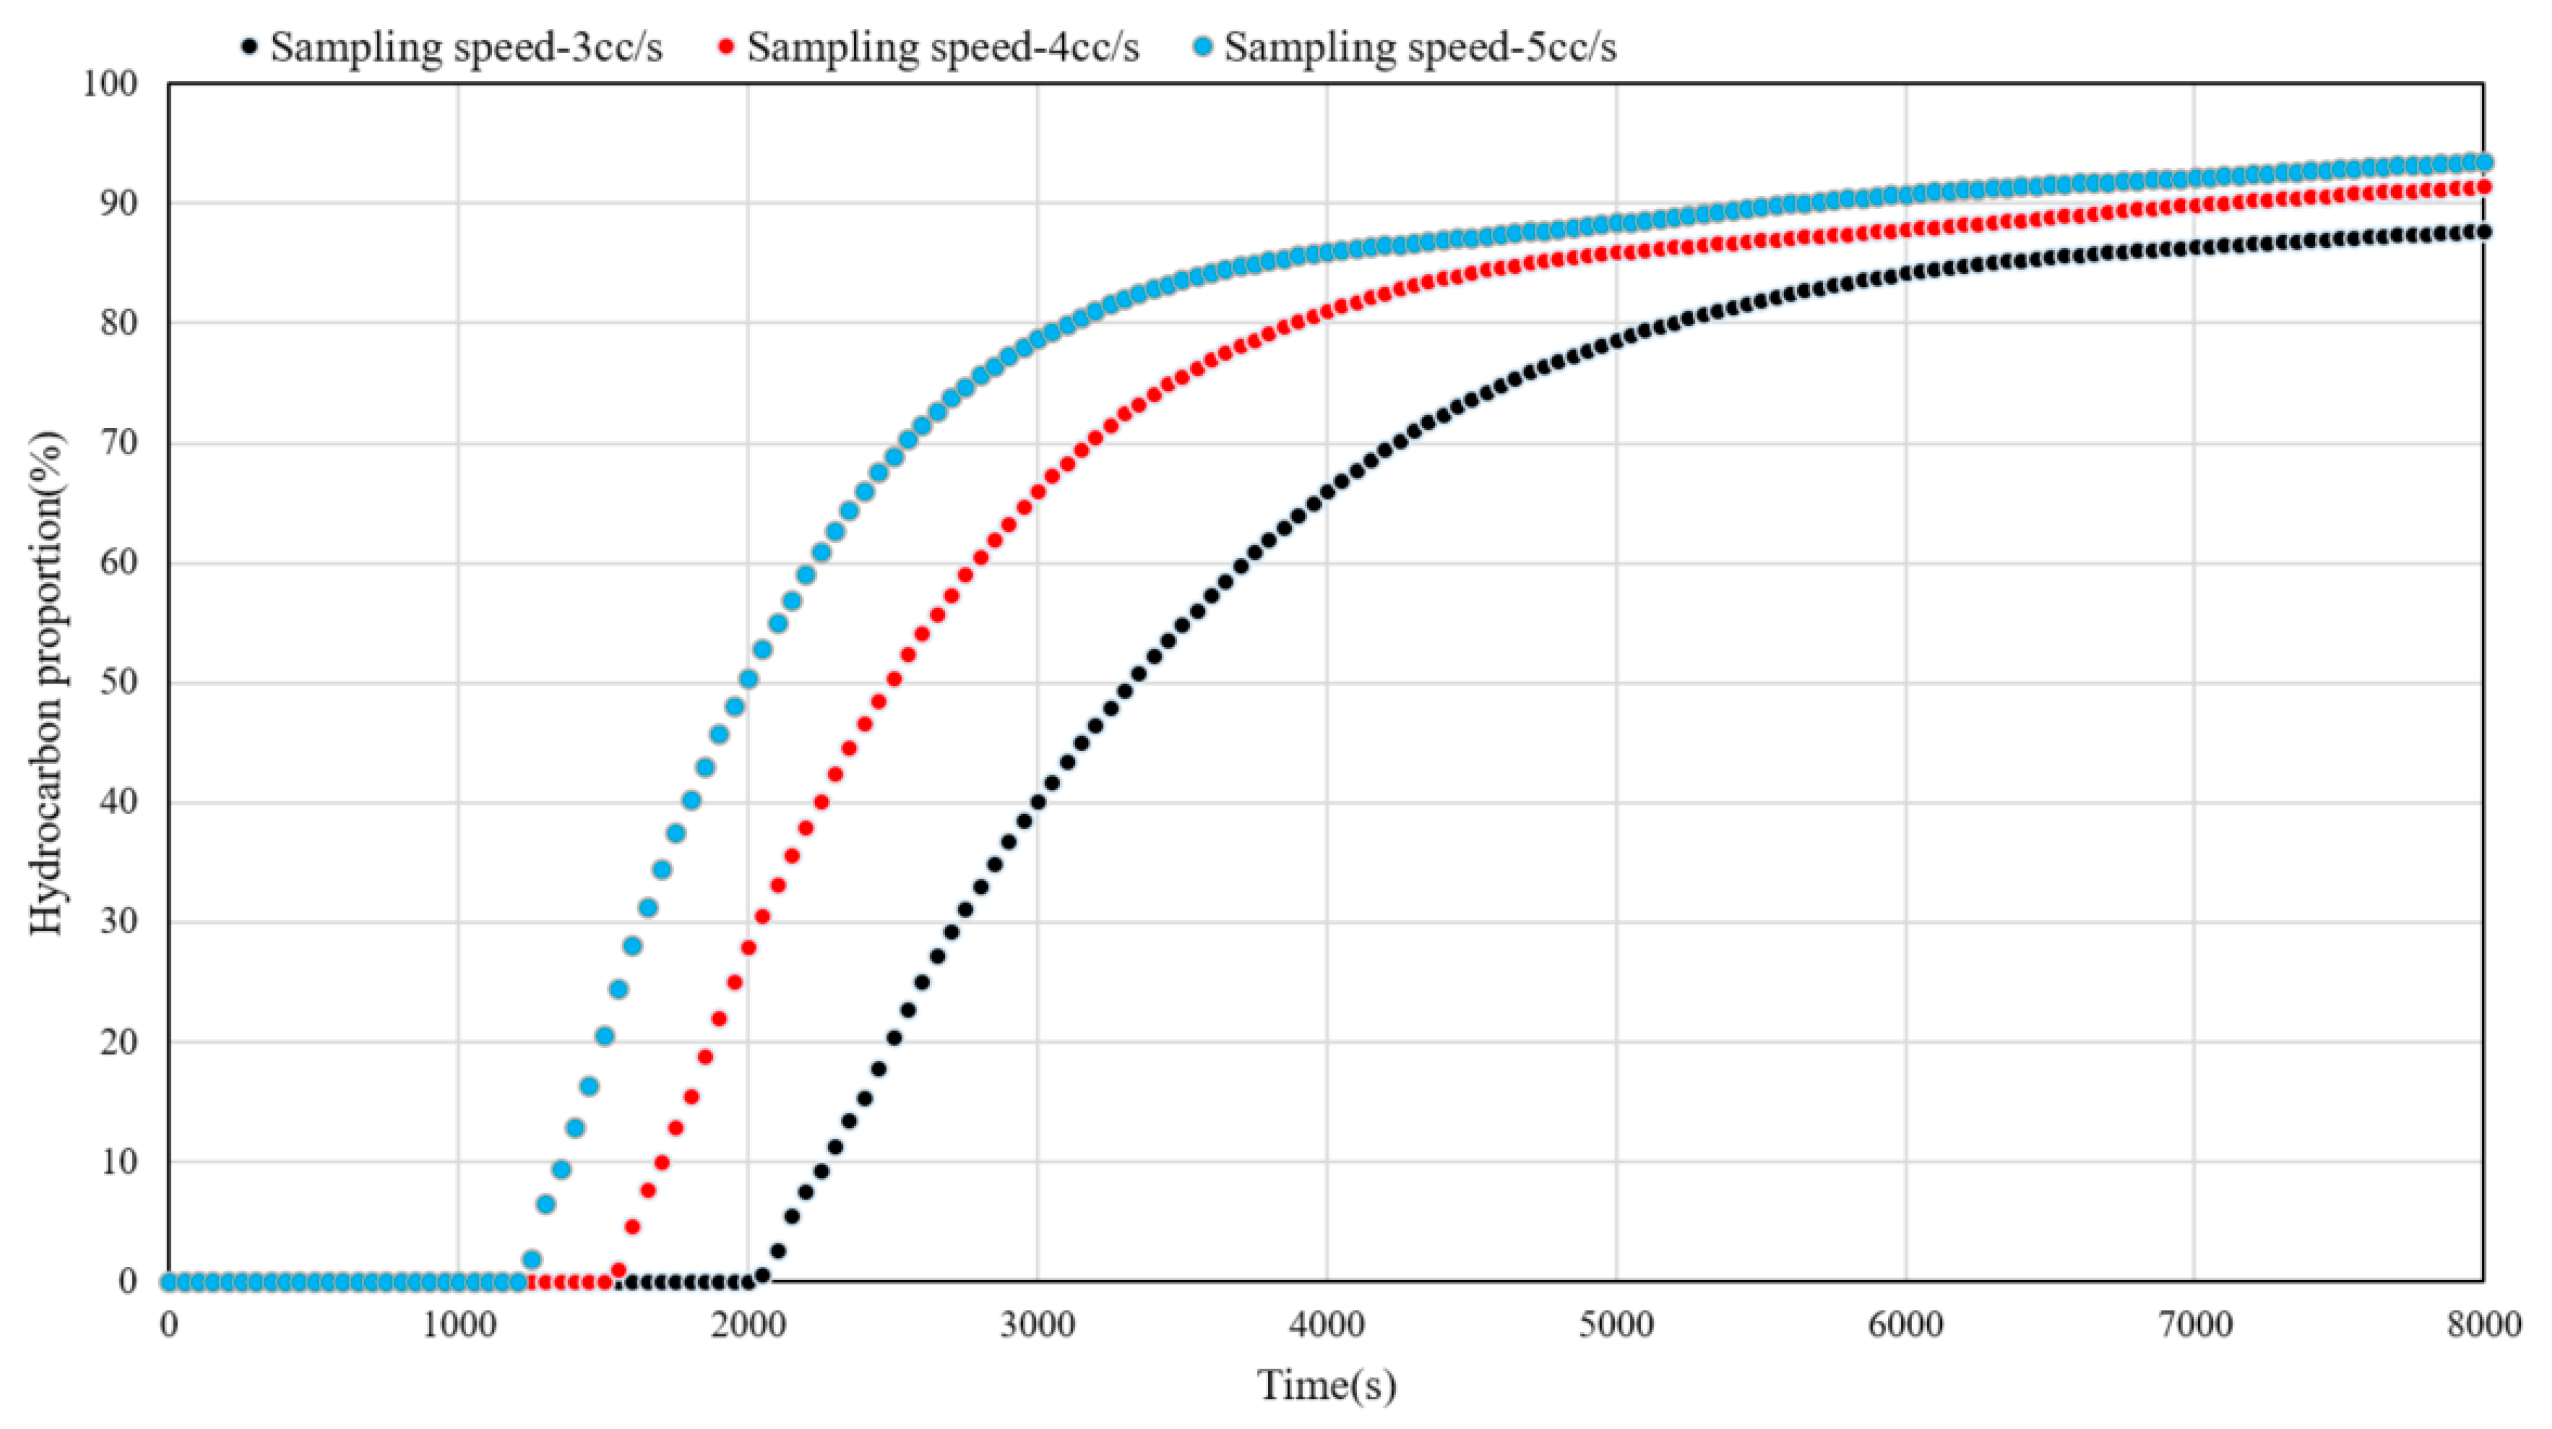
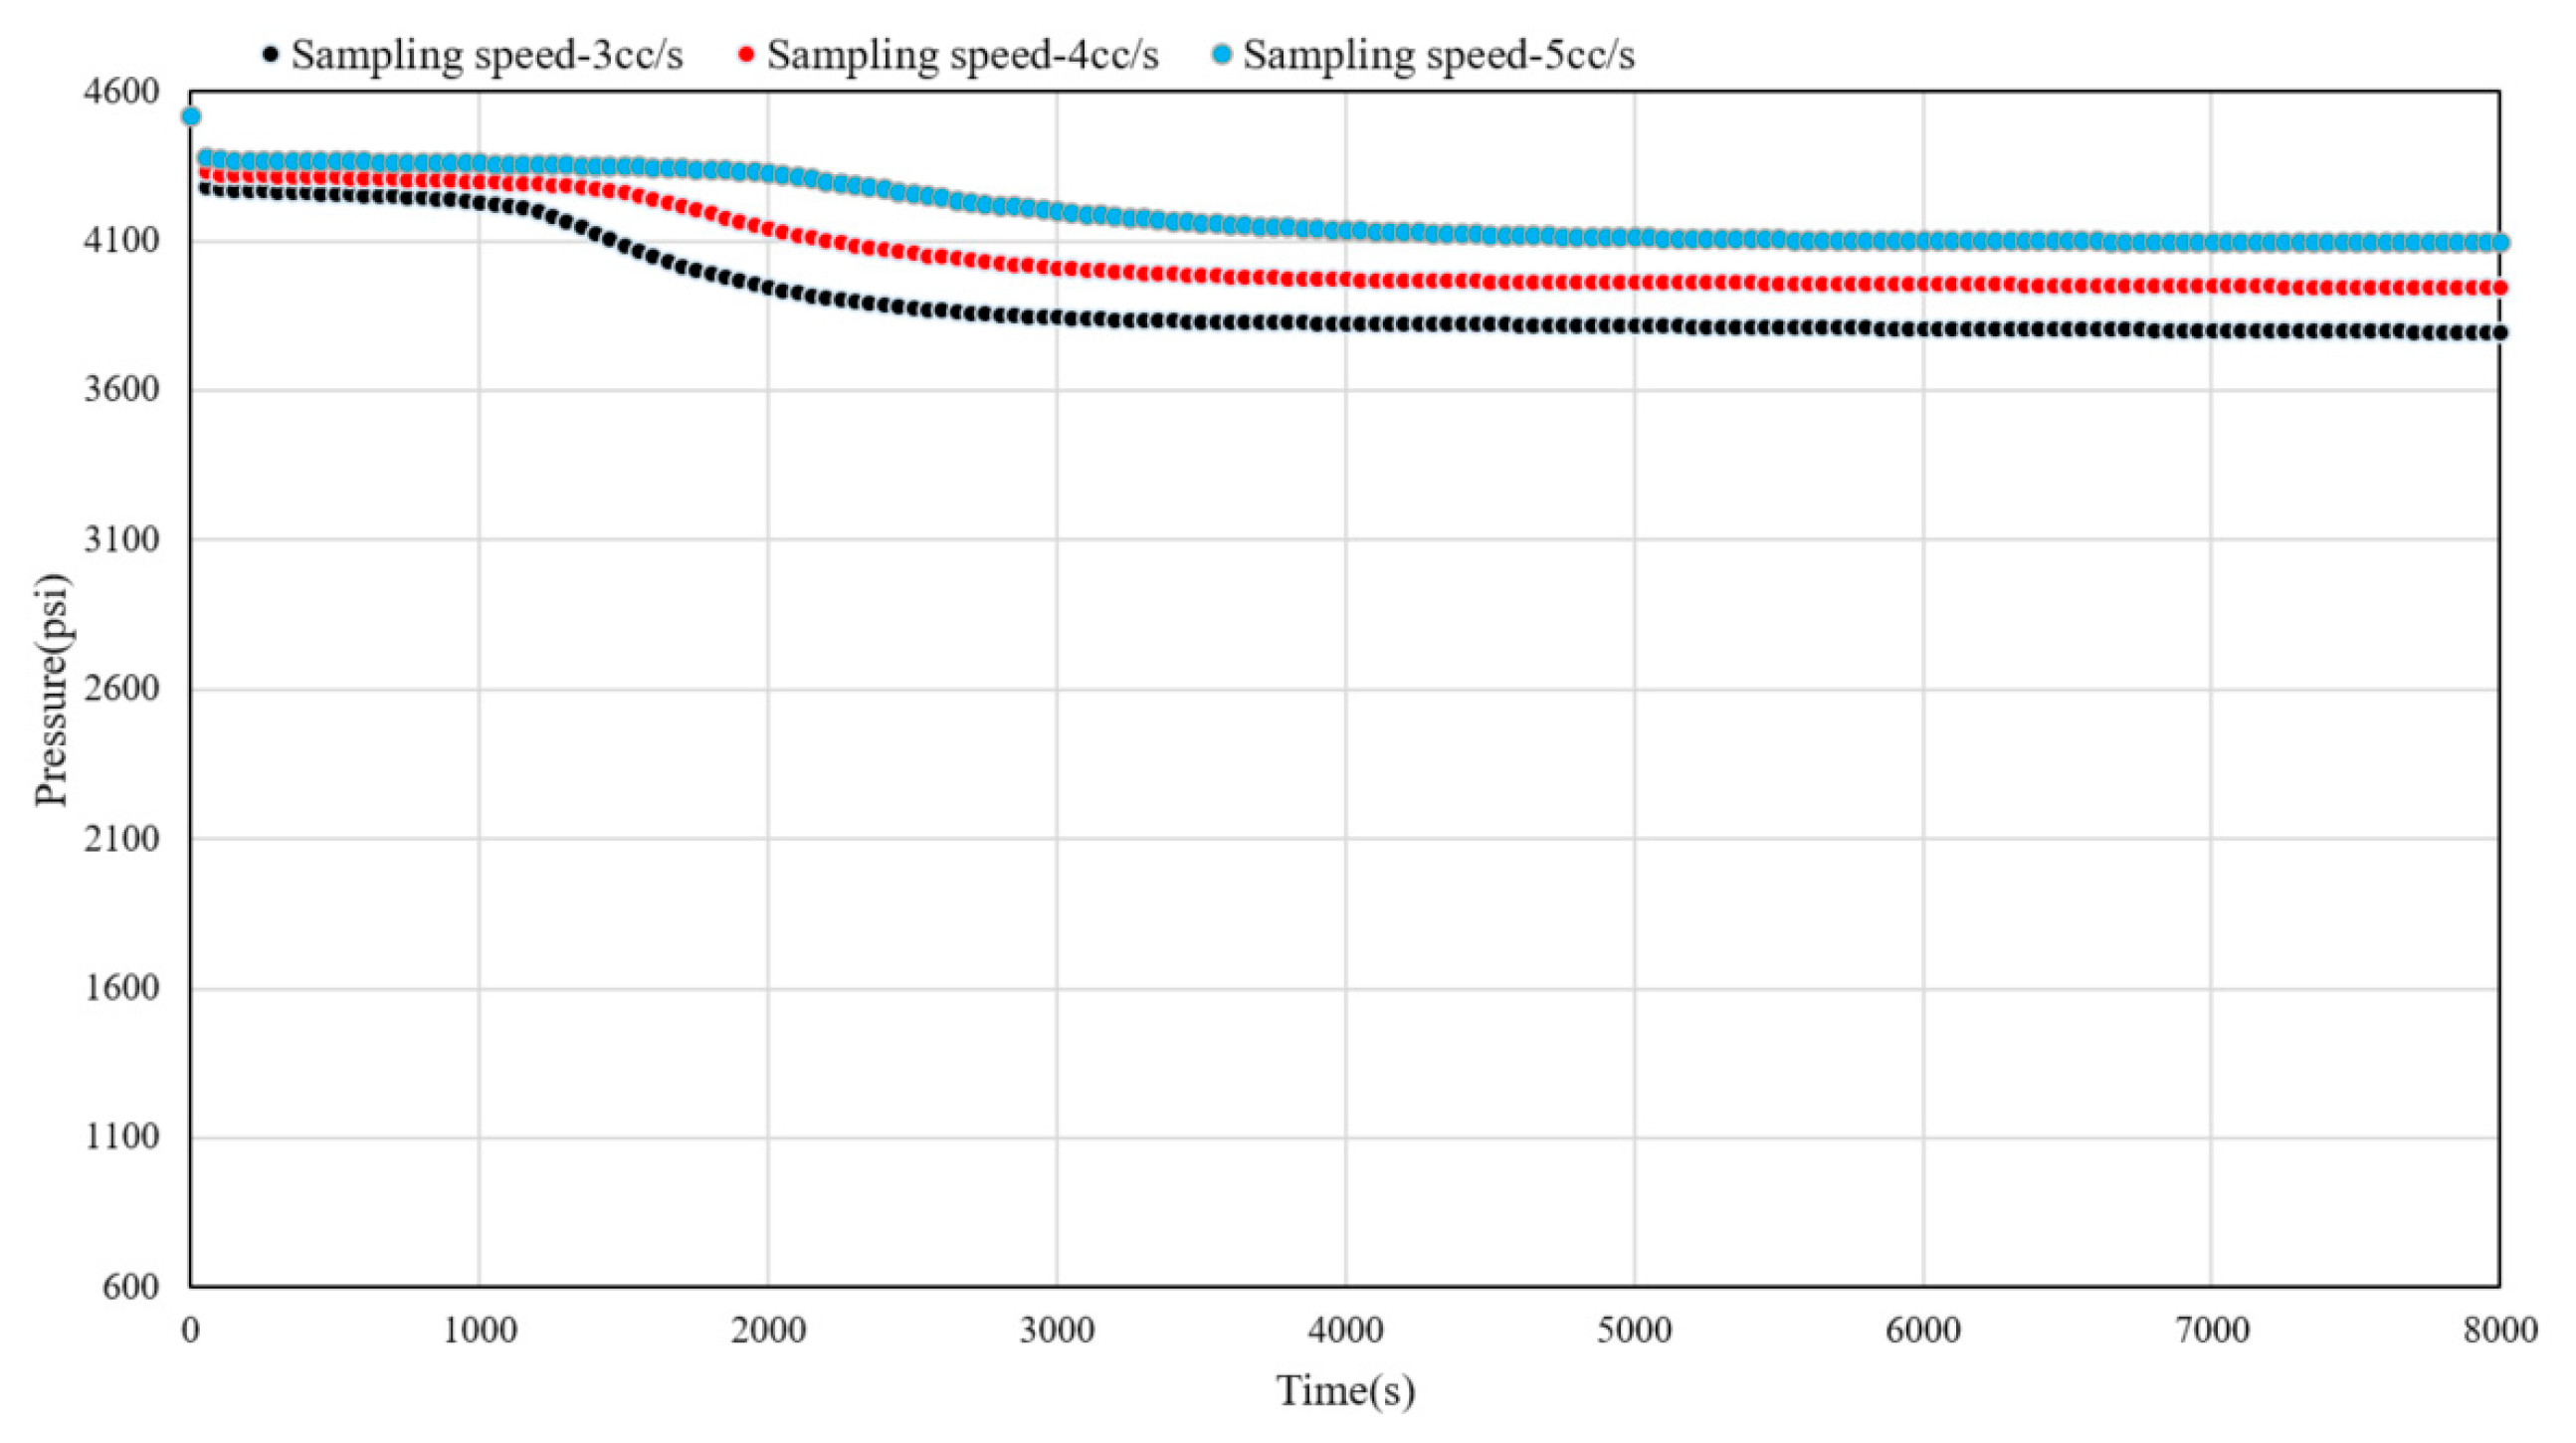
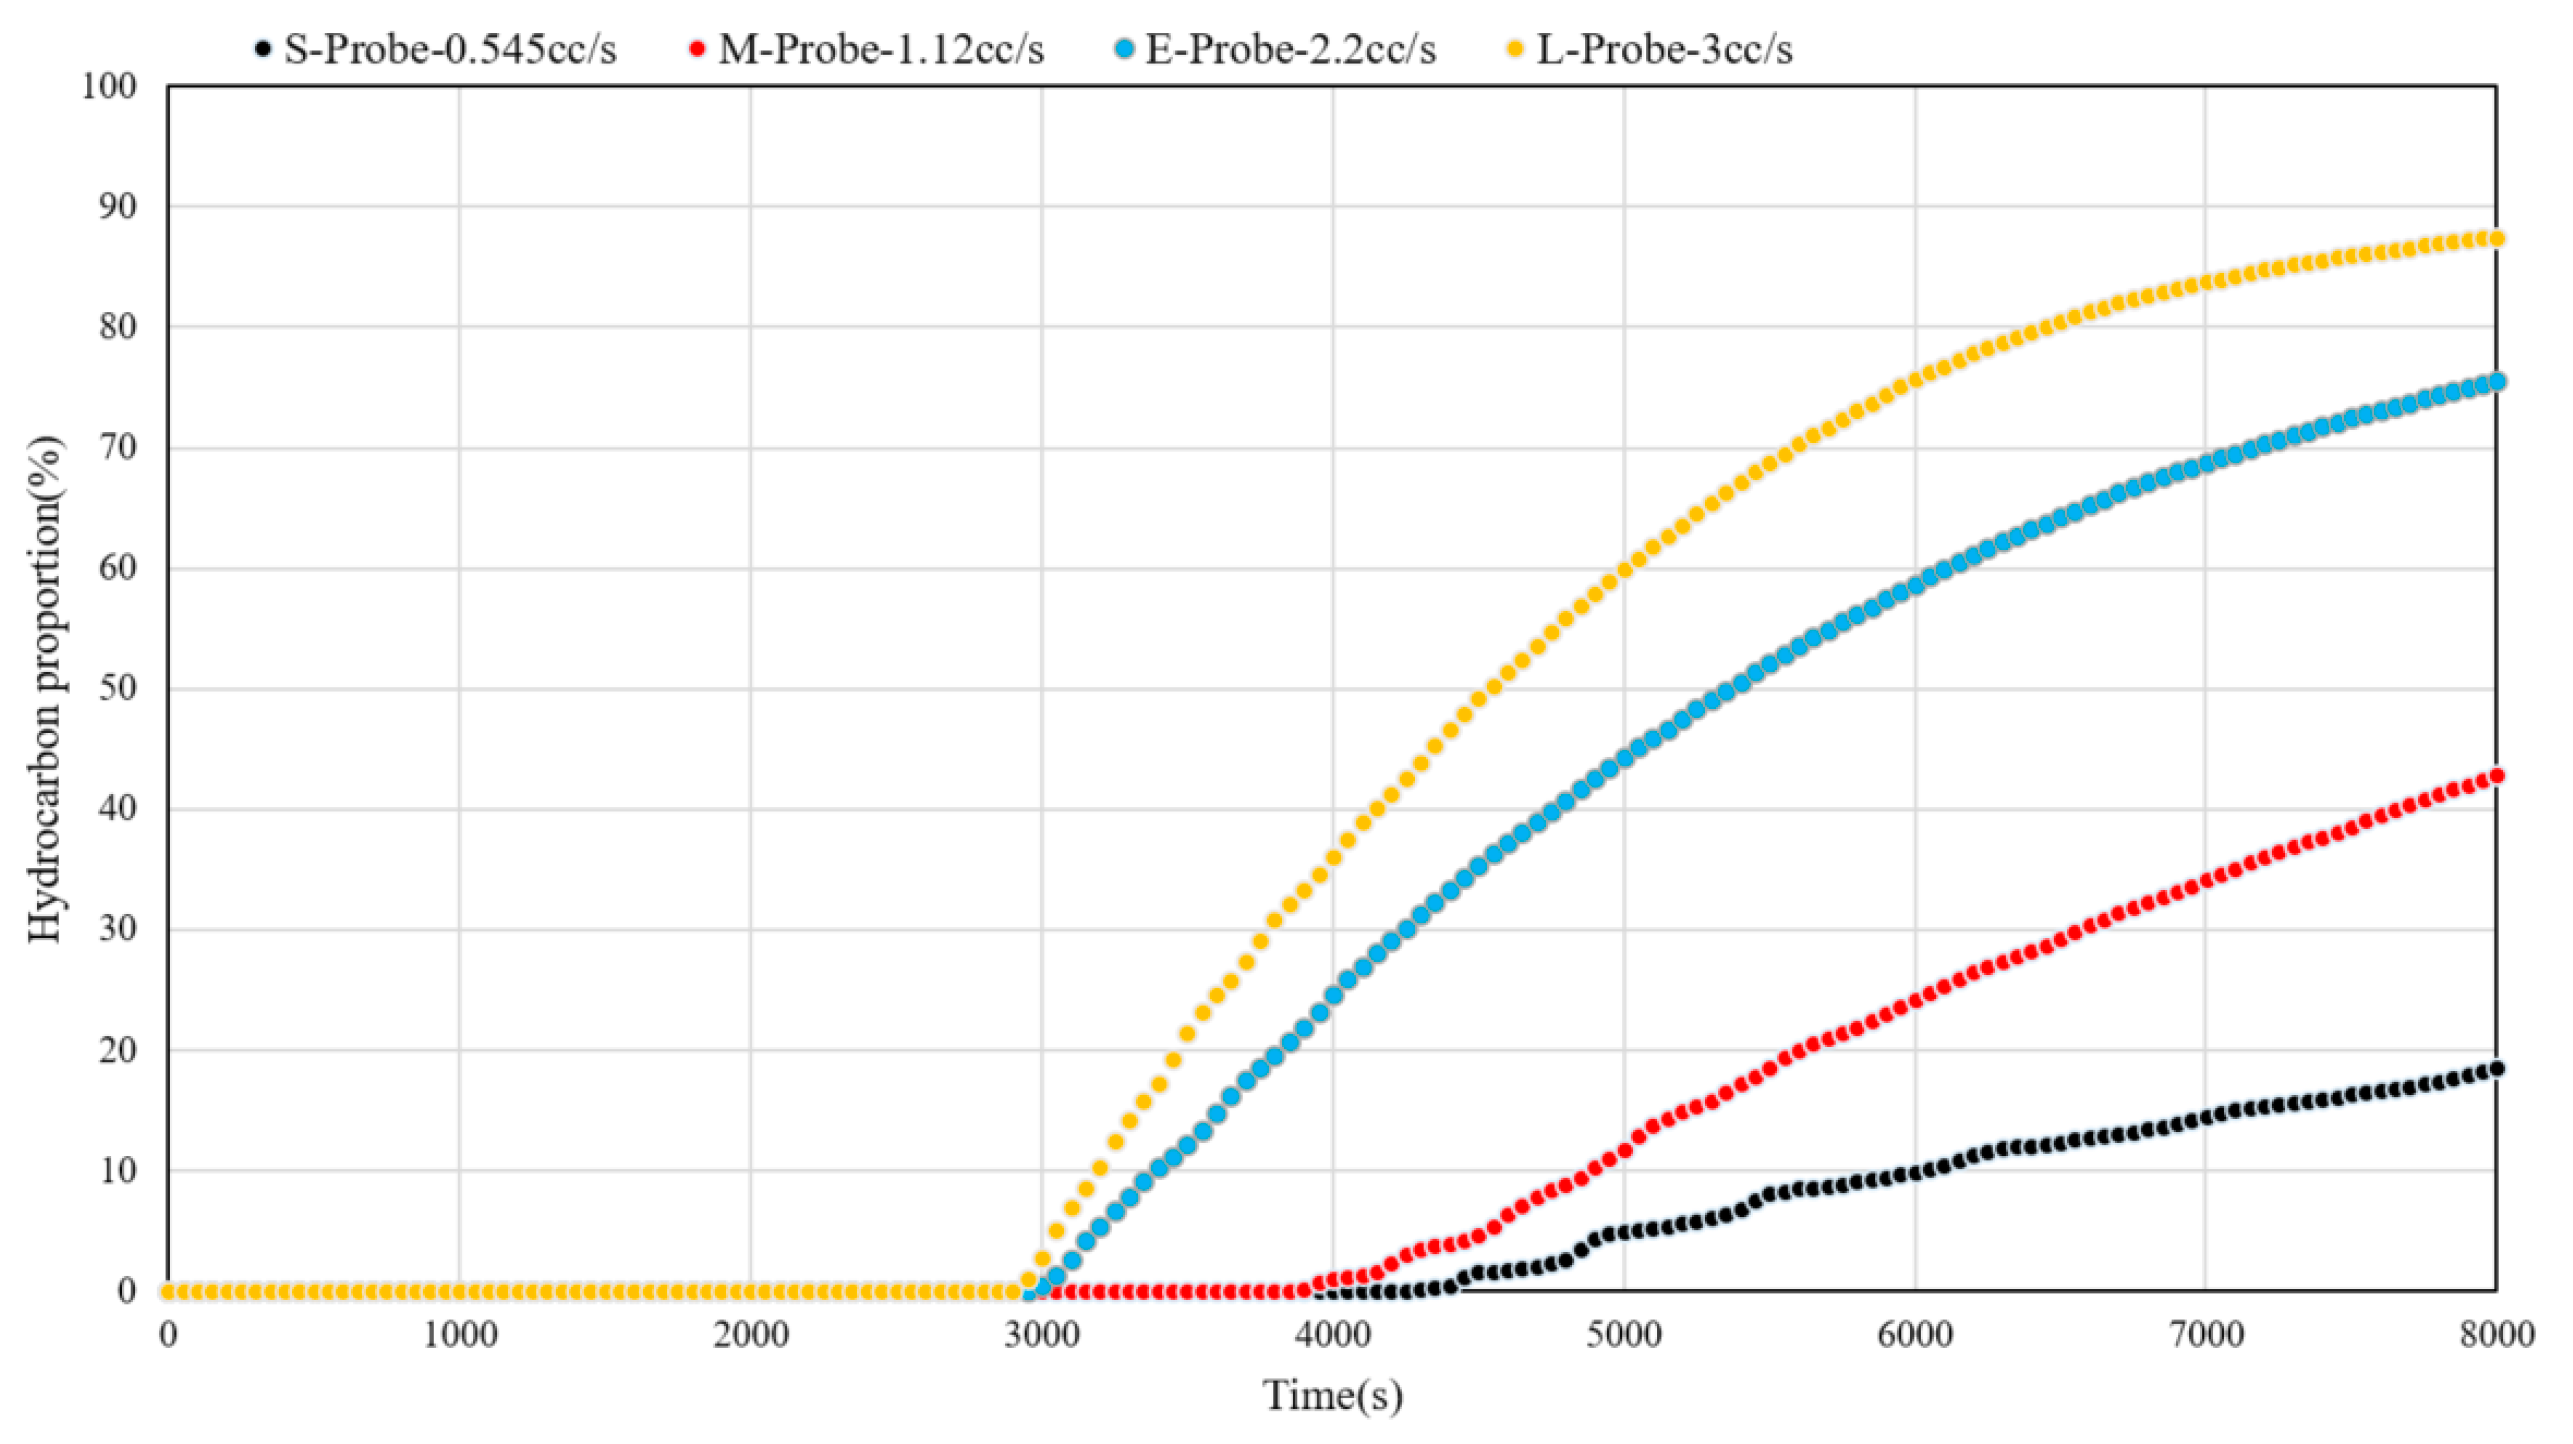
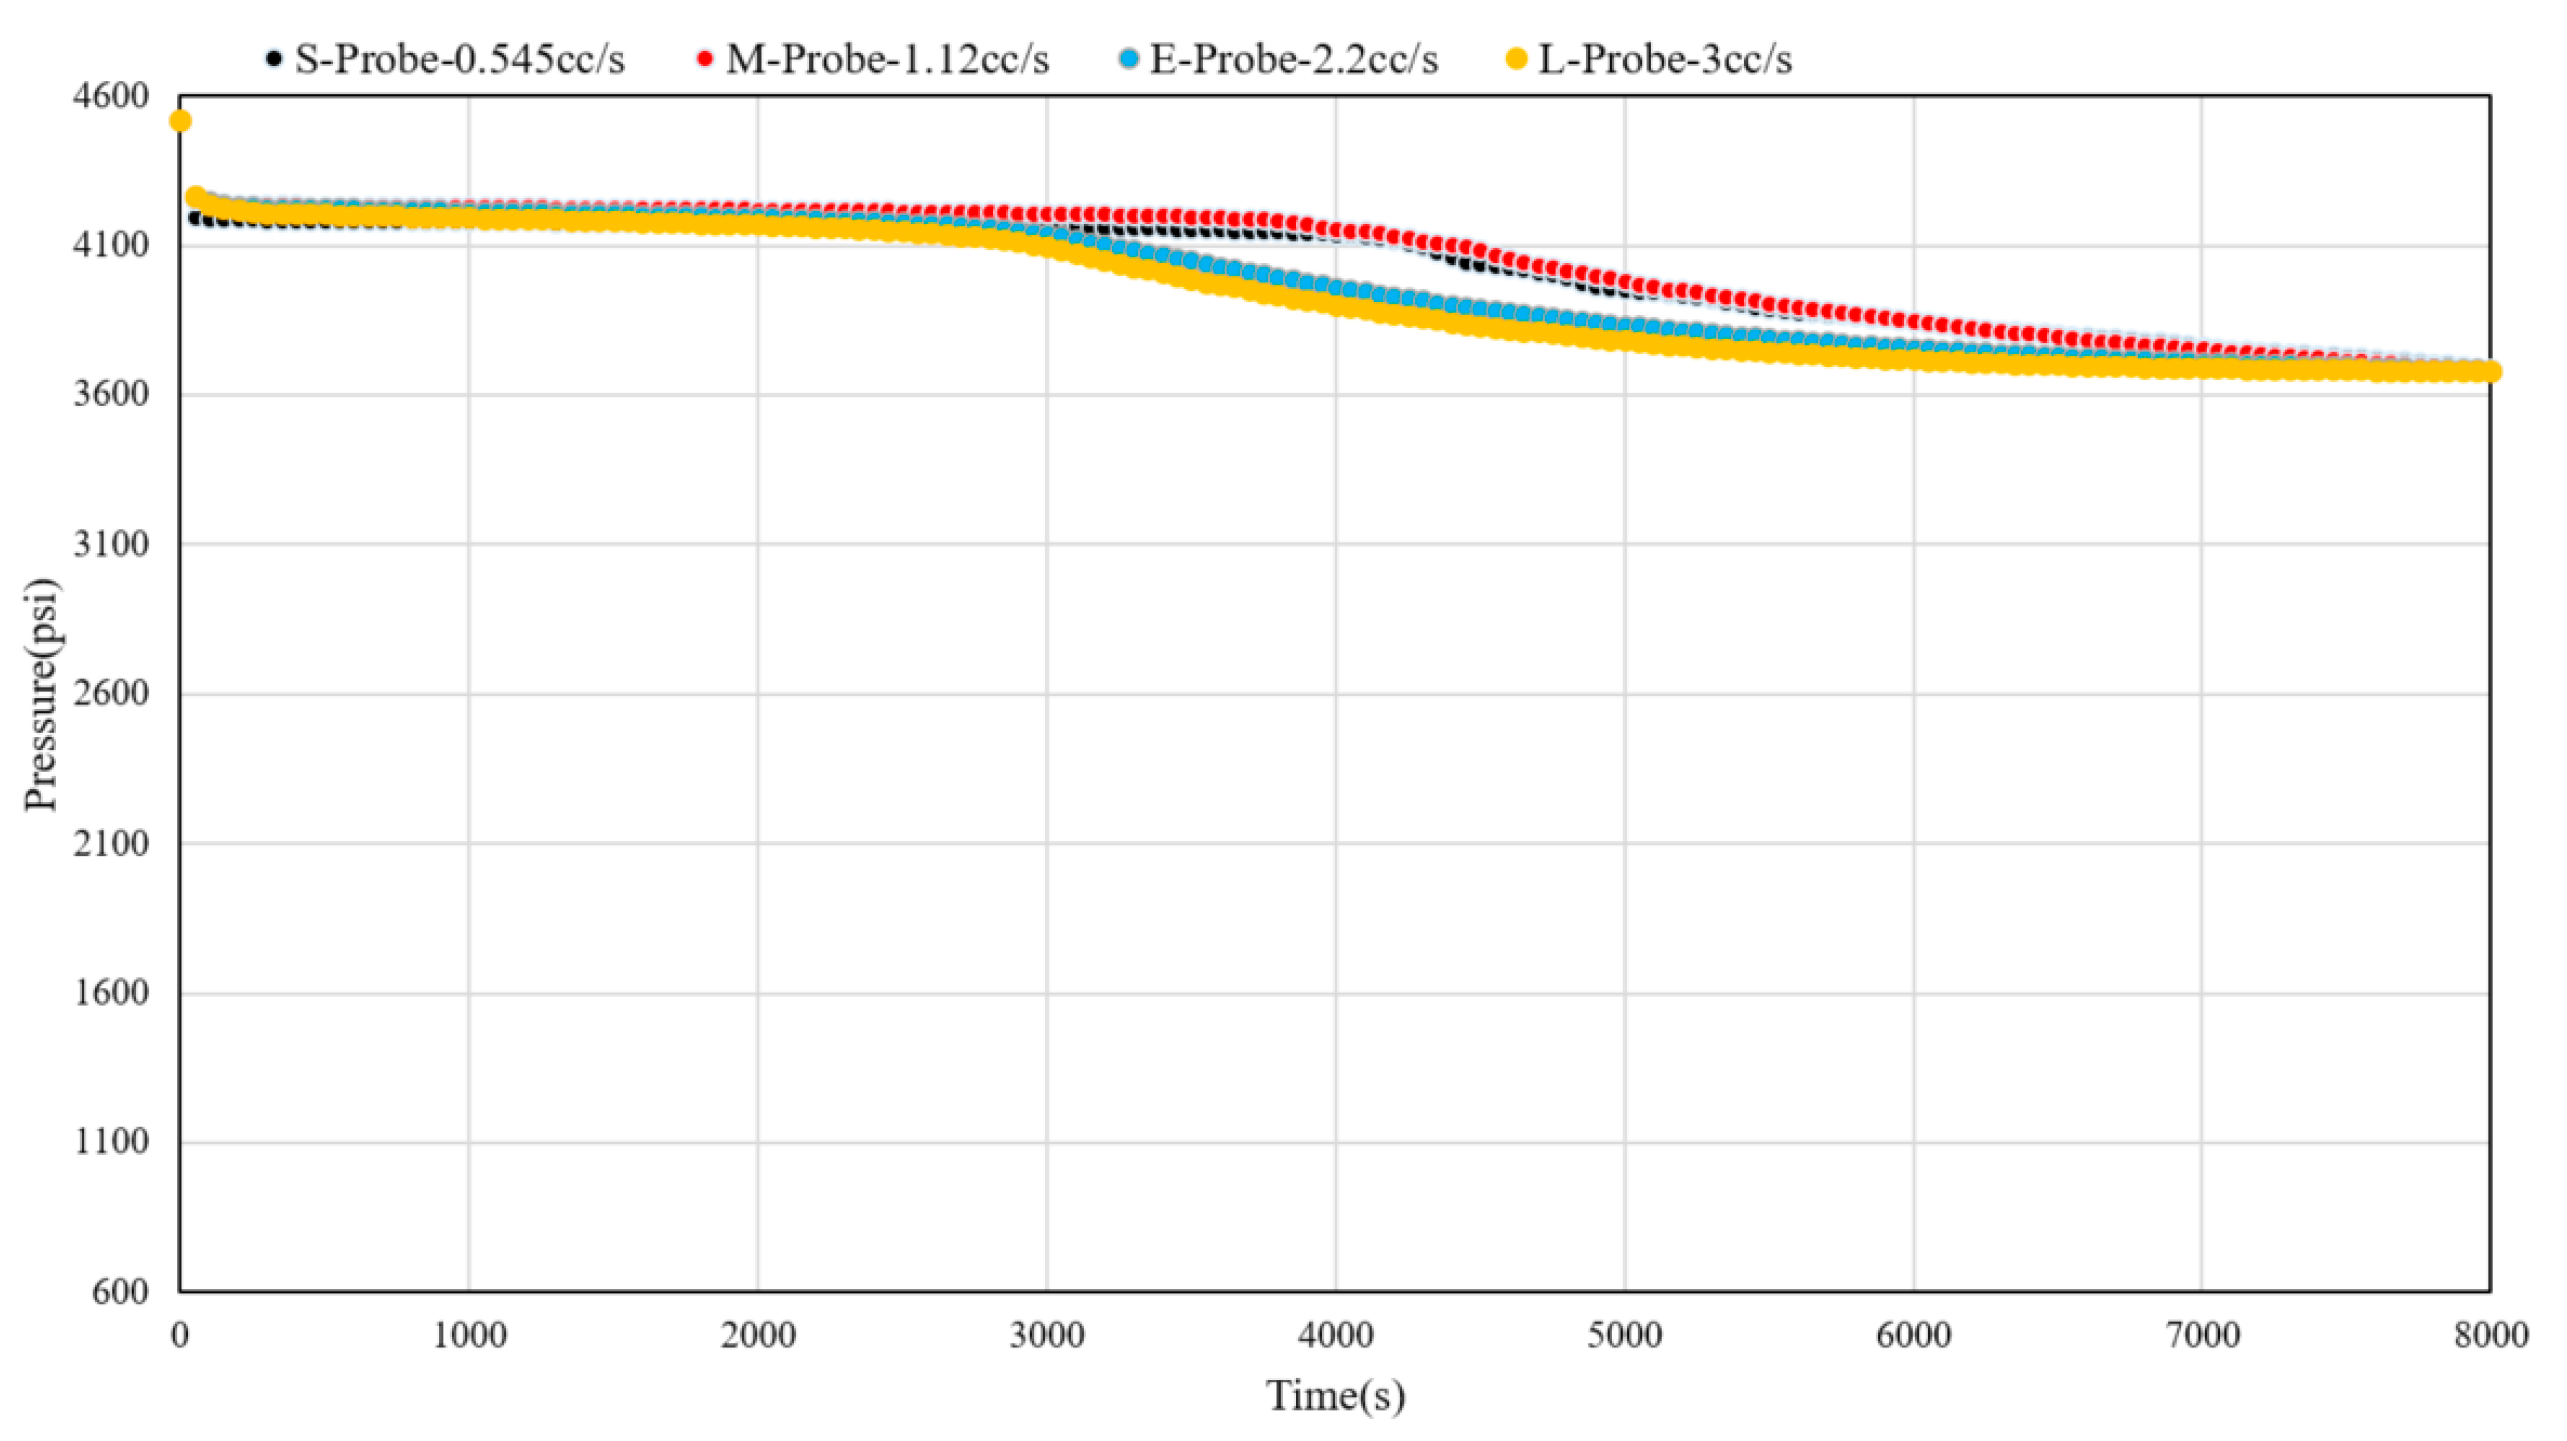
- Combining the numerical simulation model, sensitivity analysis of key information such as reservoir permeability, fluid sampling speed, and probe type was conducted. This further verified the response characteristics of calculation result curves such as hydrocarbon phase ratio and pressure in different operational measures during fluid sampling processes under various permeability, fluid sampling speed, and probe type environments. Hence, reliable bases were provided for the analysis of factors affecting the efficiency of WFT fluid sampling, in conjunction with reservoir properties and fluid characteristics.
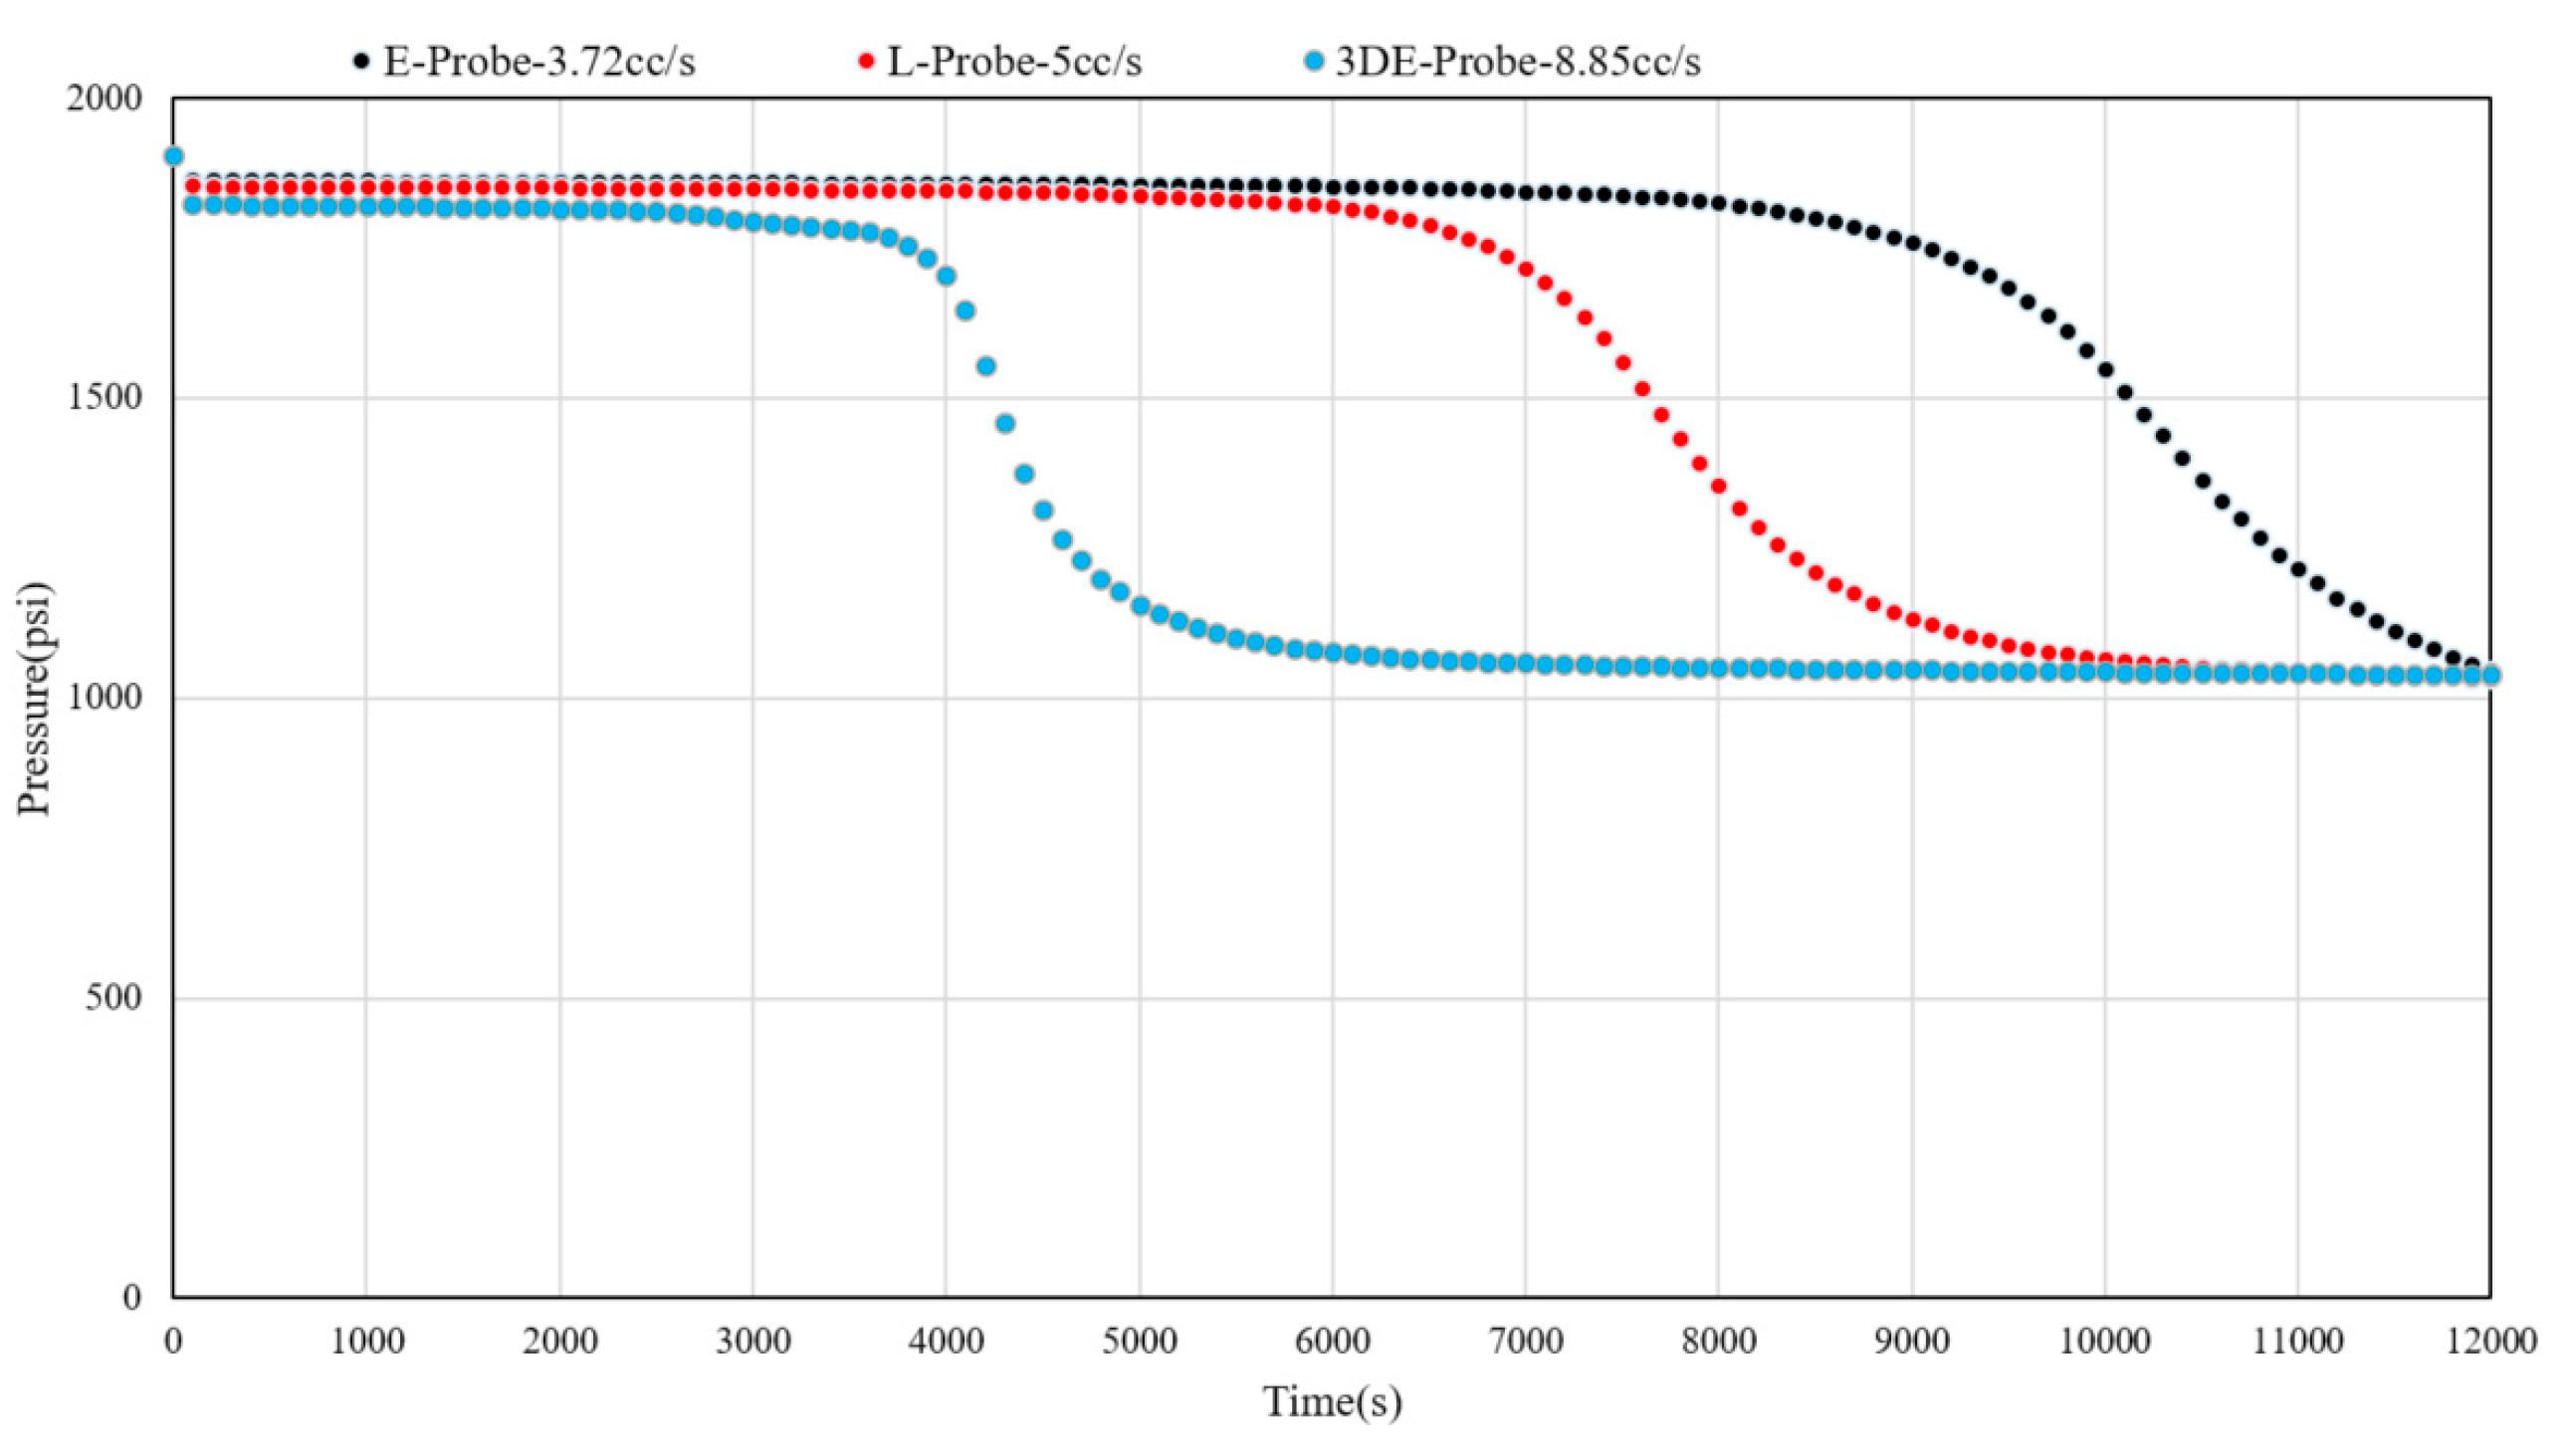
- Addressing the optimization design requirements for fluid sampling operations in shallow heavy oil sand-bearing formations, the challenges faced in environments characterized by high viscosity, high density, and high colloidal content of heavy oil reservoirs were analyzed. These challenges include difficulties such as oil sample failure to flow out of the sampling bucket, excessive pressure drop during operations, and instrument clogging due to sanding. A comparative analysis was conducted between 3D probes and traditional single-suction probes, demonstrating advantages such as increased flow area and enhanced hydrocarbon phase fluid sampling under low-pressure differential operational requirements. This approach can effectively prevent instrument clogging caused by high-pressure gradients.
Author Contributions
Data Availability Statement
Conflicts of Interest
Nomenclature
| Symbols | Meanings | Units |
| Pressure | psi | |
| Water phase saturation | - | |
| Hydrocarbon phase saturation | - | |
| Wellbore radius | m | |
| The effective fluid supply radius of the wellbore | m | |
| Transmissibility of the grid blocks | - | |
| Contact area of the current grid block | m2 | |
| The distance from the center of the grid block | m | |
| The effective thickness ratio | m/m | |
| Permeability | MD | |
| Probe area ratio coefficient | m2/ m2 | |
| Probe inlet area | m2 | |
| Contact area of the grid block | m2 | |
| Relative permeability of the hydrocarbon phase | - | |
| Relative permeability of the water phase | - | |
| Density of the hydrocarbon phase fluid | g/cm3 | |
| Density of the water phase fluid | g/cm3 | |
| Viscosity of the hydrocarbon phase fluid | mPa.s | |
| Viscosity of the water phase fluid | mPa.s | |
| Porosity | - | |
| Grid volume | m3 | |
| The compressibility of the hydrocarbon phase fluid | 1/bar | |
| The compressibility of the water phase fluid | 1/bar | |
| The comprehensive compressibility | 1/bar | |
| The depth difference between grid blocks | m | |
| Iterative time step size | s | |
| Gravitational acceleration | m/s2 | |
| Total sampling fluid rate at the probe | cc/s | |
| Water phase fluid content ratio | - | |
| Hydrocarbon phase fluid content ratio | - | |
| The flow rate of the water phase fluid | cc/s | |
| The flow rate of the hydrocarbon phase fluid | cc/s | |
| Flowing pressure at the probe inlet | psi |
References
- Jogn, A.; Agarwal, A.; Gaur, M. Challenges and opportunities of wireline formation testing in tight reservoirs: a case study from Barmer Basin, India. Journal of Petroleum Exploration and Production Technology 2017, 7, 33–42. [Google Scholar]
- Haibo, L.; Lejun, W.; Meng, W.; Hongwei, Z.; Xiaofei, Q. Calculation of depth of mud filtrate invasion based on formation sampling. Journal of Southwest Petroleum University (Science & Technology Edition) 2023, 45, 97–106. [Google Scholar]
- Mingying, L. ; Yantuo Song.; Yinghui Jiang.; Libo Jiao. Application of wireline formation tester in moderate and low permeability depleted zones. Well Logging Technology 2023, 47, 764–771. [Google Scholar]
- Xiangr, W.; Cancan, Z.; Changxue, W.; Wenli, C. Review on application of the wireline formation tester. Progress in Geophysics 2008, 23, 1579–1585. [Google Scholar]
- Bo, Z.; Xiuwen, M.; Guo, T. The numerical simulation of wireline formation tester with finite element method. Journal of Jilin University:Earth Science Edition 2007, 37, 629–632. [Google Scholar]
- Changxue, W.; Wenli, C.; Xiangr, W. Pressure gradient computation and application of the wireline formation tester. Petroleum Exploration and Development 2008, 35, 476–481. [Google Scholar]
- Faruk, O.; Carlos, T.; Tarek, M. Estimation of in-situ petrophysical properties from wireline formation tester and induction logging measurements: A joint inversion approach. Journal of Petroleum Science and Engineering 2008, 63, 1–17. [Google Scholar]
- Mathieu, N.; Gerard, M.; Herve, J. On the use of Wireline Formation Testing (WFT) data: 2. Consequences of permeability anisotropy and heterogeneity on the WFT responses inferred flow modeling. Journal of Petroleum Science and Engineering 2015, 133, 776–784. [Google Scholar]
- Yuanliang, Z.; Shengquan, G.; Chuang, H.; Kang, B.; Shichen, S.; Zhaoya, F.; Tao, Z. Oil-gas sampling purity prediction based on numerical simulation for modular dynamic formation tester. Well Logging Technology 2020, 44, 534–538+552. [Google Scholar]
- Quan, Z.; Lejun, W.; Xiaofei, Q. Applicable conditions of wireline formation testing instrument. Petroleum Geology and Engineerinng 2022, 36, 115–118. [Google Scholar]
- Jinxiu, X.; Hongzhi, L.; Yunjiang, C. An application analysis of wireline formation test in Bohai region. China Offshore Oil and Gas 2008, 20, 106–110. [Google Scholar]
- MA Junguan. Application of EFDT in sand producing formation sampling. China Petroleum and Chemical Standards and Quality 2019, 39, 53–54. [Google Scholar]
- Chunzhao, Z. Sampling probe optimization technology of the double hanging instrument for Wireline Formation Testing. Offshore Oil 2022, 42, 59–64. [Google Scholar]
- Lejun, W.; Haibo, L.; Meng, W. Research on EFDT working system optimization and applicability. Petrochemical Technology 2019, 26, 342–343. [Google Scholar]
- Jude, T.; David, M.; Andrew, C. Surface and hypersurface meshing techniques for space–time finite element method. Computer-Aided Design 2023, 163, 1–28. [Google Scholar]
- Busto, S.; Dumbser, M.; Río-Martín, L. An Arbitrary-Lagrangian-Eulerian hybrid finite volume/finite element method on moving unstructured meshes for the Navier-Stokes equations. Applied Mathematics and Computation 2023, 437, 1–36. [Google Scholar] [CrossRef]
- Van, J.; Van, H. Space–time discontinuous Galerkin finite element method with dynamic grid motion for inviscid compressible flows. Journal of Computational Physics 2002, 182, 546–585. [Google Scholar]
- Riemslagh, K.; Vierendeels, J.; Dick, E. Arbitrary Lagrangian-Eulerian finite-volume method for the simulation of rotary displacement pump flow. Applied Numerical Mathematics 2000, 32, 419–433. [Google Scholar] [CrossRef]
- Vorst, H. Bi-CGSTAB: A Fast and Smoothly Converging Variant of Bi-CG for the Solution of Nonsymmetric Linear Systems. SIAM Journal on Scientific and Statistical Computing 1992, 13, 631–644. [Google Scholar] [CrossRef]


| Type | Name | Inlet Area(in2) | Standard Ratio |
|---|---|---|---|
| S | Small Type Inlet Probe | 0.21 | 0.27 |
| M | Middle Type Inlet Probe | 0.79 | 1 |
| E | Ellipse Type Inlet Probe | 2.32 | 2.94 |
| L | Large Type Inlet Probe | 6.23 | 7.89 |
| 3D-E | 3D-Ellipse Type Inlet Probe | 2.32*3 | 2.94*3 |
| Porosity (%) |
Permeability (MD) |
Hole diameter (m) |
Initial pressure (psi) |
Invasion depth (m) |
Ratio of effective thickness (m/m) |
|---|---|---|---|---|---|
| 15.7 | 25 | 0.1556 | 4520.95 | 0.85 | 0.912 |
| Drilling fluid viscosity (mPa.s) |
Formation fluid viscosity (mPa.s) |
Drilling fluid density (g/cm3) |
Formation fluid density (g/cm3) |
|---|---|---|---|
| 0.55 | 2.50 | 1.01 | 0.903 |
| Water saturation (%) |
Hydrocarbon relative permeability (-) |
Water relative permeability (-) |
|---|---|---|
| 0 | 1 | 0 |
| 32 | 0.88 | 0 |
| 35 | 0.82 | 0.01 |
| 45 | 0.50 | 0.12 |
| 52 | 0.30 | 0.25 |
| 60 | 0.10 | 0.48 |
| 65 | 0.02 | 0.61 |
| 70 | 0.01 | 0.71 |
| 80 | 0 | 0.88 |
| Sampling speed (cc/s) |
Operating time Hydrocarbon >0.4% (s) |
Operating time Hydrocarbon >80% (s) |
|
|---|---|---|---|
| E-Probe | 3.72 | 7800 | 11900 |
| L-Probe | 5.00 | 6000 | 8800 |
| 3D-E-Probe | 8.85 | 3700 | 4900 |
Disclaimer/Publisher’s Note: The statements, opinions and data contained in all publications are solely those of the individual author(s) and contributor(s) and not of MDPI and/or the editor(s). MDPI and/or the editor(s) disclaim responsibility for any injury to people or property resulting from any ideas, methods, instructions or products referred to in the content. |
© 2024 by the authors. Licensee MDPI, Basel, Switzerland. This article is an open access article distributed under the terms and conditions of the Creative Commons Attribution (CC BY) license (http://creativecommons.org/licenses/by/4.0/).


