1. Introduction
Reconnections are ubiquitous processes in magnetized plasmas: laboratory, stellar, and planetary ones [
1]. They involve sudden changes in the topology of the magnetic field, that rearranges into a state of lower energy. Part of the initial free energy is traveled away from the reconnection region by waves, or converted into kinetic energy of ions and electrons. Reconnection is a complex process, which defies a unique description, since is heavily dependent upon the geometry of the magnetic field and the physical conditions existing; it is therefore a topic still actively studied [
2]. During reconnection, a lot of electromagnetic activity is produced, in the form of quasi-steady fields, broadband turbulence, or coherent waves, which can interact with the ions and/or the electrons, delivering energy to the kinetic component of the plasma. A topic of current investigation concerns the mechanisms that allow energy to flow towards particles.
The Magnetic Reconnection eXperiment (MRX) is a device to study the fundamental physics issues of magnetic reconnection in a well-controlled laboratory environment [
3]. We consider in this work the studies summarized in two recent papers by the MRX team [
4,
5], reporting a detailed campaign of measurements of plasma dynamics during reconnections in the presence of a guide magnetic field perpendicular to the reconnecting one. Measures were done using a full 2D probe array for magnetic field reconstruction parallel to the
reconnection plane. Furthermore, an electrostatic probe, inserted near the reconnection region, allowed fast measurements of electron density, temperature, and electric field. During reconnection, a quasi-steady electric field arises, parallel to the guide field, of amplitude
of order 100 V/m. Superimposed, electric field oscillations in
do appear. These oscillations appear as high-amplitude
, almost monochromatic (frequency
MHz, in the Lower-Hybrid wave frequency range) waves traveling along the electron outflow with a wavelength of the order of the thermal electron Larmor radius (
). Electron density fluctuations appear correlated with the electric field ones. Importantly for this work, an increasing trend of the average electron temperature (of the order of 10 eV) near the X line with
is observed. We refer to figure 4 of paper [
4]–and in particular to the red dots, corresponding to the high-guide-field case–where almost a doubling of
is observed in going from the smallest (
V/m) to the largest (
V/m) values of
.
The second part of the study [
5] is devoted to a characterization of the energy budget, to identify the different ways through which magnetic energy is converted into particle energy. As far as the electron component is concerned, the study concludes that a relevant fraction of the energy is delivered to the electrons through parallel acceleration by the electric field
near the X-point or the reconnecting field, along the
y direction.
Given the high level of electric fluctuations with respect to the steady component, and the correlation between them and the electron temperature, found in [
4], it appears reasonable to investigate how and to which extent the oscillatory part may contribute to the electron energization. This is the purpose of this work. We propose that a fraction of electron heating may occur via interaction with low-frequency high-amplitude electromagnetic waves. This mechanism has frequently been invoked in astrophysical literature, often as a candidate for ion heating by Alfvèn waves, but its range of application is more widespread [
7,
8,
9,
10,
11,
12,
13,
14,
15,
16,
17,
18,
19,
20]. In the present case, we do not refer specifically to a coherent mode: with the term “wave” we mean a traveling electromagnetic plane wave, Fourier component out of a whole spectrum. Since the frequency range of the experimental spectrum is fairly narrow, retaining just one frequency component within the model appears a reasonable simplification. We sketch a rough Hamiltonian model of wave-particle interaction in the presence of a strong guide magnetic field, in a simplified geometry, representative of MRX conditions. We will show that, when feeding the model with MRX plasma parameters, we will be able to recover quantitatively the measured amount of heating, in terms of temperature gain per electron. We justify our test-particle approach based on the fact that MRX plasmas are relatively low-
.
Finally, as a spin-off, we will discuss wave-particle correlations along the parallel direction, reminiscent of the collisionless Landau damping mechanism, which arise spontaneously within our framework.
2. Methods
Throughout this study, we will restrict ourselves close to the X line, where the reconnecting component of the magnetic field is small and will be neglected in comparison to the perpendicular guide field .
Within the Hamiltonian formulation, any electric and magnetic field is described in terms of potentials. The guide magnetic field is
To this field, we add a monochromatic electromagnetic wave:
The wave has both magnetic and electric components:
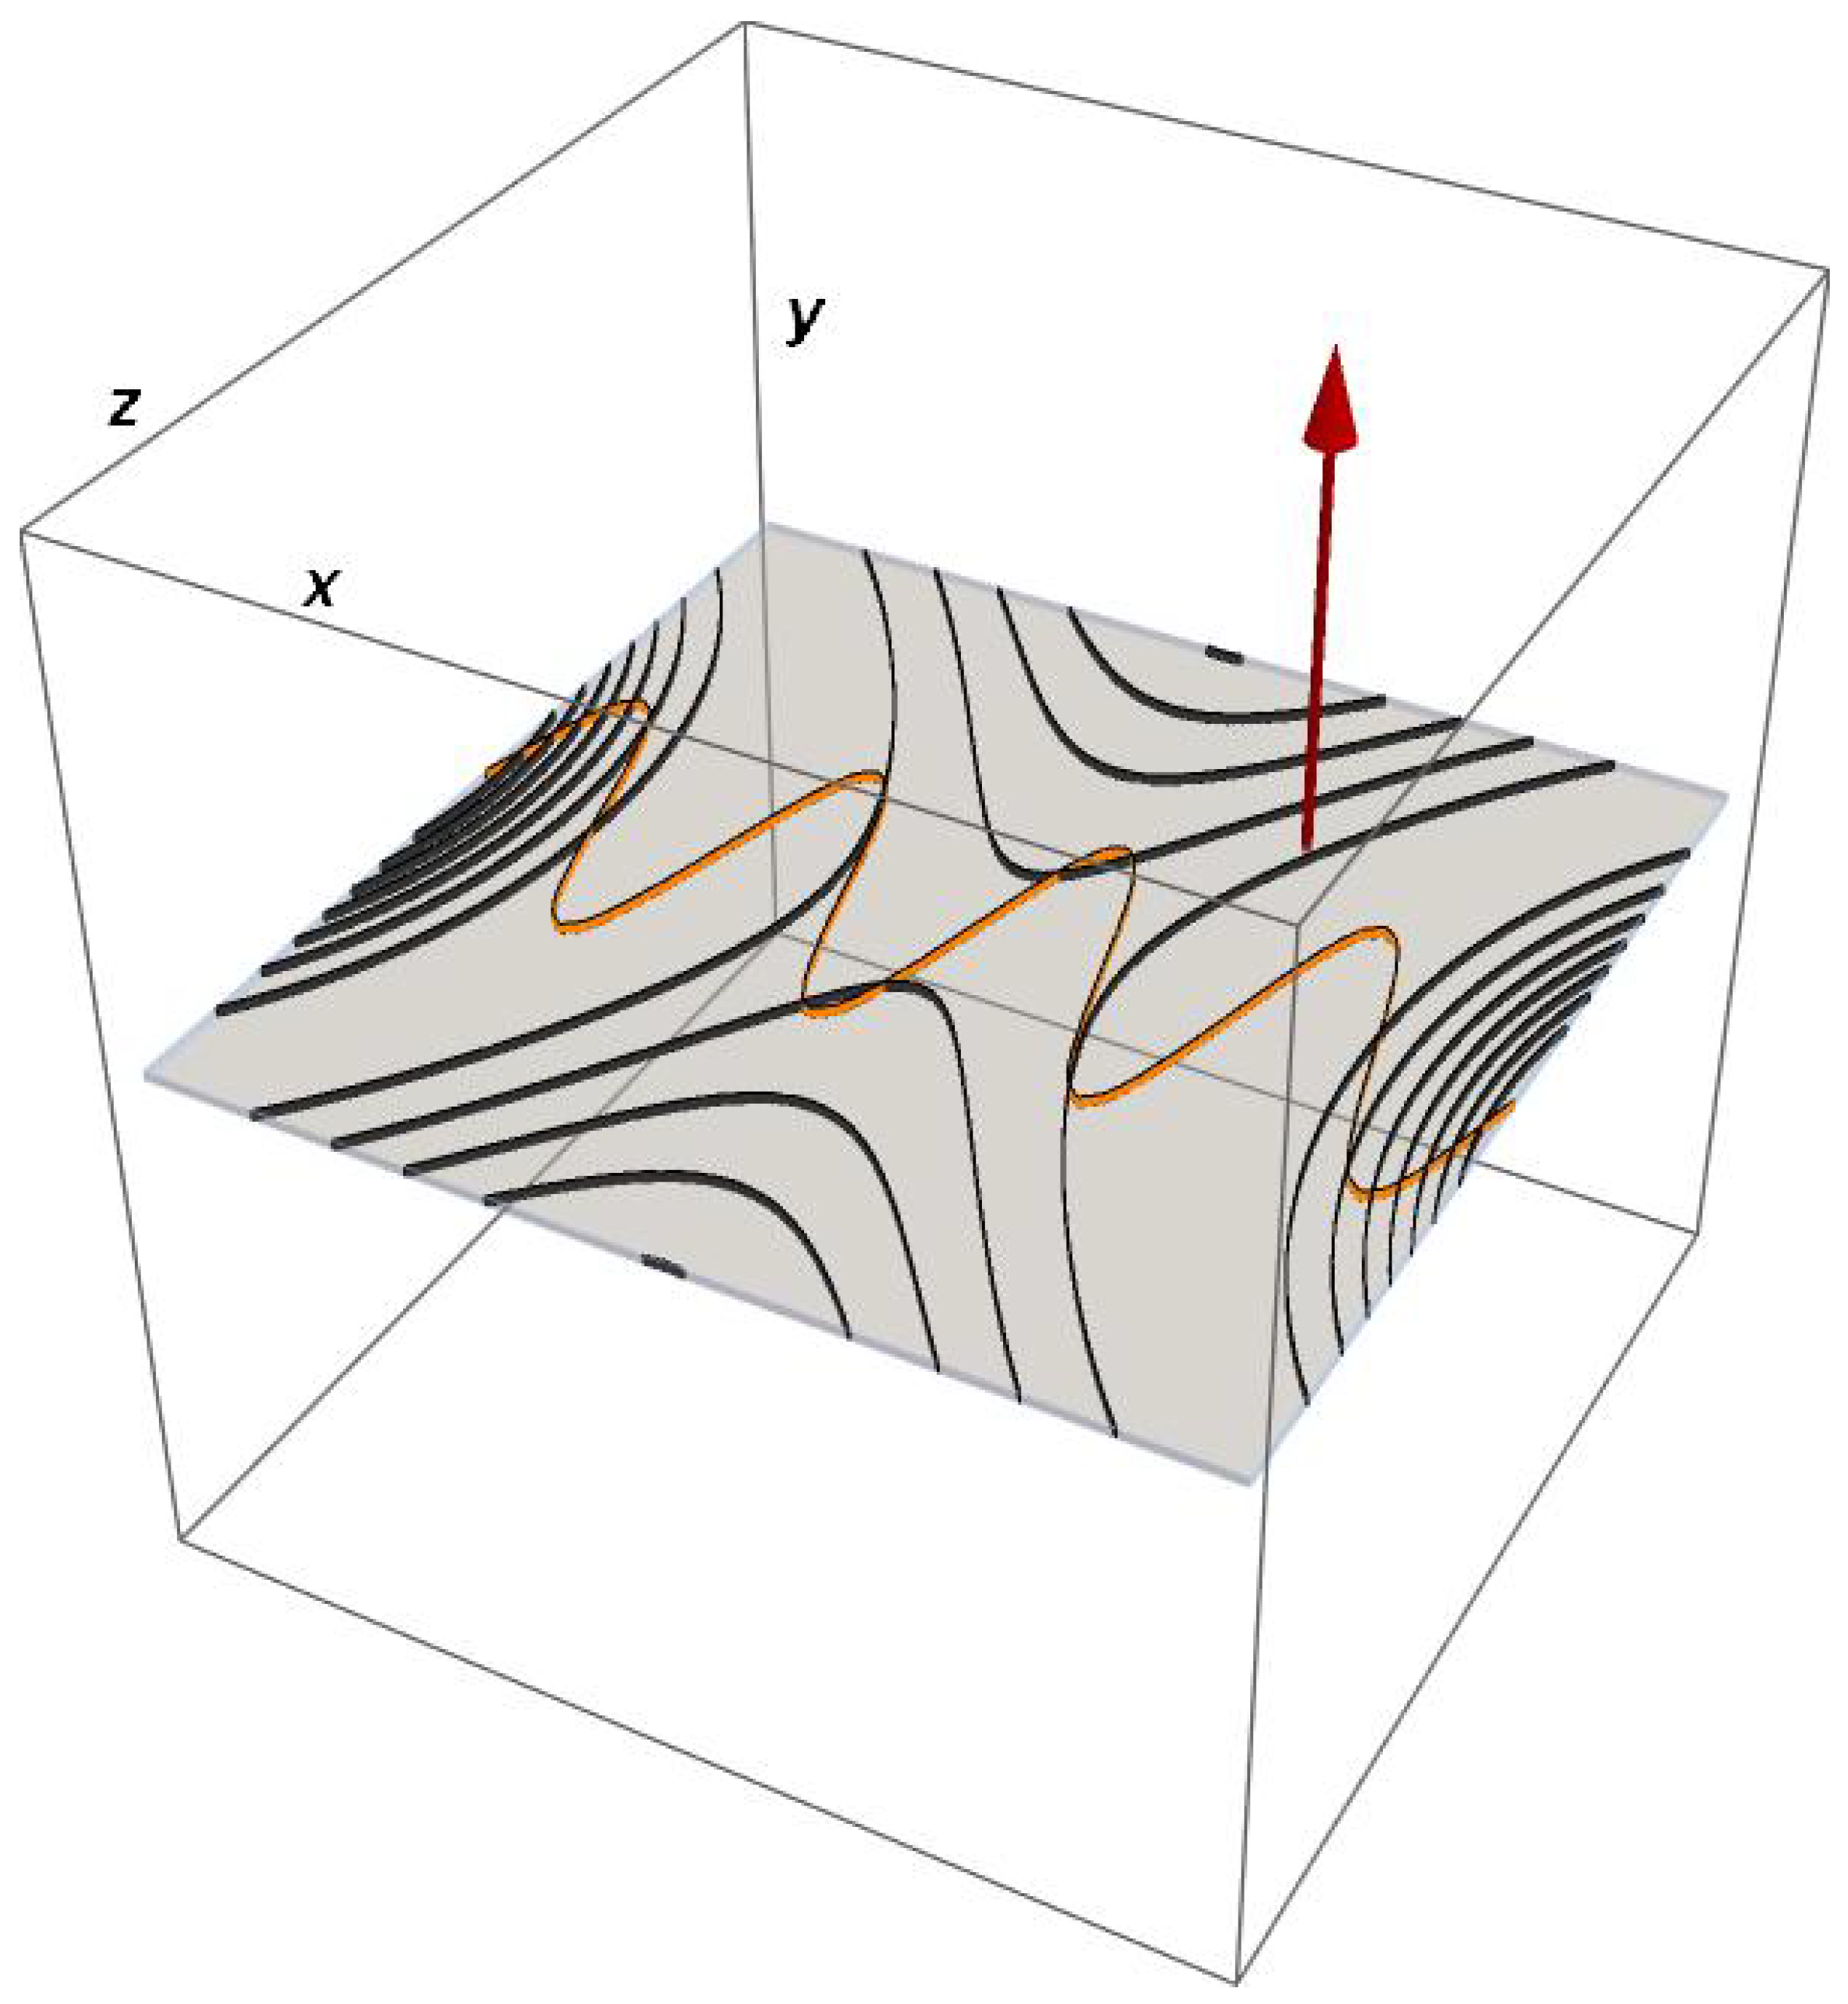
Notice that the oscillating electric field is oriented along the direction out of the reconnection plane and parallel to the guide field, like in the experiment. We provide in
Figure 1 a sketch of the experimental arrangement: we show a section of the reconnecting field in the
plane, the arrow along the
y-axis represents the direction of the guide field, while the sinusoidal curve stands for the wave propagating along the
x-axis.
In MRX, fluctuations superimpose upon a mean flow, driven by an average electric field and braked by collisions [
4]. Here, we place ourselves in a reference frame moving with the mean flow, thus treating electrons as initially at rest along the y-axis, and neglecting both collisions and the stationary electric field.
In the following lines, for convenience, we will be using dimensionless quantities: time is given in units of
, with
the Larmor angular frequency. Lengths are normalized to the thermal Larmor radius
, where
is the measured electron plasma temperature and
are the electron charge and mass. The single-particle Hamiltonian is written,
Since
H does not depend upon the coordinates
, the momenta
are constant of the motion, they can be dropped from the Hamiltonian using a gauge transform of
. A constant term
, which represents just an offset, has been dropped alike. Hamiltonian (
4), but for the inessential factor
in the argument of the trigonometric term, is in the paradigmatic form
Note that
H and
depend just upon the single
x spatial coordinate. Had we accounted for the reconnecting component of the magnetic field, the system would have been fully three-dimensional. The Hamiltonian of the form (
5) has been extensively studied in the cited literature [
7,
8,
9,
10,
11,
12,
13,
14,
15,
16,
17,
18,
19,
20]. Since the Hamiltonian features a time dependence
that is slow compared to the cyclotron motion (in our dimensionless units,
), one might naively conjecture that the corresponding dynamics be always adiabatic and reversible, i.e., if the wave is turned on for some time, and then switched off, the initial and final particle energy are the same. The literature cited above shows, instead, that this is true only for small wave amplitudes; there is a transition from adiabatic to non-adiabatic dynamics in correspondence of
a trespassing the threshold
. This condition corresponds to the appearance of a slow (moving with the wave frequency) separatrix in the particle phase space. In the static case (
), the separatrix divides orbits into totally disjointed basins while, in the dynamical regime, it is permeable. Close to the separatrix, the period of the orbit becomes very large, exceeding the wave period. Thus, the adiabaticity hypothesis, which relies upon the particle orbit period being much smaller than the wave period, breaks down, any crossing of the separatrix is an essentially irreversible process. Since the separatrix is an iso-energy curve in the phase space, each crossing corresponds to moving between disjointed basins at different energies: the initial and final particle energies are different. Therefore a net energy transfer between particle and wave may effectively take place
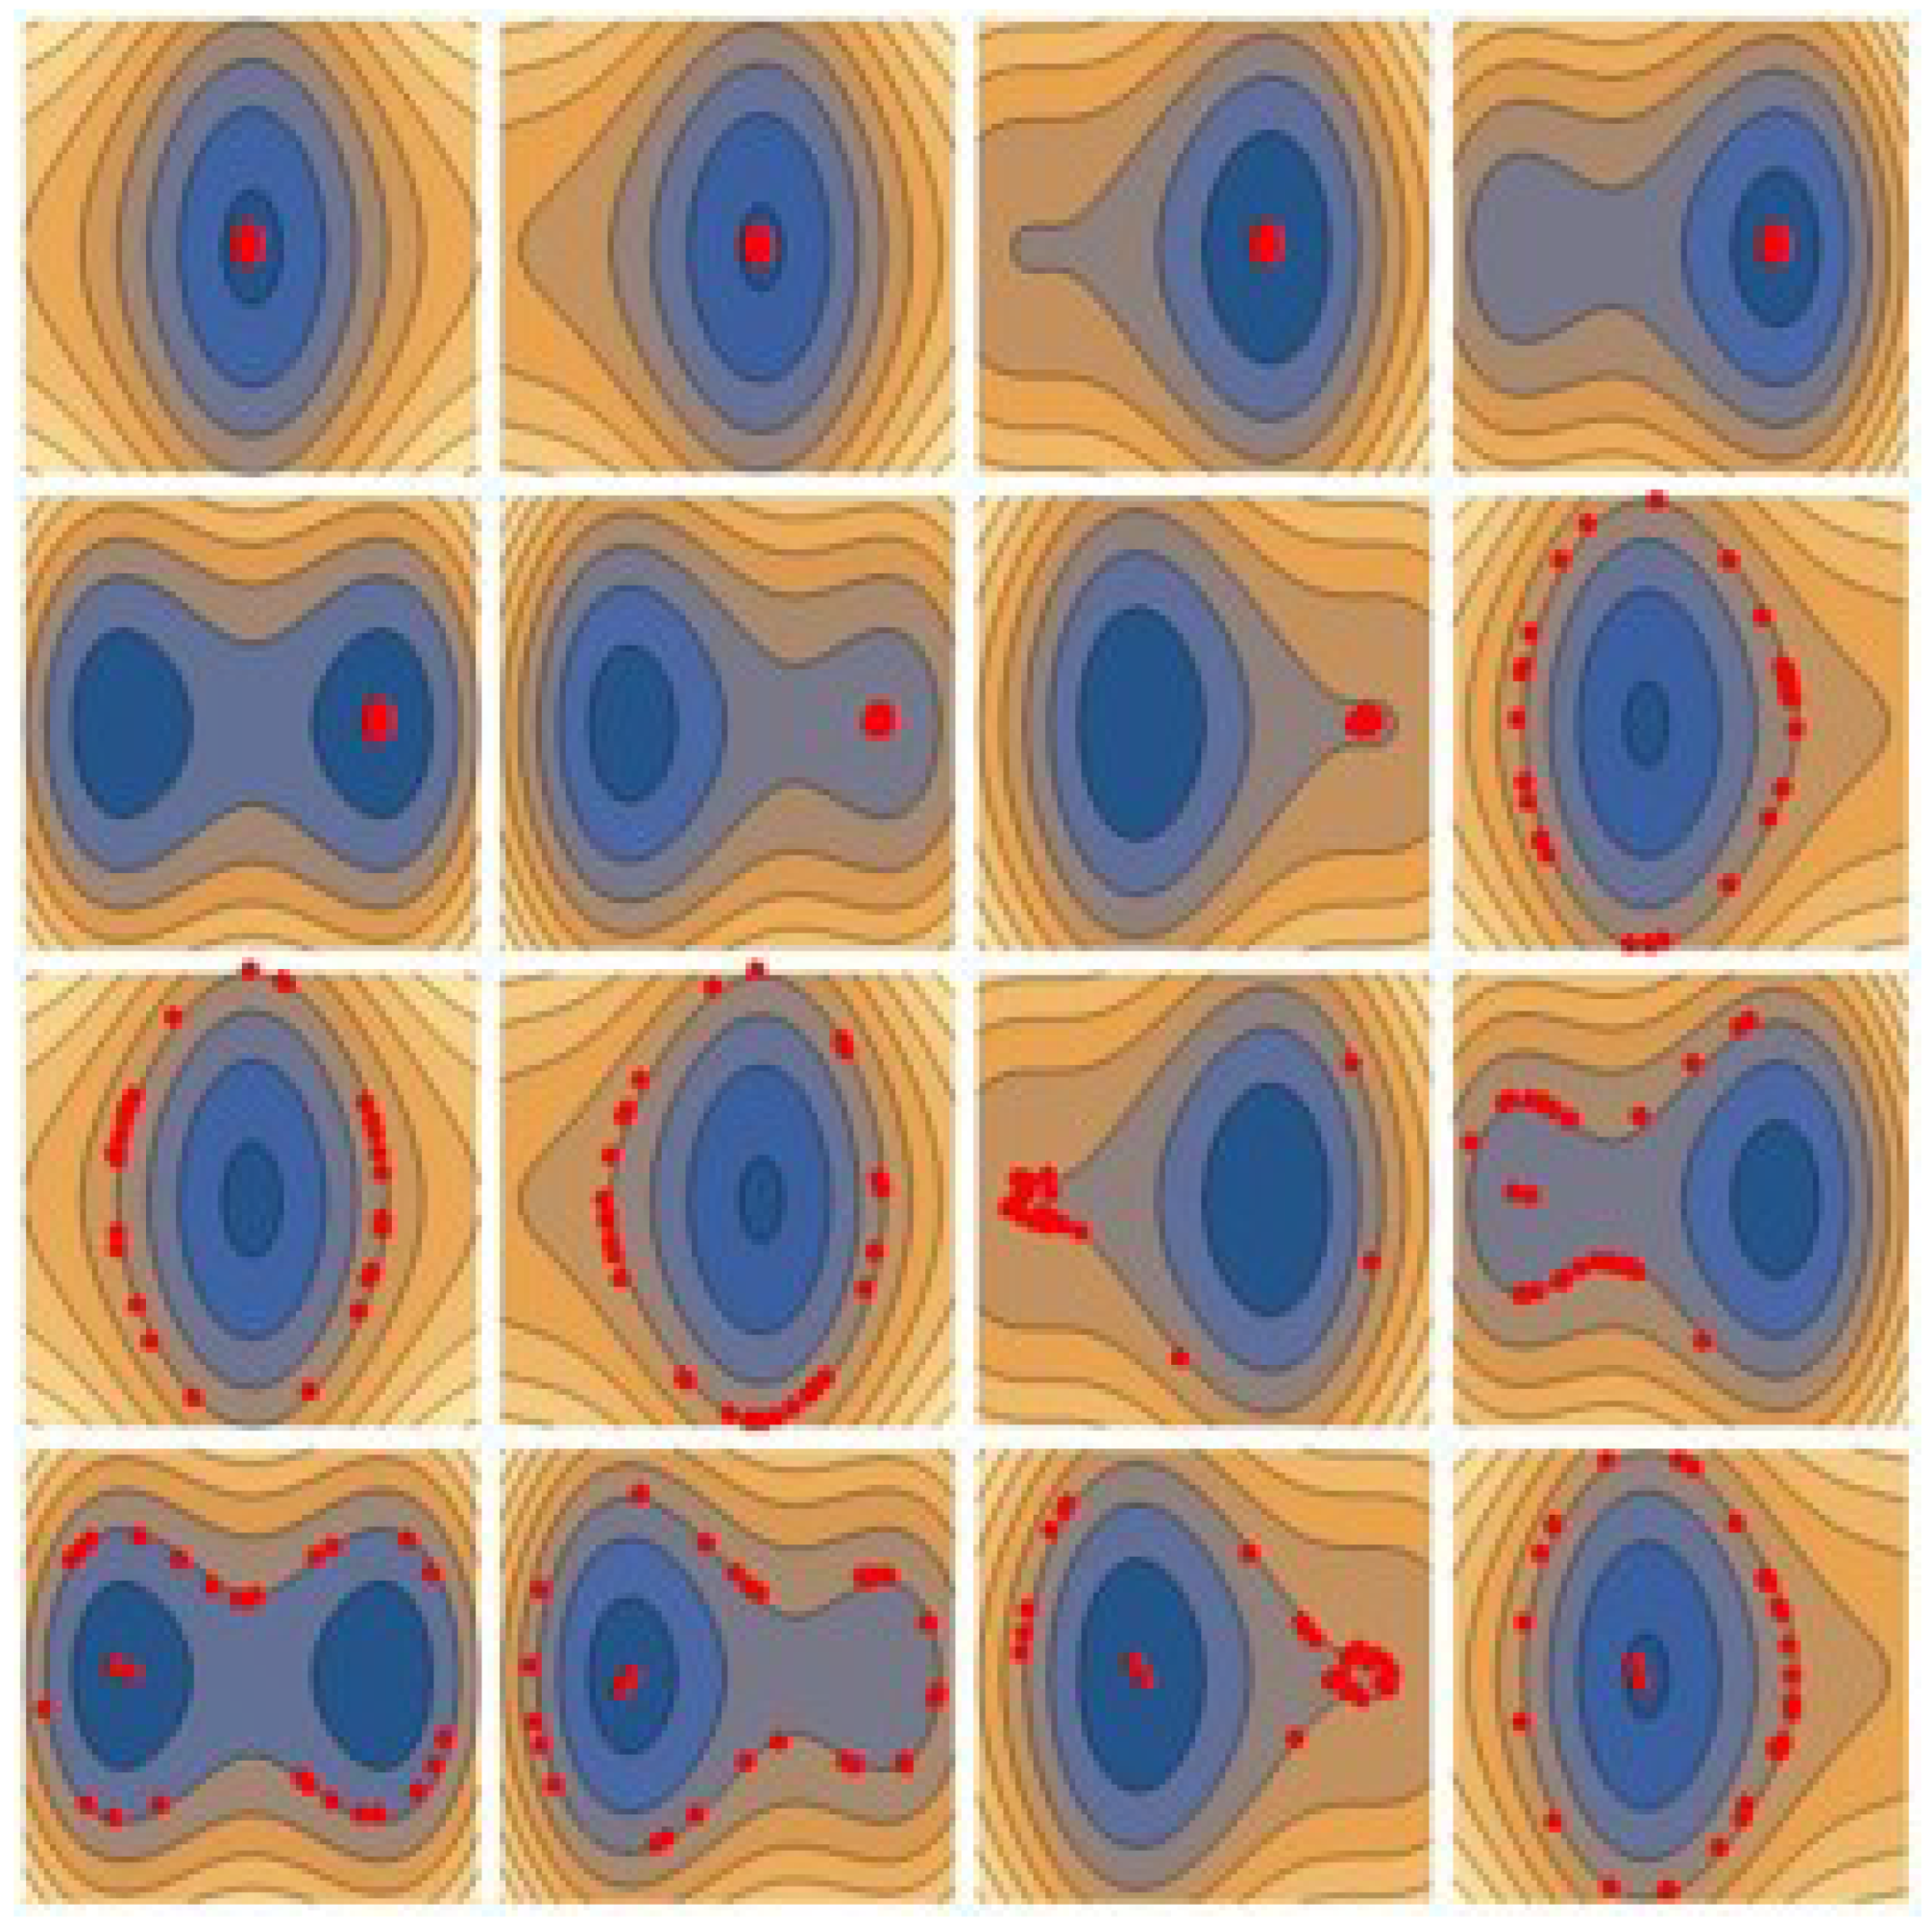
1. This result is made visual in
Figure 2: each of the 16 subplots is a snapshot of the instantaneous state of the system in the plane
taken at consecutive time intervals
, from left to right and from top to bottom. The colored contour levels label the instantaneous iso-energy curves
constant. The red dots mark the position of 30 particles initialized close to each other near the origin
(left-top subplot). While time evolves, the particles spread along almost iso-energy curves but, ultimately, a fraction of them crosses the newborn separatrix (third row) and remains energetically separated from the others. We enclose in the
Supplemental Material a video clip illustrating dynamically the same behavior: the motion of two initially close particles (red and green dot) is tracked in the
plane, superimposed to the instantaneous iso-energy levels, which progressively become detached in correspondence of each jump across the separatrix and the X-point. The energy of the two particles differs as well.
The threshold amplitude writes
. The amplitude of the electric field associated to the wave is
, hence the threshold condition can be written as
. In physical units, it becomes
where
is the thermal speed and
the electron Larmor frequency. The average energy gained per particle in the non-adiabatic regime is a question that, quantitatively, has not yet received a full investigation. Some partial investigations are reported in [
16], but only cold particles were there considered, i.e., their initial distribution was practically mono-energetic and close to zero. In this paper, we are going to repeat the exercise using a realistic thermal initial distribution.
Hamilton equations from Eq. (
4) were integrated in time using one symplectic algorithm built into Wolfram’s Mathematica software (“NDSolve” routine, choosing the “SymplecticPartitionedRungeKutta” method of fourth order), and another one implemented from ref. [
22]. Here below we provide the results of a scan done varying the wave amplitude
. The numerical strategy is the same employed elsewhere: we switch on and off the wave through a shape function
, with
In this expression,
represent the start and end time of the perturbation, and
is the time scale for switch-on and -off. By comparing the particle energy before and after the switching of the wave, we get the amount of heating. For each value of
A, 2400 independent trajectories were evolved. Initial conditions were randomly sampled from a thermal distribution, i.e.,
and
r picked up respectively from a zero-mean, unit-variance normal distribution, and from the uniform distribution in
, and
. All parameters were taken from MRX measurements. Using non-normalized quantities:
Gauss,
eV,
,
MHz. The shape function
grows up and falls down over the MRX time scale for the bursts of electromagnetic activity:
: this yields an effective duration time of the electron-wave interaction of roughly 5
which, basing upon the figures in [
4] (see their Figure 2), appears reasonable. The temperature, for each value of the electric field, was computed as the average energy of the particles after the interaction with the wave had been switched off.
3. Results
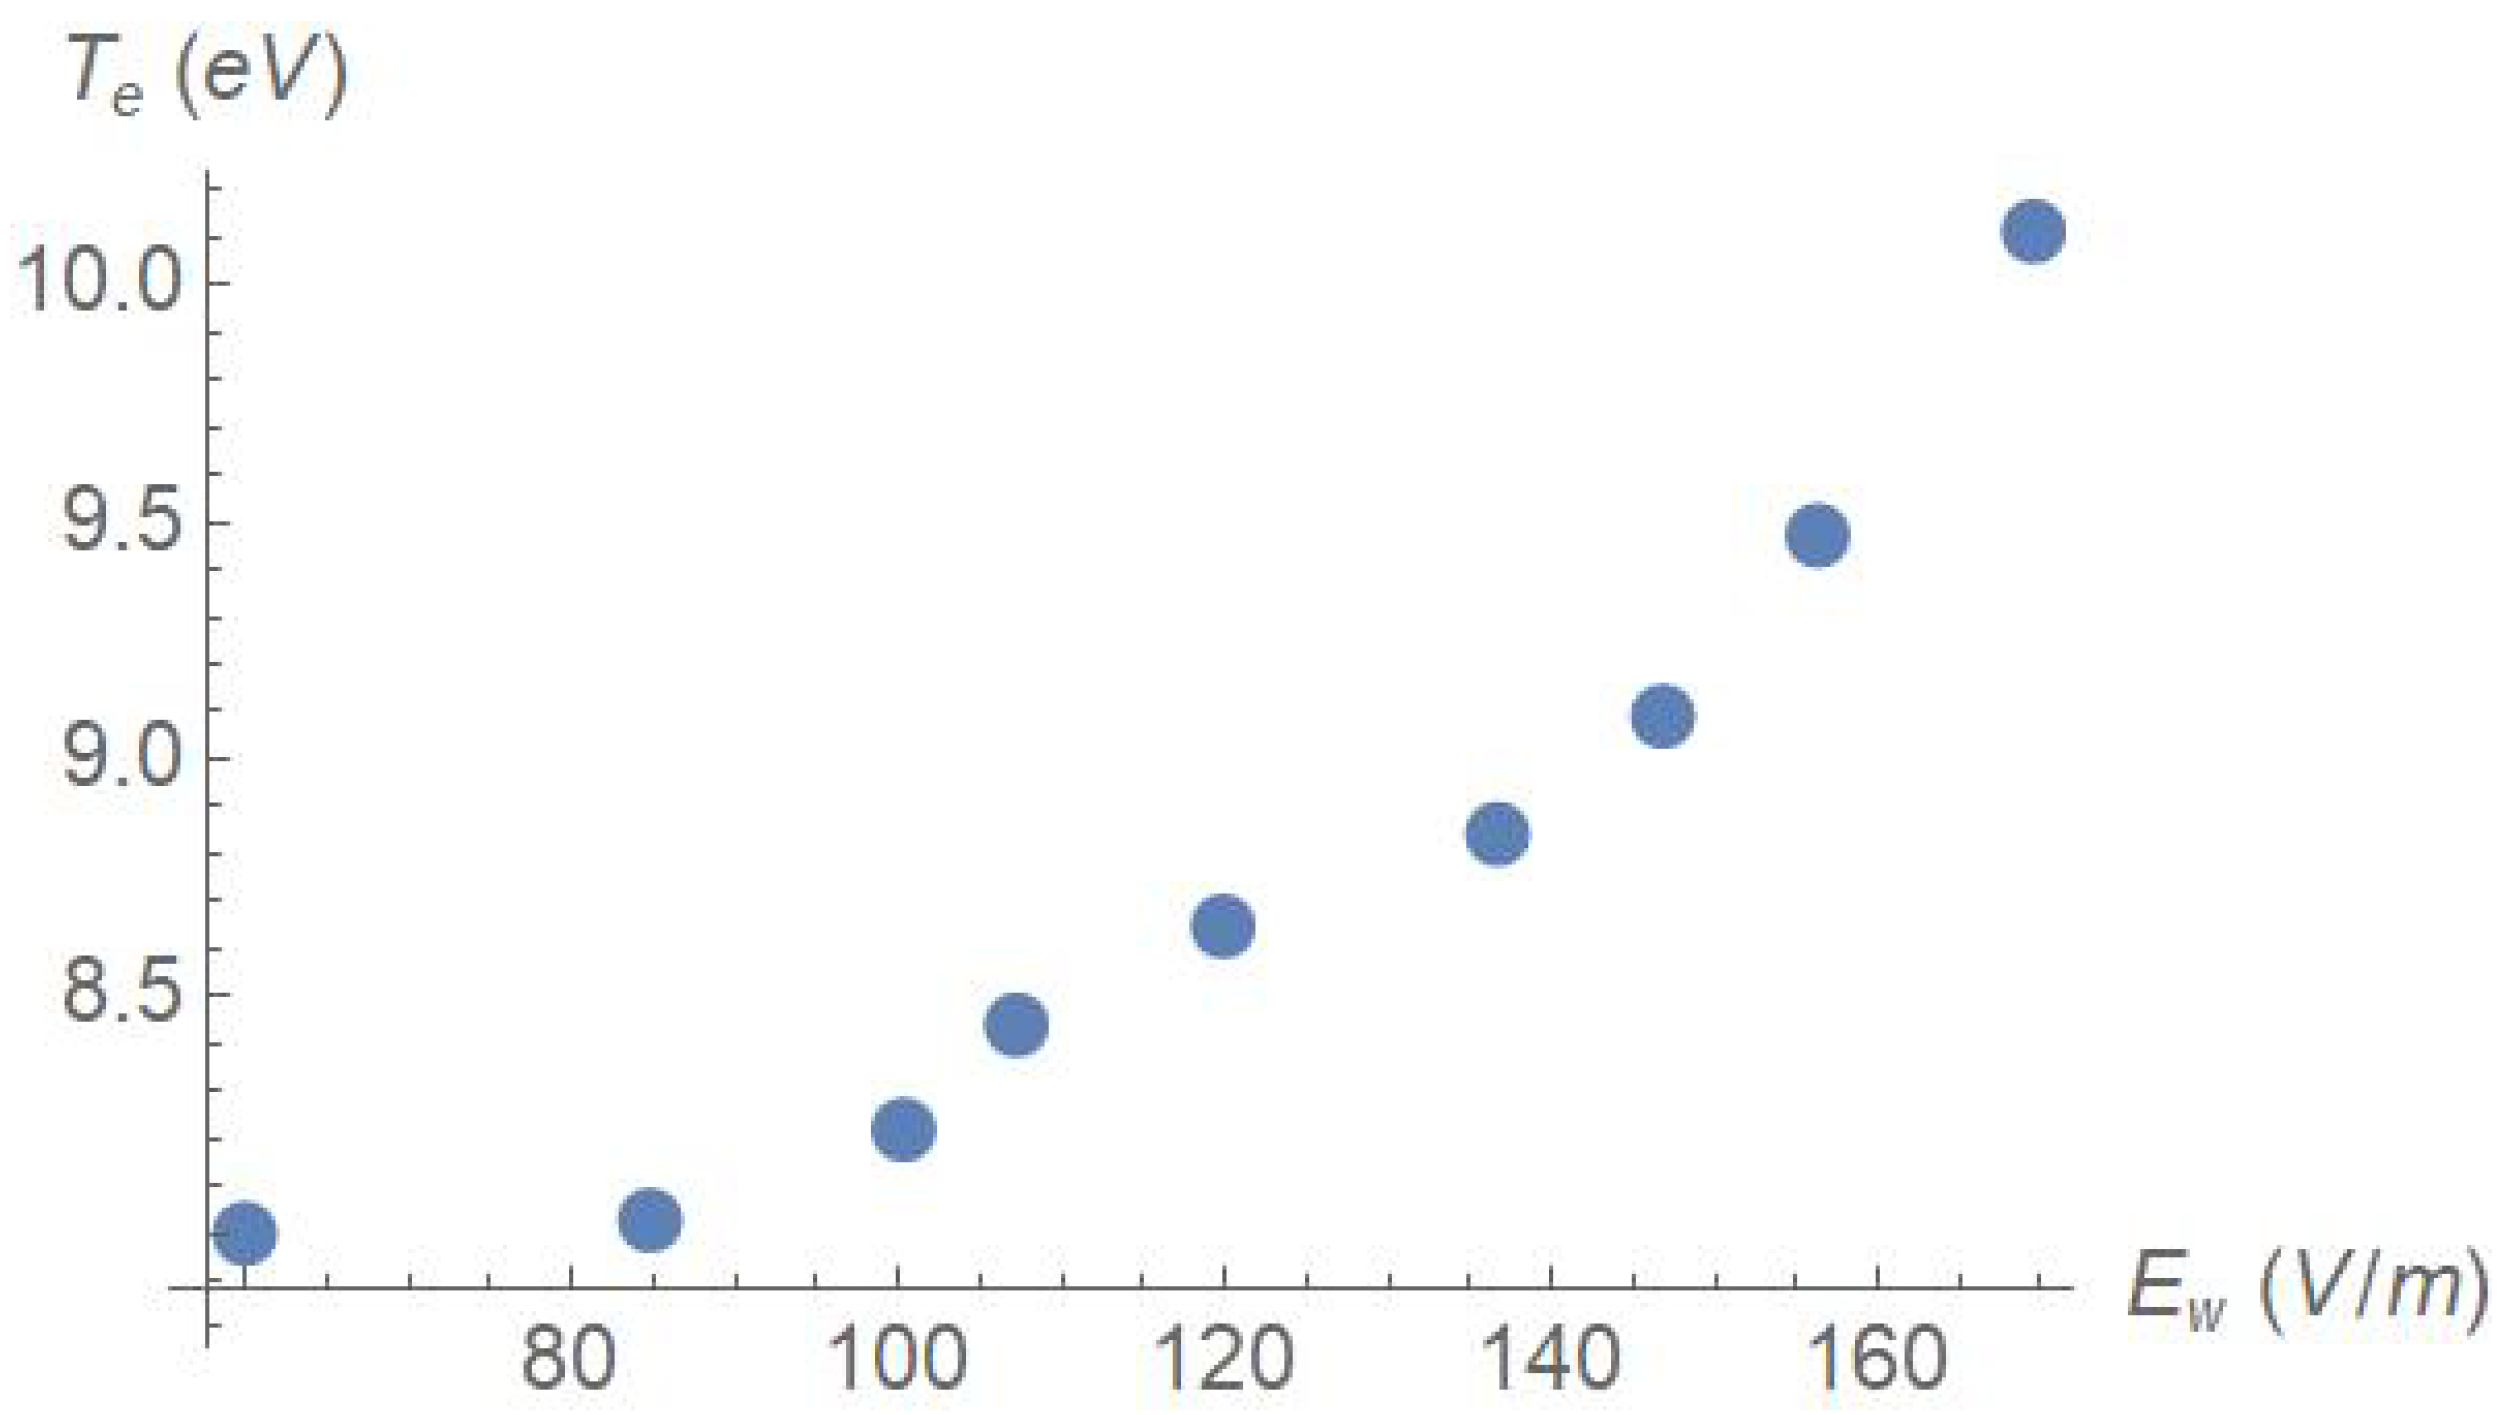
The main result of this work is summarized in
Figure 3. The threshold amplitude of Eq. (
6) corresponds to 85 V/m for the parameters employed. There is energy gain by the electrons only beyond this threshold: compare the two leftmost points with the others. The figure should be compared with
Figure 4 of the paper [
4], in particular with the red dots, that correspond to the case with the largest guide field, closest to the geometry employed in the present work: there, the electron temperature rises from slightly more than 7 eV to about 10 eV over the range 50-150 V/m, nicely consistent with our result. Indeed, it is possible to advance a conjecture: according to the paper [
4] electric fluctuations superimpose to a background quasi-static electric field parallel to the guide magnetic field, whose typical value is about 80 V/m. The electron collision time for a 10-eV,
cm
−3 plasma is
s. Over this time scale, the energy gained by an electron due to parallel acceleration is
eV. Thus we may envisage the following scenario: the baseline electron temperature,
eV, is due to electron energization by parallel electric fields: this conclusion is consistent with the analysis carried out in [
5]. Waves add a further contribution that, depending upon their amplitude, may amount up to
eV.
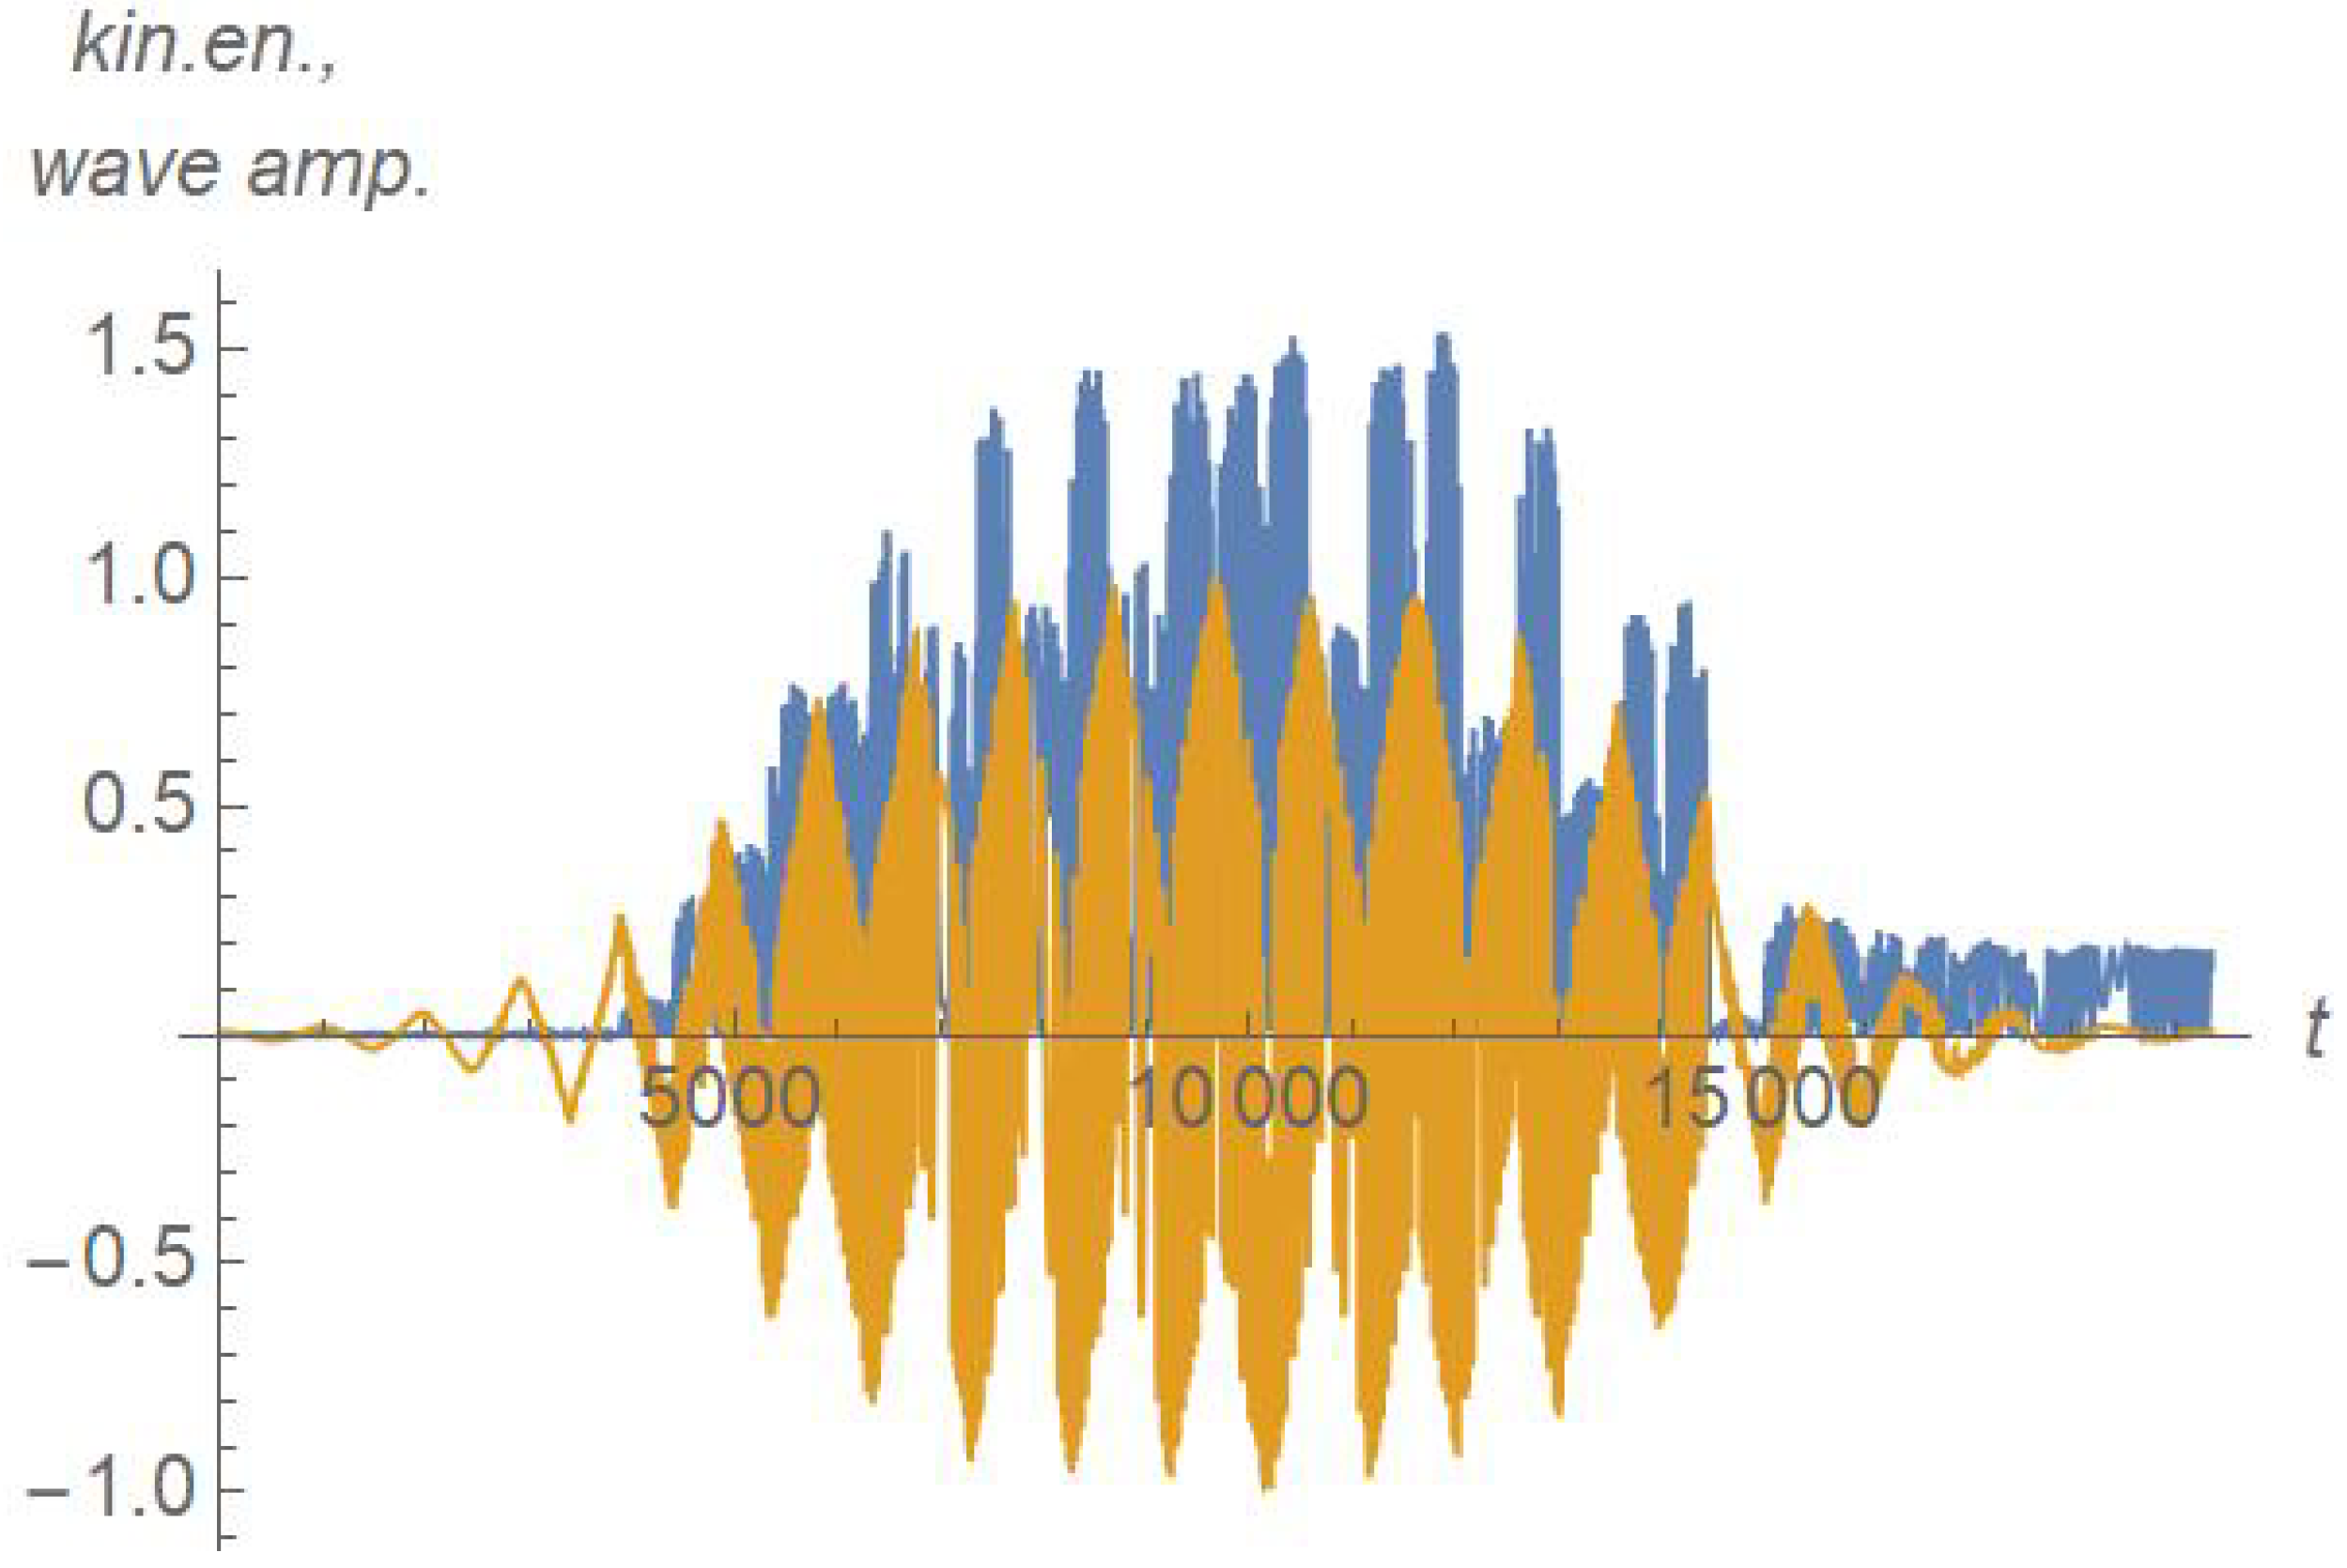
In order to give an insight about the typical dynamics experienced by the electrons during their interaction with the wave, we plot in
Figure 4 a sample of the time trace of the electron’s kinetic energy,
, alongside the corresponding time trace of the wave as experienced by the particle:
. In particular, we pay attention to the wild energy fluctuations during the time interval
, when
. They greatly exceed the final stationary energy of the particle, but only transiently: in the sub-threshold case, ultimately the electron lands back to its initial energy once the wave has disappeared.
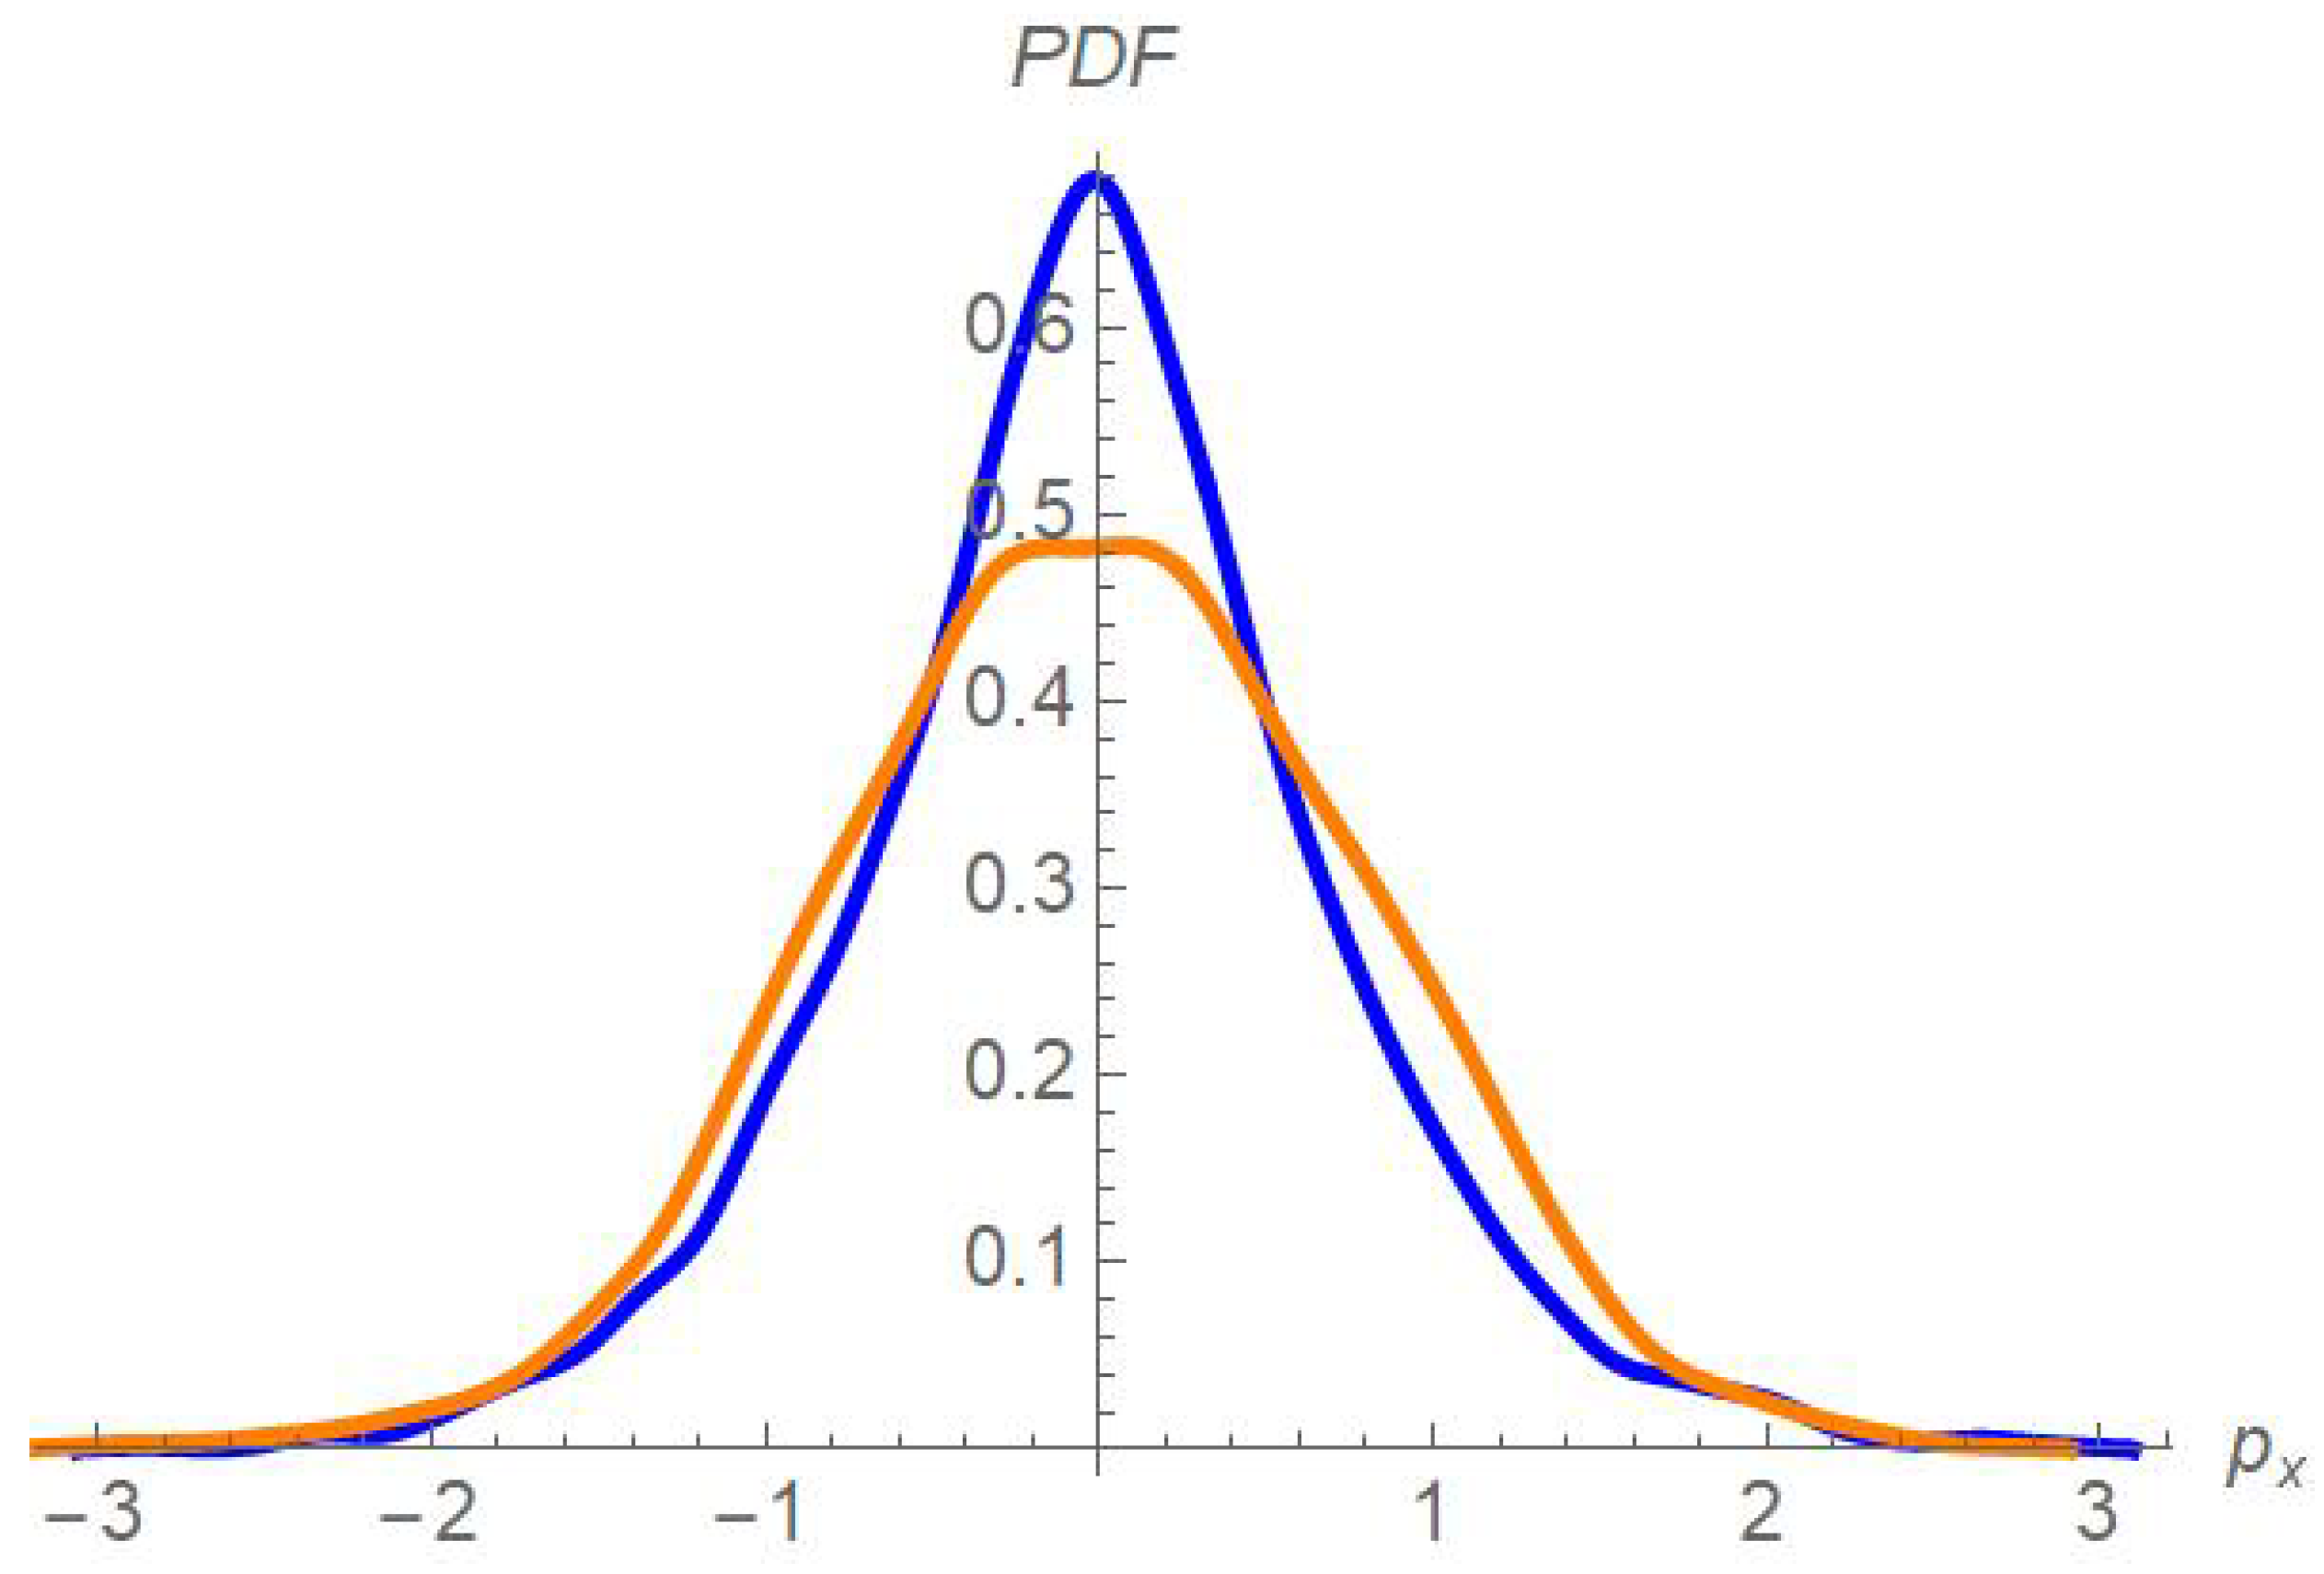
In the
Figure 5 we show the probability distribution of the initial and final particle momenta
for the case with
V/m. Each distribution has been computed by taking the initial (respectively, final) value of the momentum for all the 2400 independent trajectories. Interestingly, the final distribution remains fairly close to a thermal (normal) curve. This result was not granted from earlier studies using monoenergetic initial distributions and is comforting since experimental measurements hint to a true heating, not just electron energization.
We remark that, even though the wave electric field is parallel to the guide magnetic field, energization of the electrons occurs along the x direction, perpendicular to . Since Hamilton’s equation for the motion along the magnetic field writes (setting ), when the wave vanishes () we are sure that the particle stops moving along z: no energy is acquired along the parallel direction.
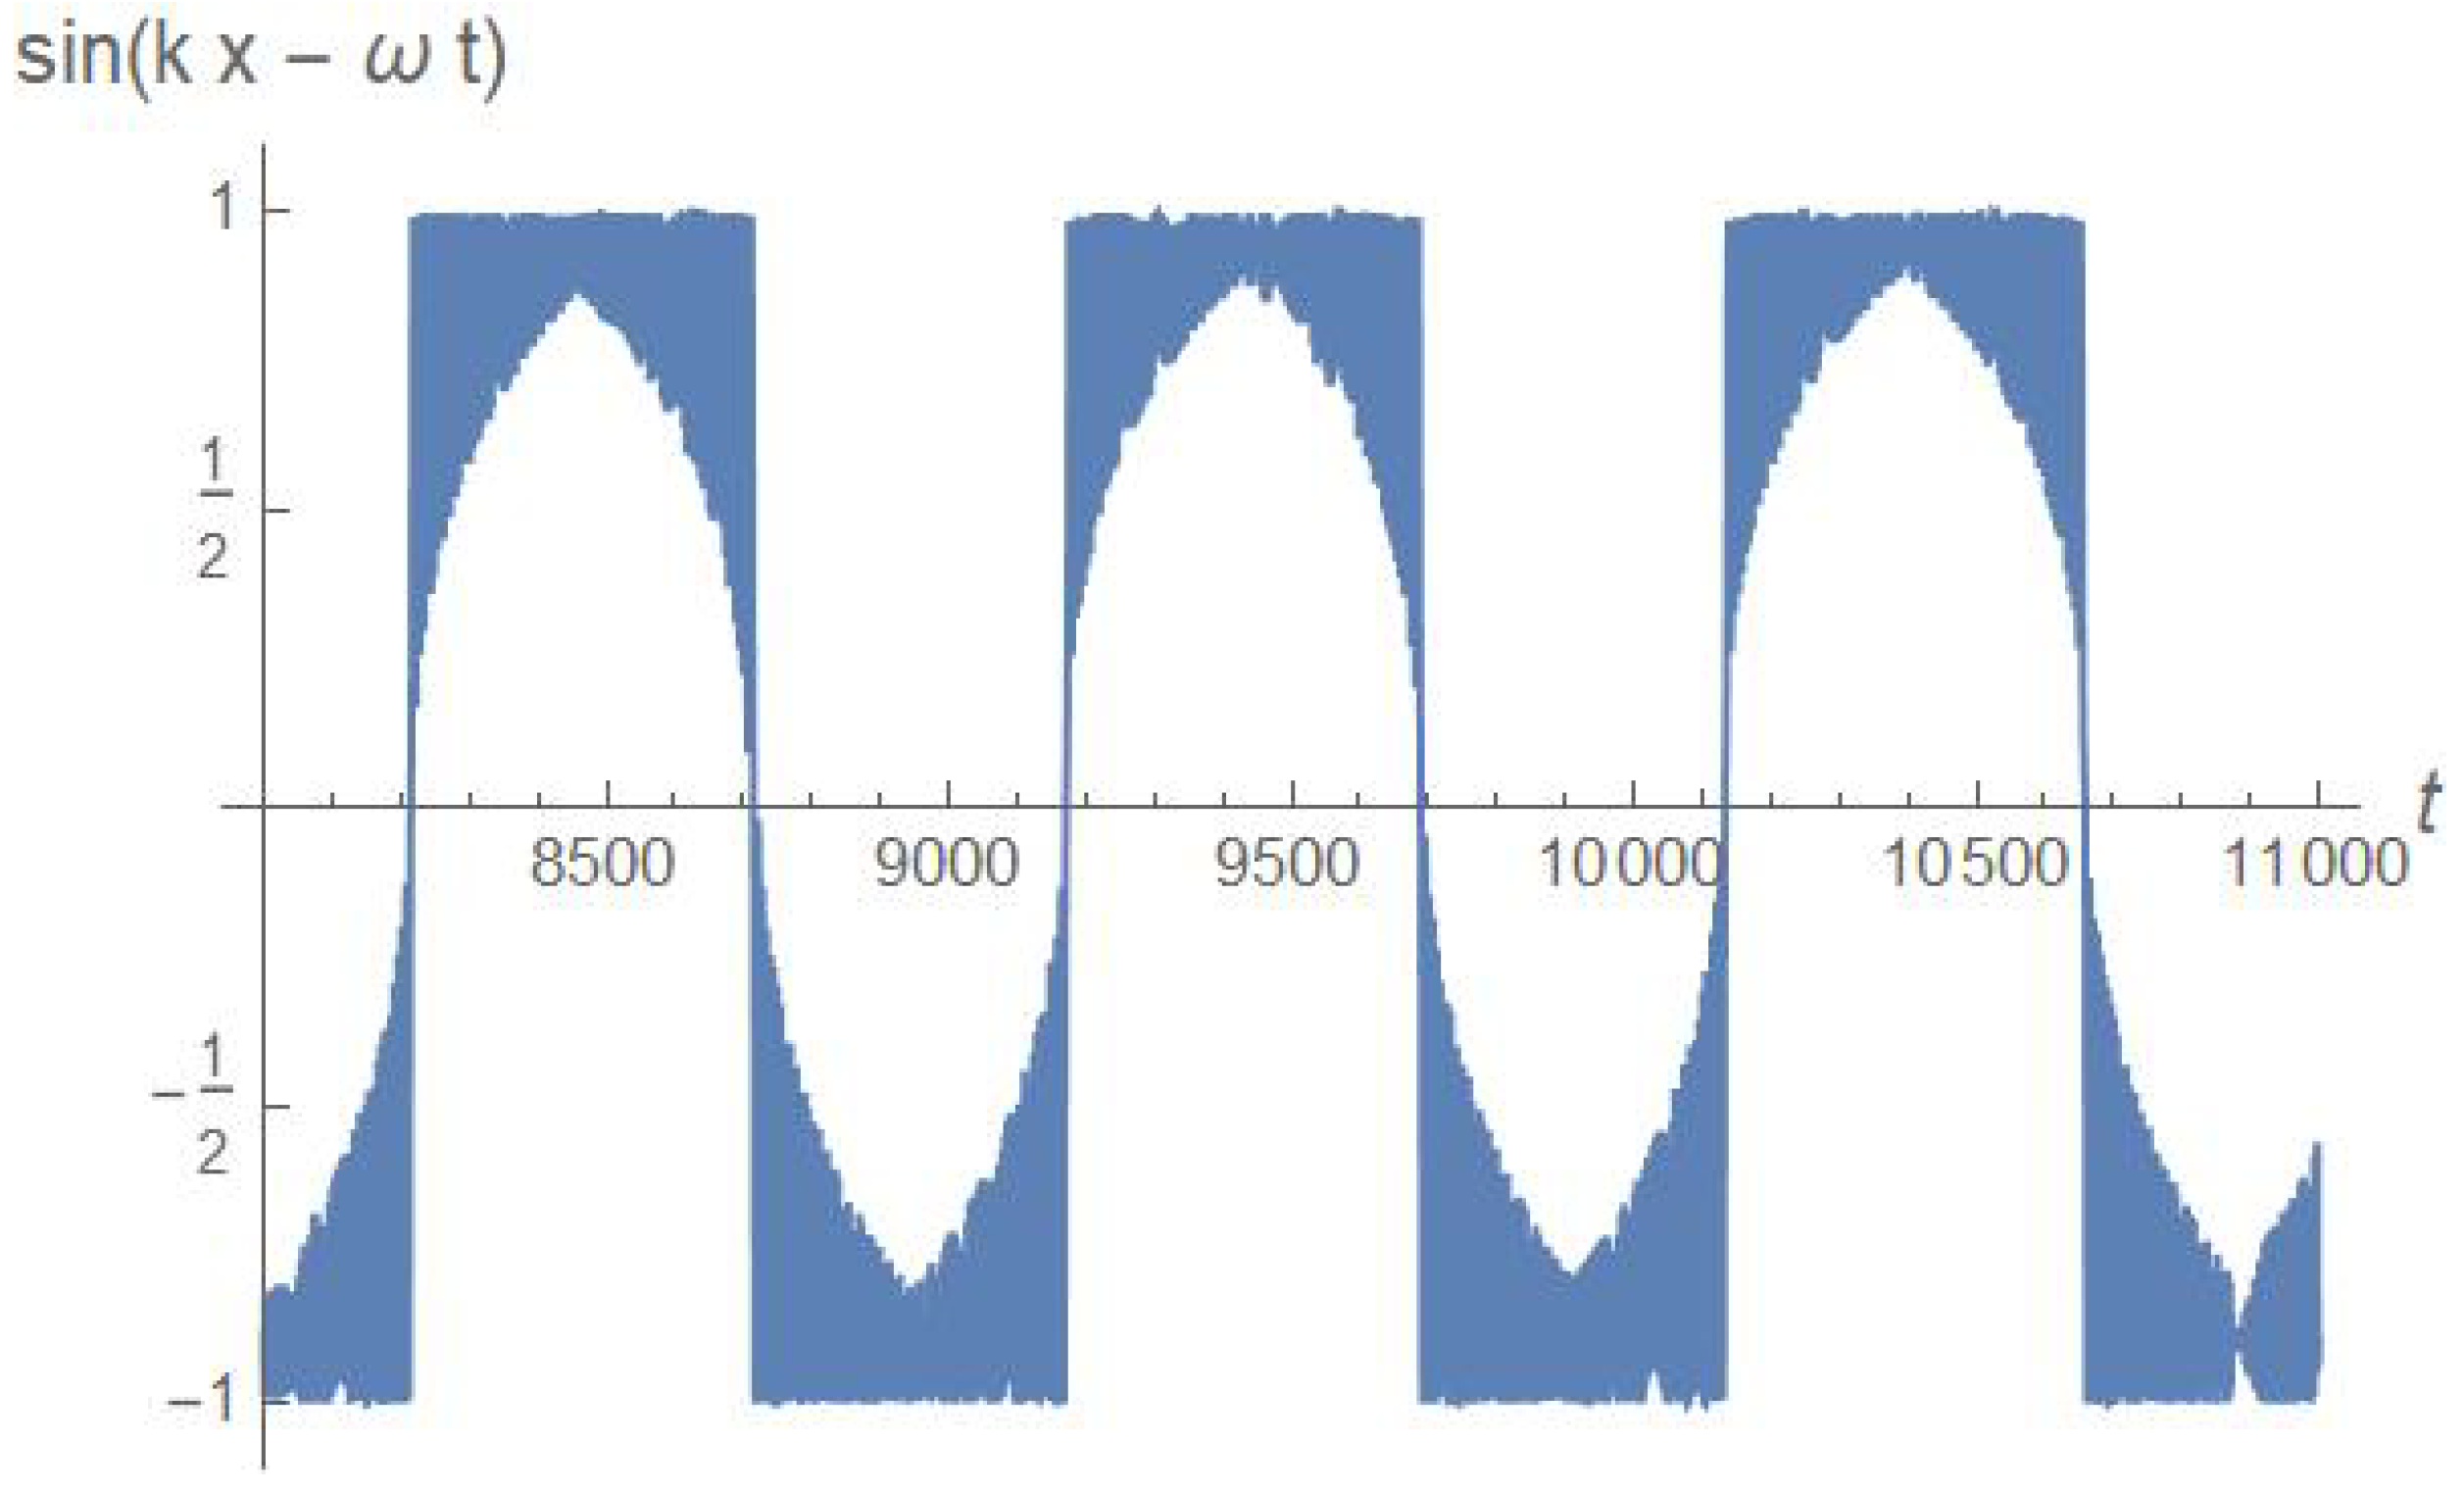
We conclude with a spin-off of the above analysis. Our simulations do not involve interactions between particles–and in particular between ions and electrons–therefore the subject of the anomalous resistivity is outside the scope of this work. Yet, the analysis of the particle dynamics reveals interesting aspects. In
Figure 6 we plot one time trace of the quantity
, where
is the computed trajectory. The plot refers to the flat-top phase, where
. Although the plot refers to just one case, the inspection of several trajectories shows that the picture is generic: the particle trajectory exhibits a quasi-periodic trend, with intervals where it slowly drifts around two attractors, placed at the phase
, interrupted by sudden jumps from the one to the other.
From Eq. (
4) we retrieve the equation of motion along
y:
where we have set
, consistently with our choice of initial conditions. After another derivative, we get Newton’s law
The dynamics of
Figure 6 consists of finite intervals where the particle stays almost in phase with the peaks of the electric field: (
), which is a feature of the Landau damping. This condition, which corresponds to the state of maximal acceleration by the electric field, is unstable since is incompatible over long times with the
condition from Eq.
8, thus the system jumps repeatedly between the two fixed points. Yoo
et al [
4] introduce the anomalous drag term
which quantifies the correlation between the particle and the electric field oscillations and the contribution to the resistivity by the fluctuating terms. Within our framework, the analog of
D, normalized to the electric field amplitude, is
where
is the particle trajectory, and the average
is performed both over time and over all the trajectories.
In our case there is no symmetry-breaking term, correlated and anti-correlated phases are equally likely, thus vanishes. However, we may speculate about what would happen if an efficient symmetry-breaking mechanism, that allows only correlated (or anti-correlated) phases to survive, were added. If we average over just the time windows where it is positive, we get , which compares fairly well with the figure coming from the measurements of Yoo et al. By comparison, a perfectly sinusoidal trend would yield . All this is highly speculative, yet it is suggestive that the observed correlation might arise as a consequence of this kind of resonance.
