Introduction
The green transition, while posing more complexity for latecomers than for advanced industrial countries, also holds significant potential for Latin America. Despite the major challenge of funding green infrastructure investments and the restructuring of manufacturing, the region’s abundant natural resources present a unique opportunity. These countries, under pressure to export raw materials to meet the energy needs of rich countries, can leverage their local capabilities to add value to natural resources industries. Importing technological solutions related to renewable energy and exporting commodities to reduce emissions from industries in advanced capitalist countries (lithium, biofuels, and green hydrogen) can be a stepping stone towards sustainable development, painting a promising picture for the future of the region.
However, these countries have the upper hand in their energy grid with a large share of renewable energy. In 2022, Brazil had the largest solar photovoltaic energy generation capacity in Latin America and the Caribbean, with over 24 gigawatts. Mexico ranked second, with some 9 gigawatts, and Chile ranked third, with a capacity of around 6 gigawatts. These impressive figures demonstrate the significant strides Latin American countries have made in renewable energy. Brazil, for instance, has the largest renewable energy capacity in Latin America at 159,943 MW. Mexico follows with 29,443 MW, and Argentina with 15,027 MW (IRENA, 2023).
Together with the pressing urgency of the green transition to curb the momentum of climate change, the need to preserve the rainforests is a looming window of opportunity for these countries. Latin American countries, for instance, export several crops and husbandry products. Mining and agriculture, which play a pivotal role in the greenhouse emissions on the continent, need to be addressed. However, it’s crucial to emphasize that preserving the rainforests is not the sole responsibility of these countries, but it is a global challenge of utmost importance that requires immediate and concerted action.
Greening the global value chains upstream gives energy-intensive products such as steel, ore, iron, soybeans, corn, and natural products an upper hand. It is not a natural outcome as part of a comparative advantage. From an optimistic outlook, the green techno-economic paradigm is an opportunity for industrial transformation in the Twenty-First Century (Perez, 2016).
Collective action and cooperation between firms, governments, and international organizations are needed to accomplish this green transition. The ‘automatic pilot’ would lead these countries to a new type of extractivism, green extractivism.
The industrial sectors that contribute the most to carbon dioxide emissions are coal-fired power plants (CFPPs), iron and steel smelting (ISS), cement production (CMP), steel, cement, non-ferrous metals, oil and gas, chemicals, and general manufacturing industries. CFPPs stand out as the leading contributors to carbon emissions, followed by ISS and CMP. These energy-intensive industries, such as steel, cement, oil and gas, chemicals, and non-ferrous metals, accounted for 36% of China’s total carbon emissions in 2017. Labor and capital resources drive direct and net CO2 emissions in industrial production processes. Energy supply and industrial systems comprise 66% of total global fossil fuel CO2 emissions, with the utility sector of “Electricity, gas, and water” having the highest labor and capital-induced emissions. The concrete industry, particularly the production of Portland cement and transportation of materials, is also a significant contributor to carbon dioxide emissions.
1. The Conundrum of Green Growth
The quest for green growth presents a complex and multifaceted challenge, particularly for emerging economies striving to balance economic development with environmental sustainability—green growth is defined as fostering economic growth. The quest for green growth presents a complex and multifaceted challenge, particularly for emerging economies striving to balance economic development with environmental sustainability. Green growth, defined as fostering economic growth and development while ensuring that natural assets continue to provide the resources and environmental services on which our well-being relies, promises a way to reconcile economic and environmental goals. However, the reality is far more nuanced and fraught with difficulties.
Emerging countries, such as those in Latin America, face the dual challenge of promoting renewable energy and upgrading their value chains while managing the socioeconomic dynamics inherent in their developmental stages. We examine how policy feedback mechanisms and local value creation influence the adoption of renewable technologies. Additionally, we discuss the challenges of decoupling GDP growth from resource use. Emerging countries, such as those in Latin America, face the dual challenge of promoting renewable energy and upgrading their value chains while managing the socioeconomic dynamics inherent in their developmental stages. We examine how policy feedback mechanisms and local value creation influence the adoption of renewable technologies.
Additionally, we discuss the challenges of decoupling GDP growth from resource use and the implications of time compression on sustainable development. The financial and temporal demands of transitioning to climate-neutral technologies are also considered, highlighting the complexities and potential barriers to achieving green growth in these regions, particularly for emerging economies striving to balance economic development with environmental sustainability. Green growth, defined as fostering economic growth and development while ensuring that natural assets continue to provide the resources and environmental services on which our well-being relies, promises a way to reconcile economic and environmental goals. However, the reality is far more nuanced and fraught with difficulties.
The origin of green growth has two main strands (Jones & Ström, 2024). One is within the neoclassical paradigm with a causal chain of incentives and solutions for resource depletion and environmental degradation. In this strand, there is a broad assumption that proper environmental regulation would lead to innovation and better business performance. In other words, with the right incentives and sanctions, companies and governments would search for adequate solutions to climate change. The rationale is that once the environmental costs become internalized, the unsustainable use of resources will cease (Jones & Ström, 2024). Considering that this approach traces back to the early nineties and the environmental situation dramatically worsened, the evidence so far does not corroborate the feasibility and effectiveness of this approach. The other theoretical approach refers to ecological economics. For this approach, any economic system is constrained by the biophysical limits of the earth (Jones & Ström, 2024). It also incorporates contributions from biology and ecology, considering the interactions between nature, human beings, society, and the economy. The core argument rests upon ‘dematerializing economies’ so that material or energy use per output unit is reduced (Jones & Ström, 2024). However, there are limits to replacing natural resources with other inputs, which poses the need to ponder growth limits.
The OECD (2011) document Towards Green Growth claims that green growth arises from the sustainable development debates from the 1992 Rio Earth Summit and is part of this debate rather than a replacement for sustainable development. The core argument of the OECD document fits nicely into the environmental economics paradigm. Green growth focuses on creating the necessary conditions for innovation, investment, and competition, giving rise to new sources of economic growth consistent with resilient ecosystems (OECD, 2011). A green growth strategy would encourage greener behavior by firms and consumers by creating incentives to reallocate jobs, capital, and technology towards greener activities. The issue of economic inequality between developing and developed countries should be mentioned in the document, highlighting the need to match green growth policies with poverty reduction. However, a bold statement relates green growth to opportunities for leap-frogging to new forms of infrastructure development (OECD, 2011). Also, the document mentions the institutional capacity needed to integrate green growth into core economic strategies with particular emphasis on finance, economic, and environmental agencies.
So far, there is a consensus around the link between green growth and innovation or upgrading, which seems adequate for developing and emerging countries. The nature of this link is distinct due to differing economic and political circumstances with no ‘one size fits all’ policy toolkit.
Renewable energy growth can also result from higher upgrading in the value chain and exports from emerging countries. Data from Mexico partially corroborates this claim with the electric cars. Eicke and Weko (2022) call attention to positive policy feedback where actors reaping benefits from greening the value chain mobilize resources exerting political influence in policymaking. This process helps to galvanize support from civil society, policymakers, and even politicians to renewable energies as an opportunity for growth. Also, employment growth associated with clean and renewable technology is alluring, especially for middle-income countries. The authors mention that growth in wind and solar energy manufacturing has been an essential driver of positive policy feedback in these countries. Brazil has solid local value creation in the manufacturing and services of wind turbines and is also investing in the skilling of workers for the maintenance of solar energy equipment through its vocational training system, which belongs to the Business Associations in Manufacturing (SENAI). The same holds for Mexico, which has suppliers of electric cars, wind farms, and solar energy parks. However, as shown below, the two countries have a vast difference in funding and policy initiatives.
Another issue contributing to improving the growth quality in Latin American industrialized countries is decoupling GDP growth from resource use. However, data concerning the green growth indicators for Mexico, Brazil, and Argentina reveal enormous difficulty in increasing demand-based CO2 productivity 74, as seen in Figure 5. Hickel and Kallis (2020) are skeptical about green growth, particularly for developing countries needing higher growth rates. They consider that green growth requires low GDP growth rates, less than one percent per year. Renewable materials yield lower emissions, as biofuels pollute less than fossil fuels. However, the relationship between resource use and environmental impact reveals the same trend, increasing with GDP growth. This poses an enormous challenge for Latin American countries because of the phenomenon of “time compression” (Whittaker et al., 2020). Developing country’s innovation and technology-intensive segments coexist with informal labor and low-skilled workers. Far from disappearing with economic growth, such coexistence becomes reinforced through an increasingly wide array of temporary and insecure jobs. Time compression condenses different stages of industrial and economic development within the same space and time, directly affecting the indicators related to the reduction of environmental impacts. Considering the need to reduce the global material footprint to 50 billion tons per year (Hickel & Kallis, 2020), the authors see no future in green growth given the urgency of climate change and argue for a radical decoupling between prosperity and development.
Beckert (2024) reminds us that advocates of green growth, on the other hand, promise that the mechanisms of the capitalist economy will reconcile growth and climate protection in the future. Very politically appealing to governments and businesses, the growth of ever-expanding capital becomes increasingly decarbonized with the help of innovative technologies and the consumption of fewer resources (Beckert, 2024). In essence, there is a higher value-added per ton of CO2 emitted. However, despite the political feasibility and adherence to the language of business, there are two significant problems with green growth, particularly for emerging countries: time and financial resources. The major Latin American economies are highly financialized, with financial activities as a source of profits in the economy (Krippner, 2011), and their investment rates are historically low to assure climate-neutral technologies in the following decades, demanding investments of billions of dollars. In addition, the diffusion of such technologies and products takes time, and timing is pressing in climate change issues.
Green technological diversification is crucial in promoting sustainable development, mainly through international linkages. Recent research indicates that countries can diversify into green technologies by leveraging co-inventor linkages with international partners. This approach is especially beneficial for catching up and following countries, which can utilize complementary linkages to build on their existing knowledge bases. The process is characterized by path-dependent diversification, where less complex and widely diffused green technologies are more accessible to these countries. At the same time, technological leaders focus on early-stage complex technologies. International cooperation is thus essential for catalyzing green innovation and achieving sustainable growth (Corrocher et al., 2023).
These findings are particularly relevant for Latin American countries, which often fall into catching-up or follower nations. The region faces significant challenges in balancing economic development with environmental sustainability. Latin American nations can tap into global green knowledge and technologies by fostering international collaborations and co-inventions, enhancing innovation capacities. Complementary linkages with technologically advanced countries can drive green diversification, helping to bridge technological gaps and support sustainable development goals. This strategy accelerates the green transition and integrates Latin American economies into global efforts to combat climate change.
2. The Challenges of Greening Latin American Countries
GHG emissions worldwide and in Latin America have increased almost uninterruptedly over the last 30 years. Although there is a direct relationship between economic and demographic growth and the increase in pollution for East and Southeast Asian countries (IEA, 2024), the same does not hold for Latin America. Growing emissions decoupling from economic growth presents a puzzle.
It is estimated that in 2021, 48.5 million gigagrams of GHG in carbon dioxide equivalent (CO2eq) were emitted globally, while, in the same year, the Latin American and Caribbean region emitted 3.2 million gigagrams of CO2 equivalent. Latin America’s GHG emissions correspond to 6.5% of the world’s (Gütschow et al.; M., 2023). In that order, Brazil, Mexico, and Argentina are the three most polluting economies in the Latin American and Caribbean region. Together, they emitted 2.18 million gigagrams of CO2 equivalent in 2021, which make up 66.7% of the entire region.
Figure 1.
Total Territorial Greenhouse Gas emissions in Brazil, Argentina, and Mexico.
Figure 1.
Total Territorial Greenhouse Gas emissions in Brazil, Argentina, and Mexico.
Argentina’s GHG emissions increased substantially by 71.58% between 1970 and 2022. However, this growth is surpassed by the dramatic rises observed in Mexico (276.13%) and Brazil (258.78%) during the same timeframe. Notably, despite experiencing a proportionally more significant increase in emissions, Brazil has consistently held the position of the highest total emitter amongst the three South American nations throughout this period.
Agriculture, livestock, and waste are mainly responsible for methane (CH4) and nitrous oxide (N2O) emissions, while carbon dioxide (CO2) is produced in activities that involve the use of fuels, such as industrial manufacturing processes, transportation, electricity generation, and fossil fuel exploitation.
Argentina’s GHG emissions increased by 71.58% between 1970 and 2022. However, this growth is surpassed by the dramatic rise observed in Mexico (276.13%) and Brazil (258.78%) during the same period. Notably, despite experiencing a proportionally more significant increase in emissions, Brazil has consistently held the position of the highest total emitter amongst the three South American nations throughout this period.
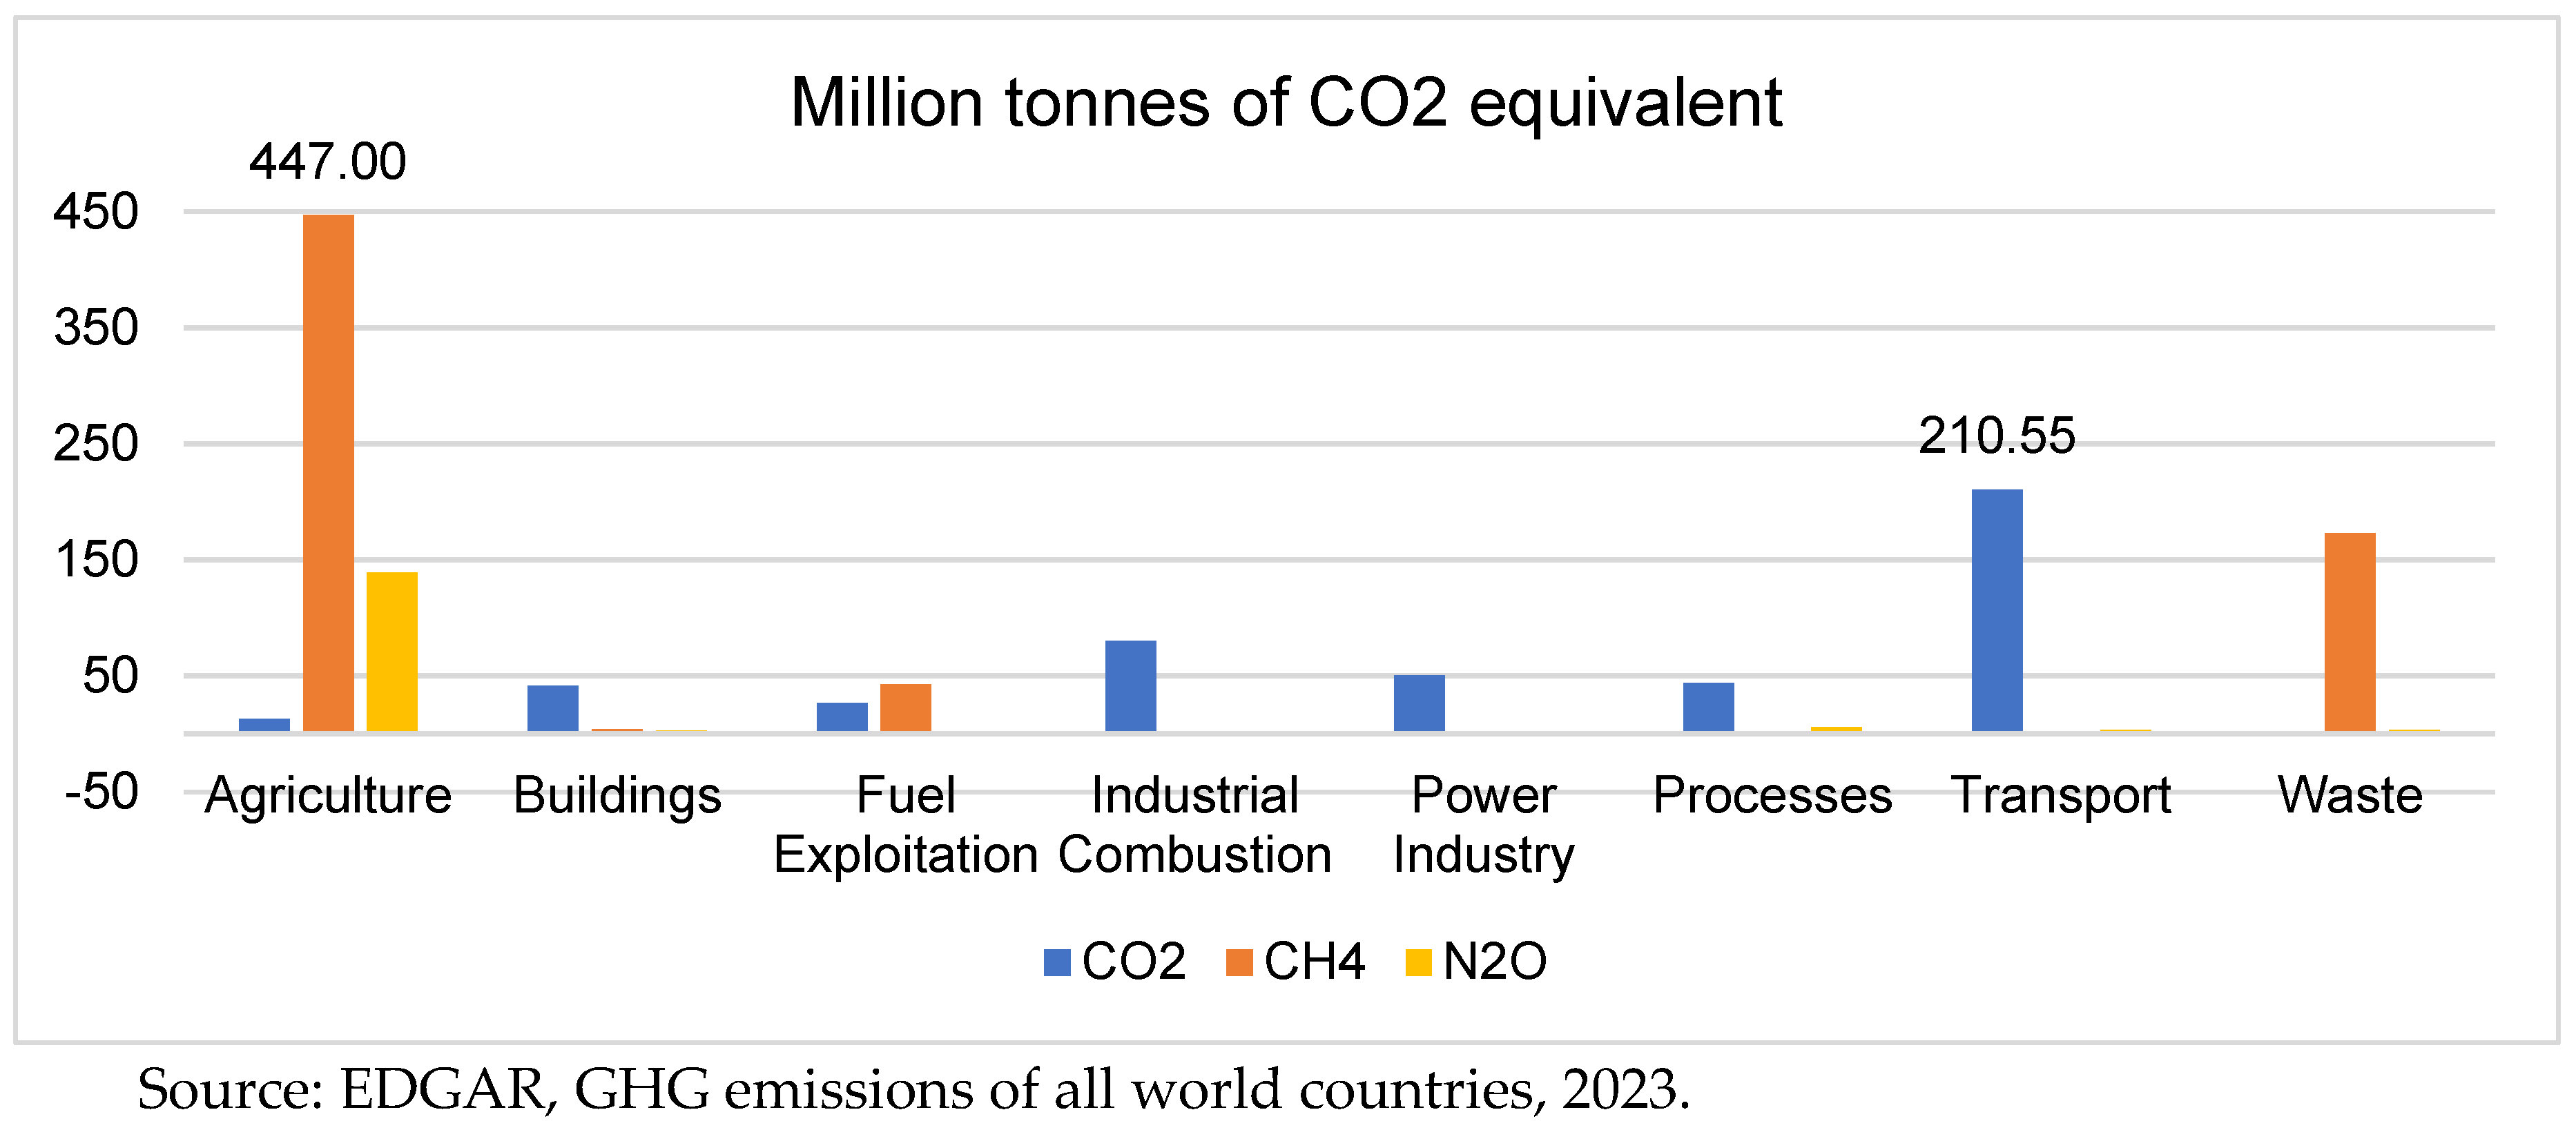
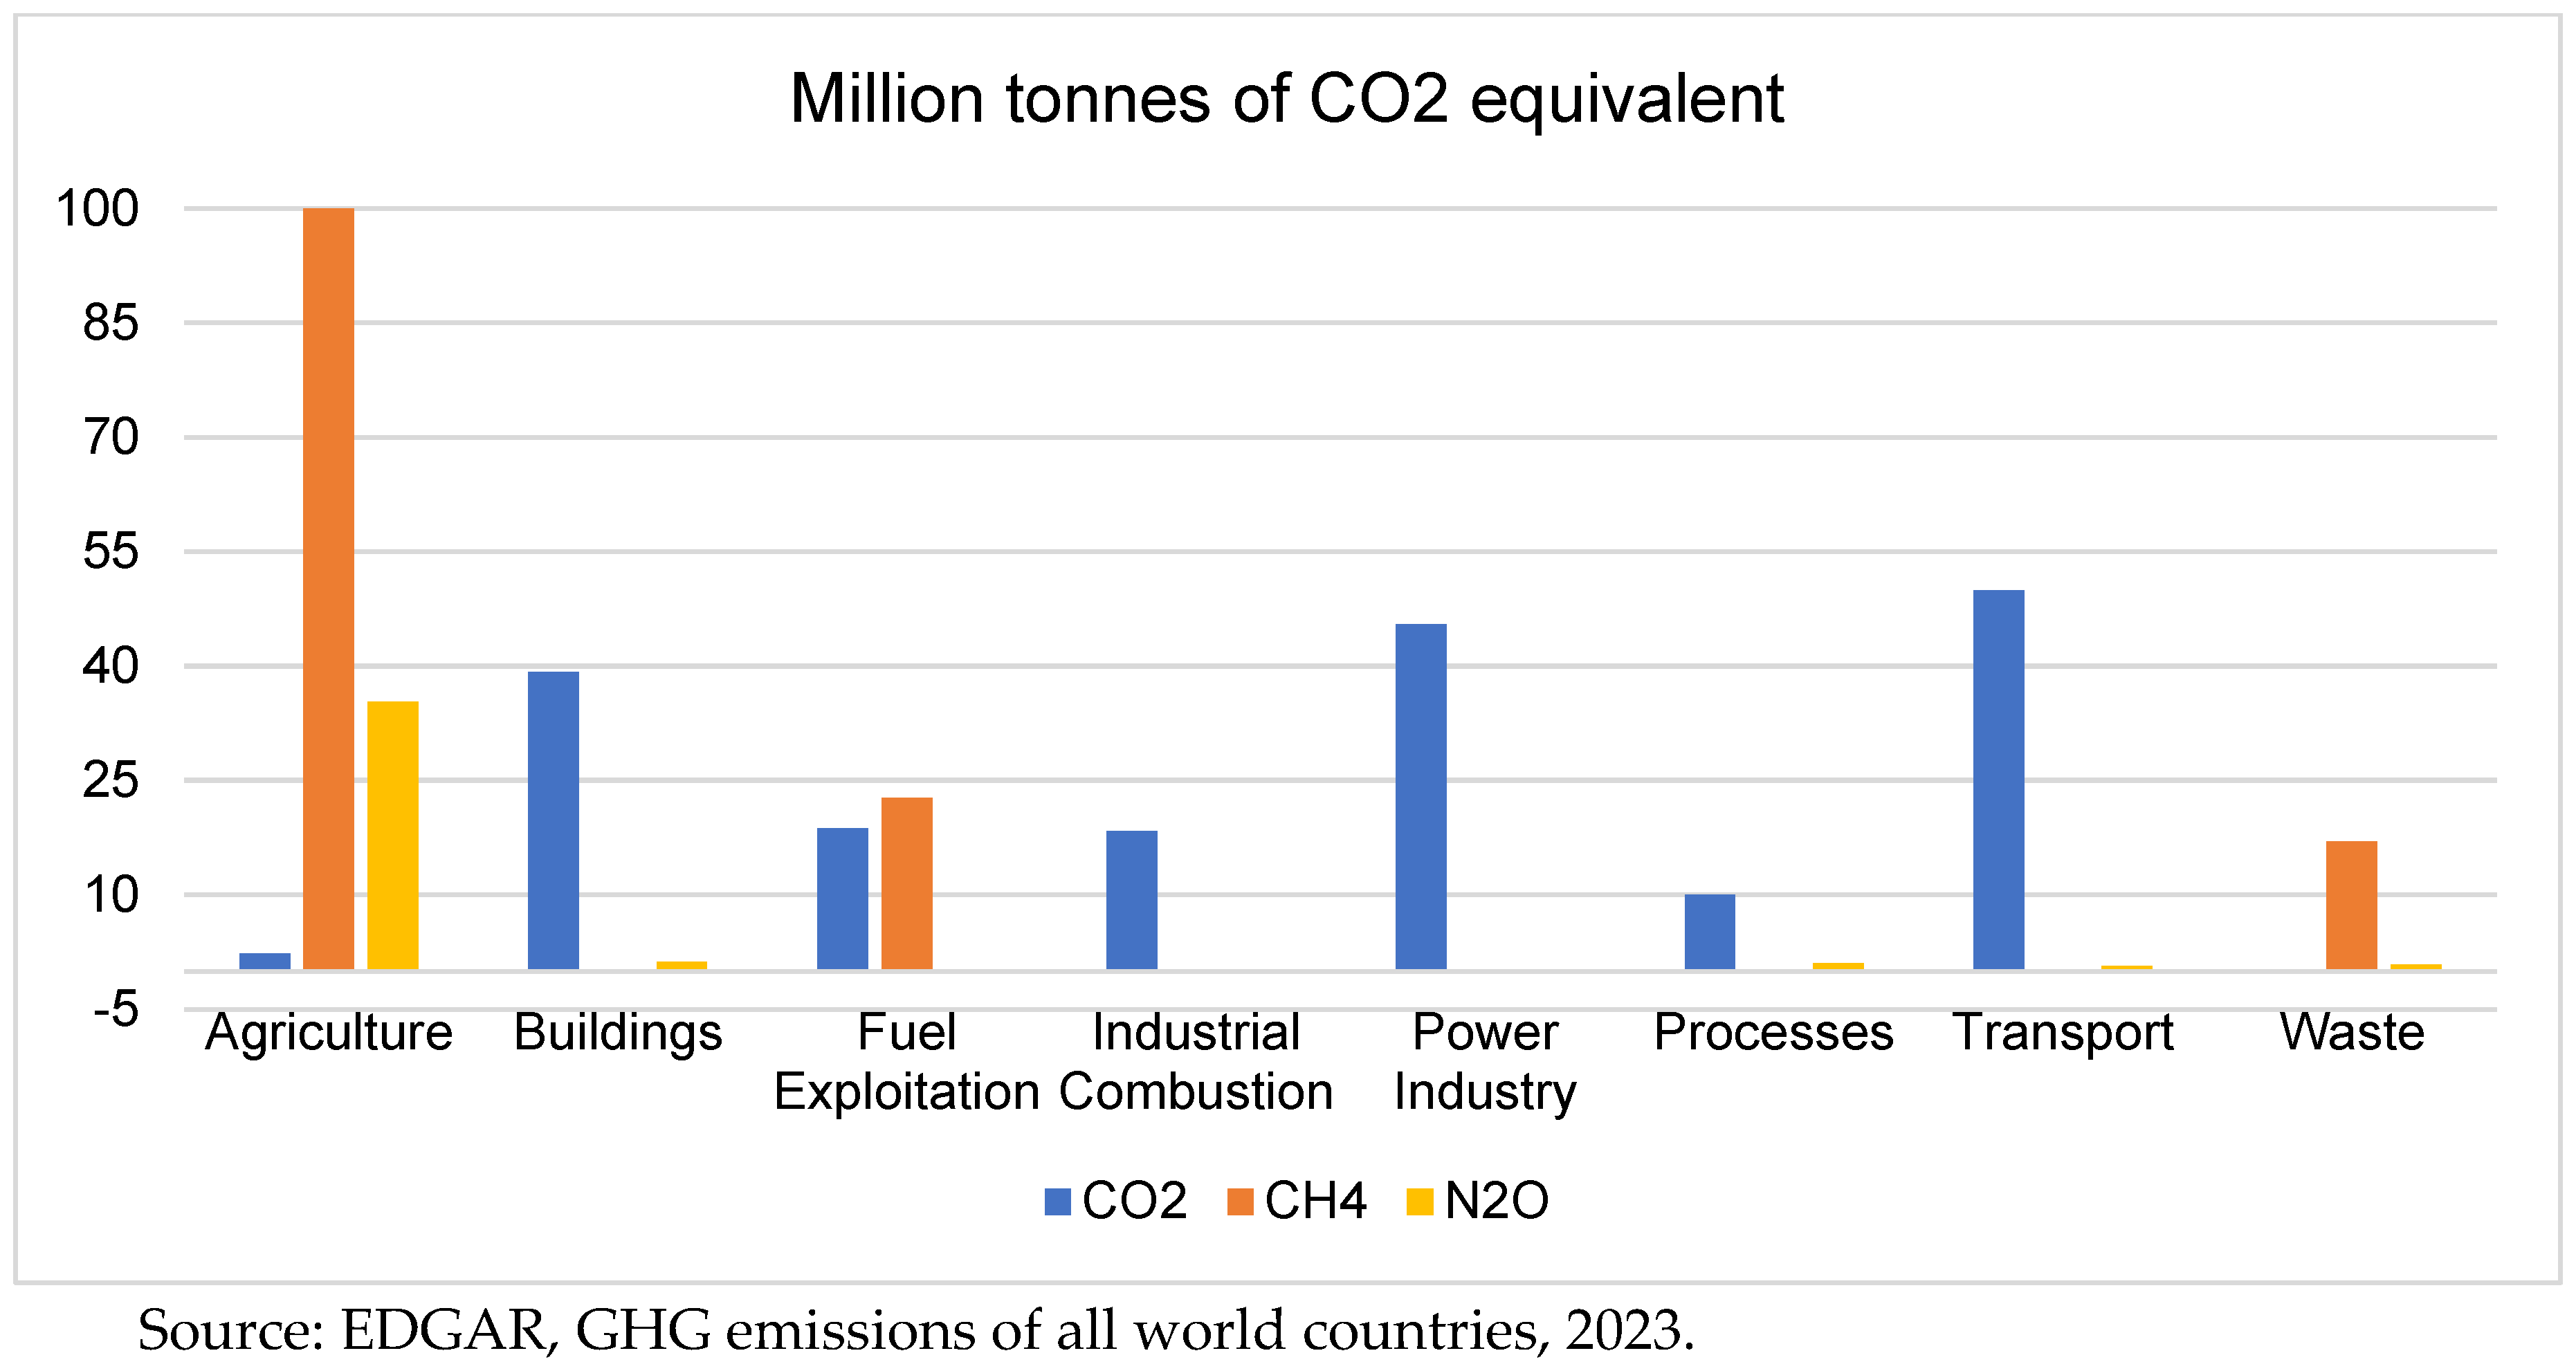
In 2022, the most polluting sector of the Brazilian economy was agriculture, which generated 447 million tons of CH4 measured in CO2 equivalent, double the amount generated by the second most polluting sector, transportation, which generated 210 million tons of CO2 equivalent. Similarly, in Argentina, agriculture emitted 104 million tons of CH4 in CO2 equivalent, becoming the most pollutant sector of the economy.
Notably, Brazil stands out as the largest polluter in Latin America, primarily due to its extensive agricultural sector, emitting a staggering 447 million tons of methane in CO2 equivalent in 2022. We observed relative stability in the emission profiles of Brazil and Argentina, suggesting that the dominant sources of emissions have remained consistent despite overall economic growth. These findings highlight the agricultural sector’s crucial role in shaping these countries’ GHG emission profiles and underscore the need for targeted mitigation strategies to achieve sustainable development goals.
Figure 2.
Brazil: GHG emissions by source. 2022.
Figure 2.
Brazil: GHG emissions by source. 2022.
Figure 3.
Argentina: GHG emissions by source, 2022.
Figure 3.
Argentina: GHG emissions by source, 2022.
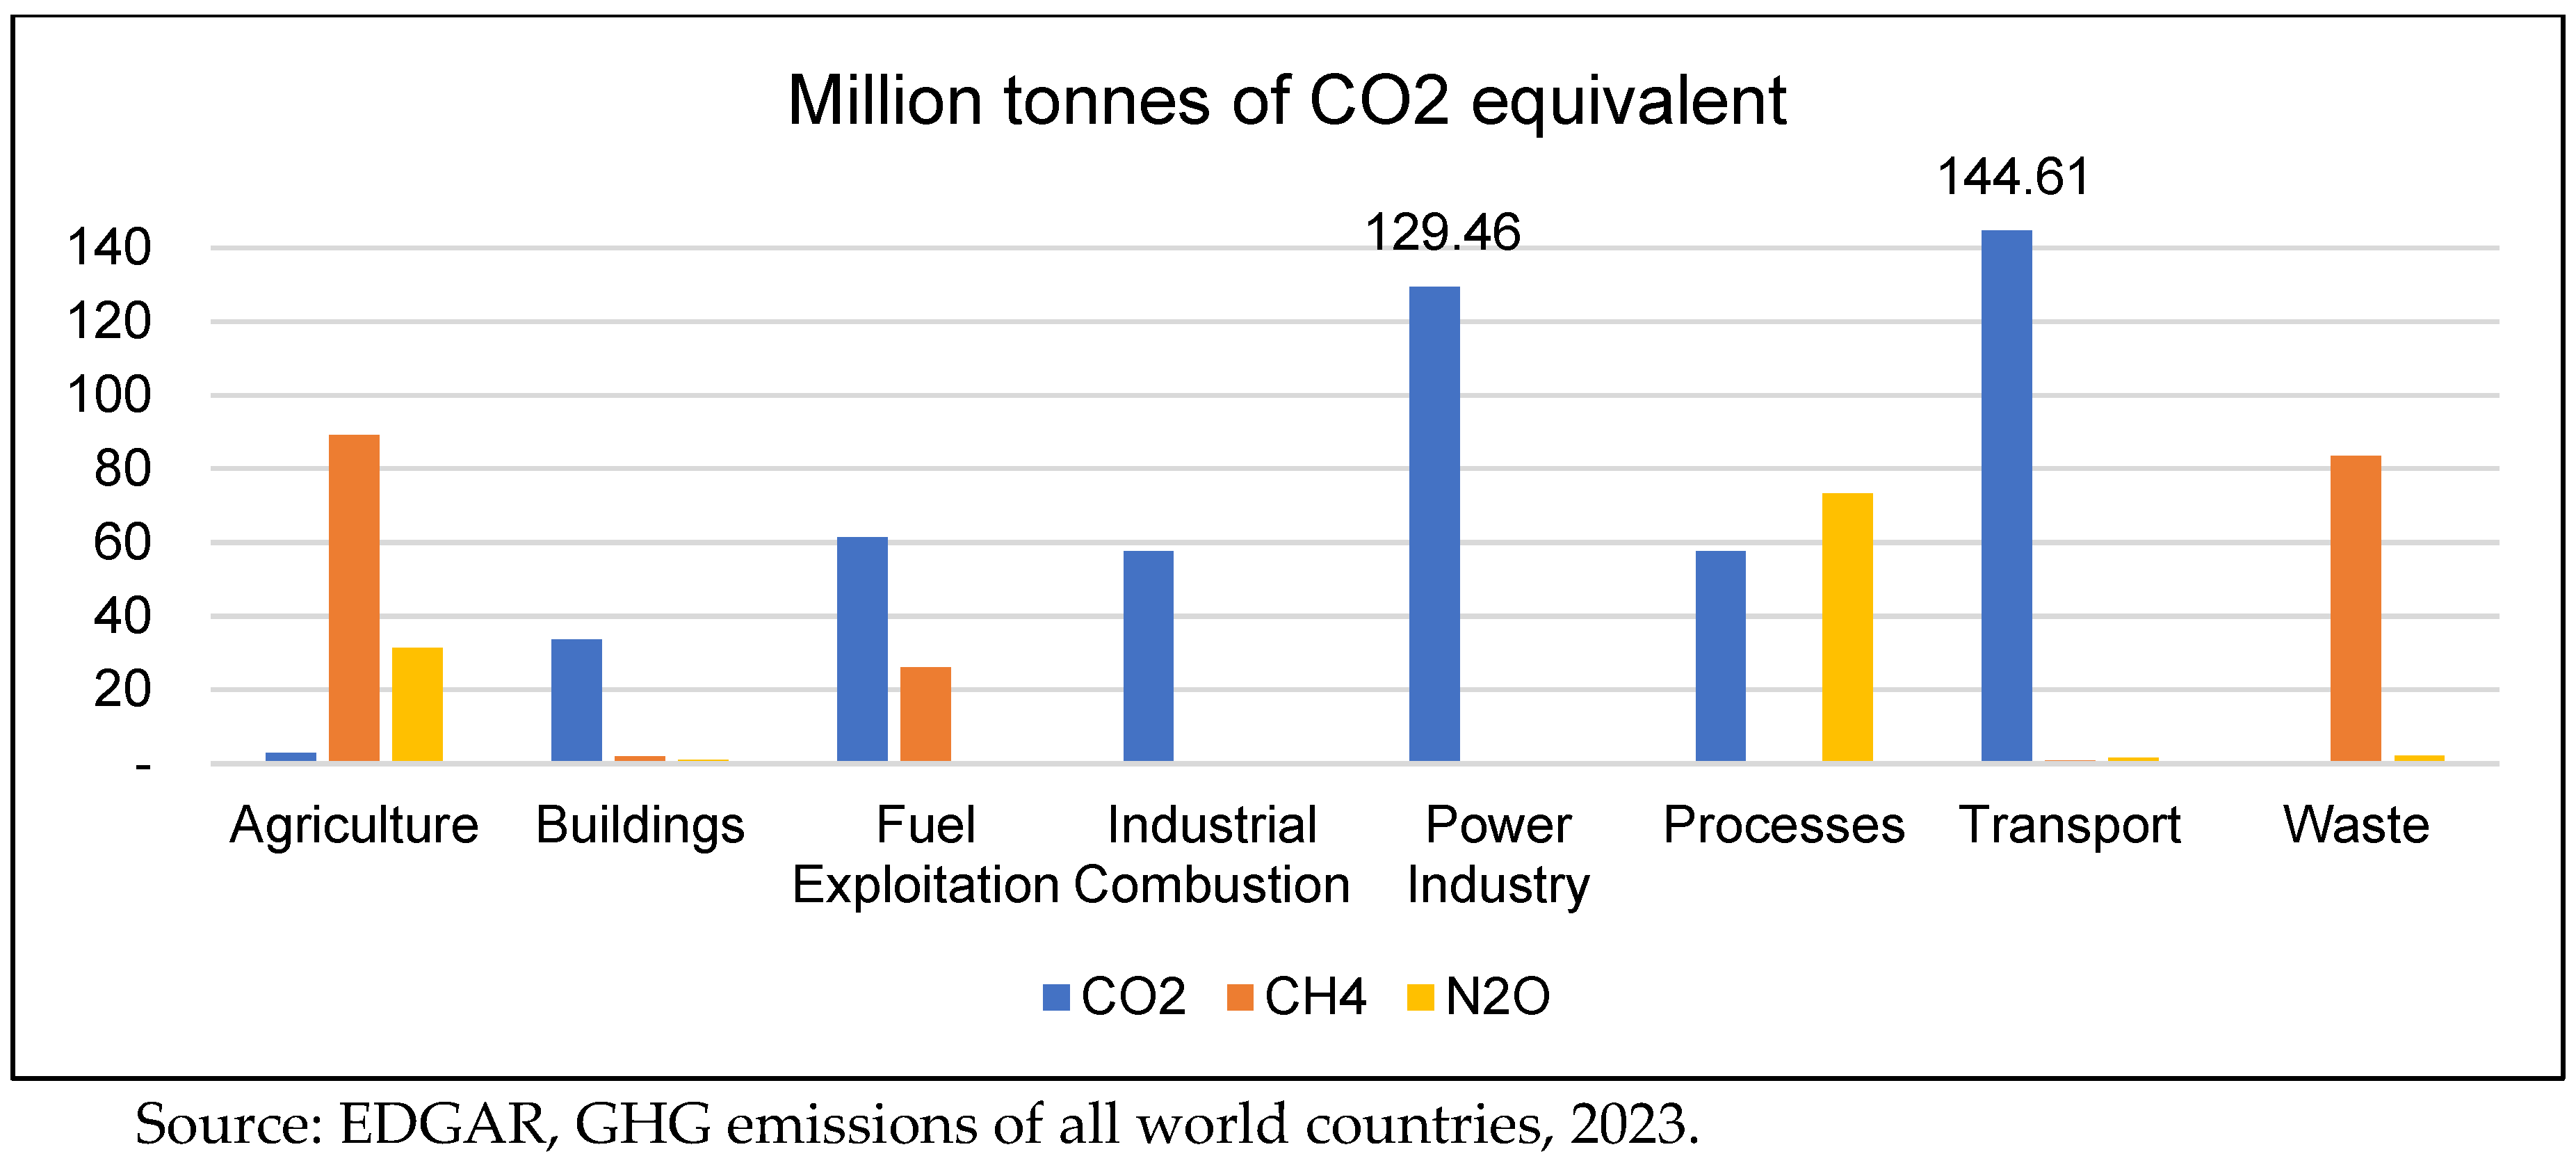
Compared to other countries, Mexico’s diverse economy leads to a more balanced distribution of (GHG) emissions across different gas types and sources. By 2022, the largest share comes from fuel combustion in the transport sector, with 144 million tons of CO2, followed by 129 million tons from electricity generation. Though slightly less, fuel exploitation and industrial processes also contribute 61 and 57 million tons, respectively. (Crippa et al., 2023 & EDGAR, 2023).
Figure 4.
Mexico: GHG emissions by source, 2022.
Figure 4.
Mexico: GHG emissions by source, 2022.
Two key indicators are crucial for understanding the challenge of greening production by decoupling from GHG emissions: Environmentally Adjusted Multifactor Productivity (EAMFP) Growth and Demand-Based CO2 Productivity. EAMFP growth measures productivity changes considering technological advancements and resource efficiency, reflecting an economy’s growth ability while reducing environmental impacts. Demand-based CO2 productivity calculates GDP per unit of CO2 emissions from final demand, indicating how efficiently an economy generates economic output relative to its carbon footprint. Both indicators are essential for assessing the progress of decoupling economic growth from greenhouse gas emissions in Latin American countries.
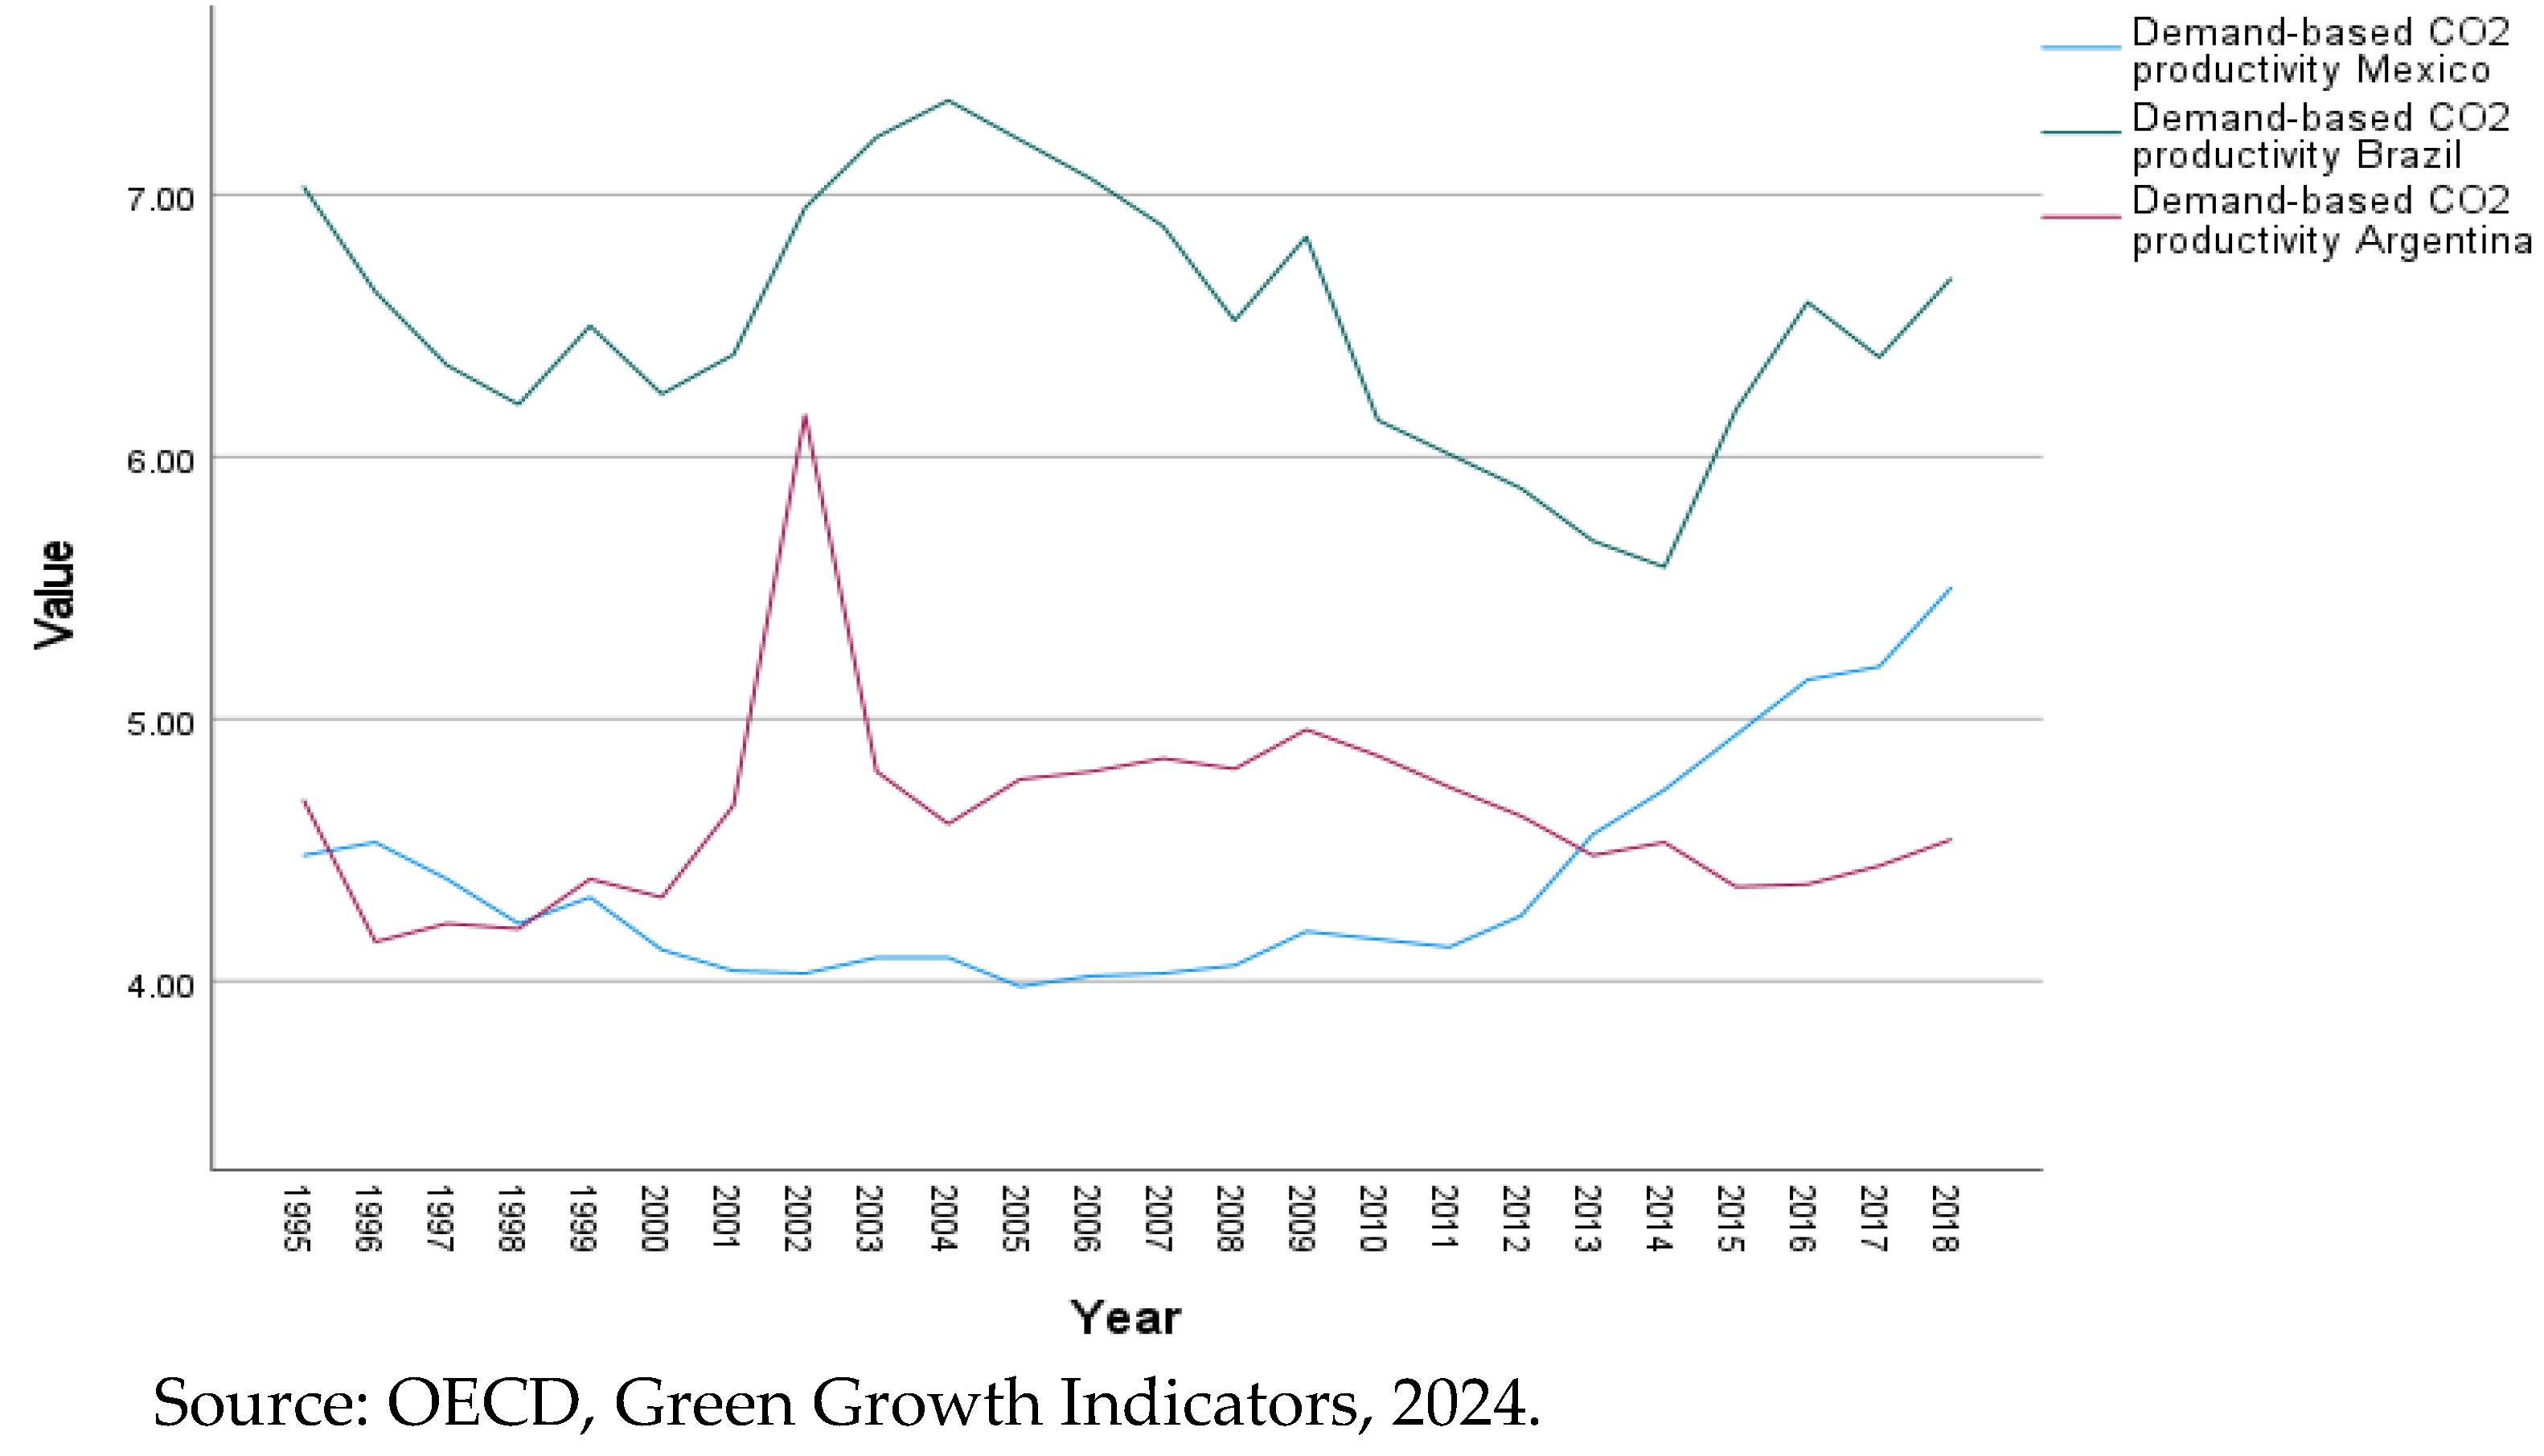
Data concerning the green growth indicators for Mexico, Brazil, and Argentina reveal significant challenges in increasing demand-based CO2 productivity and EAMFP. As illustrated in Figure 5, throughout the observed period, Brazil consistently shows the highest values of CO2 productivity, with notable fluctuations, peaking around 2004 and showing an overall decline after that, mainly due to its high investments in renewable energy. Argentina’s CO2 productivity displays significant volatility, particularly with a sharp spike in 2002, likely reflecting the economic crisis and subsequent recovery efforts. Mexico’s CO2 productivity gradually increases over time, starting from a lower base compared to Brazil but showing steady improvement, especially in the latter years of the period.
Figure 5.
CO2-related productivity rates, 1995 to 2018.
Figure 5.
CO2-related productivity rates, 1995 to 2018.
As shown in Figure 3, Brazil’s EAMFP shows significant volatility with periods of high positive growth, particularly around 1992, 1995, and 2010, but also experiences sharp declines, such as in 2009. Mexico displays a more stable yet lower EAMFP growth, with occasional negative growth periods, notably in 1995 and 2008. Argentina exhibits the most considerable fluctuations, with extreme growth peaks in 1993 and 2010 and severe drops, particularly around 2002 and 2008 (Figure 6).
The observed trends in EAMFP indicate Brazil’s volatility might be linked to its economic cycles and fluctuating investments in green technologies and infrastructure. Mexico’s relative stability but lower growth could suggest steady but slow progress in implementing technological and institutional improvements. Argentina’s extreme fluctuations likely reflect its economic instability, with periods of crisis impacting productivity and environmental policies.
Figure 6.
Brazil, Argentina, and Mexico. Environmentally adjusted multifactor growth productivity (EAMFP) from 1991 to 2013.
Figure 6.
Brazil, Argentina, and Mexico. Environmentally adjusted multifactor growth productivity (EAMFP) from 1991 to 2013.
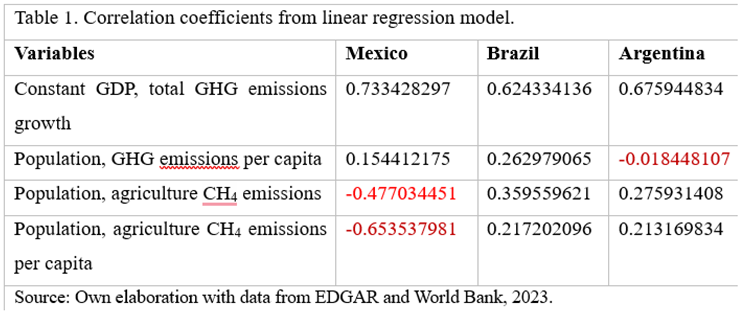
The correlation between the population growth rate and emissions in Latin America is complex. It is inaccurate to say that emissions grow as the population or gross domestic product grows. An intriguing pattern appears when examining the relationship between population growth and agricultural CH4 emissions in Latin America. We examine the correlation between population growth and GHG emissions per capita to establish the relationship between these variables.
Population growth and agriculture methane emissions do not have a simple linear relationship. The population grew by 42.87% in 2022 compared to 1990, while agricultural methane emissions rose by 69.57% in that same period. An intriguing pattern appears when examining the relationship between population growth and Latin America’s agricultural methane (CH4) emissions. Following Table, Brazil and Argentina show a weak positive correlation, suggesting that population increase vaguely coincides with a rise in CH4 emissions from agriculture. It could be attributed to agricultural expansion for food production, potentially involving land-use change that releases methane from decomposing organic matter. Additionally, traditional practices like cattle ranching, prevalent in these regions, are known for high CH4 emissions.
The significant role of agricultural exports adds another layer of complexity. Raising more cattle or intensifying agricultural practices to meet this export demand could disproportionately impact methane emissions compared to feeding the domestic population. Even if domestic consumption does not rise proportionally with population growth, the demand for increased agricultural production to meet export demands could be a significant driver of methane emissions.
 |
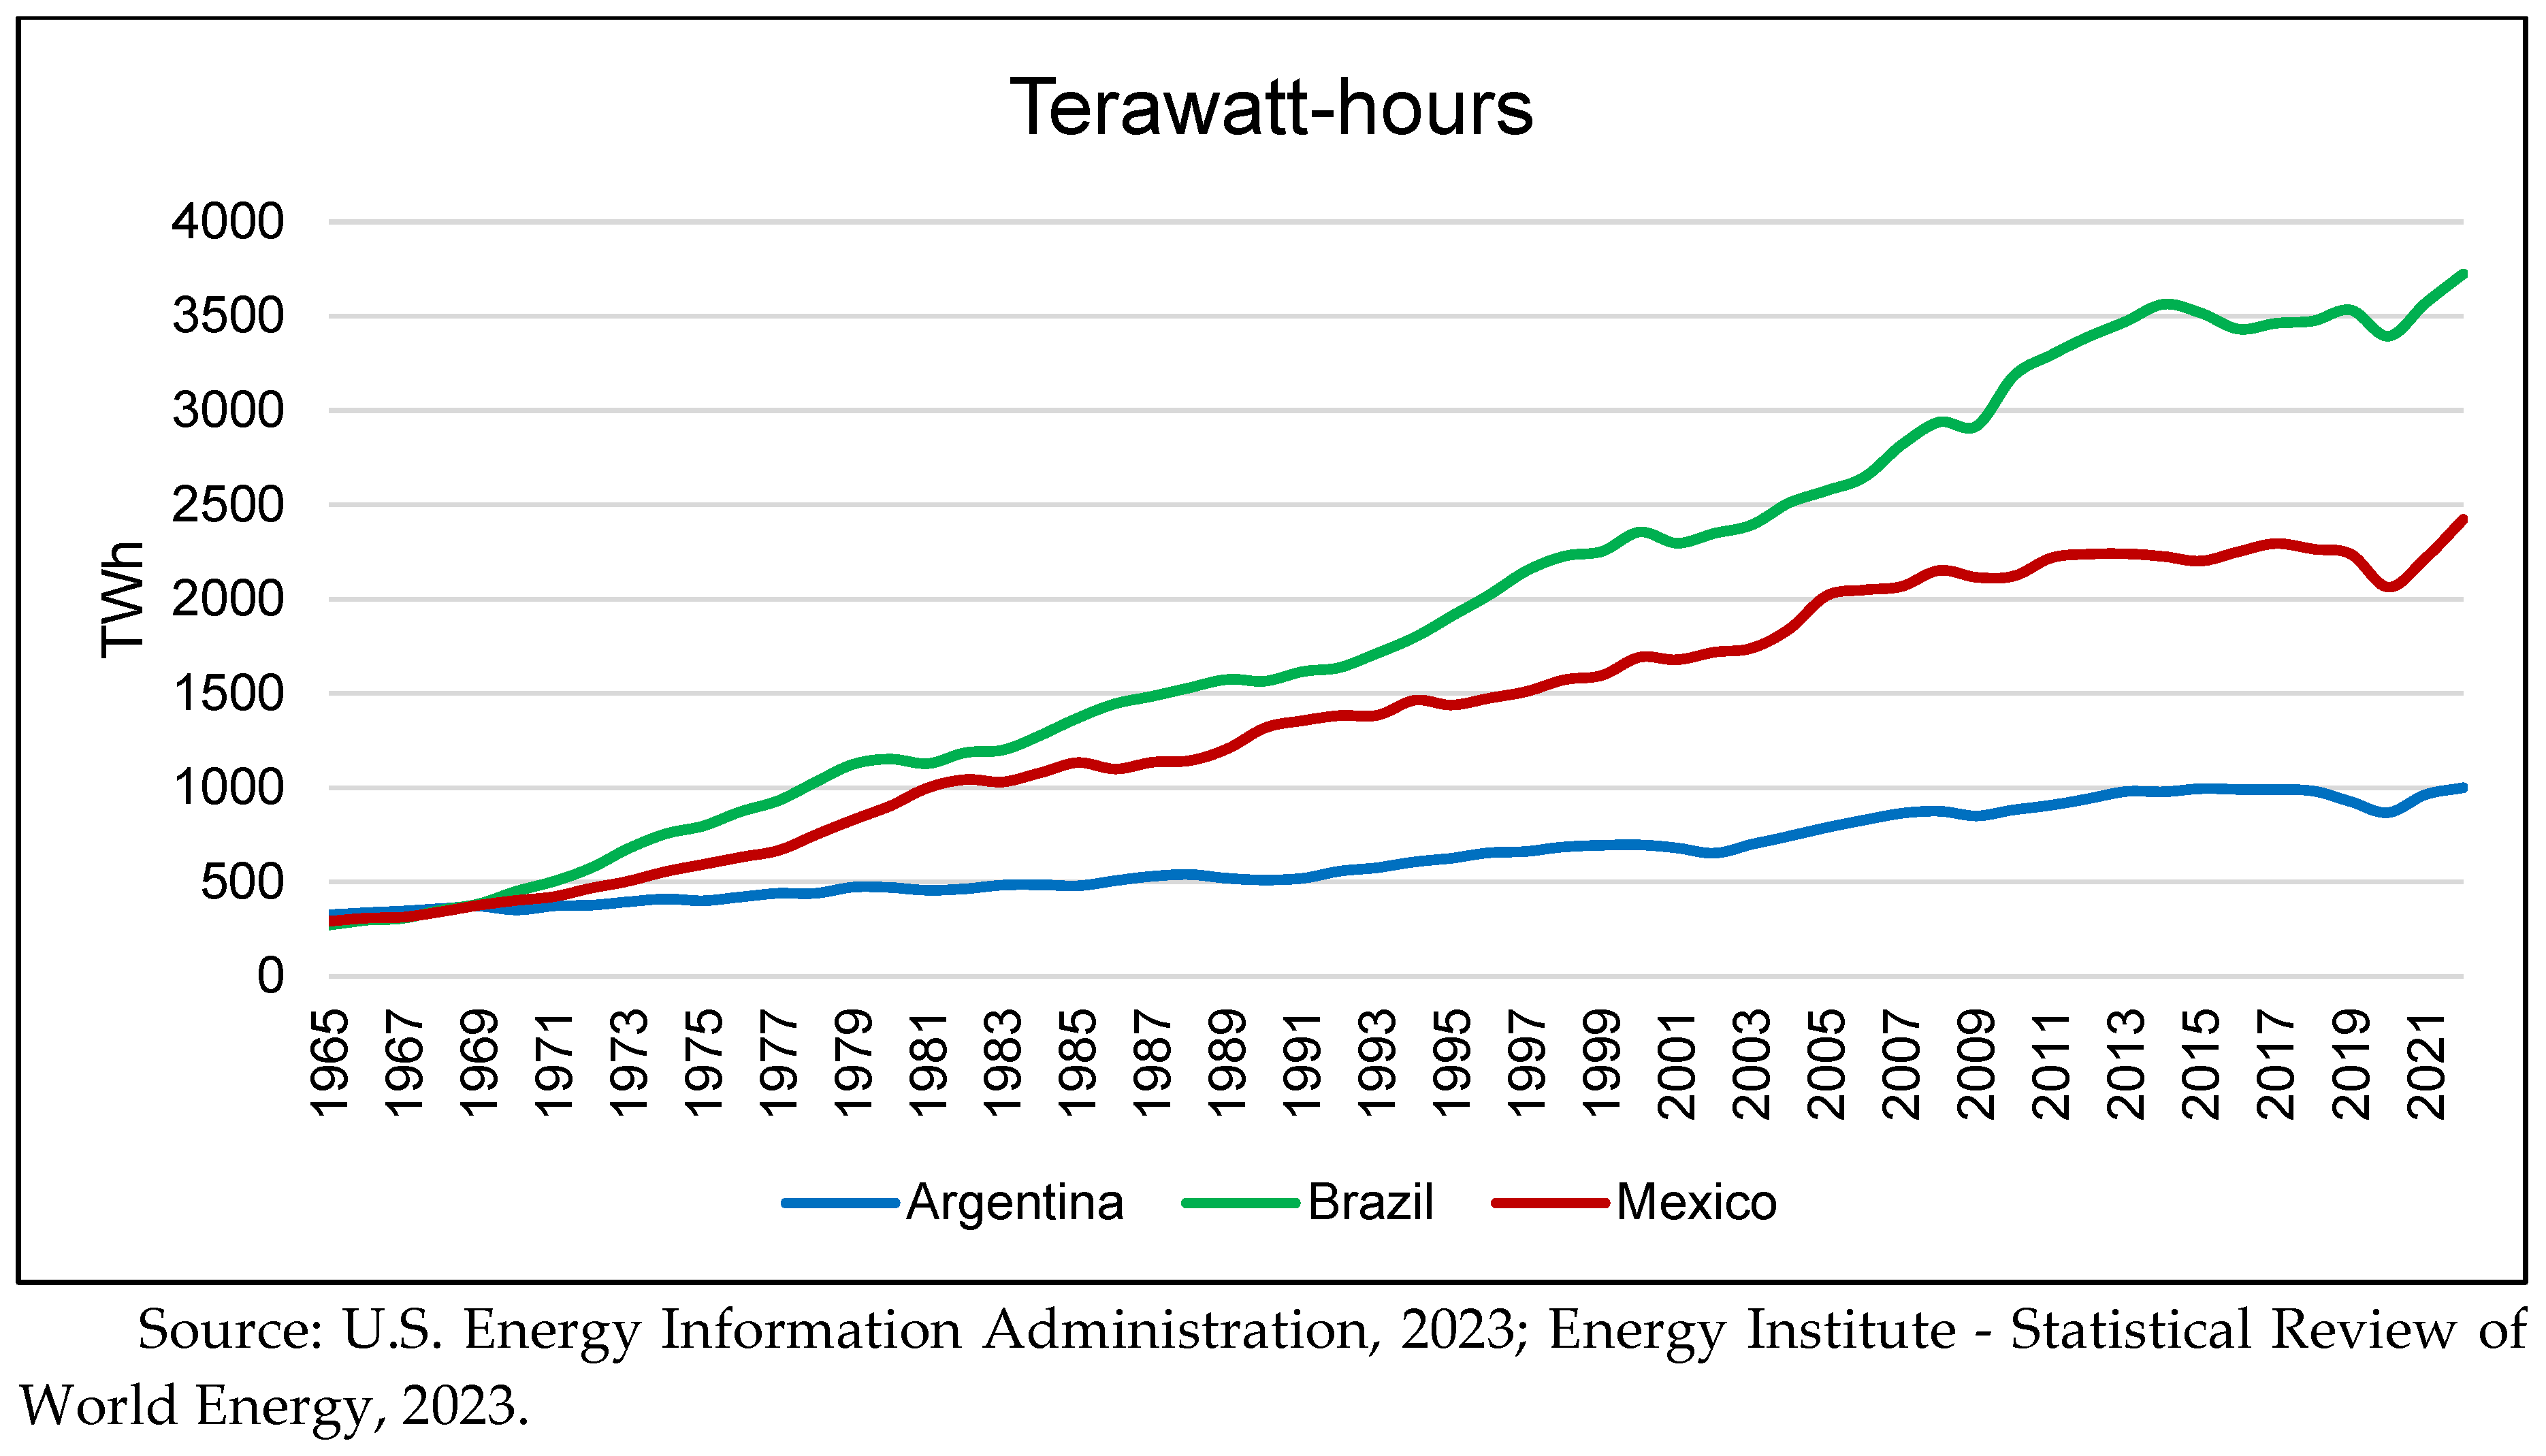
The energy consumption and intensity profiles of Argentina, Brazil, and Mexico have distinct trajectories, which are critical to understanding the challenges and opportunities for an energy transition in these countries. Figure 7 displays the primary energy consumption from 1965 to 2021, revealing that Brazil has experienced the most substantial growth in energy use, surpassing 3500 terawatt-hours (TWh) by 2022. This continuous increase reflects Brazil’s expanding industrial base and population, which drives higher energy demands. Mexico follows with a significant but slower rise, reaching around 2423 TWh. In contrast, Argentina’s energy consumption has grown more modestly, stabilizing at approximately 100 TWh in 2013.
Figure 7.
Argentina, Brazil, and Mexico: Primary Energy Consumption.
Figure 7.
Argentina, Brazil, and Mexico: Primary Energy Consumption.
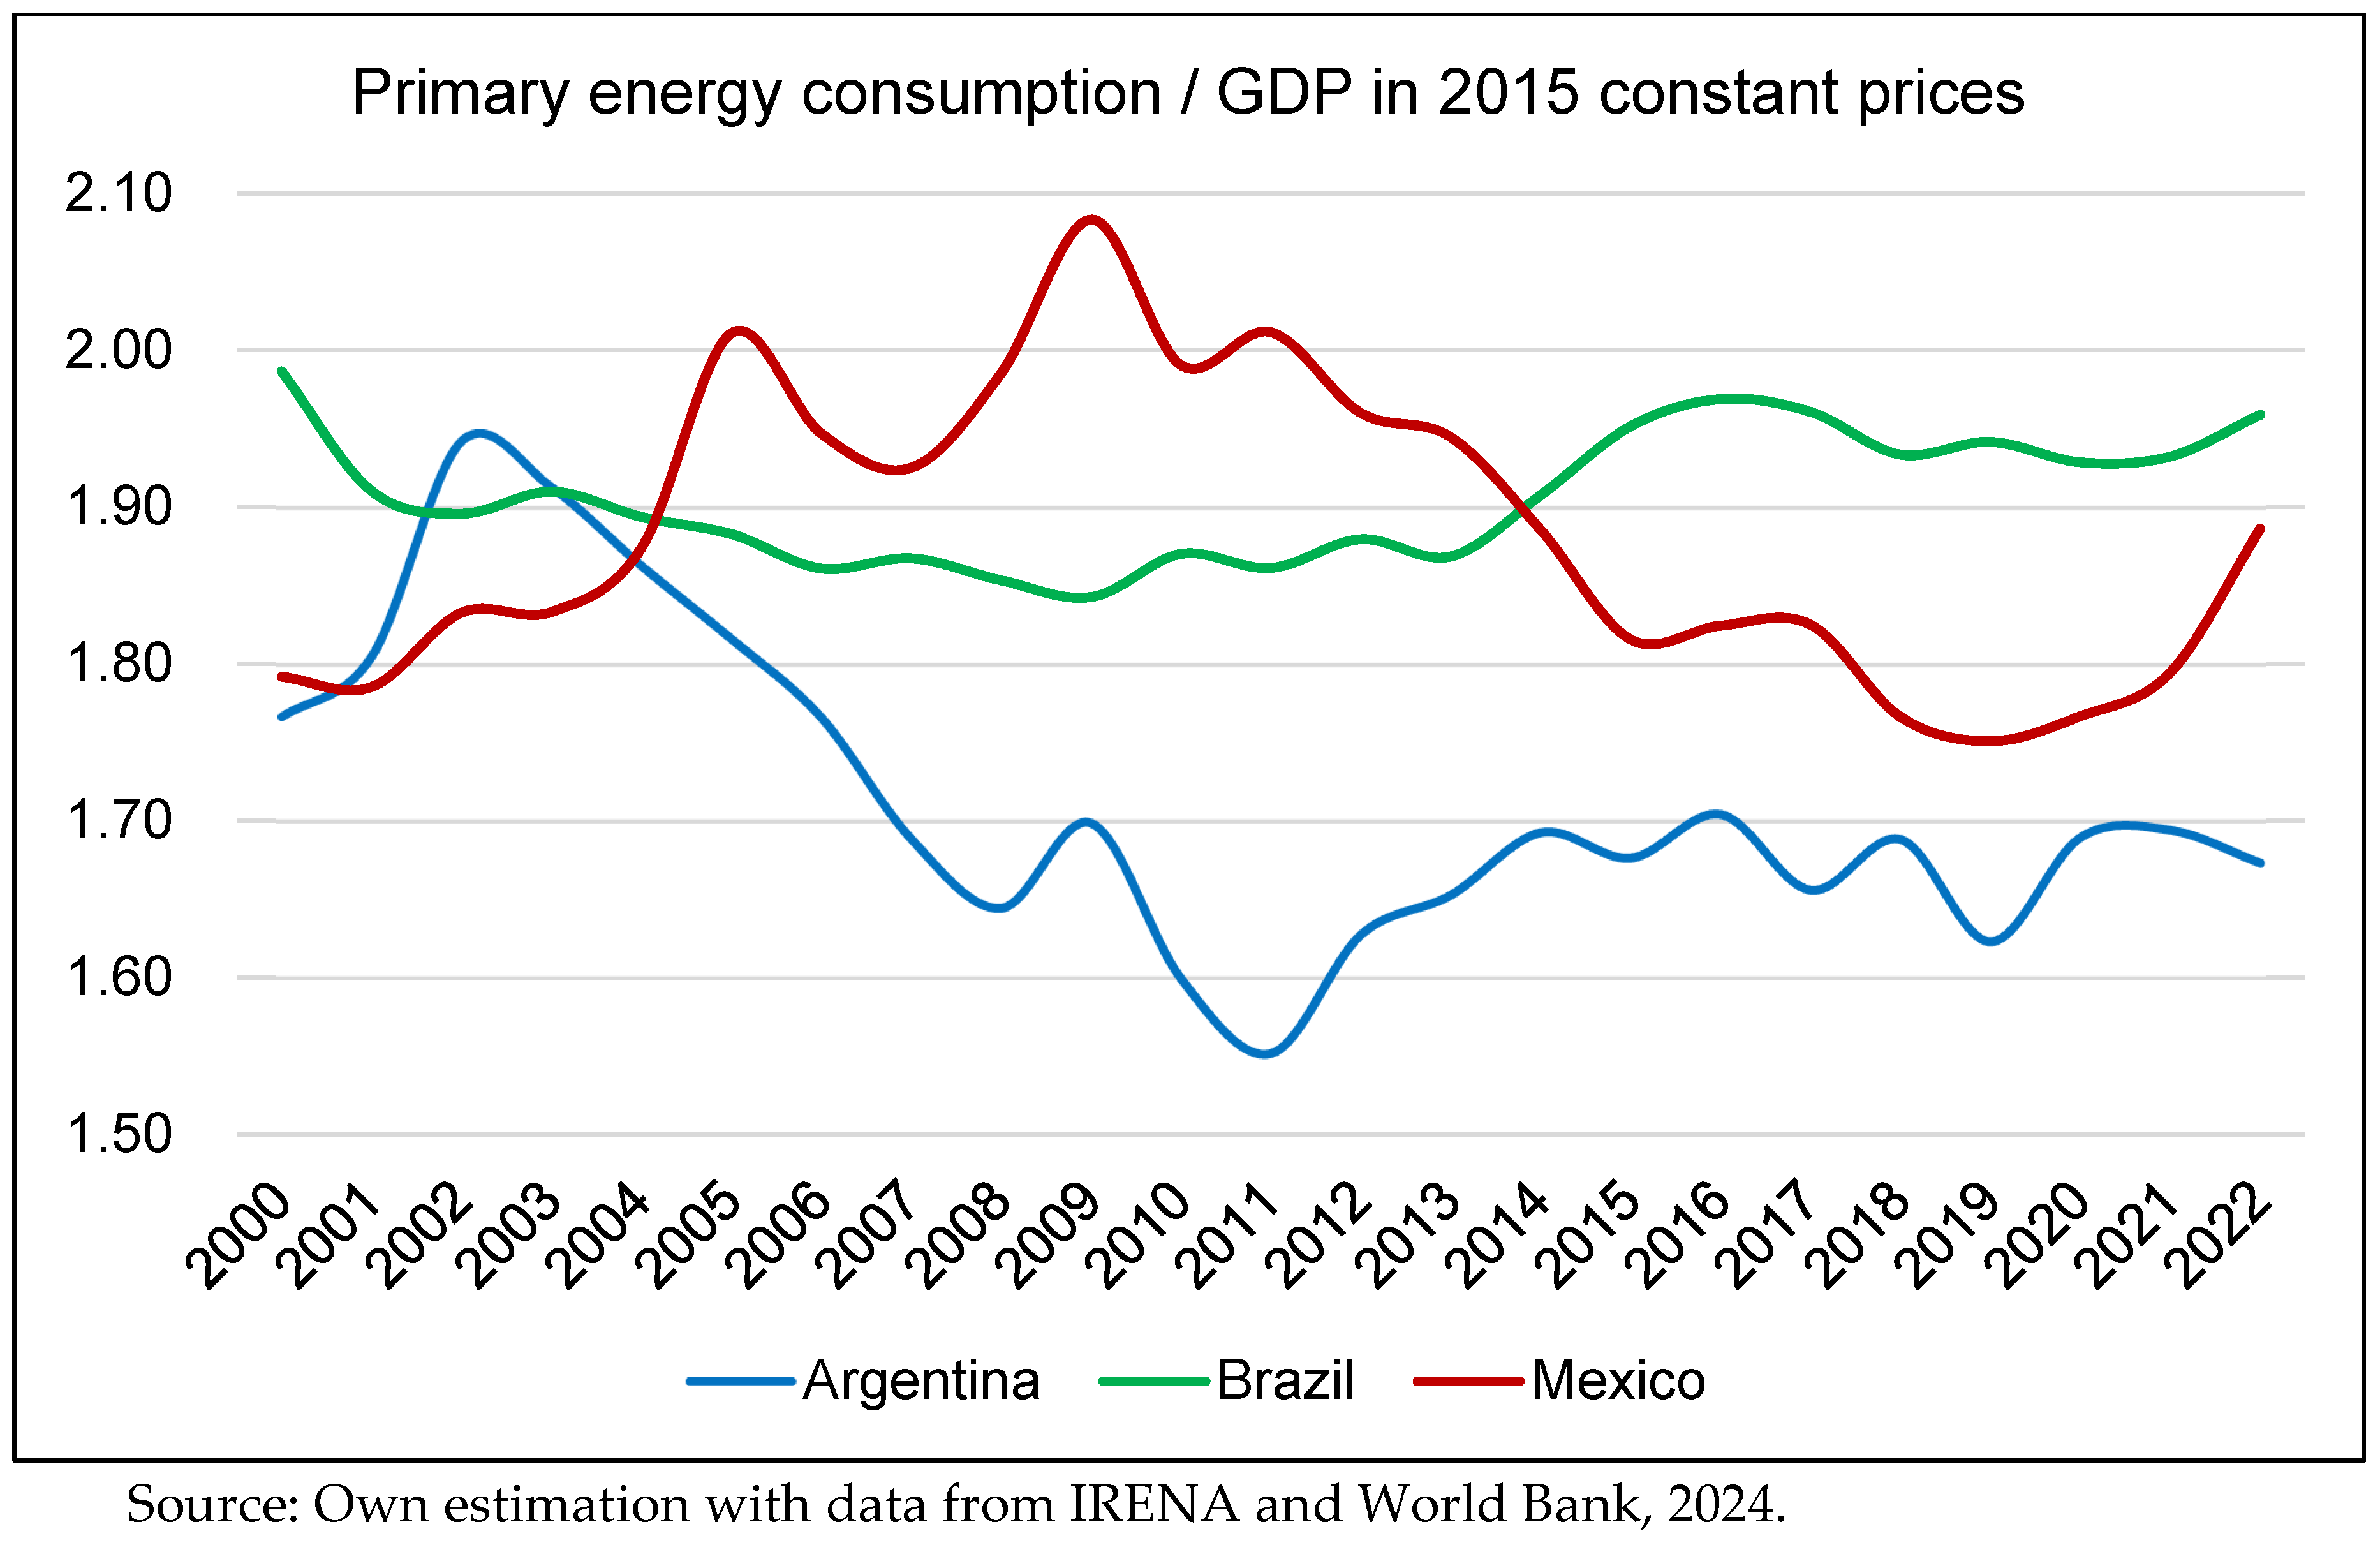
Figure 8 illustrates GDP energy intensity (measured as primary energy consumption per unit of GDP in 2015 prices) from 2000 to 2022. This indicator provides insight into how efficiently each country uses energy to generate economic output. Argentina shows a declining trend in energy intensity, indicating improvements in energy efficiency and a potential shift towards less energy-intensive economic activities. Brazil’s energy intensity remains relatively stable, with some fluctuations, suggesting a balance between economic growth and energy consumption efficiency. Mexico’s energy intensity has varied over the years but tends to stabilize around the 1.90 mark, indicating ongoing efforts to improve energy efficiency.
Figure 8.
Argentina, Brazil and Mexico: GDP energy intensity, 2000 to 2022.
Figure 8.
Argentina, Brazil and Mexico: GDP energy intensity, 2000 to 2022.
The trends in energy consumption highlight the varied stages of energy development and efficiency across the three countries, which have significant implications for their energy transition strategies. Brazil’s high and increasing energy consumption suggests that transitioning to renewable energy sources will be crucial to sustainably meeting its growing energy demand. However, the stable energy intensity indicates that Brazil has some existing efficiency measures that could be optimistically scaled up, offering a promising path for its energy transition.
Mexico’s moderate energy consumption growth and fluctuating energy intensity reflect opportunities and challenges. The country must urgently enhance its energy efficiency efforts and expand renewable energy adoption to reduce its carbon footprint while supporting economic growth, emphasizing the need for a delicate balance between the two.
3. Greening Trade and Industrial Development
Theoretically, industrial development is linked to the more recent green transition debates. As Lee (2024) argues, industrial policy must include the pressing concerns of environmental degradation and sustainable development. In addition, a neo-Schumpeterian approach to industrial policy underlines the need to build capabilities (Lee, 2024). Industrial development goes hand in hand with environmental issues such as the UN’s Sustainable Development Goals (Bianchi et al., 2023). To the poly-crisis concept, industrial development faces a more complex scenario than in the Twentieth Century, and it implies policies addressing industrial development that coherently contribute to the socioeconomic system, preferably sustainably (Bianchi et al., 2023). In addition, the innovation intensity for sustainability is more demanding, with more radical innovations being called for and a large-scale diffusion of such innovations, especially for developing countries (Mazzanti & Zecca, 2023), underscoring the gravity of the need for sustainable industrial policies.
Except for Mexico, both Brazil and Argentina have been undergoing premature deindustrialization (ECLAC, 2016). Brazil took advantage of the commodity boom in the first decades of the XXI century with rising exports of grains, iron ore, and cattle. Meanwhile, Mexico adopted an economic growth model based on the free trade of manufactured goods with North America. These conditions have created an economic structure that makes it difficult to reduce emissions, decouple growth from resource use, and adopt renewable energy sources.
The type of insertion of Latin American economies into international trade differs radically by country. Brazil and Argentina mainly export raw materials and agricultural products, while Mexico mainly exports manufactured and capital goods. Mexico and Brazil, Latin America’s biggest and most industrialized economies, produce the highest GHG emissions. However, their export specialization directly affects the size of their carbon footprint and their industrial and environmental policy capacity to achieve the green transition.
In Brazil and Mexico, the size of CO2 emissions associated with combustion processes, whether in transportation or industry, are similar. However, agricultural emissions are disproportionate to the case of Brazil. Therefore, the proportion and type of pollutants that each country emits territorially and the emissions incorporated into their exports differ depending on their economic structure and specialization.
Mexico mainly exports products from machinery and electricity, transport, fuels, metals, food products, products of the plant kingdom, plastic or rubber, stones and glass, and chemicals. In 2021, Mexican exports amounted to 494 billion dollars, making it the Latin American economy with the highest value in exports to the rest of the world (UN, COMTRADE, 2024.).
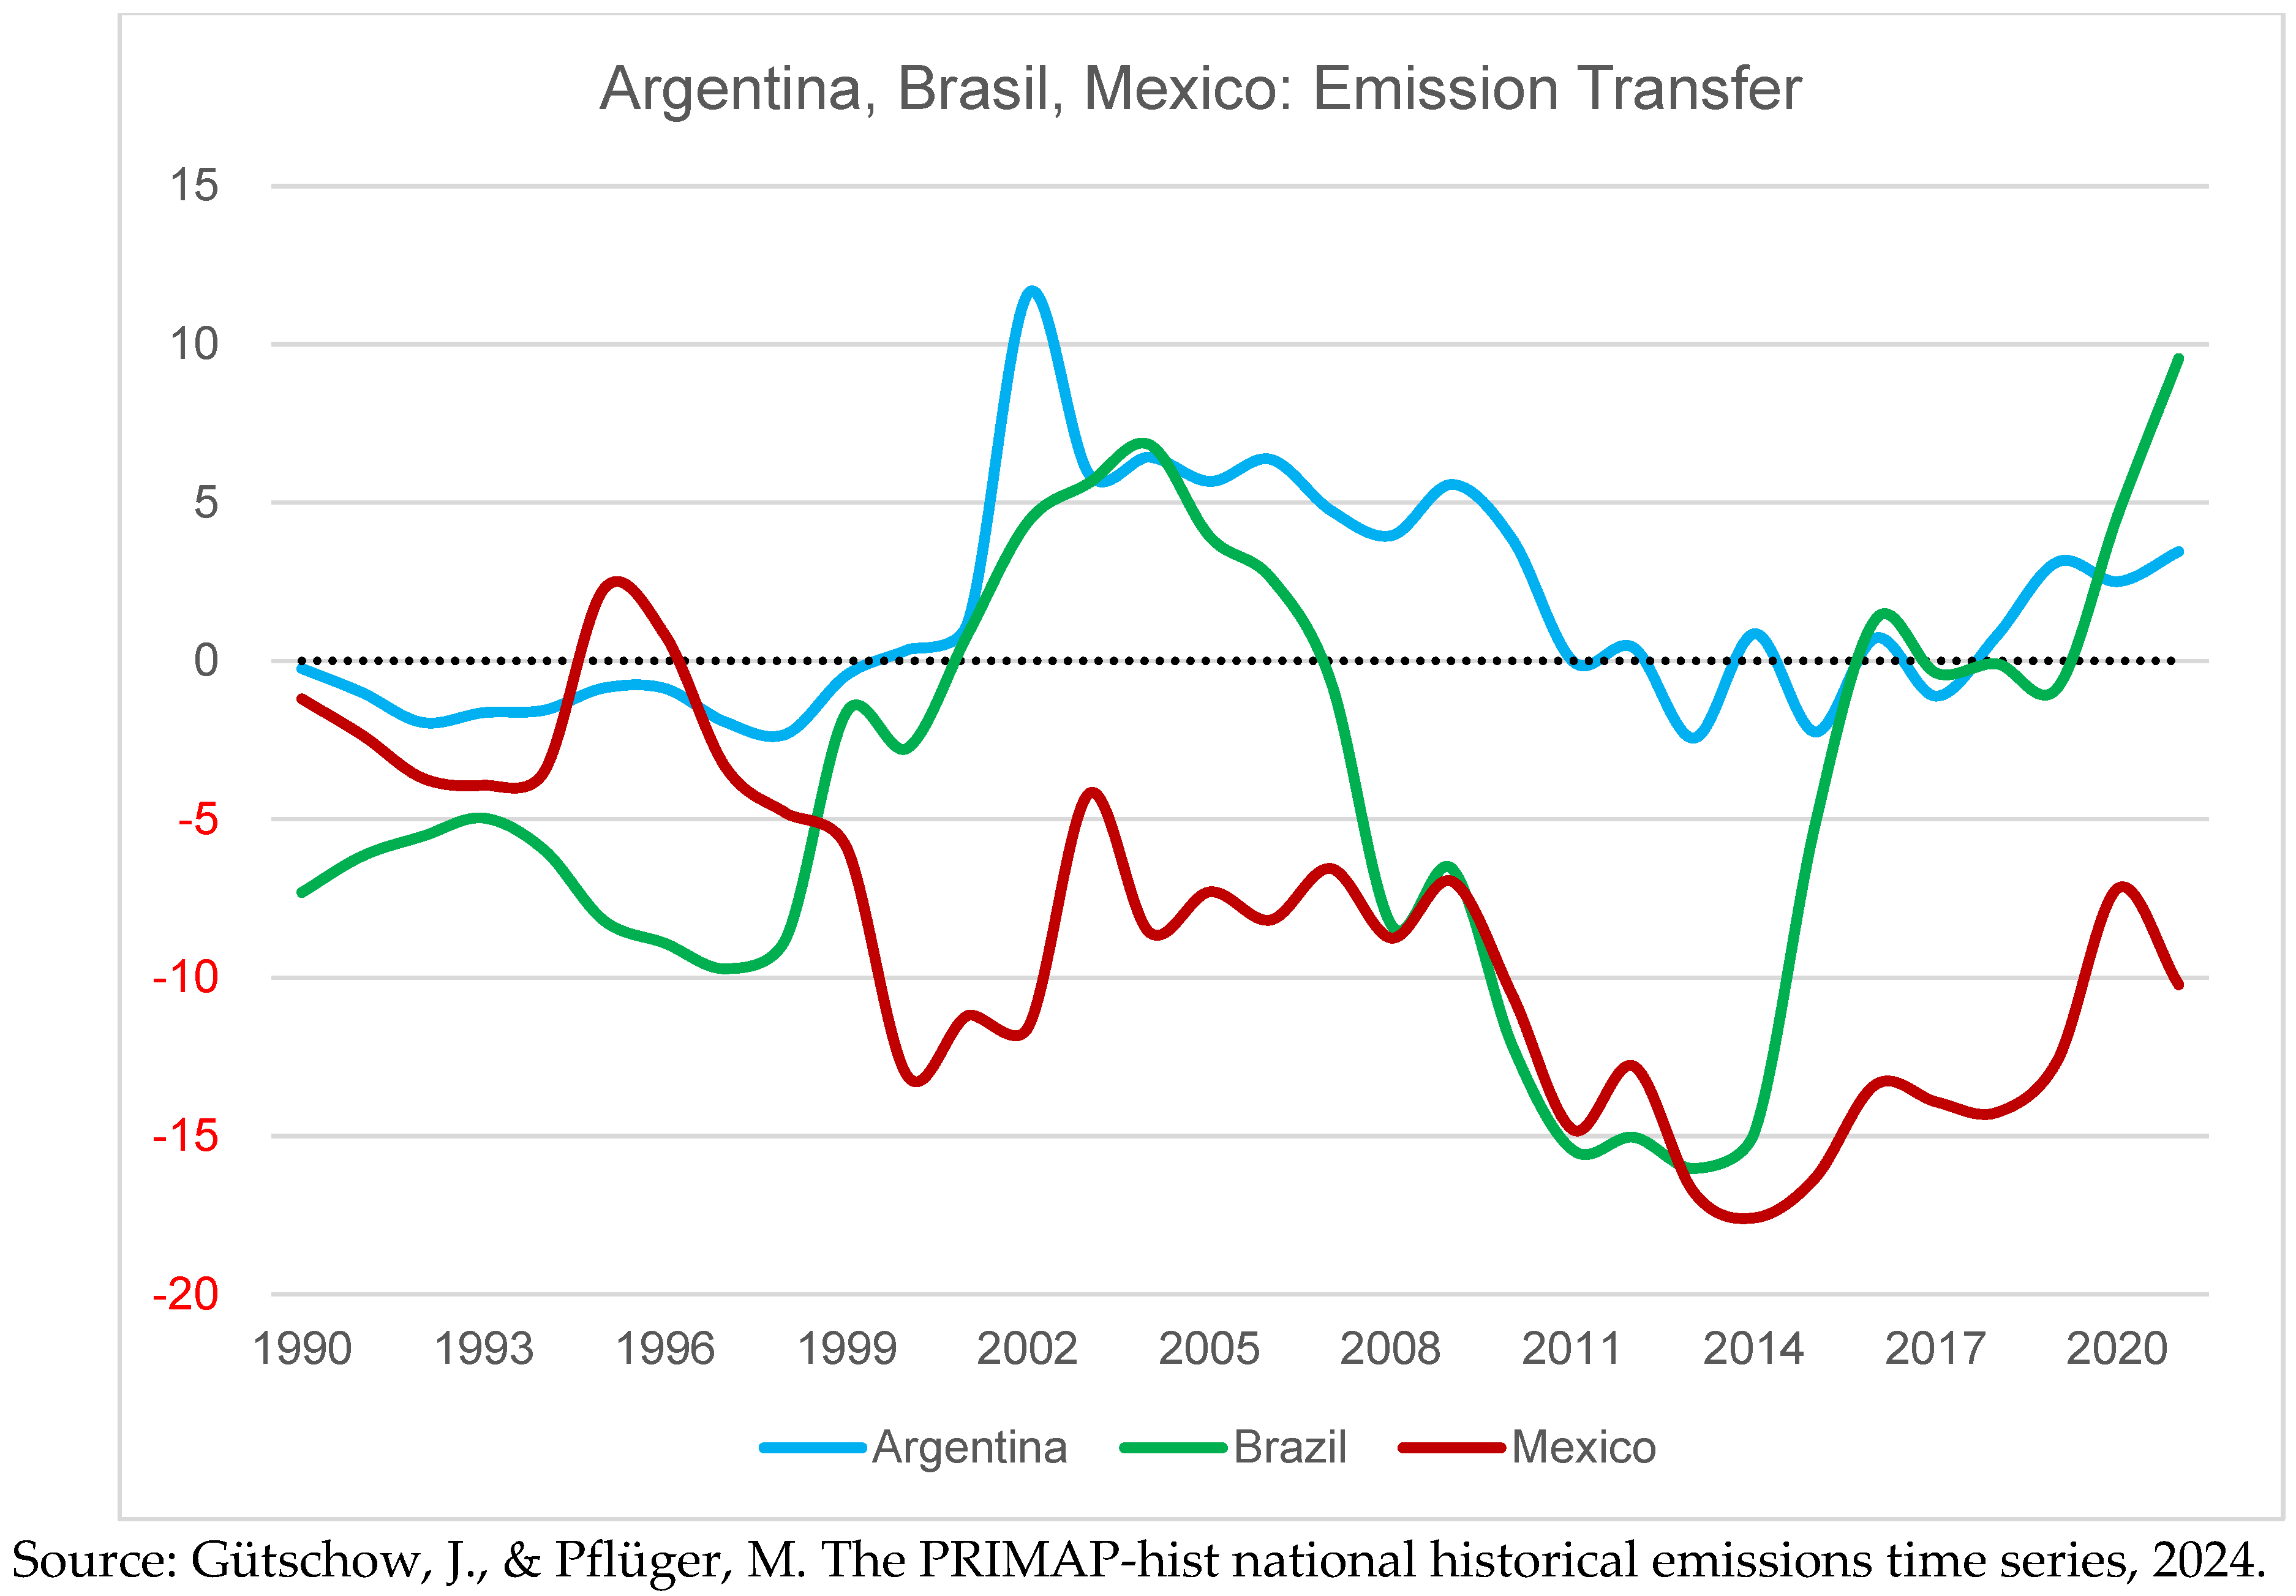
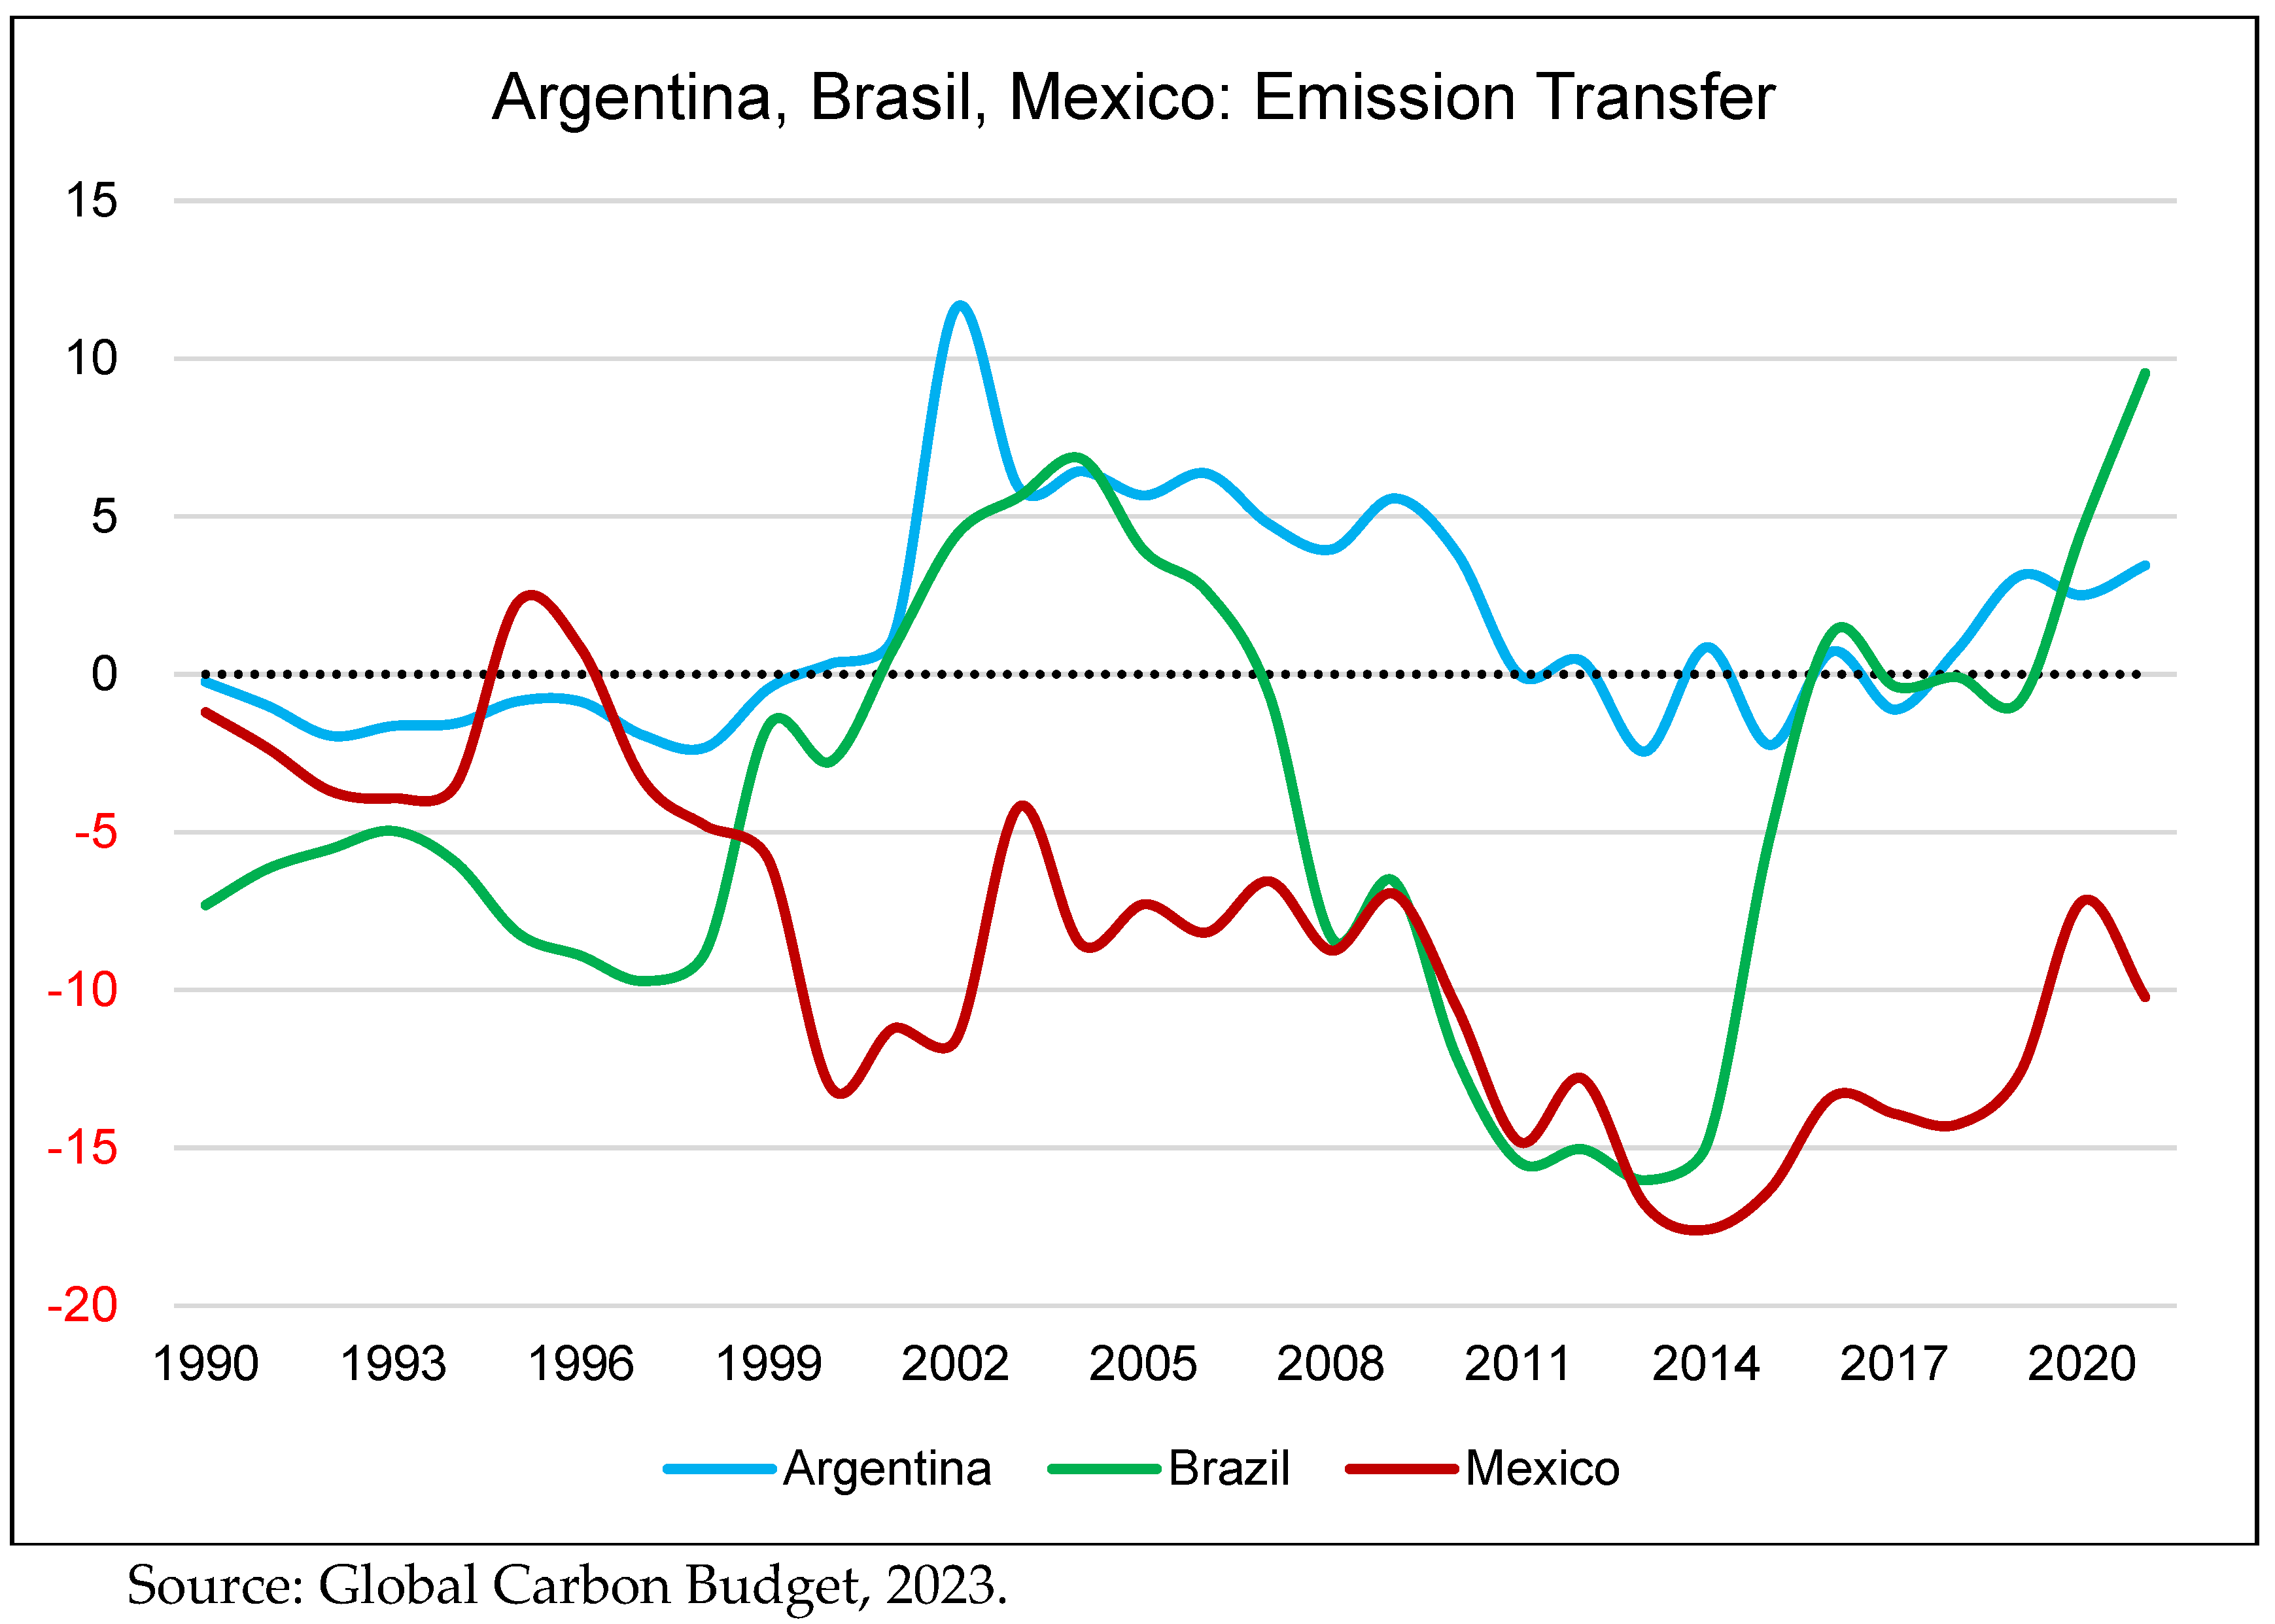
Despite boasting vast, carbon-sequestering rainforests and abundant natural resources, Latin America presents a paradoxical case of being a net importer of GHG emissions. This counterintuitive reality stems from the complexities of embodied emissions within global trade and fragmented supply chains. While Latin America exports numerous resource-intensive commodities like minerals and agricultural goods, the associated GHG emissions often occur upstream, outside its borders. This phenomenon is compounded by the consumption of manufactured goods within the region, often reliant on carbon-intensive production processes elsewhere. Consequently, the actual carbon footprint of LA consumption extends far beyond its geographical boundaries, leading to net embodied emission importation.
Figure 9.
Argentina, Brazil and Mexico: Net Emission Transfer, 1990 to 2022.
Figure 9.
Argentina, Brazil and Mexico: Net Emission Transfer, 1990 to 2022.
The standard method for estimating GHG emissions using national emission inventories, i.e., production-based accounting, solely accounts for the total emissions produced through economic activities within its borders without considering the destination of the goods produced associated with the emission of pollutants. That is, GHG emission production accounting does not show the flow of pollutants in the export and import of goods and services in the final demand of the global economy. Just as the total supply of goods is distributed through final domestic consumption and international trade (embodied in the external sector), the carbon footprint of those goods is also dispersed. This footprint reflects the emissions generated in the country where the goods are produced and the emissions associated with their entire life cycle, including transportation and final consumption.
Consumption-based accounting highlights how international trade can blur the lines of responsibility for GHG emissions. For instance, in 2016, out of a total of 669,963 kilotons of Mexico’s GHG emissions excluding land use, 2,426 kilotons stemmed from its trade with Brazil, 3,752 from China, 7,884 from Canada, and 127,606 kilotons from its trade with the United States (Lenzen et al.; A., 2013).
Table 2.
Brazil, Argentina, and Mexico: CO2 emissions embodied in gross exports, 2018.
Table 2.
Brazil, Argentina, and Mexico: CO2 emissions embodied in gross exports, 2018.
| Mexico |
|---|
| Industry |
Mt of CO2 eq |
% of exports |
| Transport equipment |
23.6 |
19% |
| Mining and quarrying, energy-producing products |
20.4 |
16% |
| Chemicals and non-metallic mineral products |
17.9 |
14% |
| Primary metals and fabricated metal products |
14.7 |
12% |
| Computer, electronic, and electrical equipment |
10.3 |
8% |
| Agriculture, hunting, forestry |
2.8 |
2% |
| Total |
126.4 |
100% |
| Argentina |
| Industry |
Mt of CO2 eq |
% of exports |
| Food products, beverages, and tobacco |
4.4 |
17% |
| Chemicals and non-metallic mineral products |
3 |
11% |
| Mining and quarrying, energy-producing products |
2.8 |
11% |
| Agriculture, hunting, forestry |
2.7 |
10% |
| Primary metals and fabricated metal products |
1.6 |
6% |
| Transport equipment |
1.6 |
6% |
| Total |
26.1 |
100% |
| Brazil |
| Industry |
Mt of CO2 eq |
% of exports |
| Primary metals and fabricated metal products |
29.1 |
31% |
| Agriculture, hunting, forestry |
11.9 |
13% |
| Mining and quarrying, energy-producing products |
9.7 |
10% |
| Chemicals and non-metallic mineral products |
8.5 |
9% |
| Mining and quarrying, non-energy producing products |
7.4 |
8% |
| Food products, beverages, and tobacco |
6.4 |
7% |
| Total |
94.9 |
100% |
Mexico’s export sector carries a significant carbon burden. Industries like engine manufacturing, electronic and computing equipment, mining of energy products, base metals, and electrical equipment production contribute the most to its exports and, therefore, to this embodied footprint. These sectors, crucial to the nation’s economy, need a focus on cleaner production technologies and sustainable practices to reduce the environmental impact of Mexican exports.
In Brazil, the industries that incorporate the most CO2 emissions into their exports are base metals, agriculture, hunting and forestry, mining of energy and non-energy products, and the food, beverage, and tobacco industries. Meanwhile, in Argentina, the industries that generate the highest CO2 emissions in export products are the food, beverage, and tobacco industries, air transport, mining of energy products, agriculture, hunting and forestry, and vehicle engines.
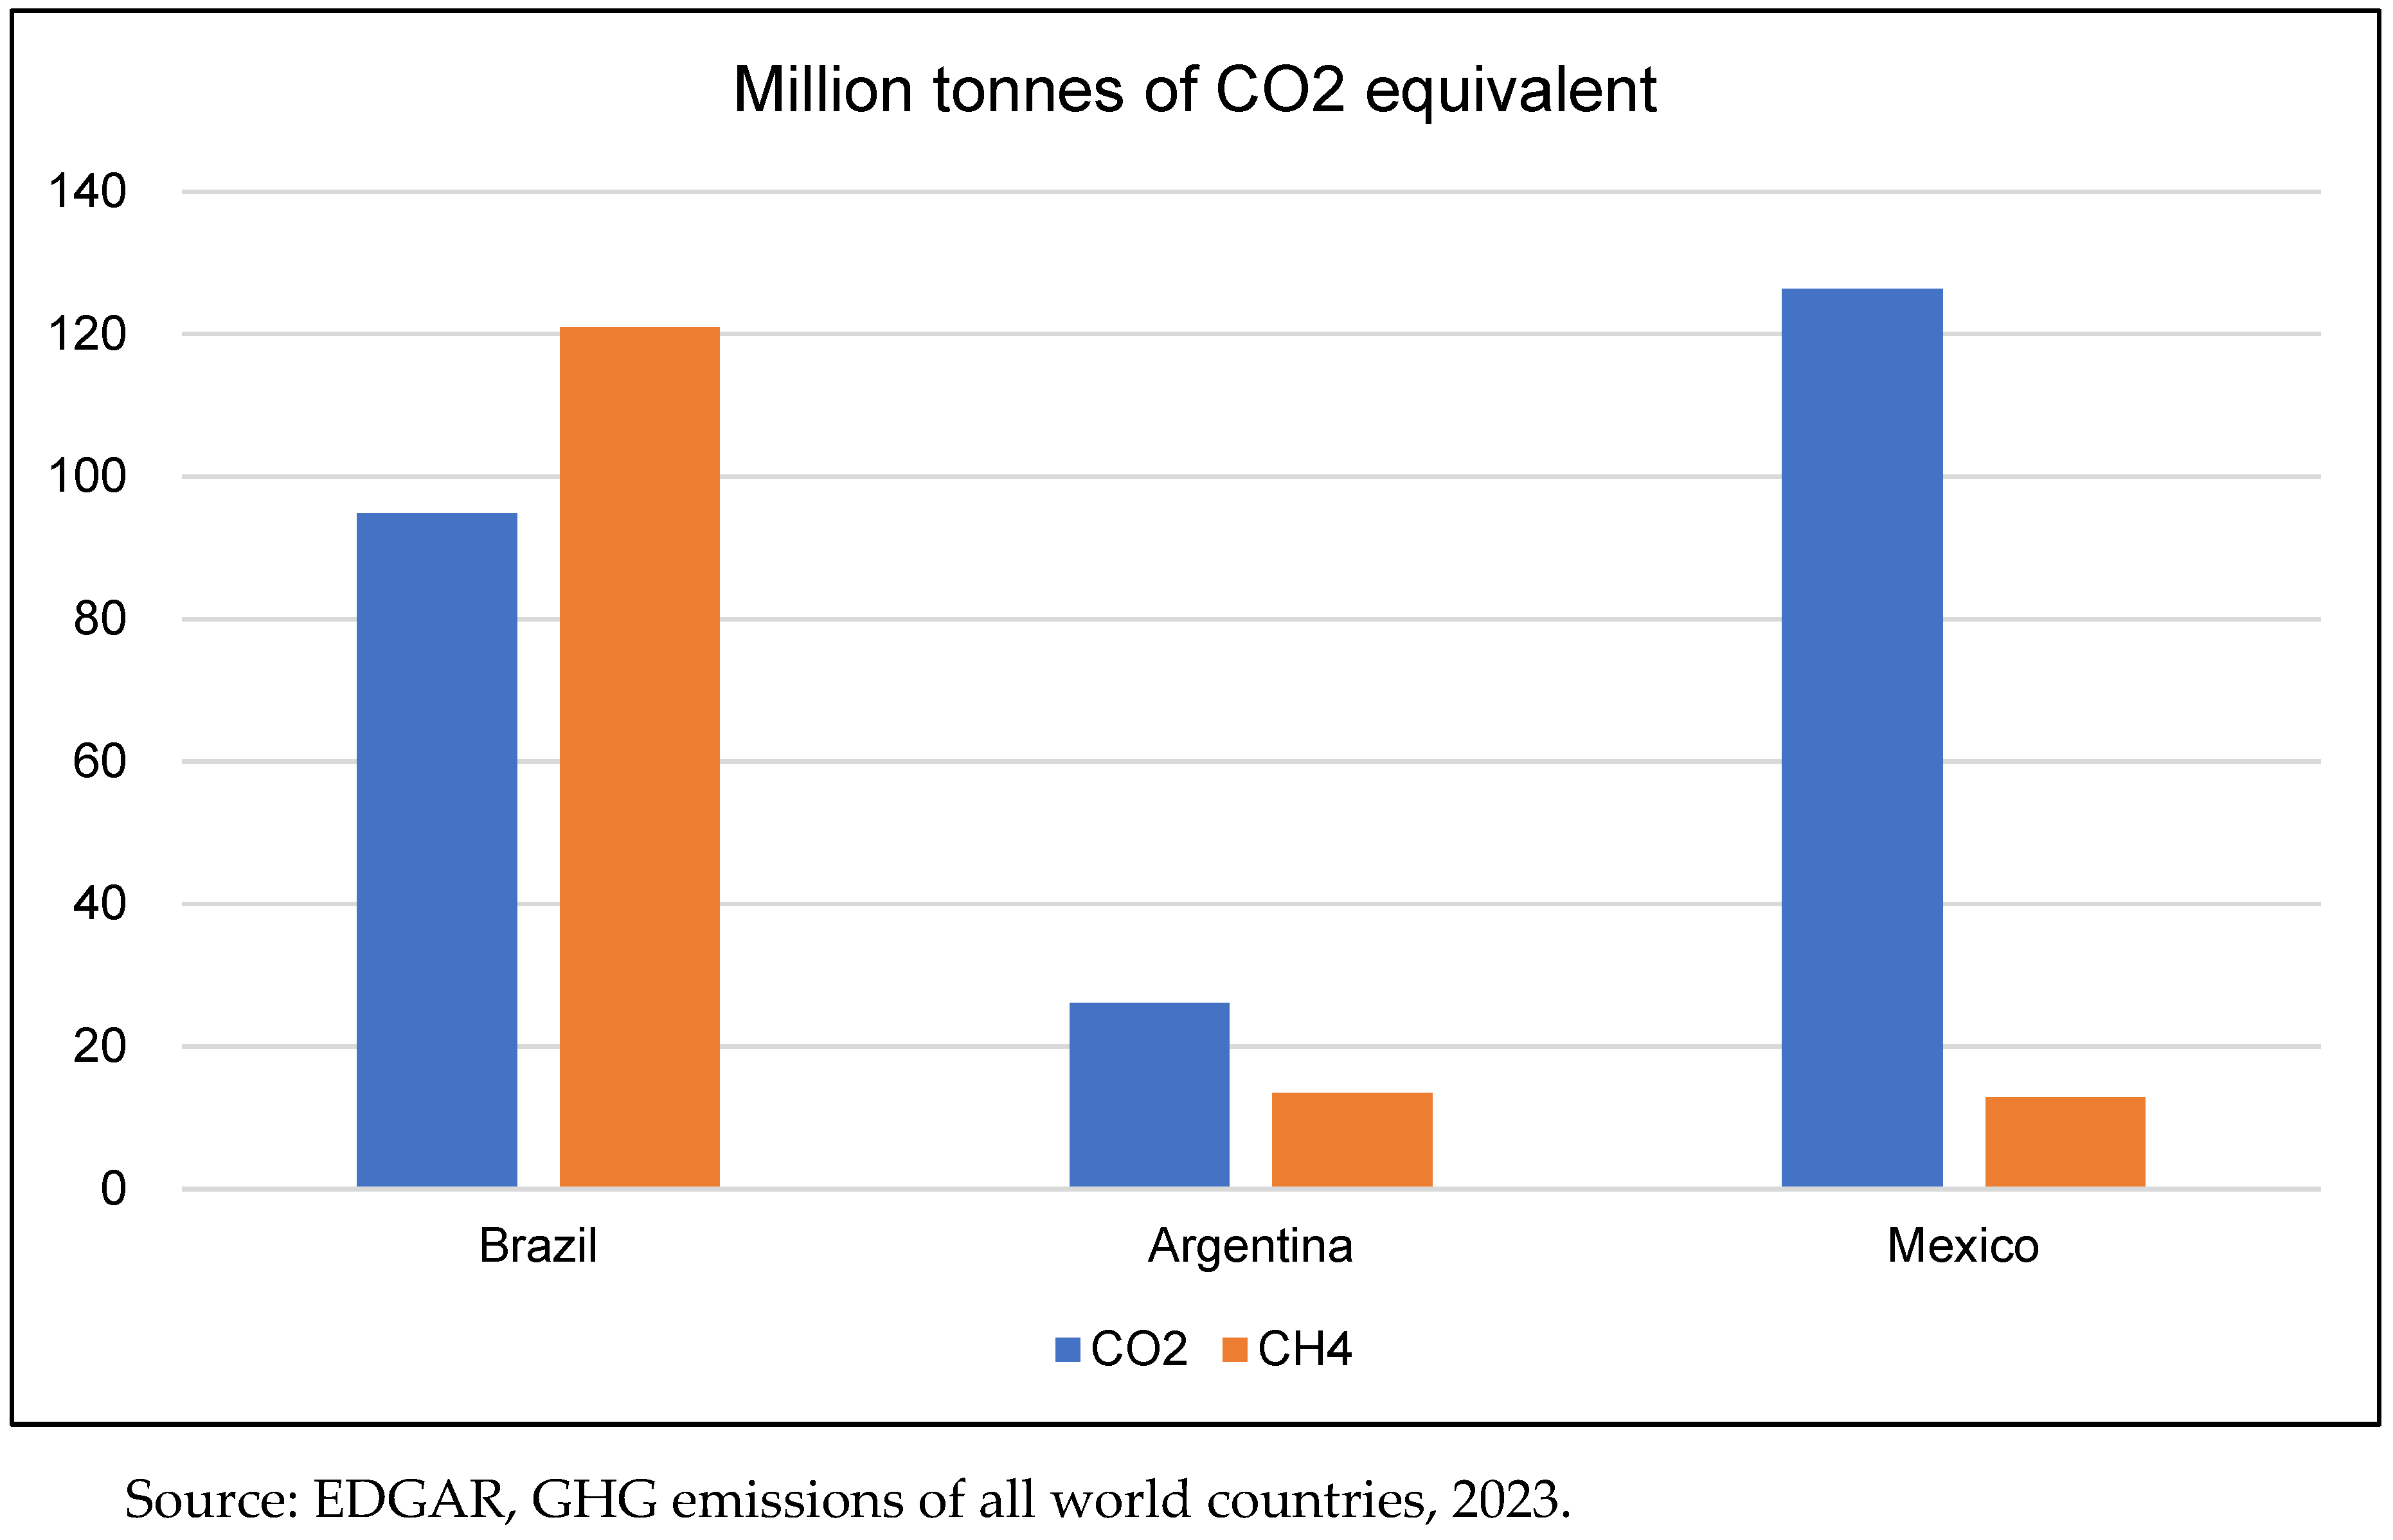
Nonetheless, an environmental analysis of the export of sole CO2 emissions only provides an incomplete picture, as industrial and power generation activities only account for a part of the total carbon footprint embedded in international trade, which is underestimated when agricultural and land use emissions are excluded. Using the EDGAR emissions inventory and the OECD input-output matrices, we estimate the CH4 emissions incorporated into the export of agricultural goods. Brazil stands out as a significant exporter of agricultural products, but this activity carries a high carbon footprint. Extensive livestock farming and deforestation for the expansion of agricultural land are two of the main emitters of GHG in the country. Although Argentina has a smaller economy than Mexico, its GHG emissions from agricultural exports are slightly higher.
Several vital differences emerge when comparing CH4 and CO2 emissions embedded in Brazil, Argentina, and Mexico exports. In 2018, Brazil’s CO2 emissions from exports were 94.9 Mt CO2eq, with a significant contribution from sectors such as primary metals and fabricated metal products (31%), agriculture, hunting, and forestry (13%), and mining and quarrying (10%). In contrast, CH4 emissions were higher at 120.9 Mt CO2eq, underscoring the impact of methane production on Brazil’s export profile. Notably, sectors like agriculture, which contribute substantially to methane emissions, show higher CH4 emissions than CO2, reflecting the significant role of livestock and other methane-intensive activities.
Figure 10.
CO2 and agricultural CH4 emissions embodied in trade, 2018.
Figure 10.
CO2 and agricultural CH4 emissions embodied in trade, 2018.
The disparity between CH4 and CO2 emissions in exports for Argentina and Mexico also highlights the importance of including methane in environmental assessments. Argentina’s CO2 emissions from exports were 26.1 Mt CO2eq, with food products, beverages, and tobacco (17%) and chemicals and non-metallic mineral products (11%) significant contributors. Methane emissions were lower at 13.5 Mt CO2eq, indicating a different sectoral impact than Brazil’s. Mexico’s CO2 emissions were significantly higher at 126.4 Mt CO2eq, with transport equipment (19%) and mining and quarrying (16%) leading the sectors. Including methane emissions in environmental assessments is crucial for a comprehensive understanding of the environmental impact of exports, as it often reveals a different sectoral distribution and highlights areas needing targeted mitigation strategies.
Livestock farming, soy production, and using fossil fuels in transportation are mainly responsible for these emissions. In contrast, despite having a sizable agricultural sector, Mexico has kept its GHG emissions from agricultural exports relatively low. It is partly due to the greater diversification of its agricultural production and its adoption of a growth model based on the production and export of capital goods as part of interindustry commerce with the United States.
Brazil is the world’s leading net exporter of land use and agricultural emissions (Chaopeng et al., 2022). This dependence on export-driven activities that generate high emissions creates a significant hurdle for Brazil’s efforts to become more environmentally sustainable. The case of Brazil exemplifies the double-edged sword of the international division of labor. Less developed economies, locked into supplying raw materials and agricultural products, face an uphill battle. Not only are they unable to develop high-value-added industries, but they also shoulder the significant environmental burden of resource extraction and intensive agriculture to feed the international market.
The transition of Latin America, and so every agro-export economy, towards the use of green technologies and energies is hindered by the needs of the international market for food and agricultural products. Regional specialization in exporting goods such as soybeans, beef, raw sugar, raw oils, and fruits to satisfy international demand represents a significant challenge and great inequality in climate change control. Environmental assessments are crucial for a comprehensive understanding of the environmental impact of exports, as they often reveal a different sectoral distribution and highlight areas needing targeted mitigation strategies.
4. The Conundrum of Financing Green Initiatives
There are two more extensive sets of greening initiatives. One involves green finance, and another refers to environmental taxes. Green finance encompasses different instruments, such as green bonds, loans, Green Banks, Carbon Finance, and Climate Finance. The issue is that funding the green transition is crucial for the initiatives and particularly challenging for the countries in the middle-income trap. These countries have lower rates of investment in comparison to those middle-income countries that are not in the trap. Between 1980 and 2020, the average Gross Capital Formation as a percentage of the GDP was 29% for middle-income countries. However, during the same period, the average growth for Mexico was 19.7%, 19.1% for Brazil and 18% for Argentina. For over four decades, these three nations have maintained a middle-income status, a condition often associated with the risk of becoming stuck in that economic category.
To illustrate the enormous financial need for climate change mitigation and adaptation in developing countries, it is worth taking the example of Developing Asia. Between 2016 and 2030, there is an estimated 22.6 trillion dollars to cover the mitigation and adaptation costs (Sachs et al., 2019). Sharma and colleagues (2022) consider three relevant dimensions in green finance: purpose, procedure, and place. Purpose refers to the priority of a green finance agenda, including energy efficiency, climate change mitigation, adaptation, and renewable energy. The procedure involves the activities and mechanisms that imply changes in society and the economy, from production to consumption and lifestyle in general. Moreover, the third dimension refers to the regional extension of green finance, especially in the Global South. The place also includes rural and urban areas and industrial and non-industrial regions.
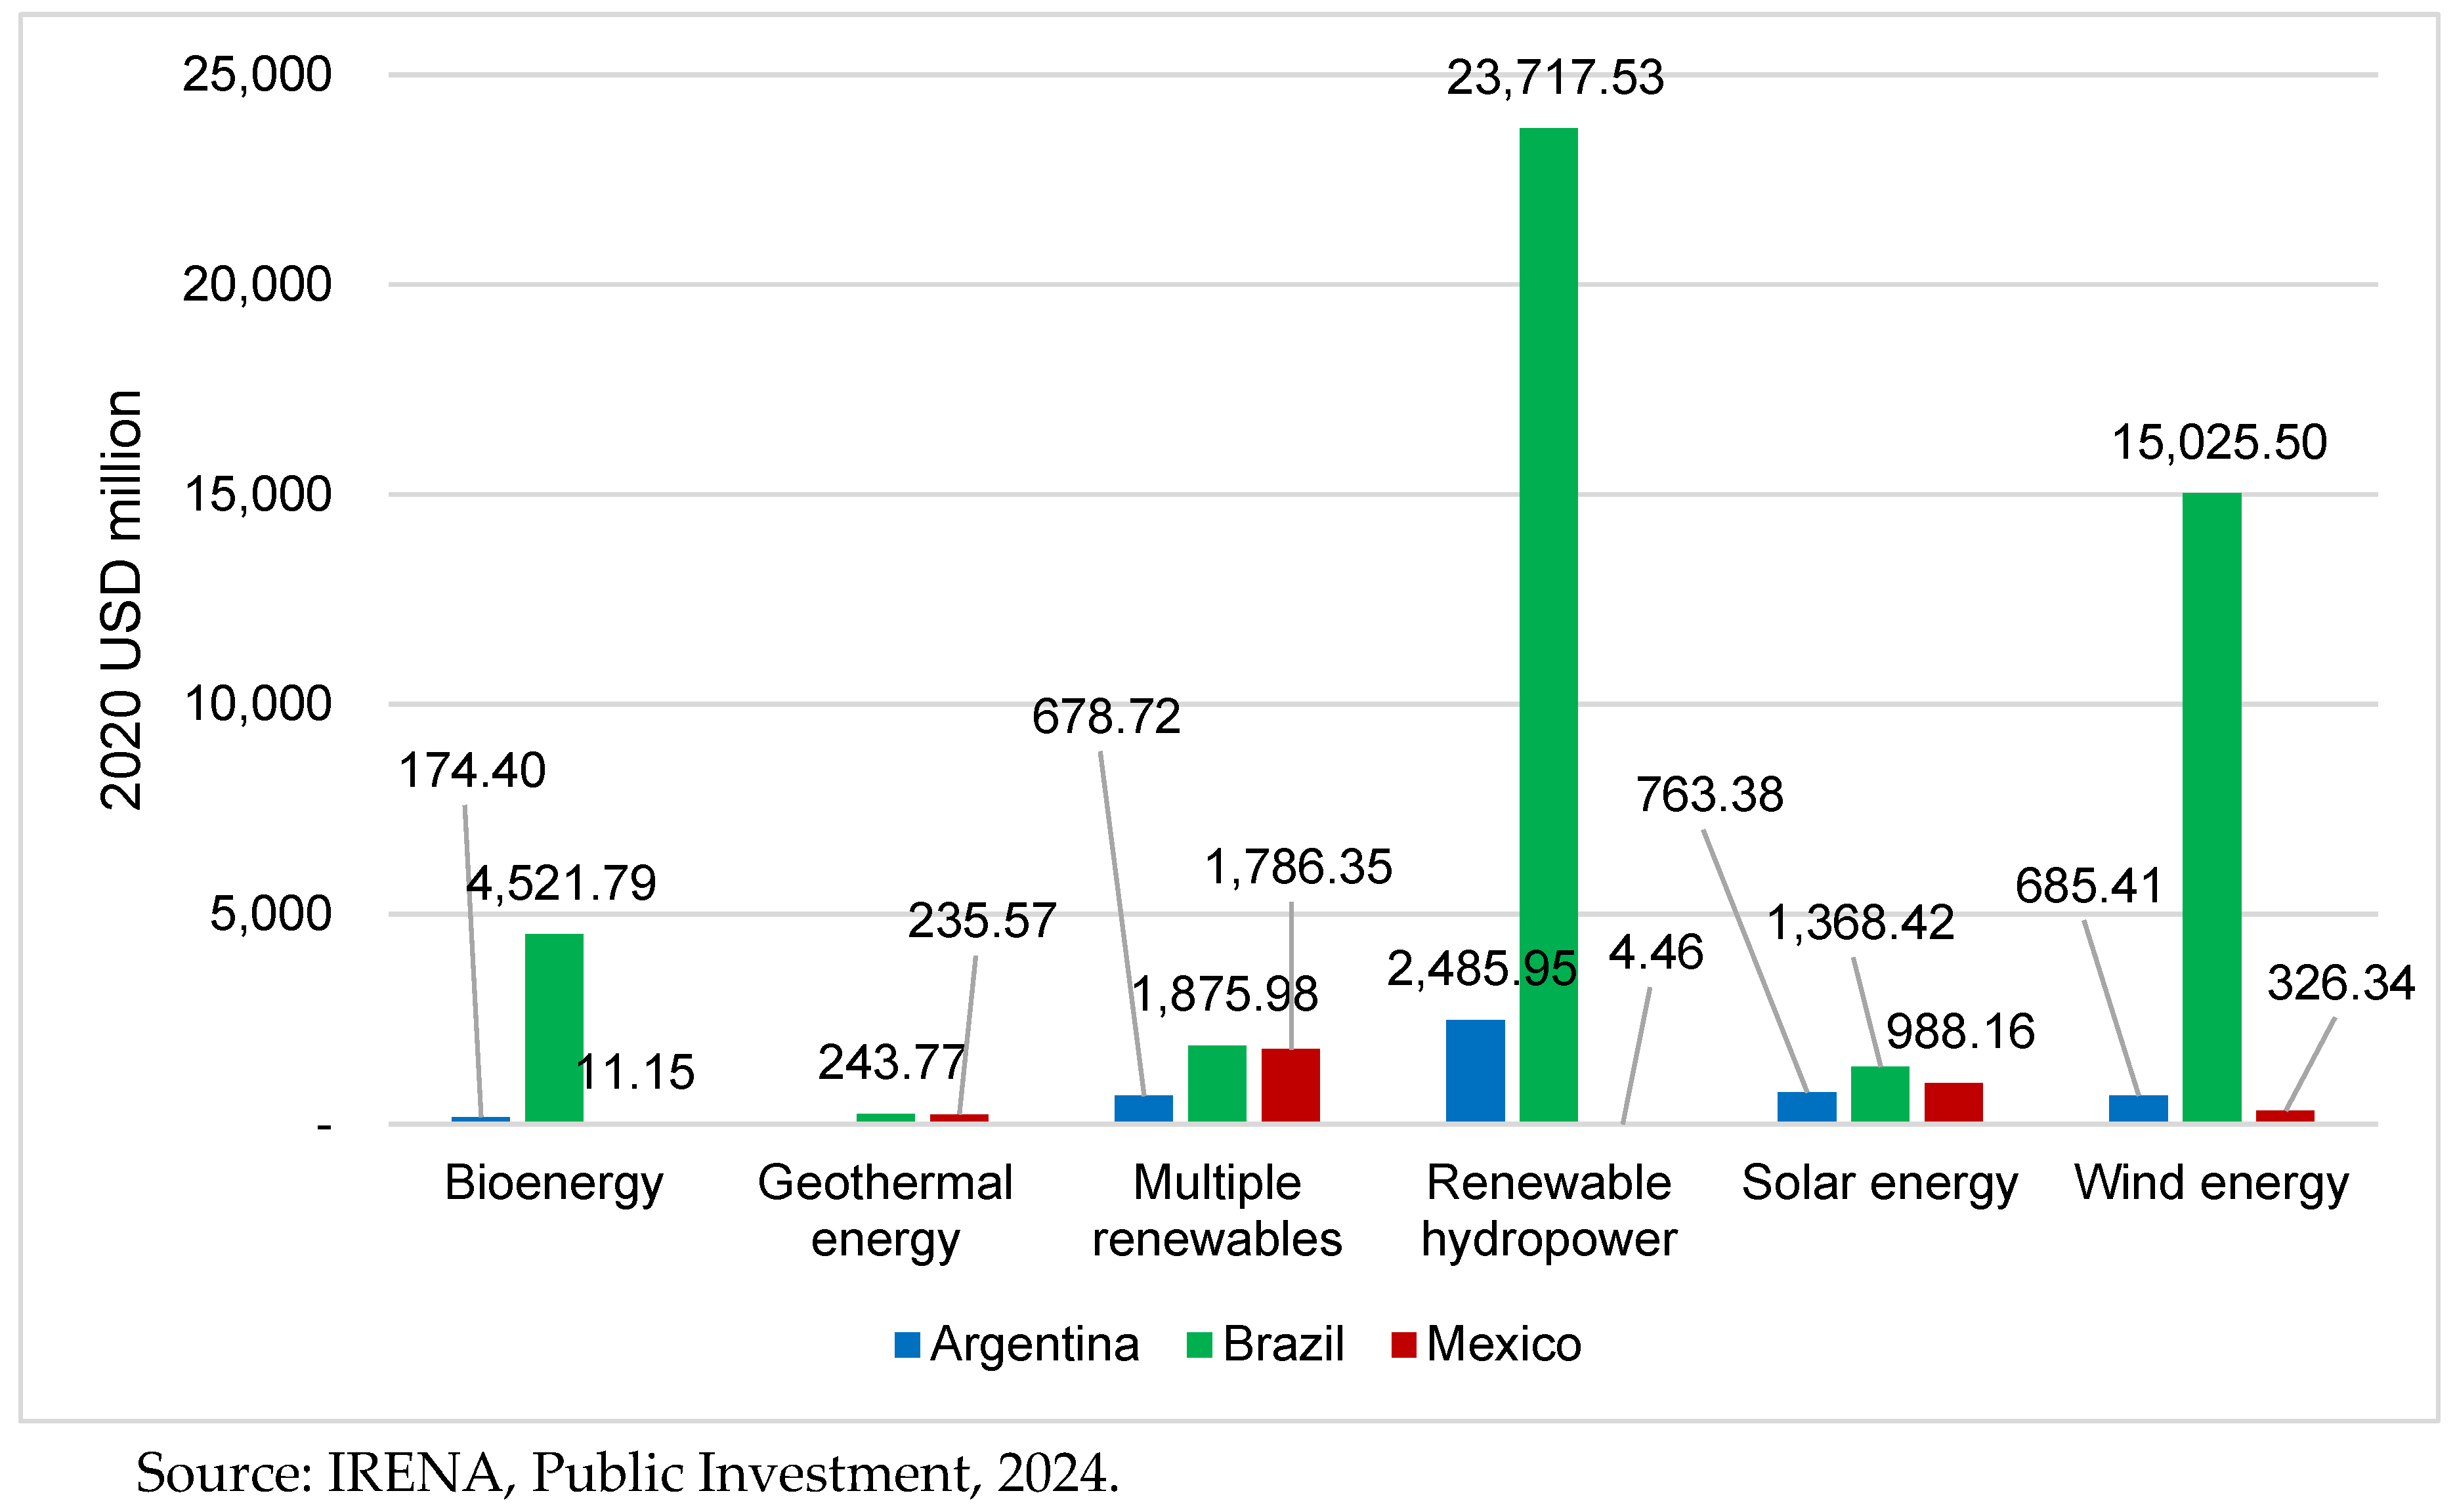
Li and colleagues (2022) underscore the need to strengthen the promotion and enforcement of green bonds and environmental taxes. They also highlight the role of the government in developing green financing. The same holds for Zhang and Wang (2021), to whom the government should commend cities and regions with higher levels of green finance development as well as supporting economically backward regions. The authors found a positive correlation between green finance and local economic development and the positive effects of green finance on sustainable energy. Figure 11 shows public investment in renewable energy for Argentina, Brazil, and Mexico from 2000 to 2022, measured in constant 2021 US dollars.
Figure 11.
Latin America (2000-2020): Cumulative Public Investment in Renewable Energy.
Figure 11.
Latin America (2000-2020): Cumulative Public Investment in Renewable Energy.
Argentina’s public investment in renewables, while modest in comparison, has shown notable increases around 2010-2012 and again in 2018-2019. This intriguing trend could motivate researchers to delve deeper into the reasons behind this modesty, which generally remained below US$5 billion constant in 2021 over the entire period.
Mexico’s public investment levels have been the lowest among the three countries, peaking around 2016 but generally remaining below US$ 2 billion for most years. In recent years (2020-2022), Brazil’s public investment in renewables has declined from its previous peak, while Argentina and Mexico have maintained relatively stable investment levels.
The data undoubtedly underscore Brazil’s pivotal role in leading public investment in renewable energy development in Latin America. This insight serves to enlighten policymakers and stakeholders about regional trends and the varying levels of commitment and resource allocation towards this sector in the three leading economies of the region over the last two decades.
The main reason Brazil stands out so remarkably from Mexico and Argentina is the active presence of BNDES in the financing of renewable energy projects. Between 2000 and 2020, BNDES accounted for 93% of the 46.7 billion dollars invested in projects of renewable energy (IRENA, 2023). The amount of money from international agencies corresponds to only 2% of Brazil’s total investment in renewable energy. The share of these agencies for Mexico is 34.4% and 17% for Argentina. The international funds and development banks account for 54.5% of Mexico’s and 15% of Argentina’s renewable energy.
Although Brazil had a much higher rate of energy investment than Argentina and Mexico between 2000 and 2020, the largest share came from oil, with 33.9 billion dollars. Brazil had 4.8 billion without oil investment, Argentina almost five billion, and Mexico 4.8 billion. China is by far the biggest donor for energy investment in the three countries, with greater emphasis on Brazil. Between 2000 and 2020, China invested 38.3 billion dollars in renewable energy and oil, amounting to 34.3 billion. Argentina followed with three billion and Mexico with a much smaller share of 996 million. IFC and Germany are Brazil’s second and third donors, with 975 million and 925 million, respectively.
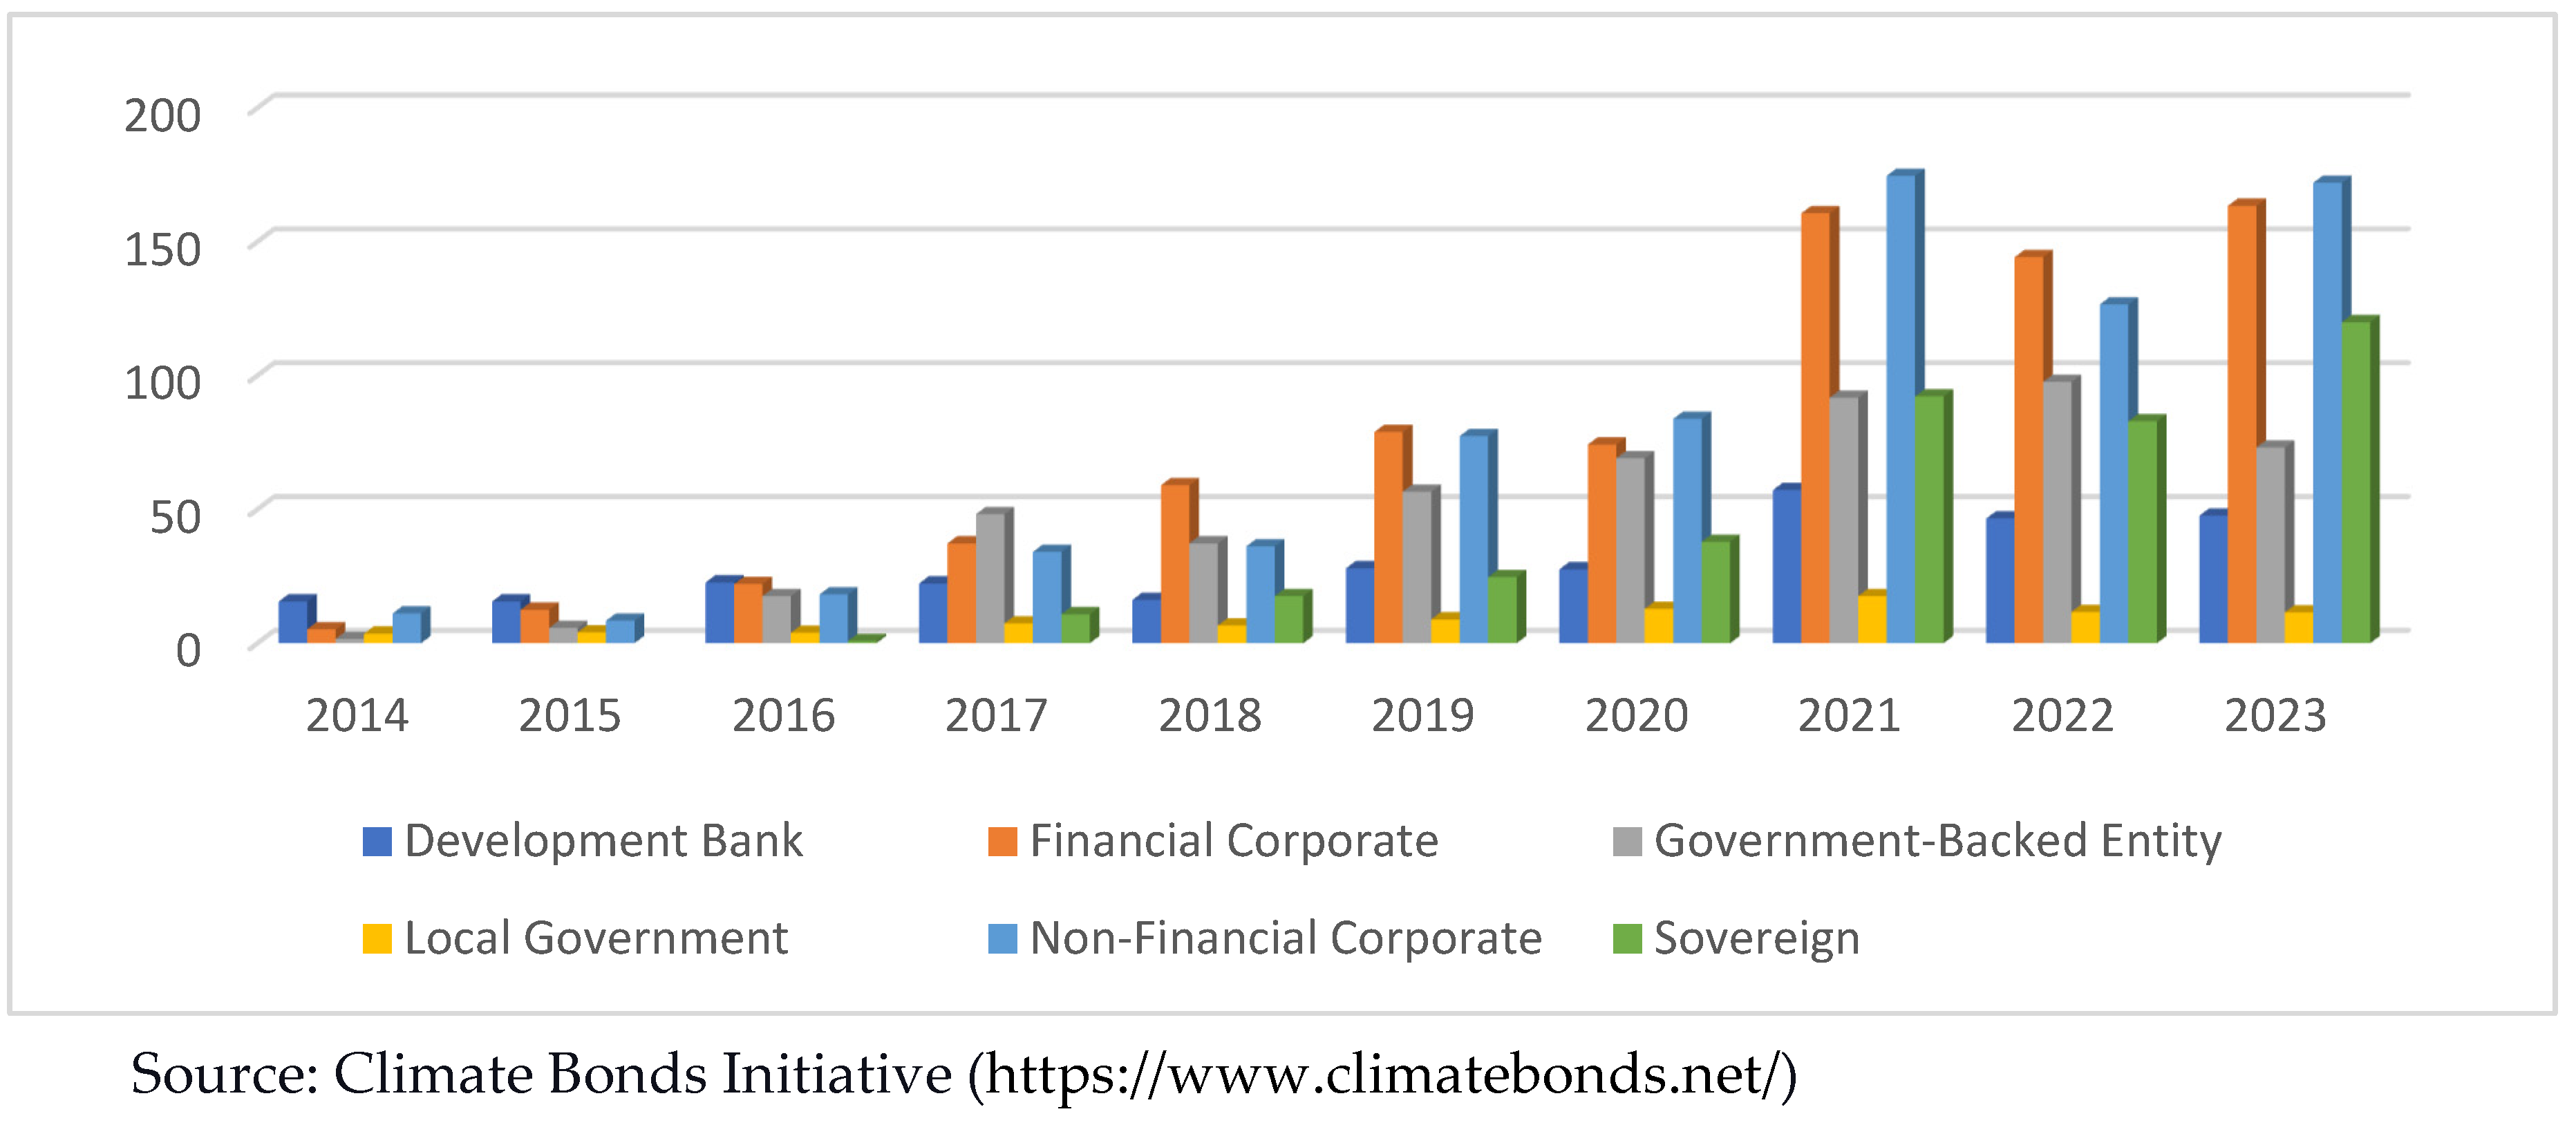
Globally, the financial volumes of climate bonds surged between 2014 and 2023. 2014 the largest issuers were development banks and non-financial and financial corporations. Nearly ten years later, non-financial and financial corporations became the leading issuers, with 172 and 163,2 billion dollars, respectively (Figure 12). However, it is relevant to underscore the role played by state and non-private institutions in the issue of climate bonds. Development banks, local government, government-backed entities, and sovereign funds accounted for 47% of the issue of total climate bonds in 2022 and 43% in 2023. Although the volume of private investment has increased dramatically over the last few years, state-related funding plays a crucial role in strengthening the need for a joint financing solution in the green transition.
Figure 12.
Climate Bonds per type of issuer between 2014 and 2023 (US billion dollar).
Figure 12.
Climate Bonds per type of issuer between 2014 and 2023 (US billion dollar).
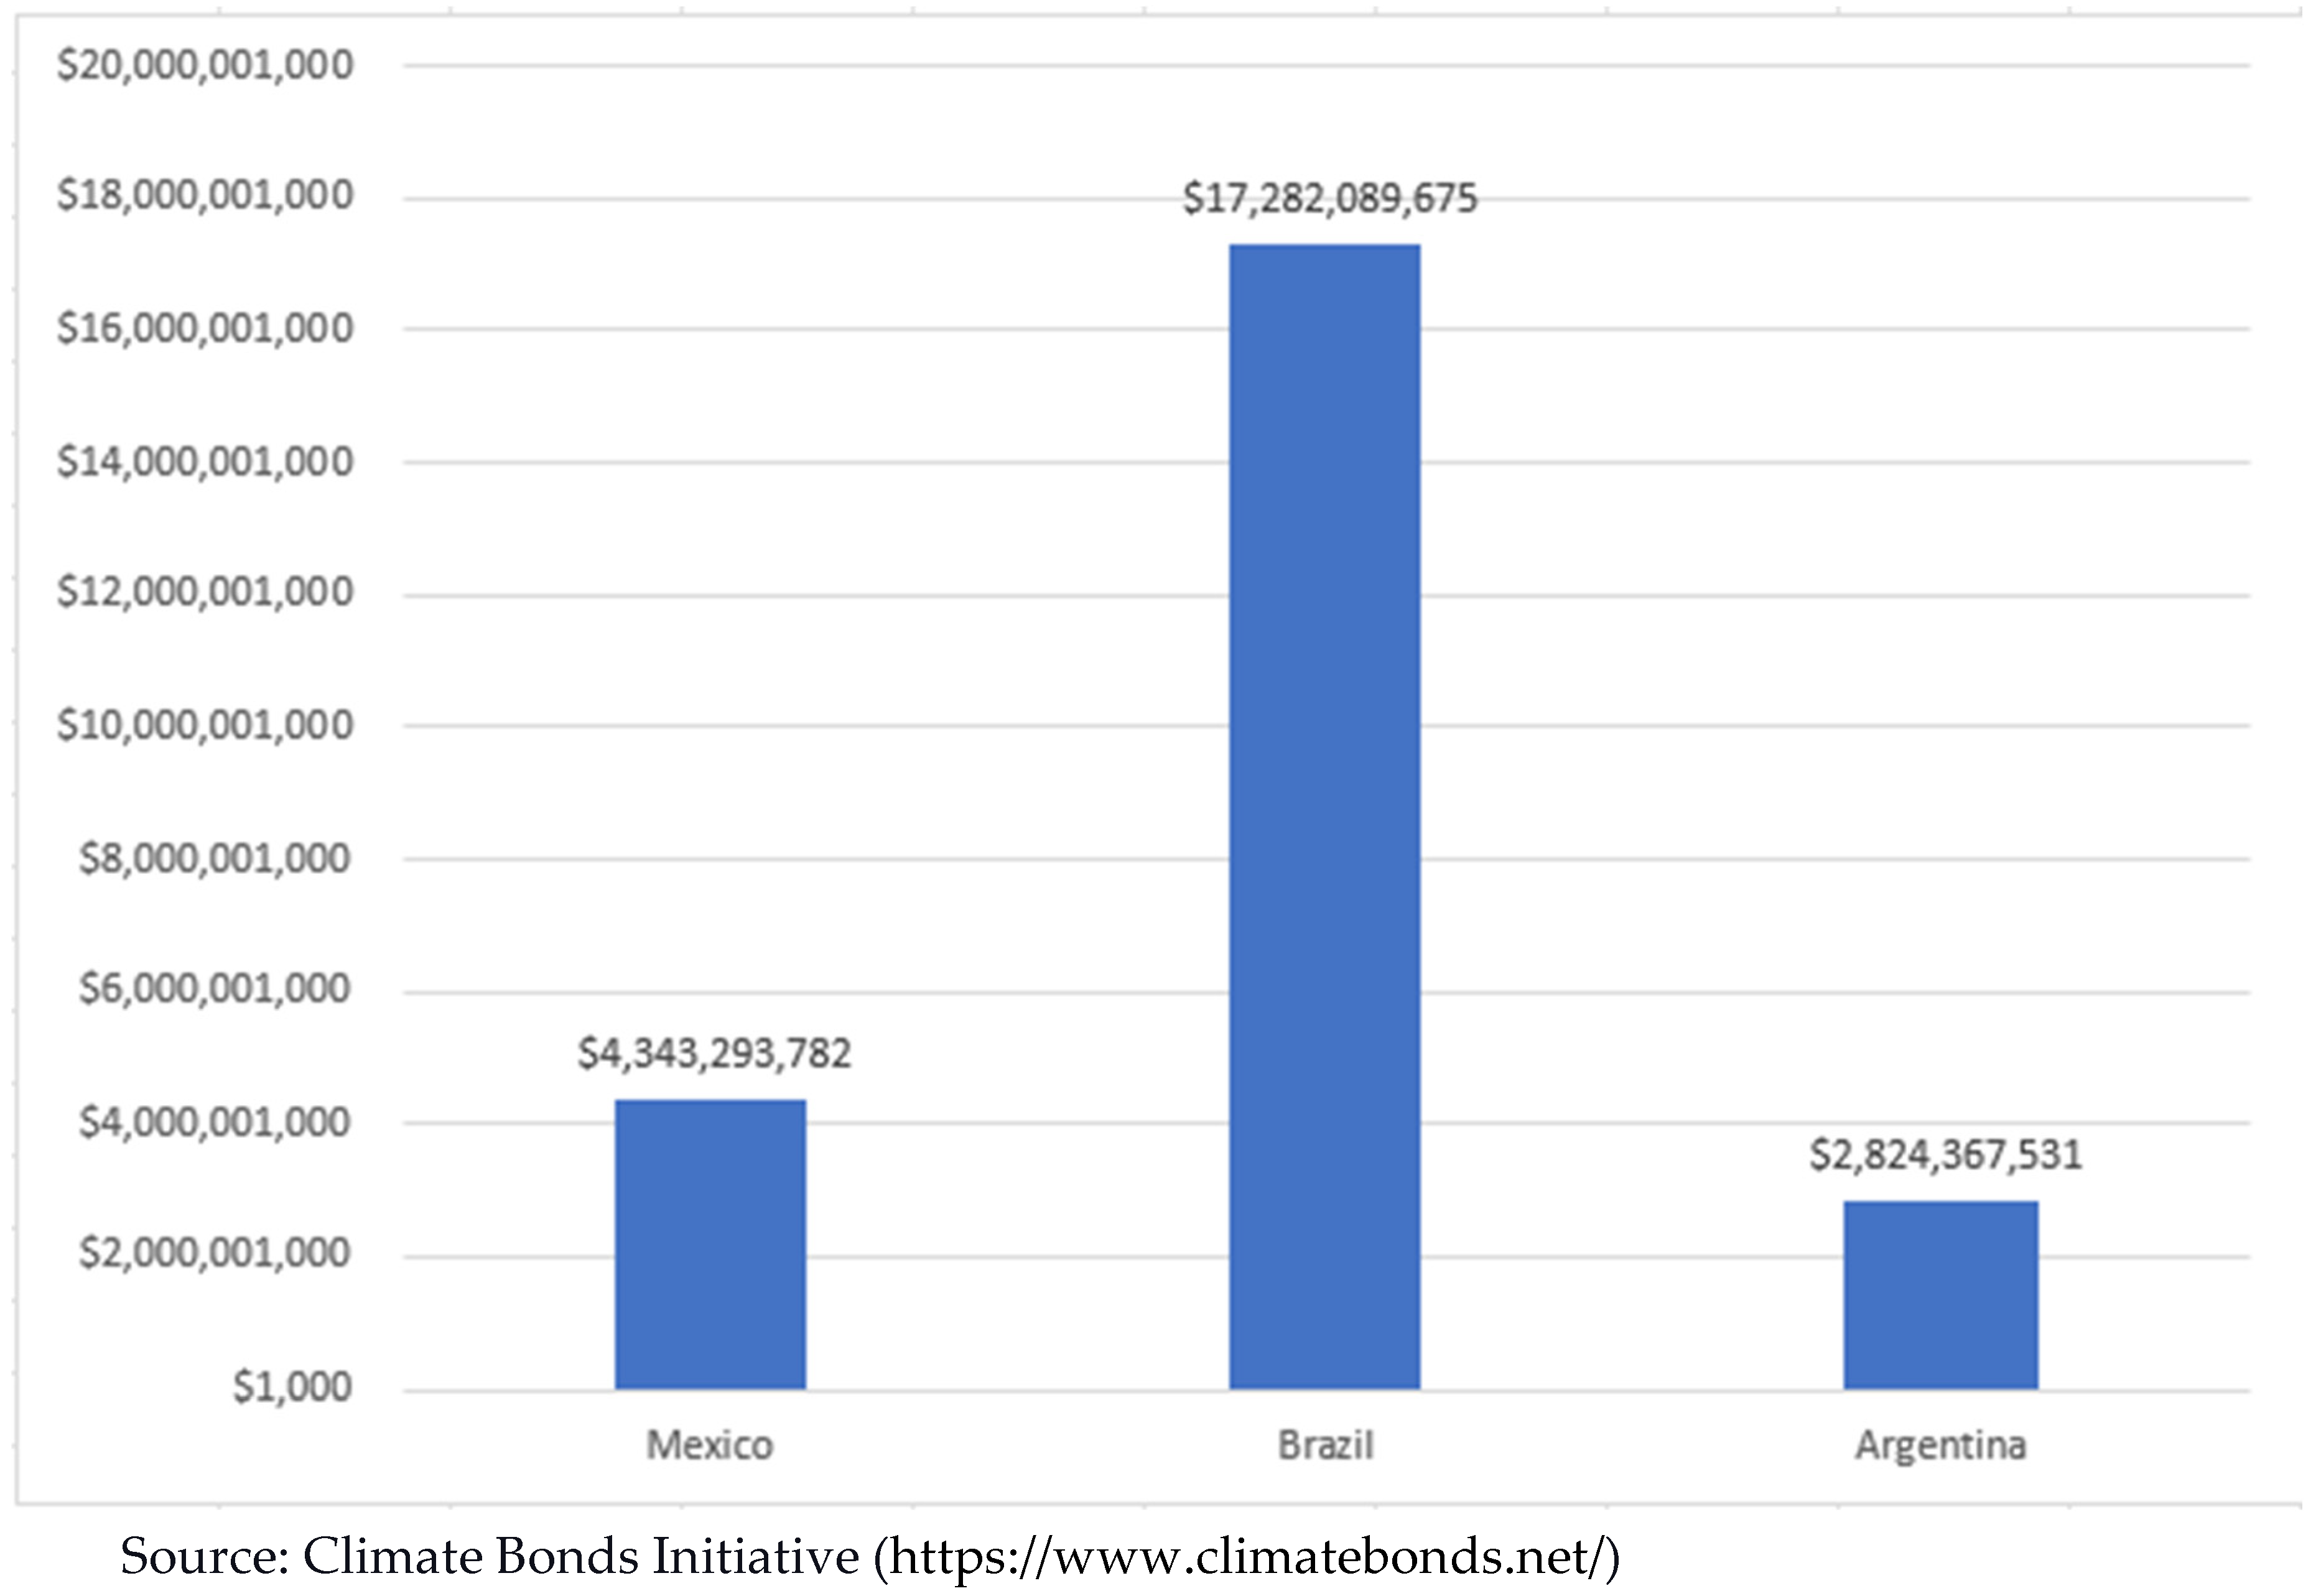
Figure 13 shows Brazil stands out in the climate bonds market with 17.3 billion dollars. Mexico comes second with 4.34 billion dollars, less than one-third of Brazil’s value. Argentina is third with 2.8 billion dollars. Although there is still a considerable difference among the three countries, it is smaller than the differences in the amount of public investment shown in Figure 11. One could raise the possibility that public investment has a carrying effect by providing incentives for the entrance of private actors, as the presence of government funds may signal less risk.
Figure 13.
Climate Bonds in Mexico, Brazil, and Argentina between 2014 and 2023 (US dollars).
Figure 13.
Climate Bonds in Mexico, Brazil, and Argentina between 2014 and 2023 (US dollars).
Brazil has 749 operating wind farms, and 193 are under construction. In contrast, Mexico has 73 operating wind farms, eight under construction, and Argentina has 61 operating wind farms, four under construction. The countries are closer to solar energy, with 116 operating parks in Mexico and 132 in Brazil. Argentina needs to catch up, with only 15 solar energy parks (Table 3). Regarding the solar energy parks under construction, Brazil is much ahead of Mexico and Argentina, with 151 parks under construction.
Table 3.
Solar and wind projects in Mexico, Brazil, and Argentina.
Table 3.
Solar and wind projects in Mexico, Brazil, and Argentina.
| Country |
Wind Farms
Operating |
Wind Farms
Under construction |
Solar energy parks
Operating |
Solar energy parks
Under construction |
| Mexico |
73 |
193 |
116 |
11 |
| Brazil |
749 |
8 |
132 |
151 |
| Argentina |
61 |
4 |
15 |
4 |
Brazil has the most industrial policy initiatives related to low carbon and climate change mitigation (Table 4), with 77 acts and programs labeled as low carbon and 15 for climate mitigation. Of the number of initiatives related to industrial policy, 53.5% are related to green industrial policy. This is 32% for Mexico and 45% for Argentina.
Table 4.
Industrial policy initiatives related to low-carbon and climate mitigation in Mexico, Brazil, and Argentina.
Table 4.
Industrial policy initiatives related to low-carbon and climate mitigation in Mexico, Brazil, and Argentina.
| Country |
Low carbon |
Climate mitigation |
Total number of initiatives |
| Mexico |
9 |
0 |
28 |
| Brazil |
77 |
15 |
172 |
| Argentina |
22 |
6 |
62 |
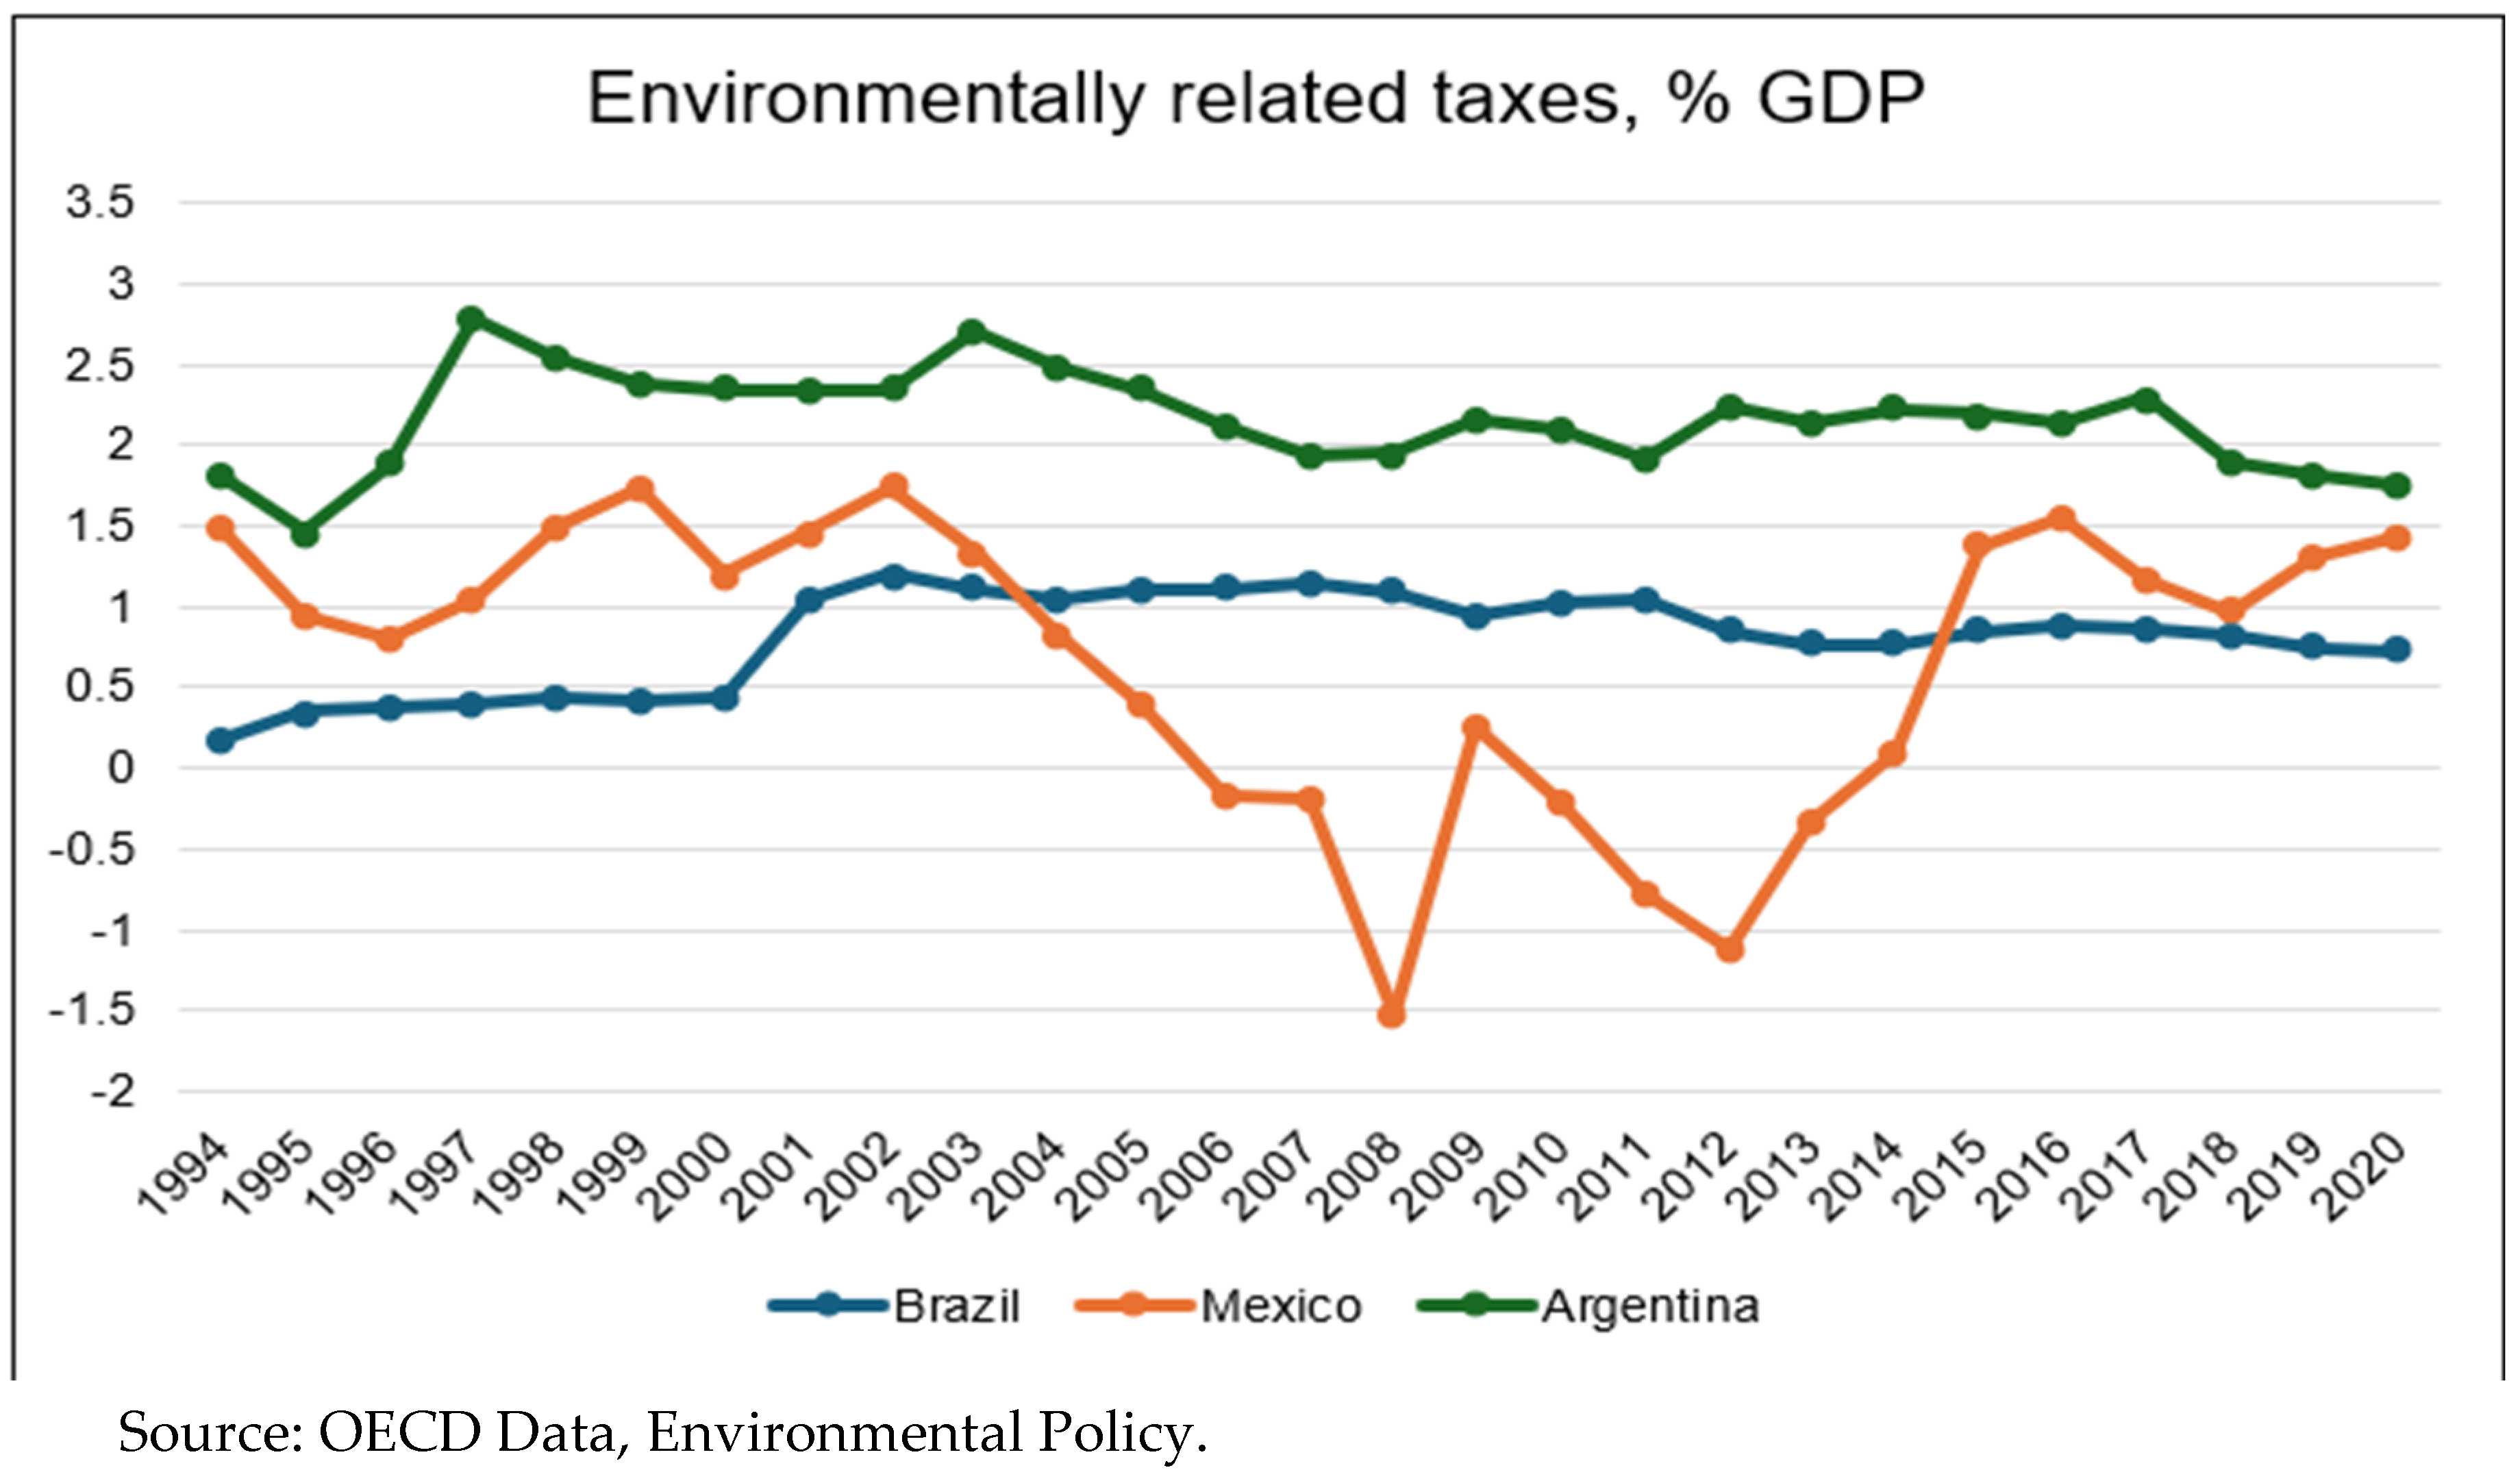
The OECD reports environmental taxes as a percentage of GDP. Argentina has the highest green product taxes, followed by Mexico and Brazil. Mexico showed negative figures between 2006 and 2014. Instead of collecting tax revenues from these taxes, the government disburses or subsidizes more than it collects for environmental concepts in a given year.
Figure 14 shows significant year-to-year variation and volatility for all three countries, suggesting possible policy changes or economic factors impacting environmental tax revenues. Argentina has placed a greater emphasis on environmental taxes than Brazil and Mexico, at least as a percentage of GDP. However, the trends have diverged in recent decades.
Figure 14.
Environmentally related taxes as % of the GDP.
Figure 14.
Environmentally related taxes as % of the GDP.
Conclusions
Latin America faces a complex web of challenges in its pursuit of decarbonization. Investment in renewable energy sources is necessary to transition away from fossil fuels. A skilled workforce specializing in green technologies and patent development is crucial but remains scarce. Additionally, a lack of robust international cooperation to share knowledge and resources creates further obstacles. The region’s overall export specialization in agricultural products leaves Latin America without promising routes for decarbonization.
A major challenge in environmental economics and policy design is the productive specialization of greenhouse gases, i.e., the phenomenon where different countries and sectors of economic activity emit distinct greenhouse gas profiles. This specialization depends on a country’s energy and resource endowments, industrial structure, and technologies employed in production processes. This specialization makes crafting international climate change policies complex, as countries with different economic profiles will have varying capabilities and burdens in reducing emissions.
Mirroring the intricate global web of trade and wealth distribution, we observe a concerning phenomenon: an international pollution division. This system, where different countries specialize in producing specific goods, also creates an unequal distribution of environmental burdens. While some nations reap the economic benefits of production, others bear the brunt of the associated greenhouse gas emissions. It highlights the need for a global approach to tackling climate change, acknowledging the shared responsibility for our collective carbon footprint.
Since consumption-based GHG accounting depends on the combined use of input-output tables and GHG inventories, the accuracy of the estimates depends on the quality of the statistical compilation of data and its degree of international comparability. Measuring the carbon footprint of global value chains is done indirectly.
While supplying renewable energy to developed nations is crucial, it is just one piece of the puzzle in tackling global emissions. To achieve lasting change, a multifaceted approach that addresses structural changes within domestic economies upgrades public infrastructure for sustainability and promotes environmentally sound agricultural practices is needed.
Industrial policy is essential to promote sustainable practices in agriculture and livestock production. Furthermore, large-scale investments in urban mobility solutions and renewable energy for transportation are identified as indispensable for achieving substantial decarbonization across the region. For this, there is the need for a dramatic shift in how we produce and trade natural resources. Sustainable agriculture will rely on renewable energy sources, biofertilizers, and other bio-based inputs. Additionally, we must move away from intensive cattle husbandry, which significantly contributes to greenhouse gas emissions.
The transition towards green energies in Latin America depends on substantial investment, which is pivotal in overcoming the region’s economic structural challenges. Latin American countries often need help adopting green energy, including reliance on traditional energy sectors, limited technological infrastructure, and insufficient financial resources. Investment is essential to bridge these gaps, providing the capital to develop renewable energy projects, modernize the energy grid, and support research and development in sustainable technologies. Public and private investments can drive the deployment of solar, wind, and hydroelectric power, enhancing energy security and reducing dependency on fossil fuels.
The conundrums of the Latin American green transition fetch old wine in new and new wine in old bottles. Problems related to the structural transformation of these economies gain momentum, such as short-termism in the time horizon of investment projects, low productivity, underinvestment as a percentage of the GDP, and insufficient finance for large-scale projects. It is also true that the green transition poses a window of opportunity for these countries to reposition their manufacturing in a new context of knowledge-intensive natural resources industries.
There is also a frantic enthusiasm for new concepts that become rapidly worn out, such as zero-net, ESG, and low-carbon. Much of this language has become widespread within a framework of old bottles because when superficially planned and implemented, it loses its substance and tends to legitimize the business-as-usual worldview.
Instead of locking in one path for this transition, Latin American countries had better not cling to panaceas but consider the threats, the risks, and the need to experiment with multiple paths and solutions simultaneously. However, this change implies the formation of a genuine developmental and environmental coalition guided by rigorous strategic considerations not captured by immediate interests. This is an overarching task for business government and party politics and demands societal engagement in the future. Paraphrasing Beckert (2024), muddling through is the alternative to a sold future.
References
- Beckert, Jens (2024) Verkaufte Zukunft Warum der Kampf gegen den Klimawandel zu scheitern droht, Berlin, Suhrkamp Verlag AG.
- Bianchi, Patrizio; Labory, Sandrine and Tomlinson, Philip R. (2023) Shaping sustainable industrial development paths in Bianchi, Patrizio, Labory, Sandrine and Tomlinson, Philip R. (edit.) Handbook of Industrial Development, Cheltenham, Edward Elgar Publishing.
- Chaopeng Hong et al. (2022). Land-use emissions embodied in international trade. Science (376). pp. 597-603. [CrossRef]
- Crippa M., Guizzardi D., Pagani F., Banja M., Muntean M., Schaaf E., Becker, W., Monforti-Ferrario F., Quadrelli, R., Risquez Martin, A., Taghavi-Moharamli, P., Grassi, G., Rossi, S., Brandao De Melo, J., Oom, D., Branco, A., San-Miguel, J., Vignati, E., GHG emissions of all world countries – JRC/IEA 2023 Report, EUR xxxx EN, Publications Office of the European Union, Luxembourg, 2023.
- Crippa, M., Guizzardi, D., Banja, M., Solazzo, E., Muntean, M., Schaaf, E., Pagani, F., Monforti-Ferrario, F., Olivier, J., Quadrelli, R., Risquez Martin, A., Taghavi-Moharamli, P., Grassi, G., Rossi, S., Jacome Felix Oom, D., Branco, A., San-Miguel-Ayanz, J. and Vignati, E., CO2 emissions of all world countries - 2022 Report, EUR 31182 EN, Publications Office of the European Union, Luxembourg, 2022. [CrossRef]
- Crippa, M., Guizzardi, D., Solazzo, E., Muntean, M., Schaaf, E., Monforti-Ferrario, F., Banja, M., Olivier, J.G.J., Grassi, G., Rossi, S., Vignati, E., GHG emissions of all world countries - 2021 Report, EUR 30831 EN, Publications Office of the European Union, Luxembourg, 2021. JRC126363. ISBN 978-92-76-41547-3. [CrossRef]
- Corrocher, N., Grabner, S. M., & Morrison, A. (2024). Green technological diversification: The role of international linkages in leaders, followers, and catching-up countries. Research Policy, 53(104972). [CrossRef]
- ECLAC. (2016). Premature industrialization in Latin America. United Nations publication.
- EDGAR (Emissions Database for Global Atmospheric Research) Community GHG Database (a collaboration between the European Commission, Joint Research Centre (JRC), the International Energy Agency (IEA), and comprising IEA-EDGAR CO2, EDGAR CH4, EDGAR N2O, EDGAR F-GASES version 8.0, (2023) European Commission.
- Eicke, L., & Weko, S. (2022). Does green growth foster green policies? Value chain upgrading and feedback mechanisms on renewable energy policies. Energy Policy, 165, 112948. [CrossRef]
- FAO. (2011). The state of the world’s land and water resources for food and agriculture (SOLAW) – Managing systems at risk. Food and Agriculture Organization of the United Nations, Rome and Earthscan, London.
- Friedlingstein, P., O’Sullivan, M., Jones, M. W., Andrew, R. M., Bakker, D. C. E., Hauck, J., Landschützer, P., Le Quéré, C., Luijkx, I. T., Peters, G. P., Peters, W., Pongratz, J., Schwingshackl, C., Sitch, S., Canadell, J. G., Ciais, P., Jackson, R. B., Alin, S. R., Anthoni, P., Barbero, L., Bates, N. R., Becker, M., Bellouin, N., Decharme, B., Bopp, L., Brasika, I. B. M., Cadule, P., Chamberlain, M. A., Chandra, N., Chau, T.-T.-T., Chevallier, F., Chini, L. P., Cronin, M., Dou, X., Enyo, K., Evans, W., Falk, S., Feely, R. A., Feng, L., Ford, D. J., Gasser, T., Ghattas, J., Gkritzalis, T., Grassi, G., Gregor, L., Gruber, N., Gürses, Ö., Harris, I., Hefner, M., Heinke, J., Houghton, R. A., Hurtt, G. C., Iida, Y., Ilyina, T., Jacobson, A. R., Jain, A., Jarníková, T., Jersild, A., Jiang, F., Jin, Z., Joos, F., Kato, E., Keeling, R. F., Kennedy, D., Klein Goldewijk, K., Knauer, J., Korsbakken, J. I., Körtzinger, A., Lan, X., Lefèvre, N., Li, H., Liu, J., Liu, Z., Ma, L., Marland, G., Mayot, N., McGuire, P. C., McKinley, G. A., Meyer, G., Morgan, E. J., Munro, D. R., Nakaoka, S.-I., Niwa, Y., O’Brien, K. M., Olsen, A., Omar, A. M., Ono, T., Paulsen, M., Pierrot, D., Pocock, K., Poulter, B., Powis, C. M., Rehder, G., Resplandy, L., Robertson, E., Rödenbeck, C., Rosan, T. M., Schwinger, J., Séférian, R., Smallman, T. L., Smith, S. M., Sospedra-Alfonso, R., Sun, Q., Sutton, A. J., Sweeney, C., Takao, S., Tans, P. P., Tian, H., Tilbrook, B., Tsujino, H., Tubiello, F., van der Werf, G. R., van Ooijen, E., Wanninkhof, R., Watanabe, M., Wimart-.
- Gütschow, J., & Pflüger, M. (v2. 2023). The PRIMAP-hist national historical emissions time series (1750-2022) 5 (2.5) [dataset]. Zenodo. [CrossRef]
- Gütschow, J.; Jeffery, L.; Gieseke, R.; Gebel, R.; Stevens, D.; Krapp, M.; Rocha, M. (2016): The PRIMAP-hist national historical emissions time series, Earth Syst. Sci. Data, 8, 571-603. [CrossRef]
- Hernández Soto, G. (2024). The role of foreign direct investment and green technologies in facilitating the transition toward green economies in Latin America. Energy, Volume 288, 2024. 129933, ISSN 0360-5442. [CrossRef]
- Hickel, J., & Kallis, G. (2020). Is Green Growth Possible? New Political Economy, 25(4), 469–486. [CrossRef]
- IEA (2024), The relationship between GDP growth and CO2 has loosened; it needs to be cut completely, IEA, Paris. Available at: IEA, Licence: CC BY 4.0 (IEA).
- IRENA. (2023). Renewable Energy Statistics 2023. International Renewable Agency.
- Jones, Andrew and Ström, Patrik (2024). Introduction: conceptualizing research into the green economy in Jones, Andrew and Ström, Patrik (edit.) Research Handbook on the Green Economy, Cheltenham, Edward Elgar Publishing.
- Krippner, G.R. (2011). Capitalizing on crisis: the political origins of the rise of finance, Cambridge (MA), Harvard University Press.
- Lenzen, M., Kanemoto, K., Moran, D., & Geschke, A. (2012). Mapping the structure of the world economy. Environmental Science & Technology, 46(13), 7268-7275.
- Lenzen, M., Kanemoto, K., Moran, D., & Geschke, A. (2013). Building a reliable, multi-regional input-output table for the world. Economic Systems Research, 25(3), 38-62.
- Lee, Keun (2024). Innovation–Development Detours for Latecomers Managing Global-Local Interfaces in the De-Globalization Era, Cambridge, Cambridge University Press.
- Li, Z., Kuo, T. H., Siao-Yun, W., & The Vinh, L. (2022). Role of green finance, volatility and risk in promoting the investments in Renewable Energy Resources in the post-covid-19. Resources Policy, 76(January), 102563. [CrossRef]
- Mazzanti, Massimiliano and Zecca, Emy (2023). Industry, innovations and transition to the green and circular economy in Bianchi, Patrizio, Labory, Sandrine and Tomlinson, Philip R. (edit.) Handbook of Industrial Development, Cheltenham, Edward Elgar Publishing.
- OECD (2011), Towards Green Growth, OECD Publishing. [CrossRef]
- OECD (2021), Trade in embodied CO2 (TeCO2) Database.
- OECD (2023). OECD Inter-Country Input-Output Database. Available online: http://oe.cd/icio.
- OECD/IEA (2024), “RD&D Budgets per GDP”, IEA Energy Technology RD&D Statistics (database). [CrossRef]
- Poore, J., & Nemecek, T. (2018). Reducing food’s environmental impacts through producers and consumers. Science, 360(6392), 987-992.
- Rousseau, C., Yang, D., Yang, X., Yuan, W., Yue, X., Zaehle, S., Zeng, J., and Zheng, B.: Global Carbon Budget 2023, Earth Syst. Sci. Data, 15, 5301–5369. [CrossRef]
- Sachs, Jeffrey D. et al. (2019) Importance of Green Finance for Achieving Sustainable Development Goals and Energy Security in Sachs, Jeffrey D. et al. (edit) Handbook of Green Finance: Energy Security and Sustainable Development, Singapore, Springer.
- Sharma, G. D., Verma, M., Shahbaz, M., Gupta, M., & Chopra, R. Transitioning green finance from theory to practice for renewable energy development. Renewable Energy 2022, 195, 554–565. [CrossRef]
- United Nations (2024). COMTRADE database. Available online: https://comtrade.un.org/.
- Whittaker, D. Hugh; Sturgeon, Timothy J.; Okita, Toshie; Zhu, Tianbiao (2020) Compressed development time and timing in economic and social development, Oxford, Oxford University Press.
- World Bank, (2024). World Development Indicators DataBank. Accessed 12 February 2014.
- Zhang, B., & Wang, Y. (2021). The Effect of Green Finance on Energy Sustainable Development: A Case Study in China. Emerging Markets Finance and Trade, 57(12), 3435–3454. [CrossRef]
|
Disclaimer/Publisher’s Note: The statements, opinions and data contained in all publications are solely those of the individual author(s) and contributor(s) and not of MDPI and/or the editor(s). MDPI and/or the editor(s) disclaim responsibility for any injury to people or property resulting from any ideas, methods, instructions or products referred to in the content. |
© 2024 by the authors. Licensee MDPI, Basel, Switzerland. This article is an open access article distributed under the terms and conditions of the Creative Commons Attribution (CC BY) license (https://creativecommons.org/licenses/by/4.0/).
