1. Introduction
Toll plazas are essential connectors that enable efficient and adequately maintained road networks in the current infrastructure and transportation environment. The term “toll plaza” refers to a particular location along a road or highway where motor vehicles must pay a fee, or “toll,” to access and use the road. Toll plazas are essential for funding continuing projects for road repair and development. The tolls collected are frequently used for improvements, expansions, and maintenance, ensuring that the roads remain effective and safe for all users [
1]. Modern toll systems frequently use electronic toll collection (ETC) techniques like RFID technology to ease traffic and improve the whole travel environment.
The toll plaza methods, rules, and procedures used to manage and control traffic flow on roads are referred to as traffic management. Traffic management is to reduce congestion, assure safety, and maximize utilization of the current road networks. Infrastructure design, traffic engineering, and the use of intelligent technology all go into effective traffic management [
2]. Traffic congestion happens when the number of vehicles on the road is more significant than its capacity. Traffic congestion is an issue in every country’s major cities. The main components of the toll plaza are toll booths, which are essential because lane signals and signs provide crucial information as drivers approach the toll plaza. Administrative buildings are also essential as the administrative staff, maintenance workers, and operational control centers are housed in these facilities to supervise the toll collection procedure, respond to consumer questions, and resolve any problem. The main drawbacks of the conventional toll plaza are traffic jams and delays because every car must stop separately to pay tolls, especially during busy travel hours. For conventional toll plaza authorities, labor expenditures related to hiring and teaching toll collectors can be significant, adding to operational costs. Handling cash transactions raises security issues that could put toll collectors in danger of theft or robbery. Additionally, there are environmental repercussions because idling cars at toll booths waste fuel and contributes to air pollution.
Traffic congestion is still present despite most toll plazas using electronic toll collection. The time delay at toll plazas might be reduced by converting the lanes to electronic toll collection. However, it is still not feasible because all users of toll facilities would need to have electronic transponders. Therefore, this approach may be put into practice once all users sign up as ETC customers. For this reason, there should be both traditional and electronic toll collection methods, and services should handle the vehicles in a lane such that the greatest number of vehicles can pass through a lane without experiencing a long wait time at the plazas. The optimization of the Peshawar toll plaza in Peshawar holds immense significance as it aims to reduce traffic congestion, enhance revenue generation, improve operational efficiency, enhance user satisfaction, and contribute to sustainability. By implementing advanced technologies, streamlining toll collection processes, and adopting efficient traffic management strategies, this research can lead to shorter travel times, cost savings, a smoother commuting experience, and a more environmentally friendly toll plaza. The findings from this research can serve as a valuable blueprint for toll plaza management, benefiting not only the Peshawar toll plaza but also other toll plazas and transportation systems, ultimately fostering efficient and user-friendly transportation networks. The Peshawar toll plaza in Peshawar is being optimized to raise the operation’s efficacy, efficiency, and overall performance. The objectives of this research work are as follows:
Improve the throughput of the toll plaza.
Decrease the time delay at toll plazas by making a simulation model by which the best favorable lane pattern can be determined.
Reduce the long queue length during peak hours
2. Literature Review
Queuing theory is a well-known theory of mathematics that deals with waiting lines and queues [
3]. It is widely used in multiple areas with the prominent use of services, healthcare, transportation, and telecommunications sectors. Researchers use it according to the needs and requirements, such as modeling, analysis, and optimization. Recent technological developments have shown that electronic toll collection is beneficial, economically sustainable, and helpful. The users utilized it quickly and electronically. Before, in ordinary or conventional toll plazas, the drivers must either slow down or reduce their speed to pay the toll manually [
4]. The general volume of traffic flow is still influenced by the actions of the cars in front of the toll plaza. There are often traffic blocks during the toll pay in conventional toll plazas, particularly in the lanes, even though there are no backups on the other routes or at the toll gates. Toll plazas can improve traffic flow and reduce travel times [
5].
Due to the latest developments in Technology, Electronic Toll Collection (ETC) systems are becoming a common way to pay the toll, and it improve the toll plazas’ operational efficiency. The efficiency of toll collection procedures is enhanced by combining simulation models with automatic vehicle identification technologies, such as RFID or license plate recognition. Due to these simulations, it is possible to test and validate the functionality of ETC systems. Proper training should be arranged for drivers to educate about the E-Tag system’s procedure, method, and mechanism. During the sessions and seminars, there should be proper and time-to-time alterations to show the model simulation and automatic vehicle recognition technology [
6].
Before practically implementing, it is necessary to ensure it is robust and will work accurately, and the system should be simulated. The installation engineer should create a different environment before the physical installation of the system. The PTV Vissim will create a virtual environment that accesses operating methods virtually. The software’s main benefit is that it can create the environment by creating lanes, toll booths, and toll collection technology [
7]. The simulation software can also provide an environment where the traffic can be changed and adjusted according to the projected throughput because only observation and collecting data in the special time interval is insufficient [
8]. The changing features of the PTV Vissim are changing the possible traffic volumes. It can also create an environment where the toll plaza performance and its surrounding road network can be evaluated. Different congestion scenarios with traveling patterns and driver behaviors can also be projected [
9]. All the creation means to be practical before physical installation for the traffic jam in the future. Due to this evaluation, the project will be more robust and perform well regarding congestion and other features. Through this, the overall performance will be improved [
10].
The main aim of the proposed research work is to improve the performance of the Peshawar toll plaza in the KPK province of Pakistan. The main objective of the proposed research work is to enhance the throughput along with the systematic way to traffic flow. It will collect data parameters like arrival rate, delay, and service proving time. These parameters will be divided using different vehicle types that pass through the toll plazas. Further, it will be divided into time variance, like peak hours of the weekdays along with lanes, and the delay time would be classified at various time intervals. The statistical analysis of the maximum, minimum, and average delay will also be evaluated. The statistical evaluations between ETC, Mixed, and E-tag lanes will be found and compared to make the research more effective and valuable.
3. Methodology
Traffic jams due to heavy traffic are a common problem that can be noticed at every toll plaza. They were making the queue bigger and bigger. These long waits make the driver feel frosted and irritated. Arriving rate, delay time and service time of different types of vehicles are collected at toll plazas for different lanes during peak hours of the weekdays and the delay time would be classified in different time intervals. The statistical analysis of the maximum delay, average delay, and minimum delay is evaluated. The statistical evaluations between ETC, Mixed, and E-tag lanes would be calculated and checked for significance values. The results from different scenarios would be simulated in software and the LOS would be checked for sustainable movements of different vehicle types on different lanes. The results from different scenarios would be compared and checked with the most optimum configurations and suggestions would be proposed for efficient and intelligent operations configurations. The study uses a simulation methodology to tackle the real-time problem. The Peshawar Toll Plaza is virtually rendered for effective practical implementation, and several traffic scenarios are created and simulated. It is tried to avoid real-world traffic flow and implement the simulation safely and affordably. The PTV Vissim is used in the proposed study due to its primary and prominent features [
11]. Using the program, a toll plaza environment is created and generated. In the created environment, real-time traffic situations and collect information on traffic patterns and flow are created.
The study investigates the layout of different lanes to find and evaluate the impact of varying lane configurations on traffic flow. Every lane configuration is created to create a real-world scenario, and the effect on traffic will be assessed. The study utilized the dataset with parameters like traffic volume, the kinds of vehicles that travel through the toll plaza, and the current configuration of the toll booths before executing simulations [
12]. The proper setup of the simulations is based on this real-time data. Our team digitally reconstructed the Peshawar Toll Plaza using PTV Vissim. This entails duplicating the amount of lanes, the layout of the toll booth, and other elements that influence traffic flow. The aim is to make a real-time digital copy that resembles the toll plaza. To examine distinct lane usage, the researchers generated a variety of traffic scenarios. These scenarios are given below.
What is the maximum time for a vehicle to wait for its turn at the toll booths?
What is the time frame for a drive in a queuing line?
What is the maximum capacity of a toll plaza for many vehicles to pass through the booth?
How crowded the plaza becomes
How can the toll plaza be used efficiently?
Once the setup is developed, the data is collected and analyzed. The simulation is run in real-time in each scenario circumstances. Then, the statistical and visualized results are compared to find the best scenario regarding time, capacity, and performance.
3.1. Data Collection
A robust data collection setup is essential to create impactful research. The attributes of the developed dataset are the plaza’s design, number of lanes, volume of traffic, and kinds of vehicles that use it. The architecture of the toll plaza is also critical to be done. “The National Highway Authority (NHA)” and other pertinent sources are used for the dataset collection setup.
Table 1 shows the collected data.
3.2. Model Development
After dataset development, it is compulsory to develop the model of the Peshawar toll plaza using PTV Vissim. The model will consist of the toll plaza’s physical design, the quantity and all kinds of vehicle lanes, and the number of vehicles that run on the road. Real-time data fetched from the toll plaza validated and calibrated the model.
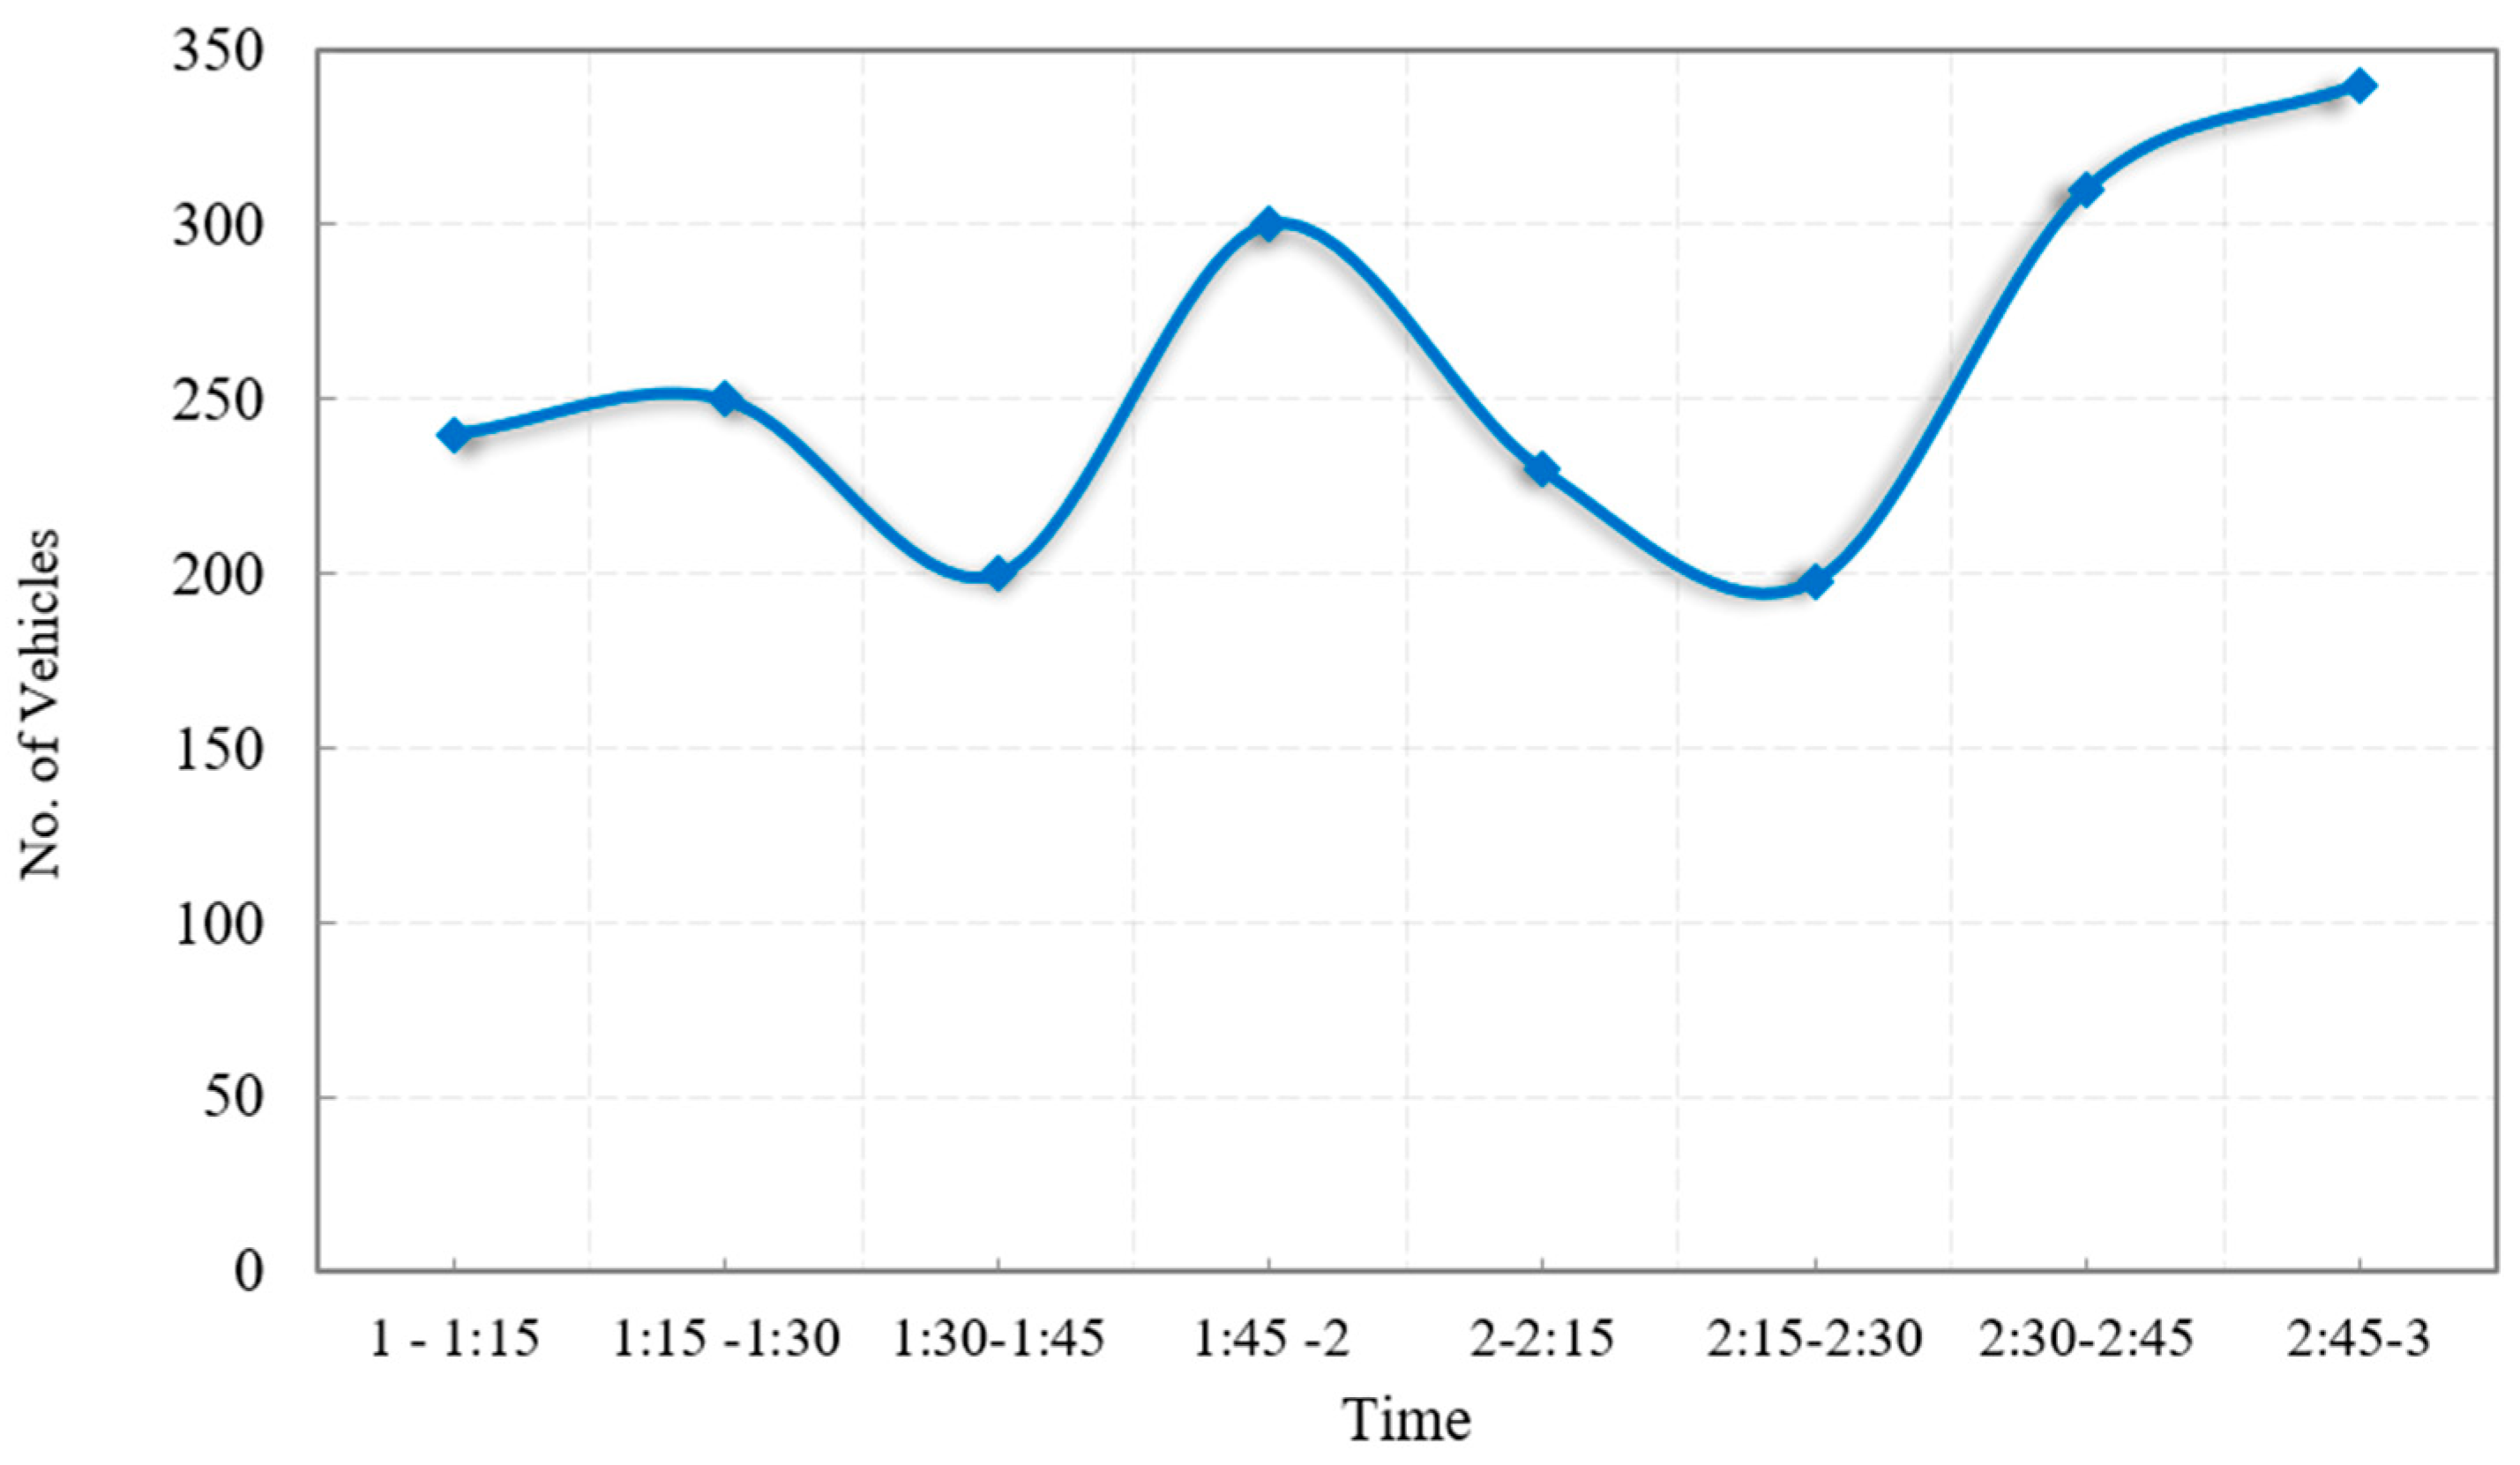
Figure 2 shows the number of cars passing in a time.
Multiple vehicles that use the toll plaza in a given time frame are enlisted. These vehicles are cars, trucks, and even bikes. The dataset will count not only the vehicles but also the arrival patterns, such as peak hours and off-peak hours. In peak time, a maximum number of vehicles will utilize the toll plaza. In contrast, in off-peak hours, the vehicle volume will be comparatively low in the developed dataset. The traffic volume, lane configurations, and physical layout are all included in this model. Then, to guarantee the model’s accuracy and dependability when simulating various traffic conditions and lane layouts, it is meticulously calibrated and validated using real-time data. This thorough modeling procedure is essential to the study’s capacity to offer insightful recommendations for enhancing traffic flow.
3.3. Development of Each Line
The developed research project is established by creating different lane pattern scenarios. These scenarios will be used to simulate and evaluate the performance of toll plazas. These scenarios included a cash line (mixed pattern), dedicated ETC lanes, and dedicated cash lanes. Each scenario is simulated using PTV Vissim, and the traffic volume, travel time, and delay time are recorded. Each lane pattern scenario indicator includes travel time, delay time, and the number of vehicles using each lane. The results have been compared across the different lane patterns, and the most effective lane pattern has been identified.
3.4. Difference between Existing Toll Plaza Lanes Scenario and Different Toll Plaza Pattern Scenario
This scenario concentrates on the current or pre-existing conditions of a toll plaza. It aims to replicate the real-world situation as accurately as possible. The primary purpose of this scenario is to model and simulate the actual traffic conditions, lane configurations, and toll booth operations at the toll plaza before any changes or optimizations are made. Different toll plaza lane scenarios explore potential changes and optimizations to the toll plaza’s lane configurations and traffic management strategies. The primary purpose is to test various alternative scenarios, such as different lane patterns, toll booth assignments, or traffic control strategies, to identify traffic flow improvements and reduce congestion. Although data from the current toll plaza might be used as a basis, the simulation model is modified to reflect the modifications suggested in the various scenarios [
13]. Researchers examine each alternative scenario’s performance to ensure which scenarios can provide the advantages. It assists in determining the best adjustments to make to improve traffic flow and lessen congestion. While the alternative toll plaza pattern scenario investigates possible modifications and optimizations, the current toll plaza lanes scenario concentrates on the current state of affairs.
4. Implementation
The proposed effort highlights traffic control systems for lane layout as the primary research focus. Toll plaza performance is assessed through the use of simulator models. These models help transportation planners and engineers understand how several factors affect the efficiency of the toll plaza, such as traffic volume, lane configuration, toll collection methods, and operating strategies. Modifies and facilitates decision-making through the toll plaza operational replication.
4.1. PTV VISSIM
PTV VISSIM is a well-known software program that has several uses in planning, designing, and analyzing transportation systems. It is very effective for planning the public transportation system. It enables users to optimize routes, schedules, and passenger capacity by modelling and analyzing transit operations. The basis of PTV VISSIM is bus data along with the tram systems. The end users can use the process to evaluate and replicate various road user behaviours and spot possible sources of conflict. These features and this software can also give you the services to update you about safety precautions, whether they are effective or not. This makes it easier to find and put into practice the best ways to improve traffic safety and lower the likelihood of collisions. Data collection, calibration and validation, traffic analysis, toll plaza layout optimization, toll collection tactics, and line setup are the main components of the PTV VISSIM.
After implementing the chosen optimizations, keep an eye on the toll plaza’s performance. To get the required results, tweak and fine-tune the strategies as necessary. It’s crucial to note that this is only a broad approach and that a thorough investigation of the regional conditions, traffic patterns, and stakeholder requirements would be necessary to determine the precise optimization techniques for the Peshawar toll plaza in Peshawar.
5. Results and Analysis
The toll plaza’s current cash and electronic lane configuration caused the most car delays. Because the cash lanes moved more slowly in this layout, there was a bottleneck at the toll plaza. Two minutes and ten seconds is the highest delay per vehicle examined.
5.1. Waiting Time vs Existing Each Lane
According to
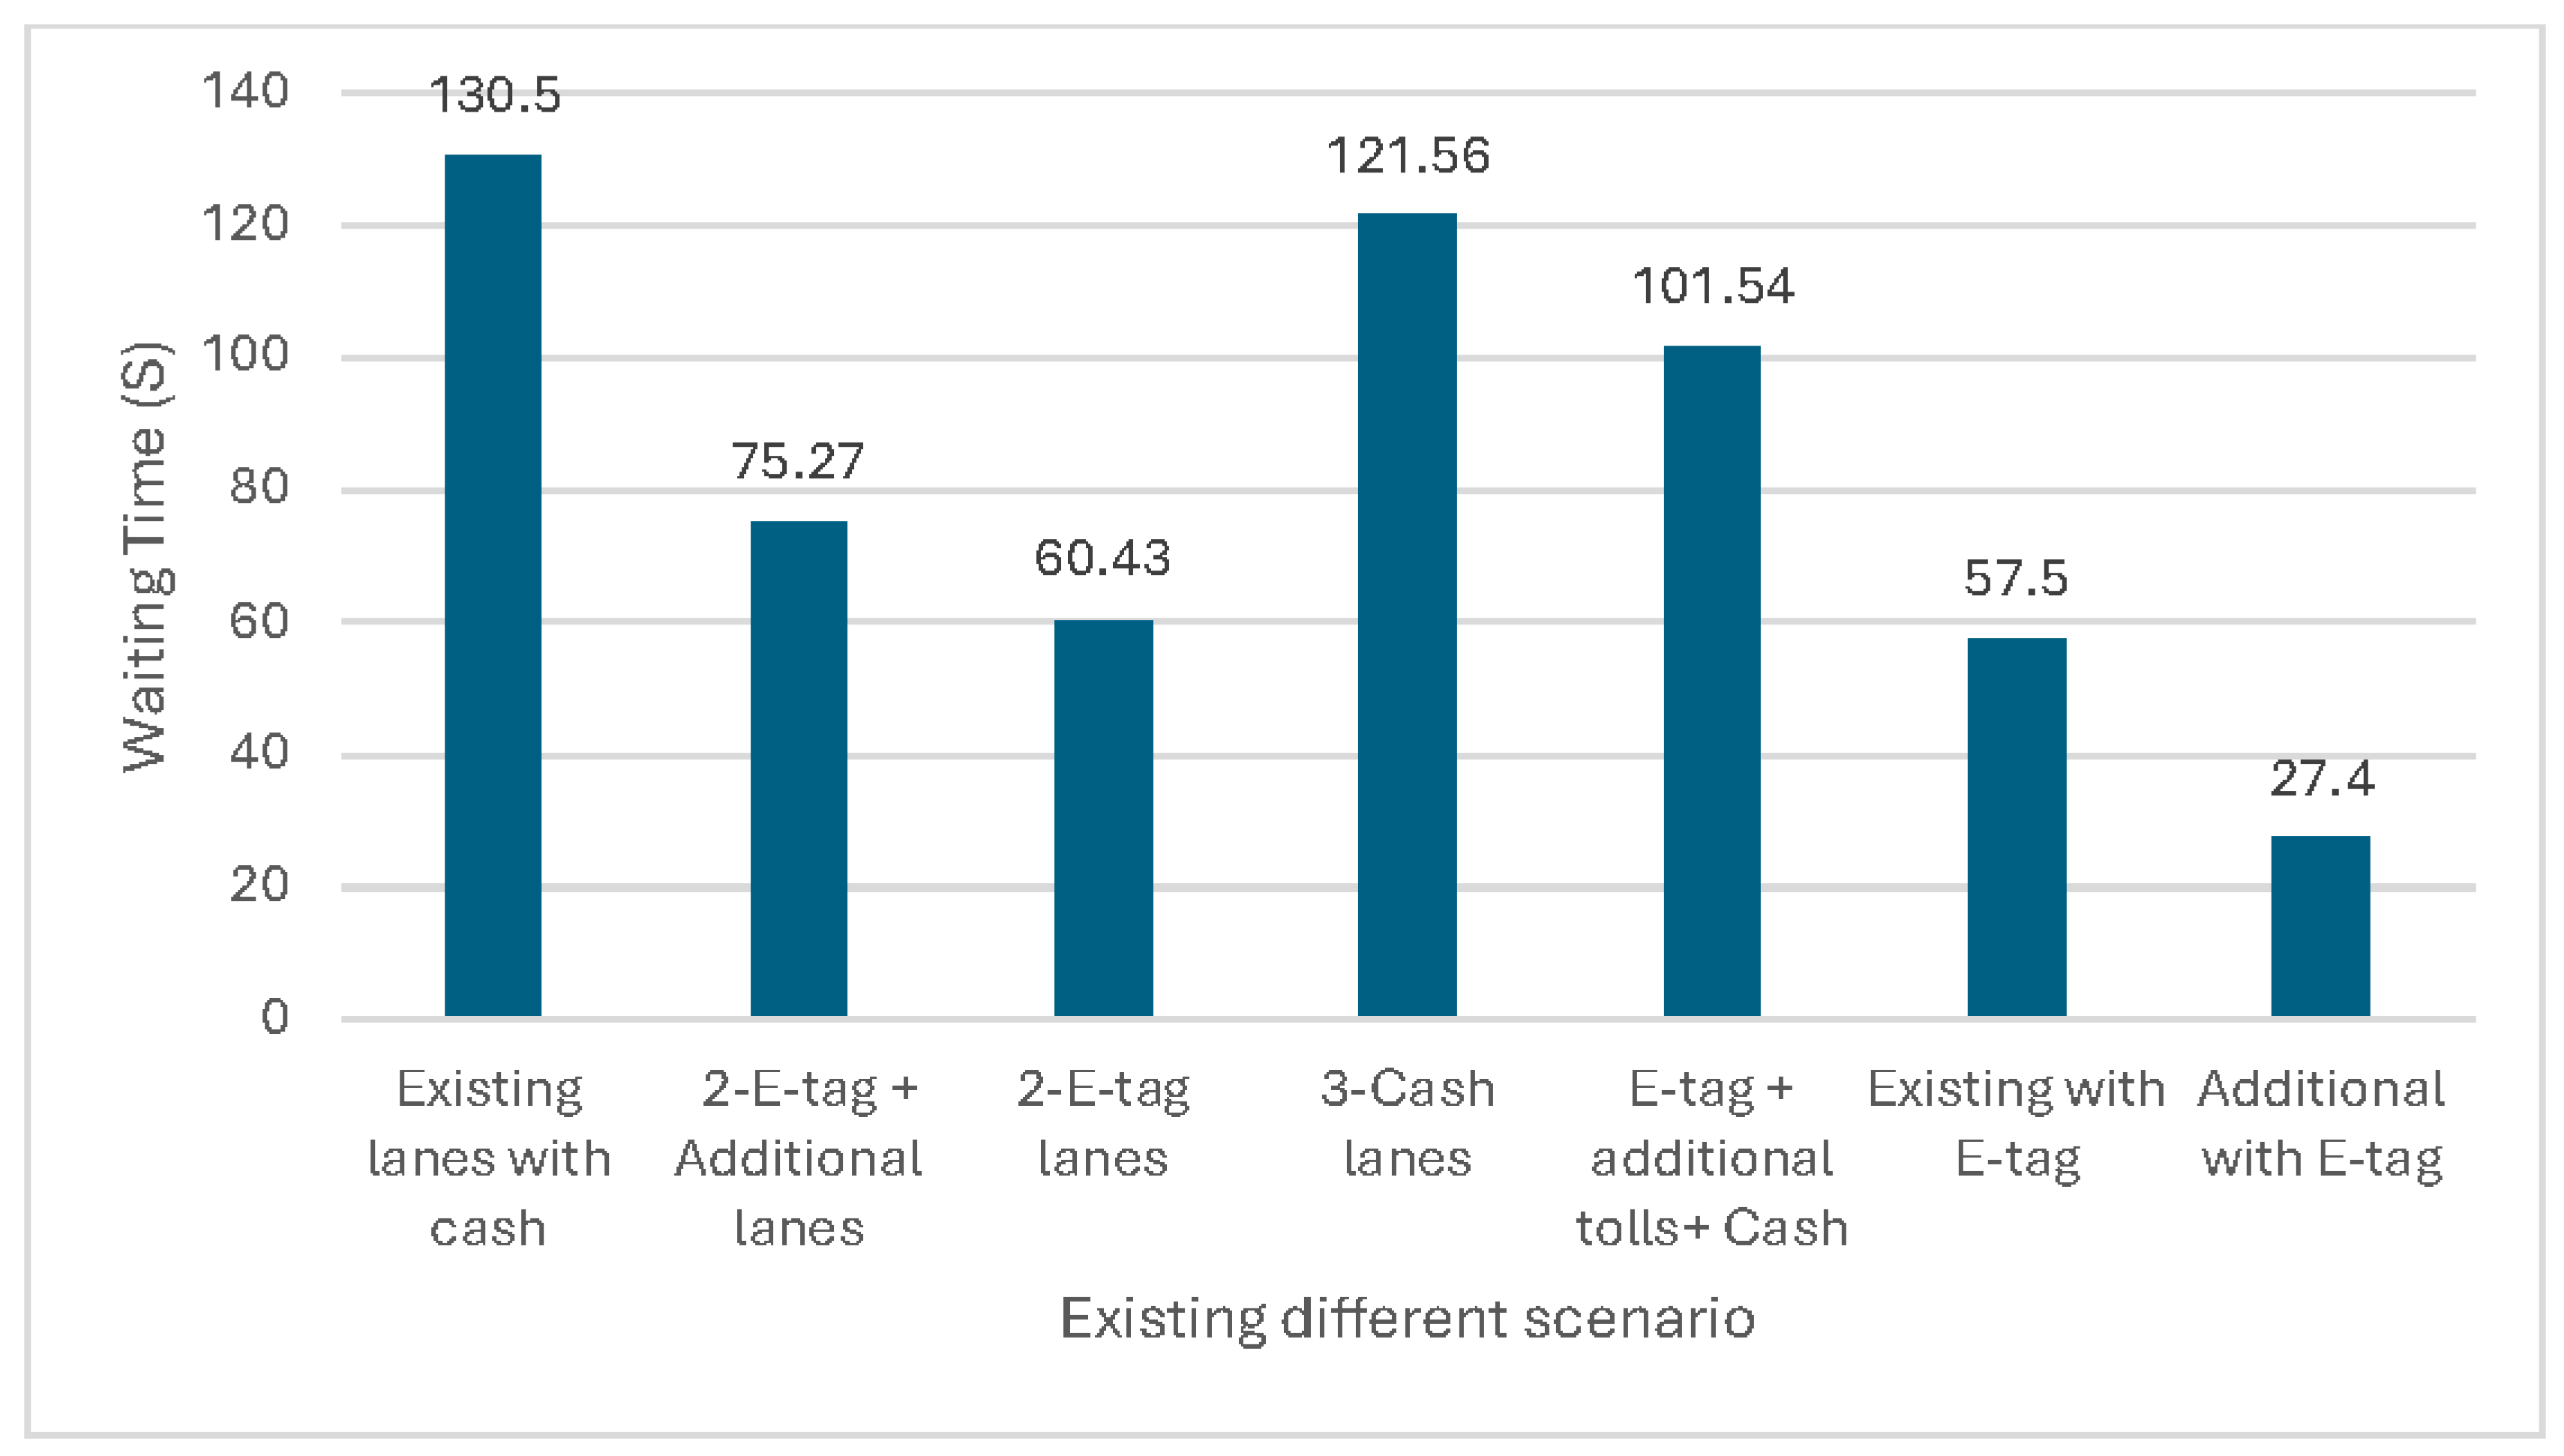
Figure 4, variations in the number of lanes affect waiting time, with more lanes and E-tags resulting in shorter waiting times. Optimal allocation of cash and electronic toll collection lanes reduces waiting time for different payment methods. Traffic flow is streamlined with dedicated lanes for particular vehicles, and time is reduced. Based on these, it can be said that the traffic lane management contributed to improved toll plaza efficiency and waiting time optimization. Special lane management helps allocate lanes effectively depending on payment methods for a specific kind of vehicle to maximize toll collection efficiency. By separating cars, dedicated lanes inherently improve traffic flow and shrink the waiting times and congestion.
The effect of E-tag lanes and lane management concerning time is shown in
Figure 3. From the Figure, it is assumed that waiting times for a few cars are correlated with an increase in lanes. E-tag lanes shrink the waiting time because passing cars don’t need to stop. This finding demonstrates the significance of assigning lanes strategically based on payment methods. The result shows that the toll plazas can efficiently reduce the time spent on vehicles by adopting different modes of payment, such as optimizing the cash methodology and E-tag lanes. If the mode of payment is more convenient using technology, the overall traffic flow and customer experience will be improved.
5.2. Waiting Time vs Different Lanes Scenario
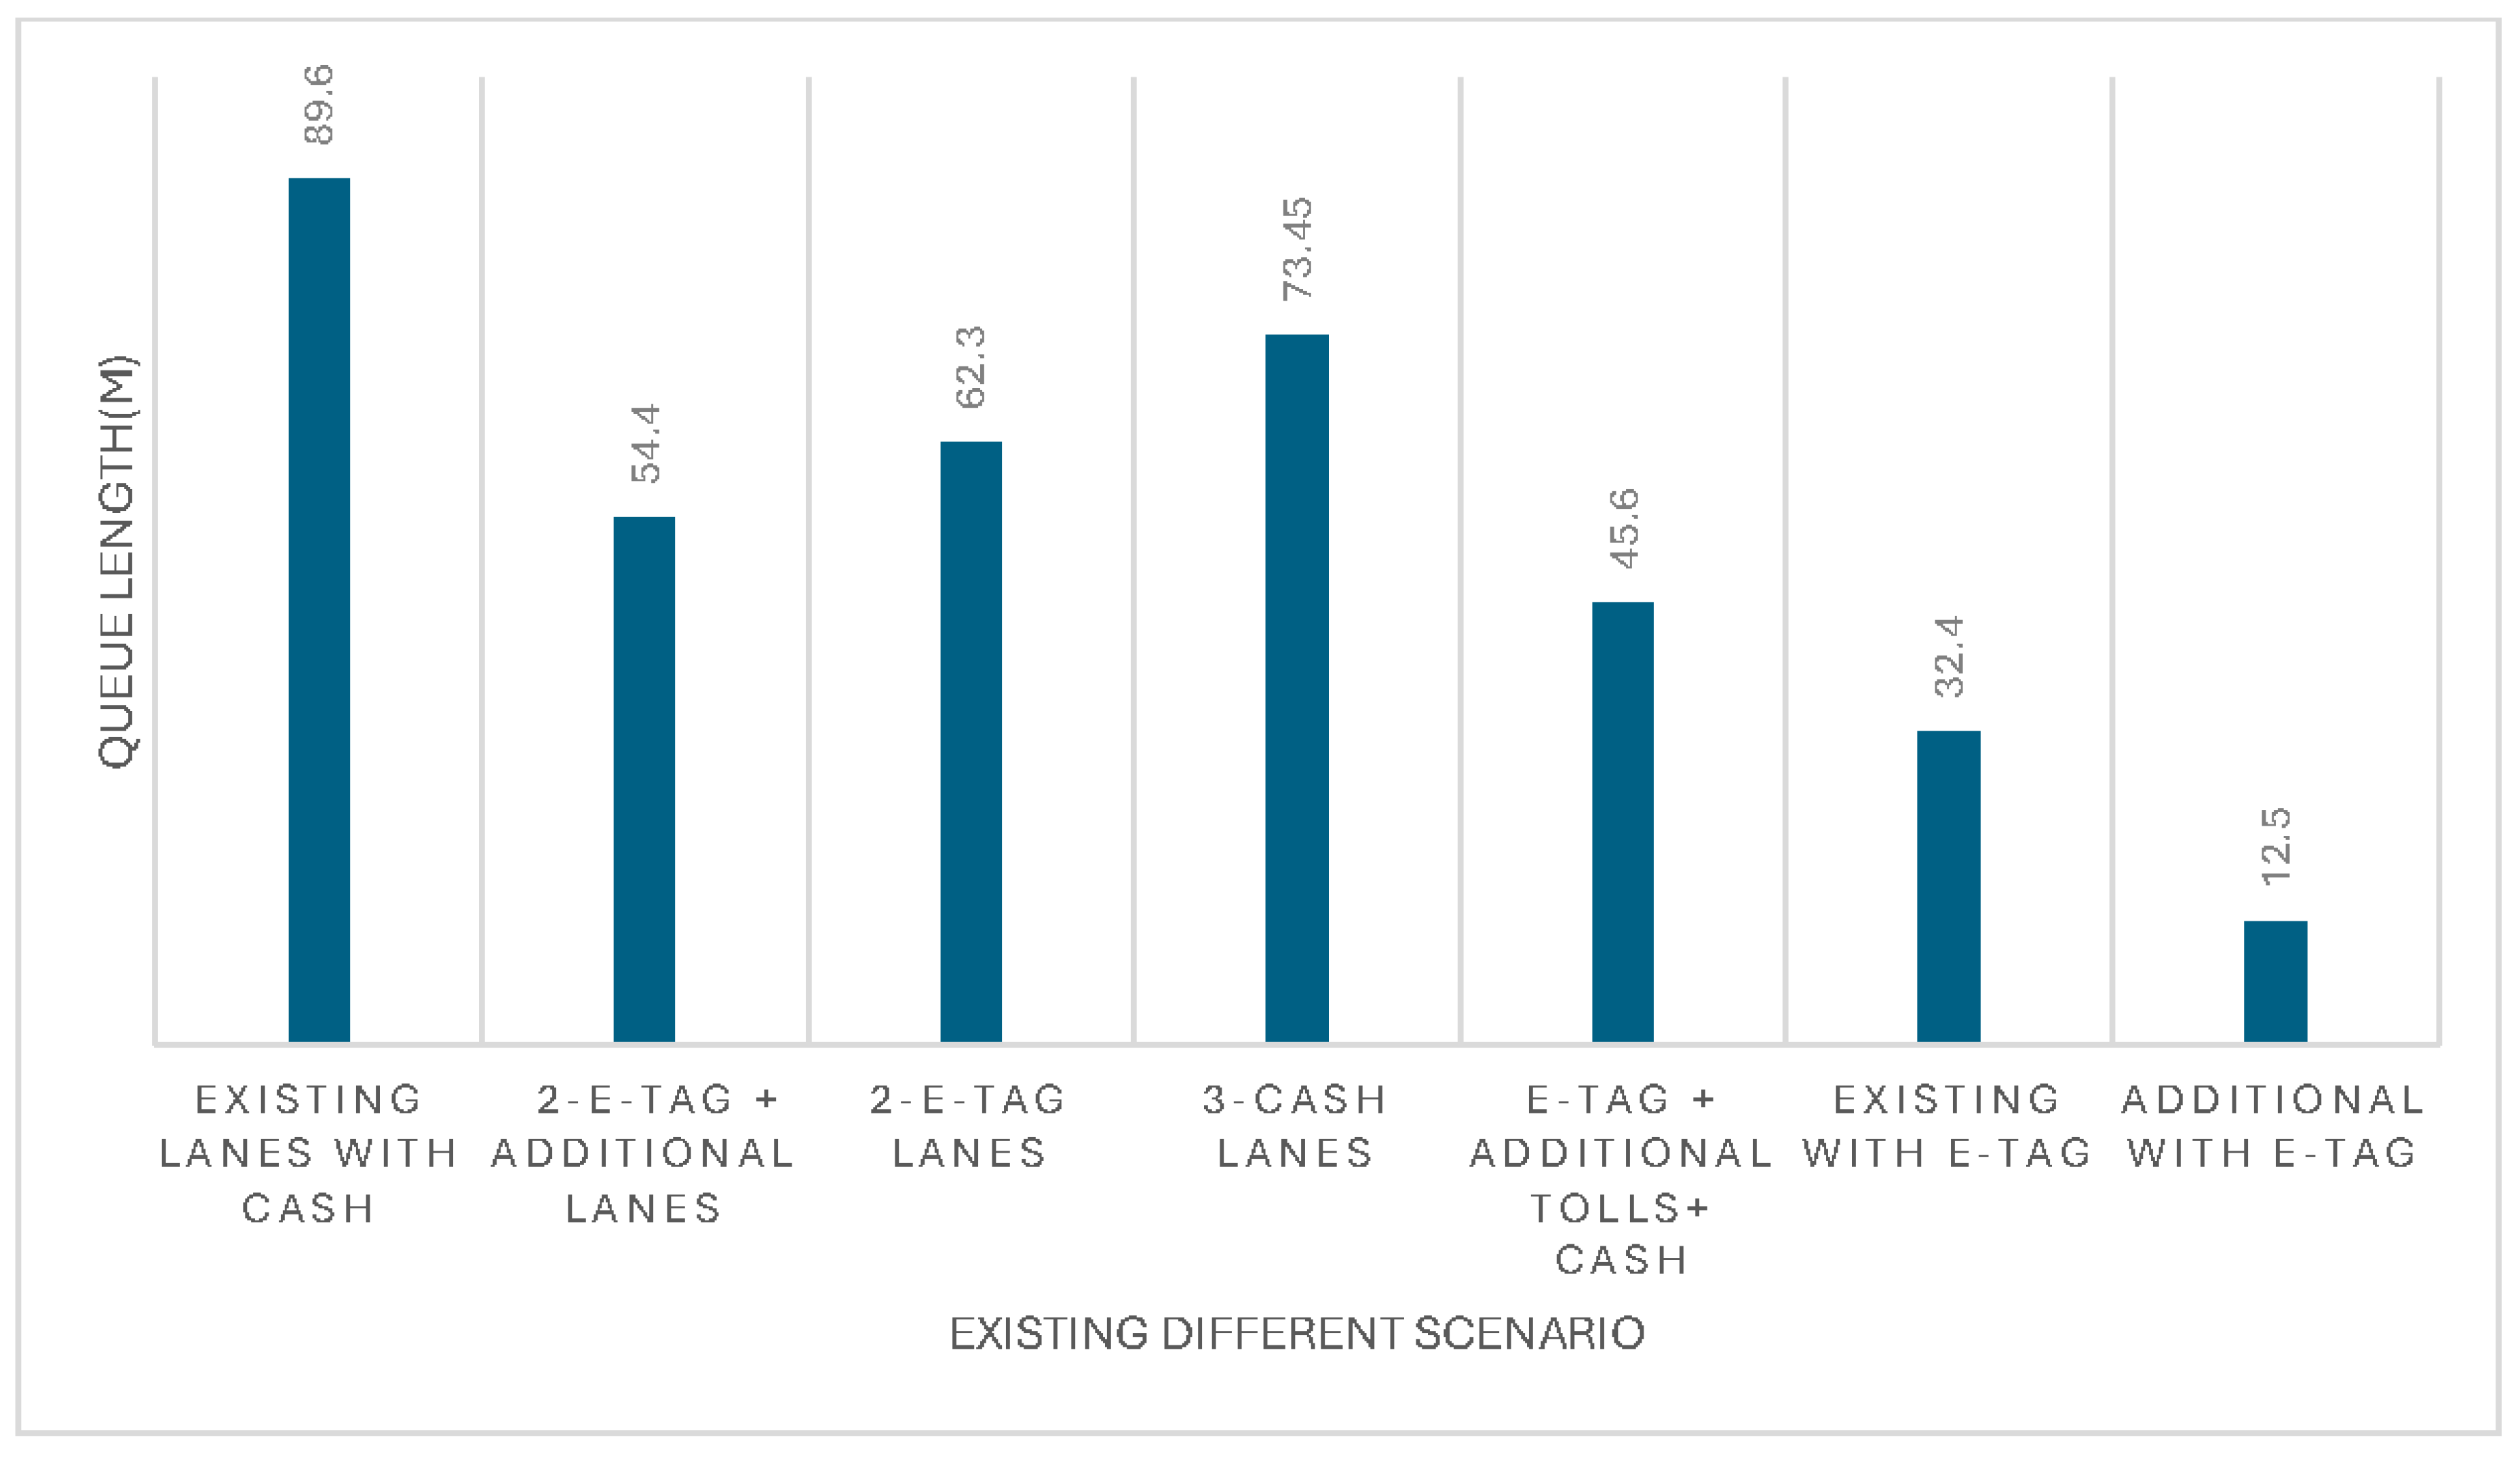
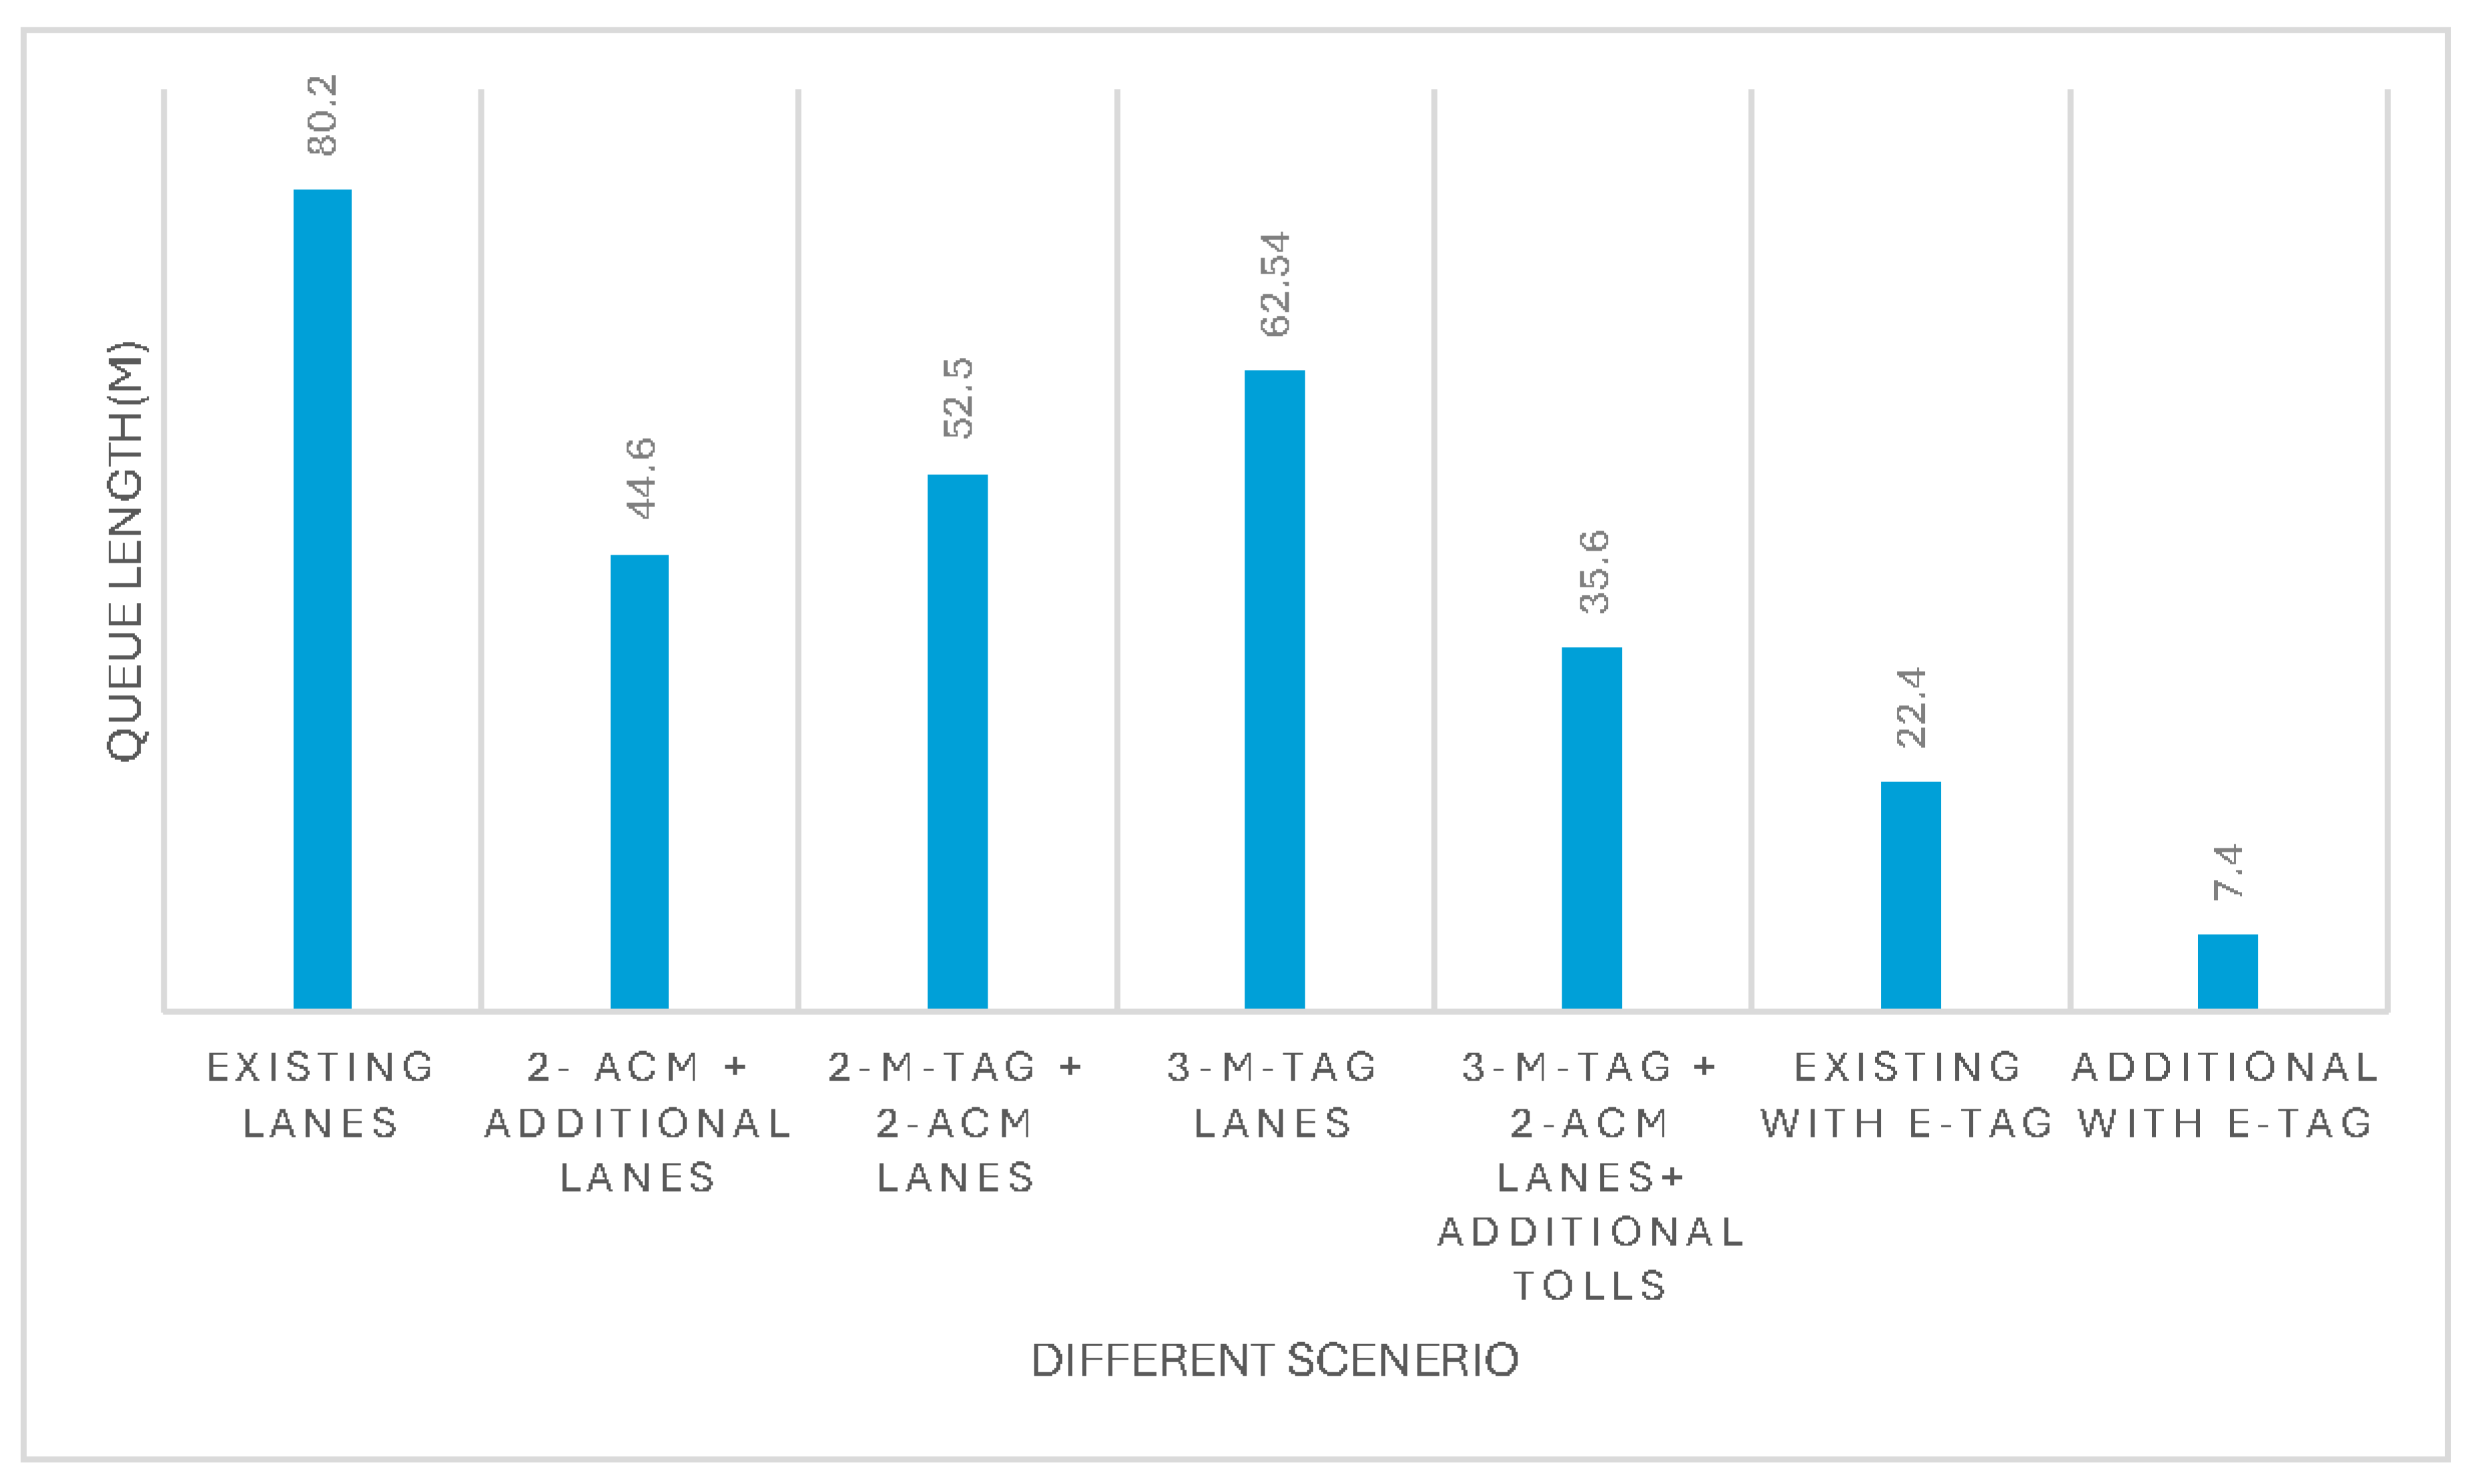
Queue lengths significantly impact pre-existing lanes, as shown in
Figure 4. Longer lines make the waiting time long because the cars must wait for their turn to pass through the toll booths. Longer wait times cause delays and affect the toll collection and transactions. This delay is mainly caused due to technological error. Logical chances for improving queue duration will be affected if the lane layout scenario is not regularly monitored and adjusted based on traffic updates. All these factors will be considered and improved with time to reduce wait times and improve traffic flow at the toll plaza.
Figure 4.
Waiting time vs Different lanes scenario.
Figure 4.
Waiting time vs Different lanes scenario.
The influence of the current lane arrangement at toll plazas on waiting vehicle line lengths is shown in
Figure 4. The layout and arrangement of lanes directly impact how long cars must wait in line to enter toll booths. Longer lines create a congested traffic volume and longer wait times. The necessity of lane allocation schemes for adequate traffic flow at toll plazas is highlighted by the fact that in the absence of such dedicated lanes, these vehicles mixing with general traffic further contribute to longer wait times because of their different features and toll payment options. It is shown in the existing lane of
Figure 4.
5.3. Queue Length vs Existing Lane Scenario
Various payment options also significantly impact the length of the line. Suppose the percentages of ETC and cash lanes are not equal, which is not practically equal. ETC lanes allow the vehicle to pass without pausing if proper E-tag equipment exists. Because of this, the wait time for ETC lanes is decreased by 30%, as shown in different results. Toll plaza operators can continuously monitor traffic flow and modify the number of lanes in response to real-time demand. Longer wait times are also ensured by having enough toll operators and staff at toll booths, which leads to faster.
Figure 5 illustrates how line length is influenced by allocating different lanes for cash ETC payments. The outcome of the E-tag is significantly impactful. In comparison, the existing lanes with cash have the lowest efficiency. The figures demonstrate how queue durations can be balanced. It can be done by distributing lanes, traffic patterns, and payment preferences. Toll plaza operators may guarantee enough lanes for every payment method, decreasing traffic congestion and preserving a more seamless traffic flow by carefully allocating lanes.
5.4. Queue Length vs Different Lanes Scenario
Firstly, higher throughput means reduced waiting times for motorists, leading to decreased congestion and improved traffic flow. This can have a positive impact on overall journey times and enhance the commuting experience for drivers.
Figure 6 likely illustrates that as the number of lanes at the toll plaza increases (thus increasing lane capacity), the throughput (number of vehicles passing through the plaza per unit of time) also increases. The statement acknowledges practical limitations to the number of lanes that can be added to a toll plaza. These limitations may arise due to physical space constraints, budget constraints, or environmental considerations. With a higher throughput, waiting times for motorists are reduced. Vehicles can pass through the toll booths more quickly, resulting in shorter queues and less time spent waiting in line. Reduced waiting times translate to decreased congestion at the toll plaza. Congestion occurs when vehicles stack up in long queues, causing delays and frustration. By increasing throughput, congestion is minimized. An increase in throughput contributes to improved traffic flow not only at the toll plaza itself but also on the surrounding roadways. As vehicles exit the plaza more swiftly, they can merge back into traffic more seamlessly.
5.5. Existing Lanes Scenario vs. Throughput (X100)
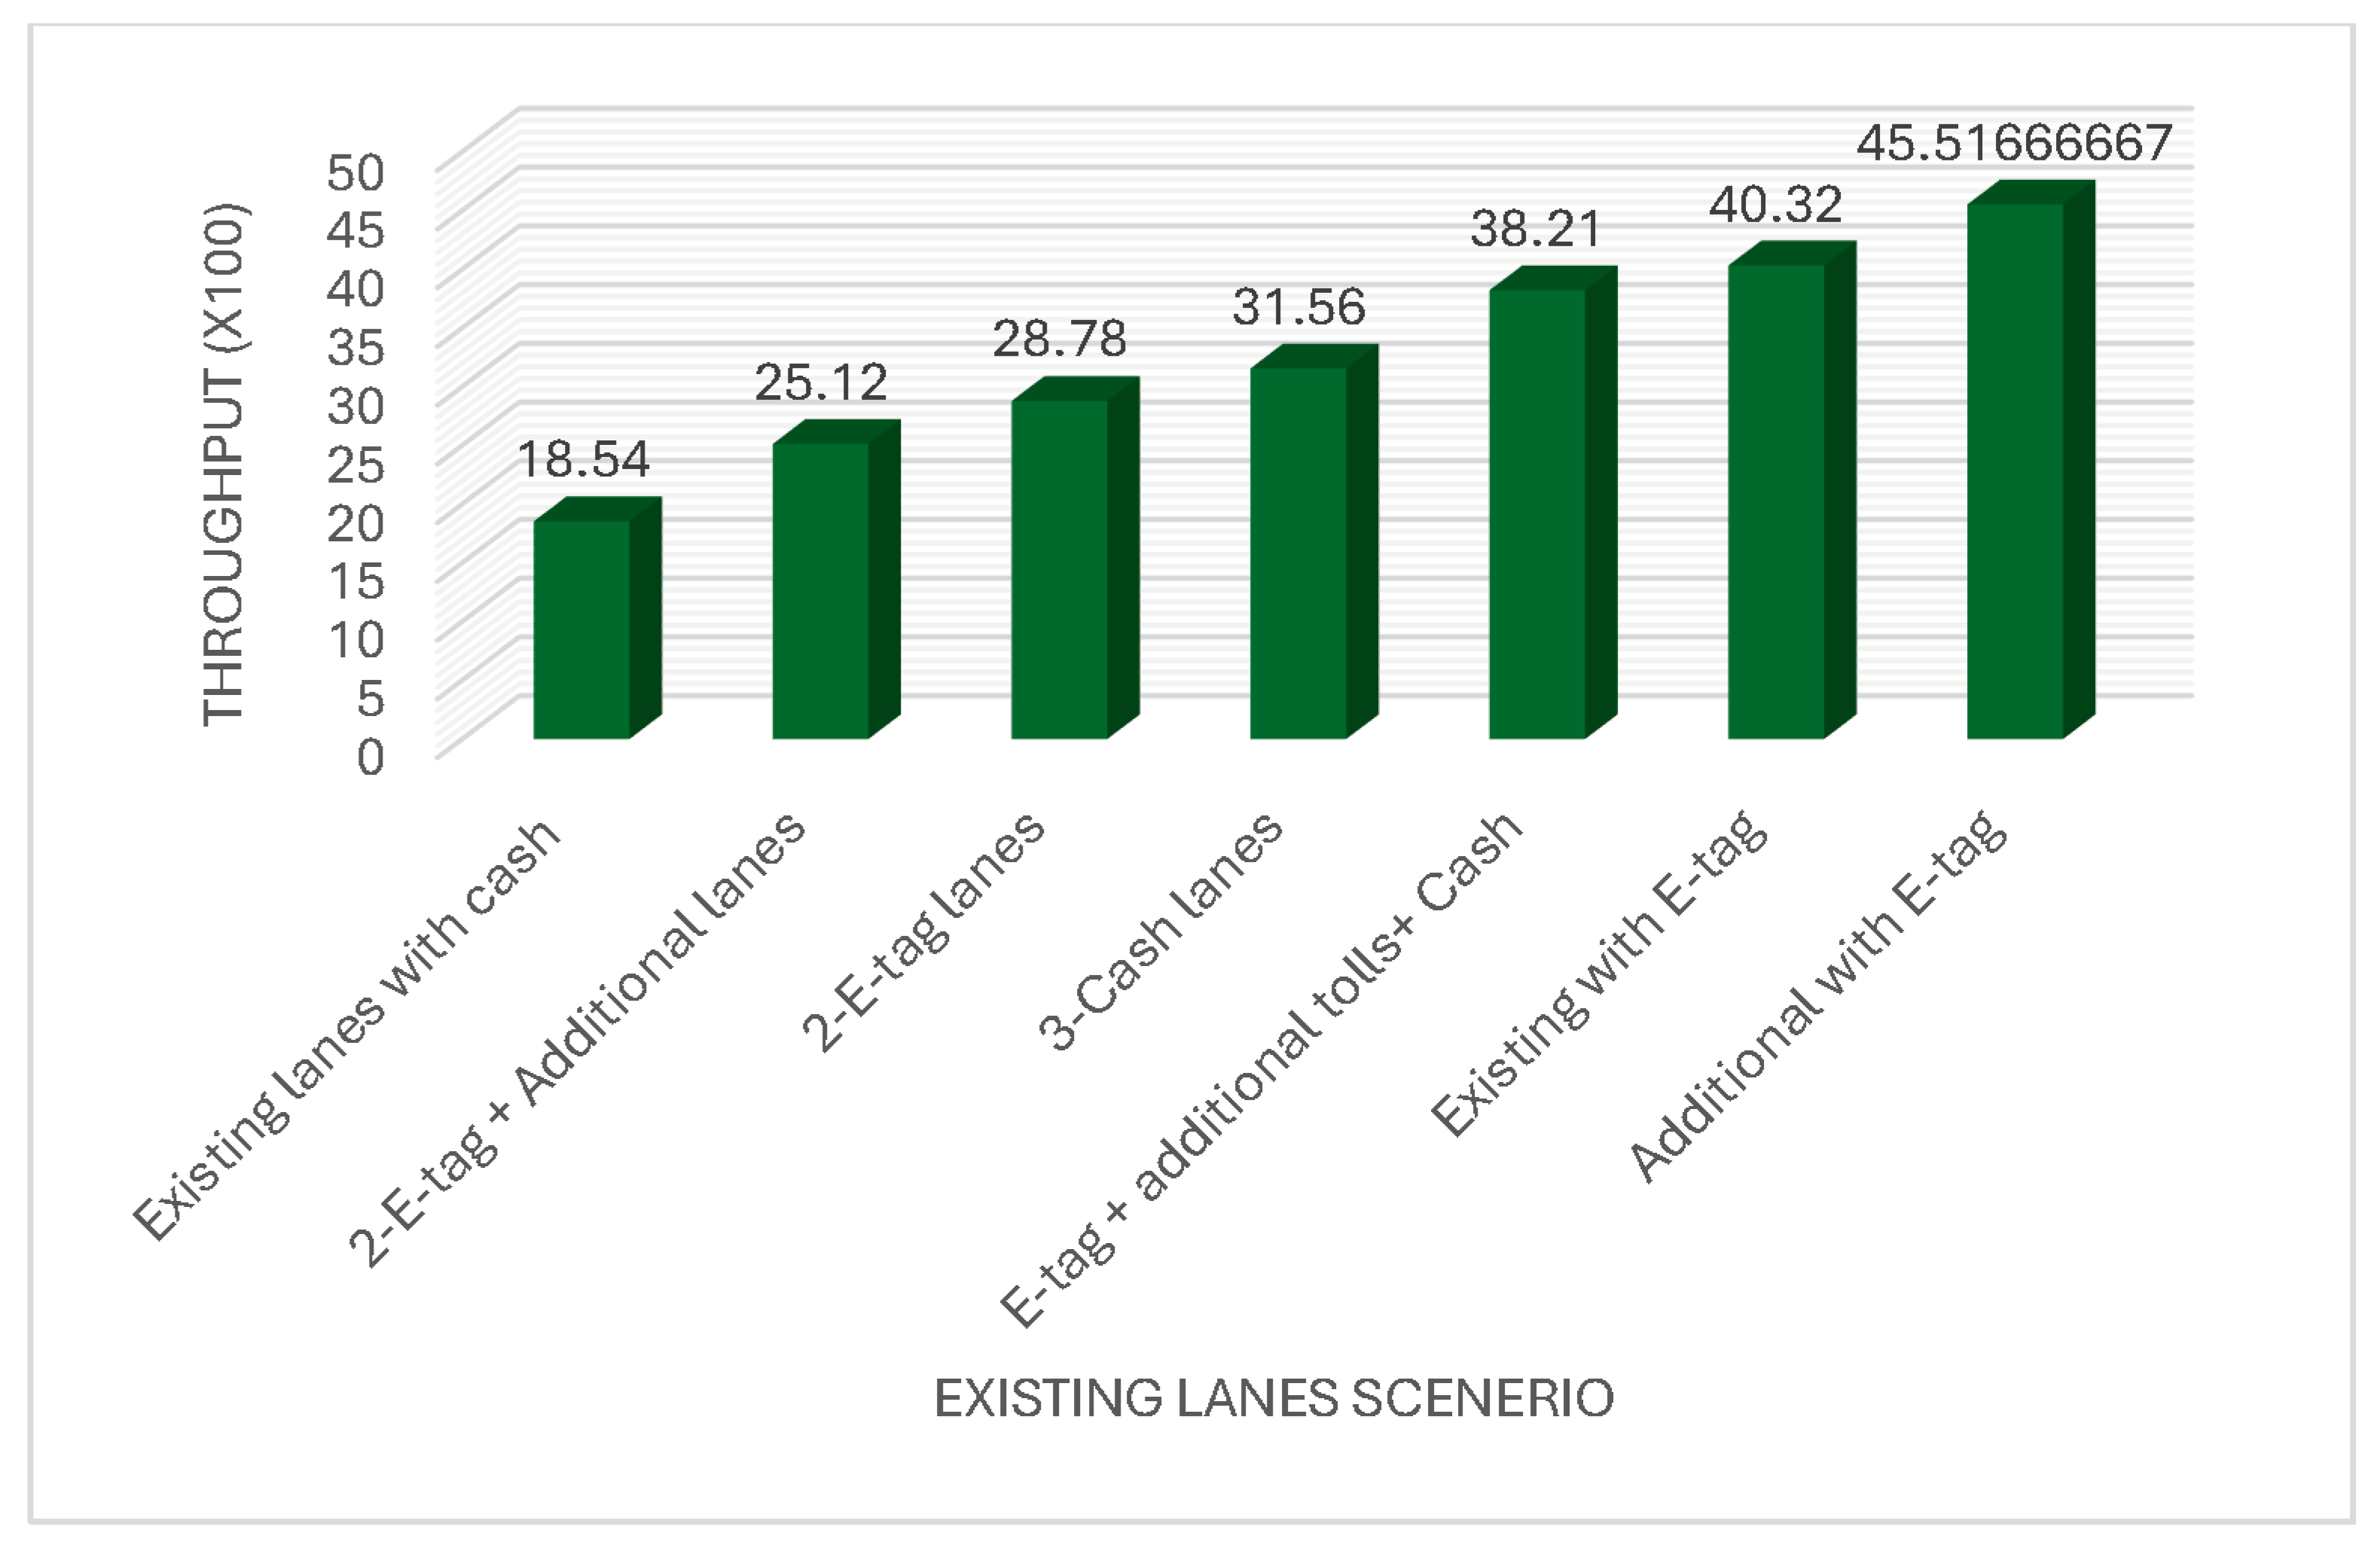
At a toll plaza, if the number of vehicles passes from the toll plaza, it will generate higher revenue. This can be achieved when more additional lanes are available with highly accurate E-tagging equipment in times of congestion. Extra lanes and a properly trained operator should be hired to handle the technology equipment. Government organizations and the finance department should also do the proper check for timely upgradation. The throughput result shown in
Figure 7 shows the current lanes scenario, highlighting that increasing capacity to improve productivity and efficiency is essential. A multiplier of 100 indicates a considerable improvement in throughput that could transform manufacturing and transportation systems, resulting in better flow with higher output in revenue, etc.
As
Figure 7 illustrates, higher revenue production at a toll plaza strongly correlates with higher throughput. The plaza can handle an enormous volume of vehicles more effectively and efficiently when there are more lanes for toll collecting, which collects more money in terms of revenue effectively. Suppose there is a comparison between throughput and the study of the current lane scenario. In that case, it can be easily found that it is essential to increase capacity to increase efficiency. A significant throughput boost, amplified by a factor of 100, can yield revolutionary enhancements in transportation networks and production procedures, resulting in more efficient flows, decreased latency, and increased yield.
5.6. Different Lanes Scenario
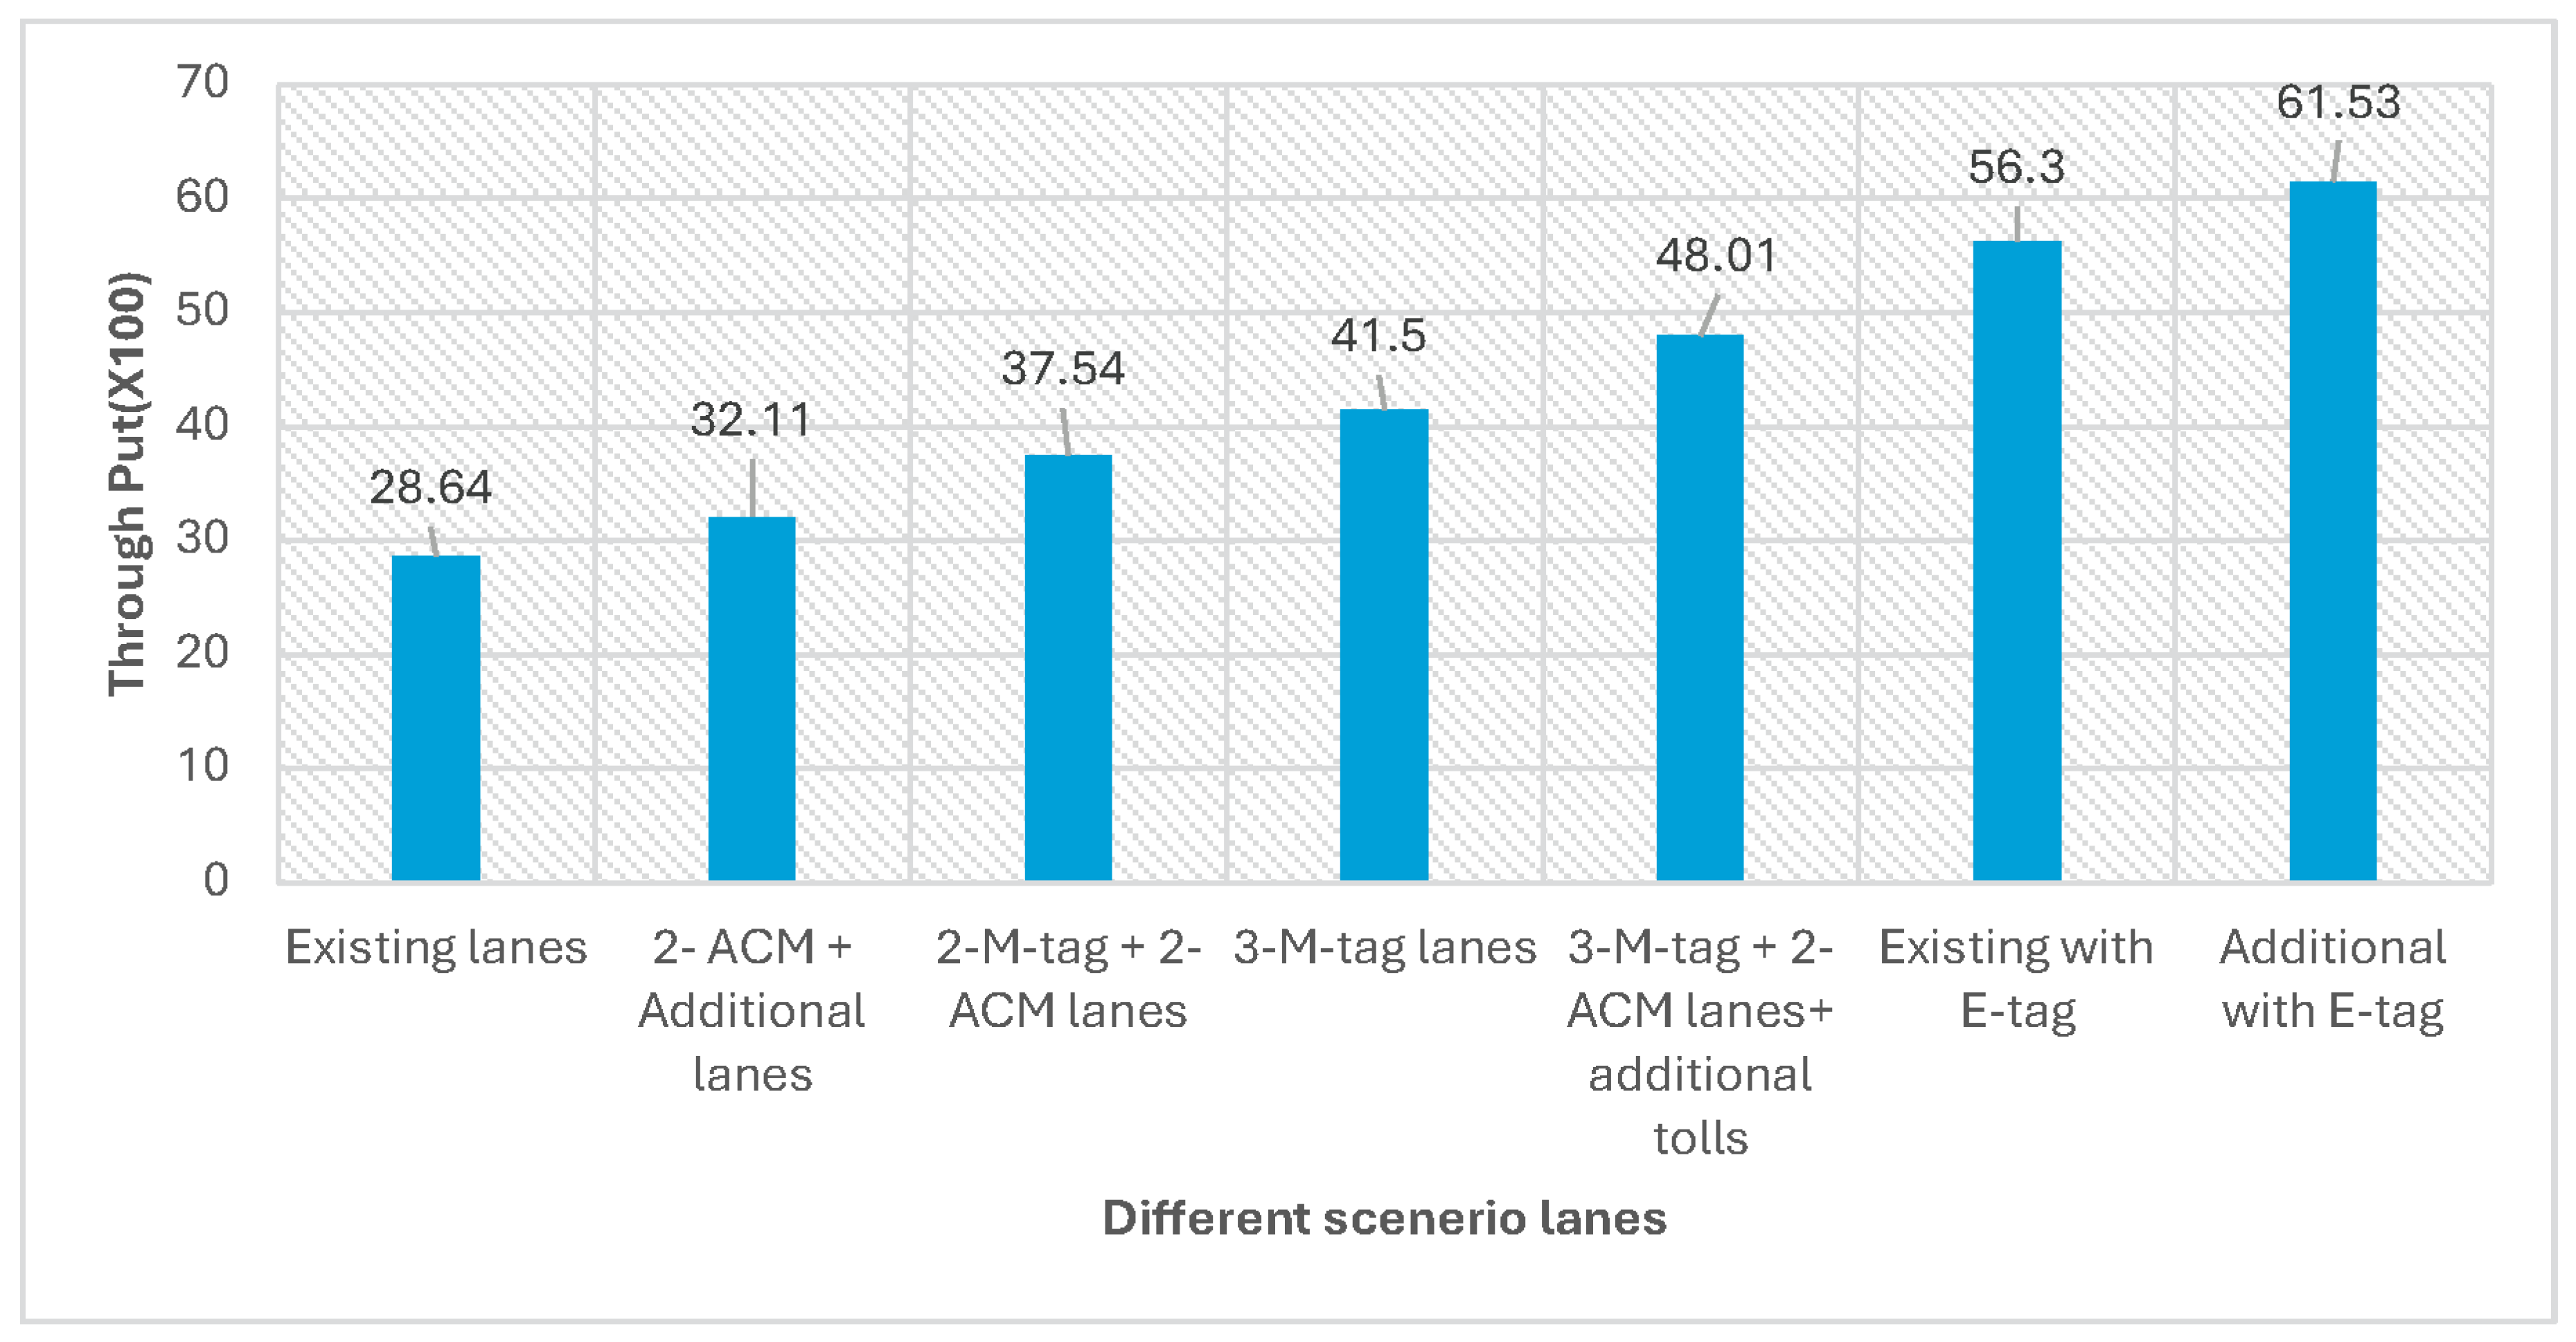
The throughput is directly proportional to the number of E-tag lanes, as shown in
Figure 8. There is a strong and direct association between technology and efficiency. The proper simulation will streamline the toll collection procedure. With the help of E-tag technology, these dedicated lanes facilitate smooth and automatic toll transactions. These days, education and facilities lead the driver to avoid manual payment processing.
The graph illustrates that as the number of E-tag lanes at the toll plaza increases, the throughput of vehicles passing through the plaza also increases. In simple terms, this graph shows that there is a positive correlation between the implementation of E-tag lanes and improved efficiency in processing vehicles at the toll plaza. E-tag lanes are designed as dedicated lanes equipped with E-tag technology. These lanes are specifically tailored to vehicles equipped with E-tags, which are electronic devices that facilitate automated toll transactions. Vehicles equipped with E-tags can pass through these dedicated lanes seamlessly and without stopping. The E-tag technology allows for automated toll transactions, where toll fees are electronically deducted from the vehicle owner’s account. This automation eliminates the need for manual payment processing, such as handing over cash or swiping a credit card, which can be time-consuming.
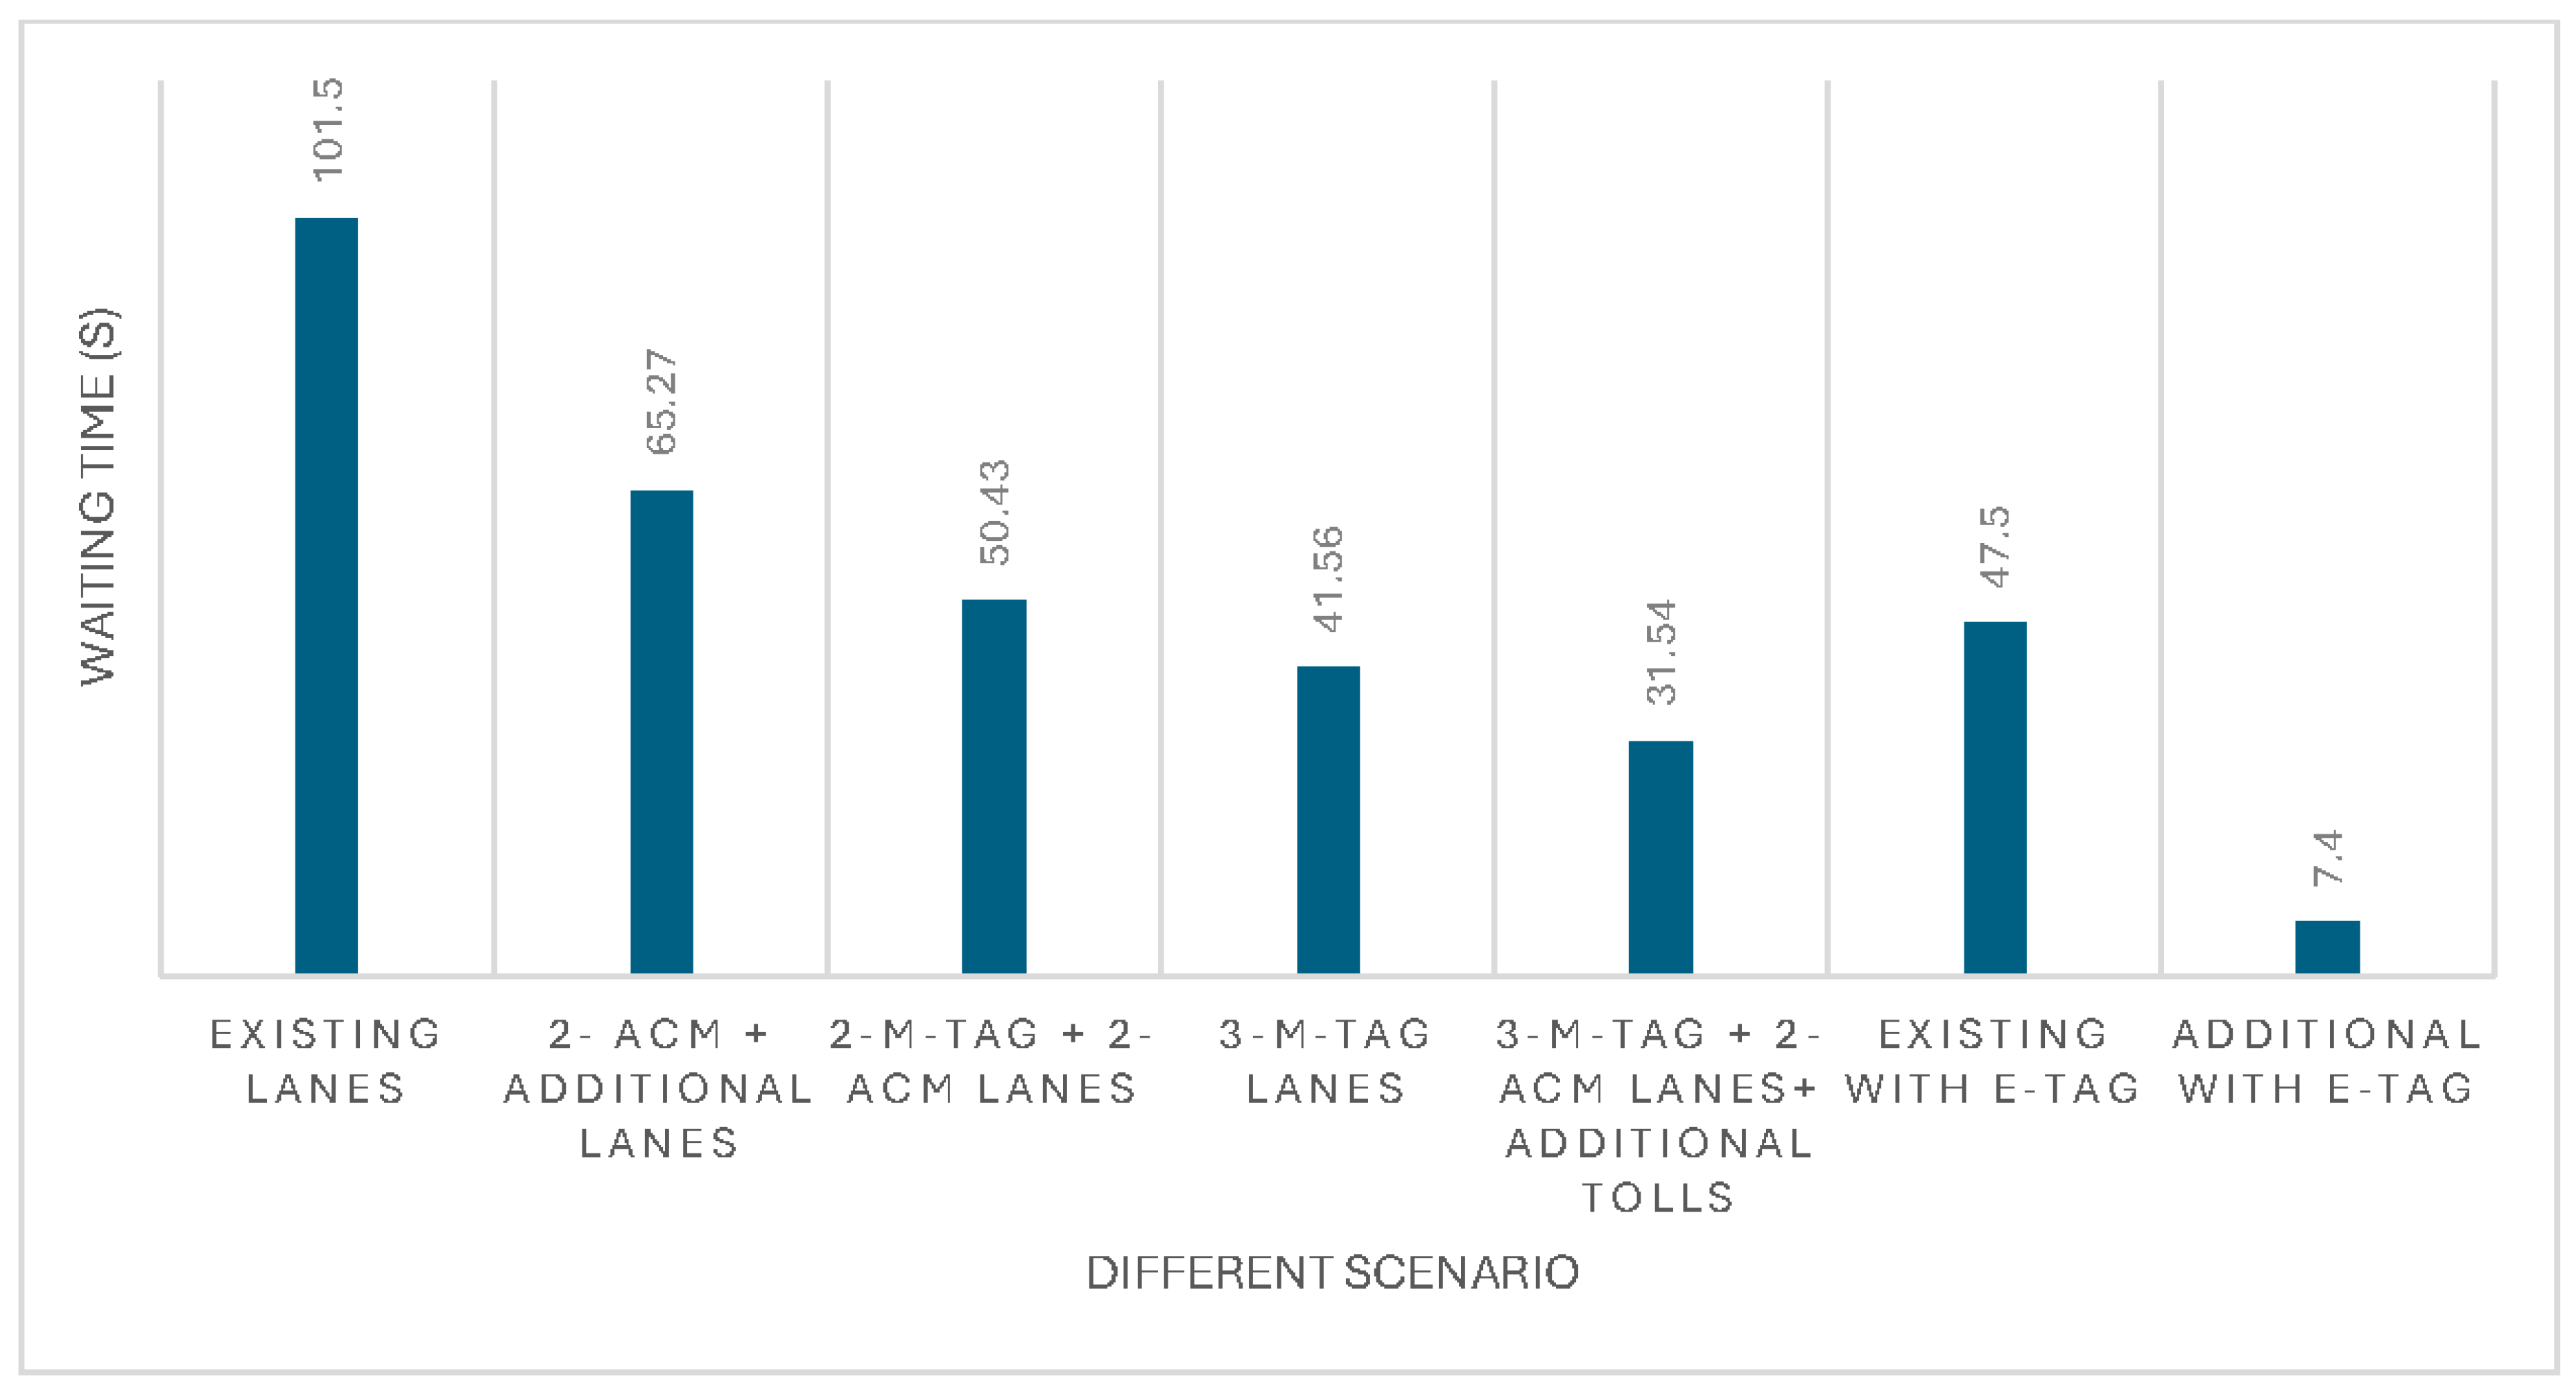
The principal source of substantial delays for cars utilizing the toll plaza is the current design of the cash and electronic lanes. This arrangement has caused congestion at the toll plaza due to the slower moving cash lanes, with delays of as much as two minutes and a tenth of a second recorded for each car.
Figure 4 shows how long times wait for lanes might result from incorrect lane assignment or a disparity between cash and electronic toll collection (ETC) lanes. An ideal lane configuration that accounts for traffic patterns and payment preferences is advised to reduce wait times. This is where the G.T. road portion under discussion is located. Wait times for various payment methods are decreased by allocating cash and electronic toll collecting lanes optimally. Traffic flow is streamlined and waiting times are reduced with dedicated lanes for vehicles. These findings suggest that managing traffic lanes helped to improve toll plaza efficiency and wait times. Efficient toll collection and reduced waiting times for designated lanes are the natural results of allocating lanes appropriately depending on payment modalities. Dedicated lanes make sense since they separate cars, which eases traffic and cuts down on waiting times and congestion.
6. Conclusion and Future Recommendations
The simulation study using PTV Vissim showed that different lane patterns can have a significant impact on the performance of the Peshawar toll plaza in Peshawar, Pakistan. The following results are observed: The mixed pattern of cash, and ETC lanes resulted in the highest delay for vehicles using the toll plaza. This pattern caused a blockage at the toll plaza due to the slower cash lanes. The average delay per vehicle was recorded as 1.5 minutes. The sensitivity analysis showed in Figure 9 that the dedicated ETC lane pattern is the most effective lane pattern across a range of traffic queue lengths, waiting time, and throughput(X100). Based on the results of the simulation study, it can be concluded that the dedicated ETC lane pattern is the most effective lane pattern for optimizing traffic flow at the Peshawar toll plaza in Peshawar, Pakistan. This pattern allows for a smoother flow of traffic through the toll plaza, reducing the delay per vehicle and fuel consumption. The results of this study can be used by toll plaza operators and transportation planners to implement more efficient toll plaza management practices. The main toll station performance efficiency factors considered in this simulation study are throughputs (x100), waiting time (s), and queue length (m). It has been inferred from the simulation results that changing the existing lanes to the E-tag system of toll collection and equipping the additional lanes with the E-tag system of toll collection can significantly reduce the waiting time and improve the efficiency of the toll station. Adopting this approach results in a minimum delay problem. The most advantageous plaza lane pattern is must to have the queue length and waiting time as minimum as possible, and the maximum number of vehicles passing through a lane. As soon as the users become ETC patrons, this is the best possible lane pattern as it assists in making a well-organized toll collection and satisfies the users as well. The results show that the throughput vs. current lanes scenario is maximum 45% of the additional with E-tag lanes, 40% of the existing with E-tag lanes, 38% of the E-tag + additional toll+ cash, 32% of the 3- cash lanes, 28% of the 2-E-tag lanes. Based on the results of the simulation study, it can be concluded that the dedicated ETC lane pattern and E-tag are the most effective lane pattern for optimizing traffic flow at the Peshawar toll plaza, Pakistan. This pattern allows for a smoother flow of traffic through the toll plaza, reducing the delay by 18% per vehicle and fuel consumption. The results of this study can be used by toll plaza operators and transportation planners to implement more efficient toll plaza management practices. If the existing lane pattern scenario is not regularly monitored and adjusted based on traffic patterns, it logically contributes to 20% longer queues. Without proactive evaluation and optimization, opportunities to improve 63% queue length.
To achieve the most advantageous plaza lane pattern, it is imperative to minimize queue length and waiting time while maximizing the number of vehicles passing through each lane. Adopting the E-tag system has proven to be the best approach, especially as users become ETC patrons. It is recommended to increase the number of lanes at Peshawar Toll Plaza. This will help accommodate higher traffic volume and reduce waiting times, resulting in improved traffic flow. In this research, different lanes pattern means different types of toll collection systems facilitate the transporter. The benefits of an optimal allocation of cash, ETC lanes. It is recommended to maintain a balanced distribution that caters to different payment preferences, reducing congestion and waiting times for both payment methods. It is recommended to employ proper signage, lane merging techniques, and dedicated toll plaza personnel to facilitate smoother traffic flow and minimize congestion, ultimately reducing waiting times.
References
- Abuzwidah, M.; Abdel-Aty, M. Safety assessment of the conversion of toll plazas to all-electronic toll collection system. Accid. Anal. Prev. 2015, 80, 153–161. [Google Scholar] [CrossRef] [PubMed]
- Adiseshu, G.; Naidu, G. Influence of coarse aggregate shape factors on bituminous mixtures. International journal of engineering research and applications (IJERA) 2011, 1, 2013–2014. [Google Scholar]
- Ahmed, M.M.; Abdel-Aty, M.A. The Viability of Using Automatic Vehicle Identification Data for Real-Time Crash Prediction. IEEE Trans. Intell. Transp. Syst. 2011, 13, 459–468. [Google Scholar] [CrossRef]
- Alaka, H.A.; Oyedele, L.O.; Owolabi, H.A.; Kumar, V.; Ajayi, S.O.; Akinade, O.O.; Bilal, M. Systematic review of bankruptcy prediction models: Towards a framework for tool selection. Expert Syst. Appl. 2018, 94, 164–184. [Google Scholar] [CrossRef]
- Aljuaydi, F.M.M. Mathematical Model and Cloud Computing of Road Network Operations under Non-Recurrent Events, Curtin University, 2022.
- Alkiswani, M.A.M. Improving the Utilization of Public Transportation Using Intelligent Transportation Systems, Master Thesis, 2022.
- Alomari, A.; Al-Omari, A.; Aljizawi, W. Evaluation of travel time reliability in urban areas using mobile navigation applications in Jordan. Journal of Applied Engineering Science 2022, 20, 644–656. [Google Scholar] [CrossRef]
- Astarita, V.; Giofré, V.P. From traffic conflict simulation to traffic crash simulation: Introducing traffic safety indicators based on the explicit simulation of potential driver errors. Simul. Model. Pract. Theory 2019, 94, 215–236. [Google Scholar] [CrossRef]
- Bains, M.S.; Arkatkar, S.S.; Anbumani, K.S.; Subramaniam, S. Optimizing and modeling tollway operations using microsimulation: Case study Sanand Toll Plaza, Ahmedabad, Gujarat, India. Transportation Research Record 2017, 2615, 43–54. [Google Scholar] [CrossRef]
- Bandi, M.M. Calibration of Vehicle and Driver Characteristics for Vissim Model, Ann-Based Sensitivity Analysis, Traffic Management, and Signal Design Using Ga for Mangalore City, National Institute of Technology Karnataka, Surathkal, 2022.
- Bartin, B. Use of learning classifier systems in microscopic toll plaza simulation models. IET Intell. Transp. Syst. 2019, 13, 860–869. [Google Scholar] [CrossRef]
- Beaudoin, J.; Farzin, Y.H.; Lawell, C.Y.C.L. Public transit investment and sustainable transportation: A review of studies of transit’s impact on traffic congestion and air quality. Research in Transportation Economics 2015, 52, 15–22. [Google Scholar] [CrossRef]
- Bespalov, D.; Sistuk, V.; Tarasuik, V. Substantiation of the method of traffic flows distribution in microsimulation of toll collection plazas. Dorogi i Most. 2023, 2023, 267–278. [Google Scholar] [CrossRef]
- Bhosale, H.U.; Awasare, S.D.; Salunkhe, M.M. A Review of Environmental Impact of ITS (Intelligent Transportation System) to Reduce CO2 Emission at Toll Plaza. 2016.
- Bindzar, P.; Macuga, D.; Brodny, J.; Tutak, M.; Malindzakova, M. Use of Universal Simulation Software Tools for Optimization of Signal Plans at Urban Intersections. Sustainability 2022, 14, 2079. [Google Scholar] [CrossRef]
- Casady, C.B.; Gómez-Ibáñez, J.A.; Schwimmer, E. Toll-managed lanes: A simplified benefit-cost analysis of seven US projects. Transp. Policy 2020, 89, 38–53. [Google Scholar] [CrossRef]
- Chaalal, E.; Guerlain, C.; Pardo, E.; Faye, S. Integrating Connected and Automated Shuttles With Other Mobility Systems: Challenges and Future Directions. IEEE Access 2023, 11, 83081–83106. [Google Scholar] [CrossRef]
- Chakroborty, P.; Gill, R.; Chakraborty, P. Analysing queueing at toll plazas using a coupled, multiple-queue, queueing system model: Application to toll plaza design. Transp. Plan. Technol. 2016, 39, 675–692. [Google Scholar] [CrossRef]
|
Disclaimer/Publisher’s Note: The statements, opinions and data contained in all publications are solely those of the individual author(s) and contributor(s) and not of MDPI and/or the editor(s). MDPI and/or the editor(s) disclaim responsibility for any injury to people or property resulting from any ideas, methods, instructions or products referred to in the content. |
© 2024 by the authors. Licensee MDPI, Basel, Switzerland. This article is an open access article distributed under the terms and conditions of the Creative Commons Attribution (CC BY) license (http://creativecommons.org/licenses/by/4.0/).
