Submitted:
18 June 2024
Posted:
19 June 2024
You are already at the latest version
Abstract
This study is based on the BP neural network regression model optimised by genetic algorithm and dedicated to predicting the amount of car purchase, this study is important for all parties in the automotive industry. By plotting the violins of six indicators, including gender, age, annual salary, credit card debt, net worth, and car purchase amount, we found that, except for gender, the other data showed a trend of dense in the middle gradually decreasing to the upper and lower sides, with an overall normal distribution. The correlation analysis shows that the amount of car purchase has a high positive correlation with age (0.63), followed by annual income (0.62), the correlation between net worth and the amount of car purchase is 0.49, while the correlation between credit card debt and the amount of car purchase is low (0.03). In the experimental part, we analyse the predicted-actual values of the training and test sets in comparison and find that the model predicted values are very close to the actual values. The RMSE of the training set is 11.559 and the RMSE of the test set is 11.4835, which is not much different from each other, indicating that the model has good generalisation ability. In addition, the R2 of both the training and test sets is 1, indicating that the model fits well. The MAE of the training set is 8.2512 and the MAE of the test set is 9.578; the MBE of the training set is -4.3035 and the MBE of the test set is -2.4547.These metrics indicate that the model performs well in predicting the amount of car purchase. In conclusion, this study provides an effective and reliable method to predict the amount of car purchase, creating a useful bridge between car manufacturers, dealers and consumers.
Keywords:
Genetic Algorithm
; BP Neural Network
; Car Purchase Amount Prediction
1. Introduction
Car purchase amount prediction refers to the use of various data and models to predict the price of a car, which is of great significance to car manufacturers, dealers, and consumers. The research background of car purchase amount prediction can be traced back to the late 1990s, when, with the popularity of the Internet and the development of information technology, people began to realise that car prices could be predicted more accurately through big data analysis and machine learning algorithms [1].
Machine learning algorithms play a crucial role in car purchase amount prediction. Firstly, machine learning algorithms can deal with a large amount of complex data, including car brands, models, configurations, market demand, economic environment and other various factors, and reveal the relationship between these factors by building models [2]. Secondly, machine learning algorithms can automatically learn and optimise the model to improve the prediction accuracy in continuous iteration. Finally, machine learning algorithms can also be updated and adjusted in real time according to real-time data to maintain the accuracy of the prediction model.
In car purchase amount prediction, commonly used machine learning algorithms include linear regression [3], decision tree [4], random forest [5], support vector machine [6] and neural network [7]. Linear regression is suitable for modelling simple linear relationships, and can quickly give a basic price prediction result; decision trees are suitable for modelling non-linear relationships, and can clearly show the degree of influence of each factor on the price; random forests improve the prediction accuracy by integrating multiple decision trees; support vector machines are suitable for high-dimensional data sets; and neural networks are able to discover the complex laws hidden behind the data.
Predicting the amount of car purchase is a complex and challenging problem, in which the use of machine learning algorithms can better discover the laws hidden in the massive data and provide more accurate decision-making basis for car manufacturers, dealers and consumers. This paper provides a new idea to predict the car purchase amount based on BP neural network regression model optimised by genetic algorithm.
2. Data from Data Analysis
In this paper, we use the open-source dataset, which is located at (https://www.kaggle.com/ datasets/mohdshahnawaza adil/sales-prediction-dataset), and the dataset contains a number of metrics of car-buying users, including gender, age, annual salary, credit card debt, net worth and the amount of car purchase, the dataset can be used for regression analysis on the amount of car purchase, we show part of the dataset, the results are shown in Table 1.
The six indicators of gender, age, annual salary, credit card debt, net worth and the amount of car purchased are plotted in a violin diagram to observe the distribution pattern of the data, and the results are shown in Figure 1. As can be seen from the violin diagram, except for gender, all other data show a trend of dense in the middle gradually decreasing to the upper and lower sides, generally showing a trend of normal distribution.
3. Relevance Analysis
Correlation analysis is a statistical method for measuring the strength and direction of the relationship between two or more variables. Correlation analysis measures the overall trend of the variables by calculating the covariance between them. The covariance indicates the tendency of two variables to deviate from their means simultaneously; if the covariance is positive, the two variables are positively correlated; if the covariance is negative, the two variables are negatively correlated; and if the covariance is close to zero, there is no linear relationship between the two variables [8]. The correlation coefficient is calculated as shown in Equation (1).
Figure 2.
Correlation heat map.
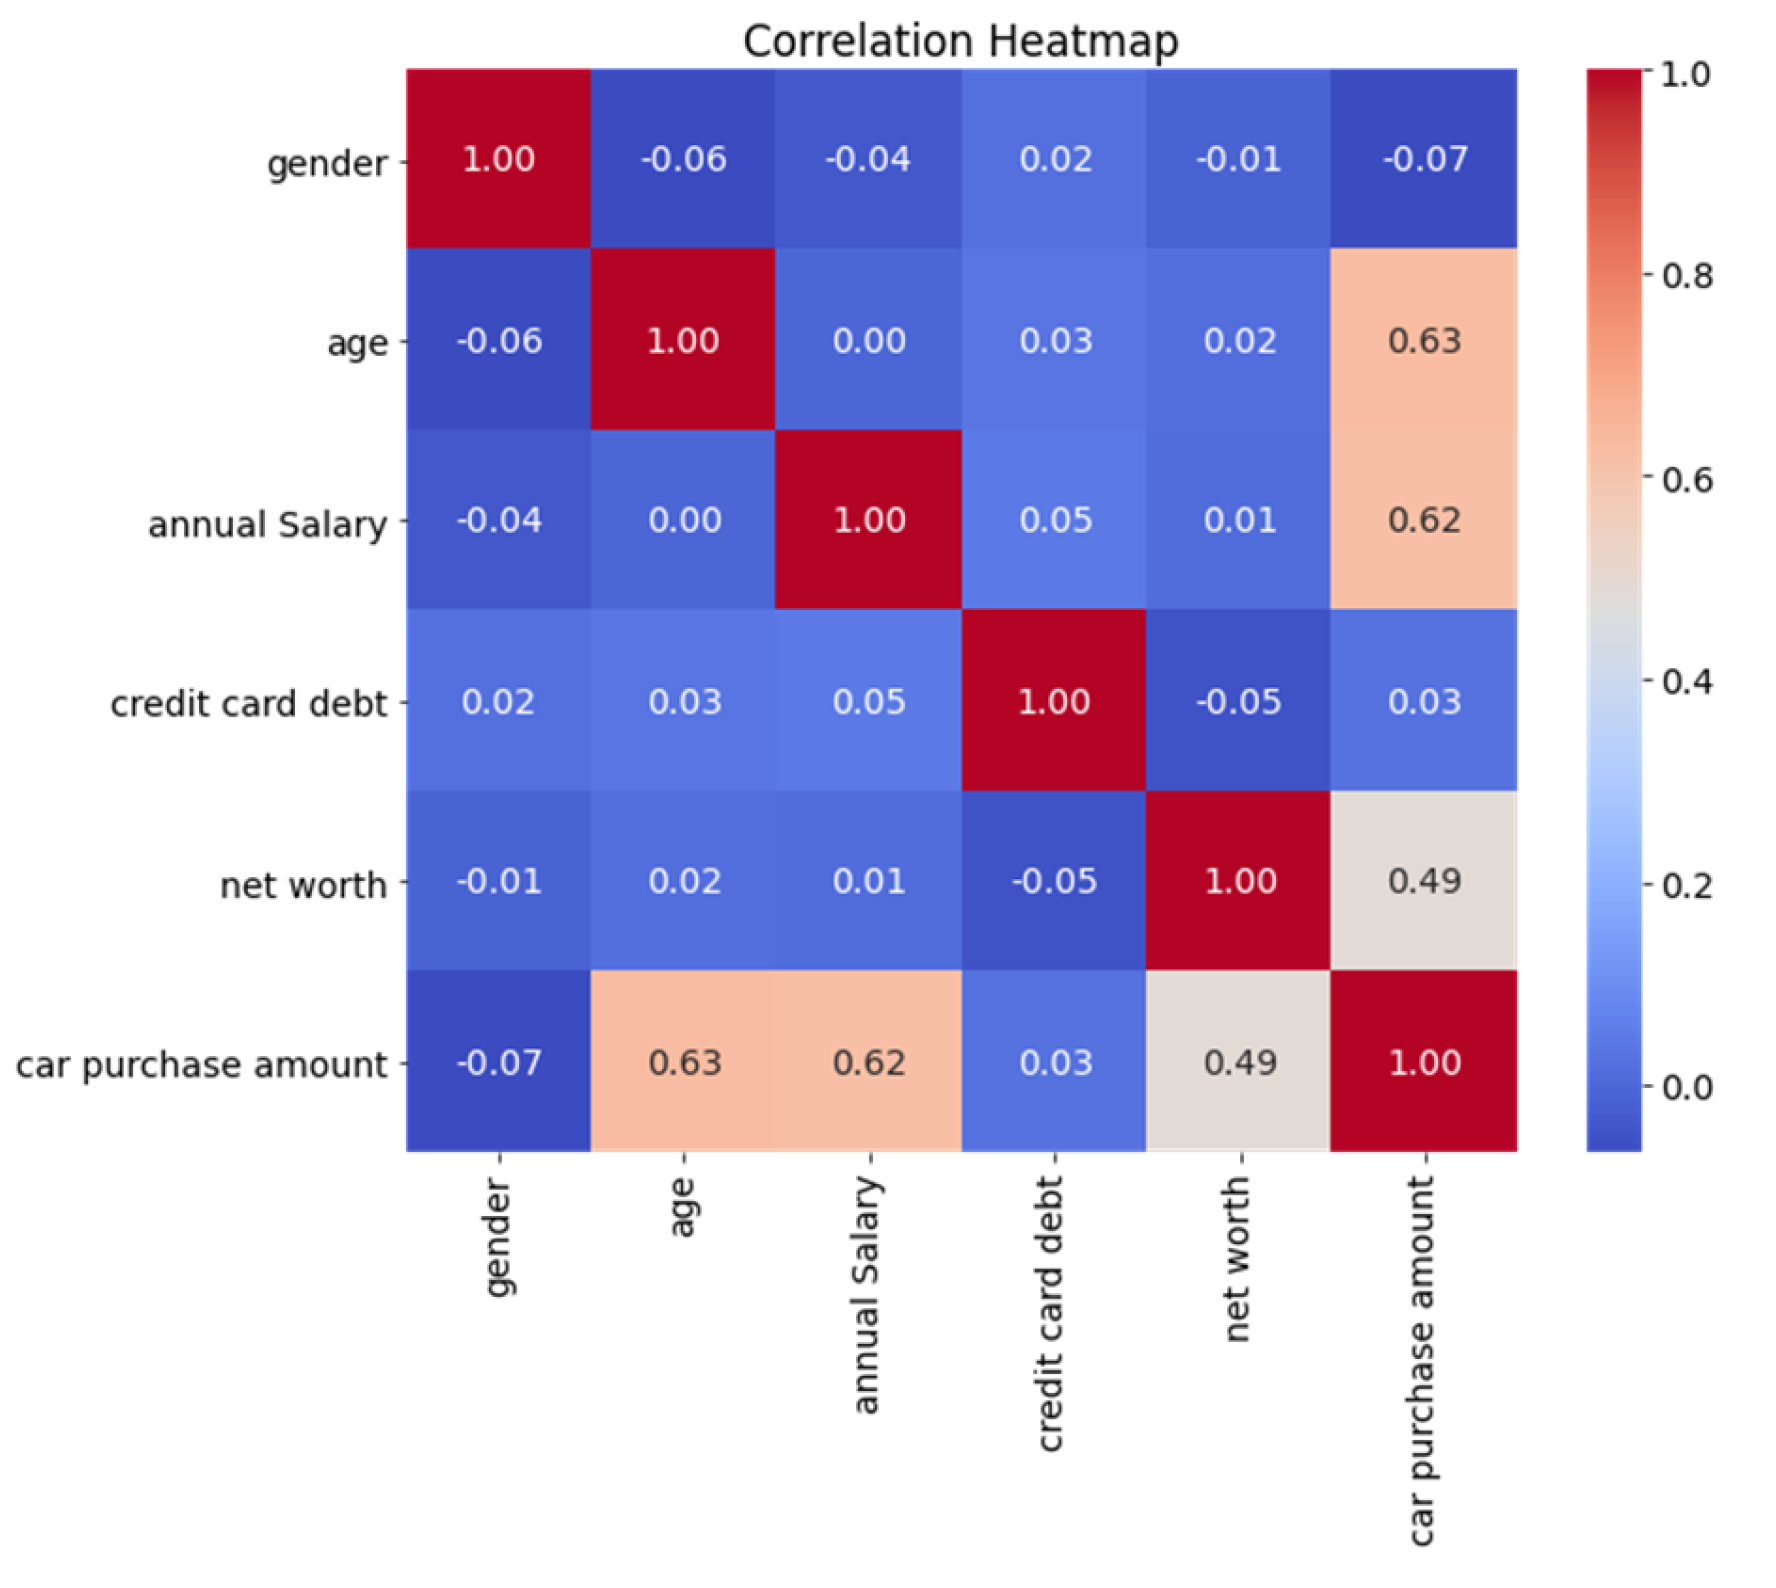
Figure 3.
Relevance Ranking.
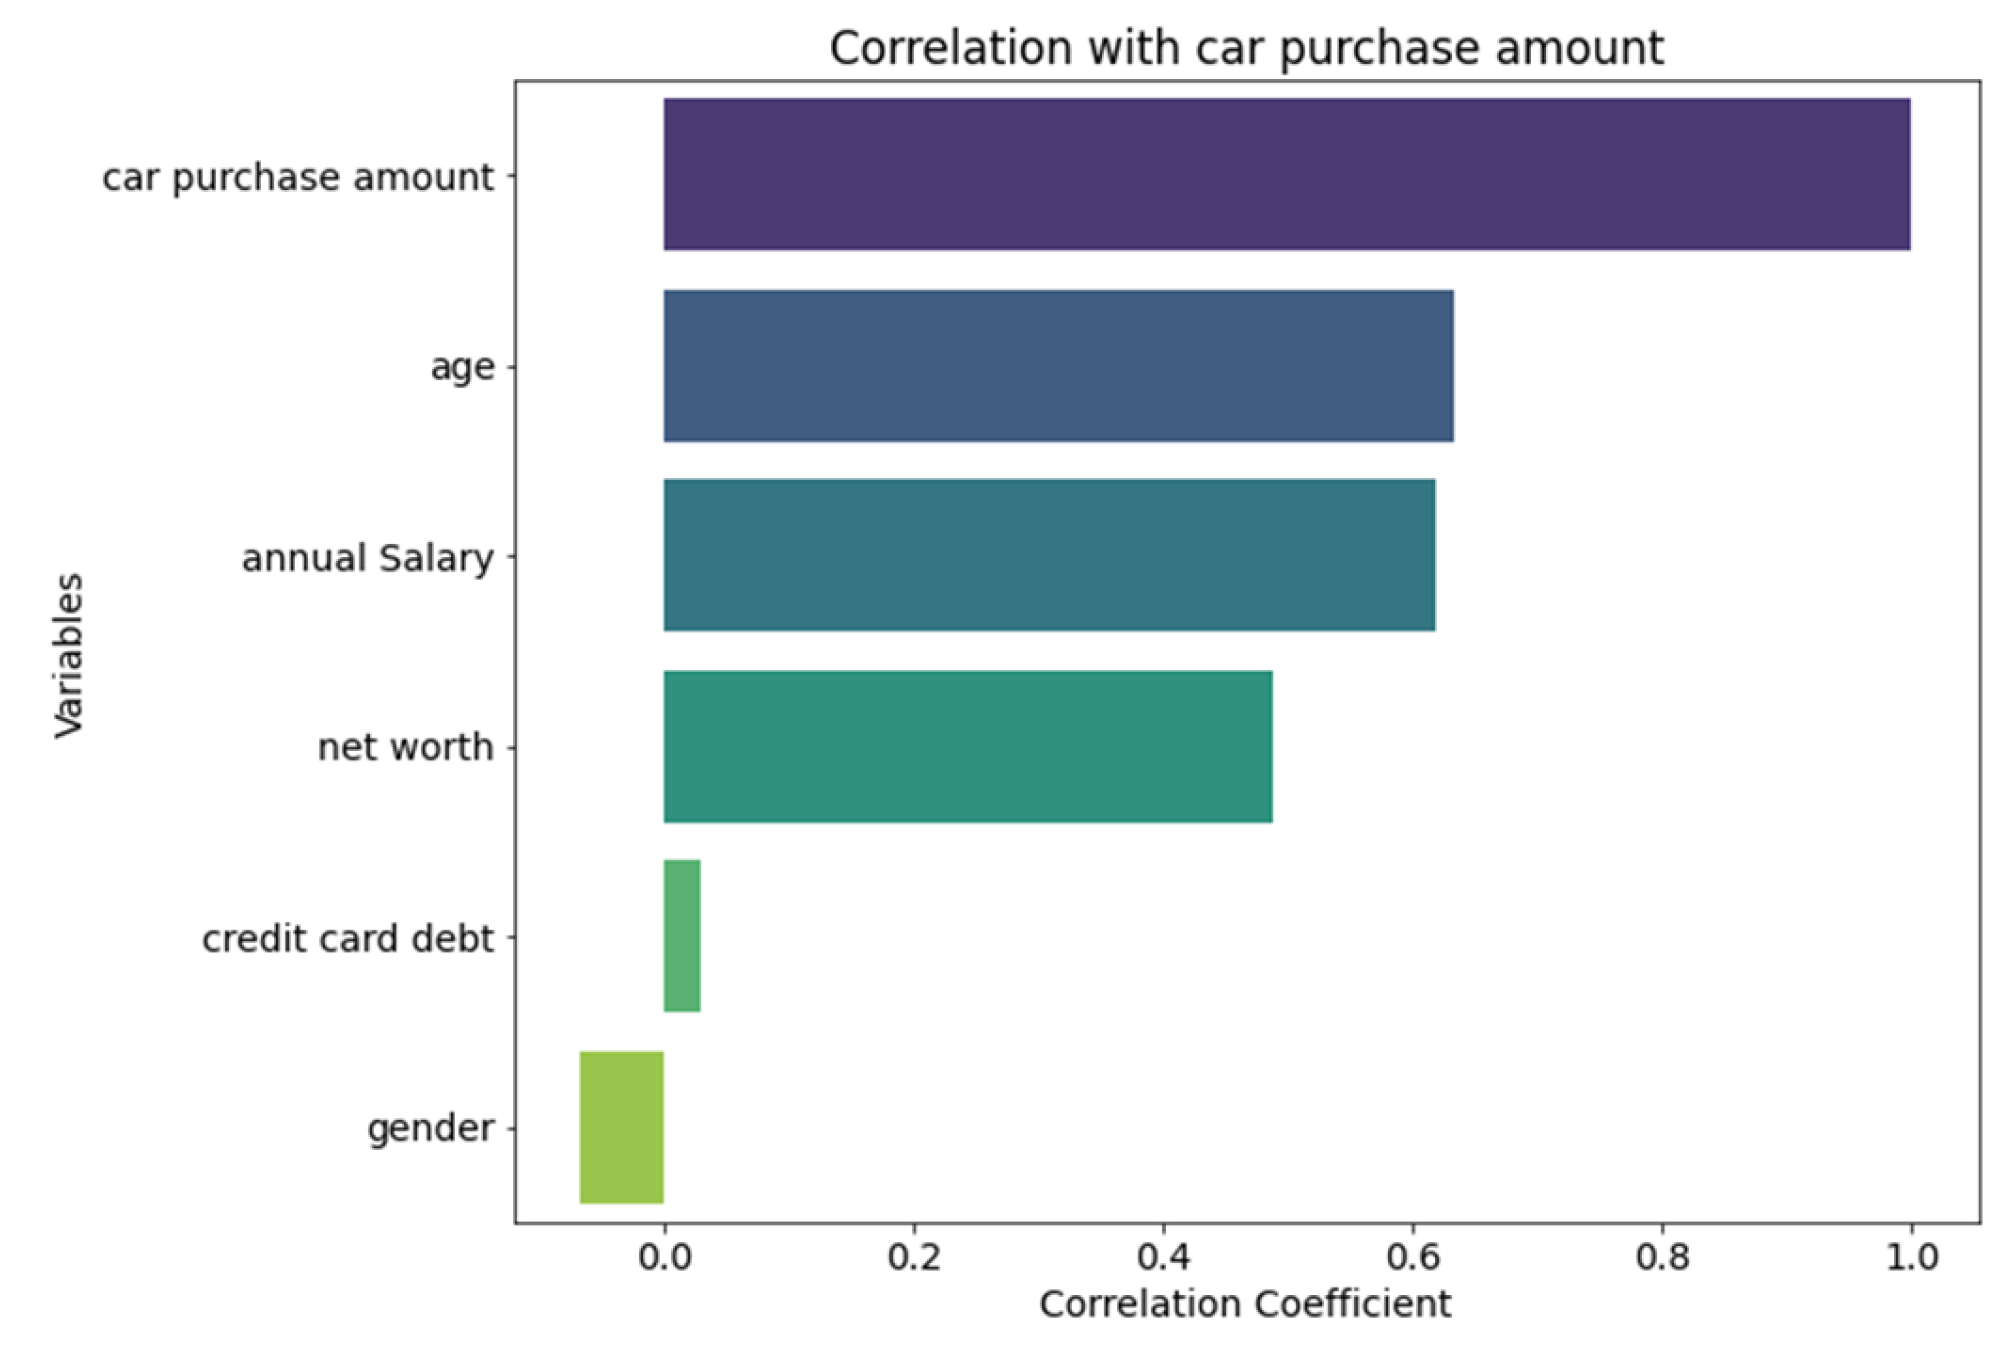
From the results of the correlation analysis, it can be seen that the highest degree of positive correlation with the amount of car purchased is age at 0.63, followed by annual income with a correlation of 0.62, net worth with the amount of car purchased with a correlation of 0.49, and credit card debt with the amount of car purchased with a correlation of 0.03.
4. Method
4.1. Genetic Algorithm
Genetic algorithms are optimisation algorithms that mimic the mechanisms of natural selection and heredity, searching for optimal solutions by simulating the operations of genetic inheritance, crossover and mutation during biological evolution.
Encoding is the process of representing the solution in the problem space as a chromosome or genotype. In genetic algorithms, the solution to a problem is usually mapped onto a binary code or real number code so that it can be processed and manipulated by a computer. The encoding directly affects the expressiveness of the algorithm’s search space and the efficiency of the search.
Selection refers to the selection of better individuals from the current population to participate in reproduction as parents based on a fitness function. Roulette selection, tournament selection and other methods are usually used to select individuals, retaining individuals with high fitness and eliminating those with low fitness, in order to improve the overall fitness of the population of the next generation.
Crossover is a simulation of the hybridisation operation during biological reproduction to generate new individuals in the next generation population. Individuals of the offspring are generated by randomly selecting two parent individuals and swapping gene segments at certain positions. Crossing operations help to retain the characteristics of superior individuals and introduce new variations that increase population diversity.
Mutation is a random mutation operation on certain genes in the offspring population. By introducing random variations, it can make the search process more global and diverse, and help to jump out of local optimal solutions. The mutation rate is usually set to a small probability value to ensure that the population will not change drastically.
In summary, genetic algorithm performs selection, crossover and mutation operations iteratively to find the optimal solution or near-optimal solution that satisfies specific conditions in the candidate solution space. It has the advantages of high parallelism, strong global search ability, and no prior derivation for the problem, and has a good application prospect in the solution of complex optimisation problems [9].
4.2. BP Neural Network
BP neural network, or back propagation neural network, is a common artificial neural network model. Its principle is based on the gradient descent algorithm, which minimises the error between the predicted and actual outputs of the network by constantly adjusting the weights of each connection in the network.The model structure of BP neural network is shown in Figure 4.
The ‘net input’ to the neuron is denoted by IJ and is expressed as a linear weighted sum, i.e.,:
The output y of a neuron’s yj is a function of its current state, and the mathematical expression for the M-P model is:
BP neural network contains input layer, hidden layer and output layer. The information is propagated from the input layer to the output layer through the hidden layer, in which the hidden layer plays the role of feature extraction and nonlinear mapping. The predicted output of the network is obtained by forward propagation calculation, and then the weights of the connections between the layers are adjusted according to the error signals by the back propagation algorithm to reduce the error, and the process is iterated until convergence.
During the training process, the BP neural network evaluates the gap between the predicted output and the actual output by calculating the loss function and updates the weights along the direction of the error gradient using gradient descent. By repeatedly iterating the training sample set, the weights and bias terms are continuously adjusted so that the network has a good generalisation ability and can adapt to the prediction of new samples [10].
4.3. Genetic Algorithm Improved BP Neural Network Model
The process of optimising a BP neural network using a genetic algorithm is divided into three steps, firstly, the parameters of the BP neural network are encoded into chromosomes in the genetic algorithm; then, the genetic algorithm is used to generate a new generation of solutions by performing crossover, mutation and other operations on these chromosomes, and the strengths and weaknesses of each solution are evaluated according to the fitness function; and lastly, the process is continually iterated until the set termination conditions are reached [11].
In this way, the genetic algorithm can help to adjust the connection weights and bias terms between the layers in the BP neural network, which enables the neural network to achieve a better fit on the training dataset and a better generalisation ability [12]. This combined optimisation approach tends to be more effective than using BP neural networks alone when dealing with complex problems [13].
5. Result
For the experimental part, matlab R2023a is used, the dataset is divided into training and testing sets according to 7:3, the learning rate is set to 0.0002, the experimental equipment has 32G of memory, and the graphics card is 2080.
Output the adaptation change curve, as shown in Figure 5. Output the results of actual values and predicted values in the training set, as shown in Figure 6. Output the results of actual and predicted values in the test set, as shown in Figure 7. Plot the results of the actual and predicted values in the training and test sets on a Y-X plot, respectively, and the results are shown in Figure 8 and Figure 9.
As can be seen from the images of predicted-actual value distribution of the training set and test set, the predicted values are very close to the actual values, and the model is able to predict the amount of car purchase well. The RMSE of the training set is 11.559 and the RMSE of the test set is 11.4835, and there is not much difference between the RMSE of the training set and the test set, and the generalisation ability of the model is good.
The output of the model is shown in Table 2.
As shown in Table 2, the MAE of the training set is 8.2512 and the MAE of the test set is 9.578; the MBE of the training set is -4.3035 and the MBE of the training set is -2.4547.The R2 of both the training set and the test set is 1. The RMSE of the training set is 11.559 and the RMSE of the test set is 11.4835.
6. Conclusion
In this study, a prediction analysis of car purchase amount was conducted based on the BP neural network regression model optimised by genetic algorithm. Firstly, by plotting the violin plots of the six indicators of gender, age, annual salary, credit card debt, net worth and car purchase amount, we observed that the data showed a trend of the middle intensively and gradually decreasing to the upper and lower sides, which roughly showed the characteristics of normal distribution. The results of correlation analysis show that there is a strong positive correlation between the amount of car purchase and age, annual income and net worth. The experimental part shows the distribution images of predicted and actual values in the training and test sets, indicating that the model can accurately predict the amount of car purchase and has good generalisation ability.
Specifically, on the training set and test set, we get the prediction results that are closer to the actual values. The RMSEs of the training and test sets do not differ much, indicating that the model can also achieve good results on unknown data. In addition, the MAE and MBE metrics show the accuracy and bias of the model’s prediction of the car purchase amount. Most importantly, the R2 evaluation metrics show that the model performs well in explaining the variance of the variables.
In conclusion, the genetic algorithm optimised BP neural network regression model developed in this study demonstrated high accuracy and stability in the task of car purchase amount prediction. This research result is not only of great significance to automobile manufacturers, dealers and consumers, but also provides a useful reference for further in-depth exploration of the automobile price formation mechanism.
References
- Lyu, Weimin, et al. “A multimodal transformer: Fusing clinical notes with structured EHR data for interpretable in-hospital mortality prediction.” AMIA Annual Symposium Proceedings. Vol. 2022. American Medical Informatics Association, 2022.
- Xiang, Jinlin, and Eli Shlizerman. “Tkil: Tangent kernel optimization for class balanced incremental learning.” Proceedings of the IEEE/CVF International Conference on Computer Vision. 2023.
- Lan, Guangchen, et al. “Improved Communication Efficiency in Federated Natural Policy Gradient via ADMM-based Gradient Updates.” Advances in Neural Information Processing Systems 36 (2024).
- Zhang, Qingchao, Xiaojing Ye, and Yunmei Chen. “Nonsmooth nonconvex LDCT image reconstruction via learned descent algorithm.” Developments in X-Ray Tomography XIII 11840 (2021): 132.
- Zhuang, Jun, and Mohammad Al Hasan. “Deperturbation of online social networks via bayesian label transition.” Proceedings of the 2022 SIAM International Conference on Data Mining (SDM). Society for Industrial and Applied Mathematics, 2022.
- Li, Diya, et al. “A reinforcement learning-based routing algorithm for large street networks.” International Journal of Geographical Information Science 38.2 (2024): 183-215. [CrossRef]
- Ma, Haixu, Donglin Zeng, and Yufeng Liu. “Learning individualized treatment rules with many treatments: A supervised clustering approach using adaptive fusion.” Advances in Neural Information Processing Systems 35 (2022): 15956-15969.
- Ma, Haixu, Donglin Zeng, and Yufeng Liu. “Learning optimal group-structured individualized treatment rules with many treatments.” Journal of Machine Learning Research 24.102 (2023): 1-48.
- Xin, Yi, et al. “Self-Training with Label-Feature-Consistency for Domain Adaptation.” International Conference on Database Systems for Advanced Applications. Springer Nature Switzerland, 2023.
- Zhang, Ziyi, et al. “Towards Invariant Time Series Forecasting in Smart Cities.” Companion Proceedings of the ACM on Web Conference 2024. 2024.
- Li, Xingyan, et al. “Analysis and research of retail customer consumption behavior based on support vector machine.” 2023 IEEE 3rd International Conference on Data Science and Computer Application (ICDSCA). IEEE, 2023.
- Jiang, Haowei, et al. “Recurrent neural network from adder’s perspective: Carry-lookahead RNN.” Neural Networks 144 (2021): 297-306. [CrossRef]
- Zhou, Chang, et al. “Optimizing Search Advertising Strategies: Integrating Reinforcement Learning with Generalized Second-Price Auctions for Enhanced Ad Ranking and Bidding.” arXiv preprint arXiv:2405.13381 (2024).
Figure 1.
Violin diagram.
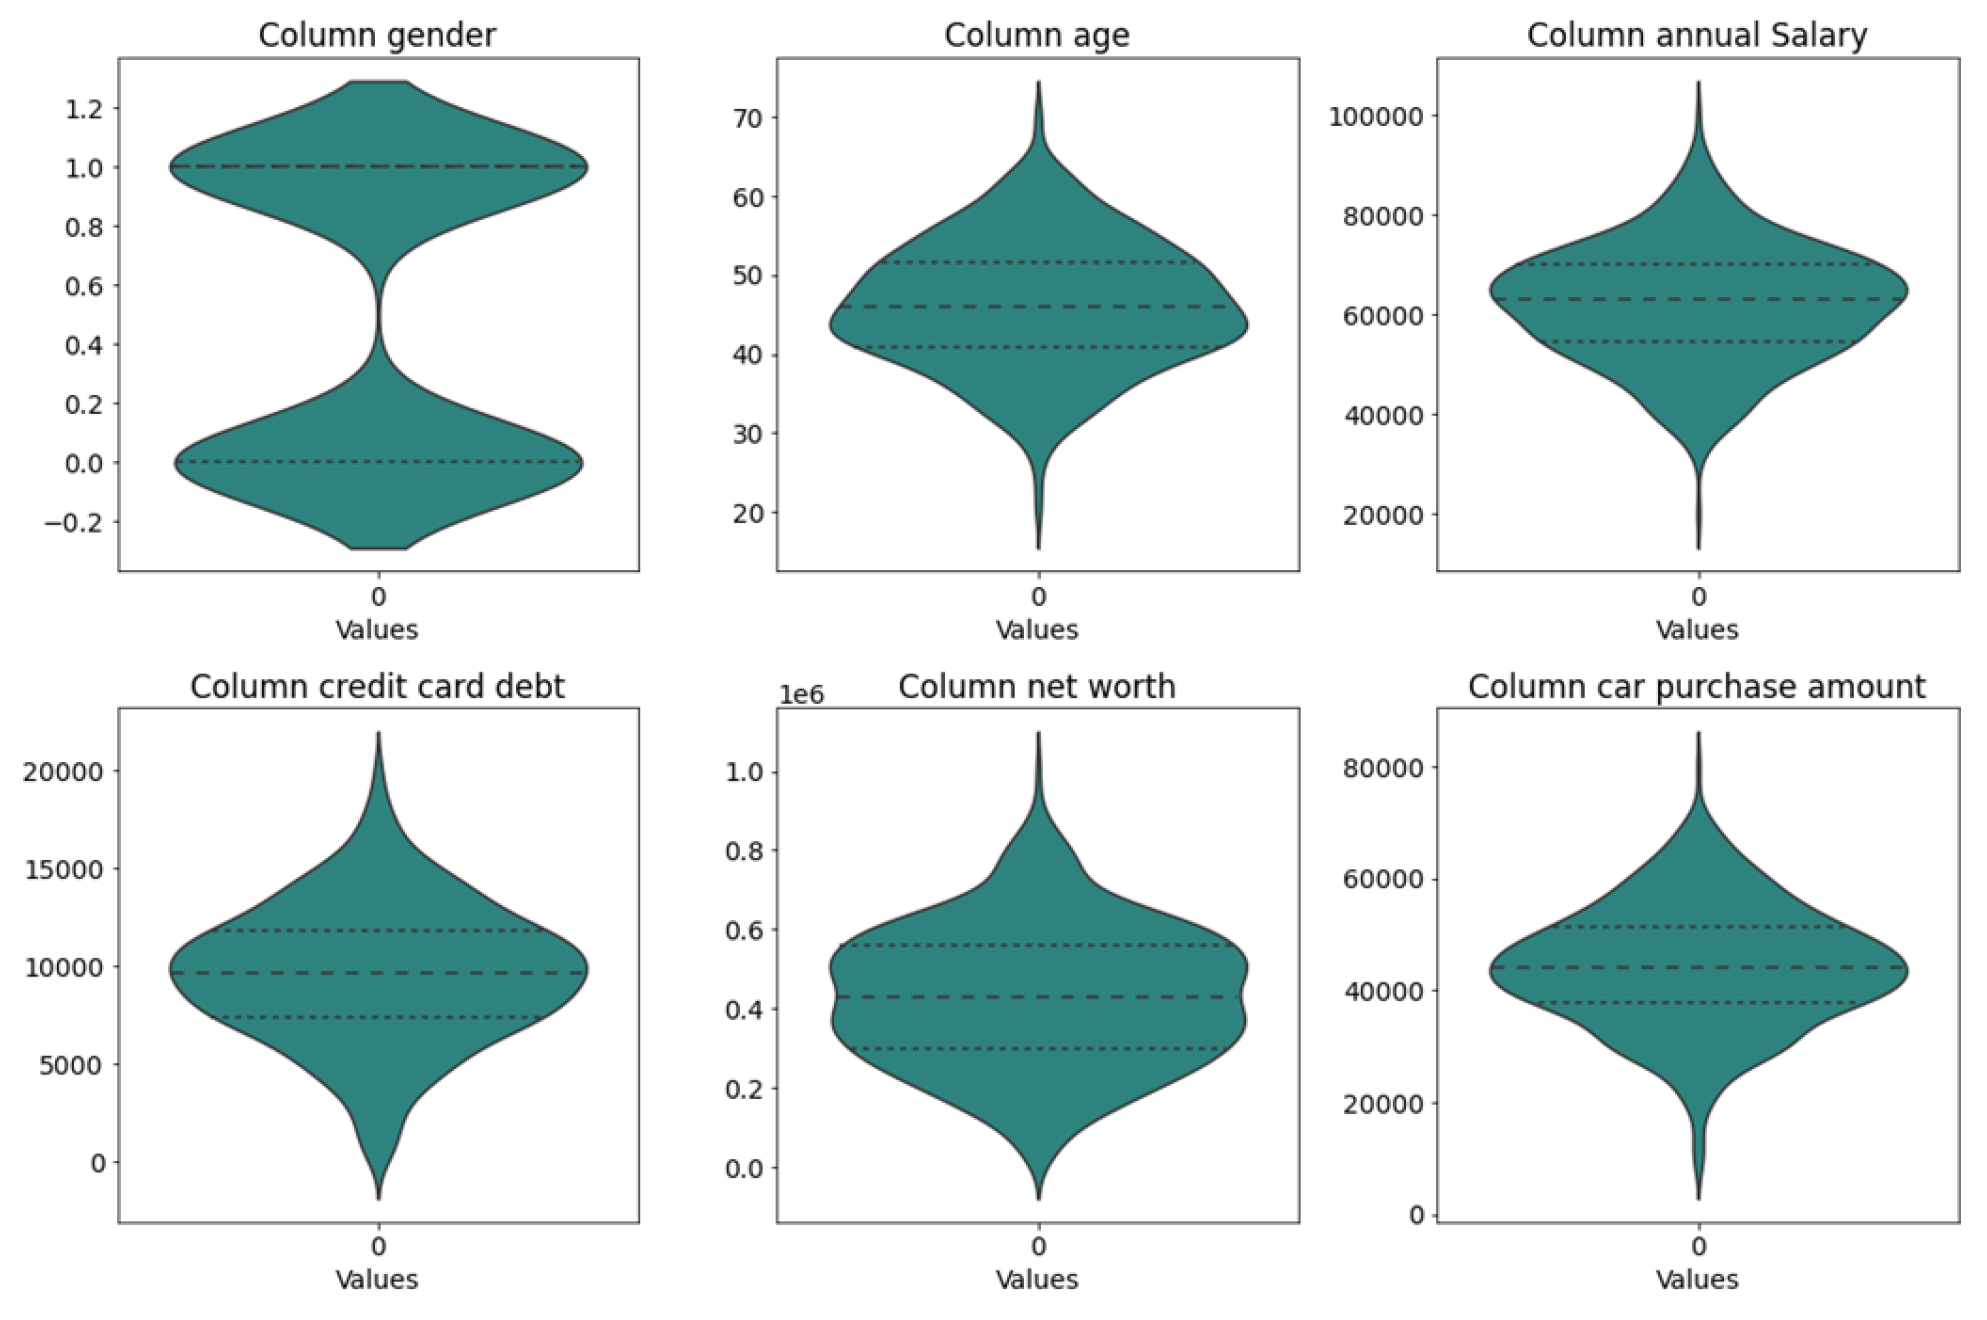
Figure 4.
The model structure of BP neural network.
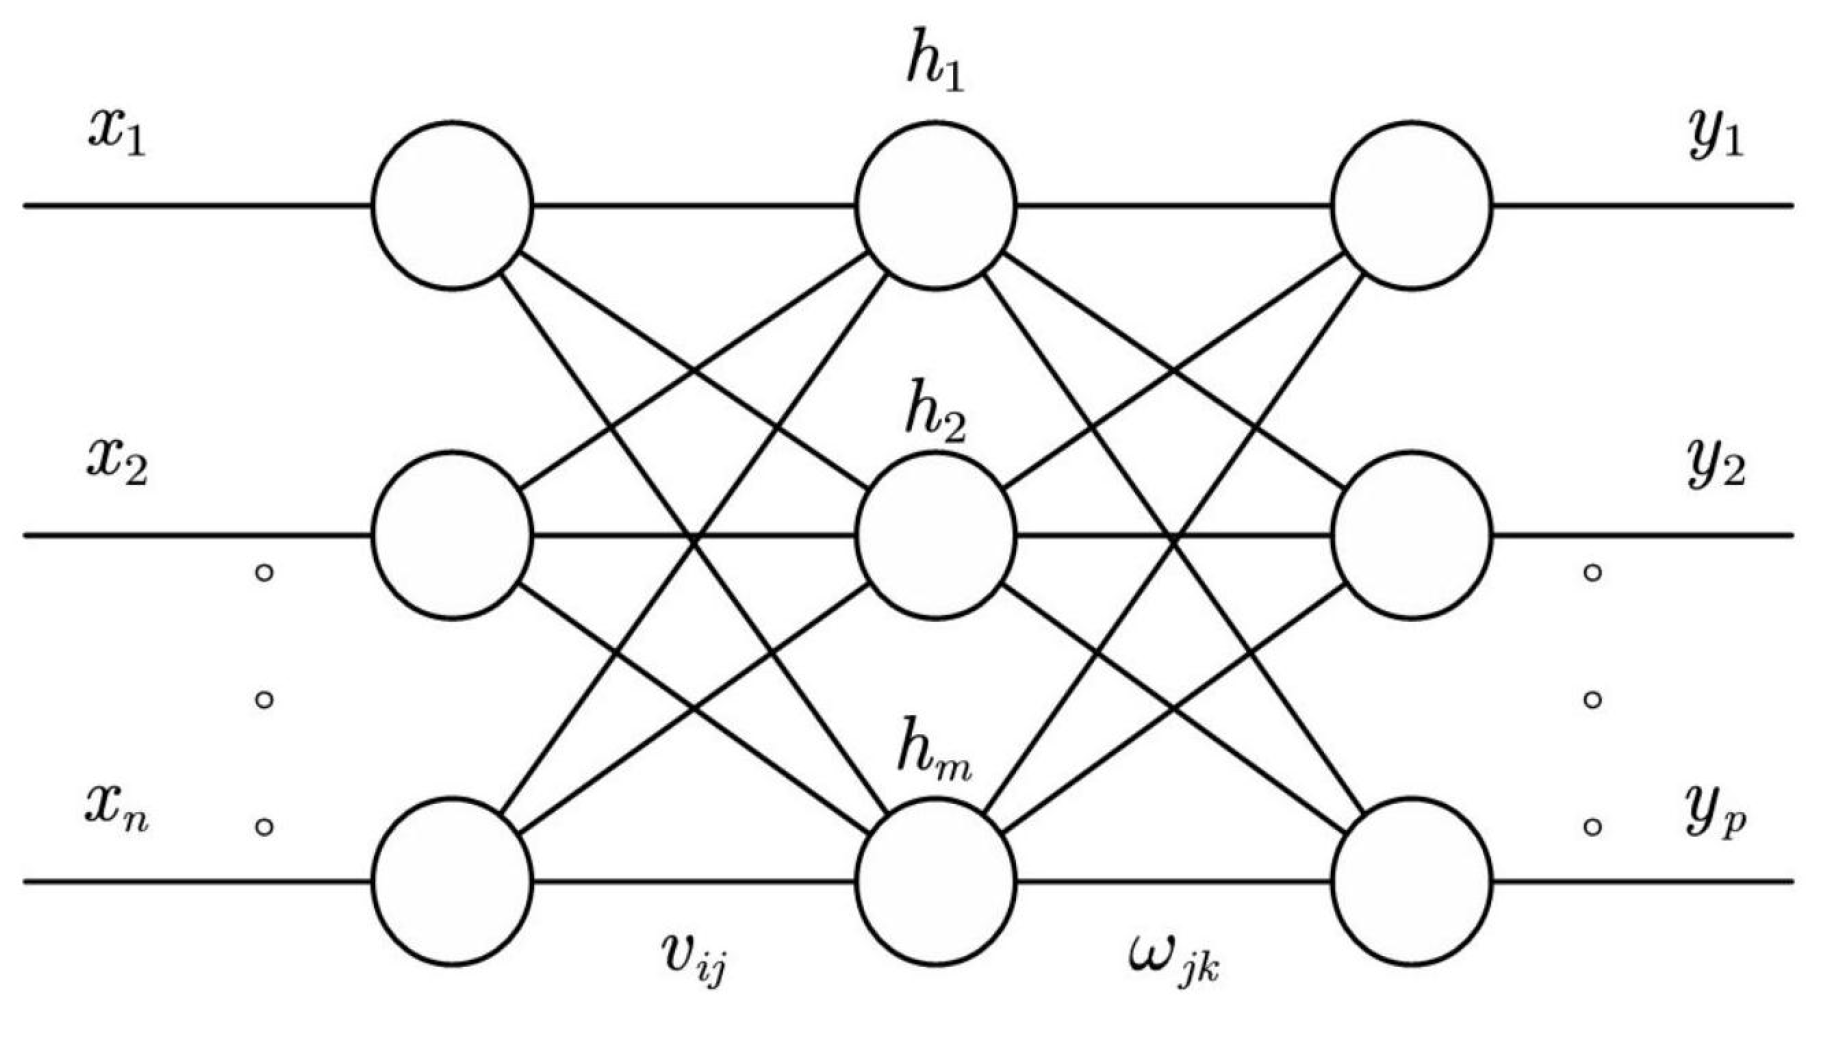
Figure 5.
The adaptation change curve.
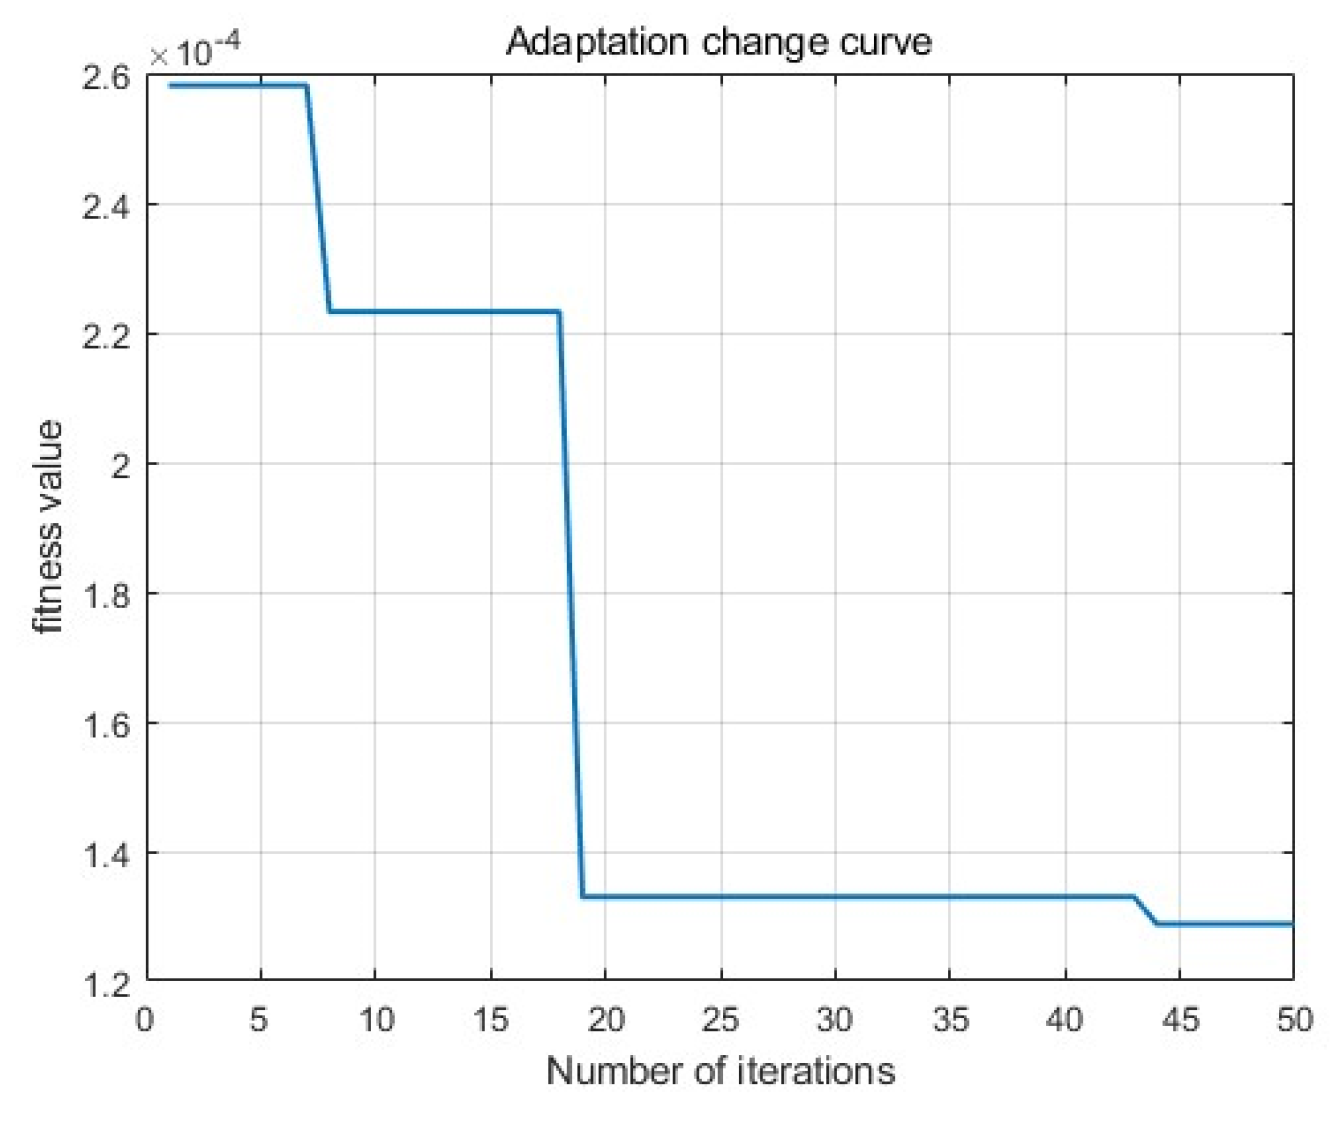
Figure 6.
The results of actual values and predicted values in the training set.
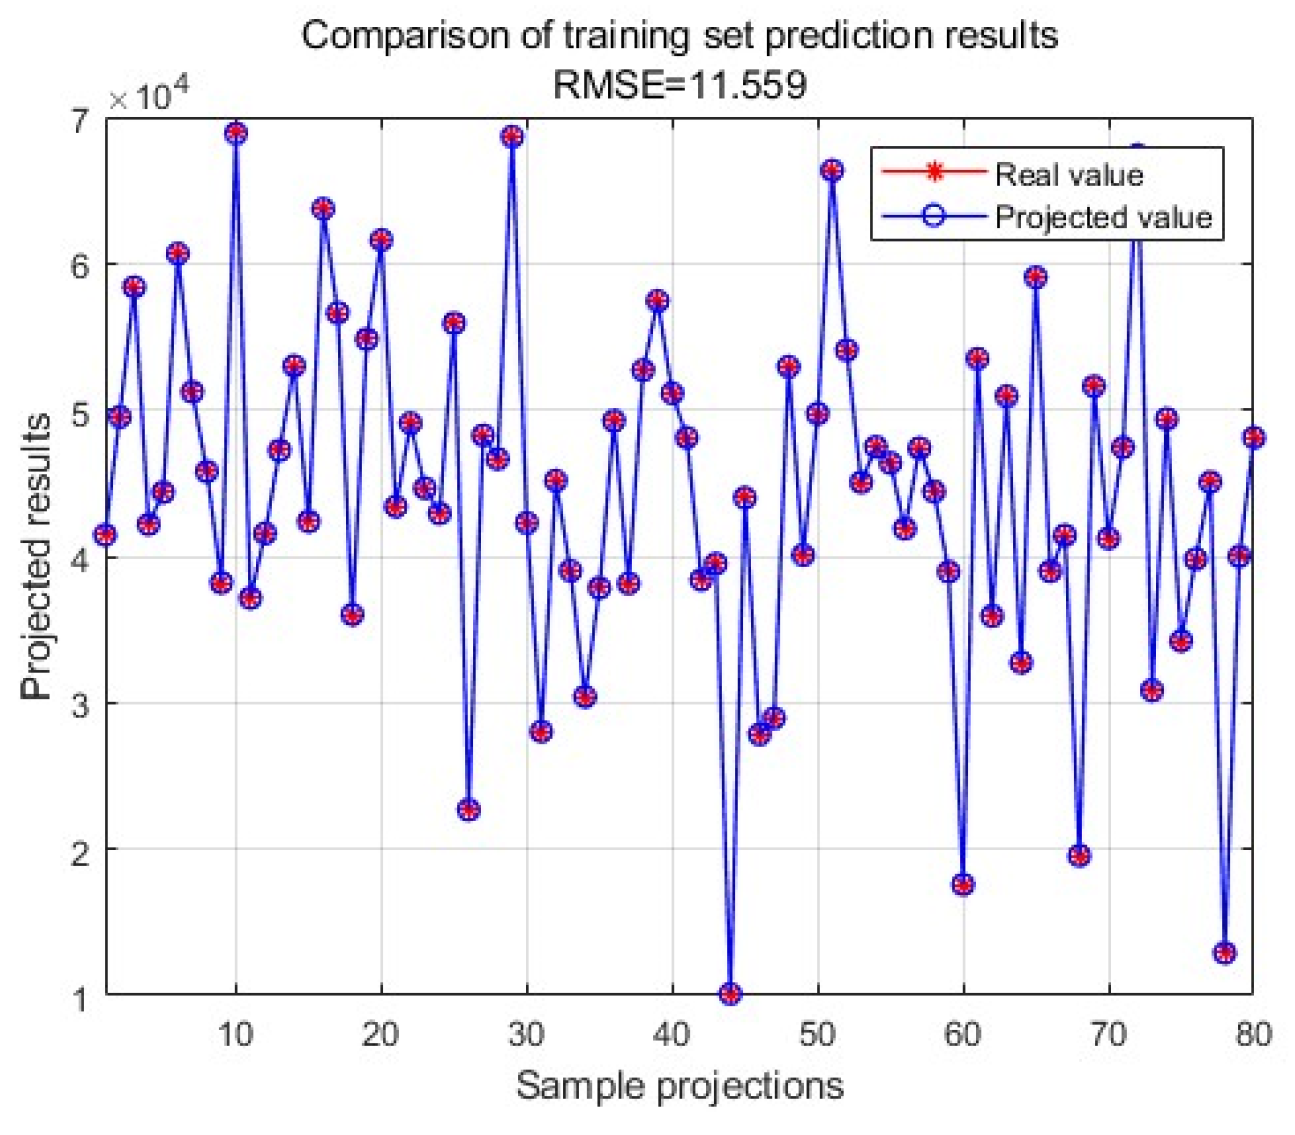
Figure 7.
The model structure diagram of random forest.
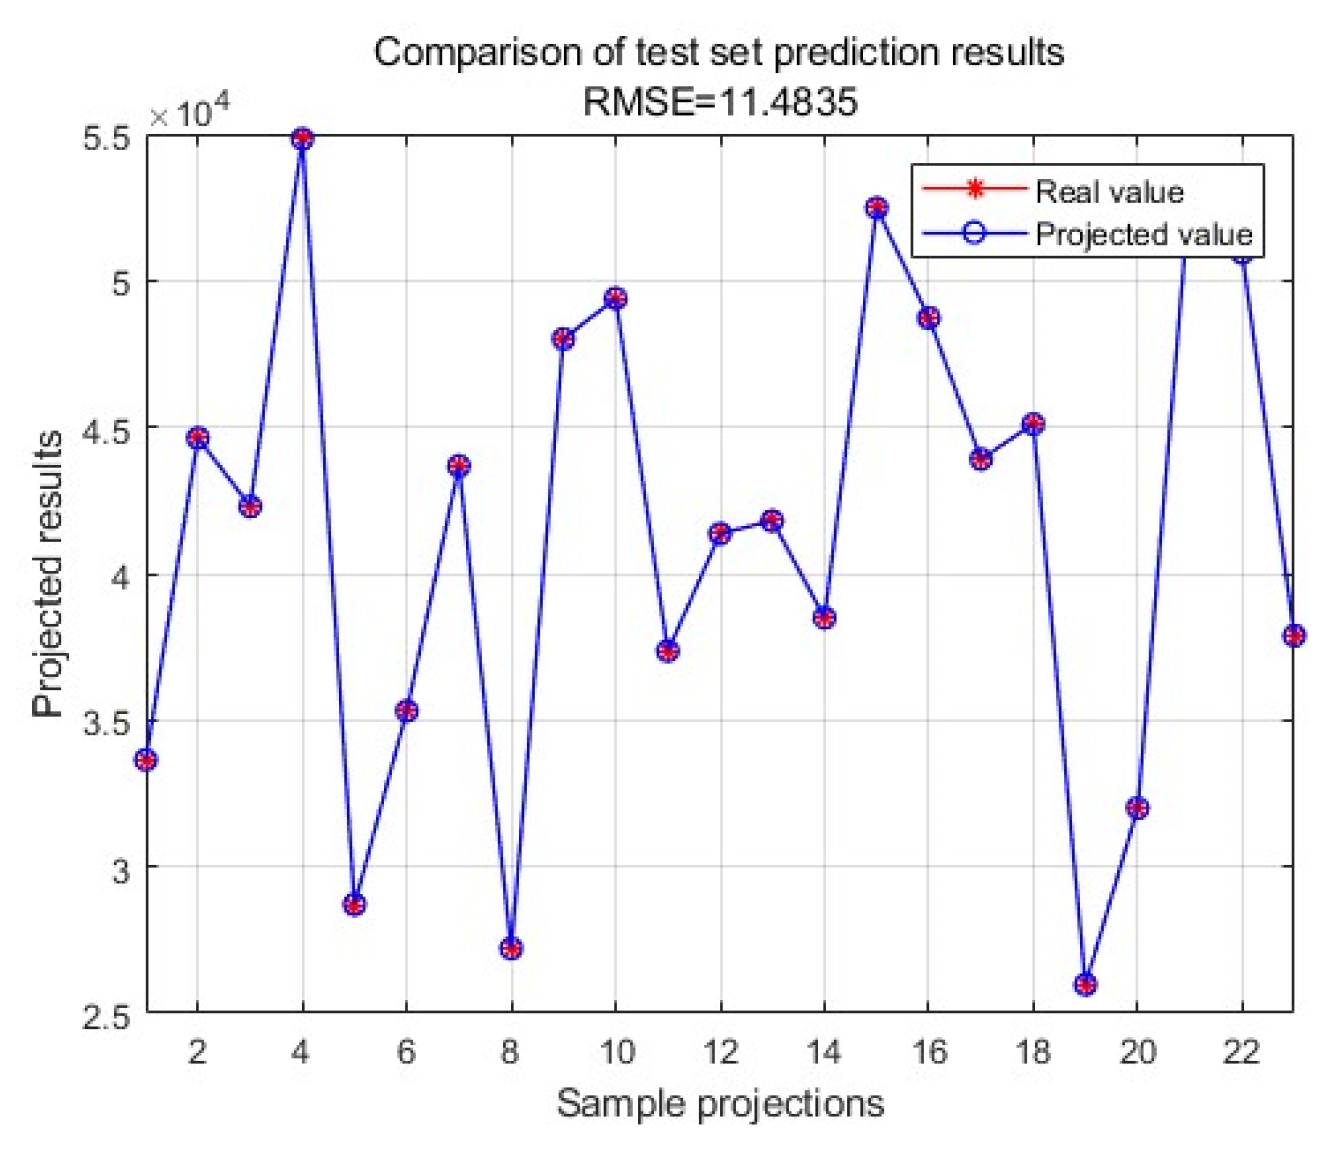
Figure 8.
The actual and predicted values in the training and test sets on a Y-X plot.
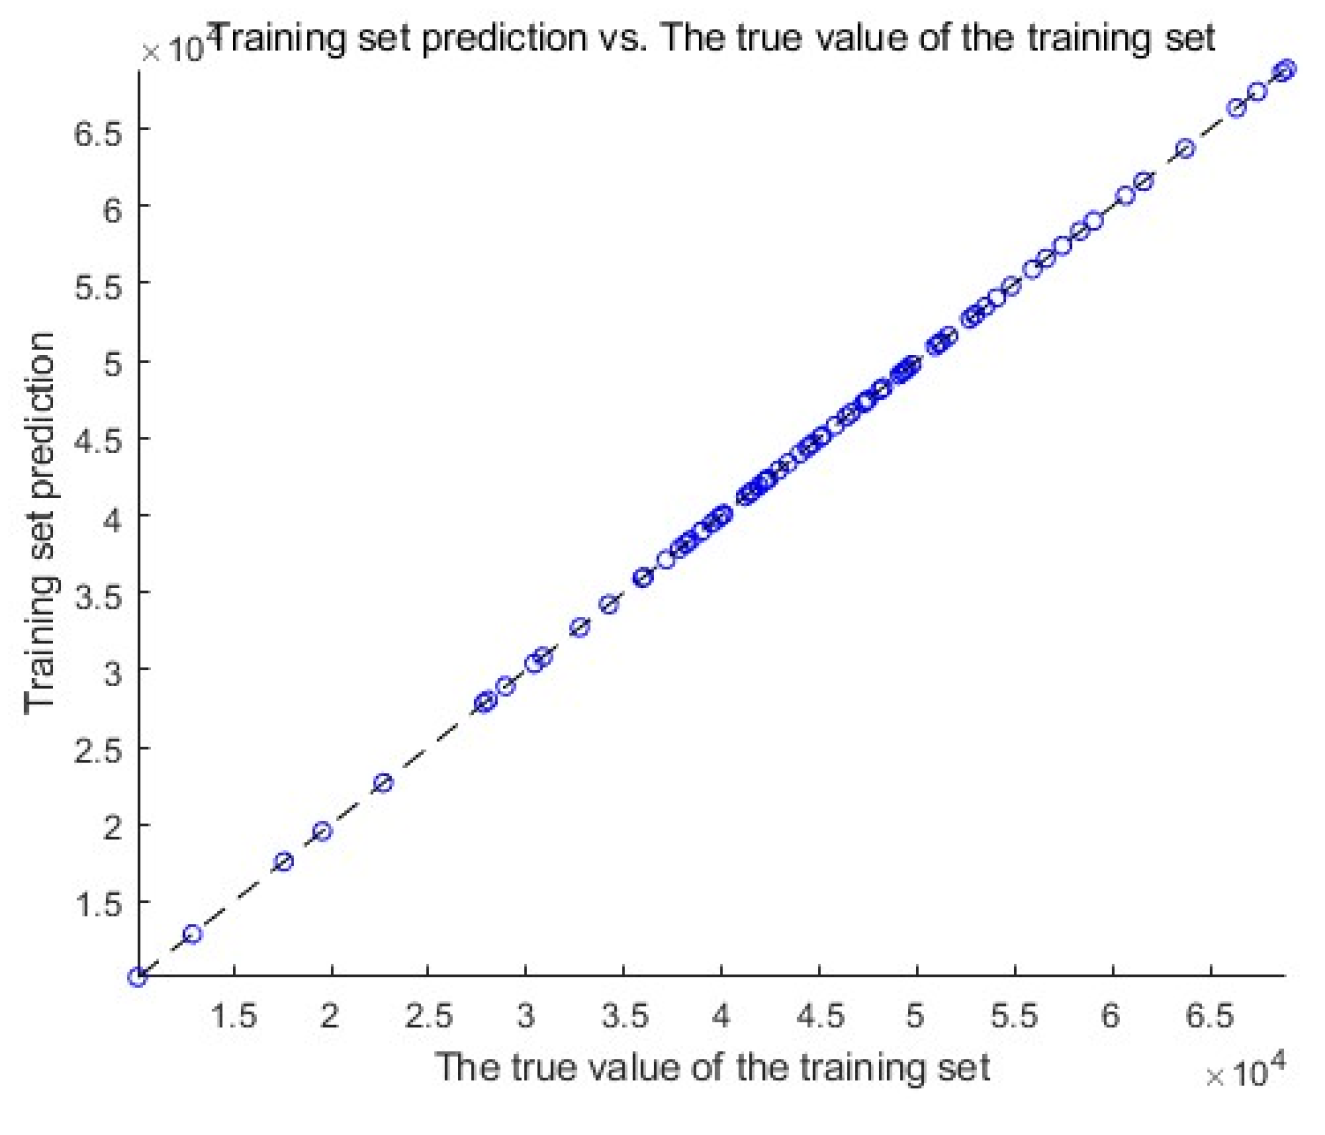
Figure 9.
The actual and predicted values in the training and test sets on a Y-X plot.
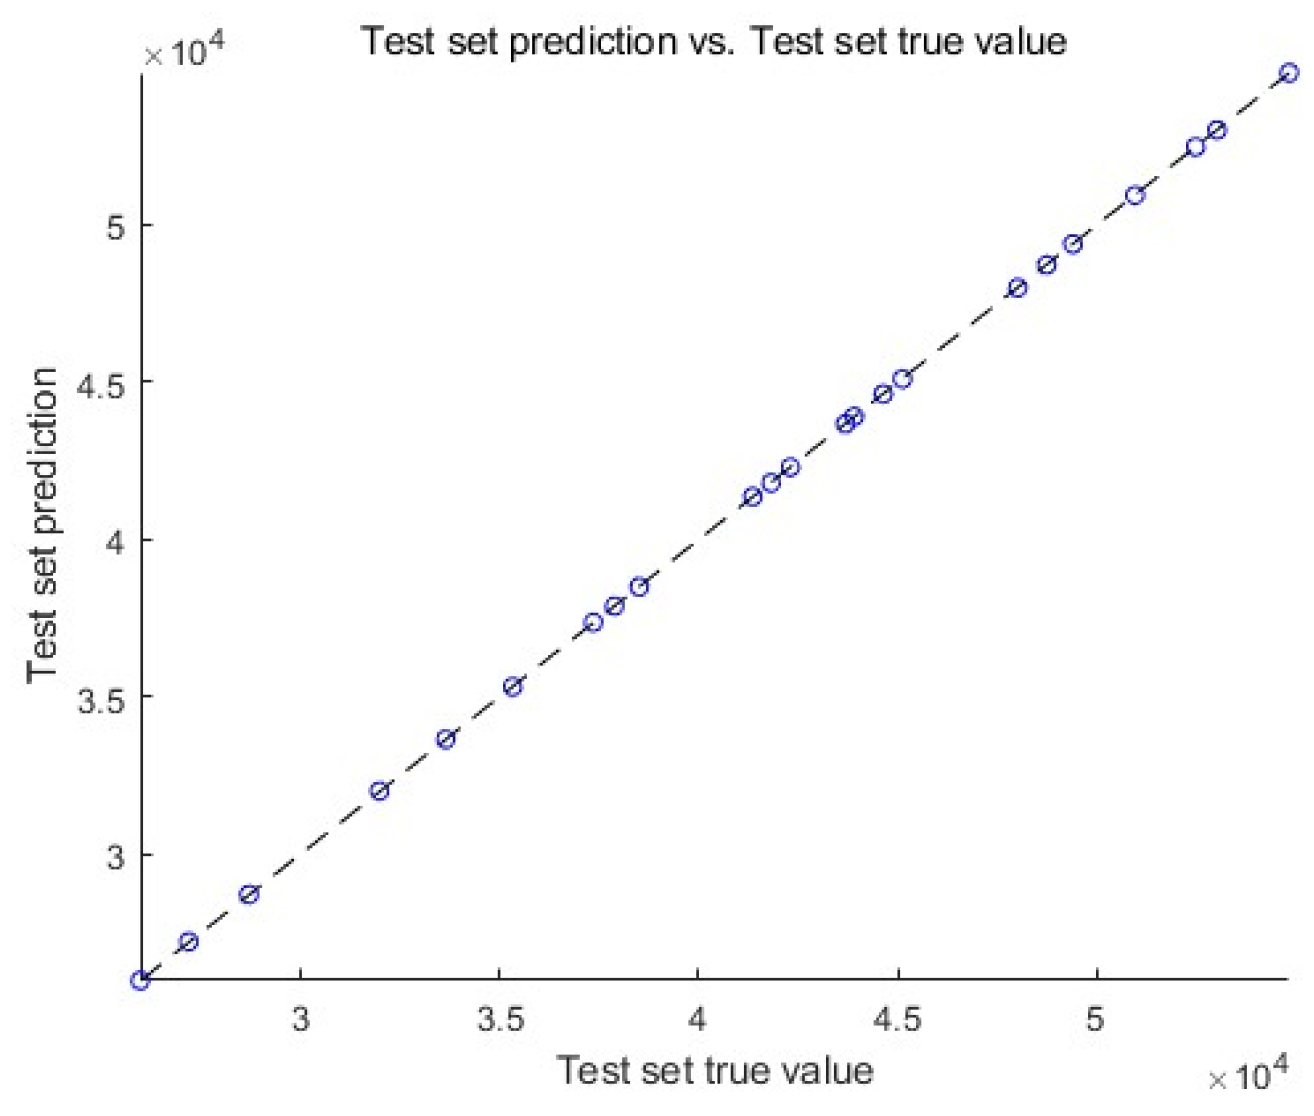

Table 1.
Partial data.
| Gender | Age | Annual Salary | Credit card debt | Net worth | Car purchase amount |
| 0 | 41.851 | 62812.09 | 11609.38 | 238961.25 | 35321.45 |
| 0 | 40.870 | 66646.89 | 9572.957 | 530973.90 | 45115.52 |
| 1 | 43.152 | 53798.55 | 11160.35 | 638467.13 | 42925.70 |
| 1 | 58.271 | 79370.03 | 14426.16 | 548599.05 | 67422.36 |
| 1 | 57.313 | 59729.15 | 5358.712 | 560304.06 | 55915.46 |
| 1 | 56.824 | 68499.85 | 14179.47 | 428485.36 | 56611.99 |
| 1 | 46.607 | 39814.52 | 5958.460 | 326373.18 | 28925.70 |
| 1 | 50.193 | 51752.23 | 10985.69 | 629312.41 | 47434.98 |
| 0 | 46.584 | 58139.25 | 3440.823 | 630059.02 | 48013.61 |
| 1 | 43.323 | 53457.10 | 12884.07 | 476643.35 | 38189.50 |
| 1 | 50.129 | 73348.70 | 8270.707 | 612738.61 | 59045.51 |
Table 2.
Modelling assessment.
| R2 | MAE | MBE | RMSE | |
| Training | 1 | 8.2512 | -4.3035 | 11.559 |
| Test | 1 | 9.578 | -2.4547 | 11.4835 |
Disclaimer/Publisher’s Note: The statements, opinions and data contained in all publications are solely those of the individual author(s) and contributor(s) and not of MDPI and/or the editor(s). MDPI and/or the editor(s) disclaim responsibility for any injury to people or property resulting from any ideas, methods, instructions or products referred to in the content. |
© 2024 by the authors. Licensee MDPI, Basel, Switzerland. This article is an open access article distributed under the terms and conditions of the Creative Commons Attribution (CC BY) license (http://creativecommons.org/licenses/by/4.0/).
Copyright: This open access article is published under a Creative Commons CC BY 4.0 license, which permit the free download, distribution, and reuse, provided that the author and preprint are cited in any reuse.


