1. Introduction
In recent years, the maintenance and inspection of aging social infrastructure in public facilities, dams, tunnels, etc. has become a critical issue due to the aging of structures and the increasing need for safety and reliability. Traditionally effective inspection methods often involve invasive procedures that can be time-consuming, costly, and potentially damaging to the structures being inspected. As a result, there is a growing demand for non-destructive testing (NDT) methods that can provide accurate and efficient assessments without compromising the integrity of the infrastructure.
The advancement of NDT technologies for infrastructure and residential buildings is particularly important in Japan, a country highly prone to earthquakes. The ability to accurately assess and ensure the integrity of structures without causing additional damage is critical to mitigating the risks associated with seismic activity and maintaining public safety.
Several NDT techniques are available for such aging infrastructure facilities, e. Typical examples include ultrasonic testing (UT) [
1,
2], thermographic testing (TT) [
3,
4,
5,
6,
7,
8,
9], X-ray testing (XT) [
10], pulsed magnetic testing (PMT) [
11,
12], etc. UT can detect internal defects with high accuracy and is often portable, but requires contact with the test object and ultrasound couplants. Thermographic testing is non-contact and can inspect large areas in a short time, but is affected by changes in surface temperature, so internal defects can be difficult to detect. XT can image internal structures using transmitted X-rays and can produce high-resolution images, but requires control of radiation, which is harmful to the human body and is often a more bulky instrument. MPT can also detect microscopic defects near the surface, but the measurement is limited to magnetic materials and requires cleaning of the surface of the object being inspected.
A promising technology in the field of NDT is millimeter-wave (MM-wave) radar imaging [
13,
14,
15]. Operating in the frequency range of 30 to 300 GHz, MM-wave radar provides high-resolution imaging and the ability to penetrate various materials, making it particularly suitable for the detection of cracks on the surface of steel bridges and concrete tunnels, and for inspecting houses damaged by earthquakes and other disasters. This technology offers several advantages over traditional methods, including the ability to perform inspections in real time, detect subsurface defects, and operate in adverse environmental conditions. In addition, if the directivity of MM-wave radar can be increased sufficiently, it is possible to inspect measurement objects located at a considerable distance. This is an important factor in ensuring the safety of the technician conducting the inspection.
Therefore, in this study, a highly sensitive MM-wave radar array antenna module with high directivity and high signal-to-noise ratio (SNR) was developed and integrated into a SIMO (single-input and multiple-output)-SAR (synthetic aperture radar) imaging system. After optimizing the imaging performance of the constructed system, actual observations were made of the building materials, including slab imitating reinforced concrete. In this paper, we report the results of these inspections and demonstrate that the constructed system is useful for NDT inspection of infrastructure structures.
2. MM-Wave Array Antenna Sensor
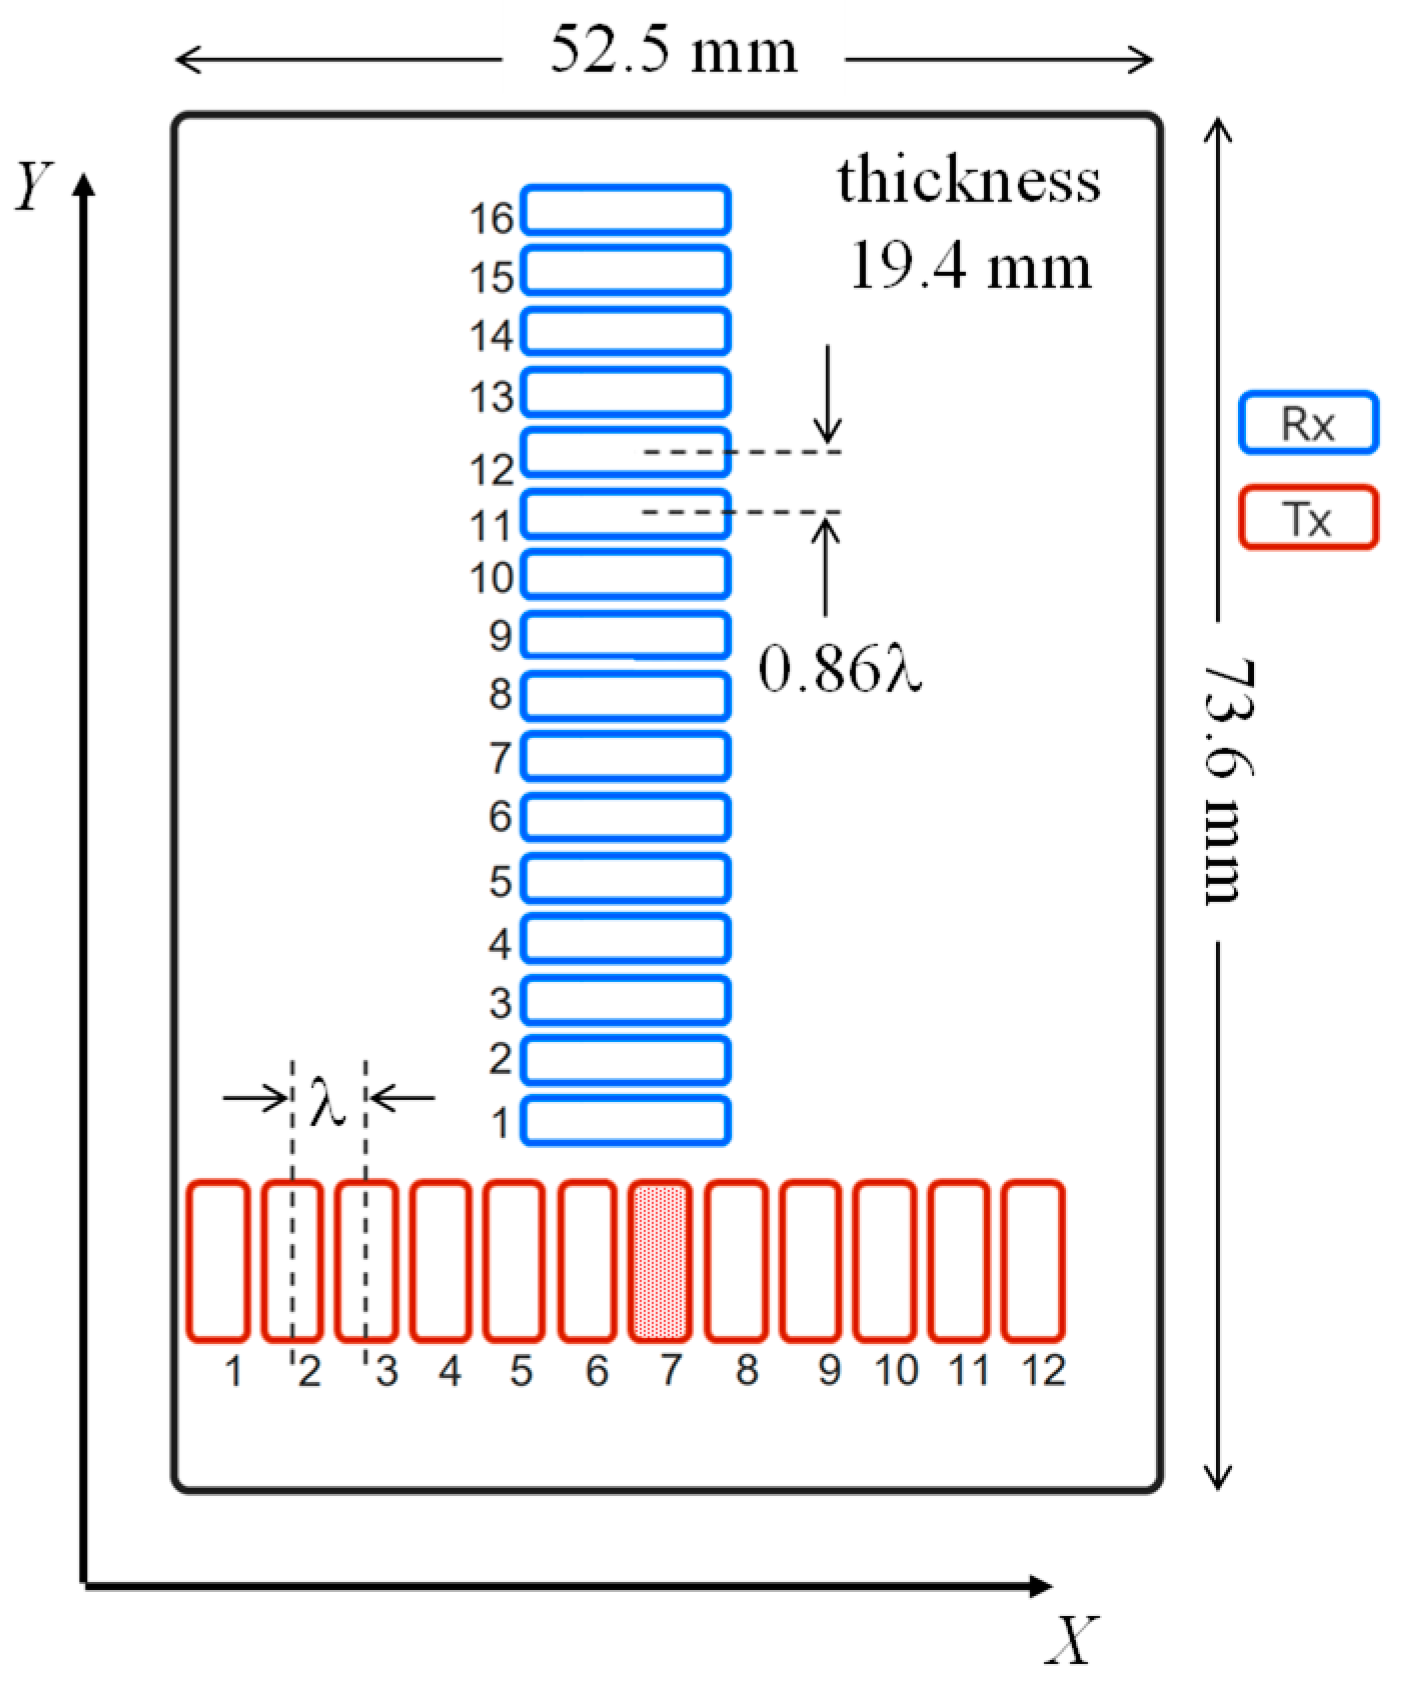
To explore the possibility of MM-wave imaging for NDT, the transmission characteristics of MM-wave against various materials that would attenuate MM-waves should be investigated. For this purpose, an MM-wave array antenna module with high absolute gains of the transmit and receive antennas was prepared for the present studies. Specifically, a 2-dimensional orthogonal array antenna sensor was fabricated by Taiyo Yuden CO., Ltd. The array pattern of the transmit and receive antennas is shown in
Figure 1, which consists of twelve transmit antennas (Tx) with a spacing of λ (= 3.80 mm) and sixteen receive antennas (Rx) with a spacing of 0.86 λ (= 3.25 mm) in an antenna unit of 52.5 mm × 73.6 mm × 19.4 mm, in an orthogonal array pattern of MIMO (multiple-input and multiple-output) antenna structure. Although these antennas are arranged in such a narrow pitch, they have excellent side-rope suppression and can control directivity over a wide bandwidth. In addition, there is very low signal transmission loss between these Tx and Rx antenna elements and the radar chips using the technology developed by Aoki et al. [
16]. For the MM-wave radar chips, four cascaded chips (Texas Instruments AWR2243 [
17]), which are FMCW transceivers in the 76 GHz to 81 GHz band, are installed on this antenna unit. The element statistics of the MM-wave array antenna module are shown in
Table 1.
Looking at the directivity and absolute gains, which are the most important factors in the present study, it can be seen that despite such a small antenna device, the directivity is high enough to achieve an absolute gain of 13.5 dB and 14.5 dB for the Tx and Rx antenna elements, respectively. These values are significantly higher than the 10.5 dB of the Texas Instruments IWR1443BOOST Evaluation Module (EVM) [
18] used in our previous MM-wave MIMO SAR (Synthetic Aperture Radar) imaging system [
15]. In addition, the elevation 3dB beamwidth is approximately ±13 degrees, indicating the excellent directivity of the present radar module.
3. SIMO-SAR Imaging System
To perform high-resolution imaging, a SAR imaging system has been constructed. SAR uses the concept of a virtual orbit, where a large number of antennas are distributed along the path of the radar system, allowing signal transmission and reception while the system is moving [
19,
20,
21,
22,
23]. This dynamic motion effectively increases the aperture length, thereby improving system performance. In this system, only a Tx7 antenna was used, as shown in
Figure 1. In other words, a SIMO (single-input and multiple-output) SAR imaging system was constructed. On the other hand, a 2-axis mechanical scanner (YAMAHA HXYx series) was adopted for SAR imaging. The maximum scanning range in the horizontal direction (
X-axis) is 1250 mm with a maximum speed of 1200 mm/s, while the maximum scanning range in the vertical direction (
Y-axis) is 1050 mm with a maximum speed of 600 mm/s. Control was performed in a Python-based environment from a host PC via a serial port.
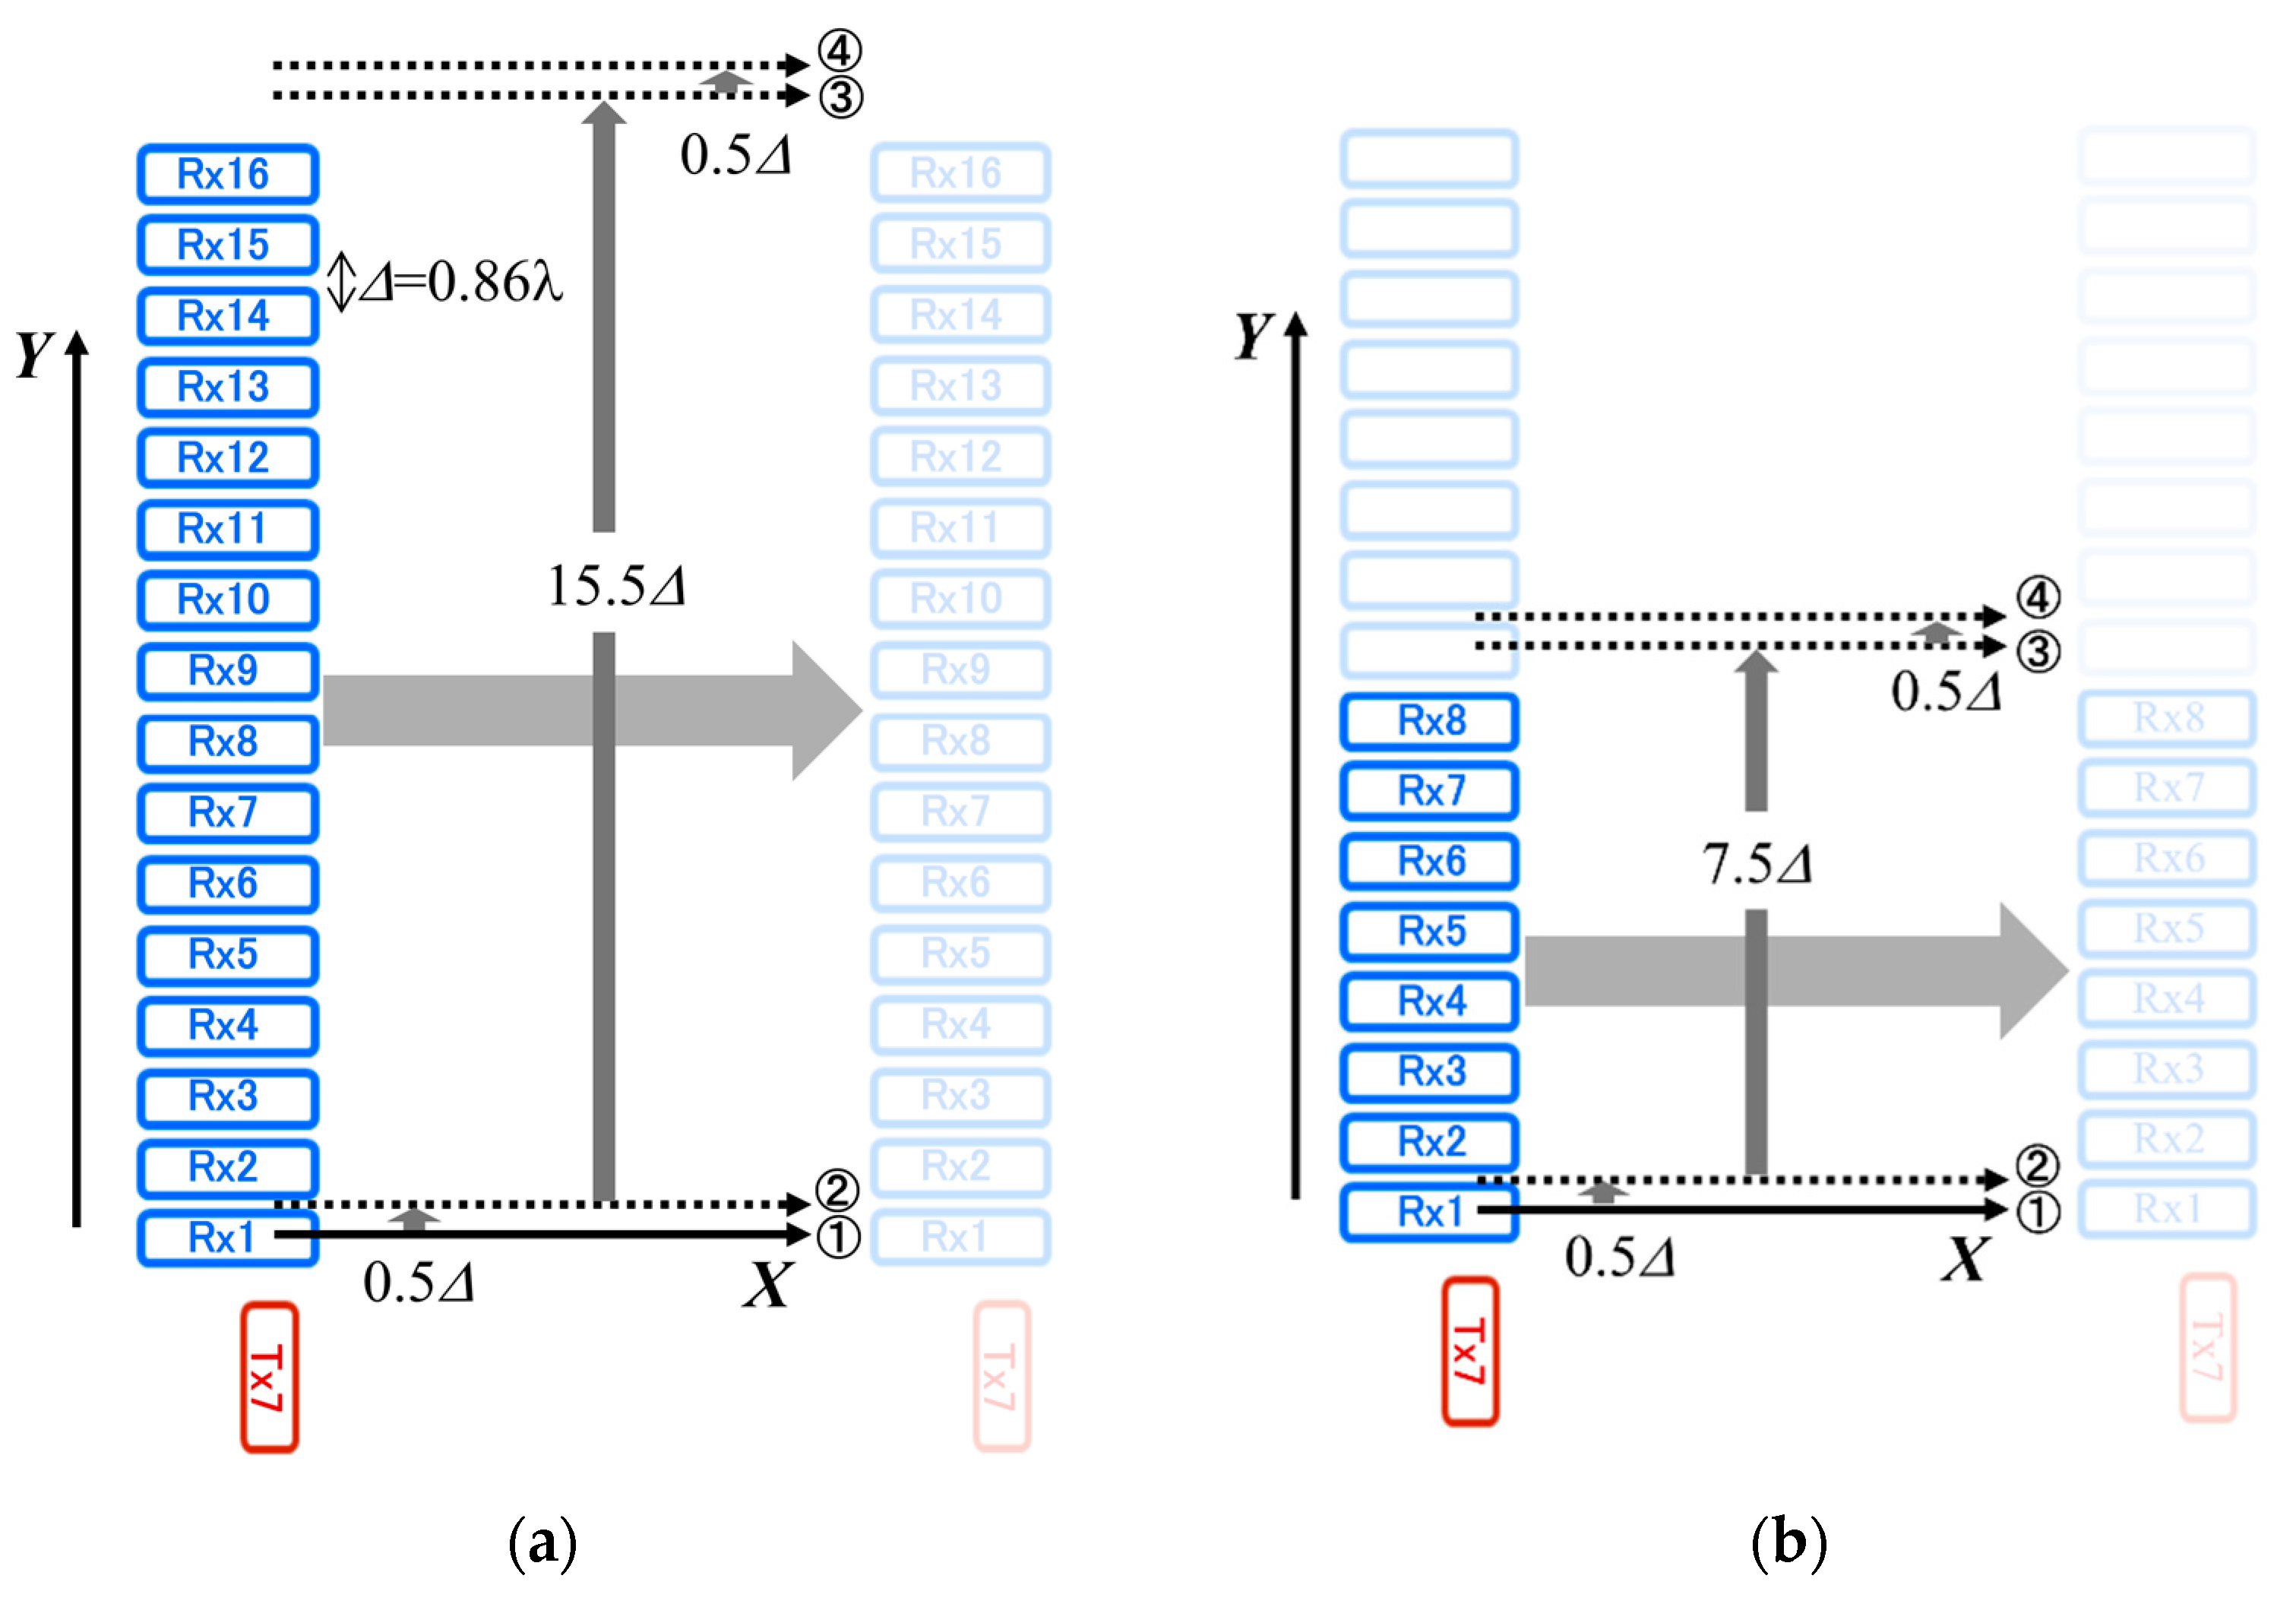
Since there is very little interference between the sixteen Rx antennas, even though the Rx spacing is very small, 16 rows of data in the
Y-axis direction can be acquired in a single scan along the
X-axis. However, for high-resolution imaging in the
Y-axis direction, the
X-axis scanner was shifted by 0.5
Δ (
Δ=0.86
λ: 3.25 mm) in the
Y-axis direction and scanned again along the
X-axis before the
X-axis scanner was shifted by 15.5
Δ in the
Y-axis direction (see
Figure 2(a)).
For the FMCW chirp signal, the frequency of the signal transmitted from the Tx antenna was varied from 77.11 GHz to 80.89 GHz (bandwidth B = 3.584 GHz) based on the effective value, and the frequency slope in the chirp signal was set to 28.002 MHz/μs. The horizontal (X-axis) scanning speed was set to 500 mm/s, the sampling interval in the scanning along the X-axis was set to 2.0 ms, and the effective number of samples was set to 768.
In FMCW radar measurement, the received signal reflected from a target is mixed with the transmitted signal by a mixer, and the differential frequency components of the two signals are output through a low-pass filter [
24]. This extracts an intermediate frequency (IF) signal [
25,
26]. The IF signal can be used to obtain a range FFT spectrum in which each spectrum peak reflects the distance (
L) of the target surfaces. Therefore, it is possible to obtain 2D and 3D reconstructed images using the range FFT spectrum. The detailed data process for obtaining the 2D or 3D reconstructed images using the IF signal has already been reported elsewhere [
15].
4. Basic Performance of the Constructed SIMO-SAR Imaging System
4.1. Optimization of Millimeter-Wave Imaging Measurements
In the above, we described the details of the SIMO-SAR imaging system constructed this time. However, since the measurements were performed in a laboratory space with limited space, the measurement conditions for the present study had to be modified somewhat. In particular, an MM-wave array antenna module with such large absolute gains, a high directivity, and up to sixteen Rx antennas probably has no problems measuring distant targets. However, there are some considerations when measuring in a limited laboratory space. In particular, the distances between T7 and R1 (6 mm) and between T7 and R16 (58 mm) are too different, which means that if the distance to the target to be measured is short, there will be a large difference in the intensity of the MM-wave signals received by Rx1 and Rx16 antennas.
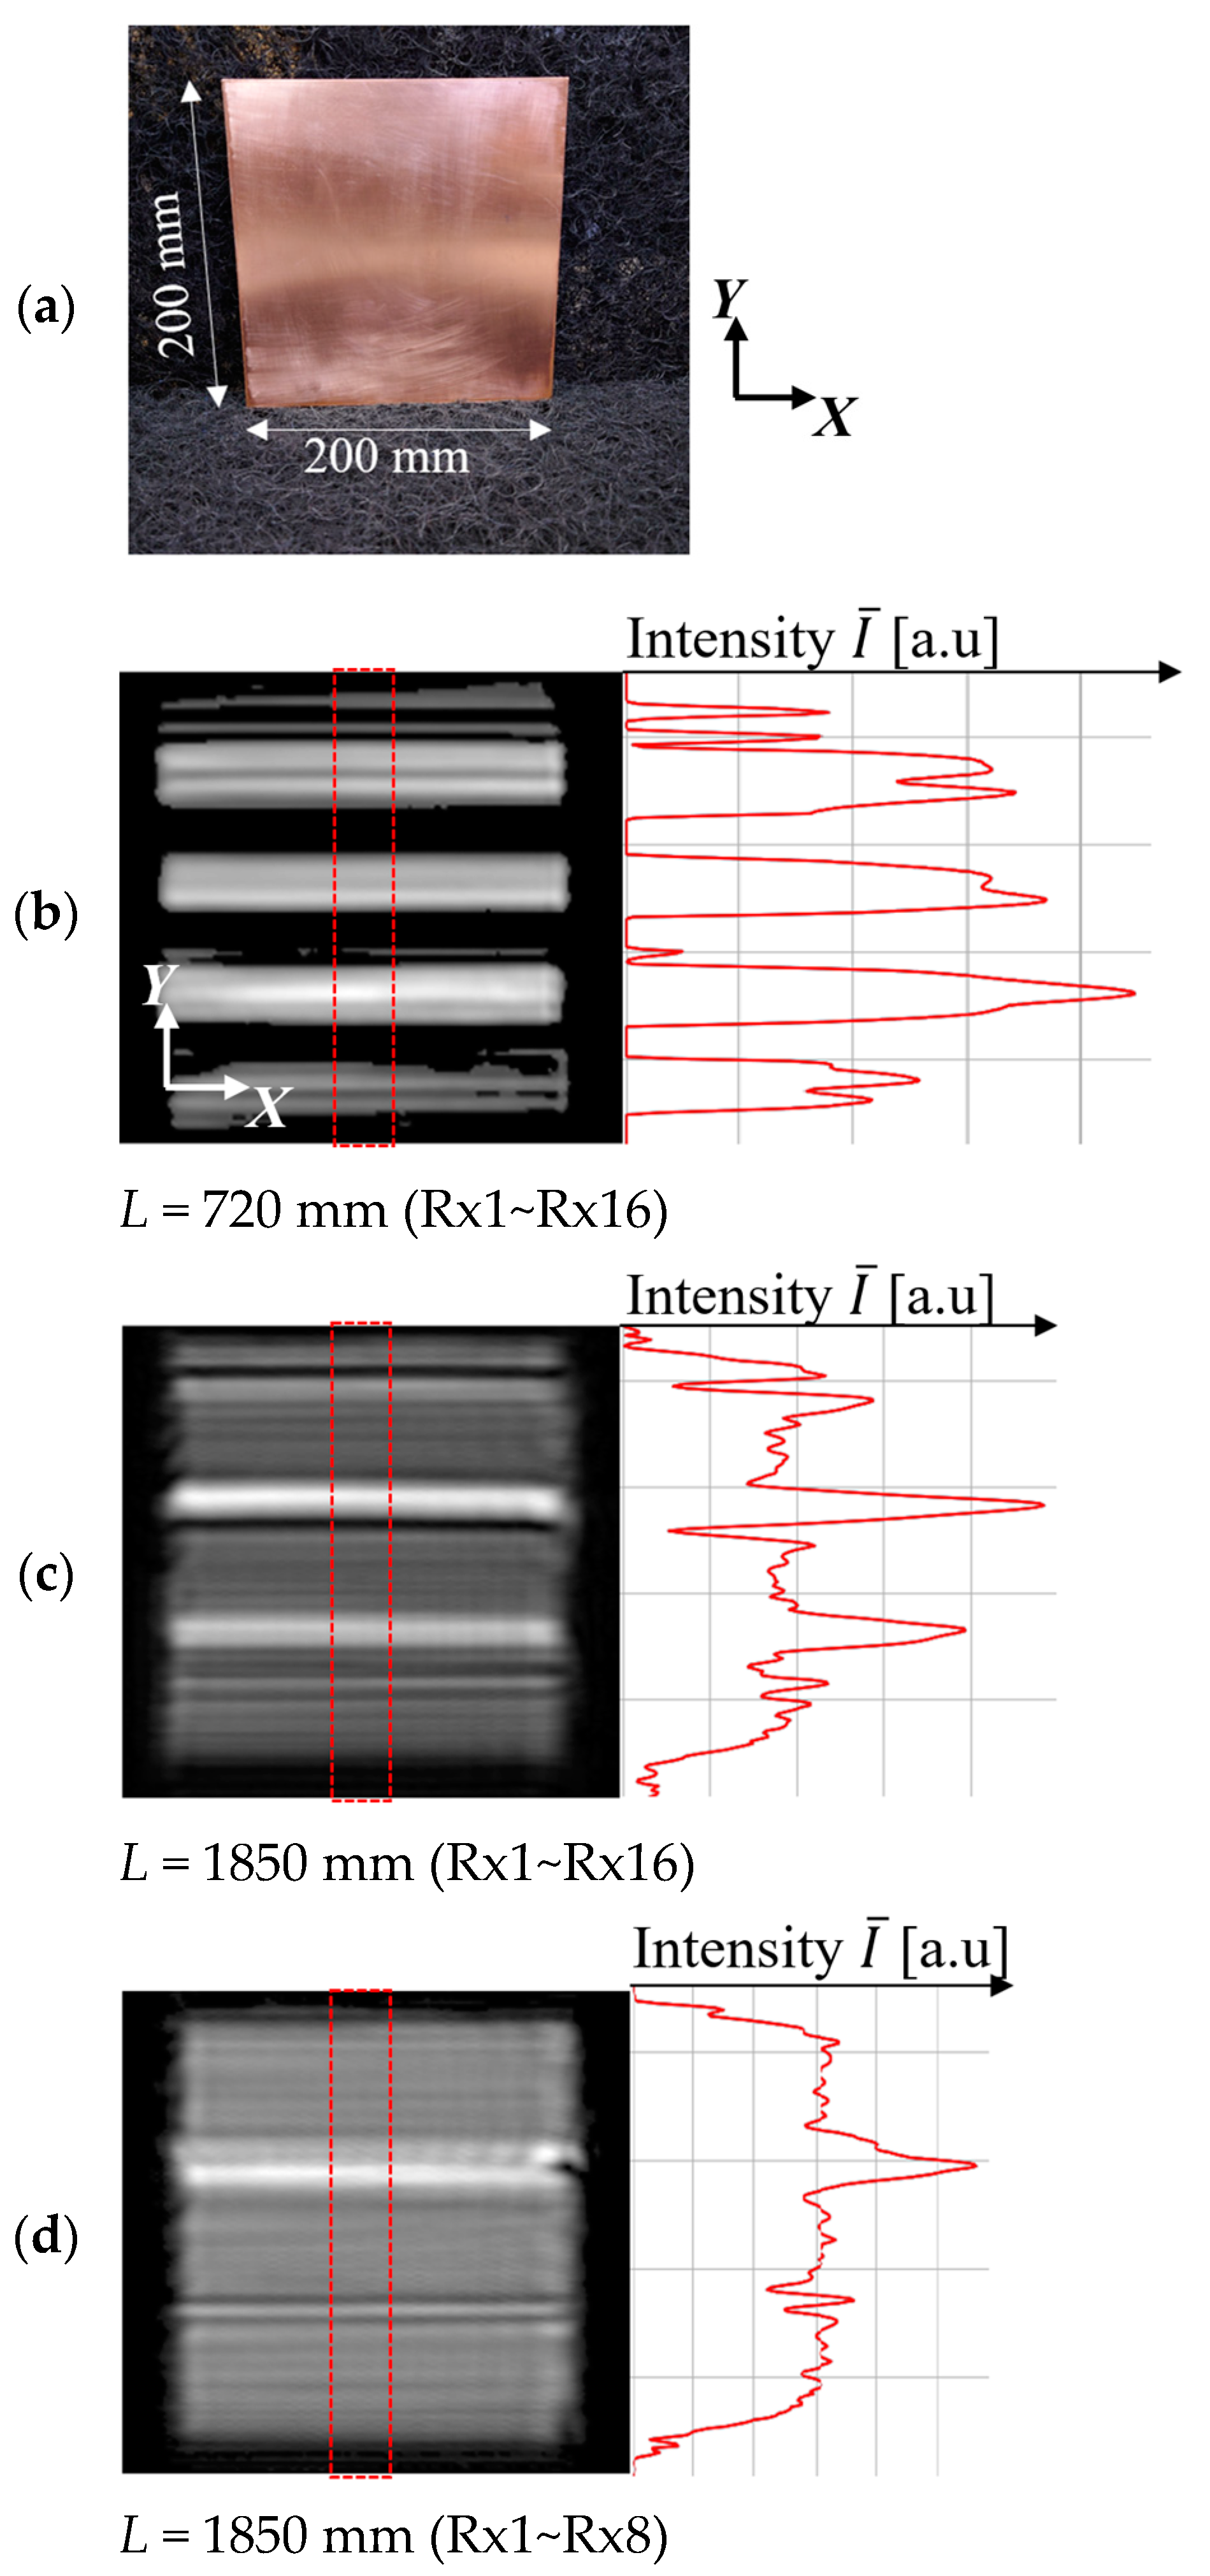
To investigate this point, we compared the MM-wave images of the copper plate placed at different distances. The results are shown in
Figure 3.
Figure 3 (a) shows a 200 mm x 200 mm copper plate used for this MM-wave imaging. This copper plate was placed in front of the constructed SIMO-SAR imaging system at different distances of
L=720 mm and
L=1850 mm in the measurements. The left sides of
Figure 3 (b) and (c) show the MM-wave images observed when the copper plate was placed at
L=720 mm and
L=1850 mm, respectively. The right sides of
Figure 3(a) and (b) show the
Y-axis profile of the averaged intensity
values within the red dotted rectangles inserted in the MM-wave images. The intensity (
I) corresponds to the MM-wave power received by the receive antenna. All receive antennas of Rx1~Rx16 were used in the measurements. Here, the difference in the MM-wave images between
Figure 3(b) and 3(c) clearly shows that the difference in the distance
L from the transmit antenna Tx7 causes a significant difference in the signal intensities received by the Rx1~Rx16 antennas when observed at a short distance of
L=720 mm. In particular, the profile in
Figure 3 (b) shows apparent areas where the reflection signal from the target can hardly be received.
The result obtained at
L=720 mm can be well explained by considering the situation as shown in
Figure 4. When the distance
L=720 mm, the elevation angle
from Tx7 of the point on the target located in front of Rx16 (distance
d between Tx7 and Rx16: 58 mm), which is the farthest from Tx7, is 4.6 degrees. Considering the beamwidth given in
Table 1, the MM-wave power at the point on the target in front of Rx16 would be about 1 dB less than the absolute gain of 13.5 dB. In addition, MM-waves are reflected from flat metal surfaces of copper plate with a reflection angle nearly equal to the angle of incidence. Therefore, it is expected that MM-waves will hardly be received by the Rx16 antenna. Increasing the distance
L improves this situation somewhat, but there should be still a significant difference in the received signal intensity between Rx1 and Rx16 as shown in
Figure 3(c). Based on these results, we decided to use only Rx1 to Rx8 antennas as the receive antennas in the present study, according to the diagram of the
X-
Y scanning diagram as shown in
Figure 2(b).
Figure 3(d) shows the result of the measurement with the number of antennas reduced while the distance
L remains at 1820 mm. It can be seen that the change in the signal intensity is considerably improved. In addition, in the present study, the measurements were performed with distant targets as far as possible.
4.2. Signal-to-Noise Ratio of the Constructed System
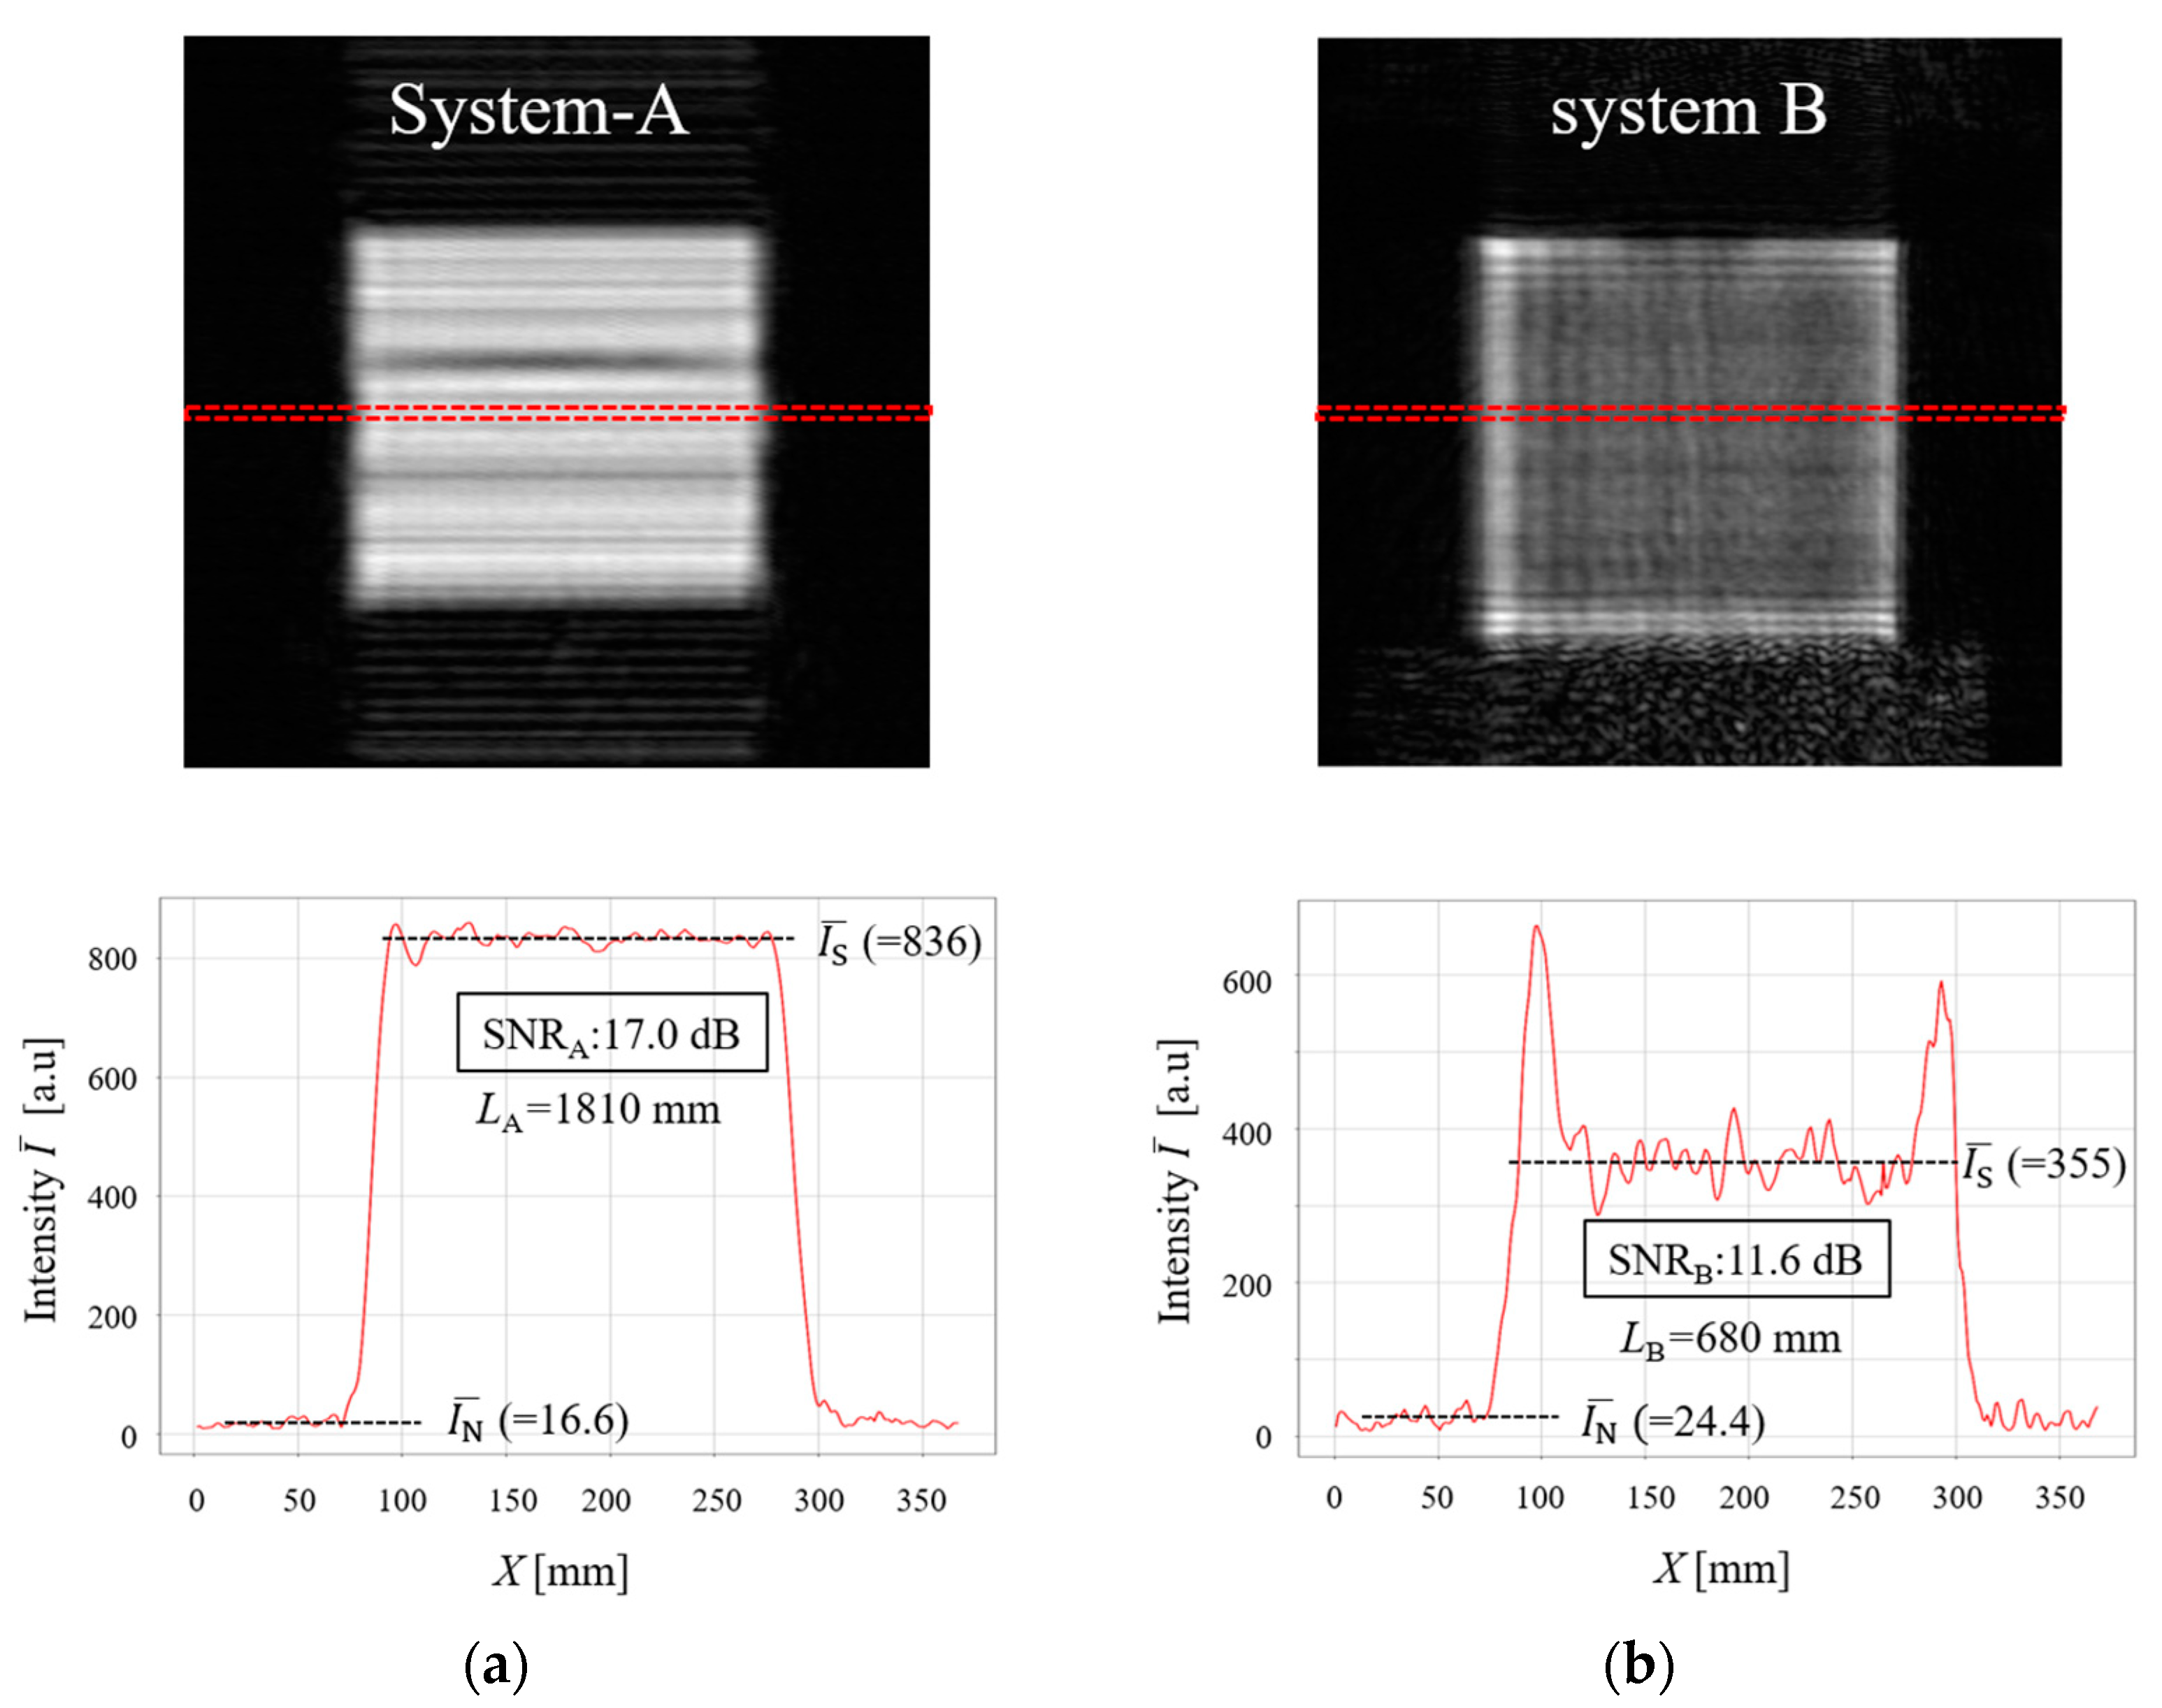
Furthermore, the SNR value of the present SIMO-SAR imaging system (system-A) was compared with that of the previously constructed MIMO-SAR imaging system with an IWR1443BOOST EVM (system-B) [
15]. The IWR1443BOOST EVM has an absolute gain of approximately 10.85 dB over the 76 to 81 GHz frequency band and an elevation 3dB beamwidth of approximately ±28 degrees [
18]. For comparison, MM-wave images of the copper plate were observed by both systems. Each distance
L from the radar module to the copper plate was
LA=1810 mm for system-A and
LB=680 mm for system-B. The results are shown in
Figure 5 (a) and 5(b), where the top figure shows the MM-wave image observed for each system, while the bottom figure shows the profile of the averaged signal intensity
along the
X-axis direction in the area indicated by the dashed red rectangle inserted in the top image. From these results, the averaged signal intensity (
) and noise intensity (
) were estimated as follows,
As a result, we got the following SNR values for system-A (SNR
A) and system-B (SNR
B)
Note that the observed SNR
A is 5.4 dB higher than the SNR
B. Considering the radar equation [
27], it is expected that the received power using system-A will be significantly attenuated because the distance
LA is about 2.66 times longer than
LB for system-B. Despite this fact, the fact that system-A has a higher SNR value than system-B is discussed below.
When considering the difference in SNR between the two systems, we should first consider the gain as a function of the number of array elements
n. In the measurements, system-A used eight array elements (
n=8: Tx-1ch×Rx-8ch), and system-B with the IWR1443 BOOST EVM also used eight array elements (
n=8: Tx-2ch×Rx-4ch). Therefore, the gain (
Garray) for both radar modules is given as follows
Since there is no difference in the gain
, the difference in the composite gain for the two systems was considered using the radar received power equation [
27].
Assuming that the results of
Figure 5 were obtained under the same condition of radar scattering cross section
σ and the wavelength
λ and that the difference in SNR values is considered to be given by the ratio of the maximum received power of each radar module of system-A and system-B. Therefore, the difference in the SNR value of 5.4 dB would be expressed by using the receive powers of
PRA and
PRA and the emission peak powers of
PTA and
PTB for system-A and system-B, respectively, as follows
Substituting the antenna gains for each module yields the following equation.
Here 10.85 dB was used as
and
for the IWR1443BOOST EVM [
18]. Therefore, the ratio of emission peak powers of each radar module can be obtained as follows.
The present radar module with four cascaded chips (Texas Instruments AWR2243) is indeed considered to have a high transmission power, but it is not possible to have 40 times more transmission power than that of the IWR1443 BOOST EVM. Therefore, this result strongly indicates a very low signal transmission loss between the Tx and Rx array antenna elements and the four cascaded chips and also indicates a very high directivity of the present radar module.
5. Experimental Results on Transmission Performance of MM-wave and Discussions
5.1. Comparative Studies on Crack Detection in Concrete
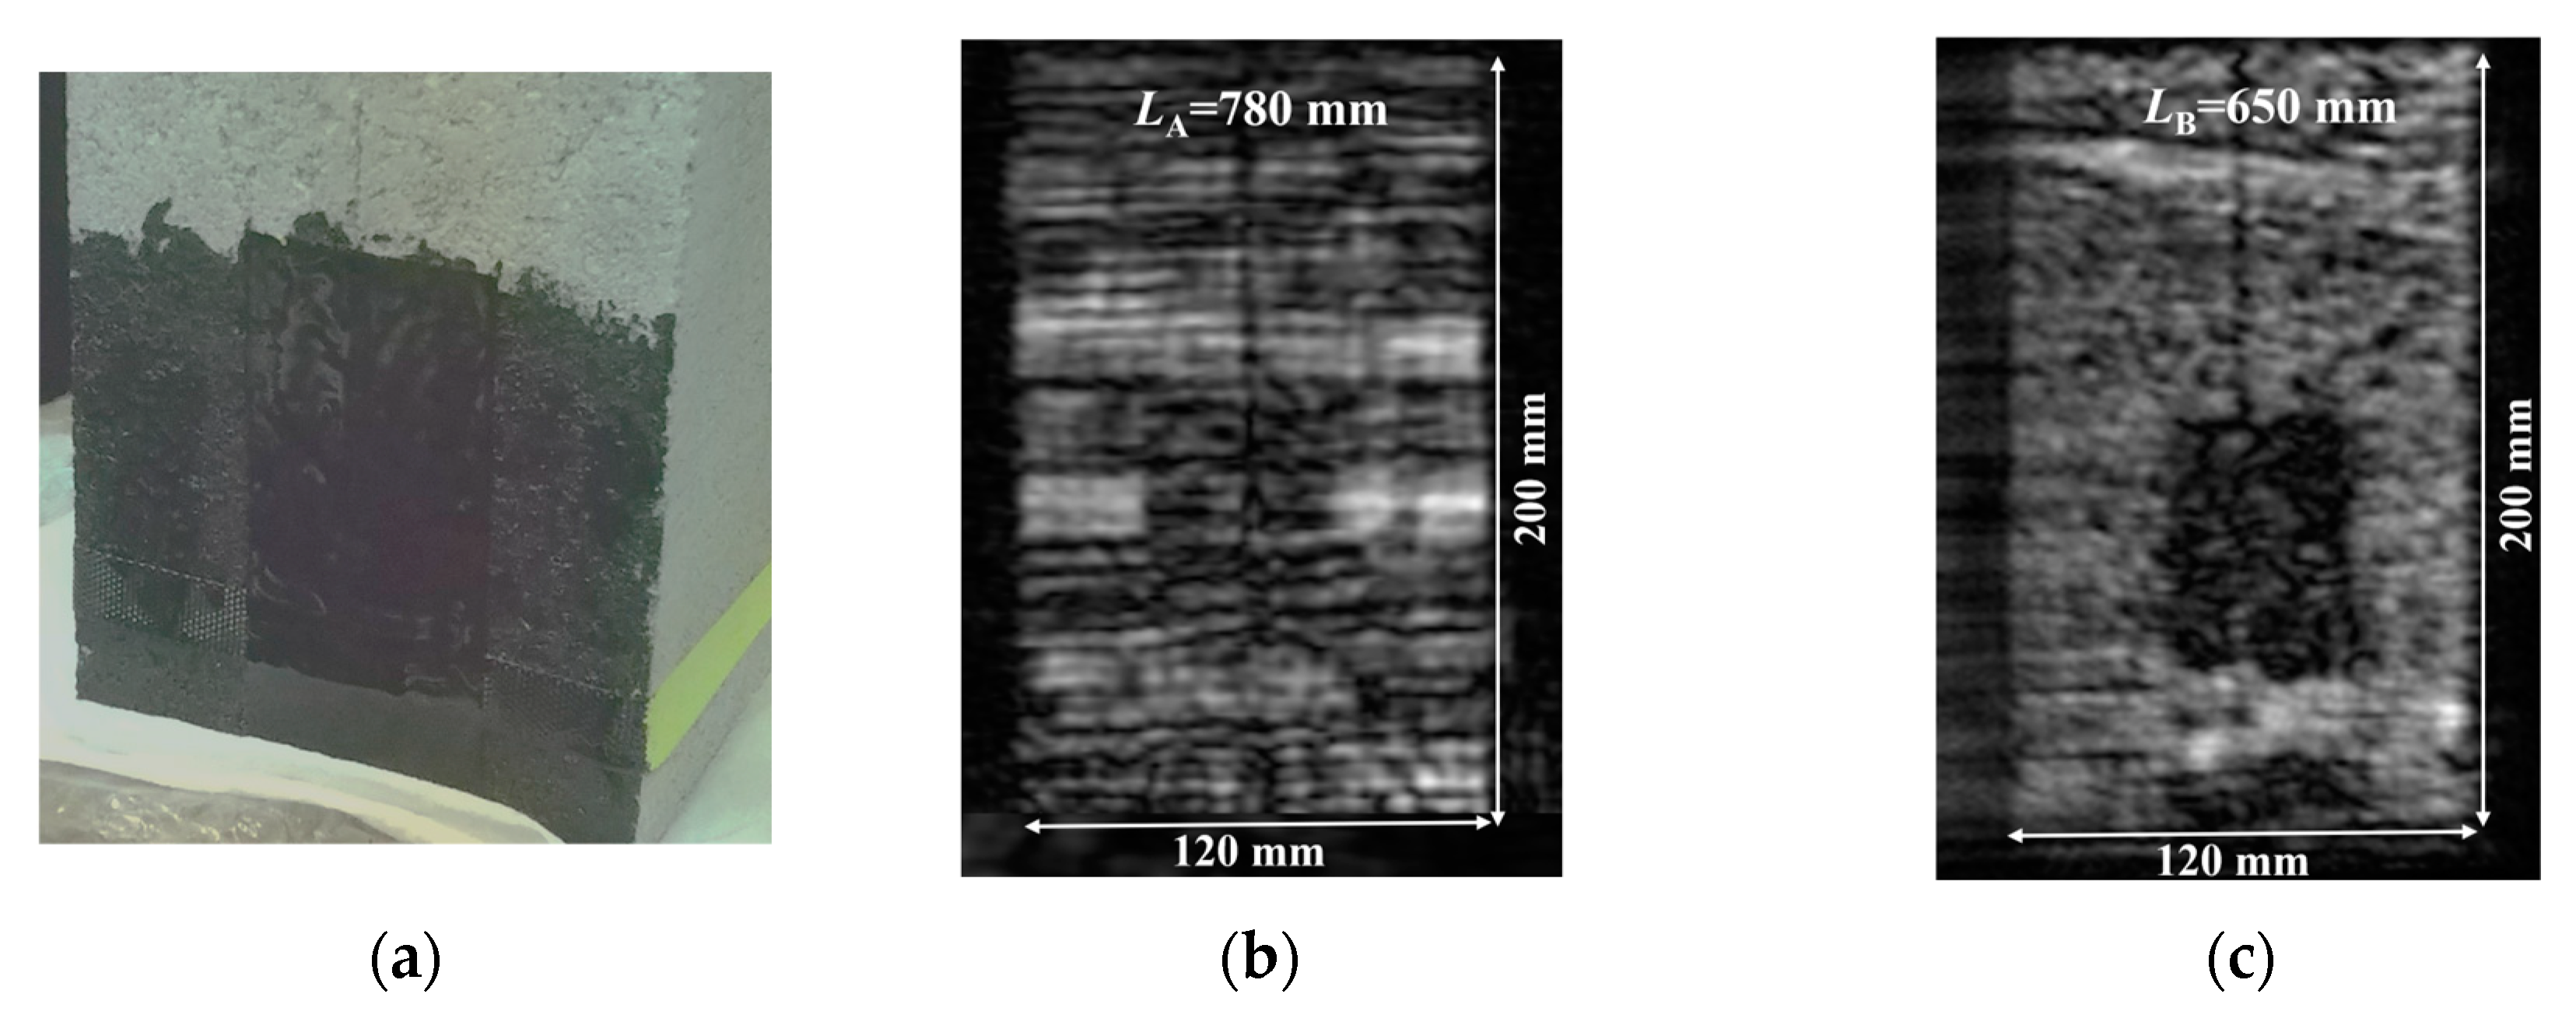
Based on the results of the preliminary experiments, the potential of the present imaging system for NDT inspection was investigated. First, a comparison study with system- B was conducted to detect the cracks between concrete blocks under fiber-reinforced tape and a coat of black acrylic paint. The results of this experiment are shown in
Figure 6. As shown in
Figure 6(a), two concrete blocks were firmly bonded together, and fiber-reinforced tape and a coat of black acrylic paint were applied over a portion of the cracks to hide the cracking areas.
Figure 6(b) shows the MM-wave image observed with system-A. It can be seen that the cracks are visible in the image below the taped areas. On the other hand,
Figure 6(c) shows the result with system-B. In this case, the coating paint itself is transparent, but the fiber-reinforced tape is not sufficiently transparent and the cracks in the underlying concrete are not visible.
The detection of cracks caused on the surface of concrete infrastructure facilities is one of the most important issues in NDT, and as shown in
Figure 6(b) and (c), we can observe the cracks on the exposed surface areas of concrete blocks. On the surface of the concrete blocks, which does not have a smooth surface like a copper plate, the incident MM-waves are scattered uniformly in all directions and reflected with a certain intensity (backscattering) in the direction of incidence. As a result, unlike objects with smooth surfaces, an overall dark image is observed. However, in the areas with cracks, since the incident MM-waves are scattered more strongly and irregularly, the intensity of the refracted waves returning in the direction of incidence would be much smaller, which would be reflected as darker lines in the MM-wave image.
On the other hand, in the area with fiber-reinforced tape and black acrylic paint on the surface, we could see cracks hidden under these coverings only with the present system-A with high sensitivity. Incidentally, the contrast of the raw photographic data was adjusted so that the viewer could see where the fiber-reinforced tape was applied in
Figure 6(a). From these two MM-wave images, there is almost no change in the received signal intensity for the black acrylic paint, but the signal intensities are weaker in the areas of the fiber-reinforced tape, confirming that absorption by this tape has occurred. Although the concrete surfaces of infrastructure facilities are generally protected by reinforcing sheets or paints in many cases, the highly sensitive MM-wave imaging system developed in this study proved to be sufficiently useful for NDT on such objects.
Another interesting result is that although the observation with system-A was made by placing the concrete blocks at a very close distance of
LA=780 mm from the radar module, no significant difference in the signal intensities appeared as shown in the MM-wave images of a copper plate. In particular, although a periodic dark and light stripe structure is observed approximately equal to the total length of the array of eight receiving antennas (8
Δ =26 mm), the signal is not extremely weak as shown in
Figure 3(b) and (c). This is because the surface of the concrete blocks is not perfectly smooth, and the incident waves scattered by the surface are uniformly scattered and detected by the receive antennas, which may indicate the superiority of MM-wave imaging in NDT inspection of materials with such a surface.
In this section, we have investigated the detection of surface cracks that may occur in common concrete structures such as tunnels and buildings. In the next section, we report the results obtained by observing the internal structure of a concrete slab using the constructed MM-wave imaging system and evaluating its transmission performance on a thin concrete plate.
5.2. Evaluation of Transmission Performance Using a Concrete Slab
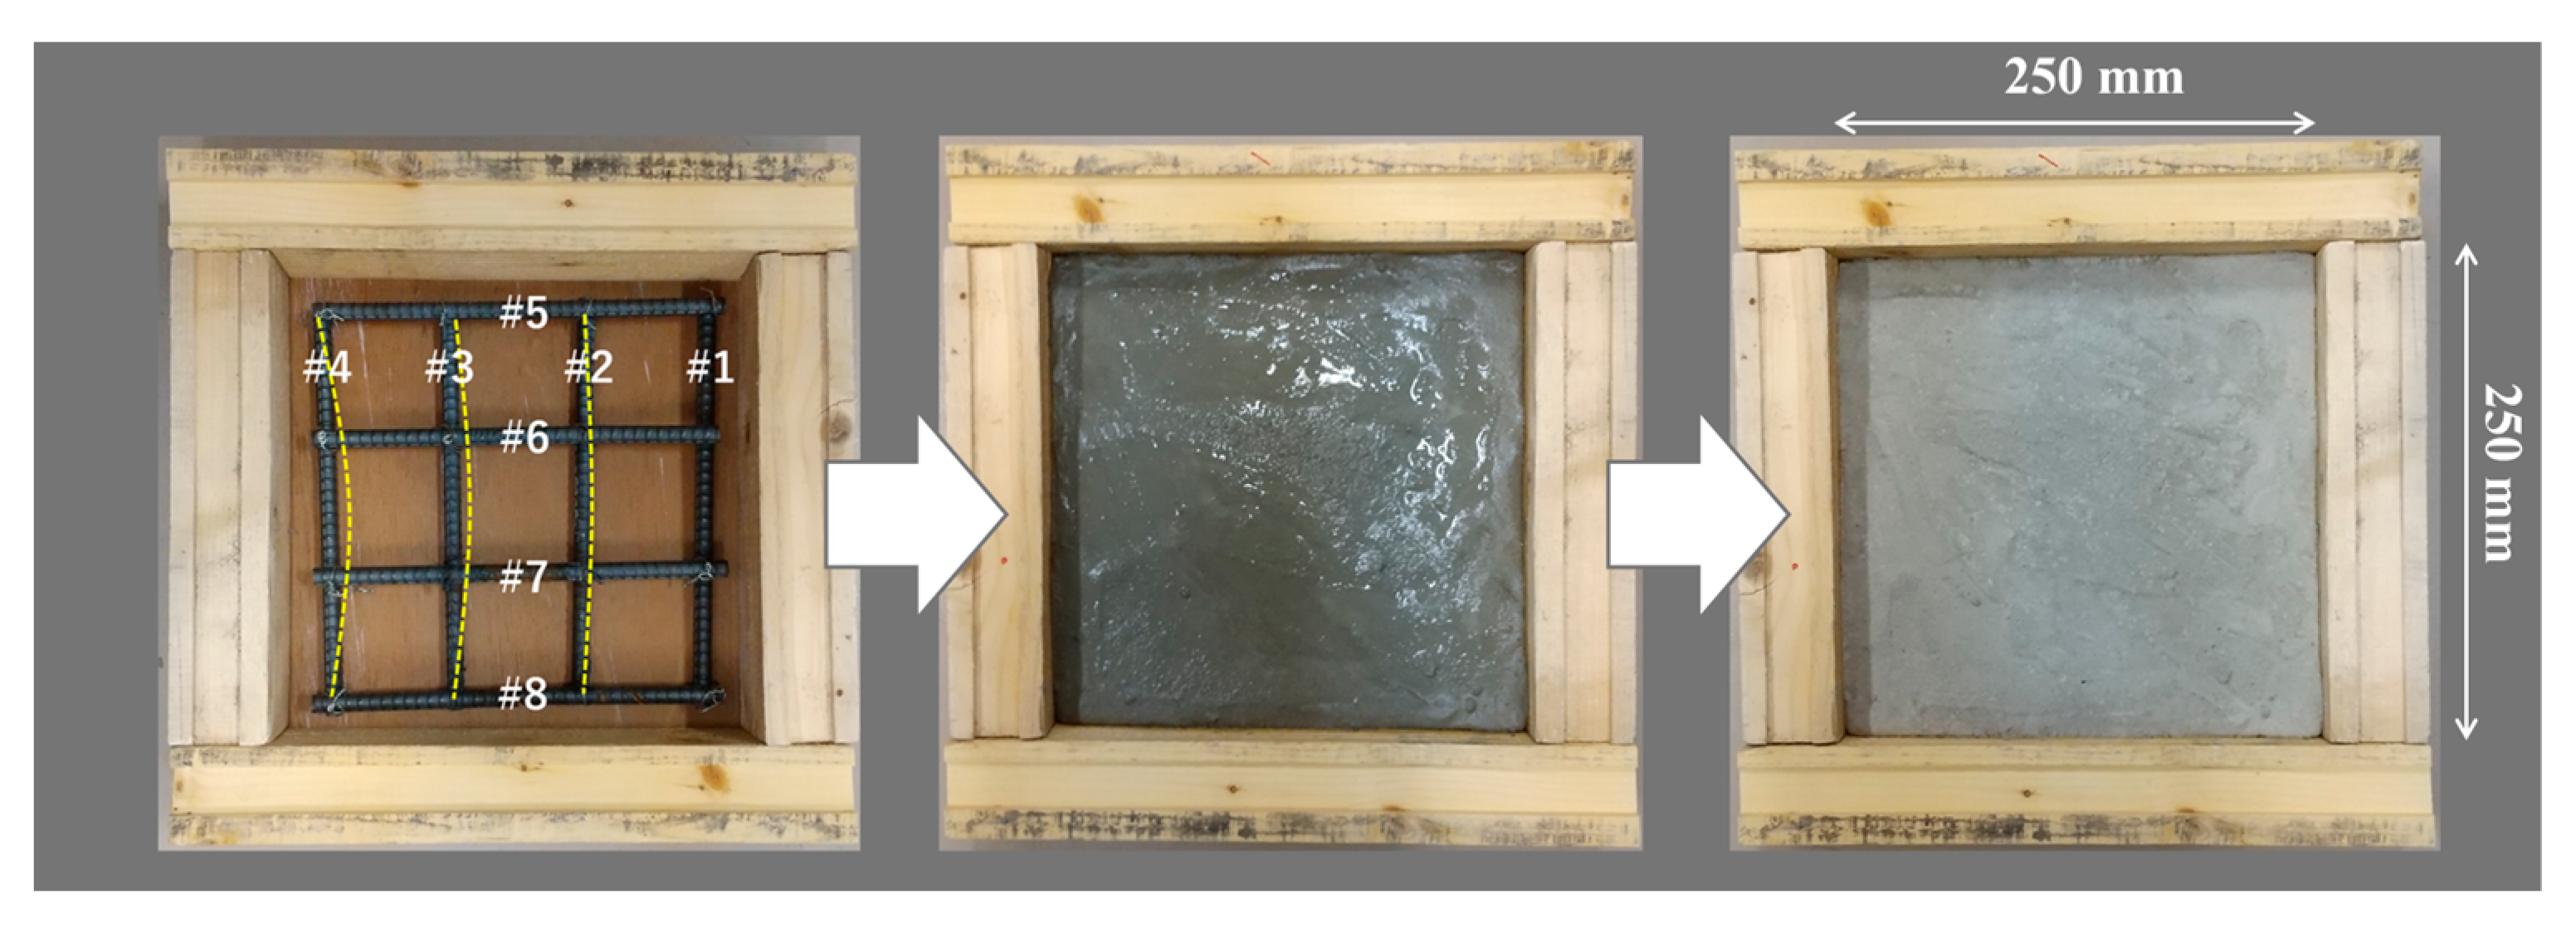
To evaluate the performance of MM-wave transmission to concrete, a reinforced concrete (RC) slab with a steel frame of D13 (ϕ12.7 mm) was prepared as shown in
Figure 7. It is difficult to see here, but steel frames #1 and #5~#8 are straight, and the other steel frames #2~#4 are bent near the center. The amount of bending increases from #2 to #4. The assembled steel frames were placed in wooden frames and poured with concrete, and this RC slab was removed and measured after the concrete had sufficiently dried and hardened.
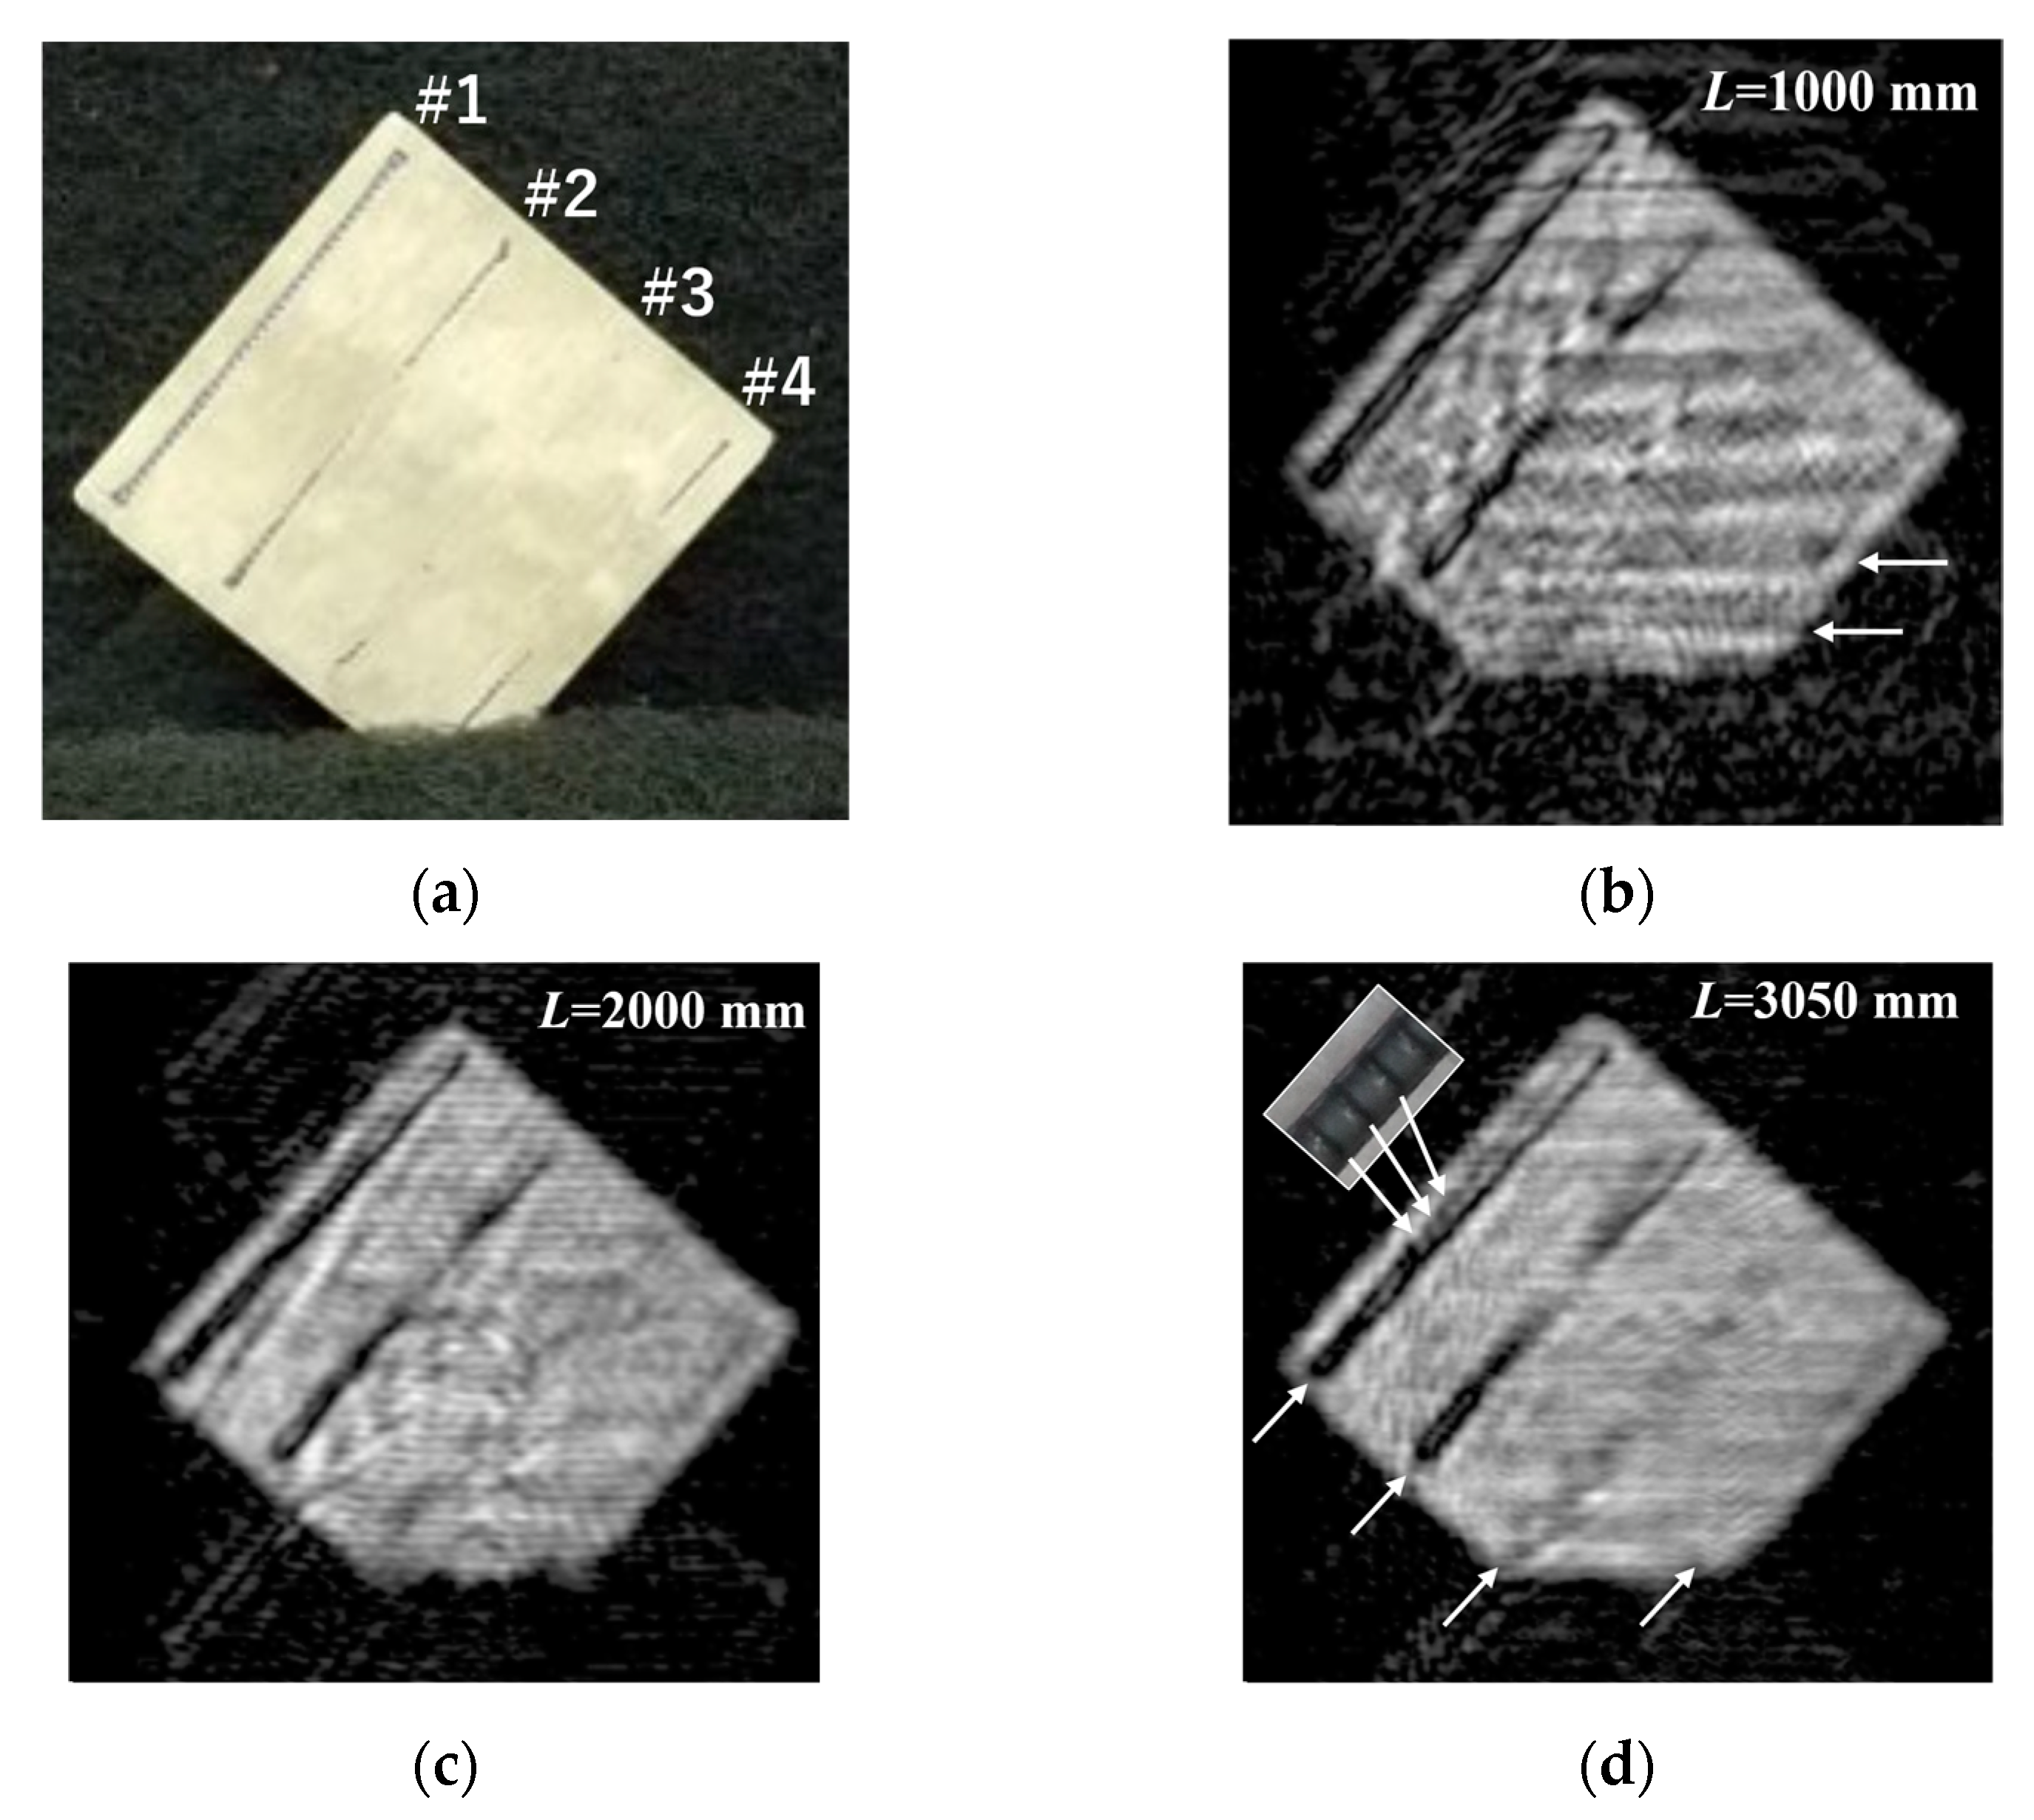
Figure 8 shows the photograph of the RC slab and its MM-wave images.
Figure 8(a) shows the surface of the measured RC slab. The measurements were made on the surface corresponding to the bottom of the RC slab in
Figure 7. It can be seen that the entire steel frame of #1 is visible, while the central regions of steel frames #2~#4 are partially buried under the concrete.
Figure 8(b), (c), and (d) show the MM-wave images observed at the distance of
L=1000 mm,
L=2000 mm, and
L=3050 mm, respectively. The horizontal stripe structure of light and dark observed at
L-1000 mm disappears as the distance
L increases from
L=1000 mm to
L=3050 mm. In addition, the steel frame of #3, which is moderately bent among the steel frames of #2~#4, becomes more visible in the MM-wave images with increasing distance. However, only the two ends are weakly imaged for the steel frame of #4, which has the largest bending even at the distance of
L=3050 mm. This is because the incident waves are attenuated inside the concrete, and the reflected wave from the inclined targets hardly returns to the receive antenna. In addition, we could not observe anything at all about steel frames #5~#8, which are mounted under steel frames #1~#4 and buried at least 13 mm under the concrete surface. This is discussed in the next section by estimating the attenuation distance
of MM-waves in concrete.
On the other hand, we can see more detailed structures of the steel frame of #1 in the MM-wave image, as shown in the inset photo of
Figure 8(d). The MM-wave image in
Figure 8(d) shows the most sensitive and clear image, reflecting the steel frames inside the concrete. Calculating the elevation angle
[
L3050,
d32] from Tx7 to the target in front of Rx8, it is about 0.6 degrees. This result indicates that the measurement was made using the central regions with the highest beam power. In general, non-destructive and non-contact inspection is highly desirable in any kind of inspection of infrastructure facilities and residential buildings, because such inspection can ensure the life safety of measurement technicians, especially when inspecting buildings after a major earthquake.
5.3. Estimation of Attenuation Distance of MM-Waves to Concrete26
To discuss the observed results on the RC slab, let us estimate the attenuation distance
of MM-waves to concrete materials by using basic electromagnetic formulas [
28]. The real part of the complex permittivity
in the MM-wave frequency range is reported to be
= 5 ~ 10 and
= 0.2 ~ 1 [
29,
30,
31,
32]. Therefore, if we calculate the complex refractive index
using the intermediate values
and
, we can estimate
and
. Using these values of
and
, we can estimate the reflectance
R of MM-waves under the condition of the air-concrete interface in the normal incidence of MM-waves. First, the reflectance
R is estimated to be about 22%. In addition, the absorption coefficient
(and attenuation distance
) in concrete is estimated to be
mm
-1 (and
mm) at 80 GHz. Here, the attenuation distance
mm explains well why the steel frames #5~#8 could not appear in the M-wave images at all.
Based on the estimated value of 5.4 mm, we prepared a concrete plate of about 3.7 mm thickness and attempted transmission measurements to demonstrate the actual transmission performance of MM-wave to a concrete plate.
5.4. Evaluation of Transmission Performance Using a Thin Concrete Plate
While all MM-wave images presented so far have been single reflection images of the target
, the SAR imaging technique using FMCW radar converts the obtained IF signal into a range FFT signal, so that a 2D cross-sectional image (2D slice image) can be obtained at any distance in front of the MM-wave radar module [
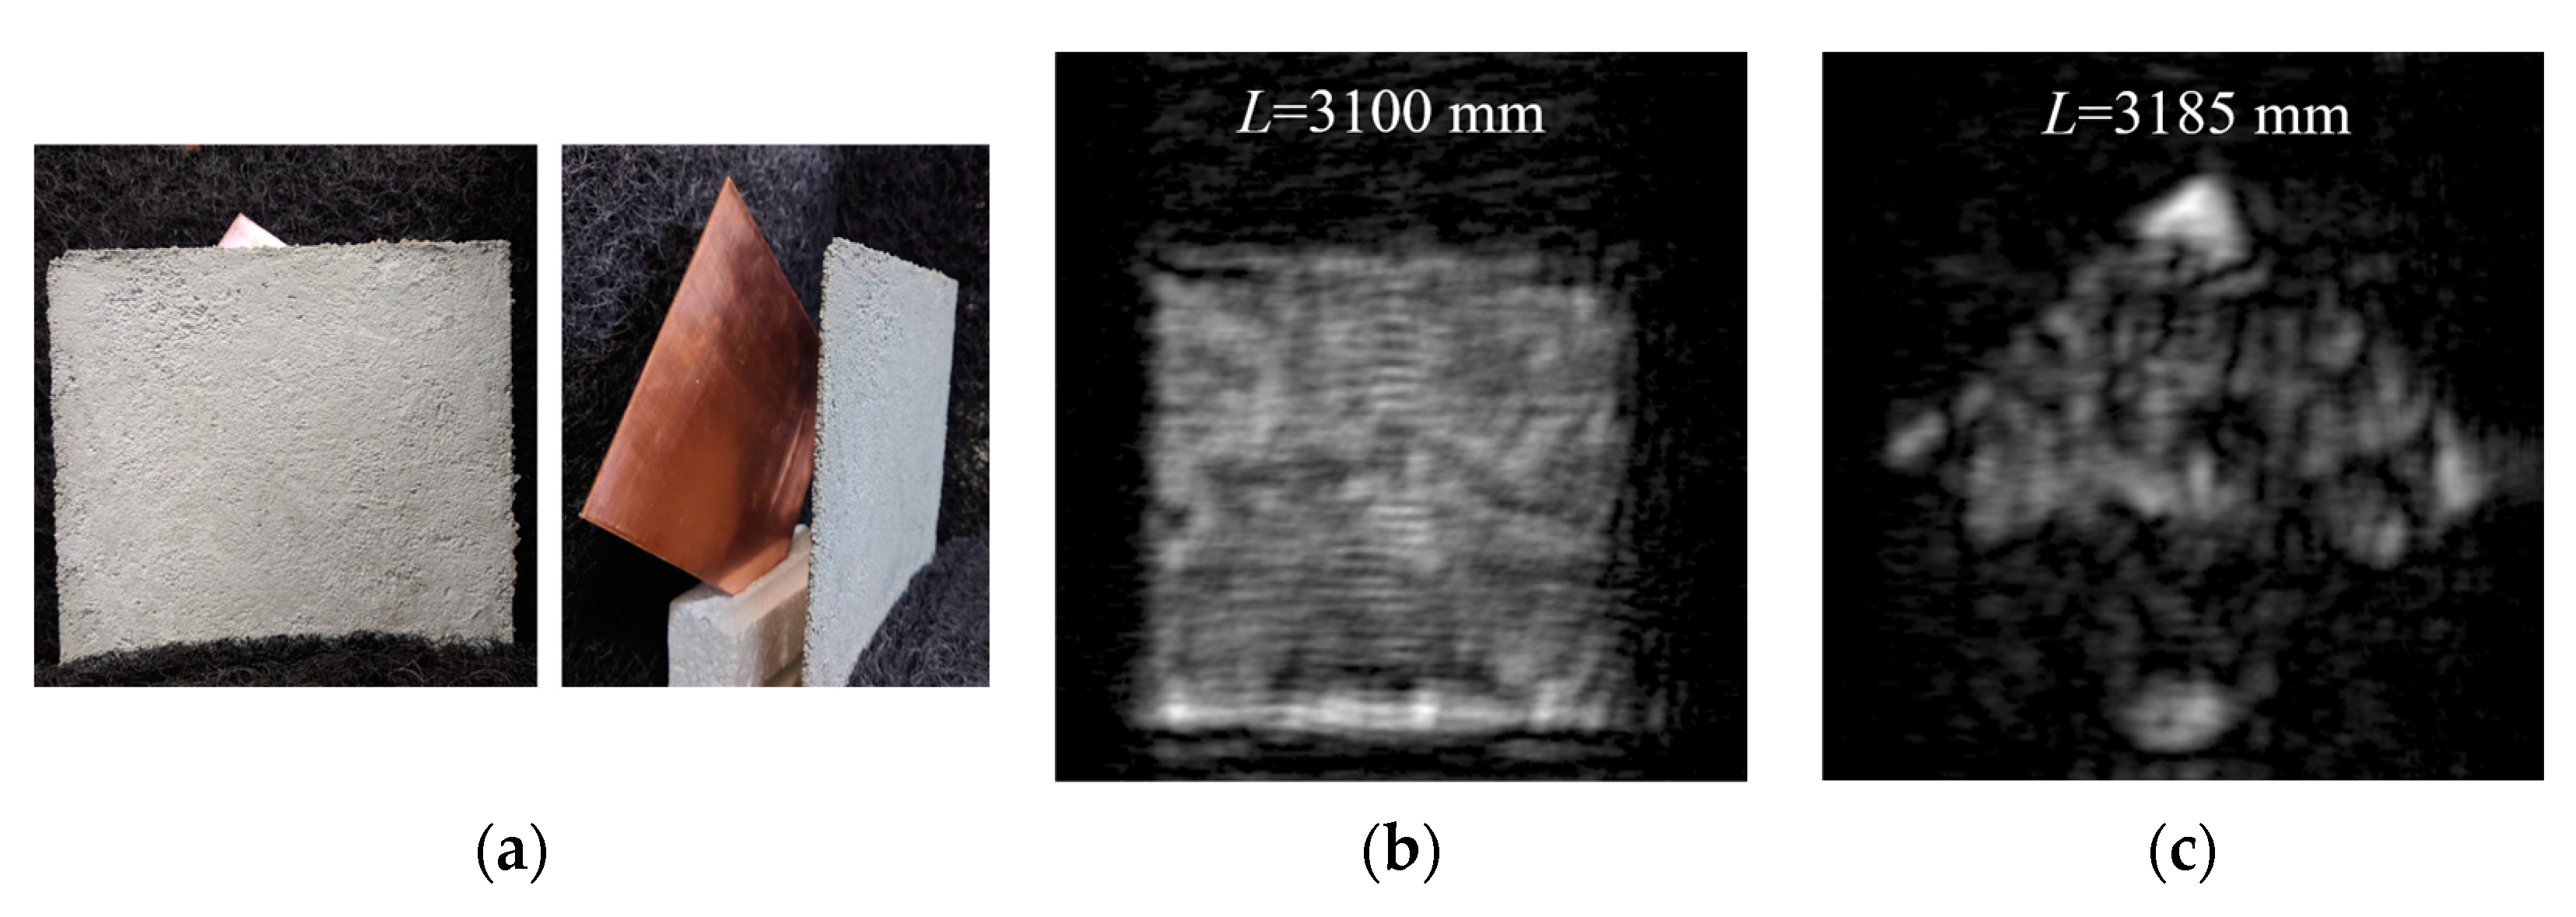
15]. Therefore, if there is some target of interest behind an object through which MM-waves can penetrate, the reflection image of the target can also be observed. Therefore, as shown in
Figure 9(a), a thin concrete plate with a thickness of 3.7 mm was prepared and placed at
L=3100 mm in front of the radar module, and a copper plate was placed at
L=3185 mm behind it, and the transmission performance of MM-waves through concrete was investigated by observing the reflection image of the copper plate.
Figure 9(b) shows the MM-wave image of the concrete surface at
L=3100 mm, and
Figure 9(c) shows the MM-wave image at
L=3185mm corresponding to the surface of the copper plate behind the concrete plate. As can be seen from
Figure 9(a), the uppermost part of the copper plate protrudes from the concrete plate and is exposed, so
Figure 9(c) shows that the signal intensity in this exposed area is considerably higher than in other areas. Therefore, the attenuation distance of the concrete was calculated by comparing the received signal intensity from the uppermost part of the copper plate and the hidden part behind the concrete in this experiment.
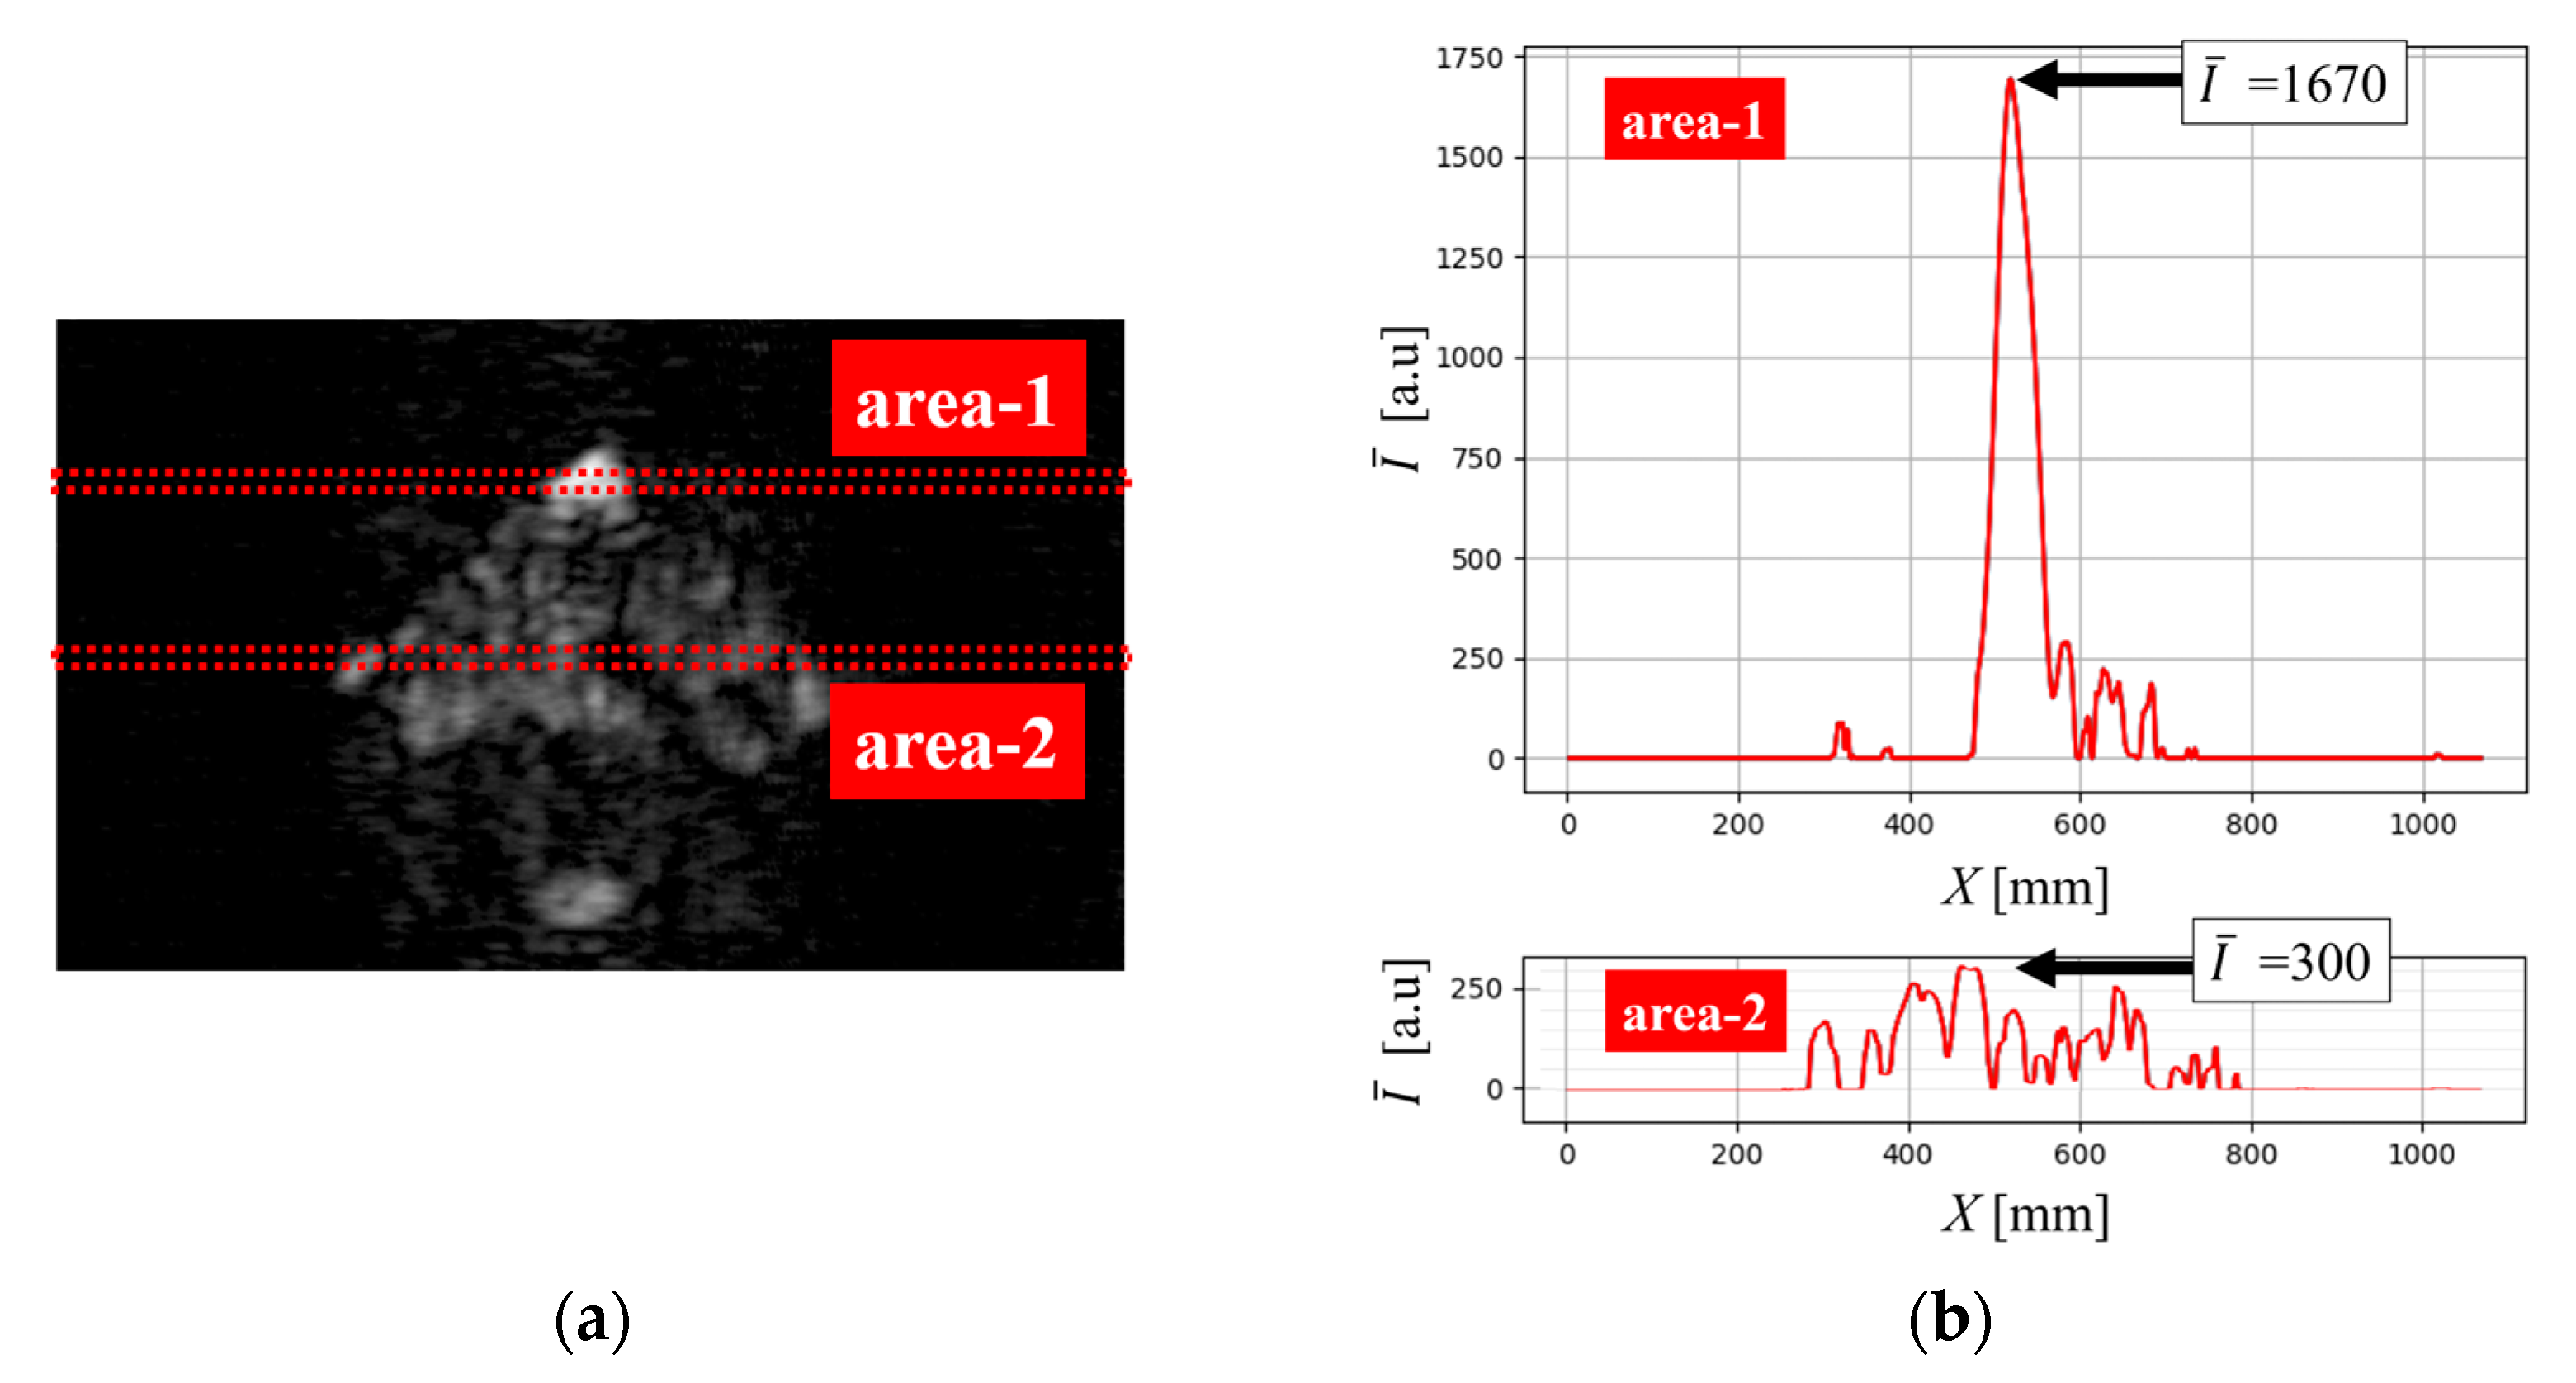
To compare the signal intensities from both parts, the averaged signal intensities along the
X-axis direction in area-1 and area-2 in
Figure 10(a) were used. The distribution of the averaged intensity
in area-1 and area-2 are shown in
Figure 10(b). The maximum averaged signal intensity in the area-1 (
) was about 1670. On the other hand, that in-area 2 (
) is about 300. We will use these values to determine the experimental attenuation distance
in the prepared concrete plate. In determining the attenuation distance
, let the reflectance
R of MM-waves on the concrete surface be 0.22 and the reflectance of MM-waves on the copper plate surface be
RCu. When the signal intensity transmitted from the Tx7 is
I0, the received signal intensity
reflected directly from the copper plate can be expressed as follows
It is assumed here that all returned signals are received. Using (9), the intensity
, which is the signal received after passing through the thin concrete plate twice, can be expressed as follows
Using (9) and (10),
can be obtained as follows
The result obtained by this experiment is almost the same as the estimated value of mm, which indicates the difficulty of investigating deeper internal structures from the concrete surface.
However, the distance L of the target was limited to a maximum of about 3200 mm due to space limitations in the laboratory. In addition, only 8 receive antennas were used to obtain better MM-wave images in the present study. Therefore, If we have a large laboratory space where we can observe at a distance of L=10 m, and if we use all antenna elements of the array for measurements, we can expect a significant improvement in SNR. This would also make it possible to obtain transmission images of thicker concrete.
5.5. Evaluation of Transmission Performance Using Residential Wall Materials
As an important NDT technology in Japan, which is an earthquake-prone country, several observations have been made on the transmission performance of MM-waves through composite plywood, refractory board, and ceramic tiles used for walls and other surfaces in residential houses.
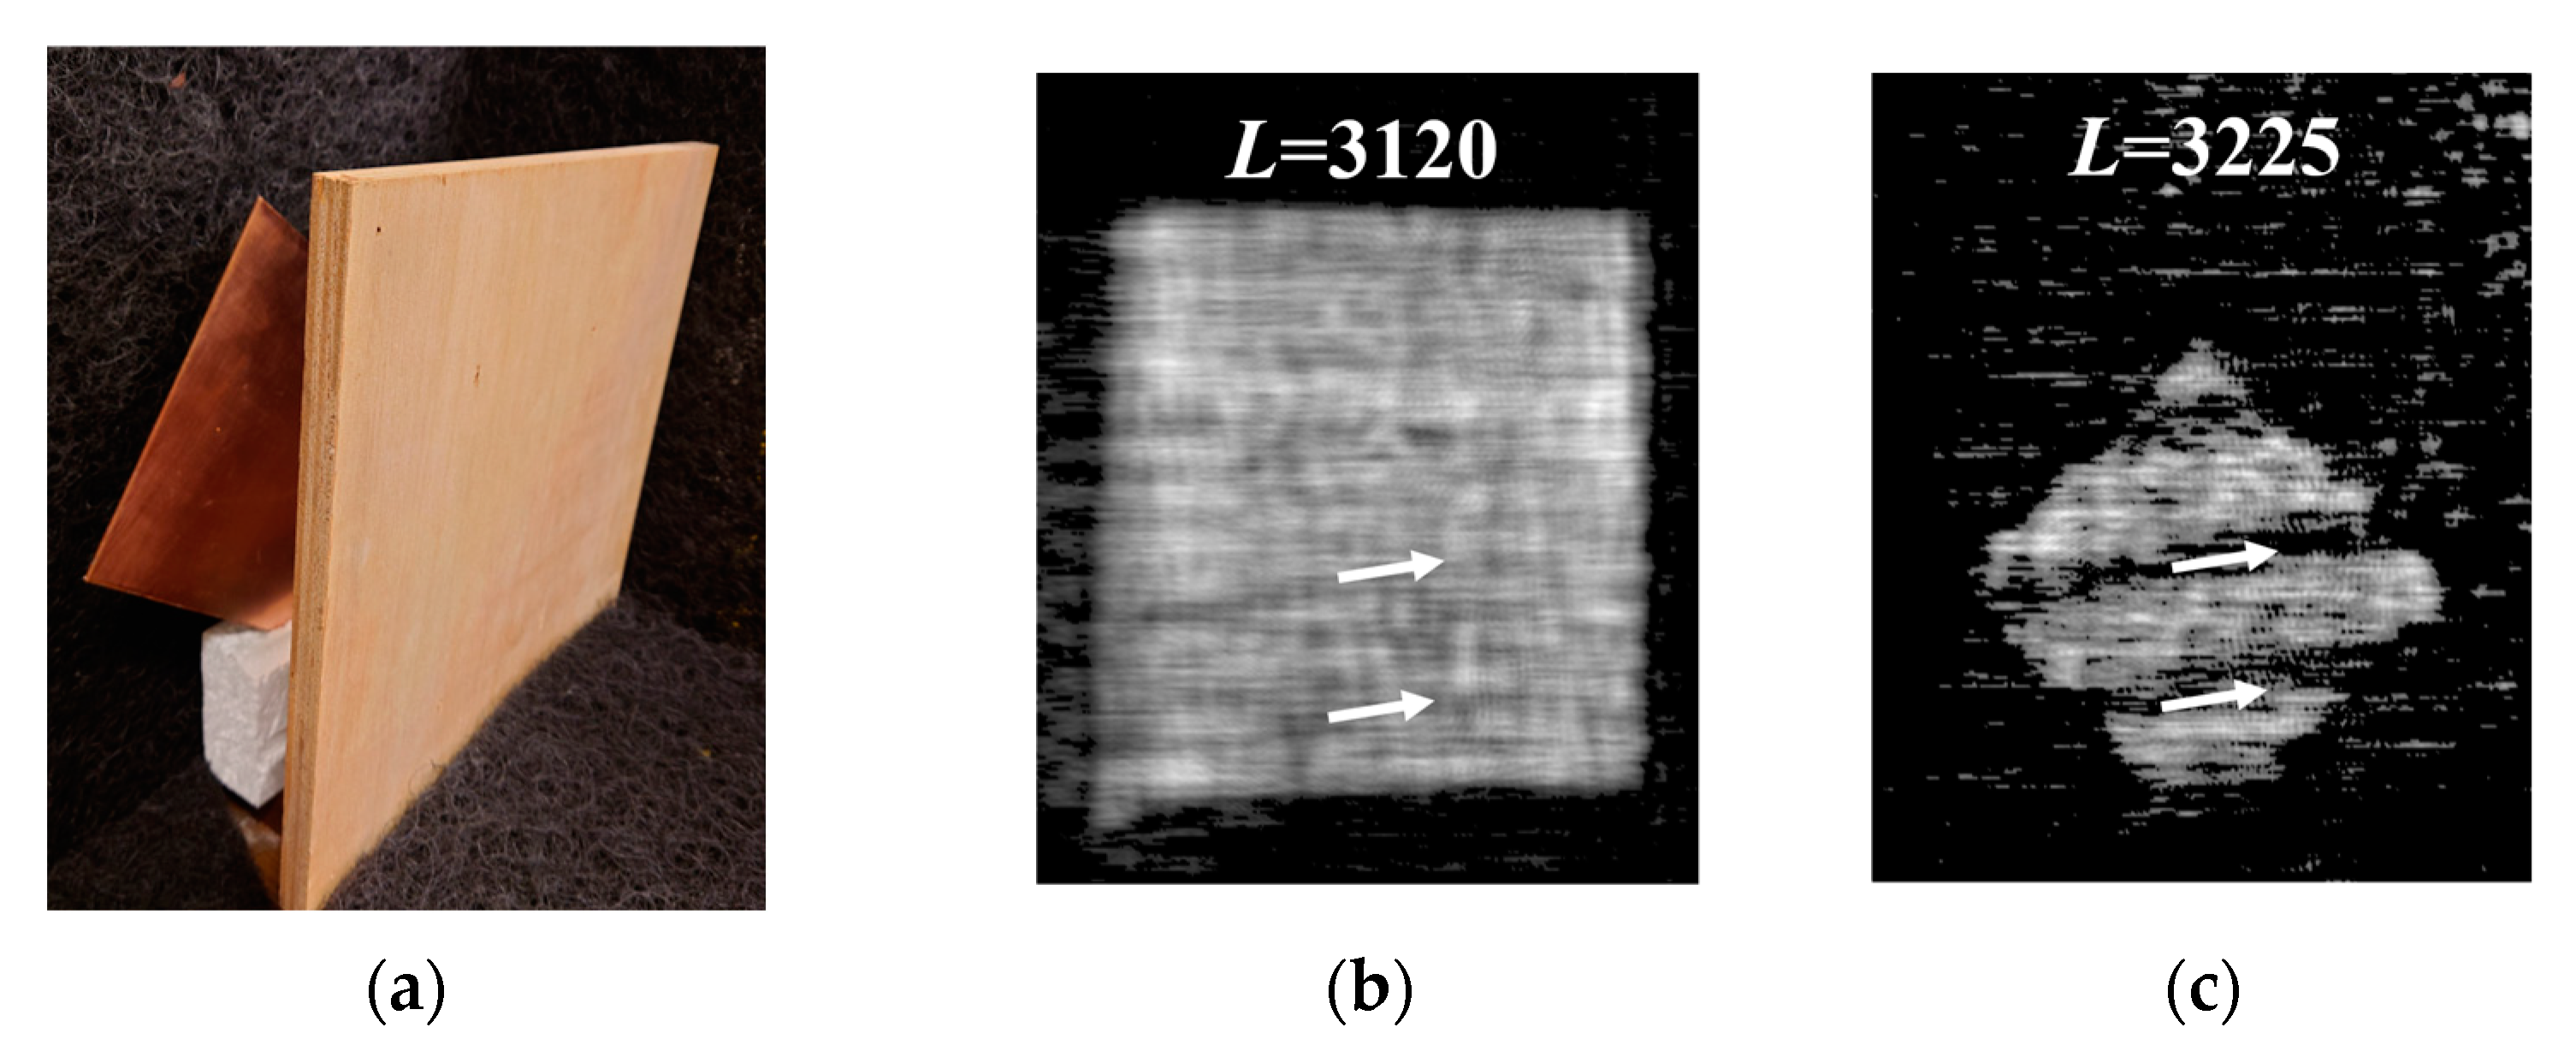
Figure 11(a) shows the arrangement of the composite plywood and the copper plate placed at
L=3110 mm and
L=3225 mm, respectively.
Figure 11(b) and (c) show the MM-wave images of the inside of the composite plywood at
L=3120 mm and the surface of the copper plate at
L=3225 mm, respectively. As can be seen from the MM-wave images, the composite plywood can transmit MM-waves with almost no power loss when the thickness is about 12 mm. On the other hand, the faint streaks along the inserted arrows in
Figure 11(b) become thicker and more distinct streaks in
Figure 11(c). Since there are no such streaks on both surfaces of the composite plywood, an inner sheet of the composite plywood may have some cracks or scratches. It is assumed that the scattering of MM-waves caused by these cracks or scratches inside the composite plywood dramatically reduces the amount of MM-wave radiation to the copper plate directly behind the cracks or scratches.
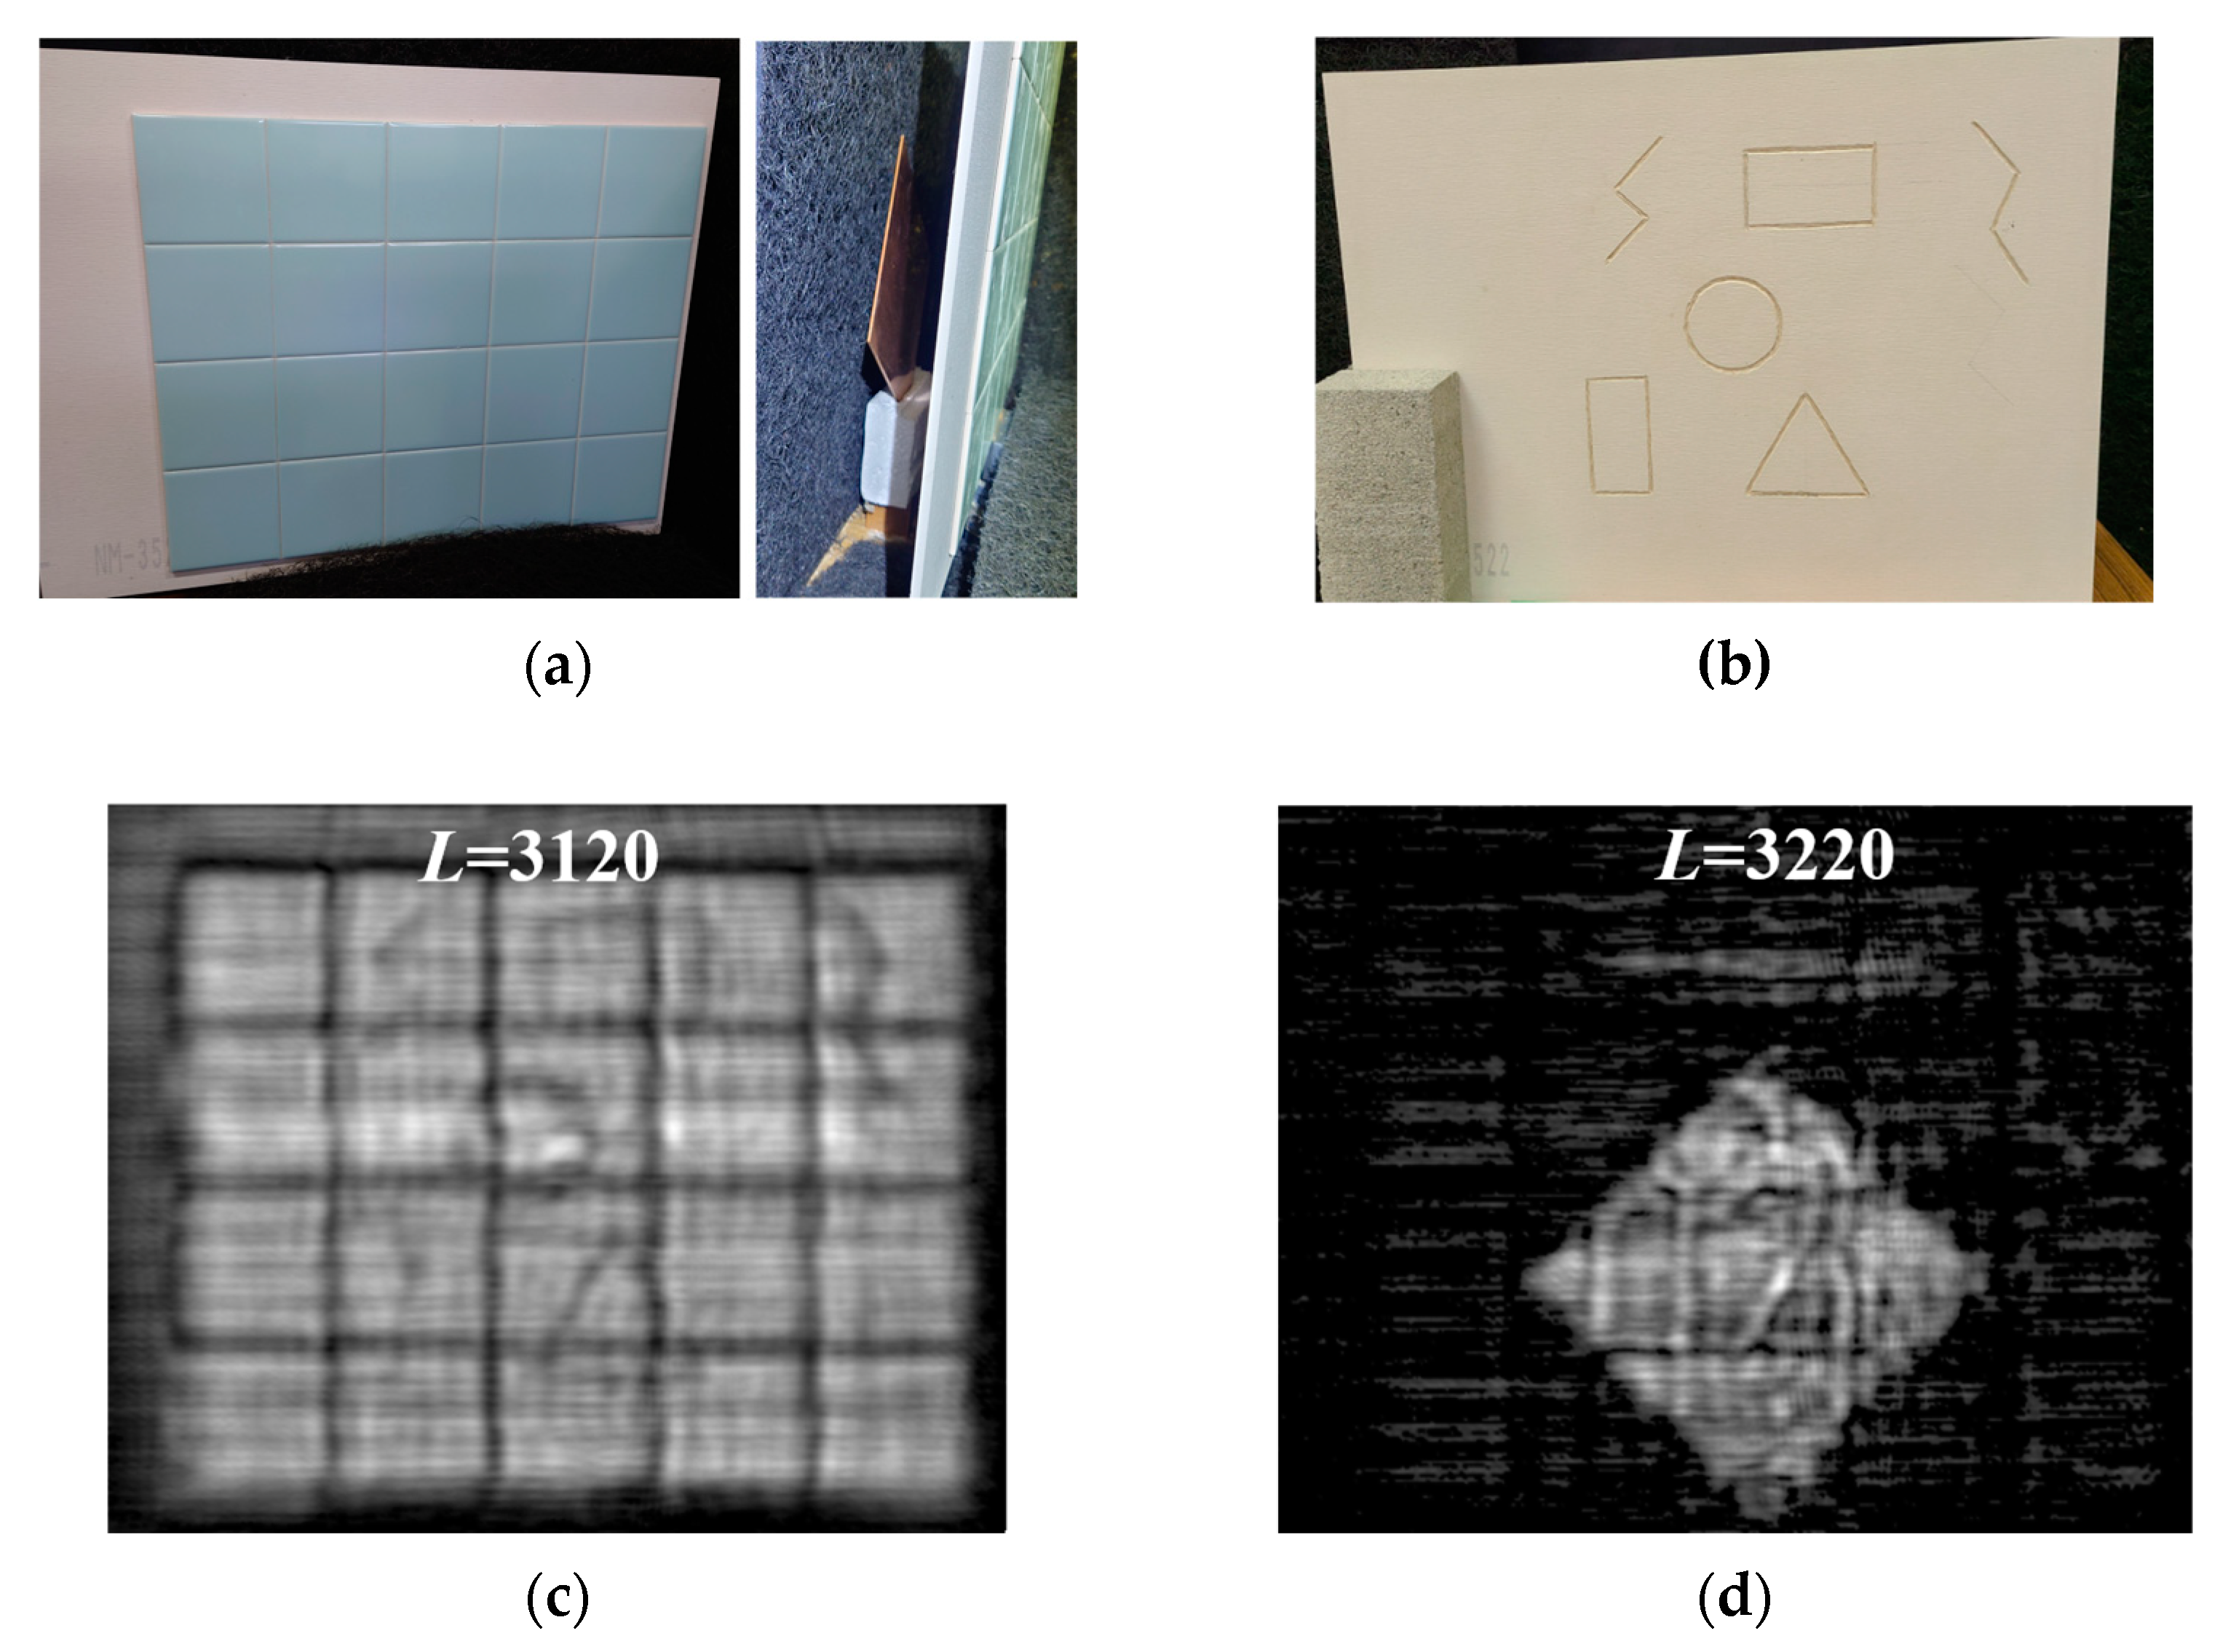
Finally, the MM-wave transmission properties of ceramic materials such as ceramic tiles and a refractory board were investigated.
Figure 12(a) and (b) show the photographs of 5 mm thick ceramic tiles bonded to the surface of a 5 mm thick refractory board with ceramic adhesives. The surface of the refractory board was engraved with various patterns for the transmission imaging.
Figure 12(c) shows the MM-wave image at the interface between the ceramic tiles and the refractory board. It can be seen that the patterns on the refractory board are observed by transmission MM-imaging through the ceramic tiles. In addition,
Figure 12(d) shows the MM-wave image of the copper plate placed at
L=3220 mm behind the ceramic tiles and refractory board. It can be seen that although the combined thickness of the ceramic tiles and refractory board is 10 mm, the reflective image of the copper plate is well observed, which also reflects the boundary lines between the tile boards and the pattern engraved on the refractory board.
Through these experiments, we were able to demonstrate that the high-sensitivity MM-wave imaging system we developed this time is very effective for NDT inspection of building materials such as residential houses.
6. Conclusions
In this study, we have developed an MM-wave SIMO-SAR imaging system incorporating a high-sensitivity MIMO radar module.
First, to evaluate the performance of the imaging system, the MM-wave reflection image of a copper plate was observed. As a result, a very high SNR value of 17 dB was obtained, reflecting the very low signal transmission loss between the array antenna elements and four cascaded chips in this high-sensitivity radar module.
Next, measurements were made on concrete materials to investigate the applicability to the actual NDT of infrastructure facilities. It was found that when the target distance L was increased from 1000 mm to 3050 mm on an RC slab, clearer images were obtained that also reflected the internal steel frame structure. However, it was not possible to observe the steel frame structure buried deeper from the concrete surface. Therefore, to obtain the attenuation distance in concrete, we prepared a thin concrete plate with a thickness of 3.7 mm and tried to observe the transmission images. As a result, we succeeded in experimentally obtaining the attenuation distance in the concrete of =6 mm.
Finally, transmission measurements were made on composite plywood, ceramic tiles, and a refractory board as construction materials used in residential houses. MM-wave transmission was good for these materials, and even copper plates placed behind these targets were visible. In addition, we have been able to detect areas of flaws that exist inside the material and cannot be seen visually.
Nondestructive testing during various disasters is best performed from a distance to protect the inspector. In this sense, the development of an imaging system that can make highly sensitive and accurate measurements from a distance is very important. In this study, we have successfully developed an MM-wave imaging system that meets these requirements.
Author Contributions
Conceptualization, H.M., H.K. and A.M.; methodology, H.M., H.K. and A.M.; software, A.M.; validation, H.M., H.K. and A.M.; investigation, H.M.; data curation, T.F., H.O. and H.M.; writing—original draft preparation, H.M.; writing—review and editing, H.K. and H.M.; visualization, T.F., H.O. and H.M.; supervision, H.M.; project administration, H.M. All authors have read and agreed to the published version of the manuscript.
Funding
This research received no external funding
Institutional Review Board Statement
Not applicable
Informed Consent Statement
Not applicable
Data Availability Statement
The dataset is available from the authors upon request
Acknowledgments
H.M. would like to thank Mr. Masato Suzuki for his assistance in solving technical problems encountered in integrating millimeter-wave radar into a 2-D scanner.
Conflicts of Interest
The authors declare no conflicts of interest.
References
- Donskoy, D.; Sutin, A.; Ekimov, A. Nonlinear acoustic interaction on contact interfaces and its use for nondestructive testing. NDT & E Int. 2001, 34, 231–238. [CrossRef]
- Glushkov, E.; Glushkova, N.; Ekhlakov, A.; Shapar, E. An analytically based computer model for surface measurements in ultrasonic crack detection. Wave Motion. 2006, 43, 458–473. [CrossRef]
- Foudazi, A.; Mirala, A.; Ghasr, M.-T.; Donnell, K.-M. Active microwave thermography for nondestructive evaluation of surface cracks in metal structures. IEEE Transactions on Instrum. Meas. 2019, 68, 576 – 585. [CrossRef]
- Yeh, C.-Y.; Zoughi, R. A novel microwave method for detection of long surface cracks in metals. IEEE Trans. Instrum. Meas. 1994, 43, 719–725. [CrossRef]
- Kharkovsky, S.; Hepburn, F.; Walker, J.; Zoughi, R. Non destructive testing of the space shuttle external tank foam insulation using near field and focused millimeter wave techniques. Mater. Eval. 2005, 63, 516–522.
- Broberg, P. Surface crack detection in welds using thermography. NDT & E Int. 2013, 57, 69–73. [CrossRef]
- Noethen, M.; Wolter, K.-J.; Meyendorf, N. Surface crack detection in ferritic and austenitic steel components using inductive heated thermography. Proc. 33rd IEEE Int. Spring Seminar Electron. Technol. (ISSE). 2010, pp. 249–254.
- An, Y.; Kim, J. M.; Sohn, H. Laser lock-in thermography for detection of surface-breaking fatigue cracks on uncoated steel structures. NDT & E Int. 2014, 65, 54–63. [CrossRef]
- Cheng, L.; Tian, G. Y. Surface crack detection for carbon fiber reinforced plastic (CFRP) materials using pulsed eddy current thermography. IEEE Sensors J. 2011, 11, 3261–3268. [CrossRef]
- Zheng, Y.; Wang, S.; Zhang, P.; Xu, T.; Zhu, J. Application of Nondestructive Testing Technology in Quality Evaluation of Plain Concrete and RC Structures in Bridge Engineering: A Review. Buildings. 2022, 12, 843. [CrossRef]
- Tian, G. Y.; Sophian, A.; Taylor, D.; Rudlin, J. Multiple sensors on pulsed eddy-current detection for 3-D subsurface crack assessment. IEEE Sensors J. 2005, 5, 90–96. [CrossRef]
- Yin, W.; Binns, R.; Dickinson, S. J.; Davis, C.; Peyton, A. J. Analysis of the liftoff effect of phase spectra for eddy current sensors, IEEE Trans. Instrum. Meas. 56(6), pp. 2775–2781, Dec. 2007. [CrossRef]
- Kharkovsky, S.; Case, J. T.; Abou-Khousa, M. A.; Zoughi, R.; Hepburn, F. L. Millimeter-wave detection of localized anomalies in the space shuttle external fuel tank insulating foam. IEEE Trans. Instrum. Meas. 2006, 55, 1250 – 1257. [CrossRef]
- Kharkovsky, S.; Ghasr, M. T.; Zoughi, R. Near-field millimeter-wave imaging of exposed and covered fatigue cracks, IEEE Trans. Instrum. Meas. 2009, 58, 2367–2370. [CrossRef]
- Wang, Y.; Su, J.; Fukuda, T.; Tonouchi, M.; Murakami, H. Precise 2D and 3D Fluoroscopic Imaging by Using an FMCW Millimeter-Wave Radar. IEEE Access. 2023, 11, 84027-84034. [CrossRef]
- Aoki, Y.; Tanaka, H.; Kamo, H.; Shimizu, T. Basic study of 79 GHz Band Resin Waffle-Iron Ridge Guide. IEEE MTT-S Intern. Microwave Symp (IMS 2023), San Diego, CA, USA, 11-16 June 2023; pp. 656-658.
- AWR2243 Single-Chip 76- to 81-GHz FMCW Transceiver. Available online: https://www.ti.com/lit/ds/symlink/awr2243.pdf?ts=1718069567602&ref_url=https%253A%252F%252Fwww.ti.com%252Fproduct%252FAWR2243 (accessed on 3 June 2024).
- IWR1443BOOST Evaluation Module mmWave Sensing Solution. Available online: https://www.ti.com/lit/ug/swru518d/swru518d.pdf?ts=1717443749726&ref_url=https%253A%252F%252Fwww.bing.com%252F (accessed on 3 June 2024).
- Moreira, A.; Prats-Iraola, P.; Younis, M.; Krieger, G.; Hajnsek, I.; Papathanassiou, K. P. A tutorial on synthetic aperture radar. IEEE Geosci. Remote Sens. Mag. 2013, 1, 6 – 43. [CrossRef]
- Lin, B.; Li, C.; Ji, Y.; Liu, X.; Fang, G. A millimeter-wave 3D imaging algorithm for MIMO synthetic aperture radar. Sensors. 2023, 23(13), 5979. [CrossRef]
- Wang, G.; Zhu, K.-H.; Wang, L.-N.; Liang, X.-D.; Chen, L.-Y. A Novel Orthogonal Waveform Separation Scheme for Airborne MIMO-SAR Systems. Sensors. 2018, 18(10), 3580. [CrossRef]
- Cruz, H.; Véstias, M.; Monteiro, J.; Neto, H.; Duarte, R. P. A Review of Synthetic-Aperture Radar Image Formation Algorithms and Implementations: A Computational Perspective. Remote Sens. 2022, 14(5), 1258. [CrossRef]
- Zhang, M.; Liao, G.; Xu, J.; He, X.; Liu, Q.; Lan, L.; Li, S. High-resolution and wide-swath SAR imaging with sub-band frequency diverse array. IEEE T. Aero. Elec. Sys. 2023, 59(1), 172-183. [CrossRef]
- Stove, A. G. Linear FMCW radar techniques. IEE Proceedings F (Radar and Signal Processing). 1992, 139, 343-350.
- Meta, A.; Hoogeboom, P.; Ligthart, L. P. Signal processing for FMCW SAR. IEEE Trans. Geosci. Remote Sens. 2007, 45, 3519–3532. [CrossRef]
- Basics of FMCW Radar. Available online: https://www.renesas.com/us/en/blogs/basics-fmcw-radar(accessed on 17 June 2024).
- Adamy, D. “EW 101: A First Course in Electronic Warfare,; Artech House: Boston/London, 2001.
- Jackson, J.D. Classical Electrodynamics, 3rd ed.; Wiley: New York/London/Sidney/Toronto, 1998.
- Wang, M.; Wang, Y; Li, W.; Ding, J.; Bian , C.; Wang, X.; Wang, C.; Li, C.; Zhong, Z.; Yu, J. Reflection Characteristics Measurements of Indoor Wireless Link in D-Band. Sensors. 2022, 22(18), 6908. [CrossRef]
- Jamil, M.; Hassan,M.K.; Al-Mattarneh, H.M.A.; Zain, M.F.M. Concrete dielectric properties investigation using microwave nondestructive techniques. Materials and Structures. 2013, 46, 77-87. [CrossRef]
- Cuinas, I.; Pugliese, J.P.; Hammoudeh, A.; Sanchez, M.G. Frequency dependence of dielectric constant of construction materials in microwave and millimeter-wave bands. Microw. Opt. Techn. Let. 2001, 30(2), 123-124.
- Costanzo, S.; Borgia, A.; Venneri, I.; Di Massa, G. Millimeter-waves structures on benzocyclobutene dielectric substrate. Radioengineering. 2011, 20(4), 785-789.
Figure 1.
A 2-dimensional orthogonal arrangement of antenna elements of the array prepared for the present study. In the present experiments, only the seventh transmit antenna (Tx7) was used. Where λ= 3.80 mm.
Figure 1.
A 2-dimensional orthogonal arrangement of antenna elements of the array prepared for the present study. In the present experiments, only the seventh transmit antenna (Tx7) was used. Where λ= 3.80 mm.
Figure 2.
X-Y scanning method for antenna elements of the array. (a) Diagram of X-Y scanning using all Rx antennas from Rx1 to Rx16. (b) Diagram of X-Y scanning using eight Rx antennas from Rx1 to Rx8. Here, Δ=0.86λ is the distance between adjacent receive antennas.
Figure 2.
X-Y scanning method for antenna elements of the array. (a) Diagram of X-Y scanning using all Rx antennas from Rx1 to Rx16. (b) Diagram of X-Y scanning using eight Rx antennas from Rx1 to Rx8. Here, Δ=0.86λ is the distance between adjacent receive antennas.
Figure 3.
Influences of the distance L to the target and the number of receive antennas (Rx) used in the MM-wave image observations. (a) The 200 mm200 mm flat copper plate for the measurements. (b) Condition of L=720 mm with all receive antennas from Rx1 to Rx16. The left and the right figures show the observed MM-wave image and the distribution along the Y-axis of the averaged signal intensity within the red dotted rectangle inserted in the MM-wave image, respectively. (c) Result in the condition of L=1850 mm with all receive antennas from Rx1 to Rx16. (d) Result in the condition of L=1850 mm with 8 receive antennas from Rx1 to Rx8.
Figure 4.
Estimation of MM-wave irradiation power on a target at a distance of L = 720 mm from the Tx antenna to the target.4.1. Optimization of MM-wave imaging measurements.
Figure 4.
Estimation of MM-wave irradiation power on a target at a distance of L = 720 mm from the Tx antenna to the target.4.1. Optimization of MM-wave imaging measurements.
Figure 5.
Comparison of SNR in the MM-wave images observed by (a) present SIMO-SAR imaging system (system-A) at LA=1810 mm and (b) previously constructed MIMO-SAR system using an IWR1443BOOST EVM (system-B) at LB=680 mm. Where the top figures show the MM-wave images, while the bottom figures show the profiles of the averaged signal intensity along the X-axis direction in the area indicated by the red dashed rectangle inserted in the MM-wave image.
Figure 6.
Comparison of MM-wave images of concrete blocks with fiber-reinforced tape and black acrylic paint over the cracks. (a) Strongly bonded concrete blocks for the observations. The contrast of the raw image is adjusted to show the position of the fiber-reinforced tape under black acrylic paint. (b) MM-wave image observed at the target distance of LA=780 mm by using system-A. (c) MM-wave image observed at the target distance of LB=650 mm by using system-B.
Figure 7.
Reinforced concrete slab to investigate MM-wave transmission characteristics into concrete.
Figure 7.
Reinforced concrete slab to investigate MM-wave transmission characteristics into concrete.
Figure 8.
(a) Photograph of the prepared 33.4 mm thick concrete slab for MM-wave imaging. This surface was used for the measurement. (b) MM-wave image observed with the slab placed at a relatively short distance of L=1000mm. Below are MM-wave images observed at (c) L=2000mm and (d) L=3050mm.
Figure 8.
(a) Photograph of the prepared 33.4 mm thick concrete slab for MM-wave imaging. This surface was used for the measurement. (b) MM-wave image observed with the slab placed at a relatively short distance of L=1000mm. Below are MM-wave images observed at (c) L=2000mm and (d) L=3050mm.
Figure 9.
(a) Photographs of the thin concrete plate of 3.7 mm thickness placed at L=3100 mm and the copper plate placed at L=3185 mm behind it. (b) MM-wave image at position L=3100mm on the concrete surface and (c) MM-wave image at position L=3185 mm on the copper plate surface.
Figure 9.
(a) Photographs of the thin concrete plate of 3.7 mm thickness placed at L=3100 mm and the copper plate placed at L=3185 mm behind it. (b) MM-wave image at position L=3100mm on the concrete surface and (c) MM-wave image at position L=3185 mm on the copper plate surface.
Figure 10.
(a) area-1 and area-2 for comparing averaged signal intensity in the MM-wave image. (b) Distribution of the averaged intensity along the X-axis in area-1 and area-2.
Figure 10.
(a) area-1 and area-2 for comparing averaged signal intensity in the MM-wave image. (b) Distribution of the averaged intensity along the X-axis in area-1 and area-2.
Figure 11.
(a) A photograph of the composite plywood of 11.85 mm thickness placed at L=3110 mm and the copper plate placed at L=3225 mm behind it. (b) MM-wave image at position L=3120mm inside the composite plywood and (c) MM-wave image at position L=3225 mm on the copper plate surface.
Figure 11.
(a) A photograph of the composite plywood of 11.85 mm thickness placed at L=3110 mm and the copper plate placed at L=3225 mm behind it. (b) MM-wave image at position L=3120mm inside the composite plywood and (c) MM-wave image at position L=3225 mm on the copper plate surface.
Figure 12.
(a) Photograph of ceramic tiles and a refractory board attached with ceramic adhesives placed at L=3115 mm and a copper plate placed at L=3220 mm behind them for MM-wave transmission imaging. (b) Photograph of the pattern engraved on the surface of the refractory board bonded to the ceramic tile. (c) MM-wave image at the interface between ceramic tile and refractory board. The pattern engraved on the surface of the refractory board can be seen. (d) MM-wave image at L=3220 mm on the copper plate surface.
Table 1.
Element statistics of the MM-wave radar in the present study.
Table 1.
Element statistics of the MM-wave radar in the present study.
| Element interval |
Tx: 3.80 mm (1.00λ)
Rx: 3.25 mm (0.86λ) |
| Tx(X,Y), Rx(X,Y) |
Tx: 12 elements (in X-direction)
Rx: 16 elements (in Y-direction) |
| Tx-element typical gain: GTx
|
13.5 dB |
| Tx-directivity |
Beam width 26 deg |
Side lobe <25 dB |
| Rx-element typical gain |
14.5 dB |
| Rx-directivity: GRx
|
Beam width 22 deg |
Side lobe <20 dB |
| Frequency (GHz) |
76.5 GHz, 77 GHz~81 GHz |
| Antenna unit size (Element + Feed line) |
73.6 mm×19.4 mm |
|
Disclaimer/Publisher’s Note: The statements, opinions and data contained in all publications are solely those of the individual author(s) and contributor(s) and not of MDPI and/or the editor(s). MDPI and/or the editor(s) disclaim responsibility for any injury to people or property resulting from any ideas, methods, instructions or products referred to in the content. |
© 2024 by the authors. Licensee MDPI, Basel, Switzerland. This article is an open access article distributed under the terms and conditions of the Creative Commons Attribution (CC BY) license (http://creativecommons.org/licenses/by/4.0/).
