Preprint
Article

Advanced Scale-Propeller Design Using a MATLAB Optimization Code

Altmetrics

Downloads

132

Views

86

Comments

0

A peer-reviewed article of this preprint also exists.

This version is not peer-reviewed

Submitted:

18 June 2024

Posted:

20 June 2024

You are already at the latest version

Alerts
Abstract
This study investigated the efficiency of scale-propellers, typically used on small drones. A scale-propeller is accepted as having a diameter of 7 to 21 inches. The Ukraine War has demonstrated the utility of relatively small, low-cost first-person view (FPV) drones, which are attritable. This investigation outlines the development of a MATLAB optimisation code, based on minimum induced loss propeller theory, which calculates the optimal chord and twist distribution for a chosen propeller operating in known flight conditions. The MATLAB code includes a minimum Reynolds number functionality, which provides the option to alter the chord distribution to ensure the entire propeller is operating above a set threshold value of Reynolds (>100,000), as this has been found to be a transition point between low and high section lift-to-drag ratios. Additional functions allow plotting of torque and thrust distributions along the blade. The results have been validated on experimental data taken from an APC ‘Thin Electric’ 10” x 7” propeller, where it was found that both the chord and twist distributions were accurately modelled. The MATLAB code resulted in a 16% increase in the maximum propulsive efficiency. Further work will investigate a direct interface to SolidWorks to aid rapid propeller manufacturing capability.
Keywords: 
Subject: Engineering  -   Aerospace Engineering

1. Introduction

1.1. Rationale

A propeller is a propulsion device that exerts a force on a large mass of air. The earliest versions of the propeller have been around for centuries, with Archimedes developing a rotating screw system, which could be used to draw water from deep wells. Since their first use in the 19th century, hydrodynamic propellers have been the propulsion system of choice for countless marine vehicles. However, it wasn’t until the 20th century when the Wright brothers used the first aerodynamic propeller as the propulsion system for their historic aircraft, the Wright Flyer. The Wright brothers were forced to develop their own propeller design method, due to the lack of existing aerodynamic propeller theory available to them. The method they used is now known as blade element theory, and it is still used to design propellers today. In simple terms, blade element theory assumes that the airflow over each section of a propeller blade is two-dimensional. Whilst in reality there will be aerodynamic interference between blade sections, it is assumed to be negligible. After several design iterations, the Wright brothers achieved a maximum propulsive efficiency of 78% by 1910. In comparison, modern large-scale propellers can now achieve maximum efficiencies of up to 90% [1].
However, this very high efficiency figure is infeasible for small scale propellers, such as those used on small FPV drones. Data analysis of the UIUC Propeller Database 1 & 4, by the authors, as shown in Figure 1, has shown that efficiencies of these small propellers (7-21” diameter) is typically between 45-75% [2], with a lot of variability between manufacturers, even with the same diameter and pitch. The reasons for this efficiency loss will be discussed in detail later in this paper, but relate to low Reynolds numbers, choice of airfoil and physical geometry. Research into this topic is limited to a few studies [2,3,4], meaning that there is ample scope for development in this important area of research.

1.2. Aim of the Study

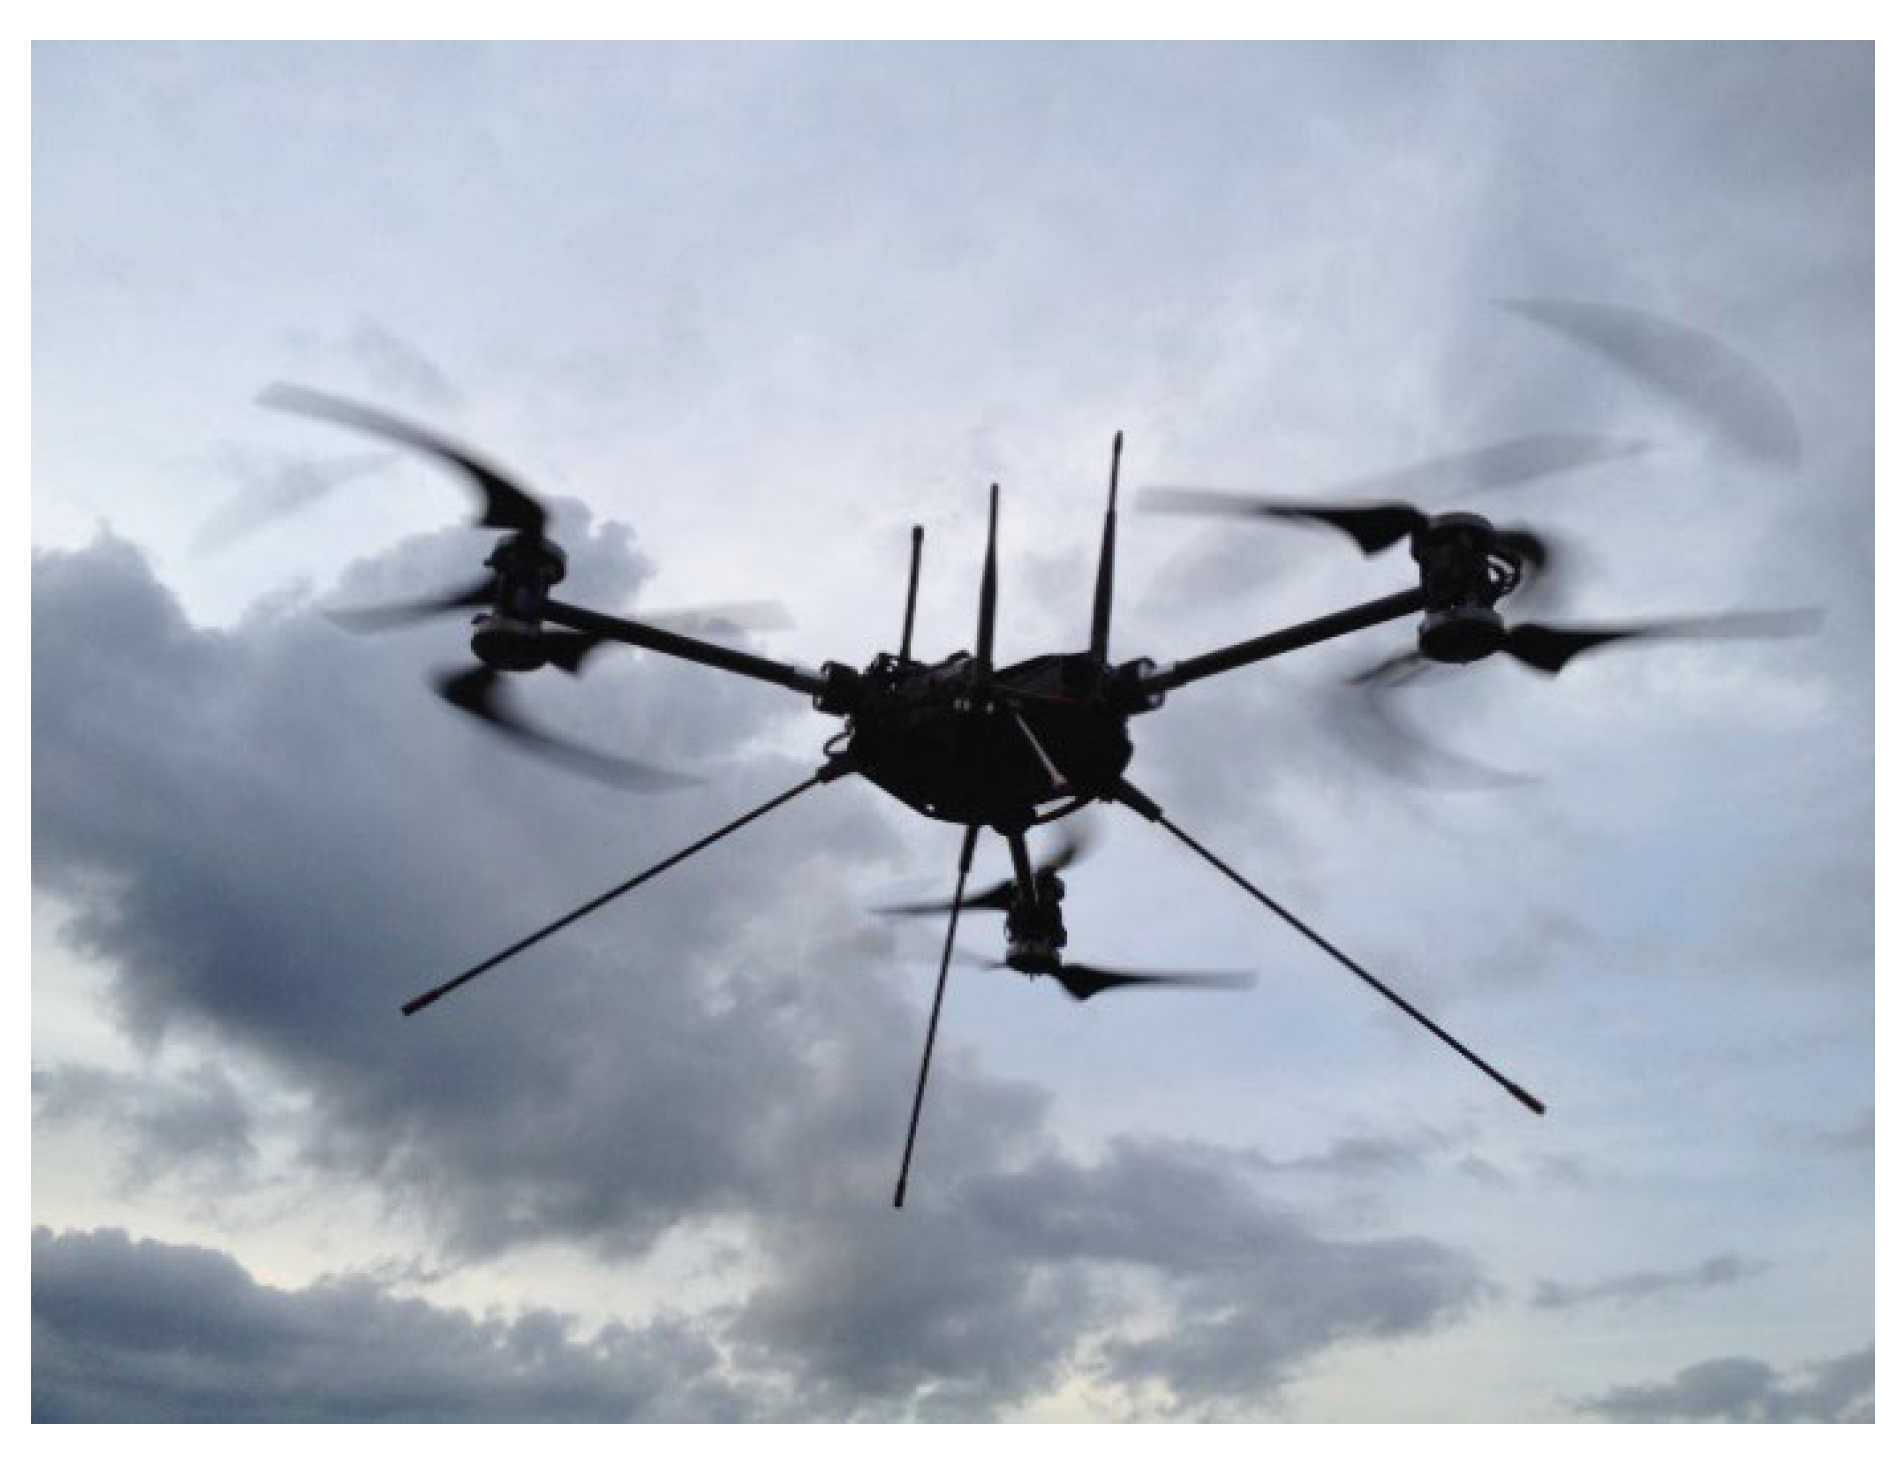
The main aim of this work is to analyse the efficiency of scale propellers as used on small drones (see Figure 2) and to develop a MATLAB program which can accurately and easily optimise propeller geometry at operating conditions specified by the end user to improve efficiency and thereby increase endurance.

1.3. Background

High propulsive efficiencies can be achieved on propellers used on full-scale crewed aircraft, such as the C-130J Super Hercules, and there are two main reasons why this is the case. Firstly, the propellers tend to have complex variable pitch mechanisms, which allow the propeller to operate at peak efficiency under different flight conditions. Such mechanisms are costly, complex and too heavy to include within small propellers for attritable uncrewed aircraft. Variable pitch mechanisms are also required to control helicopter rotors, which is why these rotors tend to have a constant angle of twist along the blade.
Secondly, full-scale aircraft propellers tend to have large diameters, which leads to greater chord lengths. As will be explained later in this study, large diameter propellers operate in higher Reynolds (Re) number regimes, which enable greater efficiencies to be achieved, in contrast to smaller propellers which operate at lower Re numbers. Therefore, creating propeller geometries that permit higher efficiencies to be reached, whilst not inducing large mass and cost penalties, would lead to significant improvements in performance.
A previous research project at the University of Southampton resulted in a MATLAB code being developed which optimised propeller geometry for given operating conditions [4]. This work was used as the basis for the Mejzlik propeller online performance program [5]. Another research project examined the low Reynolds number propeller problem, but instead focused on using overlapping propellers as a solution [6]. However, neither of these projects attempted to design a single propeller which could operate at high efficiencies in low Reynolds number regimes.

1.4. Literature Review

The earliest analytical work on propellers was performed by Rankine and Froude in the 19th century. The theory developed was intended for use on marine propellers. The theory they developed later became known as Actuator Disk Theory (ADT)—or axial momentum theory. Whilst this doesn’t include any detailed propeller aerodynamics, this theory allows designers to develop rough performance and sizing requirements.
  • ADT is based on a number of assumptions:
  • The rotor is modelled as an actuator disk, which adds momentum and energy to the air;
  • There is no inflow or outflow through the wake boundary;
  • The flow is steady, incompressible and inviscid;
  • The flow is one dimensional and uniform;
  • The flow is uniform through the disk and wake;
  • The disc does not impart any swirl to the flow.
Using inviscid flow theory and taking a force balance across the actuator disk, the thrust can be easily calculated. For a given thrust, the induced axial velocity can be calculated according to Eqn. 1.
w a x i a l = V 2 4 + T 2 ρ A V 2

1.5. Historical Perspective

In the minutes of the (1890) Proceedings of the Institution of Civil Engineers [7], the use of propellers for marine applications was discussed, and it soon became clear that the theory they were developing was applicable to aeronautics as well.
Drzewiecki [1892] is credited with the development of Blade Element Theory (BET) [8]. BET is a method used to analyse propeller performance that, unlike actuator disk theory, considers the propeller geometry and aerodynamic properties. In blade element theory it is assumed that the flow over a blade section is two-dimensional. This means that the flow over a given blade section is unaffected by the flow over neighbouring sections—in this analysis, the effective velocity is simply the result of the axial velocity and the rotational velocity. The propeller blade is broken down into multiple sections, and the forces acting on each of these blade sections is determined. By integrating over the length of the blade, the overall blade forces can be developed.
Weick (1925) in his NASA technical note entitled: Simplified Propeller Design for Low-Powered Airplanes [9] detailed an empirical design method for propellers. The design process is accomplished through the use of charts and basic formulae and involves no detailed calculations. The data required for this design method is the aircraft airspeed, the brake horsepower and the revolutions per minute of the engine, and the density of air. From this data, the performance coefficient, advance ratio and efficiency of the propeller are found empirically. The article also educates on what materials are capable of withstanding the centripetal forces at different propeller diameters and rotational speeds.
In his 1935 paper, entitled Airplane Propellers [10], Glauert formulated a method for analysing arbitrary propeller designs. The method is a combination of axial momentum theory and blade element theory, and includes corrections for momentum loss due to radial flow. The method is limited, as the contraction of the propeller wake is not considered. As a result, the theory is accurate for low disc loading (small thrust per unit disc area), but is only adequate for estimating performance at high disc loadings.
Propeller Analysis from Experimental Data [11] is a 1940 report (Stickle & Crigler) in which propeller performance is analysed. The data used in this analysis was obtained in a 20-foot wind tunnel with a 4-foot diameter propeller, but the results apply to all propellers. Firstly, aerodynamic theory is used to create formulae which can be used to calculate both the axial and rotational energy losses in the wake of a propeller. These are then validated with wind tunnel data, and it is shown that, for an optimal propeller, the loss in efficiency due to rotational velocity is always very small. However, for a propeller with high-blade settings, this efficiency loss can become quite high. The load distribution along a propeller blade is also examined, and the maximum thrust generation is found to always be between 0.7R-0.85R (where R is the radius of the blade). Finally, the benefits of counter-rotating propellers over single propellers with an increased diameter are examined, and it was found that only small gains in propeller efficiency can be expected with counter-rotating blades.
A book by Theodorsen (1948) entitled Theory of Propellers [12] was a development of the earlier propeller theory developed by Drzewiecki (1892), and Reynolds et al. (1890). Theodorsen focussed on the wake downstream of the propeller more than the propeller itself, as “thrust, torque and efficiency are uniquely and completely established by the knowledge of the wake far behind the propeller and of the wake alone. To establish these quantities, in fact, it is absolutely unnecessary to know the design of the propeller.” Theodorsen introduces a mass coefficient, which represents the effective cross-section of the column of air behind the propeller divided by the projected propeller wake area. Formulae are then developed for calculating the torque, thrust, energy loss and efficiency, in terms of the mass coefficient, for any propeller with ideal circulation distribution, from the downstream wake conditions.
In 1979, McMasters and Henderson working for Boeing, published a report entitled Low-Speed Single-Element Airfoil Synthesis [13] which outlines the design criteria and the practical restraints for an airfoil operating at low Reynolds numbers. The report also describes a ‘synthesis’ based approach to airfoil design, in contrast to the typical ‘analytical’ approach. First, the boundary layer characteristics are defined, as they define the pressure distribution and therefore the airfoil performance. From this, powerful computational tools were used to generate an airfoil shape which yields the pre-defined boundary layer.
A Master’s thesis by Gamble (2009) entitled Automatic Dynamic Propeller Testing at Low Reynolds Numbers [14] focuses on the testing of propellers and reducing propeller test times, by designing a system in which propeller data can be acquired systematically. The effect of the Reynolds number on efficiency and propeller pitch were also examined.
Another Master’s thesis by Koch (1998) called the Design and Performance Calculations of a Propeller for Very High-Altitude Flight [15] examined propellers for use in low Reynolds number flow regimes (60,000-100,000). A design process utilizing BET and ADPAC (a numerical Navier-Stokes code) was used to optimise a propeller for high altitude flight. The operating conditions for this study were 25.9 km (85,000 ft) at Mach 0.4, and each propeller was required to absorb 63.4 kW (85 bhp).
Propeller Performance Measurement for Low Reynolds Number Unmanned Aerial Vehicle Applications [16] focused on the testing of small propellers, particularly those used on UAV systems. An Integrated Propulsion Test System (IPTS) was used to evaluate the performance of many propellers, and a database of performance data was created. This IPTS setup is similar to the one in use at the University of Illinois at Urbana-Champaign’s (UIUC) Department of Aerospace Engineering, where a vast propeller database has been created [2]. Using a load cell to measure thrust and a torque cell to measure torque, efficiency curves have been plotted, and in modern propeller research this database is often used for comparative reasons.
Similarly, in Low Reynolds Propellers for Increased Quadcopters Endurance [17], the design process for creating a propeller for use in low Reynolds number flow is detailed by Carvalho (2013). A validation exercise of the UIUC Propeller database [2] was also completed, by comparing the UIUC experimental results of the APC Slow Flyer 10” x 7” to simulated results on JBLADE software. The highest efficiency value was found to be 61% from JBLADE simulations, compared to the experimental value of 59%. Note: The UIUC database was updated in March 2015, to account for a new wind tunnel correction method for the drag due to the propeller mounting fixture. This had the result of increasing the peak efficiency of props by approximately 10%.
A journal paper entitled Propeller Performance Measurements at Low Reynolds Numbers [18] by Silvestre, et al. (2015) discussed the design of propellers for use on high-altitude airships. Two APC propellers were tested between 4 m/s and 28 m/s in 1 m/s intervals, and the data was compared to the UIUC database in order to validate the test-rig. It was shown that as the Reynolds number increases with increasing RPM values, the efficiency and thrust coefficient of the propeller was increased significantly. It is also stated that the test-rig would be used to create experimental data that could improve the JBLADE software in the future.
In a 2016 paper by Kuantama, et al. entitled Quadcopter Propeller Design and Performance Analysis [19] used SolidWorks to analyse the efficiency of a two-bladed 16” x 5” propeller. The range of RPM values used in this case study was 1,000-9,000 RPM. The experimental data was compared to datasheets of existing propellers in order to validate the SolidWorks flow simulation method.
A book by Prior (2018) Optimising Small Multi-Rotor Unmanned Aircraft—A Practical Design Guide [20] gives an overview of propellers used on small multi-rotor aircraft. Propeller variables are discussed, including the geometry and airfoil choice that needs to be made when designing a propeller. Basic propeller theory, including momentum theory, various propeller coefficients, and propeller efficiency is outlined. The effect of using overlapping rotors is explored, from large aircraft such as the Boeing CH-47 Chinook helicopter, to smaller aircraft such as the Malloy Aeronautics Hoverbike. Finally, Prior discusses the challenges of propeller design in low Reynolds number flow, using the analogy that at low Reynolds numbers, air becomes more viscous and therefore achieving high efficiencies is much harder.
Finally, an Experimental Study on the Aerodynamic and Aeroacoustic Performances of a Bio-Inspired UAV Propeller [21] discussed the performance of a baseline propeller and a bio-inspired propeller with the same design thrust (3N) and solidity (0.12) are analysed. It was found that for the same thrust generation, the bio-inspired propeller emitted lower noise under constant power input. The planform shape of the bio-inspired propeller was inspired by the cicada wing and the shape of maple seed.

1.6. The Optimum Propeller

There is ample literature describing and validating various methods of analysing propeller performance, however there is significantly less existing literature on design methods for optimum propellers.
All propellers have spanwise or radial circulation distributions which minimise the kinetic energy loss associated with the generation of lift (thrust). By determining the geometry which results in these circulation distributions, one can determine the geometry of the propeller which results in the minimum losses (most efficient). In 1979, Larrabee published Design of Propellers for Motorsoarers [22] which explains his method, and forms a series of equations which are solved iteratively to form the final propeller geometry. The two geometric parameters this method calculates are the chord distribution and the twist distribution. The suitability of the method for three very different applications was then discussed. These were propellers for use on a human-powered aircraft, a powered hang glider and a motorsoarer. Comparisons were made between the calculated propellers and the actual propellers used on these aircraft, and in all instances the calculated geometry was found to be very close to the actual optimum geometry.
The Design of Optimum Propellers (Adkins & Liebeck, 1994) [23] further explains the process, which is based around the Betz condition that a constant-displacement velocity across the propeller wake provides a propeller design with maximum efficiency. Using the circulation functions developed by Betz & Prandtl [24] and Goldstein [25], one can use the Betz condition to obtain the chord and twist distributions of a theoretical propeller with minimum losses. The original equations stated by Betz and Glauert [10] were only applicable for propellers with light-loading, however, Theodorsen [12] showed that the Betz condition for minimum loss can be applied to heavy-loading as well, by including the contraction of the wake in the equations.
In his paper entitled Increasing of Aircraft Propeller Efficiency by Using Variable Twist Propeller Blades (Klesa, 2008) [26], the method is simplified to a simple step by step iterative process. Klesa shows that a MATLAB code could be written to generate the optimum chord and twist distributions, and shows that the varying flight conditions will present different optimal geometry, meaning that a propeller can only be optimised for one design point at a time, unless deploying variable pitch mechanisms.

2. Materials and Methods

2.1. Propeller Theory—Geometry

2.1.1. Airfoil Geometry

An airfoil is a 2D cross-sectional shape of an object that, when moved through a fluid, produces an aerodynamic force. The most common application of airfoils is on the wings of fixed-wing aircraft, however they are also used on propellers. Among others, the main objective when selecting an airfoil is to create the highest lift to drag ratio. The most suitable airfoil will depend on the flow conditions the airfoil will be operating in. Using online tools such as JavaFoil [27] or QProp [28], existing airfoils can be analysed, and new airfoils can be created and analysed. Figure 3 depicts a NACA0012 in JavaFoil, which is one of the most common airfoils. As can be seen, the airfoil is symmetric (it has no camber). This can be deduced from the ’00’ digits in the airfoil name. The airfoil has a thickness to chord ratio of 12% (hence the ’12’ digits in the airfoil name).
However, most airfoils used on propellers are cambered, as symmetric airfoils require either high angles of attack or high flow speeds to produce significant lift, resulting in poor lift to drag ratios. The NACA3414 airfoil, as seen in Figure 4, is a cambered airfoil. It has 3% maximum camber (signified by the ’3’ digit), with the maximum camber occurring at 40% chord (signified by the ’4’ digit), and a thickness to chord ratio of 14%.

2.1.2. Propeller Geometry

Aside from the diameter, the pitch of the propeller is the most important geometric parameter when designing a propeller. The pitch of a propeller is defined as the distance that, if the propeller were moving through a soft solid, the propeller would move forward in one complete rotation. Of course, in conventional propellers the pitch will decrease from the hub to the tip, and so it has become convention to specify the pitch of a fixed pitch propeller at 75% of the distance from the hub to the blade tip. Propellers with high pitch values can produce higher thrust levels at higher speeds than low pitch propellers, whilst low pitch propellers can produce higher thrust levels at low speeds. Therefore, the main driver in selecting the pitch for a propeller is the velocity of the propeller. From the pitch, the theoretical angle of twist can be calculated for the length of the blade using Eqn. 2.
A n g l e o f T w i s t = t a n 1 p 2 π r
Another important geometric aspect of a propeller is the taper profile. Whilst rotor blades found on helicopters tend to have no taper, and wings on fixed wing aircraft tend to have linear tapers, the taper profile of propellers is typically quite complicated, involving complex curves. The taper profile is defined as the variation of chord length along the blade. Typically, the chord length is small at the hub, it increases, resulting in a maximum chord length between 25% and 75% along the blade radius, and then it decreases towards the blade tip.

2.2. Non-Dimensional Coefficients

The performance parameters of a propeller (or rotor) can be expressed in non-dimensional form. Understanding how to calculate these quantities is therefore key to understanding propeller theory. It should be noted that these coefficients differ for propellers and rotors. A rotor is defined as an aerodynamic propulsion device which operates in static conditions, whereas a propeller operates in non-static conditions. Simply put, for the calculation of these coefficients a rotor is a propeller operating with a forward flow speed of zero. From Leishman (2008) [29], the non-dimensional coefficients can be found using Eqns. 3 to 8, and are categorised in Table 1 below.
C T = T 1 2 ρ A Ω R 2
C T p = 3.875 C T = T ρ n 2 D 4
C P = P 1 2 ρ A Ω R 3
C P p = 12.175 C P = P ρ n 3 D 5
C Q = Q 1 2 ρ A Ω R 2 R
C Q p = 1.938 C Q = Q ρ n 2 D 5
Another dimensionless quantity of rotor blades is the blade solidity, which can be defined as the ratio of total blade area to the disk area, as defined in Eqn. 9. Values of the solidity for conventional helicopters vary from about 0.06 to 0.12.
σ = A r e a o f r o t o r b l a d e s A r e a o f r o t o r d i s k = B c R π R 2 = B c π R

2.3. Propeller/Rotor Efficiency

The efficiency calculation of a blade propulsion system varies depending on whether the system is a rotor or propeller driven system. Rotor driven systems, such as those found on helicopters, use a hover efficiency metric called the Figure of Merit (FoM), whilst propeller driven systems use a more conventional propulsive efficiency term ηP.
Figure of Merit
The Figure of Merit is a dimensionless factor used to calculate hover efficiency of rotor driven propulsion systems. The concept of a Figure of Merit was first proposed by Renard (1903) and then Glauert (1935), but was first presented in its present form by Richard H. Prewitt of Kellett Aircraft. The Figure of Merit is defined in Eqn. 10.
F o M = I d e a l P o w e r R e q u i r e d t o h o v e r A c t u a l P o w e r R e q u i r e d t o h o v e r = C T 3 2 2 C P
Eqn. 10 is derived from simple momentum theory, and thus assumes there is no viscous losses when calculating the ideal power required to hover. In the actual power required to hover measurement, viscous effects will result in both profile and induced loss contributions, and therefore for a real rotor, the Figure of Merit must be less than 1. Hover propulsion systems can be optimised to achieve FoM values of up to 0.9, however, achieving an optimal FoM value will result in a significantly lower propulsive efficiency value. Therefore, rotor propulsion systems are often designed to have FoM values of around 0.6, resulting in higher efficiencies at high speeds at the expense of lower efficiencies in hover conditions.
The disc loading of a rotor is defined as the ratio of the thrust produced by the rotor to the rotor disk area. To make a meaningful comparison between the FoM values of multiple rotors, the rotors must have the same disc loading. The disc loading will increase the induced power relative to the profile power, resulting in a higher FoM which is a misleading value for comparison. Generally, rotors with high disc loadings will give higher figure of merit values than rotors with low disc loadings.

Propulsive Efficiency

The propulsive efficiency, ηP, of a propeller driven propulsion system is a more useful expression of propeller performance, since in their operation, all propulsion systems will have axial flow with a non-zero velocity. Firstly, the advance ratio, J which is needed to calculate the propulsive efficiency, is defined in Eqn. 11.
J = A x i a l F l o w V e l o c i t y T i p R o t a t i o n a l V e l o c i t y = V n D
Typically, in the range of 0-2, the advance ratio is the ratio of axial velocity to rotational velocity at the tip of the propeller. As can be seen in Eqn. 12, the propulsive efficiency is directly proportional to the advance ratio, J.
η P = J C T C P     T c P c
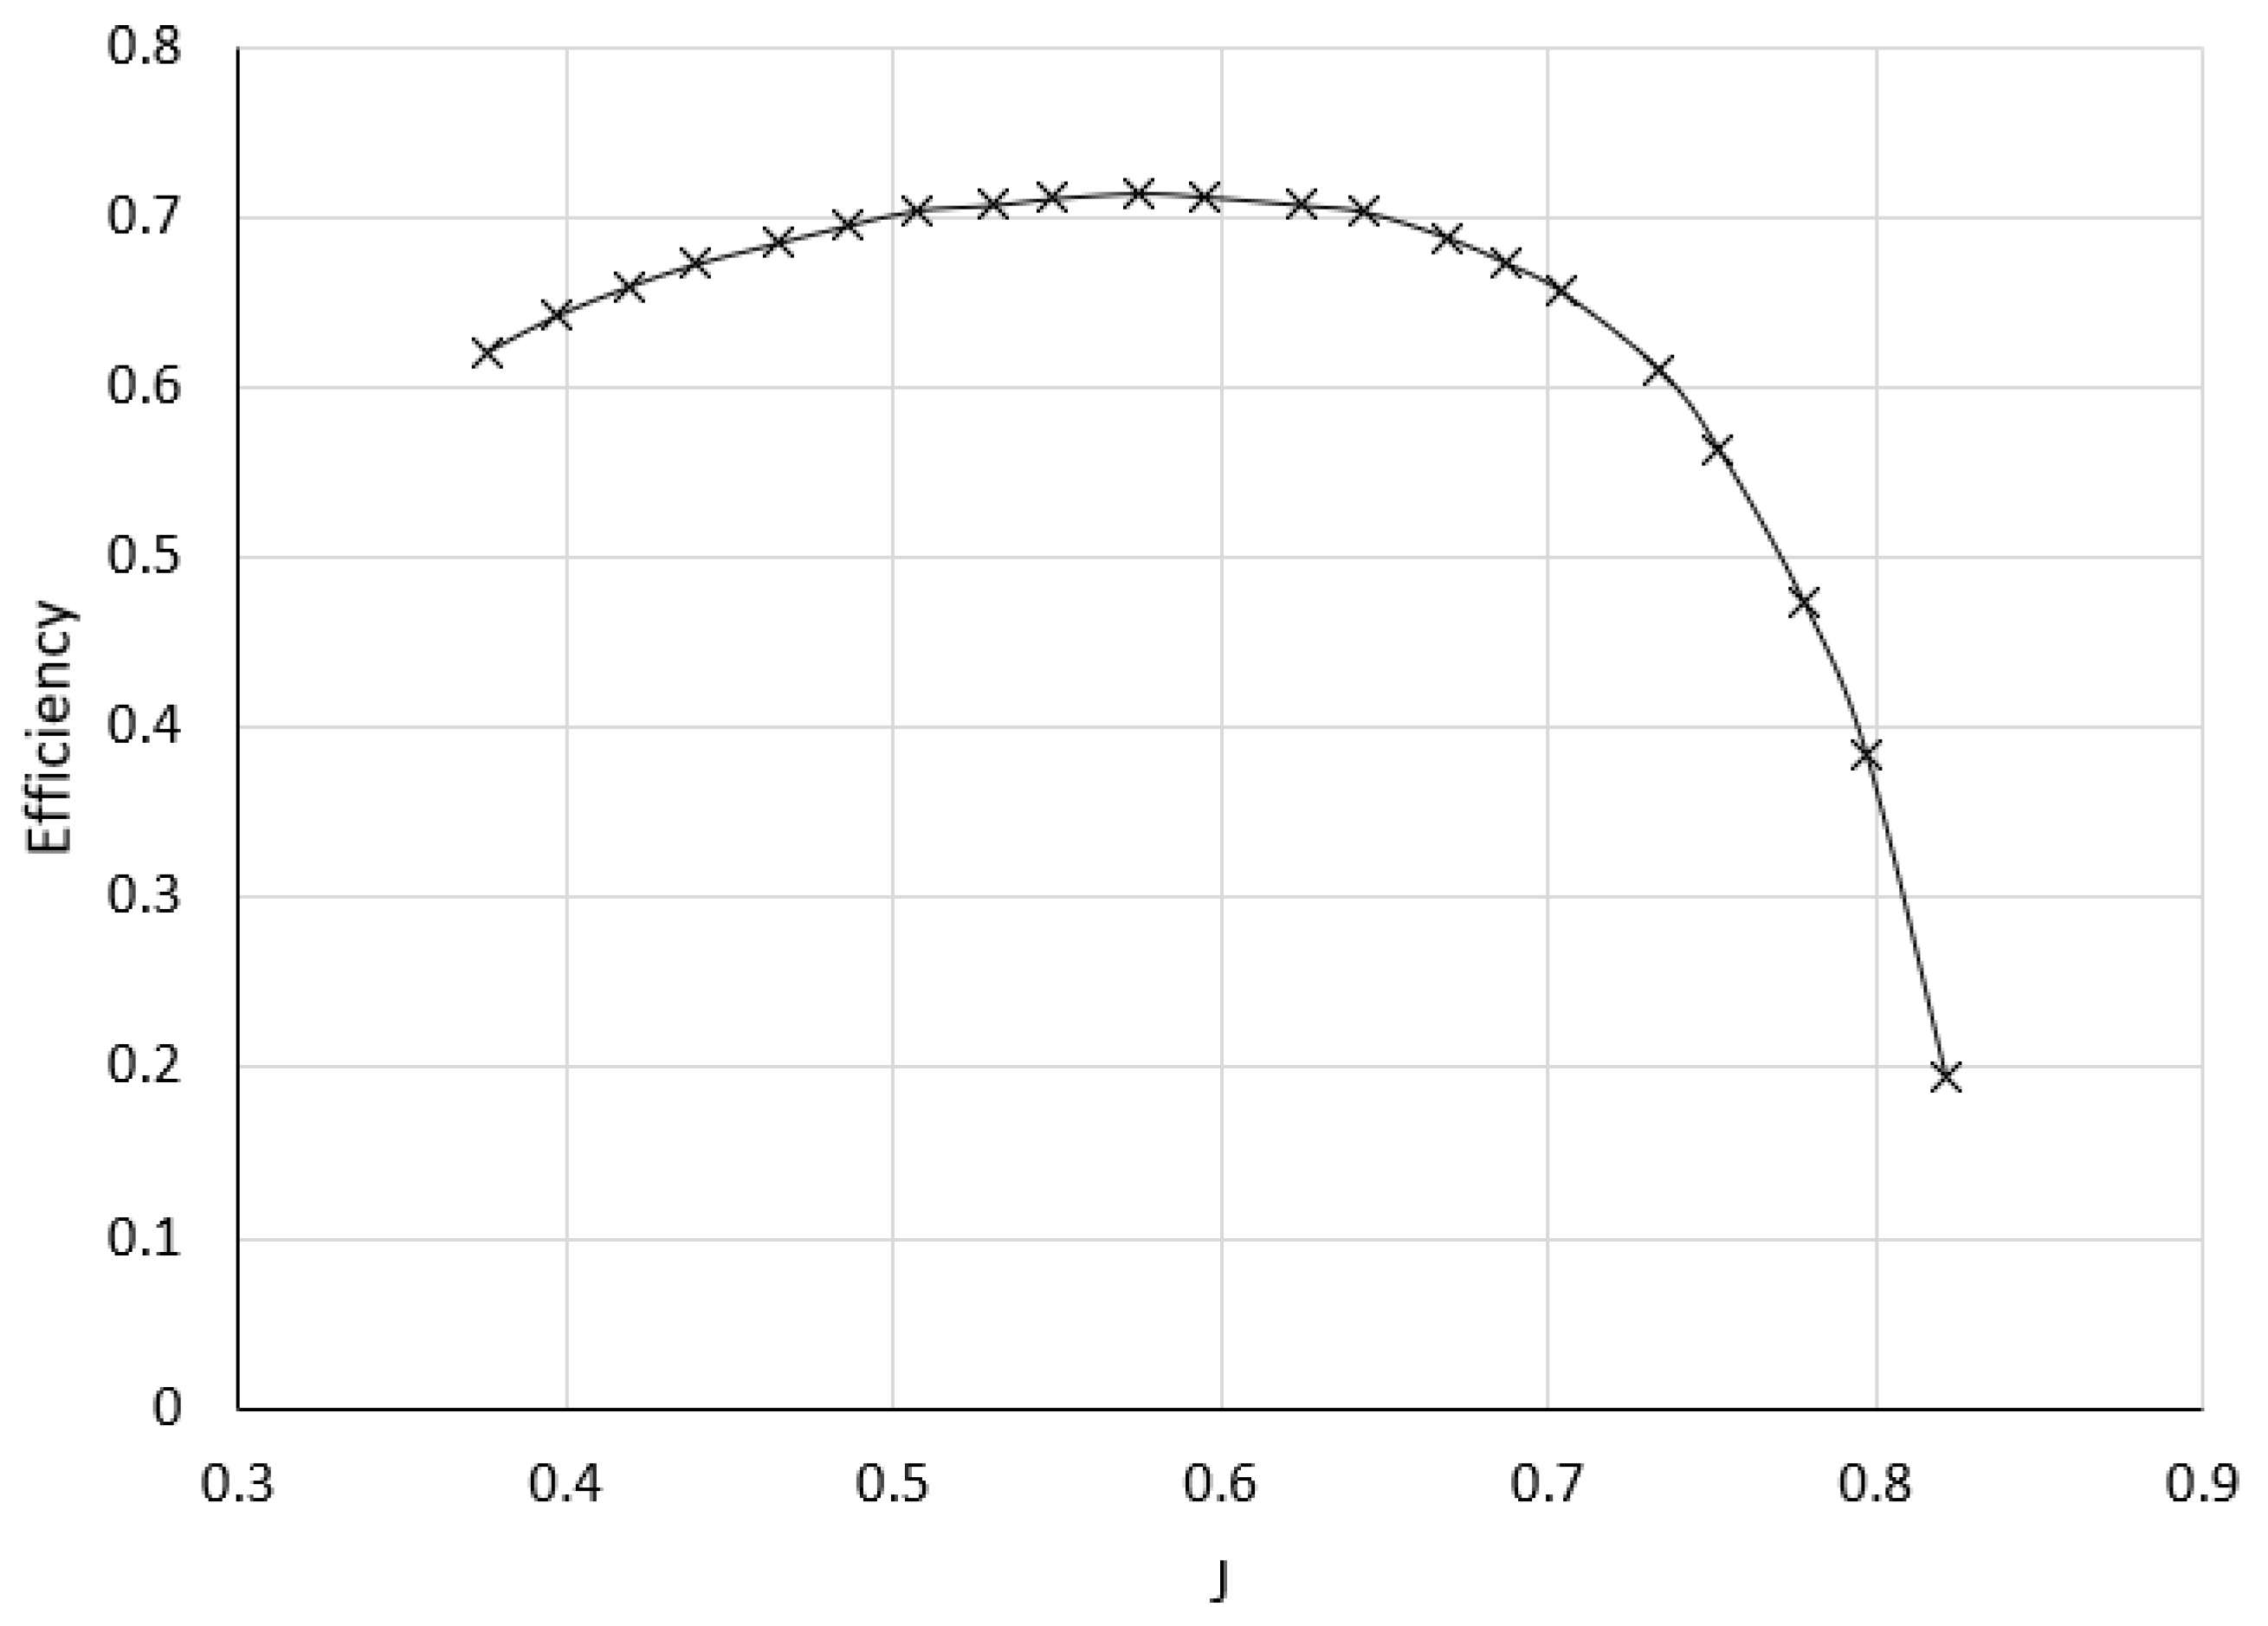
As can be seen in Eqn. 12, the propulsive efficiency of a propeller is directly affected by the coefficients of thrust and power. Looking back to Eqns. 4 and 6, it can be seen that both the angular velocity and the propeller diameter will affect the propulsive efficiency. The fluid density, which is in the denominator of both coefficients, cancels out and therefore does not affect the efficiency. However, the propulsive efficiency is determined by other factors not explicitly seen in Eqns. 4 and 6. The propeller pitch/diameter ratio, airfoil geometry, spanwise chord, taper profile and material choice all affect the thrust and power terms seen in Eqns. 4 and 6; thus, they all affect the propulsive efficiency. The efficiency curve of an APC 10” x 7” propeller is shown in Figure 5, with data from the UIUC propeller database [2].
Well-designed propellers typically have maximum efficiencies at advance ratios of between 0.5 and 0.7. However, the maximum efficiency for a propeller only occurs at one advance ratio (J), meaning that as the advance ratio increases, the efficiency will quickly reduce to a minimum. This sudden drop means that designing an efficient propeller that will be operated over a range of advance ratios is very challenging, as one can select an advance ratio at which the propeller will operate at maximum efficiency, but any variation in advance ratio can lead to a drastic drop in efficiency. Therefore, the maximum efficiency of a propeller is limited to a single airspeed at a given angular velocity. Propellers on larger aircraft suffer from compressibility losses, whereby the tips of the blades approach the speed of sound, resulting in shock wave formation and the losses associated with these. Transonic flow begins at about Mach 0.8.

2.4. Reynolds Number

The Reynolds number of a certain flow condition is defined as the ratio of inertial forces to viscous forces, and it is a dimensionless parameter that can help predict flow patterns. The Reynolds number is defined in Eqn. 13, where L is the characteristic length.
R e = ρ V L μ
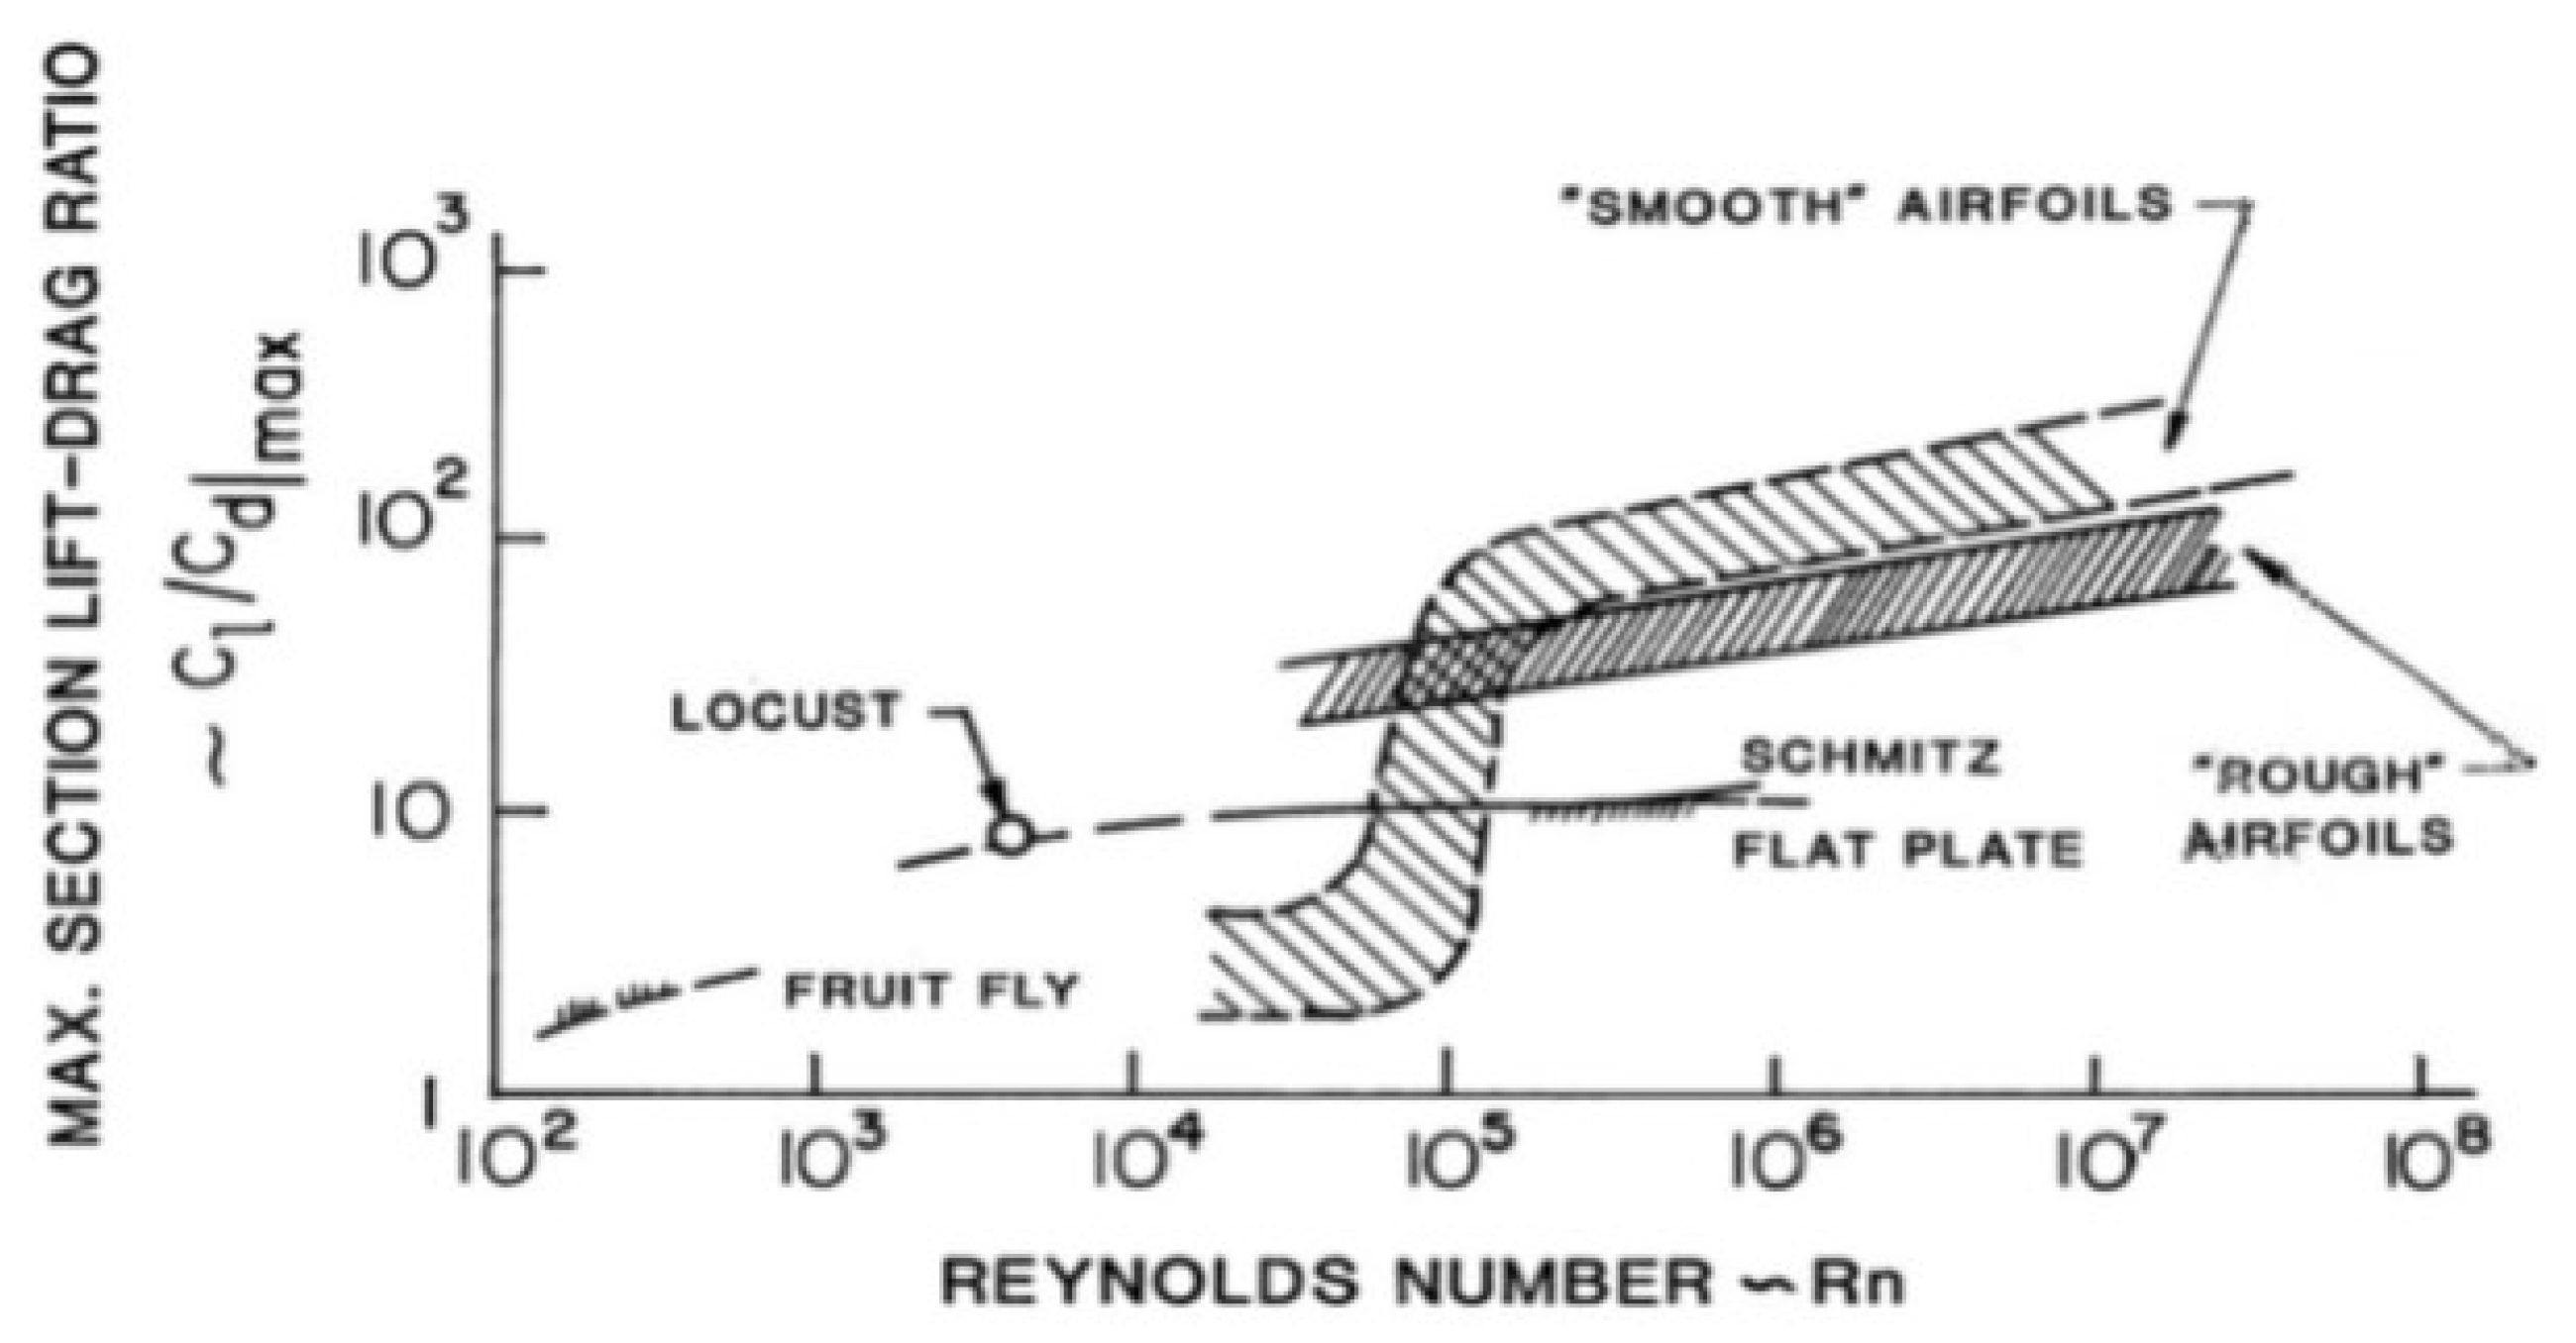
As can be seen in Eqn. 13, if all other parameters are held constant, the Reynolds number will decrease if the characteristic length decreases. When analysing propeller flow, the characteristic length is the chord length of the blades, and so smaller blades will result in smaller Reynolds numbers. As can be seen in Figure 6, at a Reynolds number of 100,000 for smooth airfoils, there is a sudden transition from a low maximum section CL/CD ratio to a high maximum section CL/CD ratio. Propellers used on small drones often operate in Reynolds numbers less than 100,000, and the maximum lift/drag ratio that can be achieved is therefore limited by their small diameters.
When operating below the 100,000 Reynolds number threshold, the lower lift/drag ratios associated with these flow regimes, are the biggest contributor to the lower efficiencies associated with scale propellers. The velocity component in Eqn. 13 means that the angular velocity of the propeller affects the Reynolds number. The Reynolds number will vary along the length of the blade, due to varying chord lengths and rotational velocities, and at low angular velocities sometimes no part of the blade will exceed the 100,000 Reynolds number threshold. It is therefore critical for a propellers efficiency to operate at the highest RPM value possible (assuming tip speeds do not approach Mach 0.8).

2.5. Propeller Geometry Optimization

The following section describes a method that is used to iteratively design propeller chord and twist distributions. The following systems of equations are only reviewed briefly in this paper, but a more detailed explanation and derivation has been written by both Larrabee (1979) [22] and Adkins & Liebeck (1994) [23]. The method below assumes that the shaft power supplied to the motor is known, however, if the required thrust of the propeller is known instead, Klesa (2008) [26] describes a method that is largely the same as the one described here. This method assumes light-loading (<400 N/m2) and incompressible flow.

2.6. Calculating Propeller Geometry

The numerical method is based on the Betz criteria [24]. The Betz criterion for optimum loading for a lightly loaded actuator disk in axial flight states that the trailing edge vortex sheets, after an initial deformation close to the rotor disk, move axially downward as a rigid screw surface (i.e., the ratio of translational velocity to rotational velocity is constant). For every iteration of this method, the displacement velocity is assumed to be radially constant. If the wake helix angle is φs, the axial and swirl velocity components are therefore given by Eqns. 14 and 15.
w a x i a l = v Cos 2 2 ϕ s
w s w i r l = v cos ϕ s sin ϕ s
In this method, the displacement velocity will be represented by the displacement velocity ratio, which is defined in Eqn. 16. This is the variable which will be optimised to result in optimum propeller geometry, but this will be discussed later.
ζ = v V
Both Betz & Prandtl (1919) and Goldstein (1929) derived momentum loss functions, which describe the energy lost in a propeller wake. Whilst Goldstein’s function is more accurate, Prandtl’s momentum loss function, F, will be used here for simplicity.
F r = 2 π arccos e f
f r = B 2 1 ξ sin ϕ t
ξ r = r R
ξ is the non-dimensional radius and is calculated by dividing the radial co-ordinate, r, by the propeller tip radius, R as in Eqn. 19. φt is the flow angle at the propeller tip, and is a function of the displacement velocity, as seen in Eqn. 20. From the flow tip angle, the flow angle, φ, of every radial point can be found using Eqn. 21.
tan ϕ t = V Ω R 1 + ζ 2
ϕ r = arctan tan ϕ t ξ
From Eqns. 17-21, Eqns. 22 and 23 can be derived, which describe the circulation, Γ, at any radial point r. The circulation function, G, is more accurate for vortex sheets which are flat, parallel and closely spaced, however, it is an adequate approximation for most propellers.
Γ r = 2 π V 2 ζ G B Ω
G r = F Ω r V cos ϕ sin ϕ
Applying the Kutta-Joukowski theorem for a blade element at radius r, the lift per unit length of the blade can be equated as in Eqn. 24, where W is the local total velocity.
ρ W 2 c c L 2 = ρ W
Applying the expression for Γ in Eqn. 22, results in Eqn. 25.
W c r = 4 π V 2 G ζ c L B Ω
The total velocity W can be expressed by Eqn. 26.
W r = V 1 + a sin ϕ
a and a, are variables which appear several times in this method. The derivation of them will not be included in this paper, but can be found in ’Increasing of Aircraft Propeller Efficiency by Using Variable Twist Propeller Blades’, a paper by Klesa (2008) [26].
a r = ζ 2 c o s 2 ϕ 1 ϵ tan ϕ
a r = ζ 2 V Ω r cos ϕ sin ϕ 1 + ϵ tan ϕ
E is the section drag to lift ratio and is the only airfoil property that is required for this method. By dividing Eqn. 25 by Eqn. 26, the value of c can be calculated for any radial co-ordinate. Using Eqn. 29, the angle of twist (β) can be found at any radial co-ordinate.
β r = ϕ + α

2.7. Optimising Propeller Geometry

The two main geometric parameters of the propeller, the chord and twist distribution, have now been calculated, however these parameters are not optimised. The following section details how the displacement velocity ratio is optimised to produce optimal propeller geometry in an iterative process. Firstly, the non-dimensional design power coefficient, Pc, has to be calculated using Eqn. 30, where P is the shaft power supplied to the propeller.
P c = 2 P ρ V 3 π R 2
The key equation in the iterative process is Eqn. 31, which after simple integration results in Eqn. 32.
d P c d ξ = d J 1 d ξ ζ + d J 2 d ξ ζ 2
P c = J 1 ζ + J 2 ζ 2
J1 and J2 are simply variables used in the iteration process and have no physical meaning. ’Design of Propellers for Motorsoarers’, a paper by Larrabee (1979) [22], contains a full derivation of Eqns. 31, 32, 33 and 34.
d J 1 d ξ = 4 ξ G 1 + ϵ tan ϕ
d J 2 d ξ = 1 2 d J 1 d ξ 1 ϵ tan ϕ c o s 2 ϕ
After evaluating the derivatives of J1 and J2 at every radial co-ordinate, integrating with respect to the non-dimensional radius will result in values for J1 and J2. Re-arranging Eqn. 32, results in Eqn. 35. Using calculated values of Pc, J1 and J2, a new value of the displacement velocity ratio can be found.
ζ = J 1 2 J 2 + J 1 2 J 2 2 + P c J 2
The process is then repeated using the new value for the displacement velocity ratio, and is iterated until the displacement velocity ratio converges. Initially, an estimate for the displacement velocity ratio is used, which has to be small and is often zero. If the thrust, T is known then a slightly different equation is used with derivatives of I1 and I2. in the above procedure [22,23].

3. Results

3.1. Implementing the Optimization Method Using MATLAB

The required inputs for a MATLAB computer program which implements the iterative method are found in Table 2, along with their units. The non-dimensional hub radius is found by dividing the hub radius by the propeller tip radius.
The angle of attack input specifies the additional twist angle that is desired on the propeller. As can be seen in Eqn. 29, if the angle of attack is specified as zero, the radial twist angle distribution will be the same as the radial flow angle distribution.
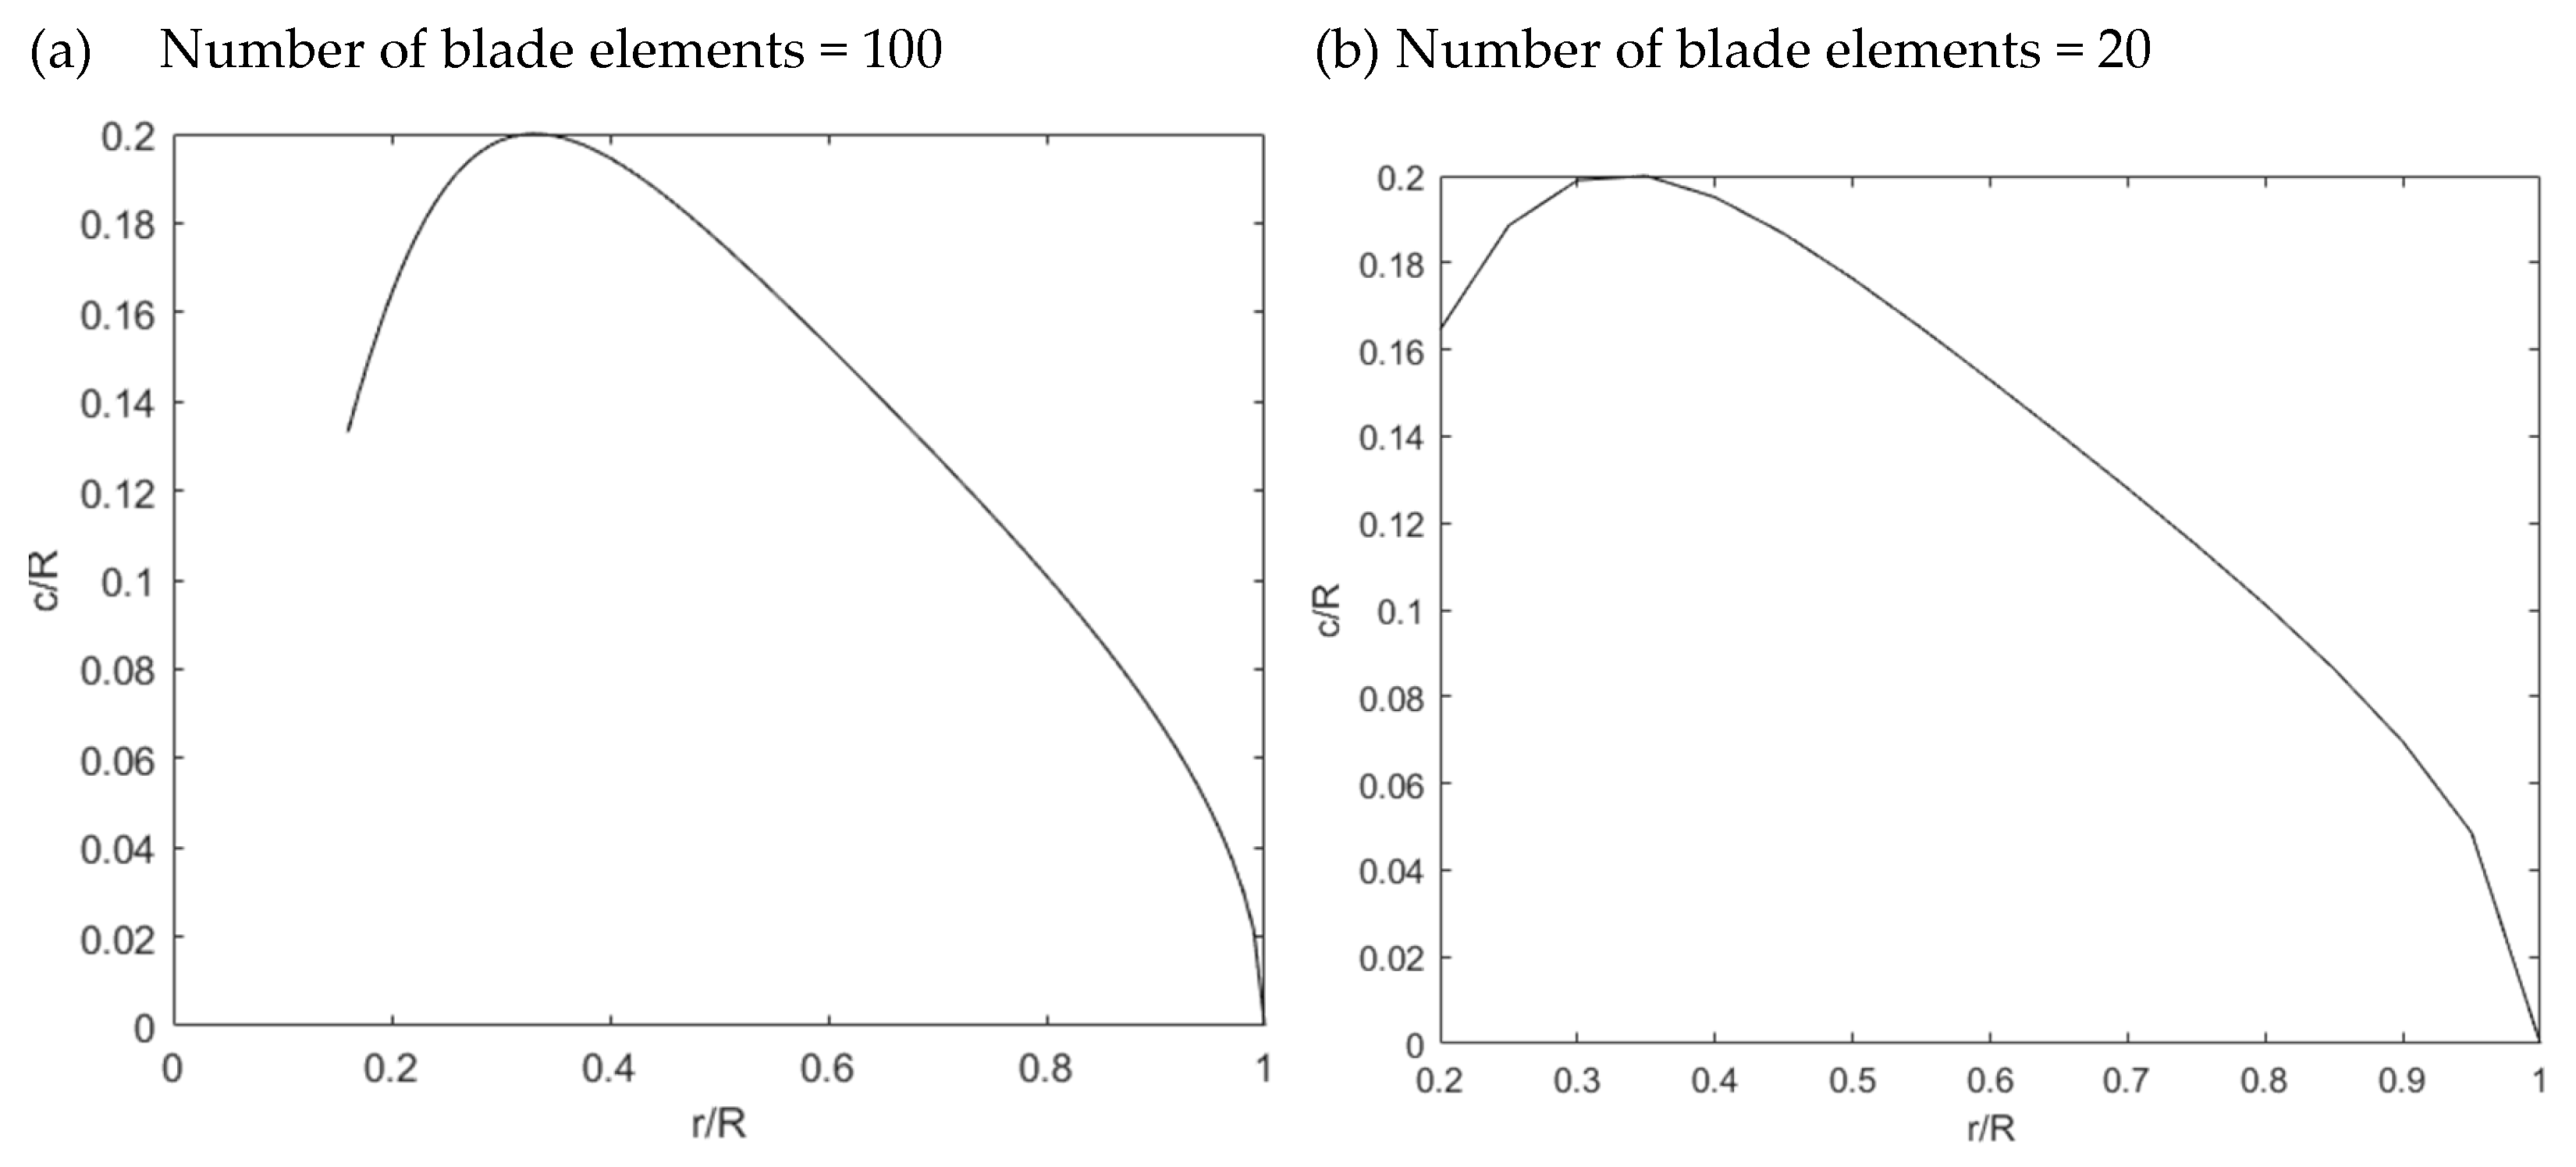
As the method is not analytical, there will inevitably always be errors. The main sources of error in the method are the assumptions of light-loading and incompressible flow, made throughout the method. Without greatly increasing the method complexity, there is little that can be done about this. However, the accuracy of the method can be increased by varying two of the inputs in Table 2. Firstly, the number of blade elements defines the blade element width. Using more blade elements will result in smaller blade element widths, resulting in a more complete and accurate output, as can be seen in Figure 7a and Figure 7b. The displacement velocity ratio convergence level defines how close the calculated value of zeta needs to be to the original value for the program to classify the displacement velocity ratio as ’converged’.
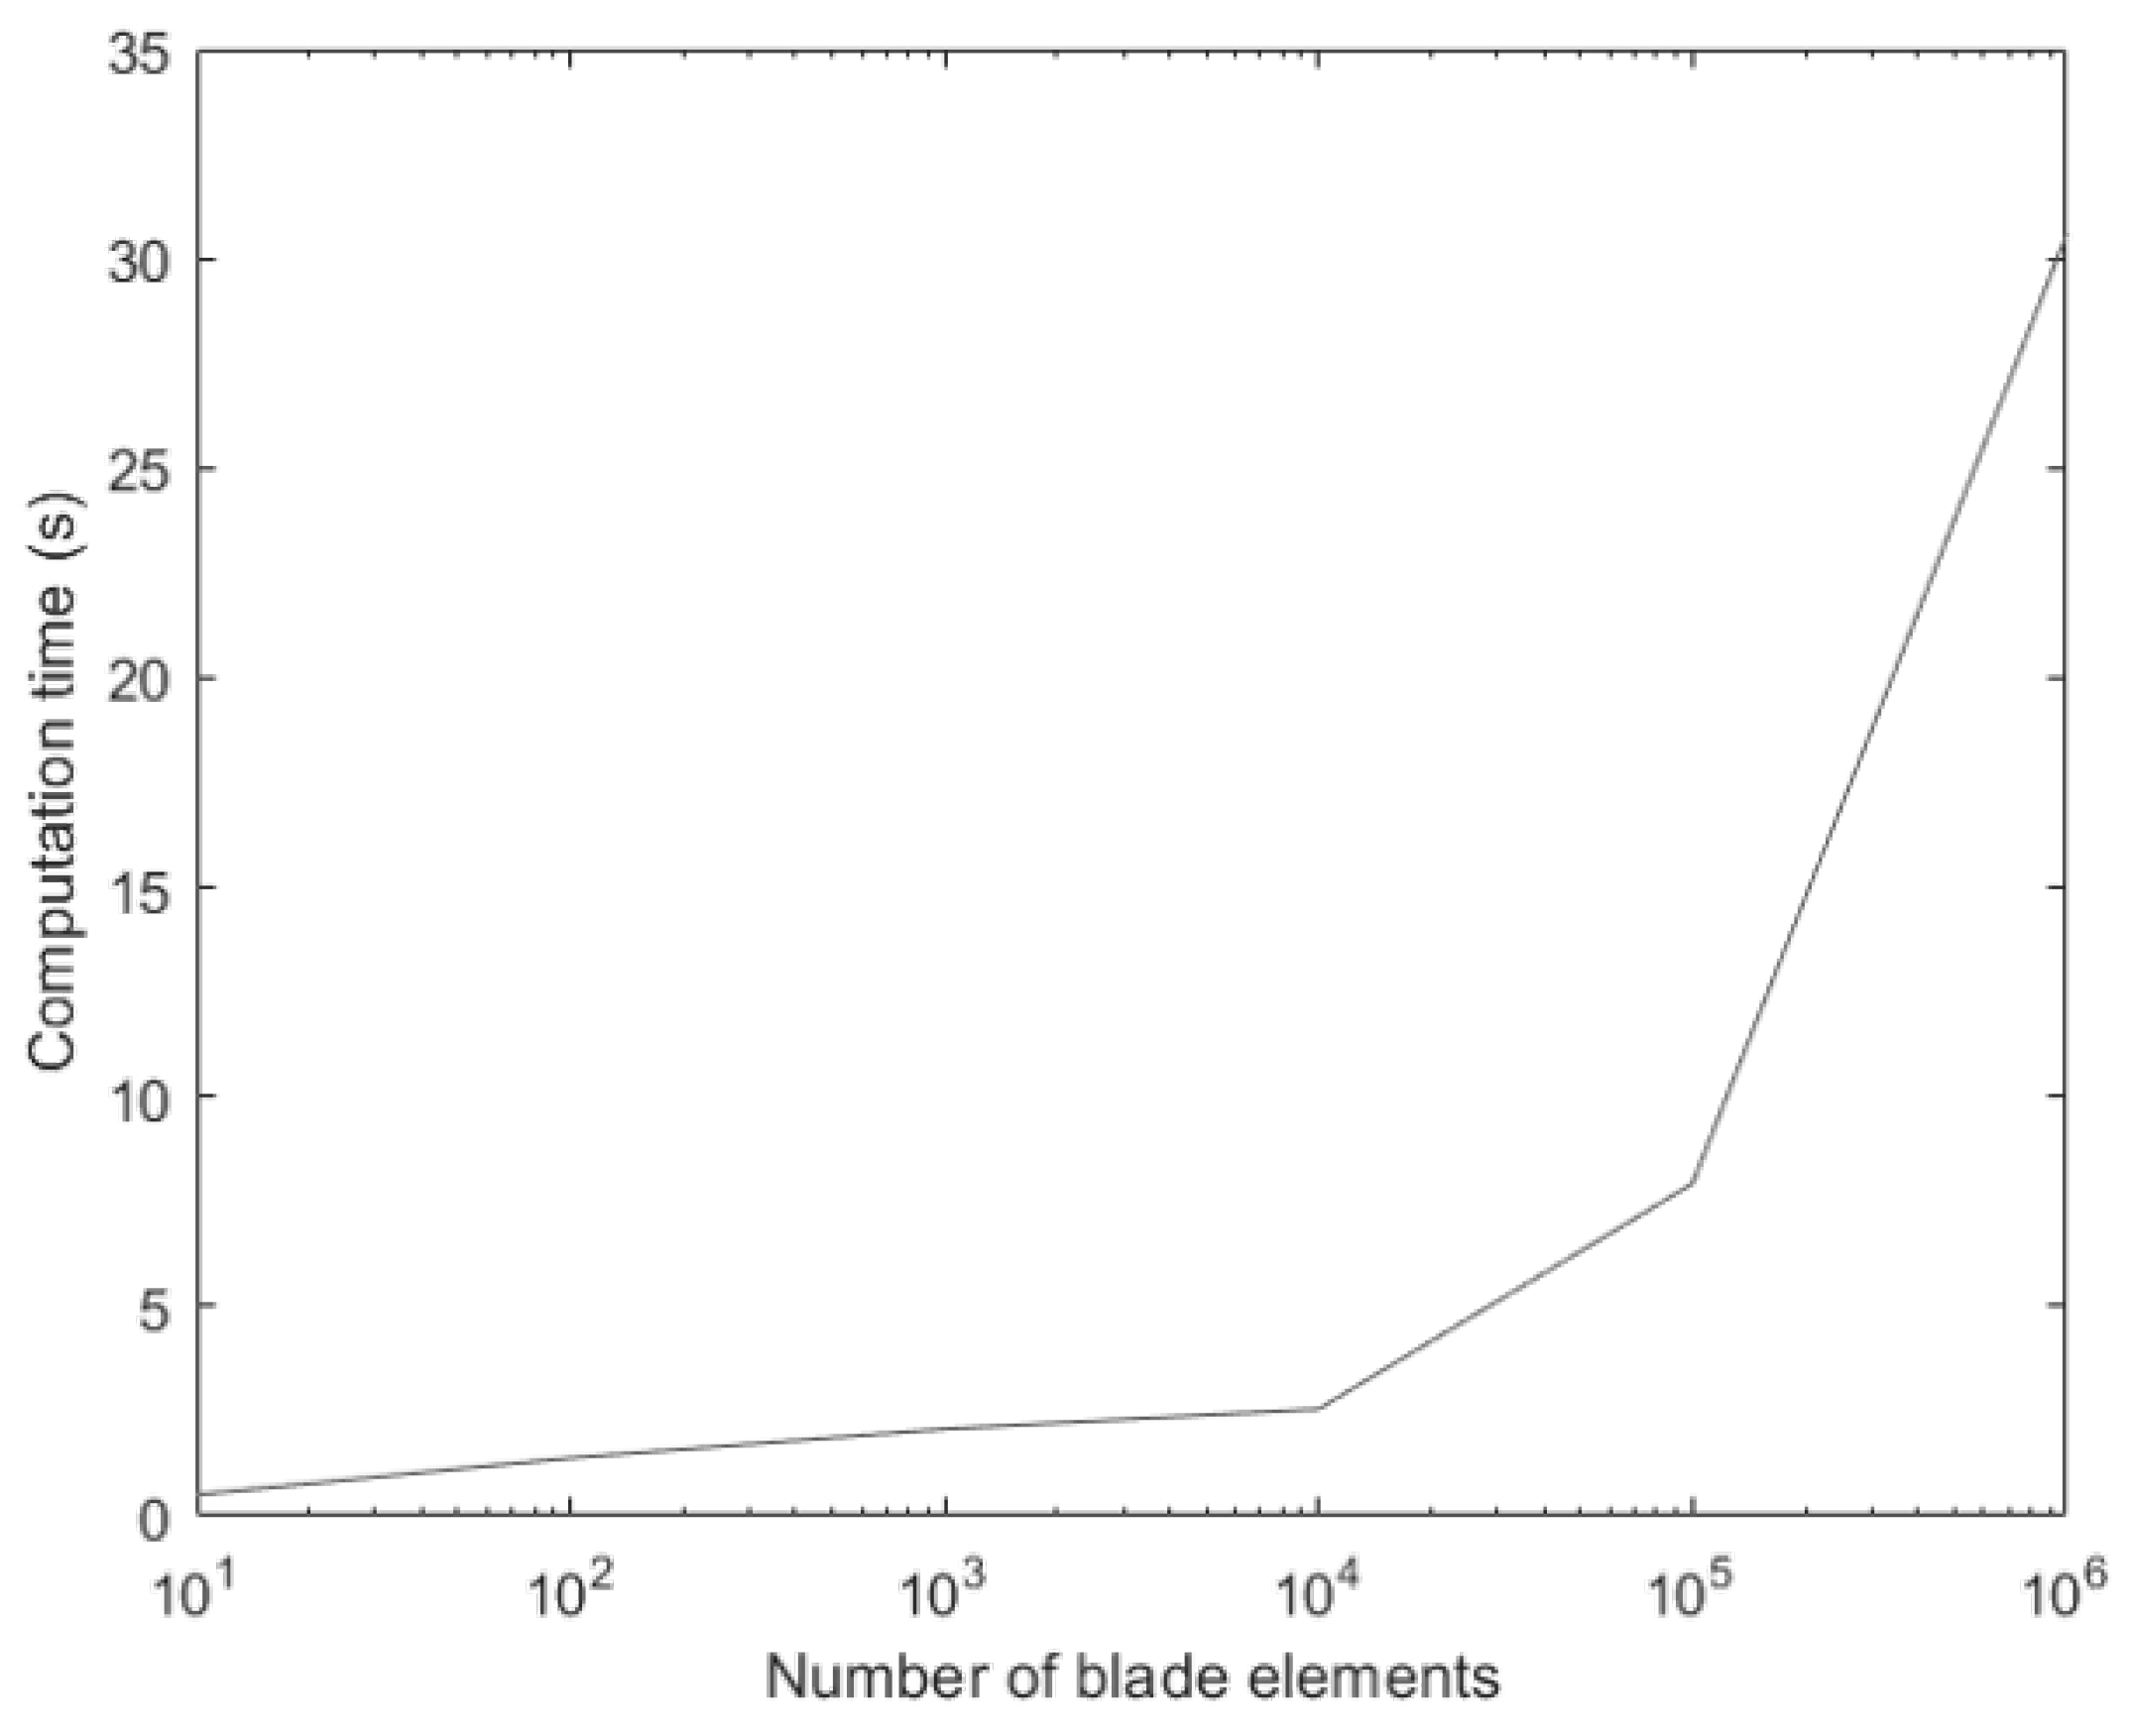
Using a smaller value for this input will therefore increase accuracy, at the inevitable expense of increased computation time, due to an increased number of iterations, as can be seen in Figure 8.

3.2. Reynolds Number Distribution

Using Eqn. 13, the Reynolds number distribution along the blade can be calculated, using the optimal chord distribution output from the program. The re-arrangement of Eqn. 13 to an equation suitable for the computer program is found below.
R e r = ρ W r c r μ = ρ Ω r c r μ
As already discussed in this paper, a Reynolds number of 100,000 represents a transition point at which the lift-to-drag ratio of a smooth airfoil increases drastically. In propeller design, it is therefore highly desirable for the Reynolds number to be above 100,000 at most radial co-ordinates. Whilst this could be achieved at all radial co-ordinates by simply increasing the chord length close to the propeller hub, structural requirements dictate that this chord profile is not commonly seen in small (less than 21-inch diameter) propellers. There would also be a drag penalty associated with increasing the chord length, which would reduce the lift-to-drag ratio of the blade sections close to the hub.
’Increasing of Aircraft Propeller Efficiency by Using Variable Twist Propeller Blades’, a paper by Klesa (2008) [26], details a method which, given that the above radial variables have been calculated at every radial co-ordinate, can be easily used to calculate the radial distribution of thrust generated by the propeller. After derivation, the equation used in the computer program is shown in Eqn. 37.
d T r = 2 π ρ V 1 + a 2 V a F d r
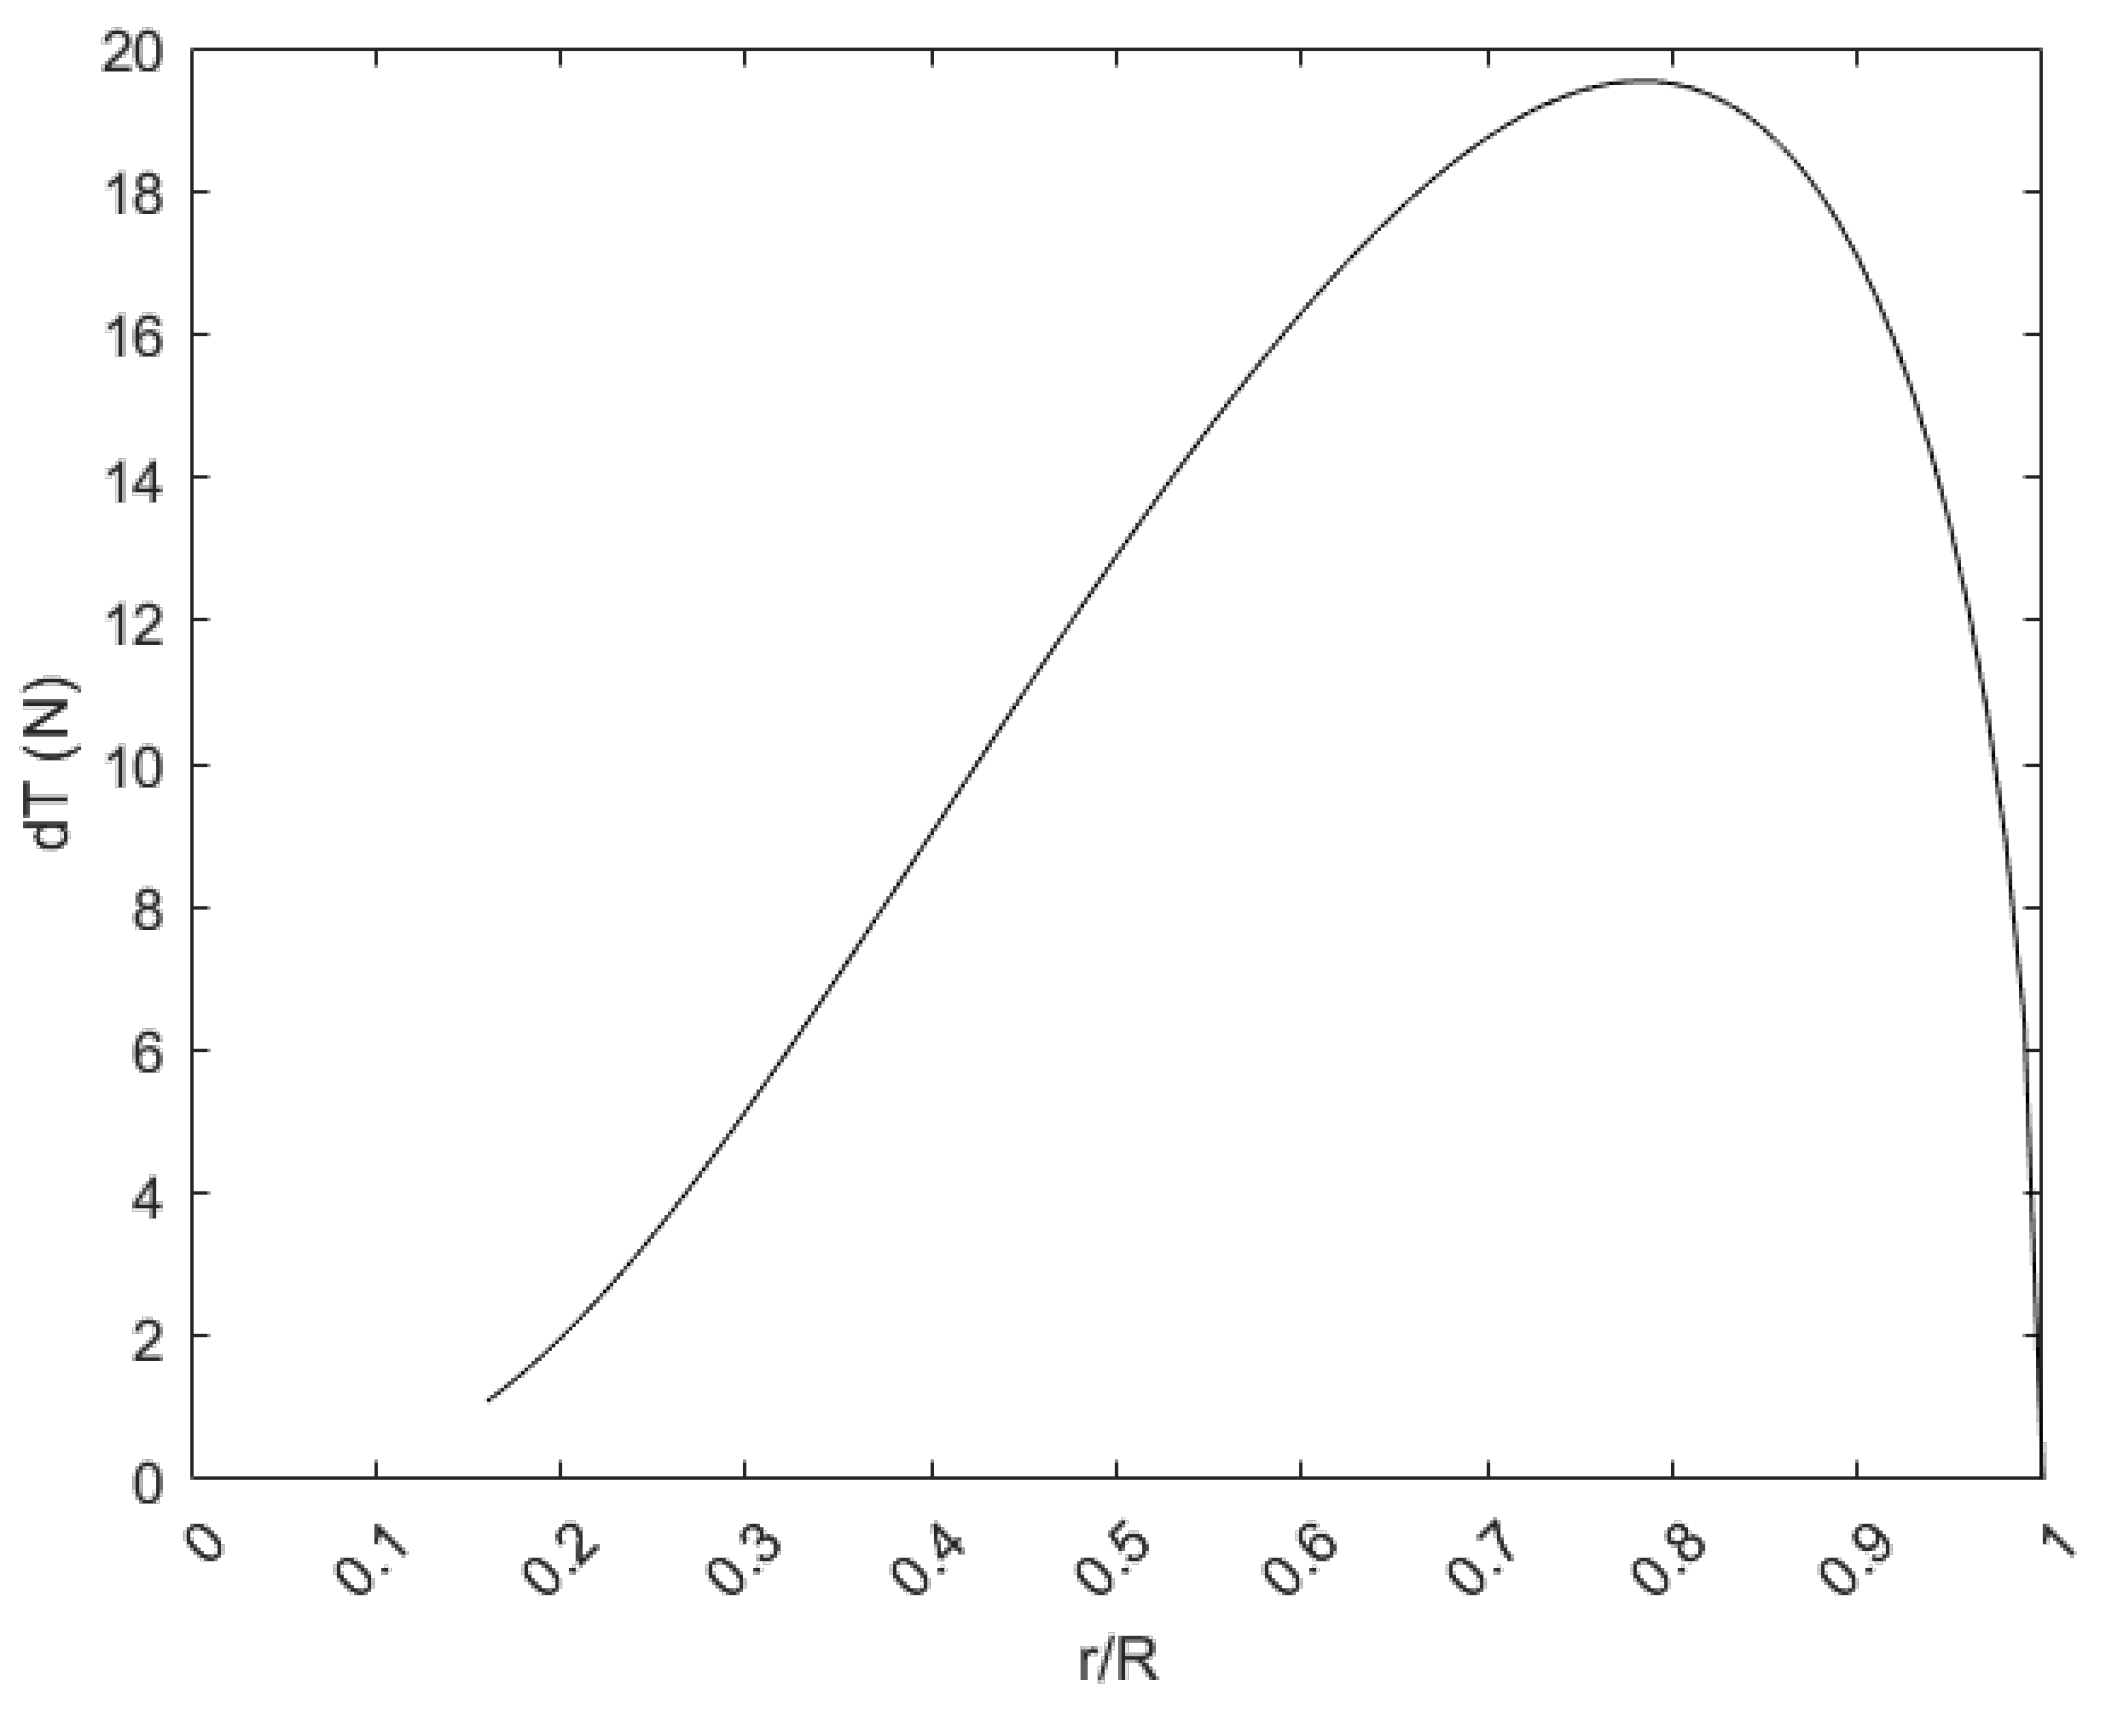
An example thrust distribution, plotted by calculating dT at every radial co-ordinate, is shown in Figure 9.
As can be seen in Figure 9, the majority of the thrust developed by a propeller is between the non-dimensional radii of 0.4 and 0.95. Using numerical integration, it is found that for the example in Figure 9, 85% of the thrust is developed between 0.4 and 0.95 of the propeller radii, but other propellers will yield very similar results. Therefore, in the computer program created for this paper, the program ensures that all blade stations between non-dimensional radii of 0.4 and 0.95 experience Reynolds numbers above the 100,000 threshold.
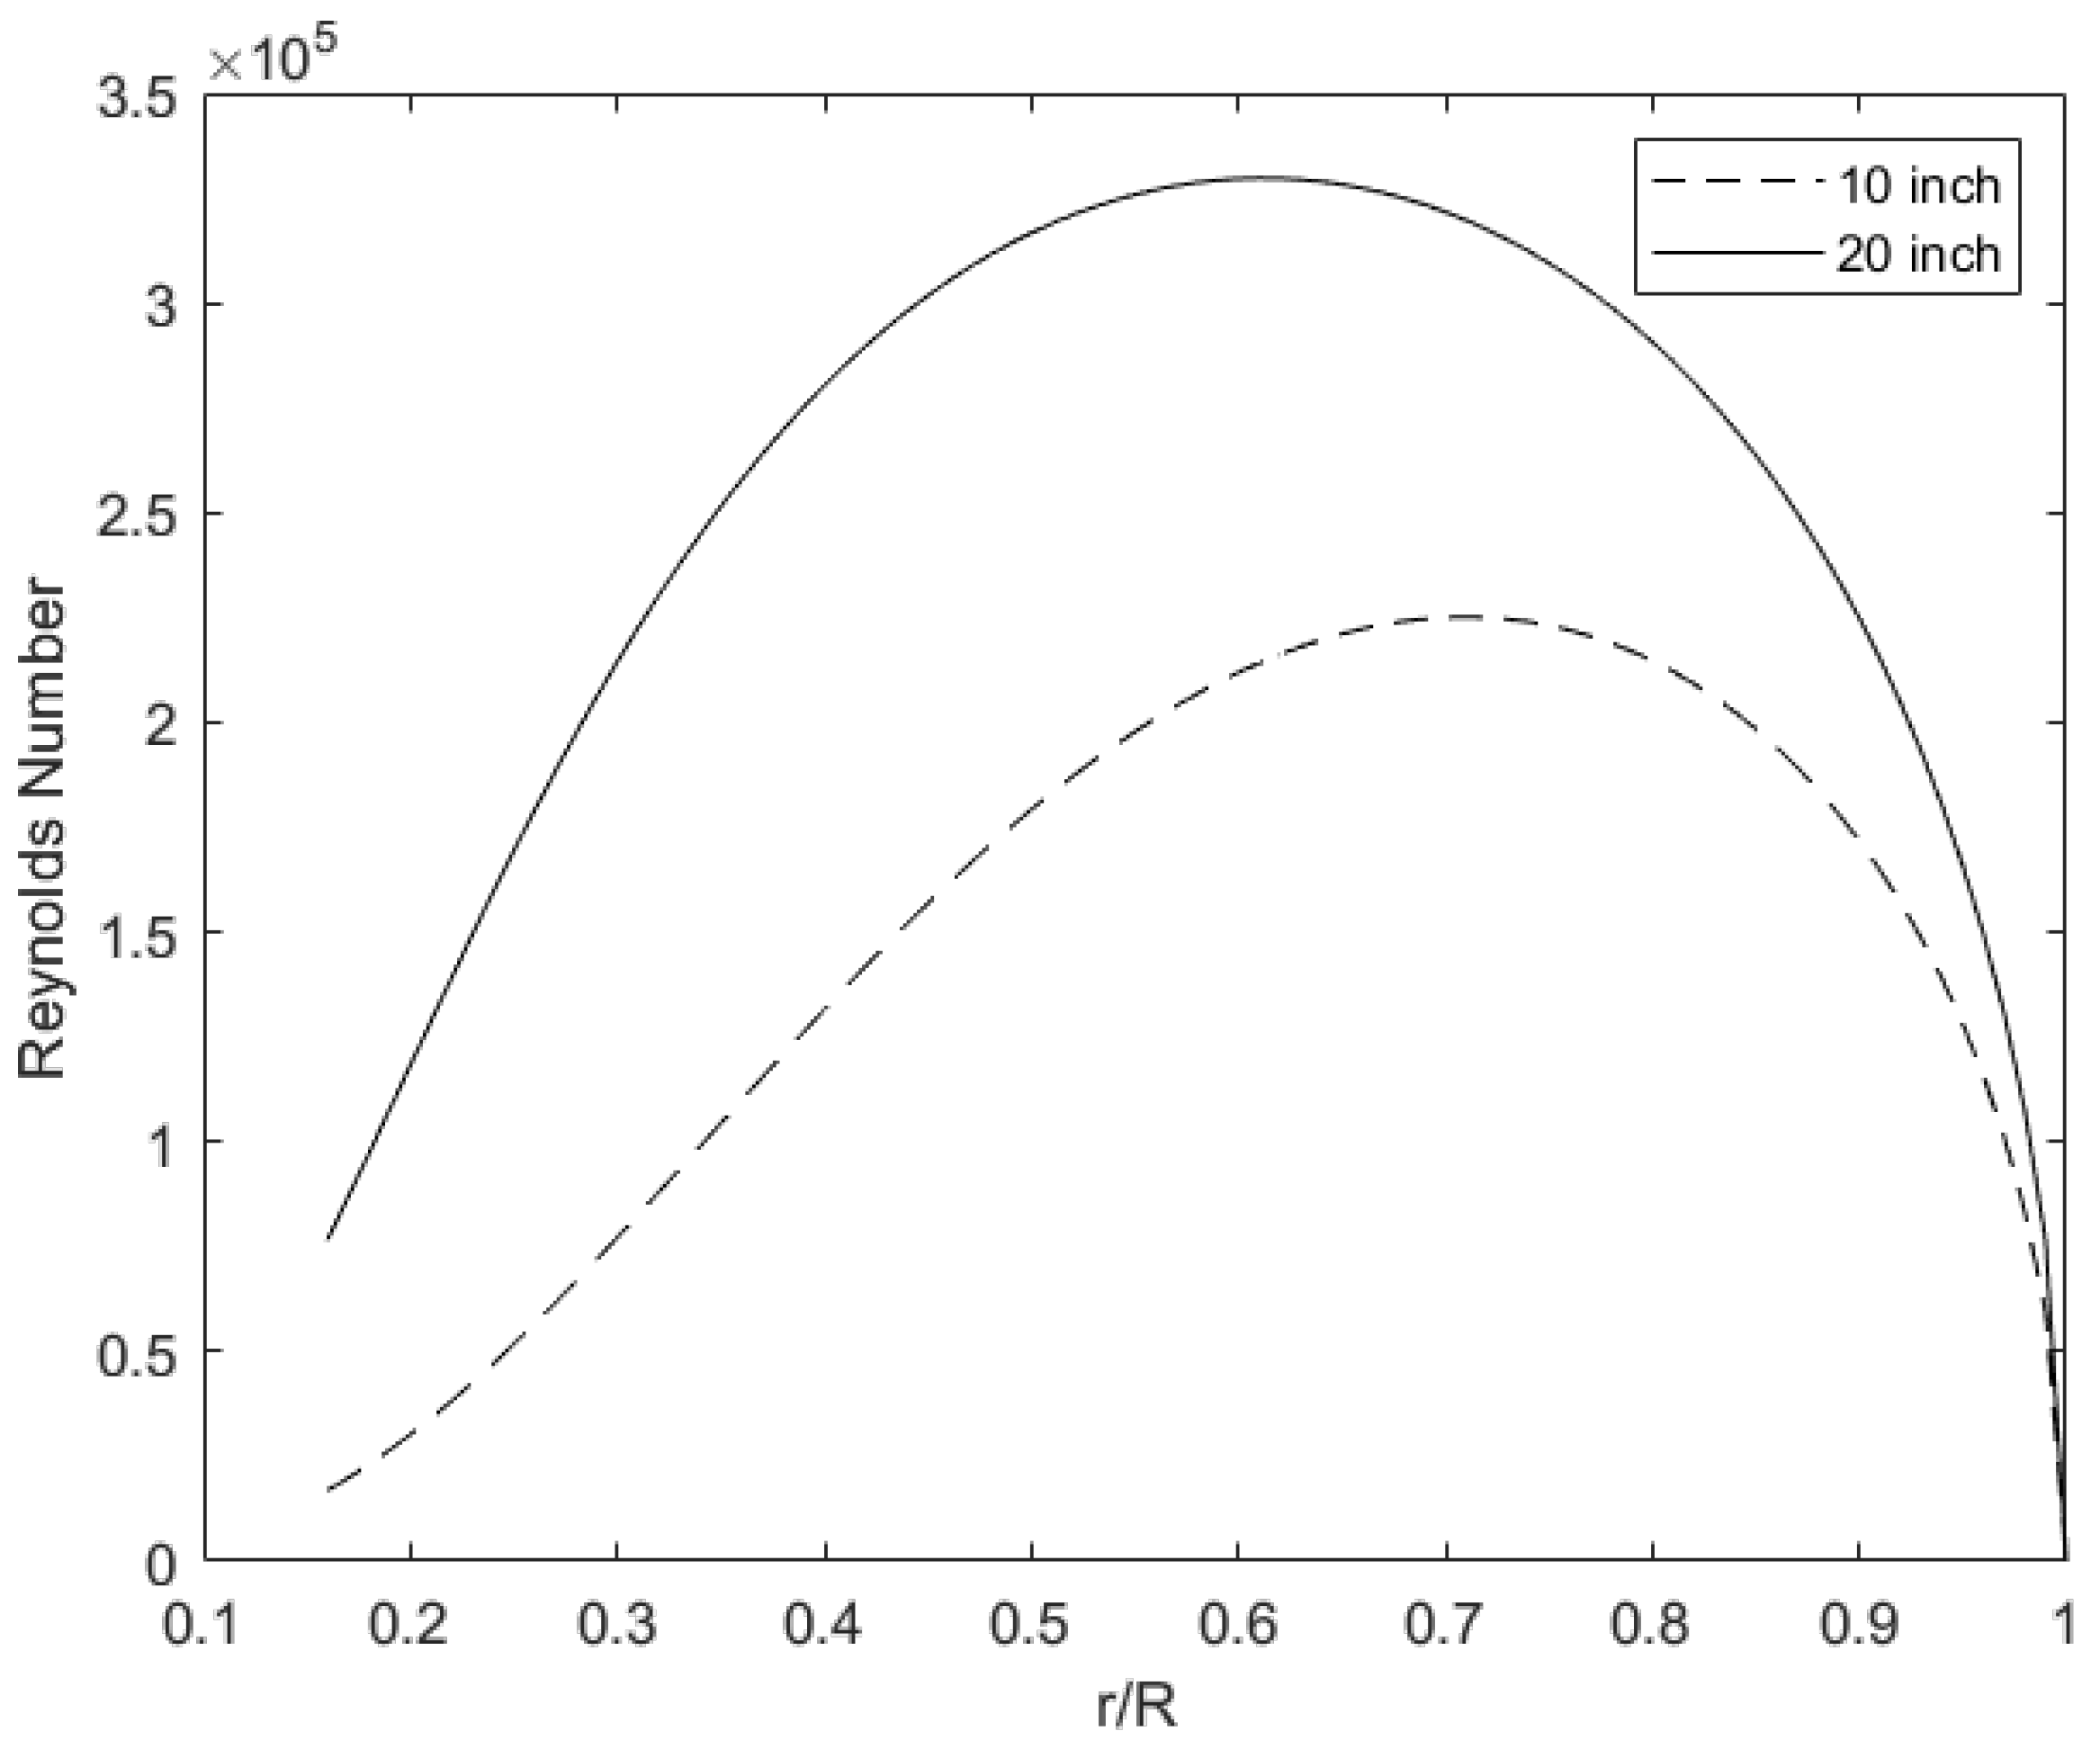
The unmodified Reynolds number distributions of two example propellers are found in Figure 10.
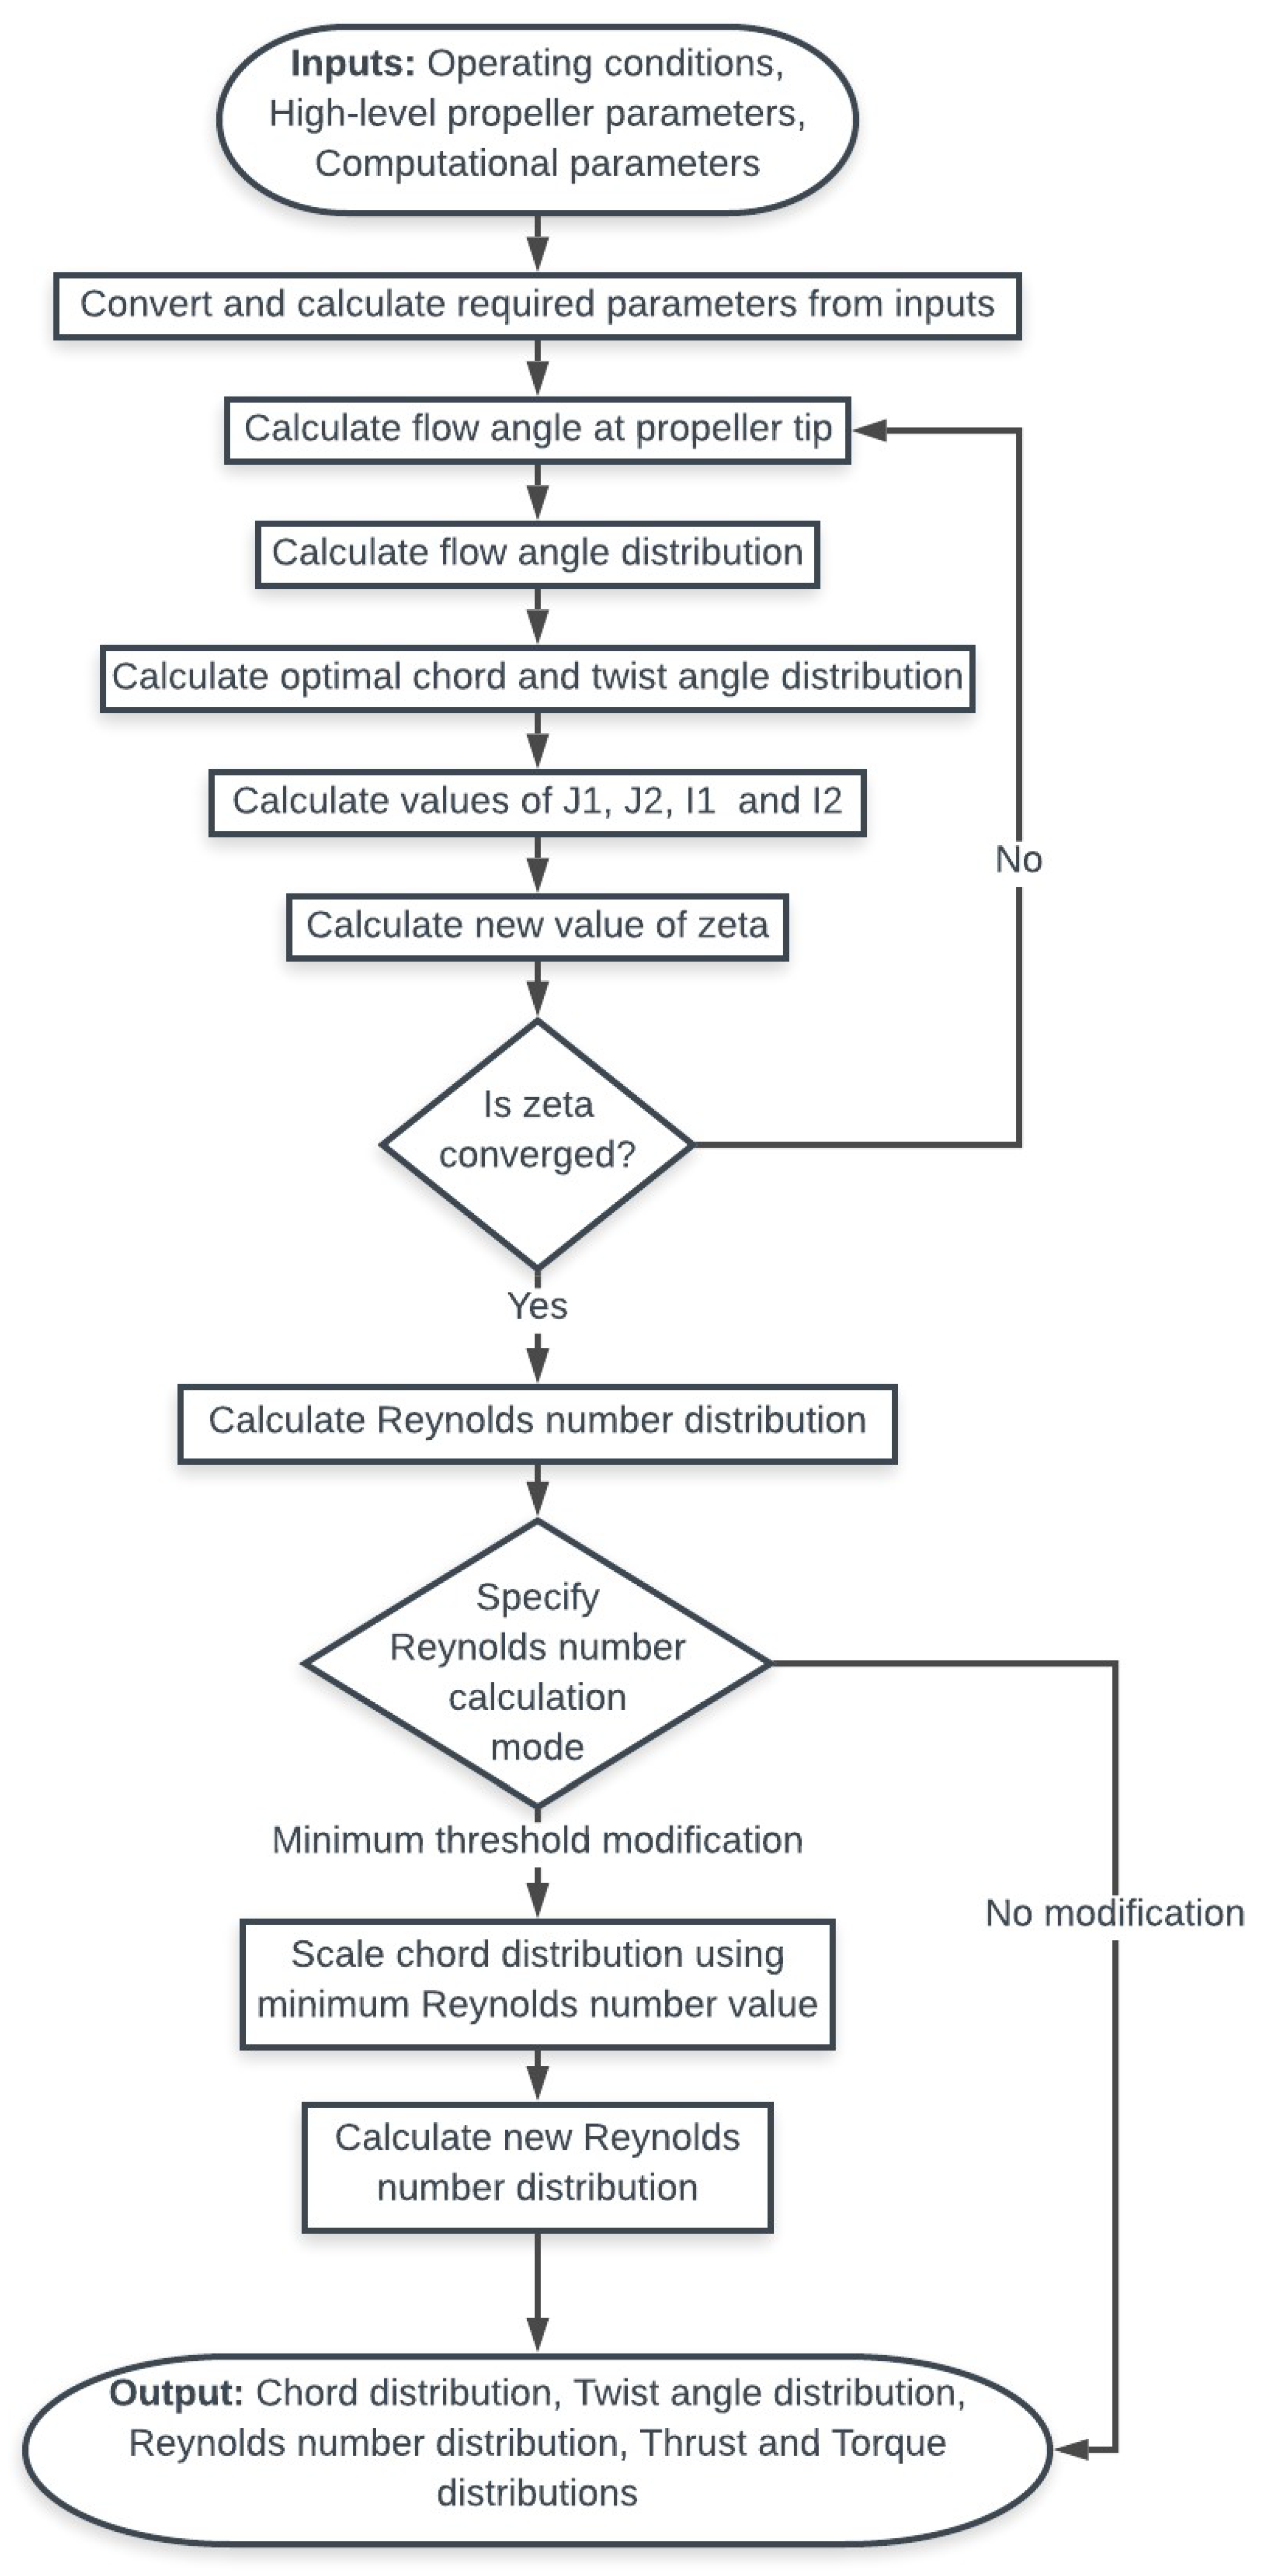
For clarification, a flow chart outlining the basic architecture of the MATLAB program which outputs optimal propeller geometry and subsequently modifies this to minimise the effect of low Reynolds number on propeller efficiency is shown in Figure 11.

3.3. Program User Interface Design

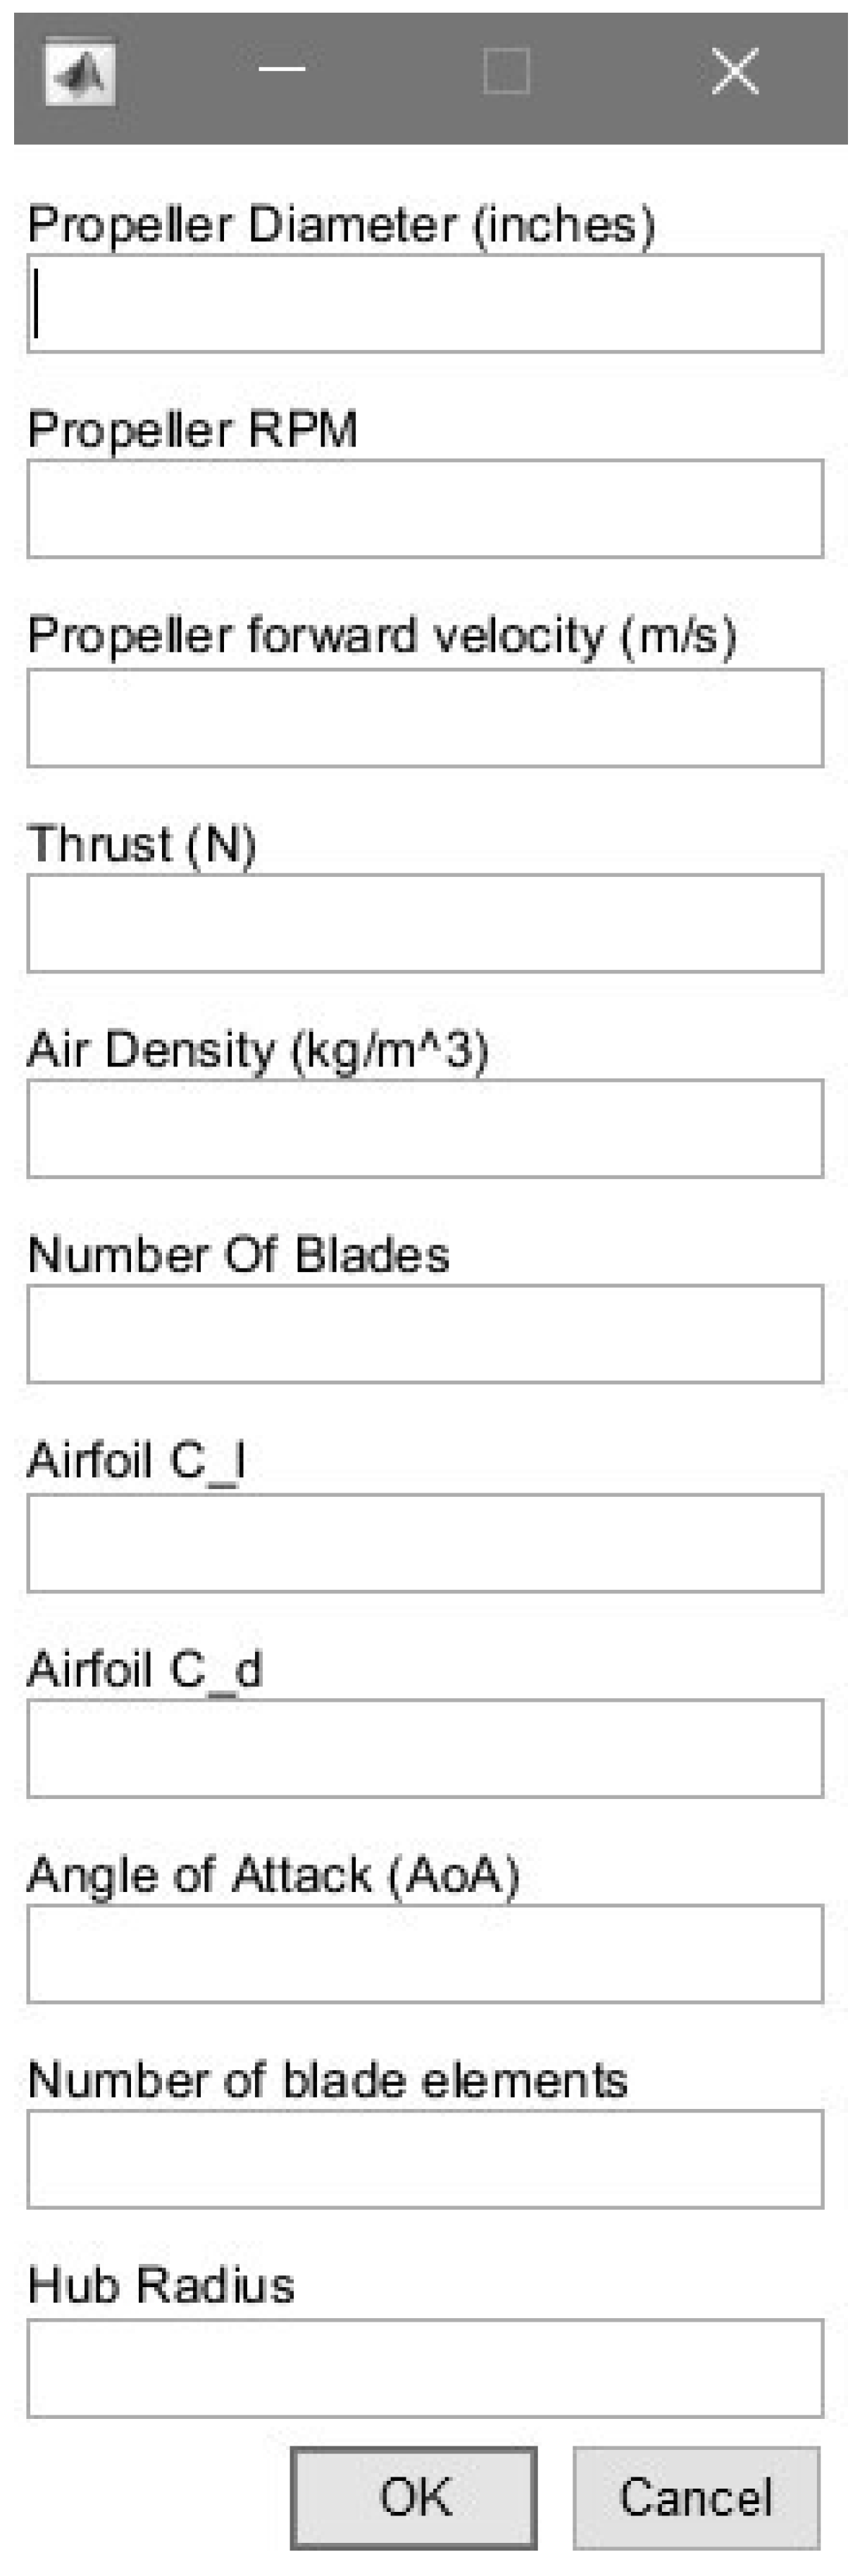
In order to make the MATLAB program user friendly, MATLAB libraries inputdlg() and listdlg() were used to create a series of pop-up windows that ask the user for the inputs required. The user can choose between whether the required thrust or consumed shaft power is known.
Following this, the pop-up window in Figure 12 appears, asking the user for the required inputs. Lift and drag coefficient data can be found in ‘Aerodynamic data banks for Clark-Y, NACA 4-digit and NACA 16-digit airfoil families’ [29].
Following this, a window appears asking the user if they require the Reynolds number chord adjustment. If the user does require this, they are then prompted to input the desired minimum Reynolds number, which by default is 100,000. If not, the code is run as normal. The MATLAB code can be found via a link in Appendix A.

3.4. Validation of the MATLAB Program

In order to validate the MATLAB program, its output was compared to online data for the APC ’Thin Electric’ 10” x 7”, from the UIUC propeller database [2]. Inputs to the program, found in Table 3, were chosen to match the performance of the APC ’Thin Electric’ 10” x 7” propeller. For example, the propeller RPM and forward velocity were chosen to match the advance ratio at which the APC propeller has a maximum efficiency (advance ratio of 0.6). The airfoil coefficients of lift and drag are from the Clark-Y airfoil, which is a common airfoil for propeller design [30,31]. An angle of attack of zero was used, as due to assumptions made in the method the twist angles are large, thus eliminating the requirement for additional angle of attack. The shaft power was approximated by comparing the required shaft powers of propellers of a similar diameter and pitch on the APC database [32].
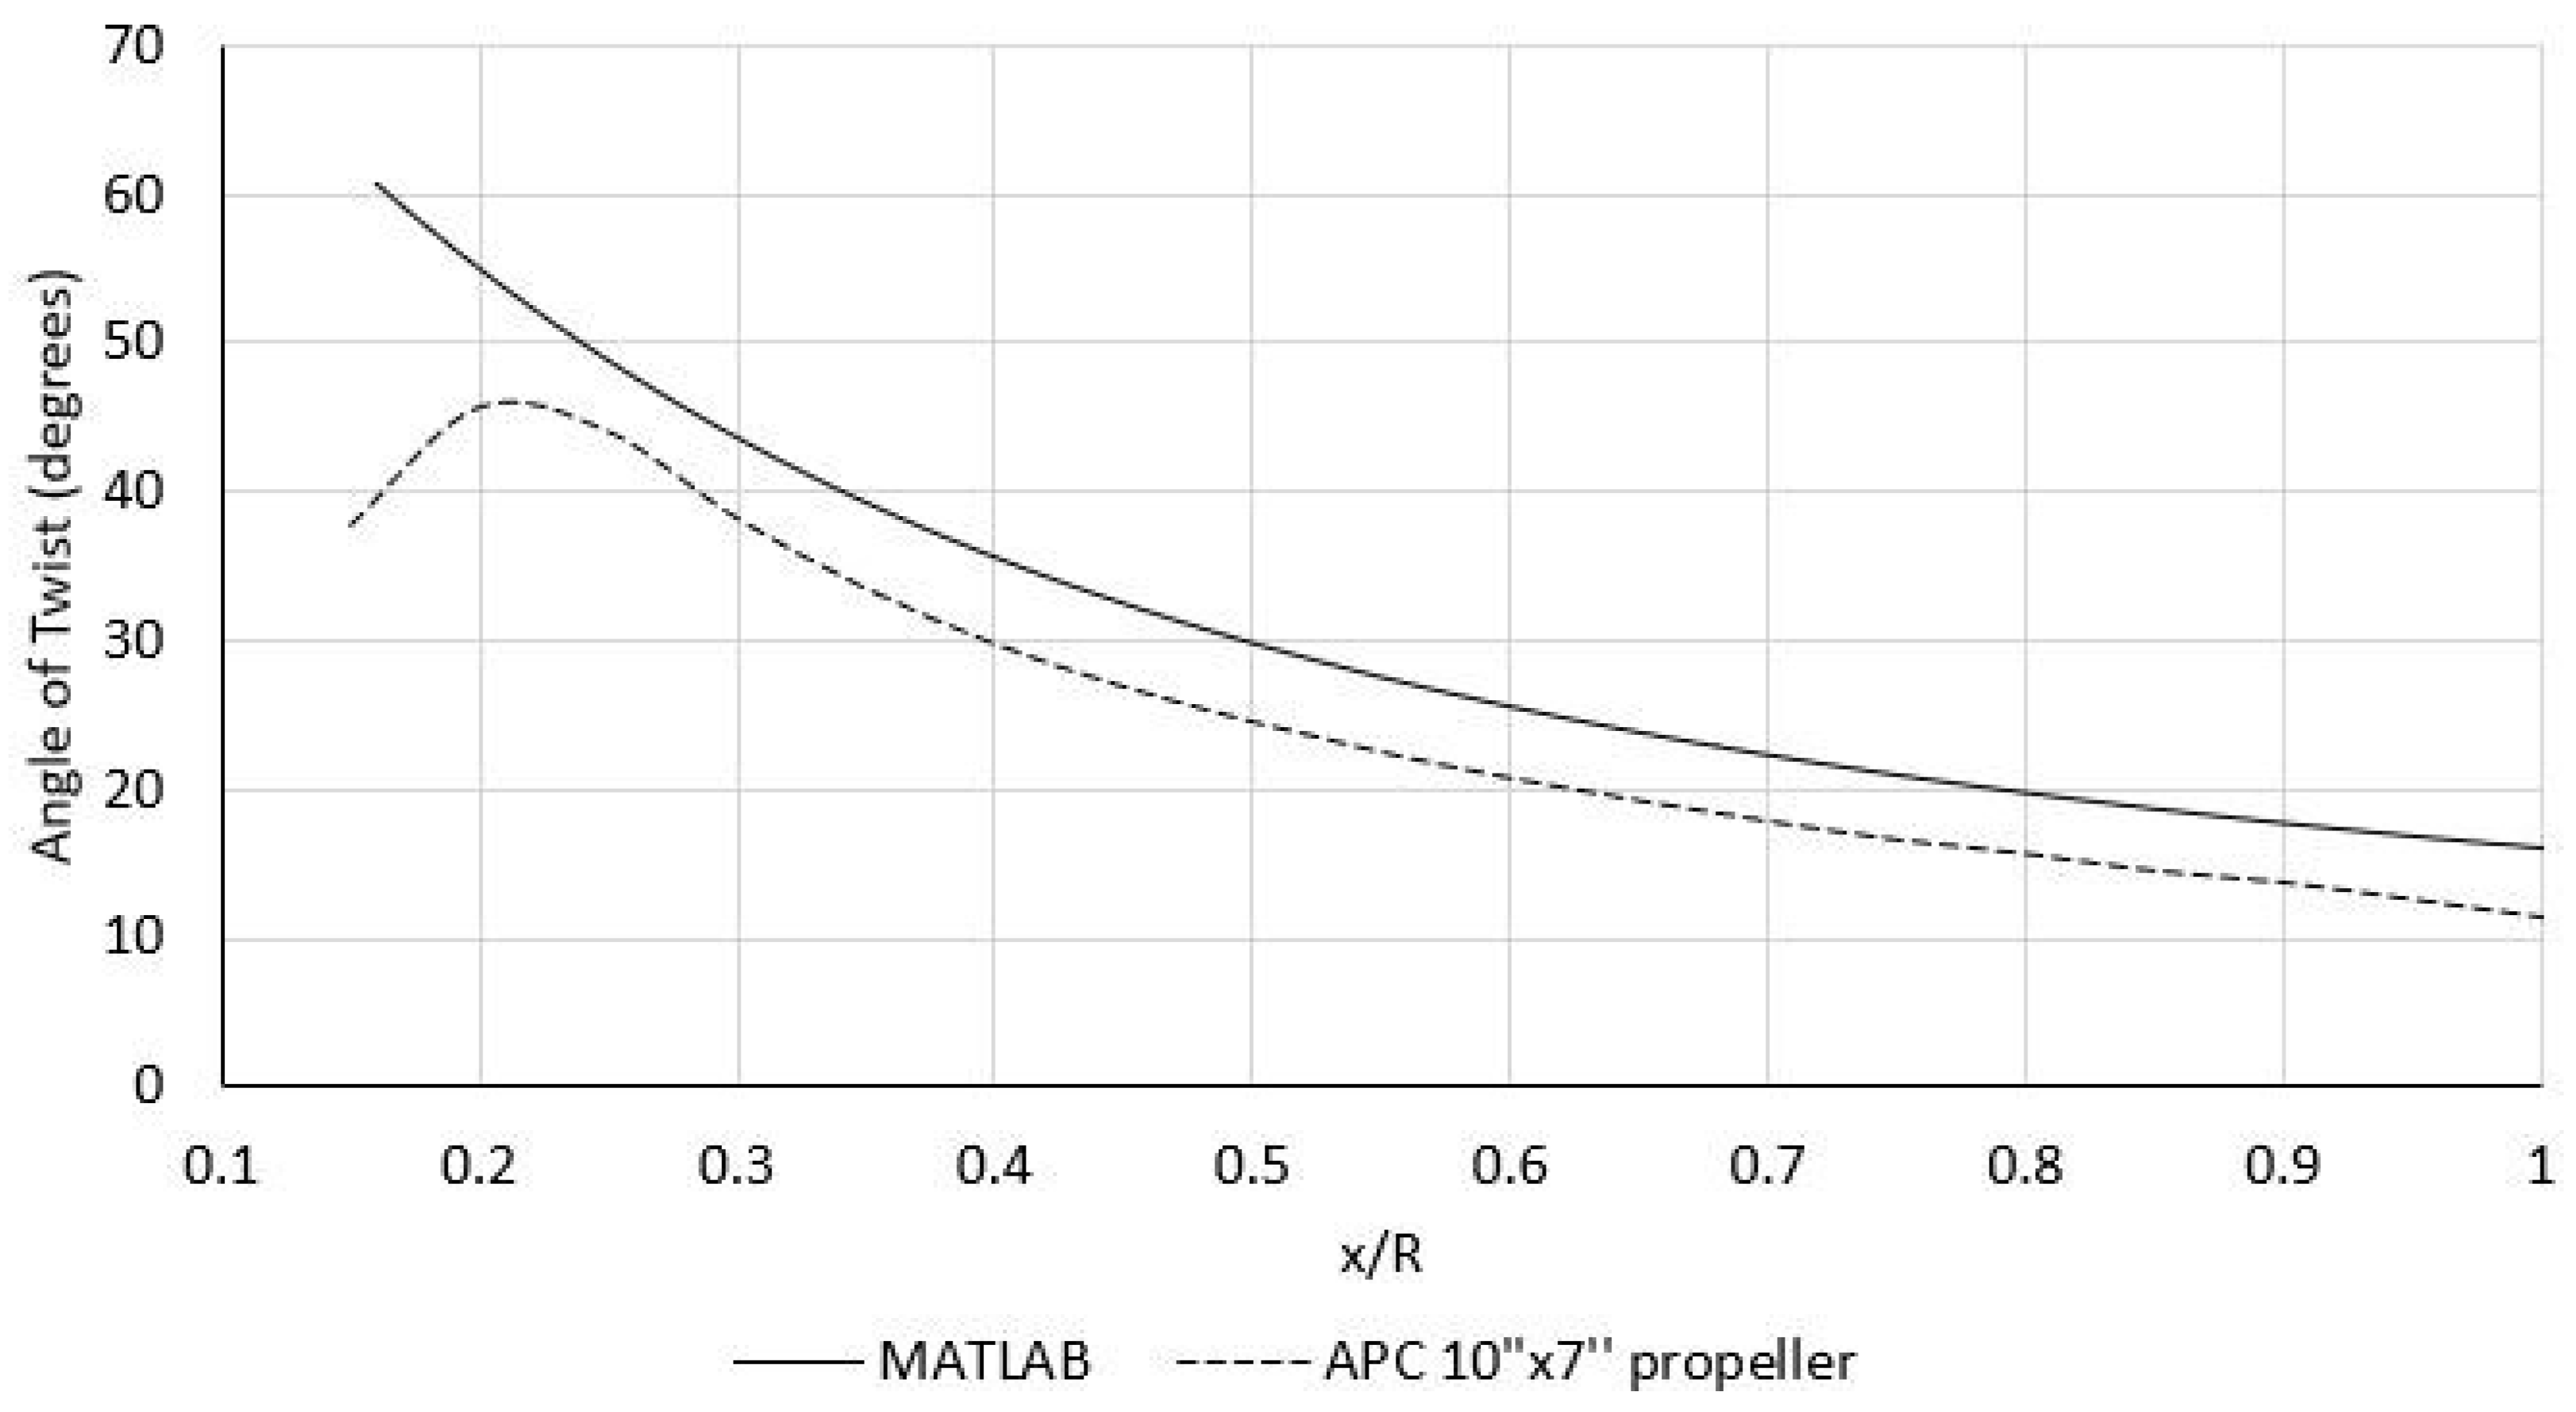
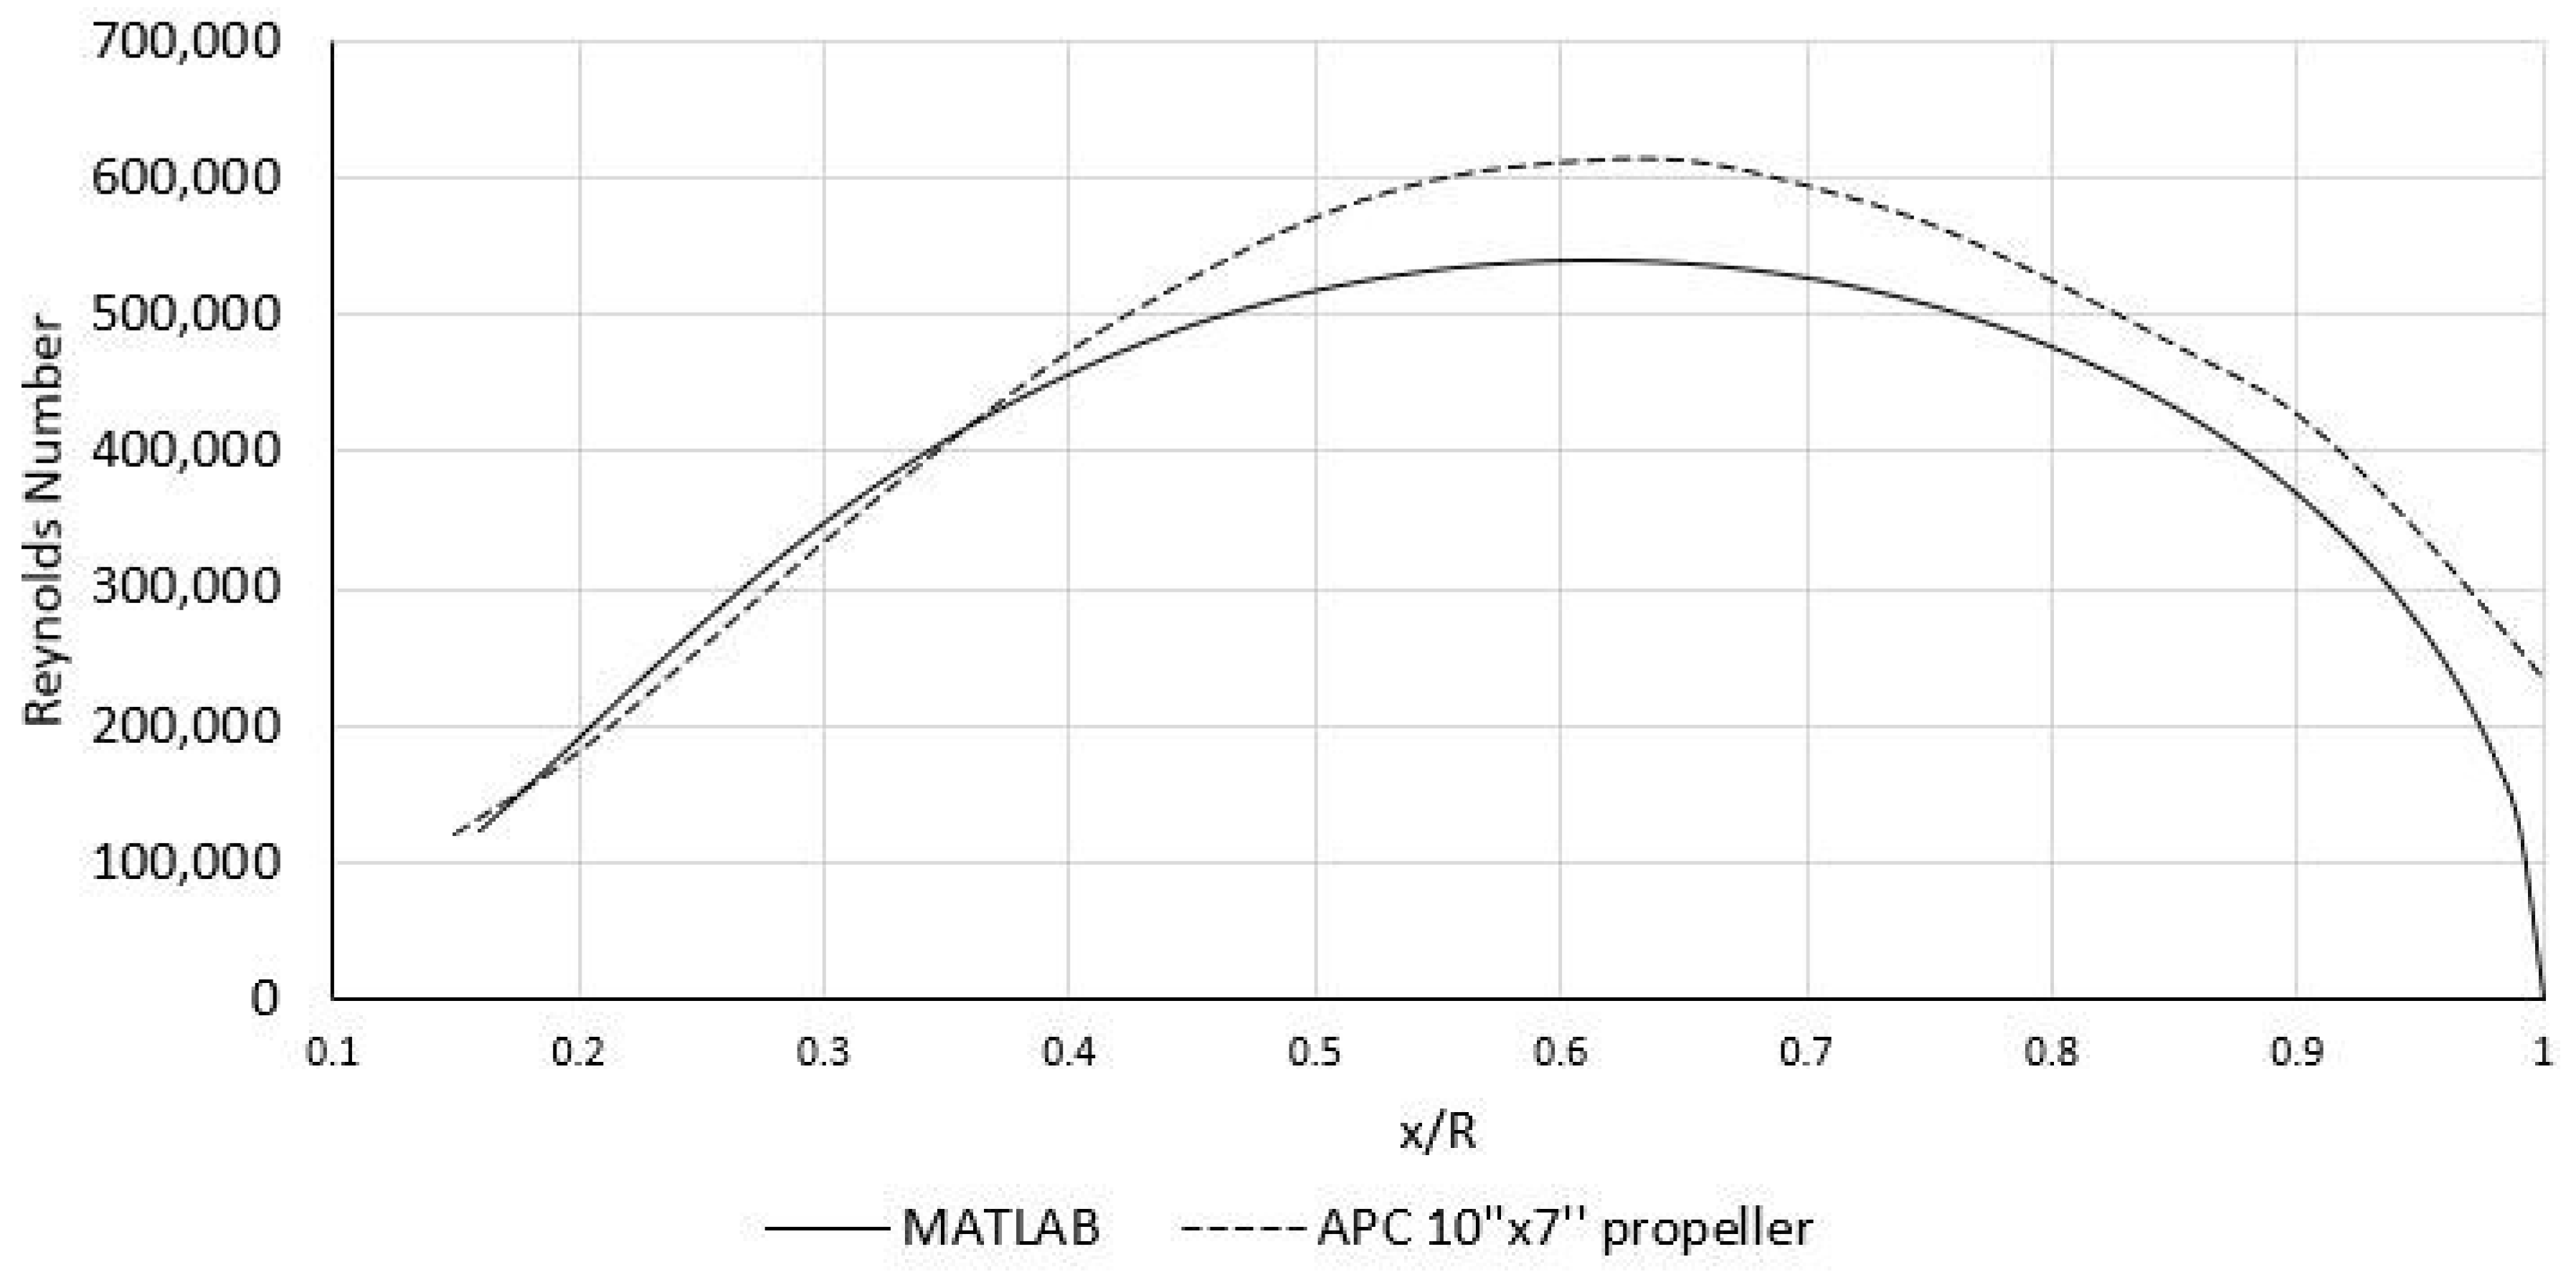
In Figure 13, Figure 14 and Figure 15, the chord, twist and Reynolds number distribution for both the MATLAB program output and the APC ’Thin Electric’ 10” x 7” propeller are plotted.
In Table 4, calculated parameters for both the MATLAB output and the UIUC database wind tunnel measurements can be found. The CT and CP values in Table 4 are for an advance ratio of 0.5751, which is the advance ratio at which the maximum efficiency occurs. Results from the APC propeller database [32] are also included for reference, however these are simulated and not experimental.
As can be seen in Figure 13, Figure 14 and Figure 15, the MATLAB program output closely resembles the geometry of the APC propeller. The APC propeller has larger chord lengths towards the propeller tip, and this is most likely due to structural issues, which the MATLAB program does not consider. Finally, there is a significant difference (16%) between the maximum propulsive efficiencies, the main source of which being the assumptions of light-loading, incompressible flow and zero tip losses made in the MATLAB program method. On the contrary, there is only a 2% difference between the UIUC wind tunnel test data and the APC simulation database. The smaller difference is most likely due to similar assumptions made in both calculation processes. However, the fact that the MATLAB program computes an optimized geometric profile in terms of the blade twist and blade chord, as well as computes these using a baseline Re number of 100,000 may mean that this is a better propeller design in terms of propulsion efficiency. Note that the MATLAB code produces a higher pitch over the spanwise radius, r of the propeller.

4. Discussion

In this paper, the efficiency of propellers used for small drones has been examined, and various ways of improving their efficiency have been evaluated.
This was first done by developing a MATLAB code, based on an optimisation method described in various literature on propeller theory. For a set of inputs specified by the user, the code will output a full chord and twist distribution for an optimal propeller blade. A function allowing the user to modify the chord distribution to ensure the blade was operating above a given Reynolds number threshold was then added. Another function was programmed which enabled the user to view the thrust and torque distributions along the blade. Finally, a case study comparing results from the MATLAB code to published results for a similar propeller, the APC ’Thin Electric’ 10” x 7”. This case study validated the MATLAB code, proving that it could be a useful tool to use for designing optimum propellers.
Summary:
  • A MATLAB tool has been developed, which takes inputs from the end user and calculates the optimal propeller geometry. The code is both fast, reliable and easy to use.
  • Theoretically, the propeller design created will achieve higher efficiencies at a range of RPM values than commercially available propellers. From the MATLAB code, it was calculated that whilst operating at 6,500 RPM, an efficiency of 0.87 can be expected.

4.1. Recommendations for Further Work

The research and design work that has been undertaken for this paper has highlighted several areas in which further research could be beneficial.
The MATLAB tool developed in this study outputs a plot of chord and twist distributions for an optimum design based on end user input. These distributions then have to be manually converted into a set of airfoil curves, which are then linked by a surface loft in the SolidWorks CAD program. If a program which automated this process, and automatically output a SolidWorks file could be created, this would reduce the design time of optimal propellers to a fraction of the time it currently takes to complete the manual process. The MATLAB code could also be improved by incorporating tip loss calculations into the optimisation process, as in the current code tip losses are neglected. Furthermore, the code could also be designed to calculate the optimal blade winglet profile to reduce the losses from wingtip vortices. Finally, the code could be modified so that the user is warned when the propeller tip speed is approaching transonic speeds of Mach 0.8. This would make it easier for the user to avoid the compressibility effects and shock waves that are associated with such tip speeds.

Author Contributions

This research article was written by both authors, the individual contributions are as follows: Conceptualization, S.P. and D.N.; methodology, S.P. and D.N.; software, D.N.; validation, S.P. and D.N..; formal analysis, D.N.; investigation, S.P. and D.N.; resources, S.P.; data curation, S.P. and D.N.; writing—original draft preparation, S.P. and D.N.; writing—review and editing, S.P. and D.N.; visualization, S.P. and D.N.; supervision, S.P.; project administration, S.P.; funding acquisition, S.P. All authors have read and agreed to the published version of the manuscript.

Funding

This research was funded by the Engineering and Physical Sciences Research Council (EPSRC), grant number (EP/V05614X/1), entitled “Aerodynamics and aeroacoustics of closely coupled rotors”.

Data Availability Statement

A range of propeller test data is available online via the UIUC Propeller Data Site, Department of Aerospace Engineering, Vol. 1-4. This can be accessed for free from: https://m-selig.ae.illinois.edu/props/propDB.html

Acknowledgments

We hereby acknowledge the administrative and technical support from within the University of Southampton, which enabled this work to be undertaken.

Conflicts of Interest

The authors declare no conflicts of interest. The funders had no role in the design of the study; in the collection, analyses, or interpretation of data; in the writing of the manuscript; or in the decision to publish the results.

Nomenclature

A Propeller disc area (m2)
B Number of propeller blades
c Blade chord length (m)
D Propeller diameter (inches)
F Prandtl’s momentum loss factor
G Circulation function
I1 Thrust loading integral
I2 Thrust loading integral
J Propeller advance ratio, V/n D
J1 Power Loading integral
J2 Power Loading integral
n Number of complete revolutions per second
p Propeller pitch (inches)
P Shaft power consumed by propeller (W)
Q Propeller shaft torque (Nm)
r Distance along the propeller radius (m)
R Propeller blade radius (m)
T Thrust produced by the propeller (N)
V Freestream velocity (m/s)
V1 Displacement velocity (m/s)
W Total local velocity (m/s)
cD Airfoil section coefficient of drag
cL Airfoil section coefficient of lift
CT Thrust Coefficient
CP Power Coefficient
CQ Torque Coefficient
mblade Mass of a propeller blade (kg)
Pc Design Power Coefficient
Tc Design Thrust Coefficient
v, Displacement velocity (m/s)
waxial Induced axial velocity component (m/s)
wswirl Induced swirl velocity component (m/s)
xblade Extension of a propeller blade (m)
xCoG Distance from centre of rotation to propeller blade centre of gravity (m)
Re Reynolds number
Greek Symbols
α Propeller blade angle of attack (degree)
β Propeller blade angle of twist (degree)
ζ Displacement velocity ratio, v1/V
ηp Propeller efficiency, Tc/Pc ≡ J CT/CP
µ Viscosity of air (kgm−1 s−1)
ξ Non-dimensional radius, r/R
Γ Circulation (m2/sec)
ρ Air density (kgm−3)
σ Rotor solidity
Propeller angular speed (rad/s)
φ Flow angle (degree)
φs Wake helix angle (degree)
φt Flow angle at propeller blade tip (degree)

Appendix A—MATLAB Program Code

The 226-line MATLAB program code entitled ‘Prop_Analysis_V3.m’ is available online: https://app.box.com/s/ozf91uzaz79rsxzvtauknh5ygc2giwgc

References

  1. Archer, R.D.; Saarlas, M. An Introduction to Aerospace Propulsion, 1st Ed. Prentice Hall, US, 1996. pp. 68–121. ISBN: 978-0131204966.
  2. Brandt, J.; Deters, R.; Ananda, G.; Selig, M. UIUC Propeller Database. Available online: https://m-selig.ae.illinois.edu/props/propDB.html, Oct. 2019. University of Illinois at Urbana-Champaign. (Accessed on 10 May 2024).
  3. Bhagwat, M. J. (2015). Optimum Loading and Induced Swirl Effects in Hover. Journal of the American Helicopter Society, 60(1), 1-14. [CrossRef]
  4. Sampath, R. An Investigation into UAV Scale Propellers. Master’s Thesis, University of Southampton, Southampton, UK, 2017. [Google Scholar]
  5. Mejzlik Propellers. Available online: https://www.mejzlik.eu/technical-data/propeller_data, (accessed on 28 May 2024).
  6. Weishaeupl, A. Evaluating the Performance of Scale Propellers Using the Heliciel Software and RCBenchmark Thrust Stands, Master’s Thesis, University of Southampton, Southampton, UK, 2018. [Google Scholar]
  7. Reynolds, E.; Barnaby, S,; Wingfield, C,; Cowper, W.J.E.,; Rigg, A.,; Stromeyer, C.E,; Thornycroft, J.T,; Froude, R.E,; and Greenhill, A.G. The Screw Propeller, In: Minutes of the Proceedings of the Institution of Civil Engineers, pp. 390–392, 1890.
  8. Drzewiecki, S. Méthode pour la détermination des éléments mécaniques des propulseurs hélicoïdaux. imprimerie Gauthier-Villars et Fils, 1892. (in French).
  9. Weick, F. Simplified Propeller Design for Low-Powered Airplanes, NASA Technical Note 212, 1925.
  10. Glauert, H. Airplane Propellers, In: Aerodynamic Theory, Durand, W.F., Ed. pp. 169–360, Springer Berlin Heidelberg, Germany. 1935. [CrossRef]
  11. Stickle, G.; and Crigler, J. Propeller Analysis from Experimental Data, National Advisory Committee for Aeronautics - Report Number 712, 1940.
  12. Theodorsen, T. Theory of Propellers. McGraw-Hill Book Company, 1st ed., 1948.
  13. McMasters, J. and Henderson, M. Low-Speed Single Element Airfoil Synthesis. Boeing Commercial Airplane Co., 1979.
  14. Gamble, D.E. Automated Dynamic Propeller Testing at Low Reynolds Numbers. Master’s Thesis, Oklahoma State University, Oklahoma, US, 2009. [Google Scholar]
  15. Koch, L.D. Design and Performance Calculations of a Propeller for very High-Altitude Flight, Master’s Thesis, Case Western Reserve University, Cleveland, Ohio, US, 1998. [Google Scholar]
  16. Merchant, M.P. Propeller Performance Measurement for Low Reynolds Number Unmanned Aerial Vehicle Applications. Master’s Thesis, Wichita State University, Kansas, US, 2004. [Google Scholar]
  17. Carvalho, I.M. Low Reynolds Propellers for Increased Quadcopters Endurance, Master’s Thesis, Universidade da Beira Interior, Covilhã, Portugal, 2013. [Google Scholar]
  18. Silvestre, M.A.R.; Morgardo, J,; Alves, P,; Santos, P,; Gamboa, P,; and Pa’scoa, J.C. Propeller Performance Measurements at Low Reynolds Numbers, International Journal of Mechanics, vol. 9, 2015, ISSN: 1998-4448.
  19. Kuantama, E.; Craciun, D.; Tarca, I. and Tarca, R. Quadcopter Propeller Design and Performance Analysis, In: New Advances in Mechanisms, Mechanical Transmissions and Robotics, pp. 269–277, Springer International Publishing, Oct 2016. [CrossRef]
  20. Prior, S.D. Optimizing Small Multi-Rotor Unmanned Aircraft, Ch. 5, pp. 33–64. Taylor & Francis, London, UK. 2018. ISBN: 978-1138369887.
  21. Ning, Z. and Hu, H. An Experimental Study on the Aerodynamic and Aeroacoustic Performances of a Bio-inspired UAV Propeller, In: 35th AIAA Applied Aerodynamics Conference, American Institute of Aeronautics and Astronautics, June 2017. [CrossRef]
  22. Larrabee, E.E. Design of Propellers for Motorsoarers, NASA Publication: The Science and Technology of Low Speed and Motorless Flight, 1 January 1979.
  23. Adkins, C. and Liebeck, R. Design of Optimum Propellers, Journal of Propulsion and Power, vol. 10, no. 5, 1994. [CrossRef]
  24. Betz, A. and Prandtl, L. Screw Propellers with Minimum Energy Loss, Gottingen Reports, pp. 193– 213, 1919.
  25. Goldstein, S. On the Vortex Theory of Screw Propellers, In: Proceedings of the Royal Society of London, Series A, vol. 123, pp. 440–465, 1929.
  26. Klesa, J. Increasing of Aircraft Propeller Efficiency by using Variable Twist Propeller Blades, 2008. Available online: https://stc.fs.cvut.cz/history/2008/sbornik/Papers/D2/Klesa_Jan_12122.pdf (accessed on 28 May 2024).
  27. JavaFoil. Available online: https://www.mh-aerotools.de/airfoils/javafoil.htm (accessed on 10 June 2024).
  28. Drela, M. QProp. Available online: https://web.mit.edu/drela/Public/web/qprop/ (accessed on 1 June 2024).
  29. Leishman, G.J. Principles of Helicopter Aerodynamics. 2nd Ed. Cambridge University Press, Cambridge, UK. 2016. ISBN: 978-1107013353.
  30. Korkan, K.; Camba, J.; and Morris, P. Aerodynamic Databanks for Clark-Y, NACA 4-digit and NACA 16-series Airfoil Families, Technical Report, Aerospace Engineering Department, Texas A&M University, Texas, US. 1986.
  31. Airfoil Tools, Airfoil Database (1,638 Airfoils). Available online: http://airfoiltools.com/search/index (accessed on 10 June 2024).
  32. Advanced Precision Composites, “APC Propeller Performance Data.”. Available online: https://www.apcprop.com/technical-information/performance-data/, (accessed on 28 May 2024).
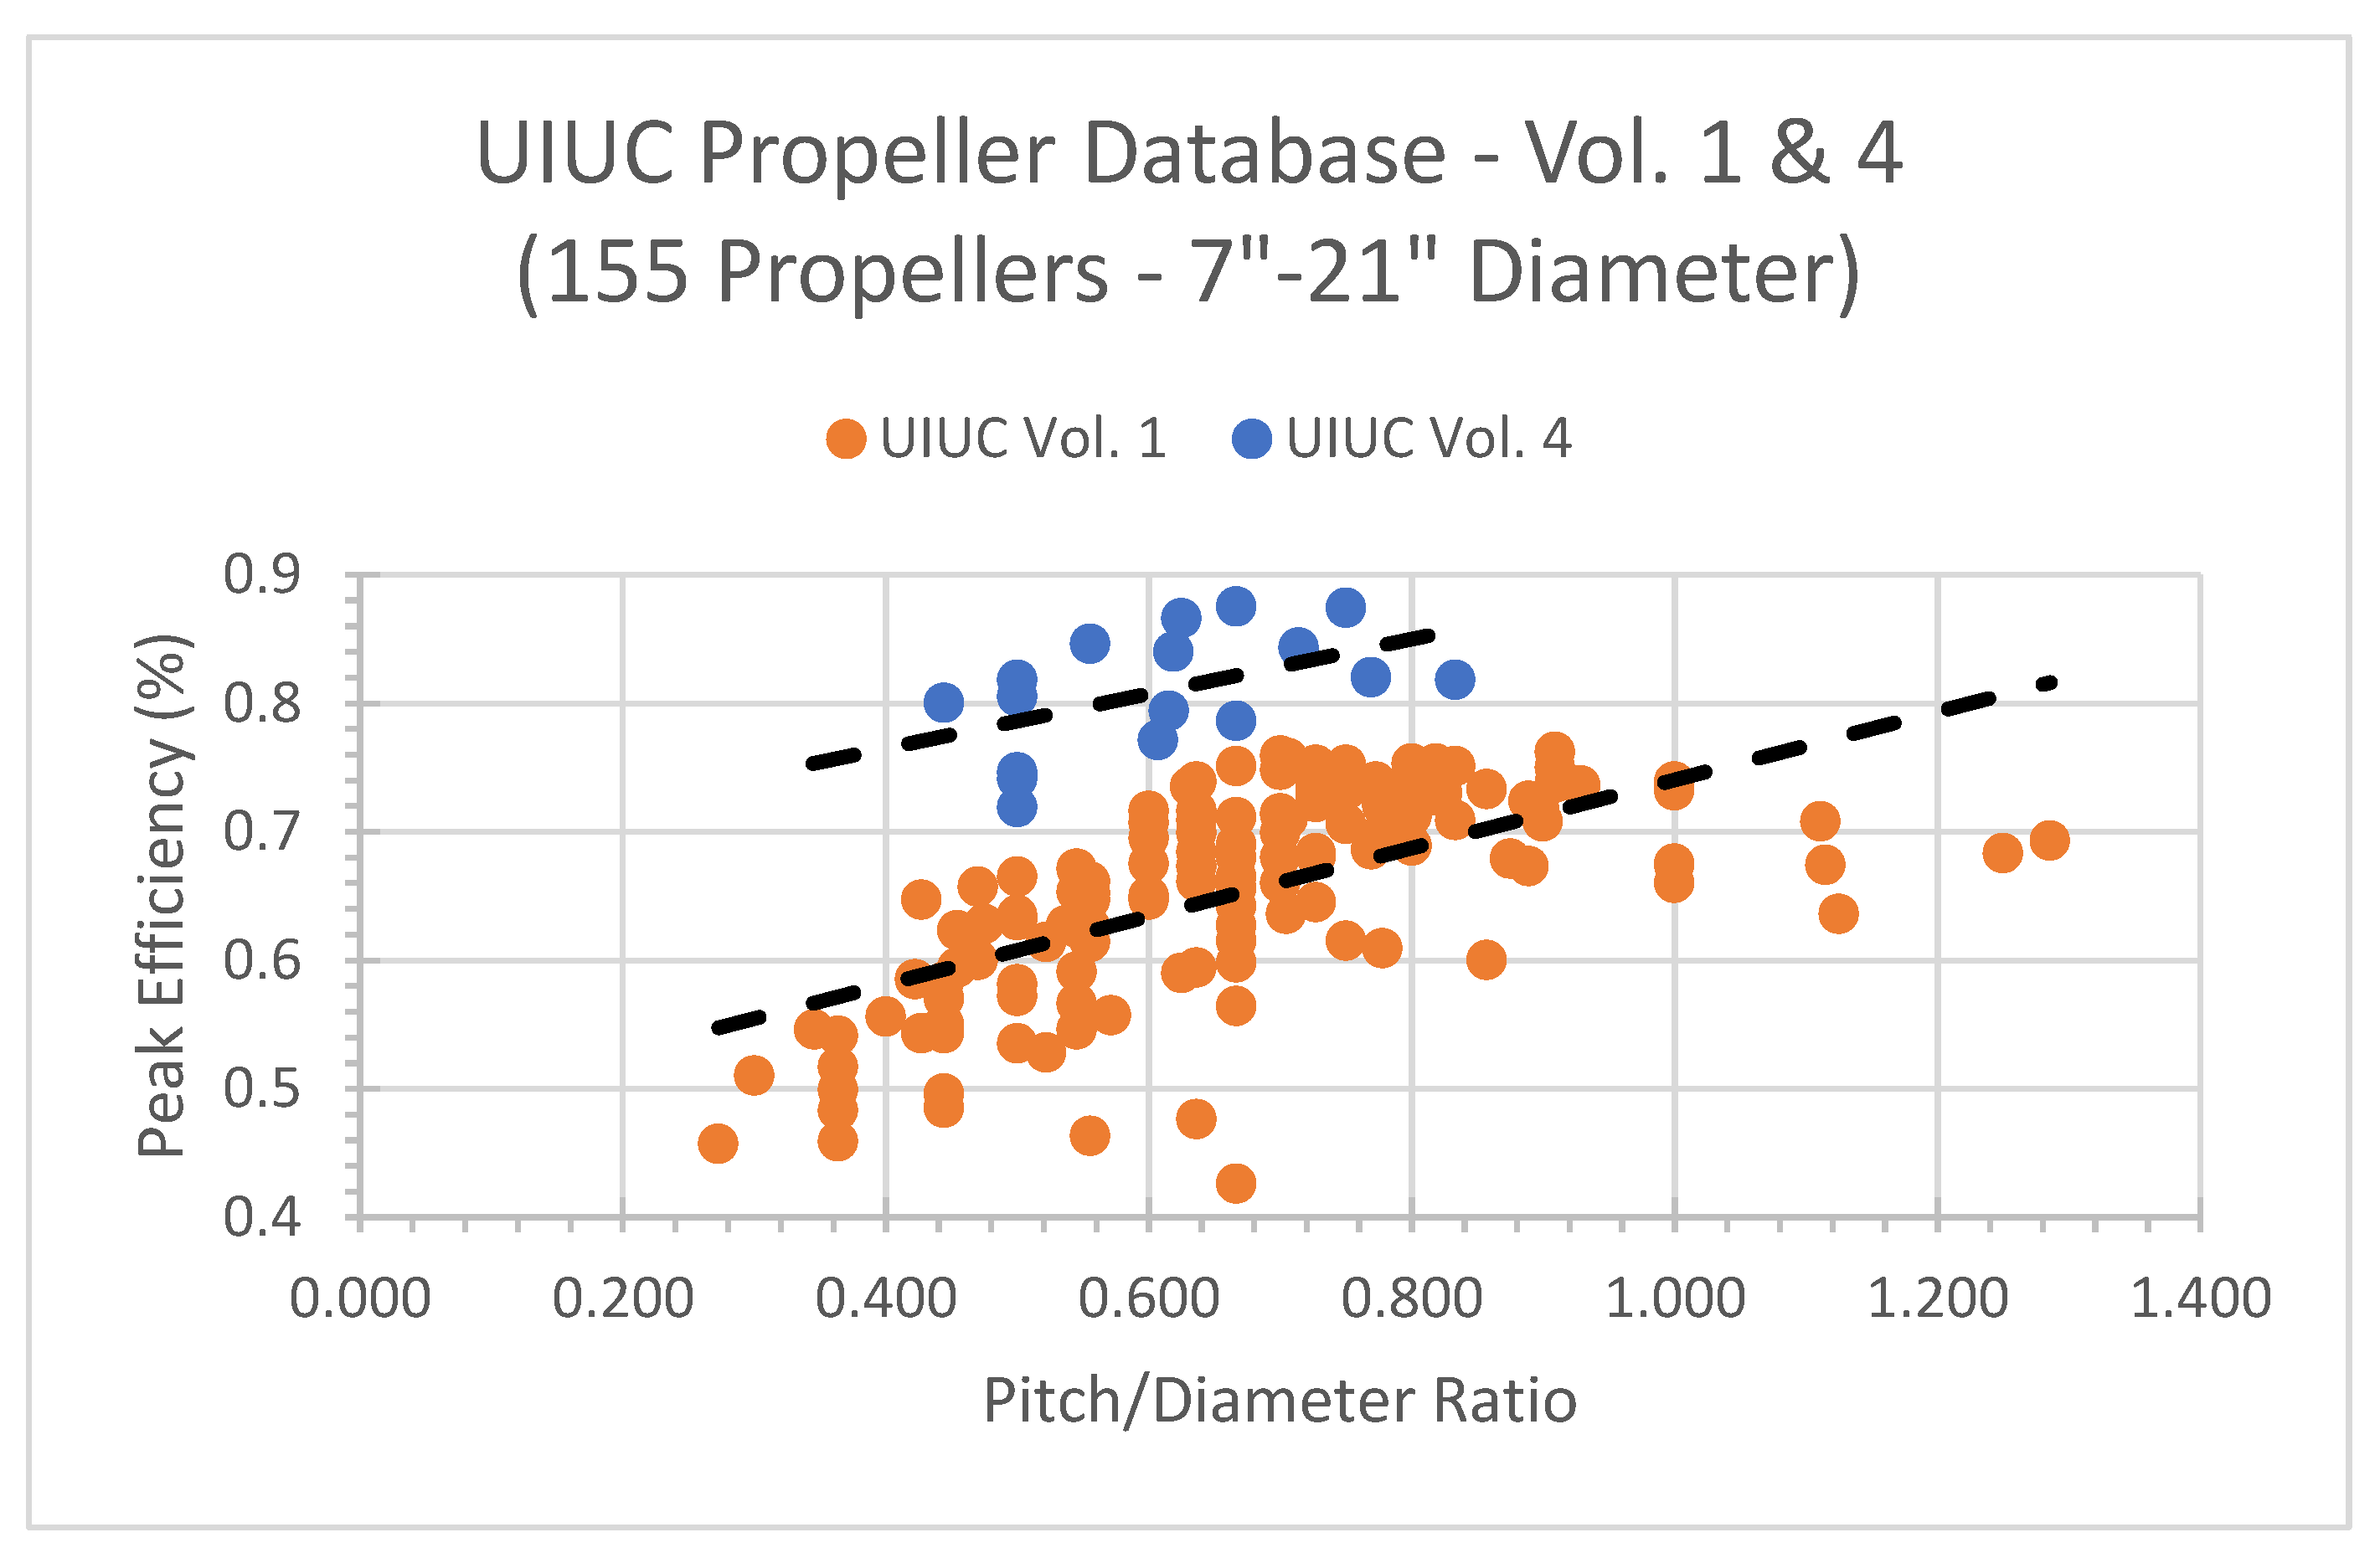
Figure 1. Propeller peak efficiency increase with pitch/diameter ratio (UUIC Database) [2]. Note: This data has been extracted from the database and transformed by the authors to produce this graph.
Preprints 109682 g001
Figure 2. Example of a small Y6 drone (HALO), winner of the DARPA UAVForge challenge 2012.
Preprints 109682 g002
Figure 3. NACA0012 airfoil profile (JavaFoil, 2024) [27].
Preprints 109682 g003
Figure 4. NACA3414 airfoil profile (JavaFoil, 2024) [27].
Preprints 109682 g004
Figure 5. Example efficiency curve of an APC 10” x 7” Thin Electric propeller [2].
Preprints 109682 g005
Figure 6. Typical maximum section lift/drag ratios versus Reynolds numbers [13]. Note the transition at approximately 100,000 Re for smooth airfoils.
Preprints 109682 g006
Figure 7. Optimal chord distribution for a propeller with design inputs of: 20-inch diameter, a design advance ratio of 0.59, two-blades, a shaft power of 3 kW, zero angle of attack, standard density of 1.225 kg/m3 and a lift-to-drag ratio of 20.
Preprints 109682 g007
Figure 8. Computation time for MATLAB program with varying number of blade elements. The processor of the system used for this computation is an Intel(R) Core (TM) i3-6006U CPU @ 2.00 GHz, 1992 MHz.
Preprints 109682 g008
Figure 9. Radial thrust distribution along a propeller blade with design inputs of: 20-inch diameter, a design advance ratio of 0.59, 2-blades, a shaft power of 3 kW, zero angle of attack, standard density of 1.225 kg/m3 and a lift-to-drag ratio of 20.
Preprints 109682 g009
Figure 10. Radial Reynolds number distribution along a 10-inch and 20-inch propeller blade with design inputs of: velocity of 10 m/s, 2,000 RPM, two blades and a hub radius of 0.15.
Preprints 109682 g010
Figure 11. Flow chart of MATLAB program which outputs optimal propeller geometry.
Preprints 109682 g011
Figure 12. Pop-up window from MATLAB code, in which user can provide required inputs.
Preprints 109682 g012
Figure 13. Plot of chord distribution for MATLAB program output and APC ’Thin Electric’ 10” x 7” propeller [2].
Preprints 109682 g013
Figure 14. Plot of twist distribution for MATLAB program output and APC ’Thin Electric’ 10” x 7” propeller [2].
Preprints 109682 g014
Figure 15. Plot of Reynolds number distribution for MATLAB program output and APC ’Thin Electric’ 10” x 7” propeller [2].
Preprints 109682 g015
Table 1. Definitions of non-dimensional propeller and rotor coefficients.
Propeller Rotor
CTp Propeller Thrust Coefficient CT Rotor Thrust Coefficient
CPp Propeller Power Coefficient CP Rotor Power Coefficient
CQp Propeller Torque Coefficient CQ Rotor Torque Coefficient
Table 2. Inputs to MATLAB computer program which outputs optimal propeller geometry.
Input Unit
Diameter (D) Inch
Velocity (V) m/s
Shaft Power (P) W
Propeller Speed RPM
Air Density (ρ) kgm−3
Number of Blades (B) -
Airfoil CL -
Airfoil CD -
Non-Dimensional Hub Radius -
Angle of Attack (α) Degree
Displacement velocity ratio convergence level -
Number of blade elements -
Table 3. Inputs to MATLAB program for validation study.
Input Input Value
Diameter (D) 10 inch
Velocity (V) 15.87 m/s
Shaft Power (P) 68.77 W
Propeller Speed (n x 60) 6,519 RPM
Air Density (ρ) 1.225 kgm−3
Number of Blades (B) 2
Airfoil CL 0.4
Airfoil CD 0.02
Non-Dimensional Hub Radius
Angle of Attack (α)
0.15
0◦
Displacement velocity ratio convergence level 0.1
Number of blade elements 100
Table 4. Comparison of calculated performance parameters for MATLAB generated propeller and APC ’Thin Electric’ 10” x 7” [2,32].
MATLAB program UIUC Experimental Results (2) APC Theoretical Results (32)
ηp 0.870 0.714 0.727
CT 0.0626 0.0514 0.0477
CP
J
0.0414
0.5751
0.0414
0.5751
0.0405
0.6166
Pitch at 0.75R 8.6” 7” 7”
Disclaimer/Publisher’s Note: The statements, opinions and data contained in all publications are solely those of the individual author(s) and contributor(s) and not of MDPI and/or the editor(s). MDPI and/or the editor(s) disclaim responsibility for any injury to people or property resulting from any ideas, methods, instructions or products referred to in the content.
Copyright: This open access article is published under a Creative Commons CC BY 4.0 license, which permit the free download, distribution, and reuse, provided that the author and preprint are cited in any reuse.
Prerpints.org logo

Preprints.org is a free preprint server supported by MDPI in Basel, Switzerland.

Subscribe

© 2024 MDPI (Basel, Switzerland) unless otherwise stated