Preprint
Article

Assessment of Hydrometeorological Impacts of Climate Change on Water Bodies in Northern Kazakhstan

Altmetrics

Downloads

80

Views

38

Comments

0

Submitted:

19 June 2024

Posted:

20 June 2024

You are already at the latest version

Alerts
Abstract
This article examines the impact of climate change on the hydrometeorological state of some lakes and reservoirs in the Akmola and North Kazakhstan regions. Time series with values of various climate parameters for the period 1986-2023 are used for the climate analysis; the reliability of the results was assessed using the Fisher criteria. Hydrometric indicators were studied using the ArcGIG program. Using GIS to spatially analyze water climate data, 8-channel satellite images from 1995 to 2023 were used. During the study, it was found that the area of the main lakes has undergone changes.
Keywords: 
Subject: Environmental and Earth Sciences  -   Ecology

1. Introduction

The Kazakhstan's water resources are a strategic asset due to its location and especially its continental climate. The total surface water resources of the country are estimated at 100.08 km3; per year, of which 56.89 km3; are formed within the republic and 43.09 km3; come from neighboring regions: China (Ili, Yertis), Uzbekistan (Syr Darya), Kyrgyzstan (Shu, Talas) and Russia (Ural, Tobol) [1]. Kazakhstan has less water than the rest of the world (approximately 6,000 m3), with 37,000 m3 per 1 km2 and 3,650 m3 per person annually [2]. However, by 2030, Kazakhstan's annual per capita water availability is projected to decline to 2,300 m3 [3].
Current water intake includes 20.18 km3 of renewable surface water [4], 2016; it is estimated that total surface water abstraction will increase to 30.22 km3 in 2040 [5]. Much of this increase is due to increased withdrawals from the agricultural sector [3]. Modern water consumption for agriculture is 13.4 km3 per year (69.1%), of which 8.8 km3 per year (65.6%) is lost due to transport through canals and only 3.8 km3 per year for regular be used for irrigation purposes. The average efficiency of canal water supply systems is only 15–20%, compared to 70–90% in most developed countries [3]. Another problem with the use of available water resources is water pollution [6]. In fact, 50–70% of Kazakhstan's surface water resources are classified as “polluted” or “heavily polluted” in terms of environmental status [4,7]. When it comes to water resources, Kazakhstan, where most of its water comes from outside, is at high risk due to climate change. This is because climate change can increase the physical, chemical and biological mechanisms that lead to deterioration. Climate change can directly or indirectly alter water quality and even aquatic ecosystems through various biochemical processes [8,9]. In addition, the specific impacts vary depending on the region and type of water body [10]. Climate change is occurring against the backdrop of a number of rapid global trends, including rapid population growth, increasing demand for energy and food, the development of new technologies, declining water resources, groundwater depletion, soil depletion, urbanization and changing consumption patterns [11].
The Sixth Assessment Report developed by the Intergovernmental Panel on Climate Change provides a more comprehensive regional analysis of climate change. In the coming decades, all regions must expect worsening climate change. A 1.5°C increase in global warming will lead to an increase in heatwaves, longer warm seasons and shorter cold seasons. According to the report, extreme heat is more likely to exceed critical tolerance levels for agriculture and public health as global warming increases by 2°C [12]. This could create risks that have a negative impact on the area [13].
The work carried out to study the climate change in Kazakhstan also confirms according to M. Karataev et al., that over the period 1950-2020, linear indicators of average surface air temperature increased at a rate of 0.31°C per decade. All trends in the series of annual and seasonal values of surface air temperature are positive and statistically significant, indicating a steady increase in air temperature in Kazakhstan [14]. Another study conducted for the period 1941-2011 also notes that trends of increasing surface air temperatures were observed in all seasons on the territory of Kazakhstan. The average annual air temperature across the country increased by 0.28ºC per10 years [15]. A regional study of the Zhabay River basin predicts the highest temperature increase to 3.9°C at RTC 4.5 and to 6.4°C at RTC 8.5 by the end of the century. The projected changes in annual precipitation in the Zhabay river basin show a clear trend towards a moderate increase in all periods and RTC of up to 11.5% by the end of the century [16].
Climate change has significant impacts on water resources. This influence manifests itself differently in diverse water resources in different regions but is generally negative. According to Li et al., for example, negative consequences of climate change in eutrophic inland lakes in China the continuing expansion of algal blooms [17]. Previous studies show that the decrease in the surface area of lakes in Kazakhstan is explained by various environmental and socio-economic factors, such as climate change, land use, agriculture, human activities and tourism, which in turn threaten the sustainability of lakes [18, 19].
Freshwater availability expected to decline in Central Asia. In fact, water problems in transboundary rivers have expanded to the level of interregional water policies, with the Central Asian region currently facing major challenges related to the water security crisis [20]. Kazakhstan has limited water resources, which are unevenly distributed throughout the territory and are characterized by significant intra-annual and long-term fluctuations in water flow. These characteristics significantly complicate the management of the country's water resources, which averaged 91.3 km3 per year during the observation period 1974-2008 [21]. But Uanxuan Wang et al. note that Kazakhstan has reached a relatively safe level (level Ⅱ), and the level of water security is high [22]. Another study shows that the water resources of the river of the Republic of Kazakhstan have decreased by 16.0 km3. According to forecasts, due to the expected decrease in transboundary runoff, by 2030 there will be a further reduction in the republic’s water resources to 87.1 km3, in dry years to less than 50.0 km3 [20]. In works on the study of water resources in Northern Kazakhstan, the main focus is on the endorheic lakes of SNNP “Burabay” and the Yesil river system [24-27]. The geochemical, morphological and geochemical indicators of the remaining lakes and reservoirs have been studied very little. Therefore, this work offers the opportunity to close these gaps. The purpose of our research is to study the impact of climate change on hydrometeorological indicators of water bodies in Akmola and North Kazakhstan regions. Research objectives are:
  • Analysis of climate change in Akmola and North Kazakhstan regions in recent decades.
  • Assessment of the impact of climate change on the surface water bodies.

2. Materials and Methods

To study the air temperature and precipitation in Akmola and North Kazakhstan regions in the period 1986 to 2023, we used the average daily data from Kazhydromet organization. As part of the study, data from Kokshetau, Sergeyevka and Saumalkol weather stations were processed. Meteorological stations were selected to cover the area of the studied water bodies. Monthly averages were calculated based on the average daily data. Statistical processing was used to compile seasonal trends in air temperature changes.
a v e r a g e t = 1986 2023 s e a s o n a l t a m o u n t o f y e a r s
To estimate the impacts of climate change on water levels and surfaces of lakes and reservoirs, average annual climate data were collected for 10 years from 1986-1995, 1996-2005, 2006-2015 and 2016-2023.
Monitoring of the status of lakes and reservoirs was carried out based on 8-channel LandSat images (4-5 for 1995 data, 7 for 2005 data, and 8-9 for 2015 and 2023). The satellite images were selected from official US Geological Survey data and are georeferenced. The water areas were determined by mixing the red, green and blue channels and by calculating the albedo of the earth's surface using the following formula for LandSat 4-7 images:
ρ = π R d 2 E sin θ
where, ρ is the reflectivity (albedo), R - the intensity of radiation from an object that has reached the satellite’s orbit, d - the distance from the Earth to the Sun, E - the luminosity coefficient for each channel and θ - the height of the Sun above the horizon.
For LandSat 8-9 images, albedo was calculated using a different formula:
ρ = 2 10 5 Q 0 , 1 sin θ
where, Q - the raster model of the image.
The contours of water bodies were additionally checked using the Modified Normalized Difference Water Index (MNDWI) using 3 and 7 channels of later image versions.
These operations identified and digitized bodies of water on satellite images. To calculate the metric parameters of the area, an equal-area projection was specified and a cartometric calculation was carried out using GIS. The height of the water edge was determined by overlaying the contours of the lake on SRTM images. The height is determined by automatically calculating the grid cell value corresponding to the points and lines of water bodies. A similar algorithm is used in ArcGIS by the Sample function from the Spatial Analyst toolbox (Arc Toolbox).

3. Results

3.1. Weather Stations Data Analysis

The study results were presented on the basis of data obtained from Kokshetau, Sergeyevka and Saumalkol weather stations in the period from 1986-2023. The average annual temperature and precipitation were analyzed. The trend lines of seasonal temperature changes showed that Kokshetau experienced a gradual increase in average temperature during the period 1986-2023. Seasonal fluctuations in winter from -8.9°C (2020) to -19.6°C (2012), with a warming trend, in spring the temperature gradually increases from 0°C to 10°C, in summer the temperature fluctuates between 15°C to 20°C, with a warming tendency, gradually decreasing from 10°C to 0°C in autumn.
According to the seasonal trend analysis, the average winter temperature was -12°C, and the average annual temperature over the past ten years (2016–2023) has increased by 0°C over the previous ten (1986–1995). Over a ten-year period, the most notable increase was recorded in February at +2.3°C. The average spring temperature is 4.9°C, an increase of 0.9°C over 10 years. The most significant increase was in March at +1.0°C. In the summer months the trends are less pronounced with an average temperature of 18.8°C, which corresponds to a temperature increase of 0.7°C over 10 years. The most significant increase was in June at +0.9°C. Autumn is characterized by relatively cool seasons, during which the average temperature was 3.9°C. The trend line describes an increase of 0.9°C over 10 years. The most noticeable increase was observed in November at +1.3°C.
The average annual temperature as well as variations in temperature for each season can be taken into consideration when analyzing Kokshetau climate data from 1986 to 2023. This makes it possible to identify trends such as warming or cooling and to estimate climate changes in the region over the period under consideration.
During the winter season, there are fluctuations in average temperatures: first a decrease from -12.9°C in 1986-1995 to -12.5°C in 1996-2005, then a sharp decrease to -14.2°C in 2006-2015, and an increase to -12.3°C in 2016-2023. This suggests that the last period was slightly warmer than the period from 2006 to 2015. Data for the spring period show a steady increase in average temperature from 3.1°C in 1986-1995 to 5.4°C in the years 2016-2023. This is a clear sign of a warming spring season in Kokshetau. The changes in summer temperature are minimal: from 18.9°C in 1986-1995 to 19.2°C in 2016-2023. However, there is a slight upward trend in average summer temperatures. The average autumn temperature also shows an increasing trend: from 2.8 C in the period 1986-1995 to 3.7°C in the period 2016-2023. This indicates warmer autumns in recent years. Overall, the average annual temperature shows an increase from 3.0°C in the period 1986-1995 to 4.0°C in the period 2016-2023. This confirms the warming trend in the region.
It is evident from the analysis that Kokshetau experienced a warming trend over the studied period. The shoulder seasons may be getting warmer as the most pronounced changes happened in the spring and fall. Although the changes are not as dramatic, the summer has also gotten a little warmer. Variability is evident in the winter season, although the most recent one was warmer than the one that spanned from 2006 to 2015. The trend of global climate change is generally confirmed by the rise in the average annual temperature.
By analyzing climate data in Sergeevka, it is possible to identify trends and changes in temperature conditions. A clear cooling trend can be seen during the winter period: the average temperature fell from -10.0 °C in the period 1986-1995 to -13.8 °C in the period 2016-2023. This is a fairly significant and gradual drop in temperature. In spring, however, there is stable warming: the average temperature rose from 2.7°C in the period 1986-1995 to 4.6°C in the period 2016-2023. This suggests warmer springs in recent years. In summer, the temperature changes are not so noticeable, but there is a slightly increasing trend: from 18.6°C in 1986-1995 to 19.0°C in 2016-2023. This could indicate a slight increase in average summer temperatures. There is also a moderate increase in average temperature in autumn: from 2.1°C in the period 1986-1995 to 3.2°C in the period 2016-2023. Although temperatures have fallen slightly since 2006 compared to the previous period, the overall trend points to warming. The average annual temperature shows slight fluctuations, starting at 3.3 °C in 1986–1995, increasing to 3.7 °C in 1996–2005, and then decreasing slightly to 3.2 °C in 2016–2023. This suggests that the average annual temperature remains relatively stable despite seasonal changes.
The data shows that in Sergeyevka there is a trend towards colder winters and warmer springs and autumns, while the changes are less significant in summer. This could indicate the influence of climate change, manifested in increasing contrasts between seasons. The average annual temperature shows relative stability throughout the study period, which may indicate that annual temperature fluctuations balance each other out.
Let's consider seasonal climate indicators in Saumalkol to determine the main trends and temperature fluctuations for a specific period.
In winter, the temperature starts at -13.9°C between 1986 and 1995, then increases slightly to -13.6°C between 1996 and 2005, then falls sharply to -15.2°C between 2006 and 2015 and rises again to -13.1°C in the period 2016-2023. This shows that the latest period has become warmer compared to the previous one, although it remains colder compared to 1986-1995 and 1996-2005. In spring there is a stable and noticeable increase in temperature: from 2.6°C in the period 1986-1995 to 4.4°C in the period 2016-2023. This indicates significant warming during the spring months in Saumalkol. There is a slight fluctuation in average temperatures in summer: from 18.2°C in 1986–1995 to 17.8°C in 2006–2015, followed by a slight increase to 18.1°C in 2016–2023. Overall, the changes are not significant, but there is a slight tendency for temperatures to fall in the middle of the period, followed by a slight recovery. There is a trend of increasing temperatures in autumn: from 1.9°C in 1986-1995 to 3.2°C in 2006-2015 and a slight decrease to 2.7°C in 2016-2023. This suggests warmer autumn months in recent years, despite a slight decline in recent years. The average annual temperature shows a general upward trend: from 2.2°C in the period 1986-1995 to 3.1°C in the period 2016-2023. This indicates moderate but stable warming in Saumalkol during the reporting period.
From the data it can be concluded that a trend towards moderate warming is observed in Saumalkol, which is particularly noticeable in spring and autumn months. Winter temperatures have also shown an improvement since the cold period of 2006-2015. Summer temperatures remain relatively stable with minor fluctuations. Overall, these changes could indicate a changing climate in the region, characterized by milder winters and warmer off-seasons.
Table 1. The average air temperature by season and annual (°C) for 1986-2023.
Kokshetau
Years winter spring summer autumn average
1986-1995у. -12,9 3,1 18,9 2,8 3,0
1996-2005у. -12,5 3,8 18,8 3,5 3,4
2006-2015у. -14,2 4,7 18,7 4,2 3,3
2016-2023у. -12,3 5,4 19,2 3,7 4,0
Sergeevka
Years winter spring summer autumn average
1986-1995у. -10,0 2,7 18,6 2,1 3,3
1996-2005у. -9,9 3,3 18,5 2,9 3,7
2006-2015у. -12,7 4,2 18,8 3,7 3,5
2016-2023у. -13,8 4,6 19,0 3,2 3,2
Saumalkol
Years winter spring summer autumn average
1986-1995у. -13,9 2,6 18,2 1,9 2,2
1996-2005у. -13,6 3,3 18,0 2,7 2,6
2006-2015у. -15,2 4,2 17,8 3,2 2,5
2016-2023у. -13,1 4,4 18,1 2,7 3,1
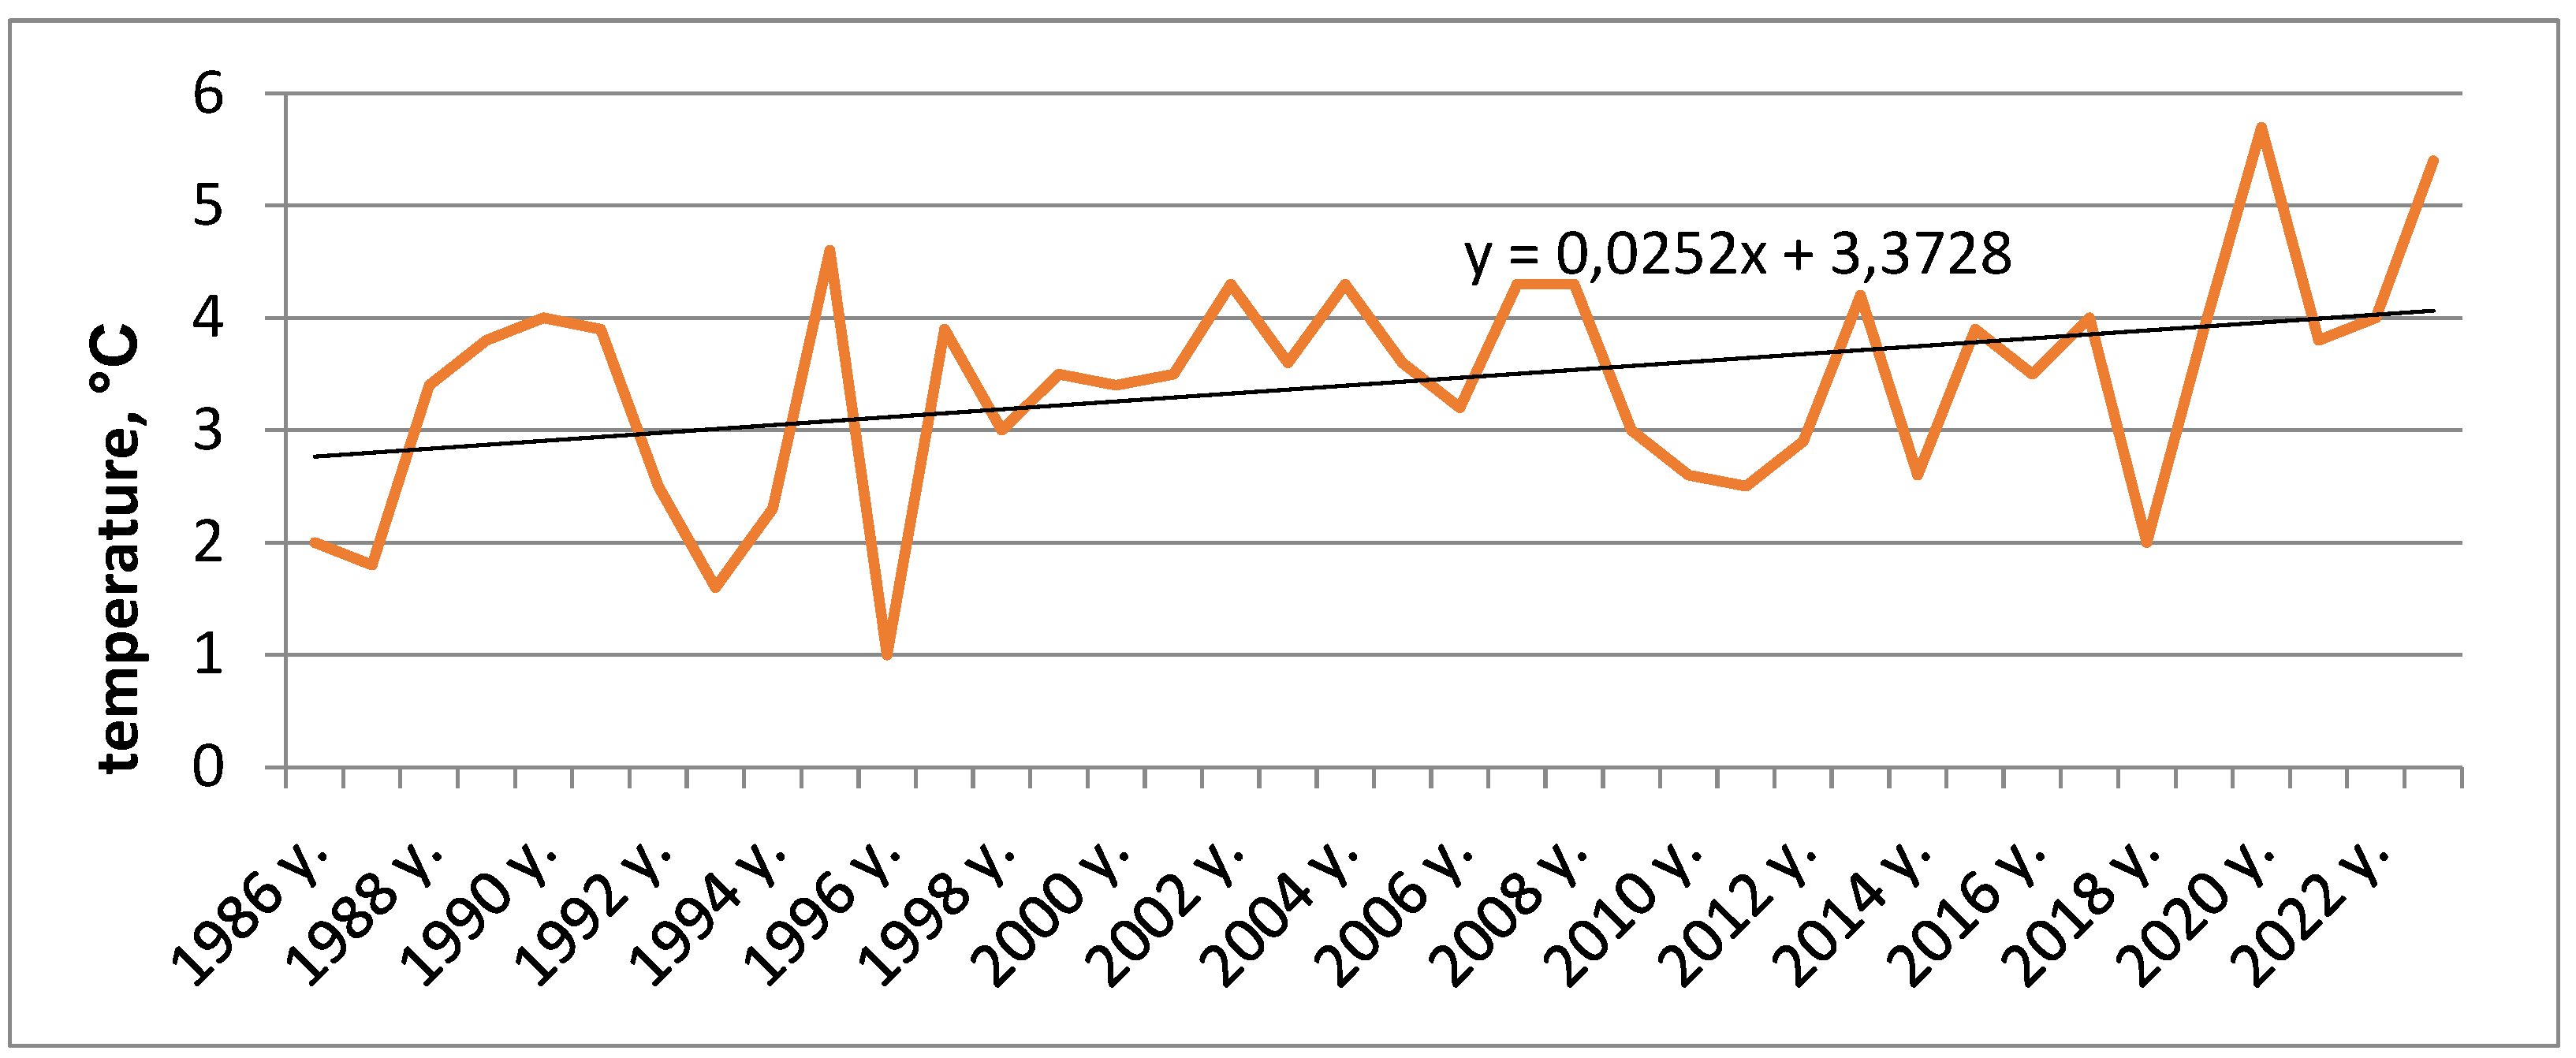
Figure 1 shows data on trends in average annual temperature in the city of Kokshetau for 38 years (1986-2023). The average annual temperature for this period is 3.4°C. There is a gradual increase in average temperature. Over 38 years, the average temperature increased by 0.7°C compared to the long-term annual average temperature of 2.7°C. The linear trend shows that the average temperature in Kokshetau will continue to increase.
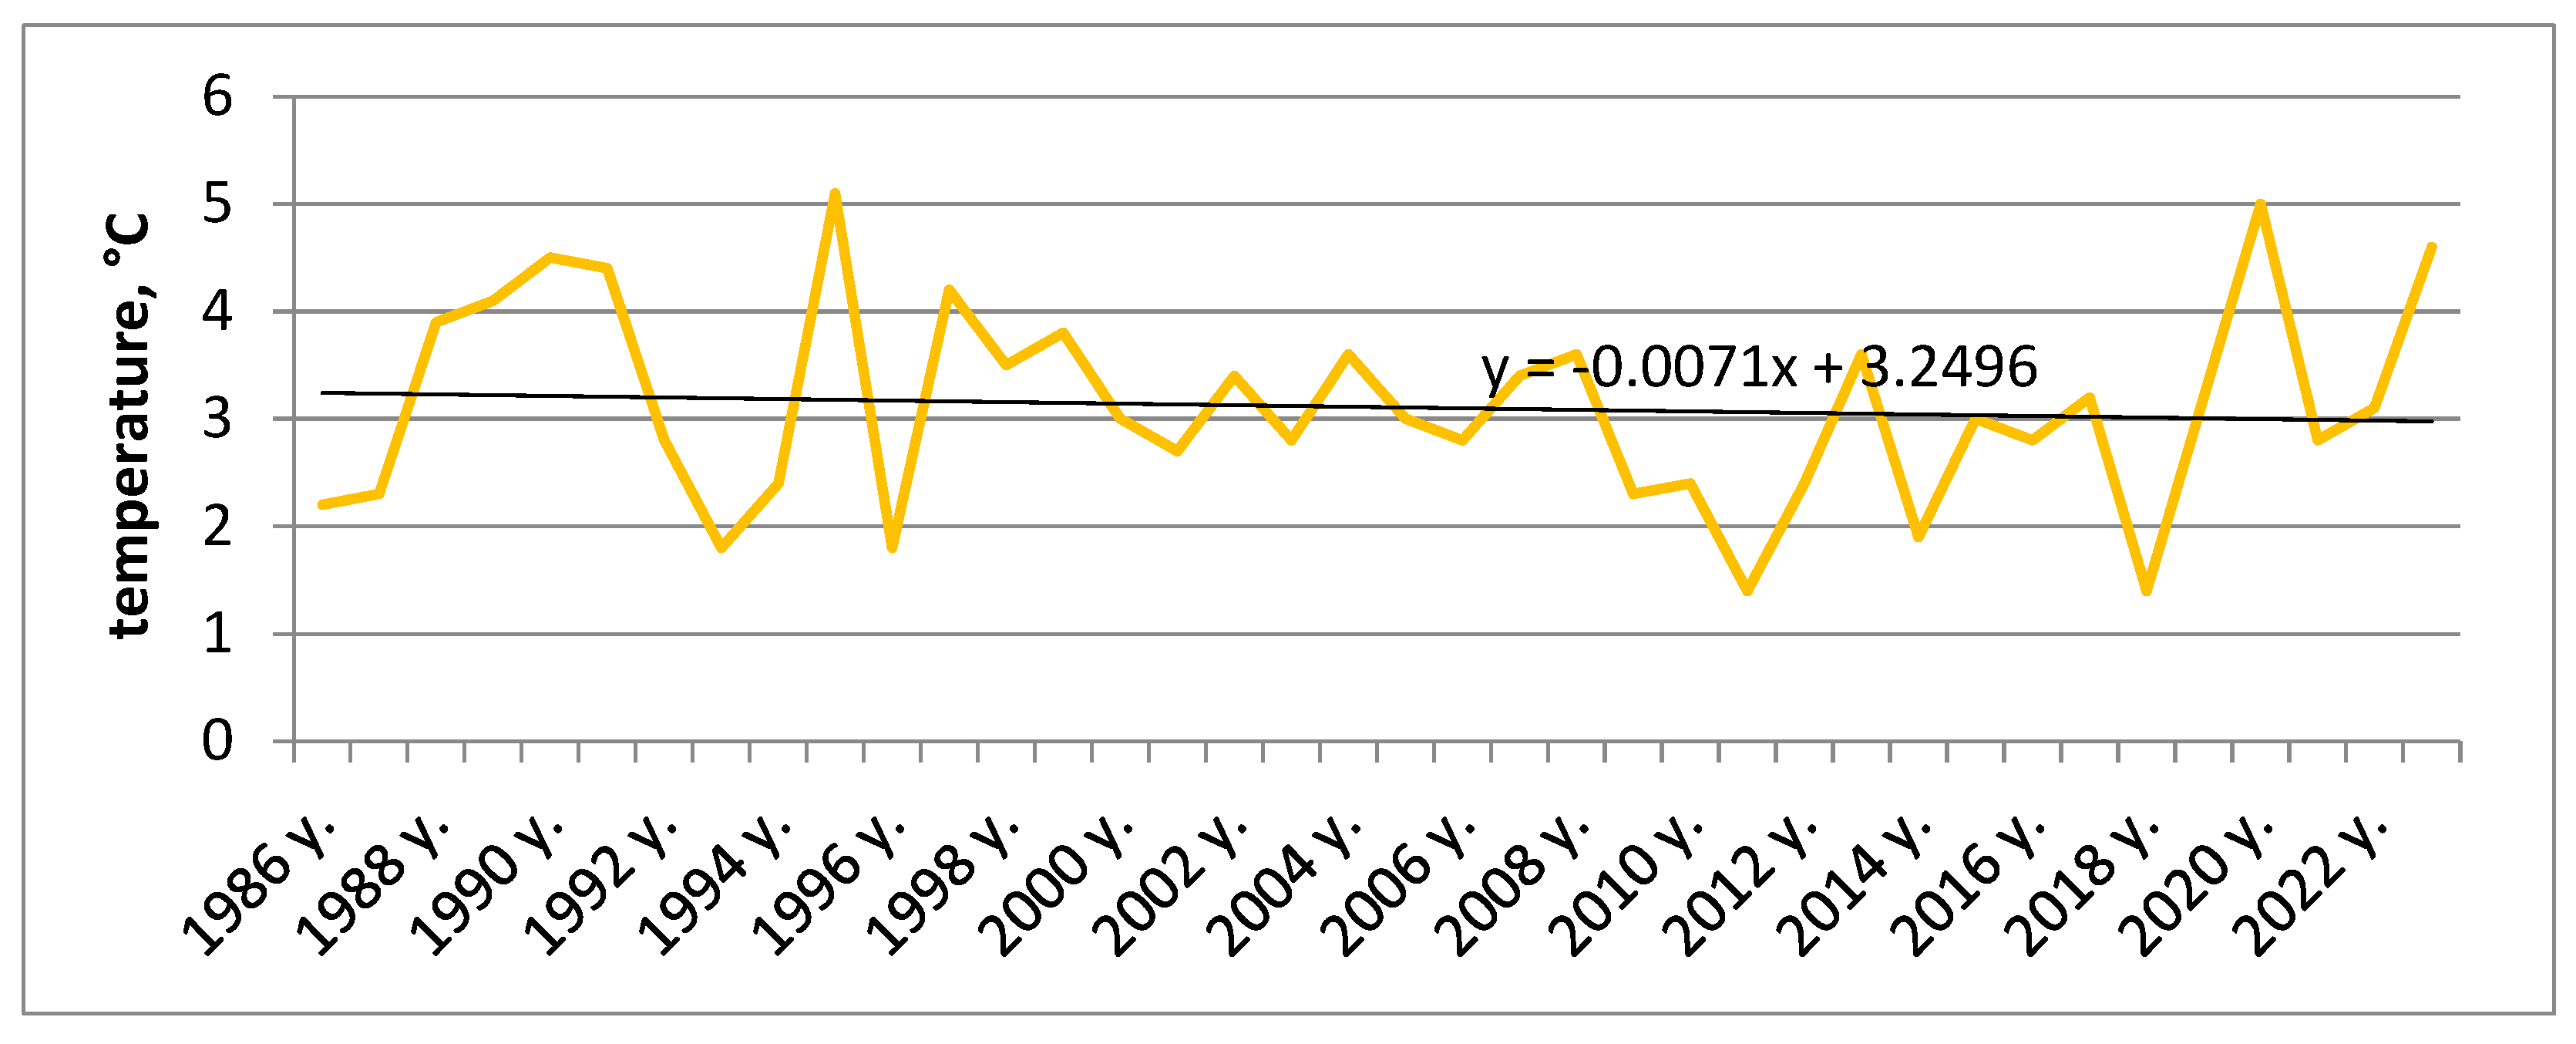
The average annual temperature in Sergeyevka has tended to decrease over the past 38 years. In 2023, the average annual temperature is 2.4°C higher than in 1986. Over 38 years, the average temperature fluctuated between 1.4°C (2011 and 2018) to 5.1°C (1995). In 2020 there was an unusually high increase in the average annual temperature of up to 5.0°C. To analyze the trend of the average annual temperature in Sergeyevka using the regression equation provided, we can look at the temperature change over time.
The regression equation states that the average annual temperature decreases by 0.0071 degrees each year compared to the previous year, starting from a base value of 3.2496 degrees in the initial year of measurement (where \\(x = 0\)). This equation assumes a linear decrease in temperature over time, which may not accurately reflect long-term climate change due to natural climate fluctuations and the possible impact of global warming.
However, if you look at the trend in the data, you will notice that the average annual temperature fluctuates, with a significant increase of up to 4.6 degrees, last year, suggesting that the actual data varies significantly may deviate from the linear trend predicted by the equation. This may indicate nonlinearity of climate change in Sergeyevka (Figure 2).
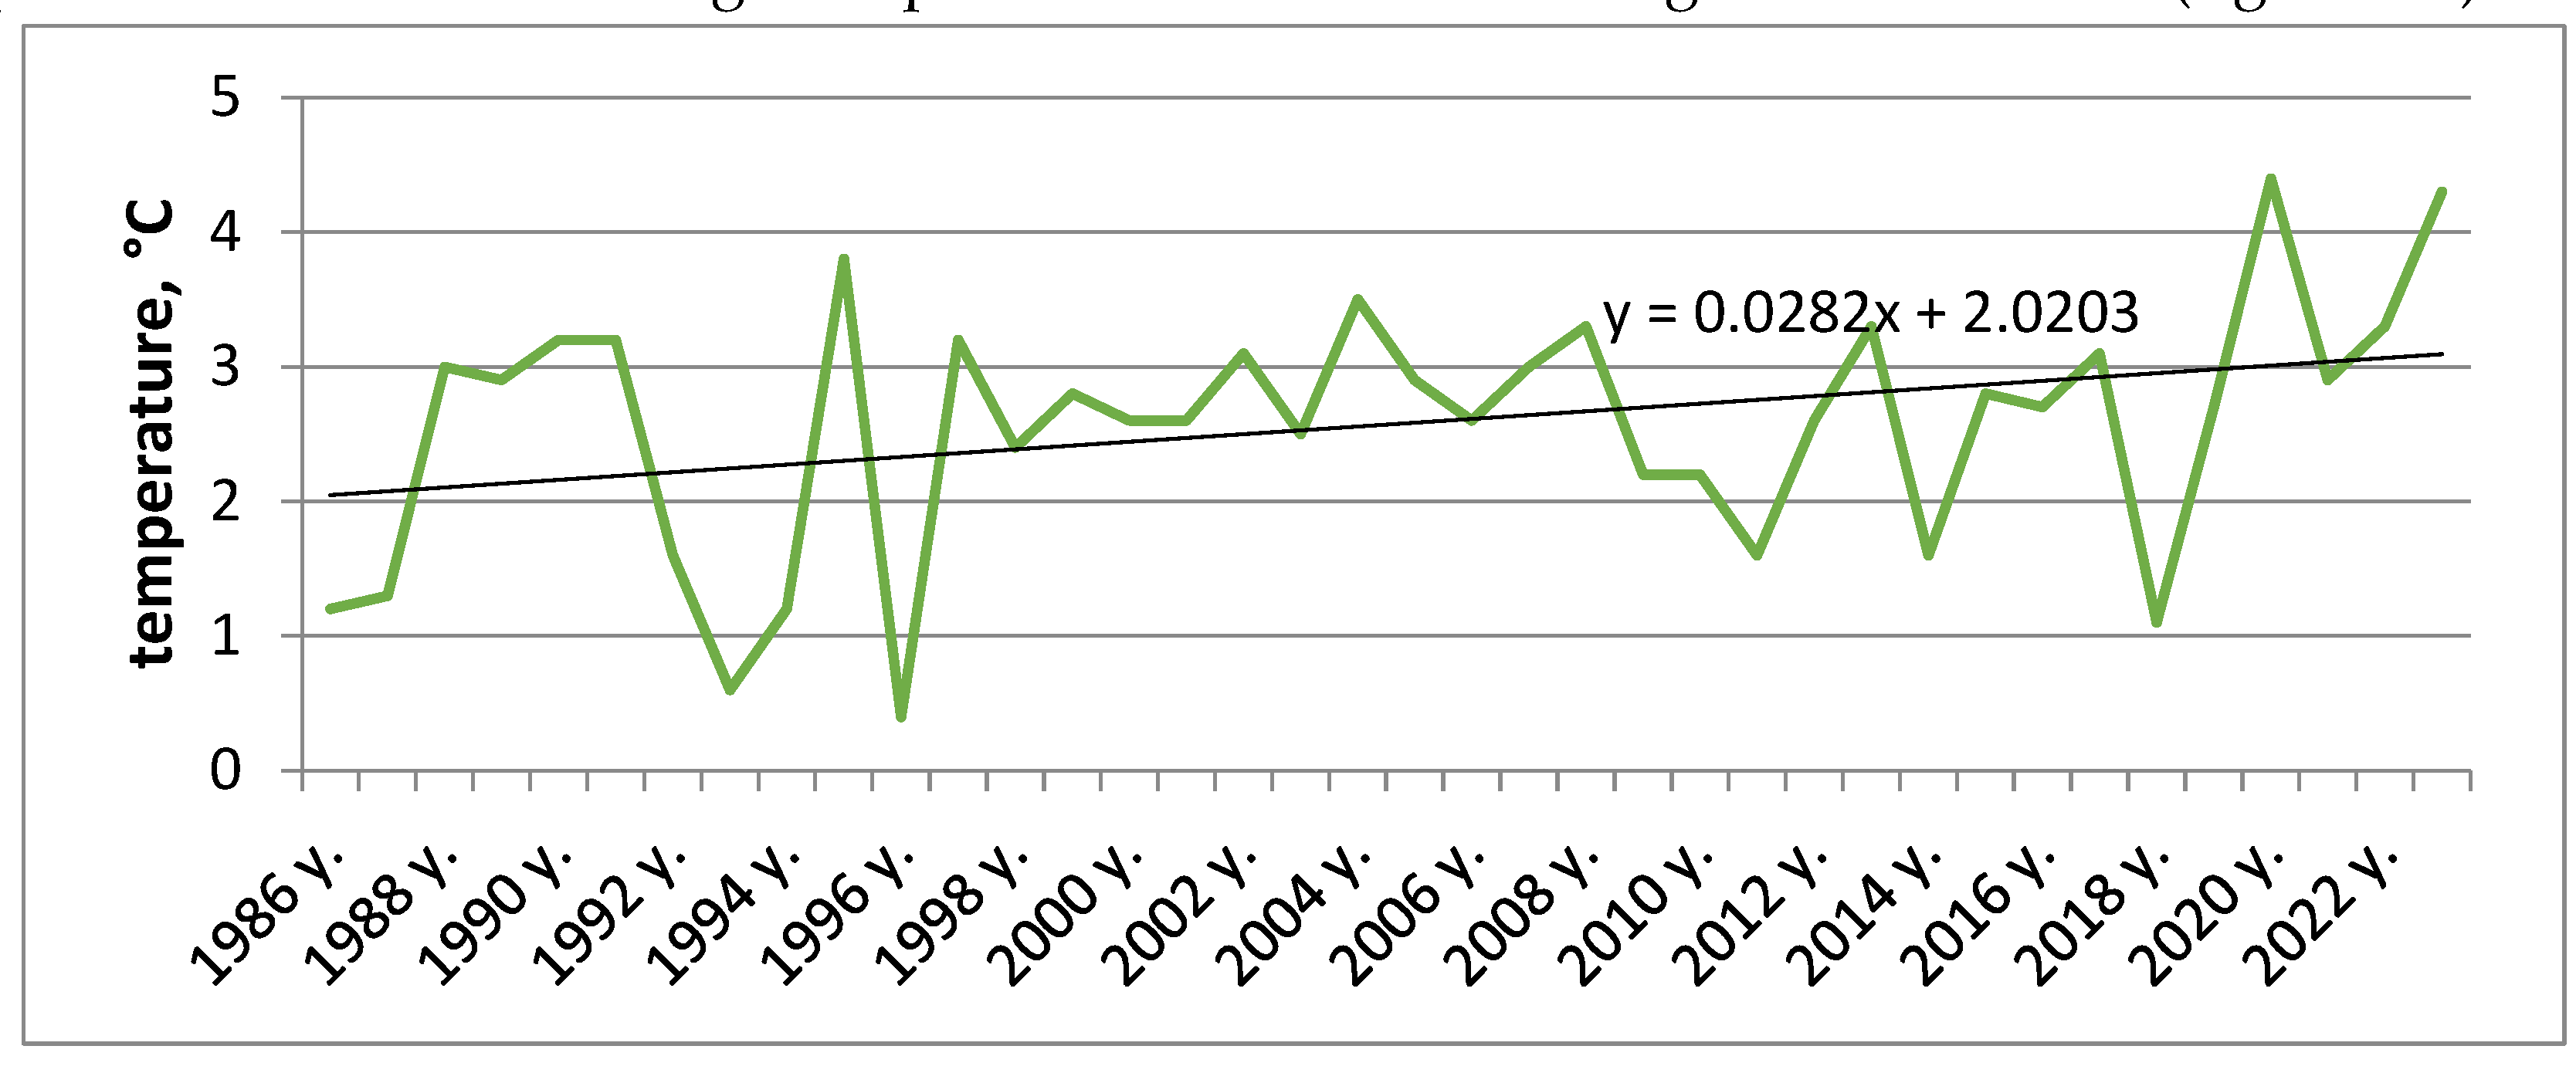
From 1986 to 2023, the average temperature in Saumalkol ranged from 0.4°C (1996) to 4.4°C (2020). There is also a gradual increase in average temperature. The trend line shows the average temperature trend. The average temperature in 2023 is 3.1°C higher than in 1986 (Figure 3).
The last 38 years have seen both record low and record high temperatures. The coolest years were 2011 and 2018, with annual average temperatures below 0.9°C. At the same time, 2020 and 2023 were the hottest years with temperatures exceeding 4°C. Particularly noteworthy is the year 2020, when it was unusually hot: the average annual temperature exceeded 4°C, which is the highest value for the entire observation period.
It should also be noted that significant changes can be observed in the seasons. Winter is becoming shorter and less severe. The number of days with thaws is increasing. Spring comes earlier. Temperatures rise in March and April. Summer is getting warmer. The number of days with extremely high temperatures is increasing. Autumn is getting shorter. Temperatures rise in September and October.
To analyze climate data for precipitation in Kokshetau, Sergeyevka and Saumalkol from 1986 to 2023, we can consider changes in average precipitation by season, as well as general changes in annual averages. This will allow us to identify trends and possible changes in the climate of these regions.
Kokshetau experiences an increase in rainfall during the winter season from 36.1 mm in the period 1986-1995 to 45.3 mm in the period 2016-2023. This suggests that winters are becoming wetter. Spring precipitation shows fluctuations, initially increasing from 50.5 mm to 68.8 mm in the period 2006–2015 and then decreasing to 53.8 mm in the later period. The maximum amount of precipitation fell in the period 2006-2015. Fluctuations are also observed in summer: the highest amount of precipitation was recorded in the initial period (1986-1995) - 161.2 mm, after which there is a decrease, but in 2006-2015 the amount of precipitation again increases to 157 mm, and then decreases in the period 2016-2023 to 146.6 mm.
The most significant increase in precipitation is observed in autumn - from 50.7 mm in the period 1986-1995 to 81.3 mm in the period 2016-2023 (Table 2). This indicates significant moisture in the fall. The average annual precipitation also shows an increasing trend: from 299 mm in the period 1986-1995 to 330 mm in the period 2006-2015, after which there is a slight decrease to 327 mm in the last period.
Analysis of rainfall data in Saumalkol shows a significant increase in winter rainfall from 70 mm in 1986-1995 to a peak of 119 mm in 2006-2015, after which rainfall decreased to 93 mm in the most recent period (2016-2023). This indicates significant fluctuations in winter precipitation, with the largest increase occurring in the middle of the observation period. There is also an increase in rainfall in spring from 86 mm in 1986-1995 to 114 mm in 2006-2015, but in the subsequent period there is a decrease to 86 mm. This shows the variability of spring precipitation with a maximum value in the third period. Summer precipitation shows an increasing trend from 150 mm in 1986–1995 to 178 mm in 2006–2015, after which there is a slight decrease to 168 mm. This indicates a general increase in summer rainfall in Saumalkol. There is also a steady increase in precipitation in autumn from 92 mm in 1986–1995 to 131 mm in 2016–2023 (Table 2). This is the most noticeable and consistent increase of all seasons.
The average annual rainfall shows a significant increase from 397 mm in the initial period to 526 mm in 2006-2015, followed by a decrease to 478 mm in the later period. Despite this decrease, the overall trend indicates an increase in the amount of rainfall in Saumalkol during the period under review.
The data shows a general increase in the amount of rainfall in Saumalkol in all seasons, especially noticeable in the summer and autumn.
In Sergeyevka, winter precipitation remains relatively stable across all periods, starting from 59 mm in 1986–1995 and slightly increasing to 61 mm in 2016–2023. This shows the stability of winter precipitation in Sergeevka. There is a significant increase in precipitation in spring, starting with 67 mm in the first period and peaking at 97 mm in 2006–2015, followed by a decrease to 77 mm in the last period. The spring season has the greatest fluctuations of all seasons. There is also a trend towards an increase in precipitation in summer, from 144 mm in the period 1986-1995 to 161 mm in the period 2006-2015 and a slight decrease to 158 mm in the last period. This suggests that summer in Sergeyevka will be wetter. Autumn rainfall also shows an increasing trend from 81 mm in 1986-1995 to 92 mm in the recent period. This indicates wet autumn months in the periods considered.
The average annual precipitation increases from 352 mm in 1986-1995 to 401 mm in 2006-2015, after which there is a slight decrease to 388 mm in 2016-2023. This suggests a general trend of increasing rainfall in Sergeyevka, although there has been a slight decrease in the recent period.
Therefore, all three regions show an increasing trend in average annual precipitation over the period under review. This may indicate a change in climatic conditions towards humidity. The largest fluctuations in precipitation occur in spring, which may indicate that this season is different in the amount of precipitation across the region. The data shows that in Sergeyevka and Saumalkol there iwill be a general increase in atmospheric precipitation, which will be especially noticeable in the summer and autumn months, in Kokshetau a noticeable increase will be observed only in autumn.
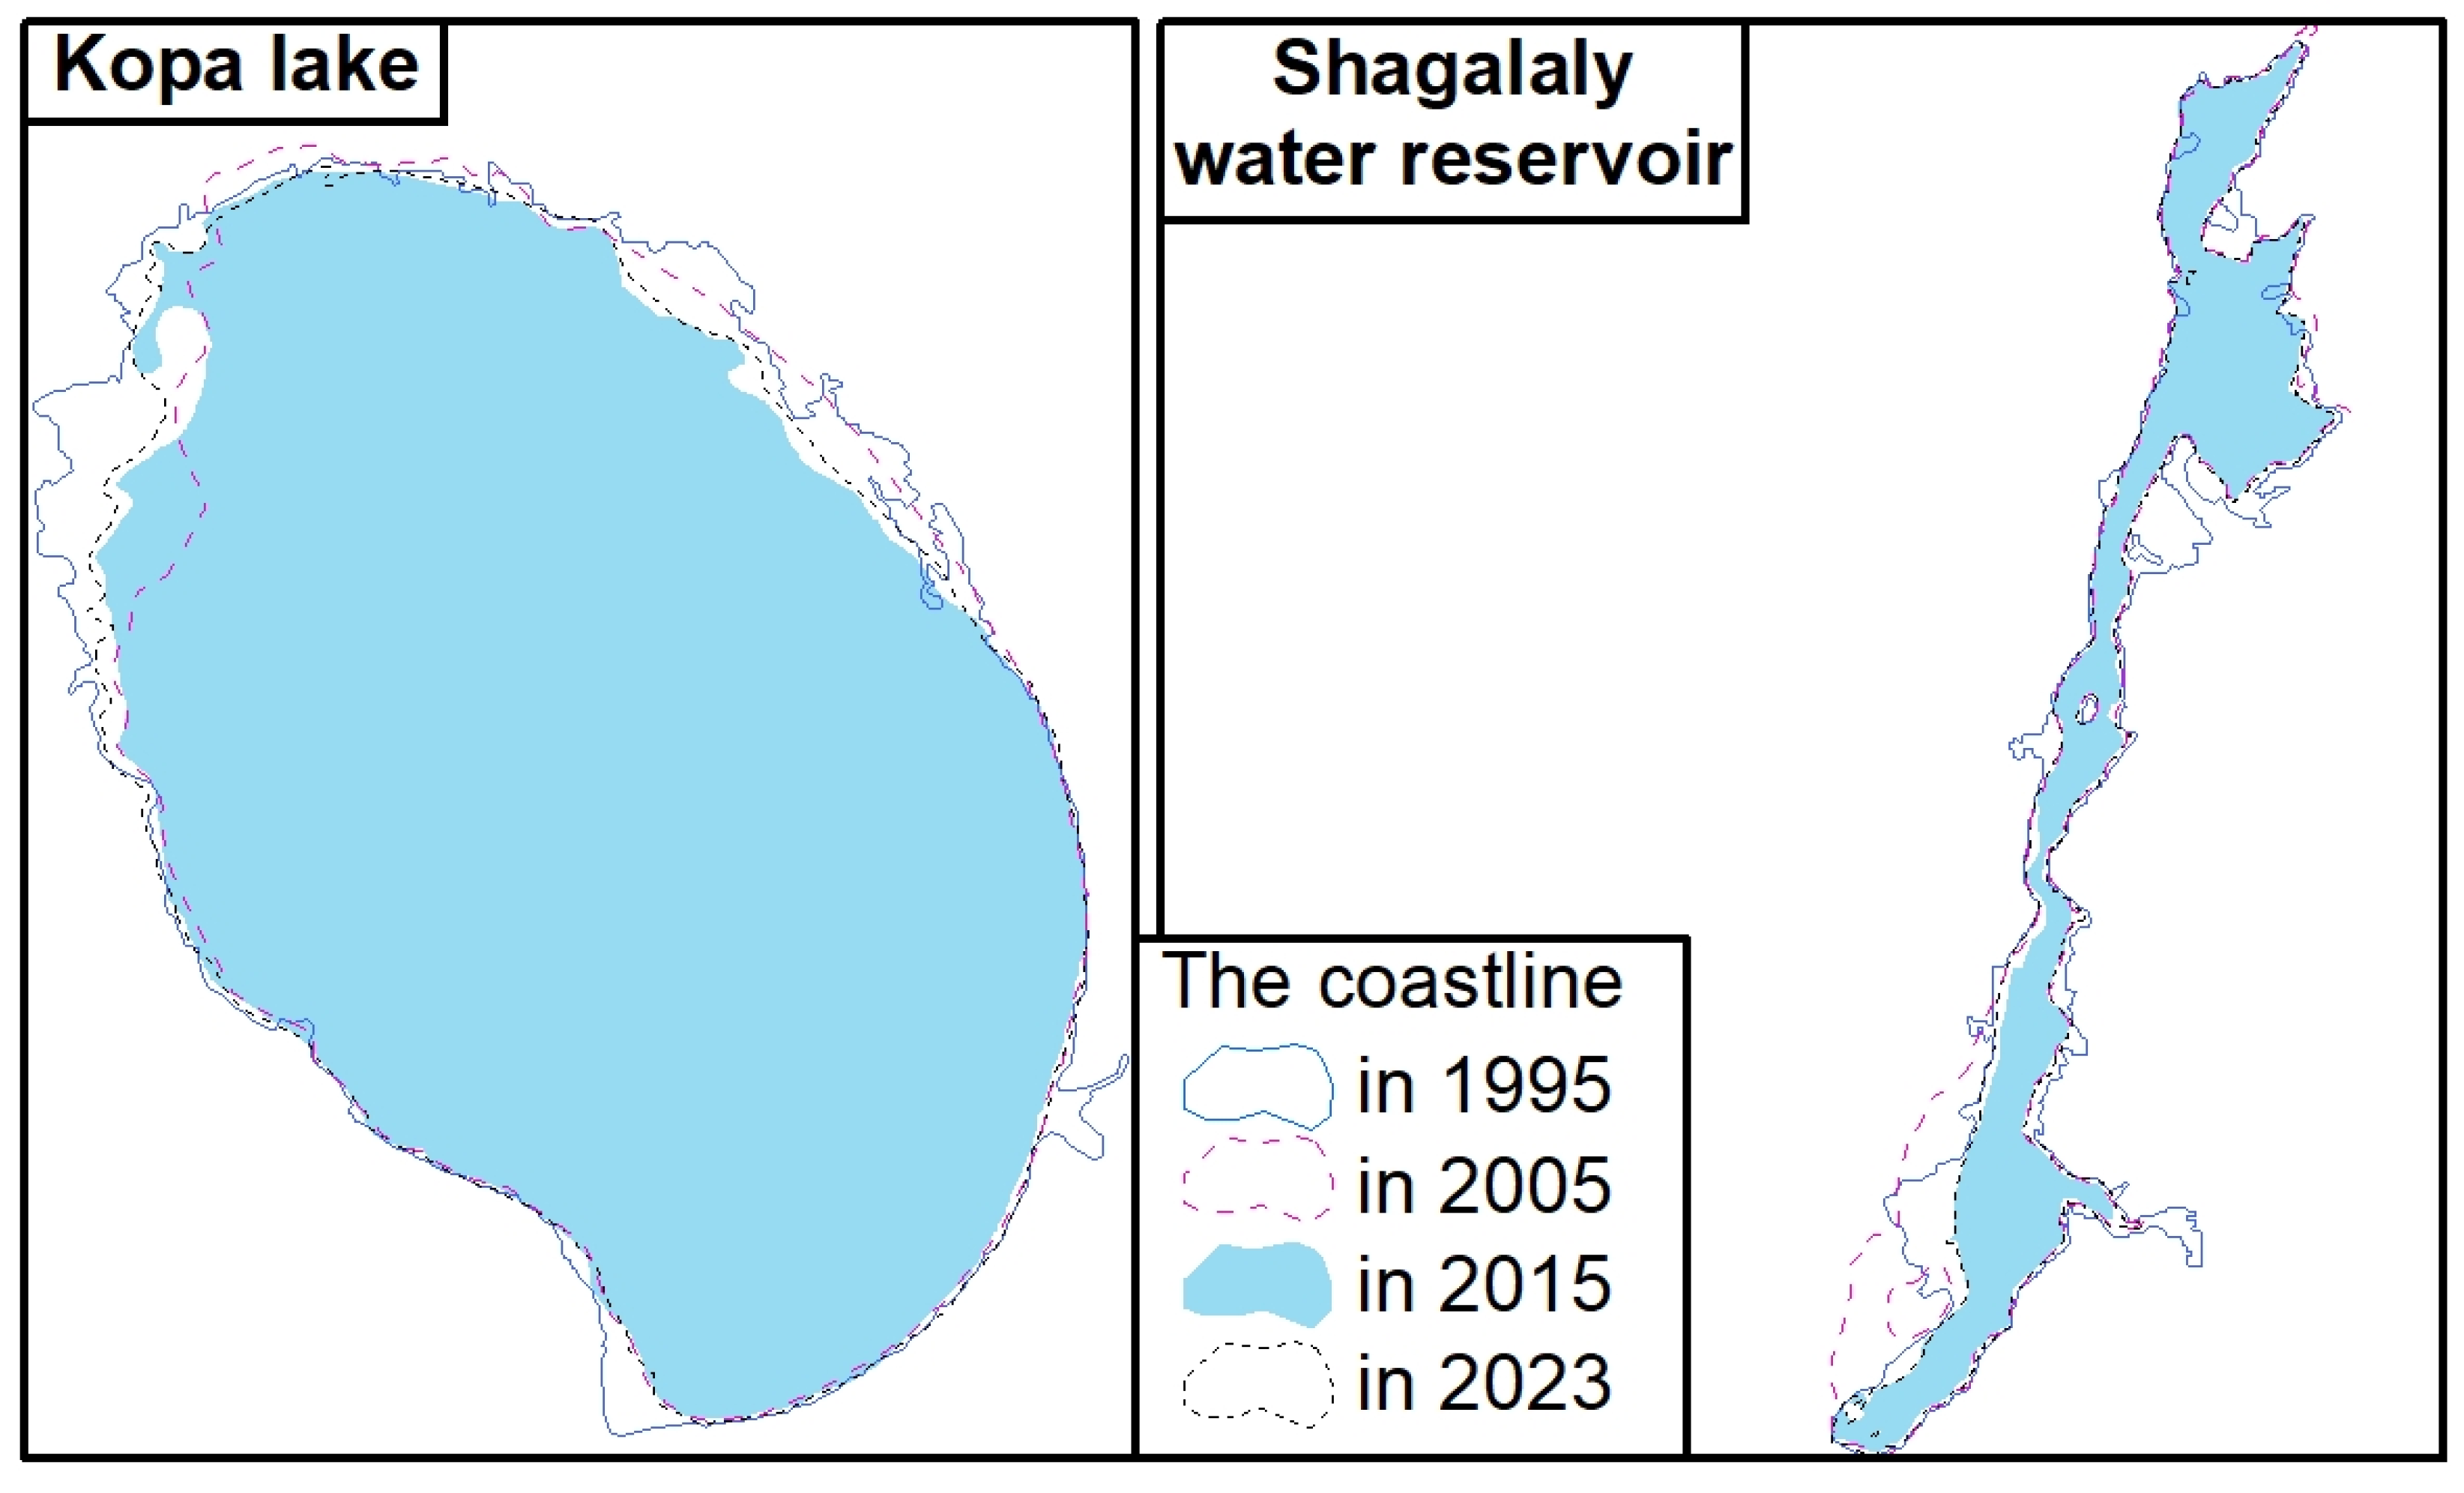
We analyzed how air temperature and precipitation affect the area of water resources over a 10-year period from 1986 to 2023. After studying the data on changes in the area of Lake Kopa depending on the amount of precipitation and average temperature for different years (1995, 2005, 2015, 2023), it is possible to analyze the influence of these factors and their correlation with the area of Sees. The area of the lake decreased from 14.4 km2; in 1995 to 13.2 km2; in 2015 and then increased slightly to 13.53 km2; by 2023. The amount of precipitation tends to increase from 299 mm in 1995 to 327 mm in 2023. The average temperature also shows an increase from 4.6°C in 1995 to 5.4°C in 2023 (Figure 4).
Mathematical calculations show that the correlation with lake area and precipitation is 0.37, indicating a weak positive correlation. This means that with increasing rainfall there is a slight, but not strong, increase in the lake area. The correlation coefficient between lake area and average temperature is -0.61, indicating a moderate negative correlation. This indicates that as the average temperature increases, the lake area tends to decrease.
Thus, the change in the area of Lake Kopa probably depends on a combination of many factors, among which temperature and precipitation play a significant role. The negative effect of temperature may outweigh the positive effect of precipitation and lead to an overall reduction in the lake area. Observed correlations indicate that climate changes such as rising temperatures and changes in precipitation, may have significant impacts on water resources such as lakes, requiring further study and possibly adaptive management of water resources and ecosystems.
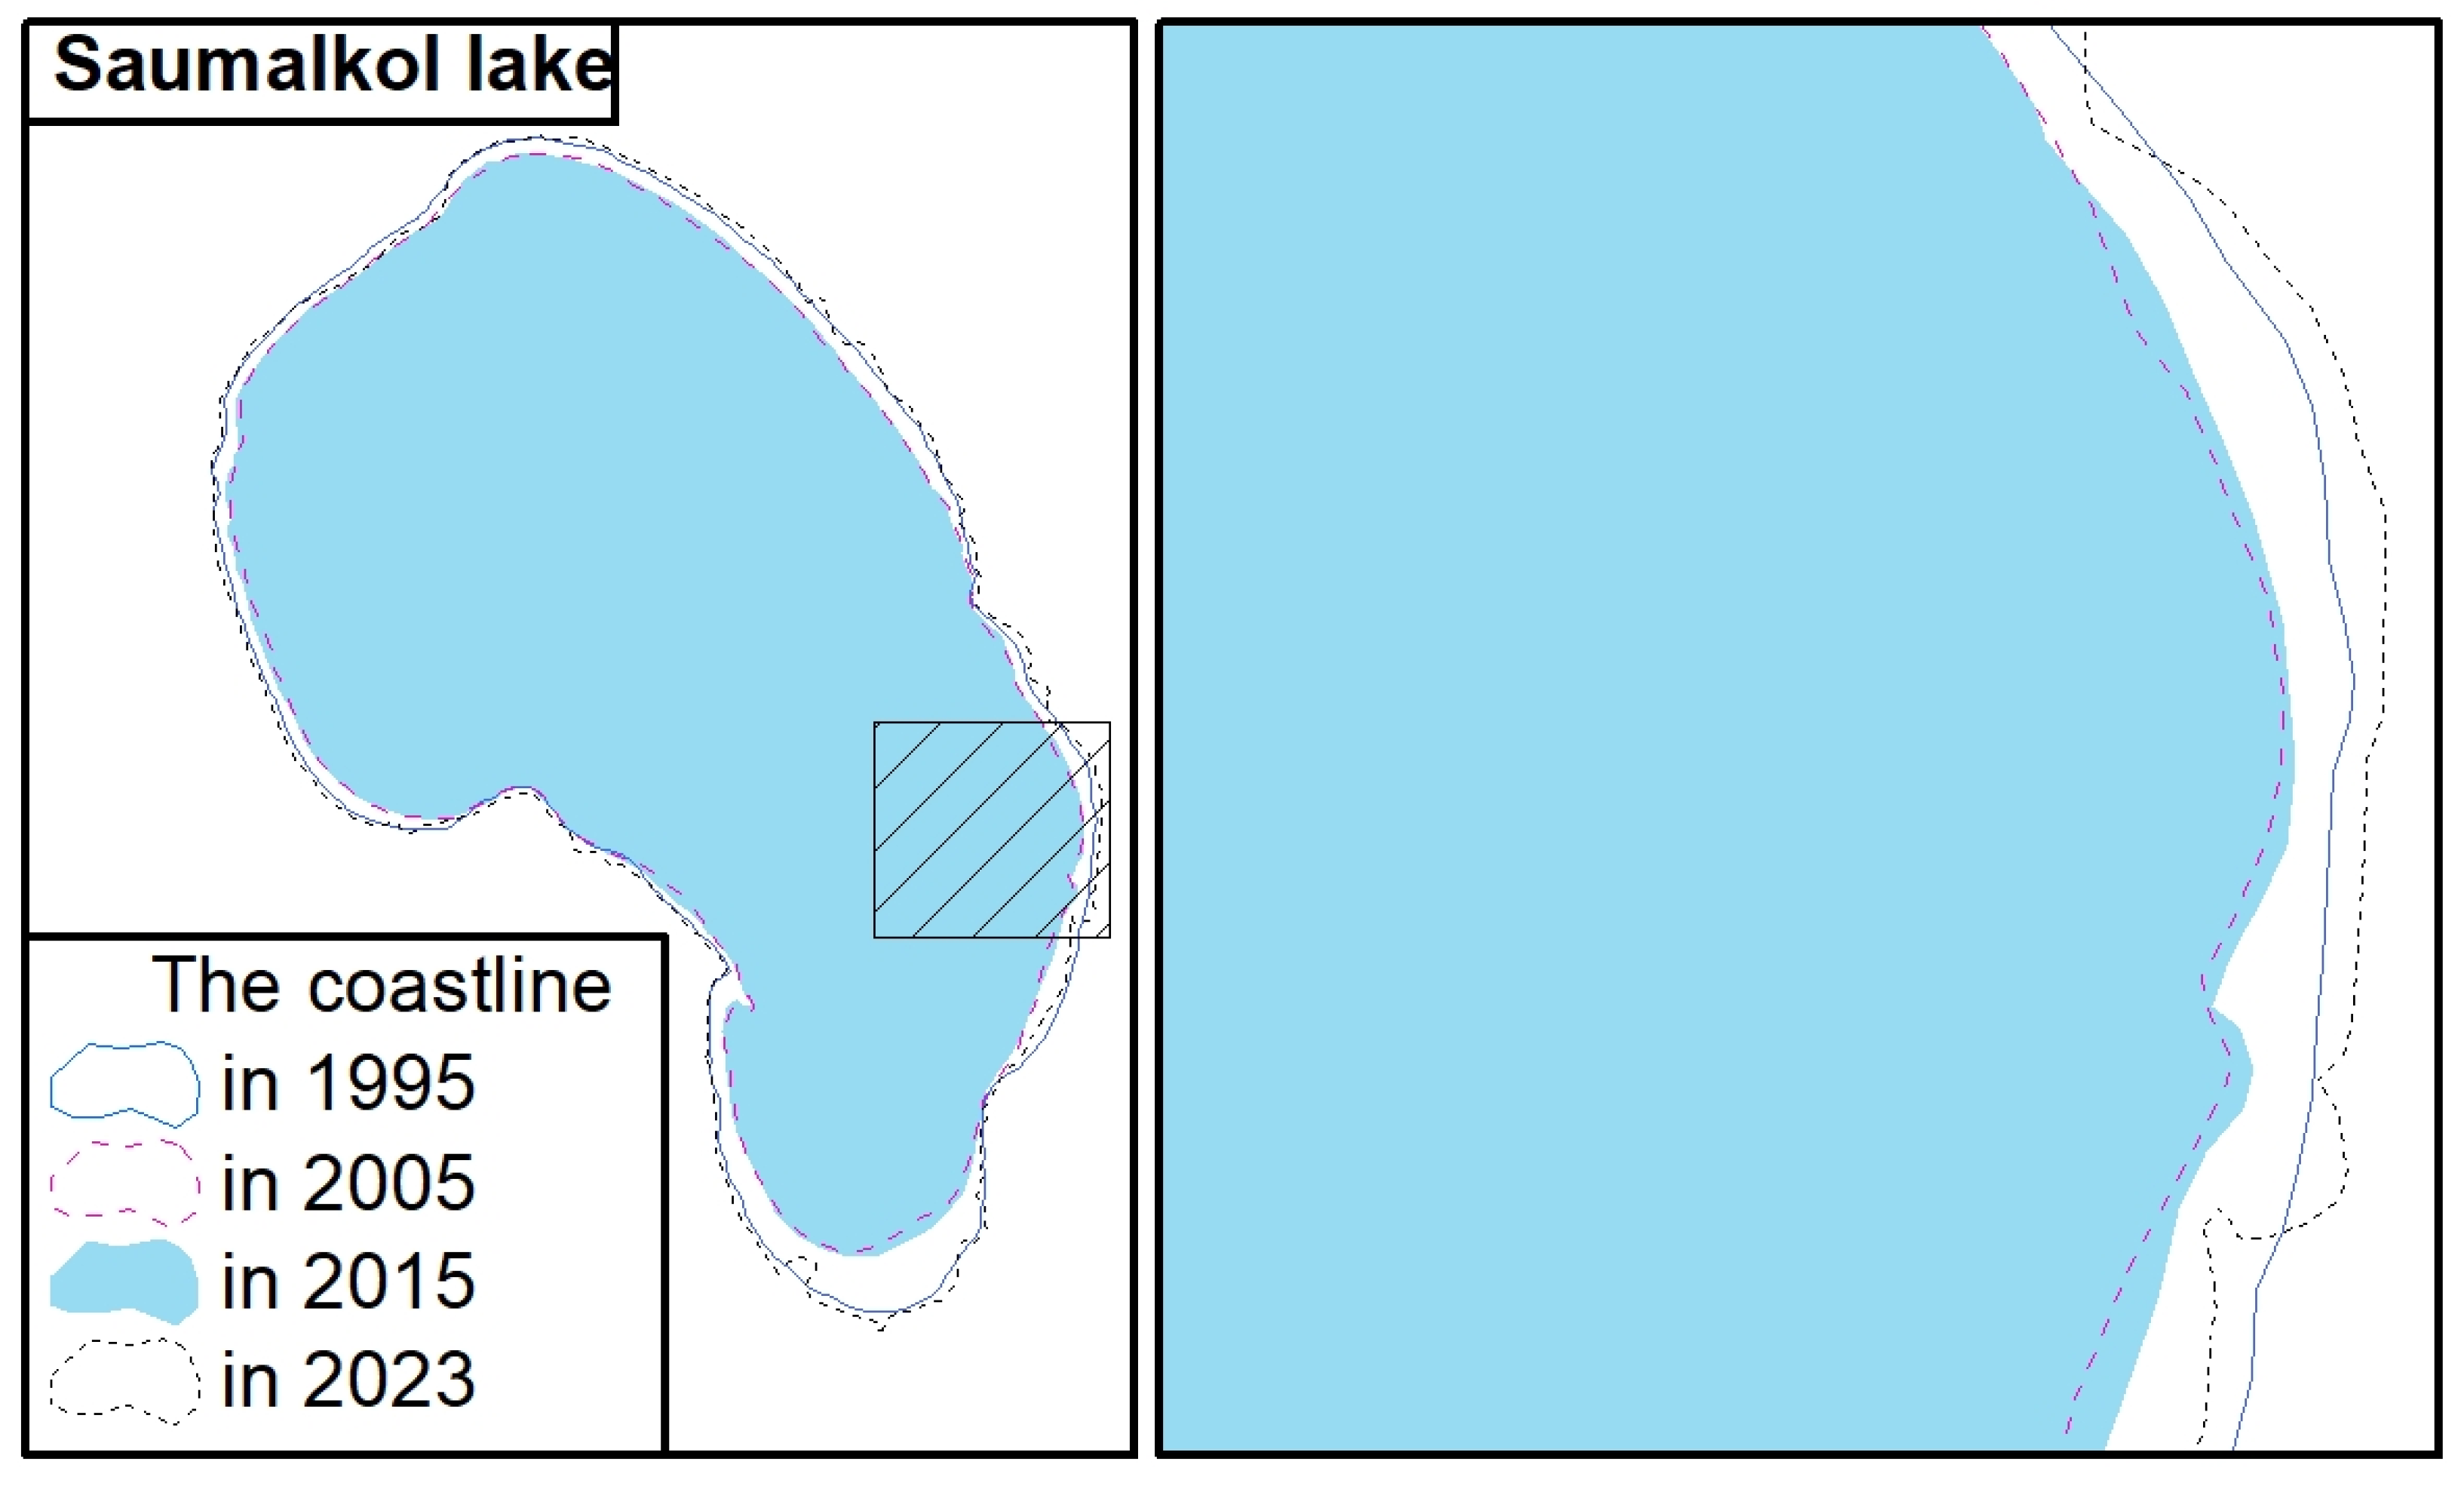
Analysis of data for Lake Saumalkol shows that the area of the lake changed from 21.1 km2; in 1995 to 21.5 km2; in 2023, with a slight decline and subsequent recovery over this period. Rainfall increased from 398 mm in 1995 to 478 mm in 2023, showing an overall upward trend. The average temperature also increased from 2.2°C in 1995 to 3.1°C in 2023 (Figure 5).
The correlation of r=-0.28 between lake area and precipitation suggests a weak negative correlation. This may seem counterintuitive, as increased rainfall due to higher water levels is generally expected to increase the area of bodies of water. However, the weak connection suggests that other factors may play a more important role in changing the Saumalkol Lake area. Especially groundwater, as groundwater sources used to be involved in feeding the lake. However, under the influence of anthropogenic influences, these springs became clogged. In recent years, underground springs have begun to burst through and fill the lake.
Since lake area and average temperature have a correlation coefficient of 0.28, this also suggests a weak positive correlation. This means that as the average temperature increases, there is a slight increase in lake area, which may be due to various climatic and hydrological processes, including changes in evaporation and precipitation.
Thus, changes in the area of Lake Saumalkol are weakly correlated with both precipitation and average temperature, indicating the complex nature of interactions within the aquatic ecosystem. To gain a deep understanding of the processes affecting the lake area, it is necessary to take into account other factors, such as geological, hydrological and anthropogenic changes.
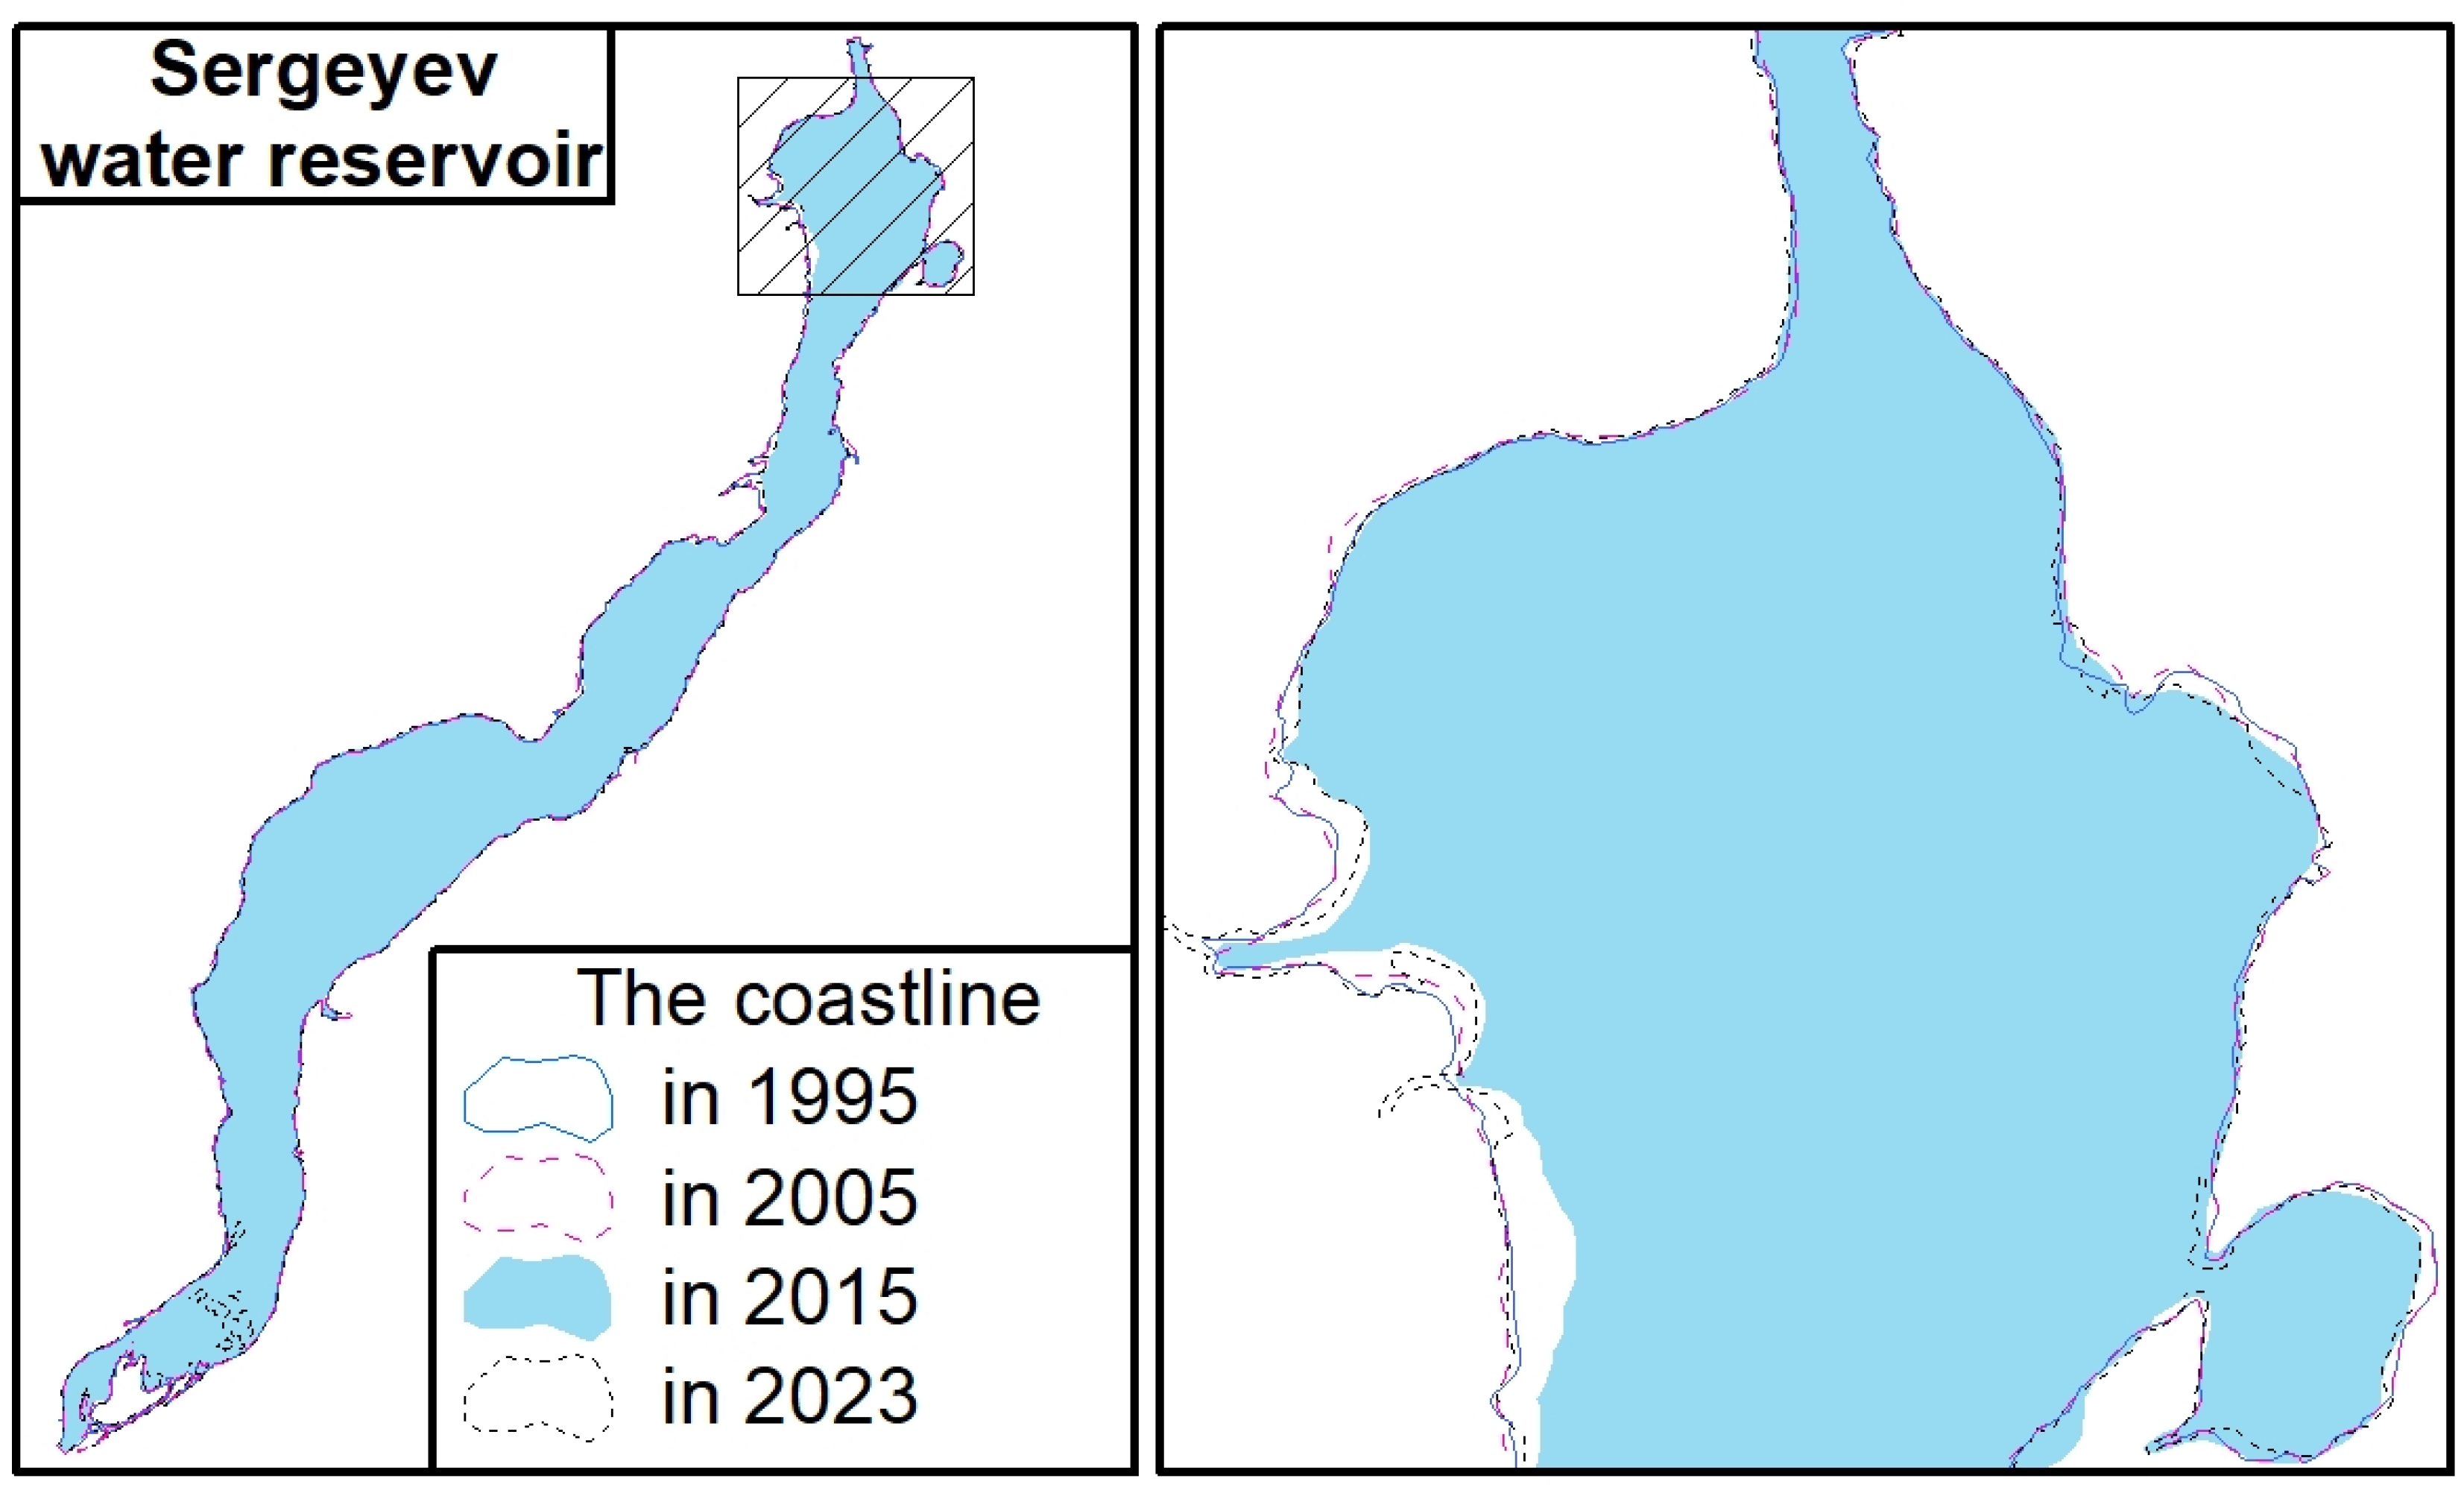
The area of the Sergeyevka reservoir fluctuates with slight changes: the maximum value in 2005 (94.84 km2;) and the minimum in 2015 (93.33 km2;). The latest data for 2023 shows a slight increase compared to 2015 to 93.4 km2;. These changes may indicate small natural fluctuations in water levels or the result of human influence (Figure 6).
To estimate the impact of climate change on the Sergeyevka area, mathematical calculations were carried out. Thus, the value of the correlation between the reservoir area and precipitation was -0.01, which indicates that there is practically no dependence of the area on precipitation. This confirms the assumption that fluctuations in reservoir area are not directly related to precipitation. The correlation between area and mean annual temperature is above 0.7, indicating a moderately positive correlation.
4. Discussion

Our results were derived from historical data on precipitation and air temperature in three regions: Kokshetau, Sergeyevka and Saumalkol, spanning the years 1986 to 2023. Studies have been conducted on temperature change trends over time. In addition, photos of lakes and reservoirs were selected using remote sensing to assess changes in water areas during the low water period. Then, the correlations between the area of water resources and the average annual and temperature precipitation total were calculated. This allowed us to assess the impact of changes in the surface of lakes and reservoirs on 10-year climate data.
It was found that the average air temperature of Kokshetau and the surroundings of Lake Kopa are negatively correlated with each other. This suggests that rising temperatures may lead to greater evaporation, which may reduce the lake's water volume and therefore its area. This connection appears to be stronger than that with precipitation, which could explain the trend of shrinking lake area despite increasing precipitation. Precipitation and lake area have a positive relationship, which could be explained by the fact that more precipitation causes the lake's water level to rise, thereby increasing its surface area. However, the weak correlation suggests that precipitation is not the only or dominant factor affecting the lake area.
The Saumalkol data indicate weak correlations between lake area and the climate factors studied, suggesting that changes in the Saumalkol Lake area cannot be explained by precipitation or average temperature alone. The lake area may also be influenced by factors such as seasonal fluctuations in water levels and changes in groundwater. The weak correlations highlight the complexity of the interactions between climate variables and hydrological properties of the lake. This confirms the need for an integrated approach to the study of aquatic ecosystems that takes into account a variety of factors.
Vadim Yapiyev et al. find that the area of endorheic lakes in SNNP “Burabay” is mainly regulated by climate variability. Evaporation from lakes dominates the water balance of lakes during the period 2000–2013. During most of the period, evaporation from the lakes increased, resulting in a steady decline in the levels of Lakes Shortandy and Ulken Shabakty. After the last drought in 2012, lake levels began to recover due to above-average rainfall [26].
Regarding climate change in Kazakhstan, the studies conducted mainly confirm an increase in the average annual temperature. Vitaliy Salnikov et al. argue that during the study period (1941–2011) trends in increasing surface air temperatures were observed in all seasons on the territory of Kazakhstan. The average annual air temperature across the country increased by 0.28 C/10 years. The greatest warming occurred in winter at a rate of 0.35 C/10 years, and the least warming occurred in summer at a rate of 0.18 C/10 years [28].
The apparent increase in air temperature in the region, especially in winter, spring and autumn, leads to increased evaporation and changes in freeze-thaw cycles. One noticeable effect is a decrease in winter precipitation in the form of snow and an increase in rainfall. This is accompanied by a general decrease in the total amount of annual precipitation. There is no consensus among researchers about changes in total precipitation. However, the observations of many authors do not show a significant trend towards a decrease in annual precipitation [29].

5. Conclusions

For regions with limited water resources, such as North Kazakhstan and Akmola regions, studying the impact of climate change on the amount of water resources is very important. The studies used analysis of temporal trends in temperature and precipitation. Remote sensing images of the examined waters were processed using GIS technologies.
The average annual temperature in Sergeyevka has tended to decrease over the past 38 years. At the same time, the average temperature in Kokshetau increased by 0.7 °C over a period of 38 years compared to the long-term annual average temperature of 2.7 °C. The linear trend shows that the average temperature in Kokshetau will continue to rise.
In Saumalkol there is a tendency towards moderate warming, which is particularly noticeable in the spring and autumn months. Winter temperatures have also shown an improvement since the cold period of 2006-2015. Summer temperatures remain relatively stable with minor fluctuations. Overall, these changes could indicate a changing climate in the region, characterized by milder winters and warmer shoulder seasons.
The average annual precipitation also shows an increasing trend in all locations. There is a significant increase in rainfall in autumn, especially in Kokshetau and Saumalkol.
Mathematical calculations between the area and the average annual temperature in the Sergeyevka reservoir and Kopa Lake showed a moderate relationship. A weak correlation was found at Lake Saumalkol. The correlation between the amount of precipitation and the area of water bodies is also weak.
As the impacts of climate change on water resources in the North Kazakhstan and Akmola regions were found, a forward-looking response is critically important to ensure the sustainability of water resources. Promoting the conservation of water resources is fundamental considering the study results. Efforts to promote efficient agricultural, industrial, and urban water use can help reduce pressure on water resources. It will also be necessary to encourage a change in public behaviour, using a combination of public awareness and educational efforts. Of course, continuous monitoring of hydrometeorological data by the responsible authorities is essential, which will guarantee the accessibility of robust data for informed decision-making.

Author Contributions

For research articles with several authors, a short paragraph specifying their individual contributions must be provided. The following statements should be used “Conceptualization, B.Y., A.K. and A.Kh.; methodology, I.P. and Z.B.; software, I.P.; validation, B.Y., A.K., and A.Kh.; formal analysis, G.K; investigation, B.Y. and A.K.; resources, G.K. and Z.B.; data curation, B.Y. and I.P.; writing—original draft preparation, B.Y.; writing—review and editing, A.Kh. and M.R.; visualization, Z.B. and M.R.; supervision, A.Kh.; project administration, B.Y.; funding acquisition, B.Y. All authors have read and agreed to the published version of the manuscript.”

Funding

This research work was funded by the Science Committee of the Ministry of Science and Higher Education of the Republic of Kazakhstan (Grant No. AP13268760).

Data Availability Statement

Data sharing not applicable. No new data were created or analyzed in this study. The data presented in this study are available on request from the corresponding author.

Acknowledgments

This research work was funded by the Science Committee of the Ministry of Science and Higher Education of the Republic of Kazakhstan (Grant No. AP13268760).

Conflicts of Interest

The authors declare no conflict of interest.

References

  1. Tyumenev, S.D. Water resources and water availability of the territory of Kazakhstan: Textbook. Almaty: KazNTU, 2008. – 267 p.
  2. Free data, statistics, analysis, visualization& sharing. Knoema 2016. Available at: https://knoema.com/ (date of access: 16.05.2024).
  3. Food and Agriculture Organization of the United Nations (FAO), 2016a. AQUASTAT – FAO's Information System on Water and Agriculture. Food and Agriculture Organization, Rome.
  4. Interstate Commission on Sustainable Development (ICSD), 2016. National Report on the State of the Environment and Resource use of Kazakhstan. Astana, 2016. Available at: https://www.mkurca.org/.
  5. Myrzakhmetov, A.I. Ministry of Agriculture. Government hour. Office of the Prime Minister of the Republic of Kazakhstan // Mazhilis of the Parliament of the Republic of Kazakhstan. Report on state support of the Kazakhstani agro-industrial complex and prospects for improving the competitiveness of domestic agribusiness. Astana, 2017. Available at: http://www.parlam.kz.
  6. Hrkal. Will the river Irtysh survive the year 2030? Impact of long-term unsuitable land use and water management of the upper stretch of the river catchment (North Kazakhstan), Environ. Geol. 2006, № 50, 717p.
  7. https://www.akorda.kz/ru/poslanie-glavy-gosudarstva-kasym-zhomarta-tokaeva-narodu-kazahstana-181130.
  8. Dalla Valle, M. , Codato, E., and Marcomini, A. Climate change influence on POPs distribution and fate: A case study. Chemosphere 2007, 67, 1287–1295. [Google Scholar] [CrossRef] [PubMed]
  9. Delpla, I. ,Jung, V.A., Baures, E., Clement, M. and Thomas, O. Impacts of climate change on surface water quality in relation to drinking water production. Environ. int. 2009, 35, 1225–1233. [Google Scholar] [CrossRef] [PubMed]
  10. Whitehead, P. , Wilby, R., Battaree, W.R., Kernan, M., and Wade, J.A. A review of the potential impacts of climate change on surface water quality. Hydrol. Sci. J. 2009, 54, 101–123. [Google Scholar] [CrossRef]
  11. EEA. Annual report 2010 and Environmental Statement 2011. Copenhagen, 2017. – 100 р.
  12. Climate Change 2021: The Physical Science Basis. Contribution of Working Group I to the Sixth Assessment Report of the Intergovernmental Panel on Climate Change.
  13. Reyer, C. , Otto, I. M., Adams, S. et al. Climate change impacts in Central Asia and their implications for development. Reg Environ Change 2017, 17, 1639–1650. [Google Scholar] [CrossRef]
  14. Marat Karatayev, Michèle Clarke, Vitaliy Salnikov, Roza Bekseitova, Marhaba Nizamova. Monitoring climate change, drought conditions and wheat production in Eurasia: the case study of Kazakhstan. Heliyon. 2022,Volume 8, Issue 1, e08660,ISSN 2405-8440. [CrossRef]
  15. Vitaliy Salnikov, Galina Turulina, Svetlana Polyakova, Yevgeniya Petrova, Aizhan Skakova, Climate change in Kazakhstan during the past 70 years, Quaternary International, 2015, Volume 358, 77-82, ISSN 1040-6182. [CrossRef]
  16. Iulii Didovets, Anastasia Lobanova, Valentina Krysanova, Christoph Menz, Zhanna Babagalieva, Aliya Nurbatsina, Nadejda Gavrilenko, Vohid Khamidov, Atabek Umirbekov, Sobir Qodirov, Dowletgeldi Muhyyew, Fred Fokko Hattermann, Central Asian rivers under climate change: Impacts assessment in eight representative catchments. Journal of Hydrology: Regional Studies 2021, 34, 100779. [CrossRef]
  17. Li, Y. , Zhu, S., Hang, X., Sun, L., Li, X., Luo, X., & Han, X. Variation of Local Wind Fields under the Background of Climate Change and Its Impact on Algal Blooms in Lake Taihu, China. Water 2023, 15, 4258. [Google Scholar]
  18. Ramazanova, M. , Bulai, M., Ursu, A., Tortella, B., & Kakabayev, A. Effects of tourism development on surface area of main lakes of Shchuchinsk-Burabay resort area, Kazakhstan. European Journal of Tourism Research 2019, 21, 69–86. [Google Scholar]
  19. Ramazanova, M. , Tortella, B. D., Kakabayev, A., Caldeira, A. M., & Carneiro, M. J. Do Sustainability Perceptions Affect Lake Destination Loyalty? Sustainability 2023, 15, 13954. [Google Scholar]
  20. Karthe. Water resources and their management in Central Asia in the early twenty first century: status, challenges and future prospects, Environ. Earth Sci. 2015, № 73, с.
  21. Akiyanova FZh, Frolova NL, Avezova AA, Shaimerdenova AM, Oleshko A. B. Water resources and system of the River Yesil (ISHIM) under conditions of active anthropogenous transformation and climate change. Eurasia J Biosci 2019, 13, 1275–1289. [Google Scholar]
  22. Uanxuan Wang, Yaning Chen, Zhi Li, Gonghuan Fang, Yi Wang, Development and utilization of water resources and assessment of water security in Central Asia, Agricultural Water Management, 2020, Volume 240, 106297, ISSN 0378-3774. [CrossRef]
  23. Aisulu Tursunova, Akhmetkal Medeu, Sayat Alimkulov, Assel Saparova, Gaukhar Baspakova. Water resources of Kazakhstan in conditions of uncertainty. JOURNAL OF WATER AND LAND DEVELOPMENT, 2022, 54(VII–IX), 138–149. [CrossRef]
  24. Akiyanova, F. Z. , Frolova, N. L., Shaimerdenova, A. M., Karakulov, Y. M., & Oleshko, A. B. Impact of anthropogenic transformation of riverbeds on the water resources of arid regions (the Yesil and Nura rivers case, North Kazakhstan). Series of geology and technical sciences ISSN 2224-5278. 2019,Volume 6, Number 438, 197 – 207. [CrossRef]
  25. Shulembayeva, K.; Rodrigo-Ilarri, J.; Rodrigo-Clavero, M.-E.; Khussainov, A.; Kakabayev, A.; Khussainova, R. Assessment of the Hydrophysical and Hydrochemical Characteristics of Lake Burabay (Akmola Region, North Kazakhstan). Sustainability 2023, 15, 11788. [Google Scholar] [CrossRef]
  26. Vadim Yapiyev, Kanat Samarkhanov, Nazym Tulegenova, Saltanat Jumassultanova, Anne Verhoef, Zarina Saidaliyeva, Nursultan Umirov, Zhanay Sagintayev, Assel Namazbayeva, Estimation of water storage changes in small endorheic lakes in Northern Kazakhstan, Journal of Arid Environments, 2019, Volume 160, Pages 42-55, ISSN 0140-1963. [CrossRef]
  27. Kakabayev, A. Yessenzholov, B. Khussainov, A. Rodrigo-Ilarri, J.; Rodrigo-Clavero, M.-E.; Kyzdarbekova, G.; Dankina, G. The Impact of Climate Change on the Water Systems of the Yesil River Basin in Northern Kazakhstan. Sustainability 2023, 15, 15745. [Google Scholar] [CrossRef]
  28. Vitaliy Salnikov, Galina Turulina, Svetlana Polyakova, Yevgeniya Petrova, Aizhan Skakova, Climate change in Kazakhstan during the past 70 years, Quaternary International, 2015, Volume 358, Pages 77-82,ISSN 1040-6182. [CrossRef]
  29. Collins M, Knutti R, Arblaster J, Dufresne J-L, Fichefet T, Friedlingstein P, Gao X, Gutowski WJ, Johns T, Krinner G, et al. Climate Change 2013: The Physical Science Basis. IPCC Working Group I Contribution to AR5. Cambridge: Cambridge University Press; 2013.
Figure 1. Trends in changes in average annual temperature in Kokshetau.
Preprints 109794 g001
Figure 2. Trends in changes in average annual temperature in Sergeyevka.
Preprints 109794 g002
Figure 3. Trends in changes in average annual temperature in Saumalkol.
Preprints 109794 g003
Figure 4. Map of changes in the shorelines of Lake Kopa and Shagalaly Reservoir.
Preprints 109794 g004
Figure 5. Map of changes in the shorelines of Lake Saumalkol.
Preprints 109794 g005
Figure 6. Map of changes in the shorelines of Sergeyevka reservoir.
Preprints 109794 g006
Table 2. Precipitations.
Kokshetau
Years winter spring summer autumn average
1986-1995у. 36,1 50,5 161,2 50,7 299
1996-2005у. 42,5 57,65 141,5 58,6 300
2006-2015у. 38,5 68,8 157 65,7 330
2016-2023у. 45,3 53,8 146,6 81,3 327
Saumalkol
Years winter spring summer autumn average
1986-1995у. 70 86 150 92 397
1996-2005у. 72 93 171 98 433
2006-2015у. 119 114 178 115 526
2016-2023у. 93 86 168 131 478
Sergeevka
Years winter spring summer autumn average
1986-1995у. 59 67 144 81 352
1996-2005у. 59 96 151 91 396
2006-2015у. 57 97 161 86 401
2016-2023у. 61 77 158 92 388
Disclaimer/Publisher’s Note: The statements, opinions and data contained in all publications are solely those of the individual author(s) and contributor(s) and not of MDPI and/or the editor(s). MDPI and/or the editor(s) disclaim responsibility for any injury to people or property resulting from any ideas, methods, instructions or products referred to in the content.
Copyright: This open access article is published under a Creative Commons CC BY 4.0 license, which permit the free download, distribution, and reuse, provided that the author and preprint are cited in any reuse.
Prerpints.org logo

Preprints.org is a free preprint server supported by MDPI in Basel, Switzerland.

Subscribe

© 2024 MDPI (Basel, Switzerland) unless otherwise stated