Introduction
Clostridioides difficile, an anaerobic Gram-positive pathogen [
1], is notorious for causing a spectrum of gastrointestinal ailments, including diarrhea, toxic megacolon, and pseudomembranous colitis [
8]. In healthcare environments,
C. difficile infection (CDI) is strongly correlated with antibiotics, which disrupt the normal colonic bacterial population, leading to dysbiosis. This disruption affects the metabolism of bile salts, particularly taurocholate, which is crucial for
C. difficile spore germination [
2,
3,
4,
5,
6,
7]. The mortality rate associated with CDI typically hovers around 5%, but during severe outbreaks, it can spike to 20% [
5]. Furthermore, CDI recurrence poses a substantial challenge in management, with up to 35% of patients experiencing a recurrence after their initial episode [
11], and the likelihood of recurrence escalating with subsequent episodes. Recurrence may involve either the relapse of the same strain or reinfection with a different strain, occurring in approximately 38-56% of cases [
12,
13]. A key contributor to recurrent disease is
C. difficile's capacity to re-sporulate and persist in the gastrointestinal tract, even in the presence of antibiotics [
11]. Current guidelines and FDA approval lists offer multiple treatment options (vancomycin, fidaxomicin, metronidazole) and possible adjunctive therapies (anti-toxin antibodies, FMT, among others, [
54] but vancomycin and fidaxomicin are the current standard treatments for CDI [
55]. This antibiotic, belonging to the class of tricyclic glycopeptides, inhibits cell wall synthesis by binding to the D-alanyl-D-alanine ends of cell wall precursors [
14].
Recent investigations suggest that the outcomes of CDI may not solely correlate with virulence characteristics or sporulation levels, indicating the involvement of other biological processes.[
8] The bacterium's persistence in biofilms could underlie colonization and relapse, potentially facilitating adherence to colonic epithelial cells [
16,
17,
18,
19], in which sporulation and persister cell formation could be different mechanisms for pathogen persistence occurring at different stages of the infectious cycle, serving different purposes. Sporulation is a complex and gradual process that produces a resilient morphotype, the spore, adapted for transmission between hosts or as a long-term reservoir between recurrent infections [
2,
3,
4,
5,
6,
7]. In contrast, persister cells are generated more rapidly, which is particularly suited for antibiotic tolerance during biofilm formation [
15,
20,
21,
22,
23,
24,
25,
26].
On the other hand, it has been hypothesized that two types of persister cells exist. Triggered persister cells (or Type I) are induced by environmental stimuli, such as antibiotic use, while spontaneous (or Type II) persister cells arise stochastically during bacterial growth; these persister cells accumulate during growth and are typically found in the stationary phase [
23,
24,
25,
26]. Since Balaban defined persistence to antibiotics in 2019, triggered persistence has been observed in bacteria as a response to stress signals like starvation, where cells enter a persistent state even after the stress is removed. Various stressors can trigger this persistence, including nutrient limitation and antibiotic exposure. Spontaneous persistence, on the other hand, happens without an obvious trigger during stable growth conditions and remains constant [
52]. Despite recent advances in the field, the mechanisms responsible for persister cell formation in
C. difficile are still largely unknown. This lack of understanding can be attributed, to a significant extent, to the challenges associated with isolating the exceedingly small fraction of the population that finds itself in this state at any given point in time, as well as the anaerobic characteristics of this pathogen. In this study, we present, to our knowledge, the first investigation that enables the enrichment of
C. difficile persister cells and allows for their thorough characterization. We have successfully differentiated between two distinct types of persister cells, namely triggered persister cells induced by vancomycin during both the exponential and stationary phases and spontaneous persister cells induced by stochastic processes. Additionally, we identified RNA metabolic-decreased persister cells in
C. difficile. In addition to these findings, we have also observed overexpression of toxin-antitoxin systems and Clp protease genes, which are known to play pivotal roles in forming persister cells in several bacteria [
30,
31,
32,
33,
34].
Discussion
Persister cells typically accumulate during the exponential growth phase, reaching their peak expression in the stationary phase, which aligns with the characterization of spontaneous persister cells [
15]. This observation was supported by research from Yang in 2016 and Cañas-Duarte in 2014, indicating that such cells arise stochastically during bacterial growth [
23].
This study demonstrated the presence of both triggered persister cells induced by vancomycin and spontaneous in
C. difficile. It is worth noting that the presence of taurocholate, acting as a spore germinant, initiated the germination process in the spores within the culture, leading to a decrease in the total number of spores in the medium, consistent with findings from previous research by other investigators [
42]. Additionally, rapidly metabolized sugars, such as glucose and fructose, have been found to regulate approximately 18% of the
C. difficile transcriptome, with half of these genes regulated by CcpA. This protein forms part of a regulon responsible for controlling sugar uptake and gene regulation [
43]. Earlier studies (Antunes, 2012) have demonstrated that CcpA suppresses the expression of Spo0A and SigF, which are early regulators of sporulation [
43]. Consequently, the presence of these sugars inhibits the expression of these genes, thus preventing spore formation during cultivation, which corroborates the absence of spores in all the cultures analyzed. The lysis treatment unveiled a plateau of persister cells, indicating the presence of cells with reduced metabolism and cell division [
23]. A comparison with a previous study by Cañas-Duarte in 2014 revealed consistency in identifying the plateau within a similar time interval despite the lack of detail regarding the lysis treatment in that study. Unlike Cañas-Duarte, our approach involved generating a curve with revived cells, thereby resolving potential confusion between persister and resistant cells.
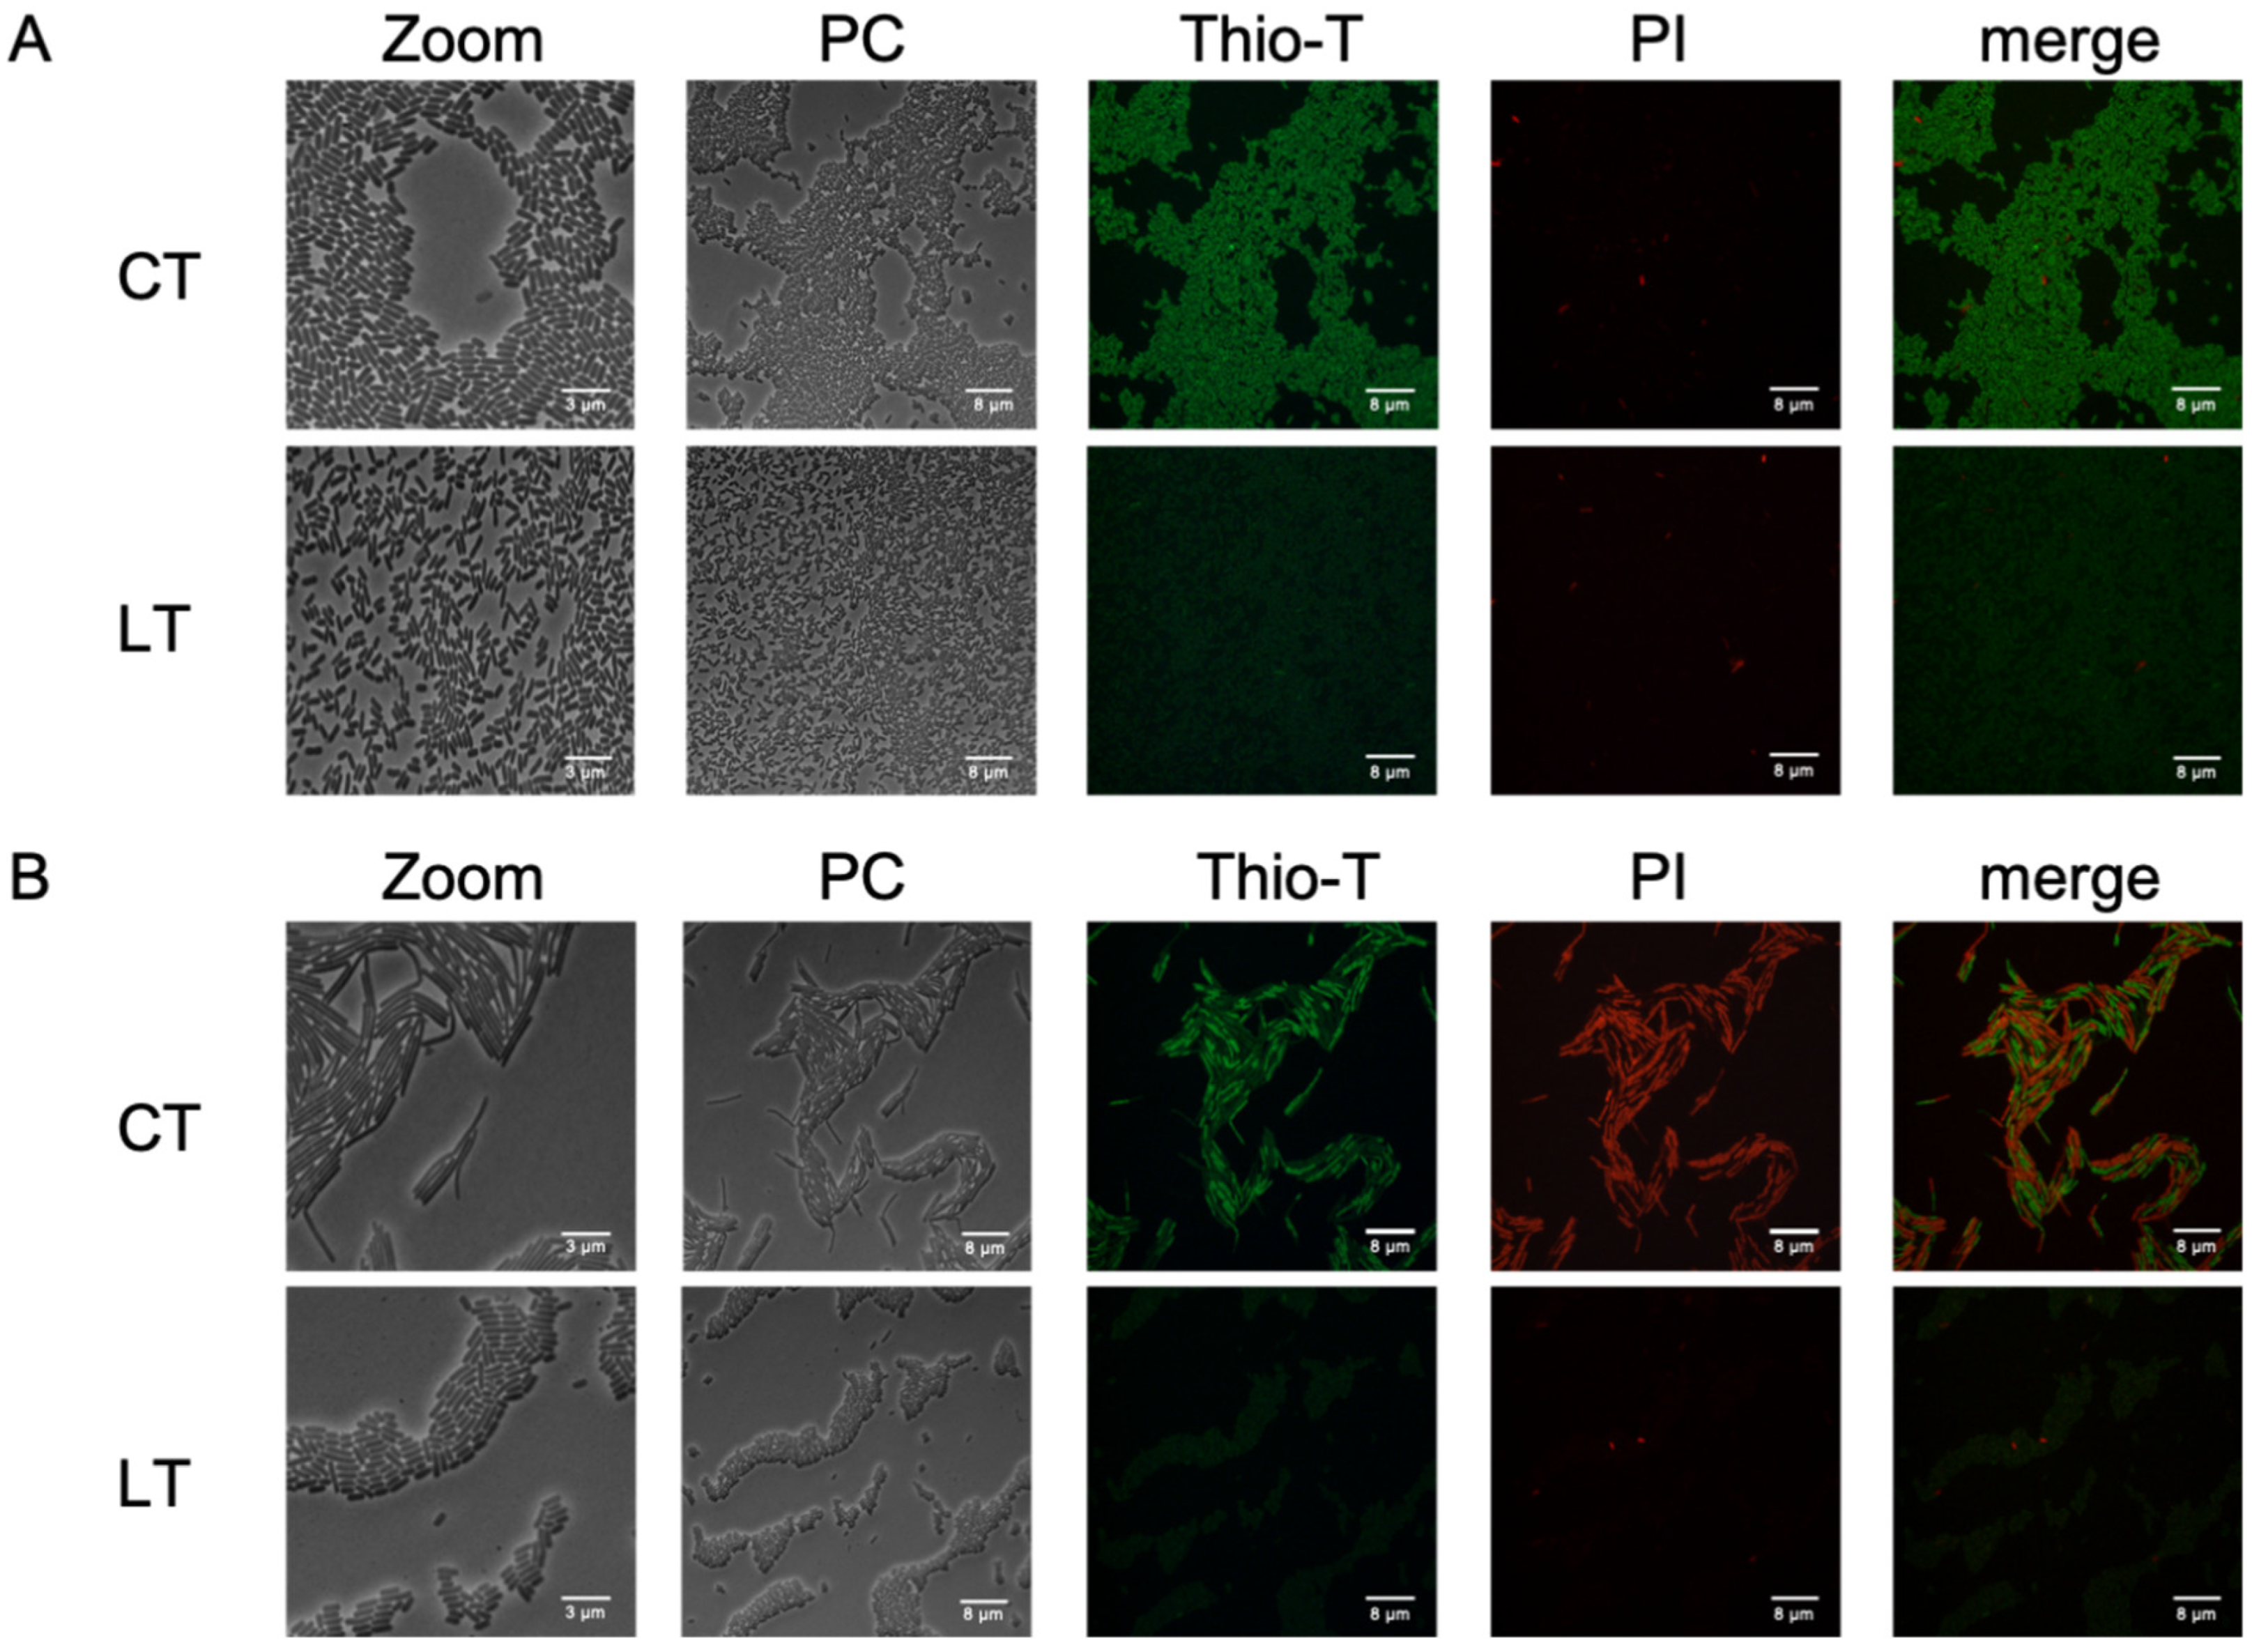
Thioflavin-T and Propidium Iodide stains helped us observe
C. difficile cells with inactive RNA metabolism and living cells after lysis treatment. This approach provided an alternative to cell sorting methods used for aerobic bacteria and revealed unique shapes in spontaneous persister cells [
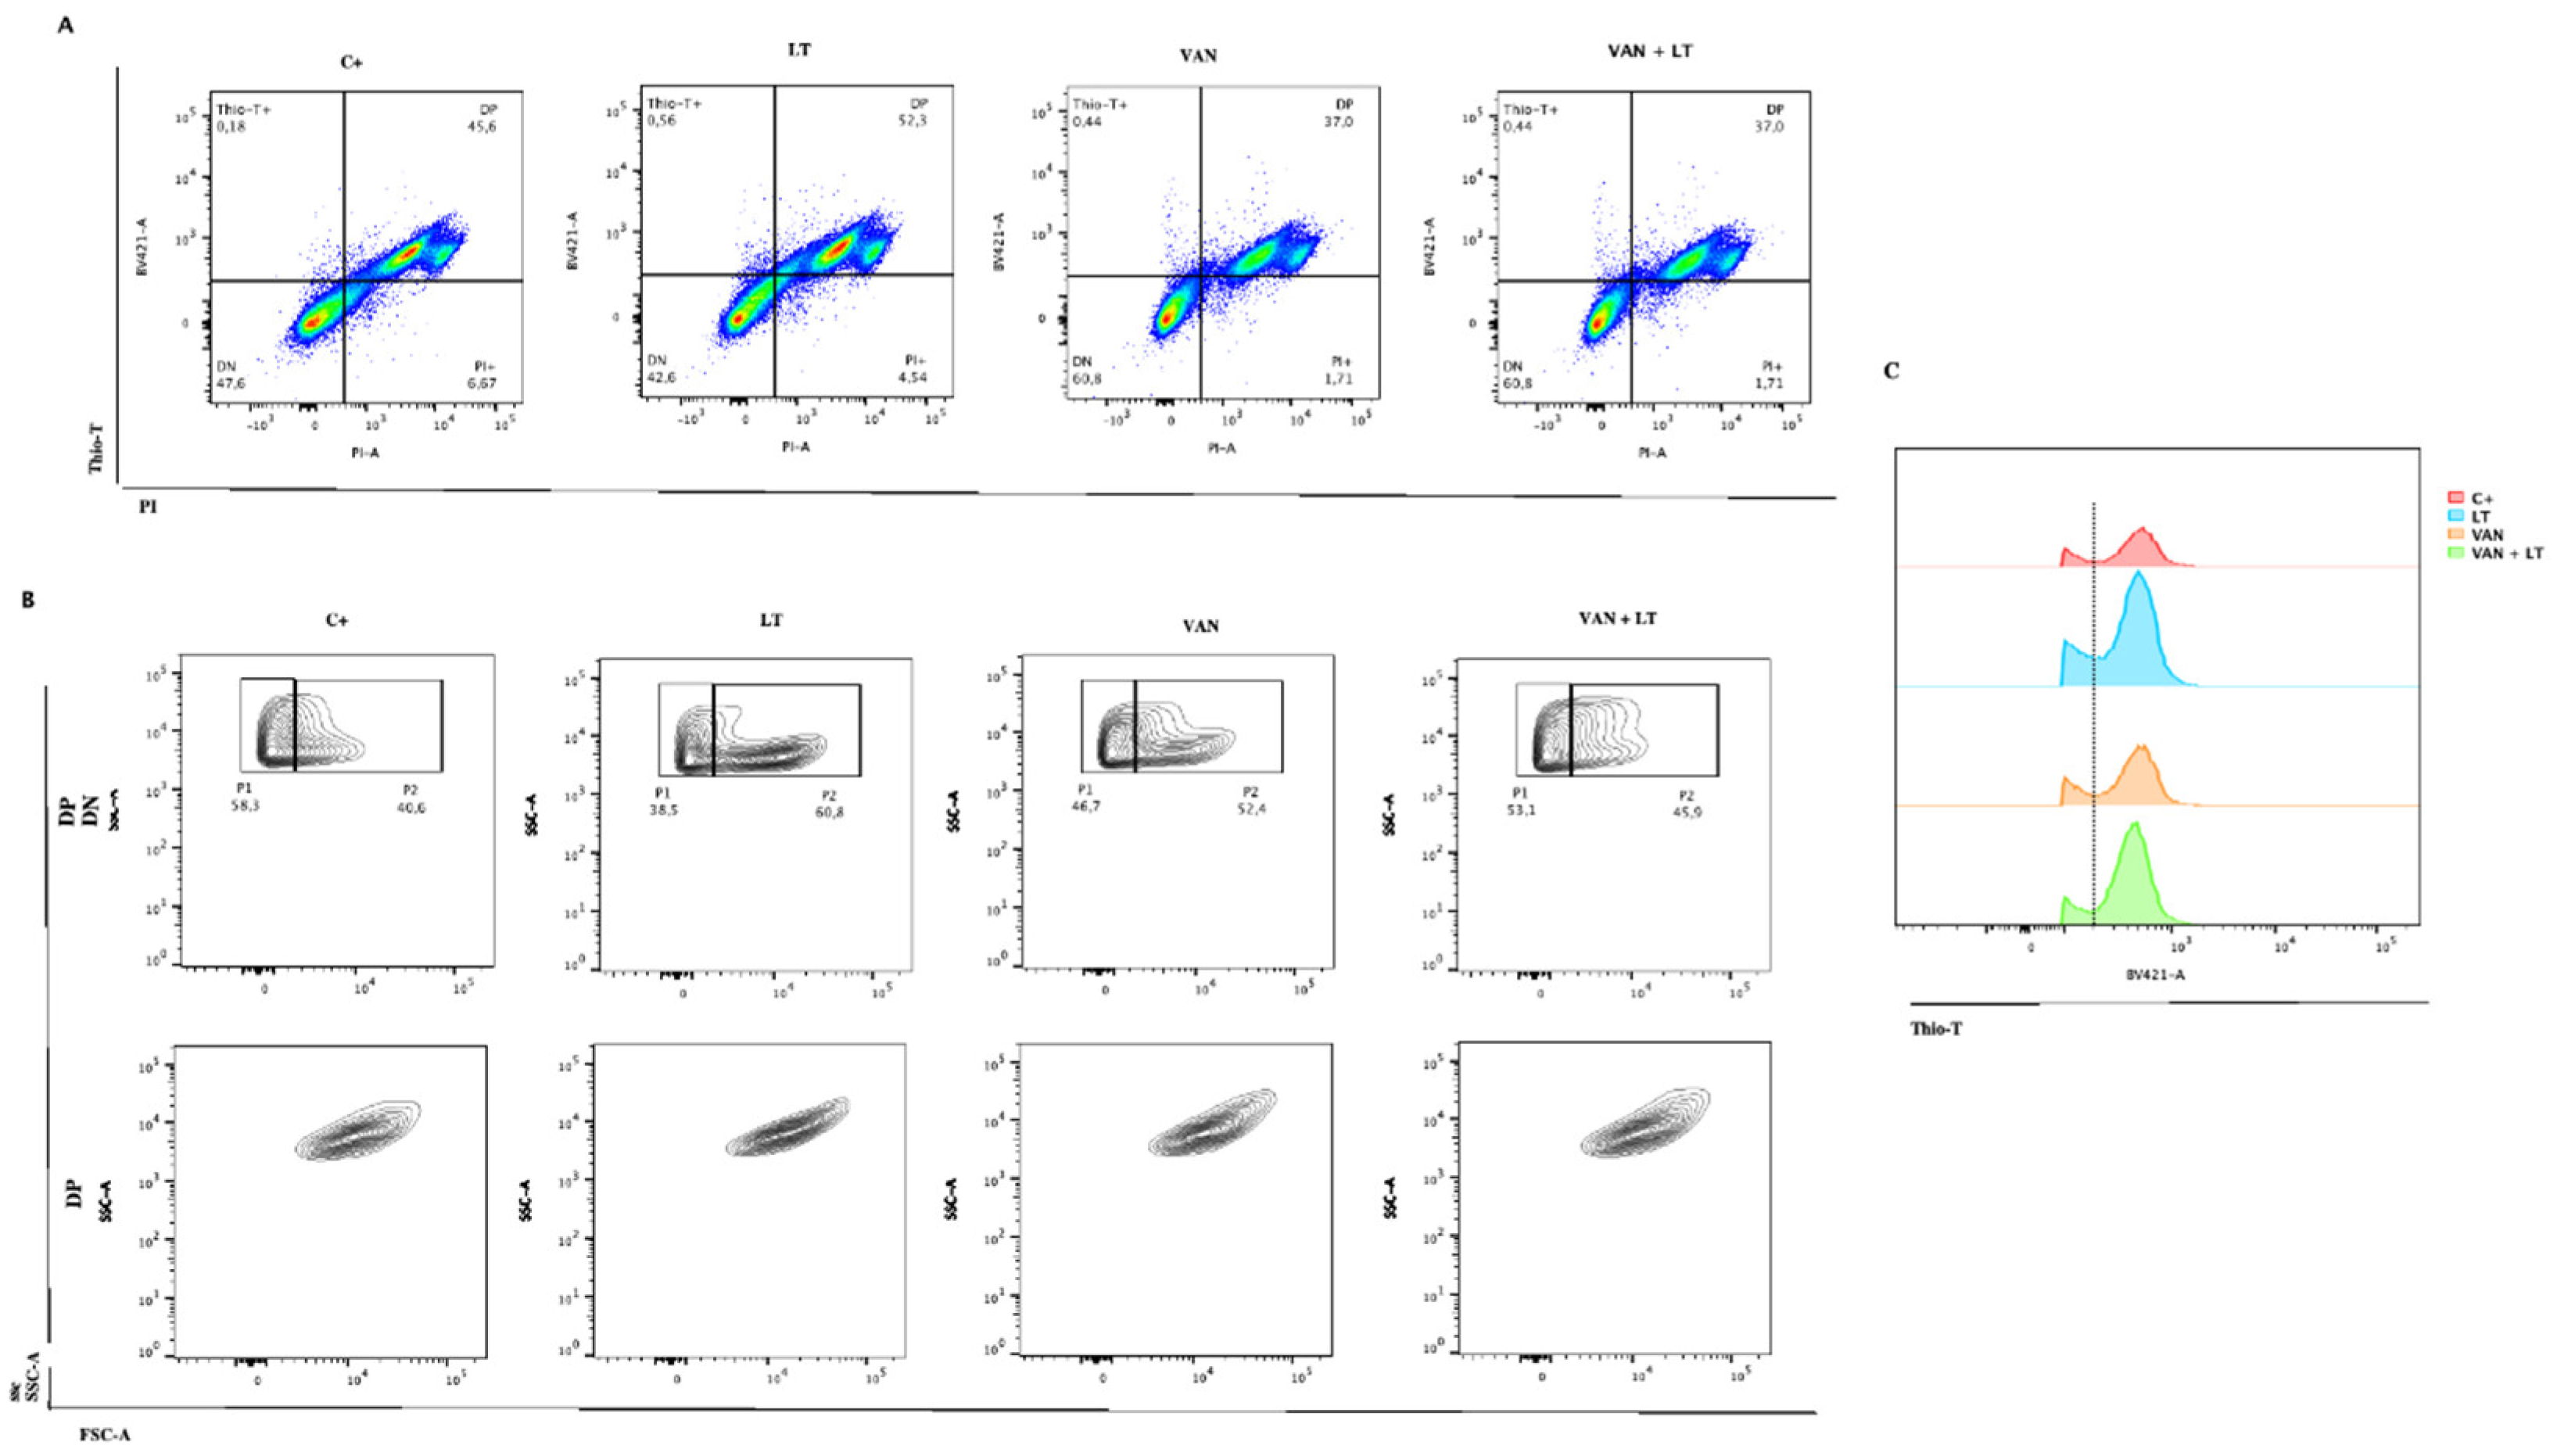
23], which appeared as short bacilli. Additionally, when examining the complexity of the cells using flow cytometry, we found that most cells treated with LT had fewer complex bacilli. However, with vancomycin and vancomycin combined with LT, a new population of more complex cells emerged (
Figure 6B). We believe these more complex cells are the long and short bacilli seen under the microscope. This finding offers new insights into
C. difficile and adds to the growing understanding of the different shapes and electron densities of persister cells [
35].
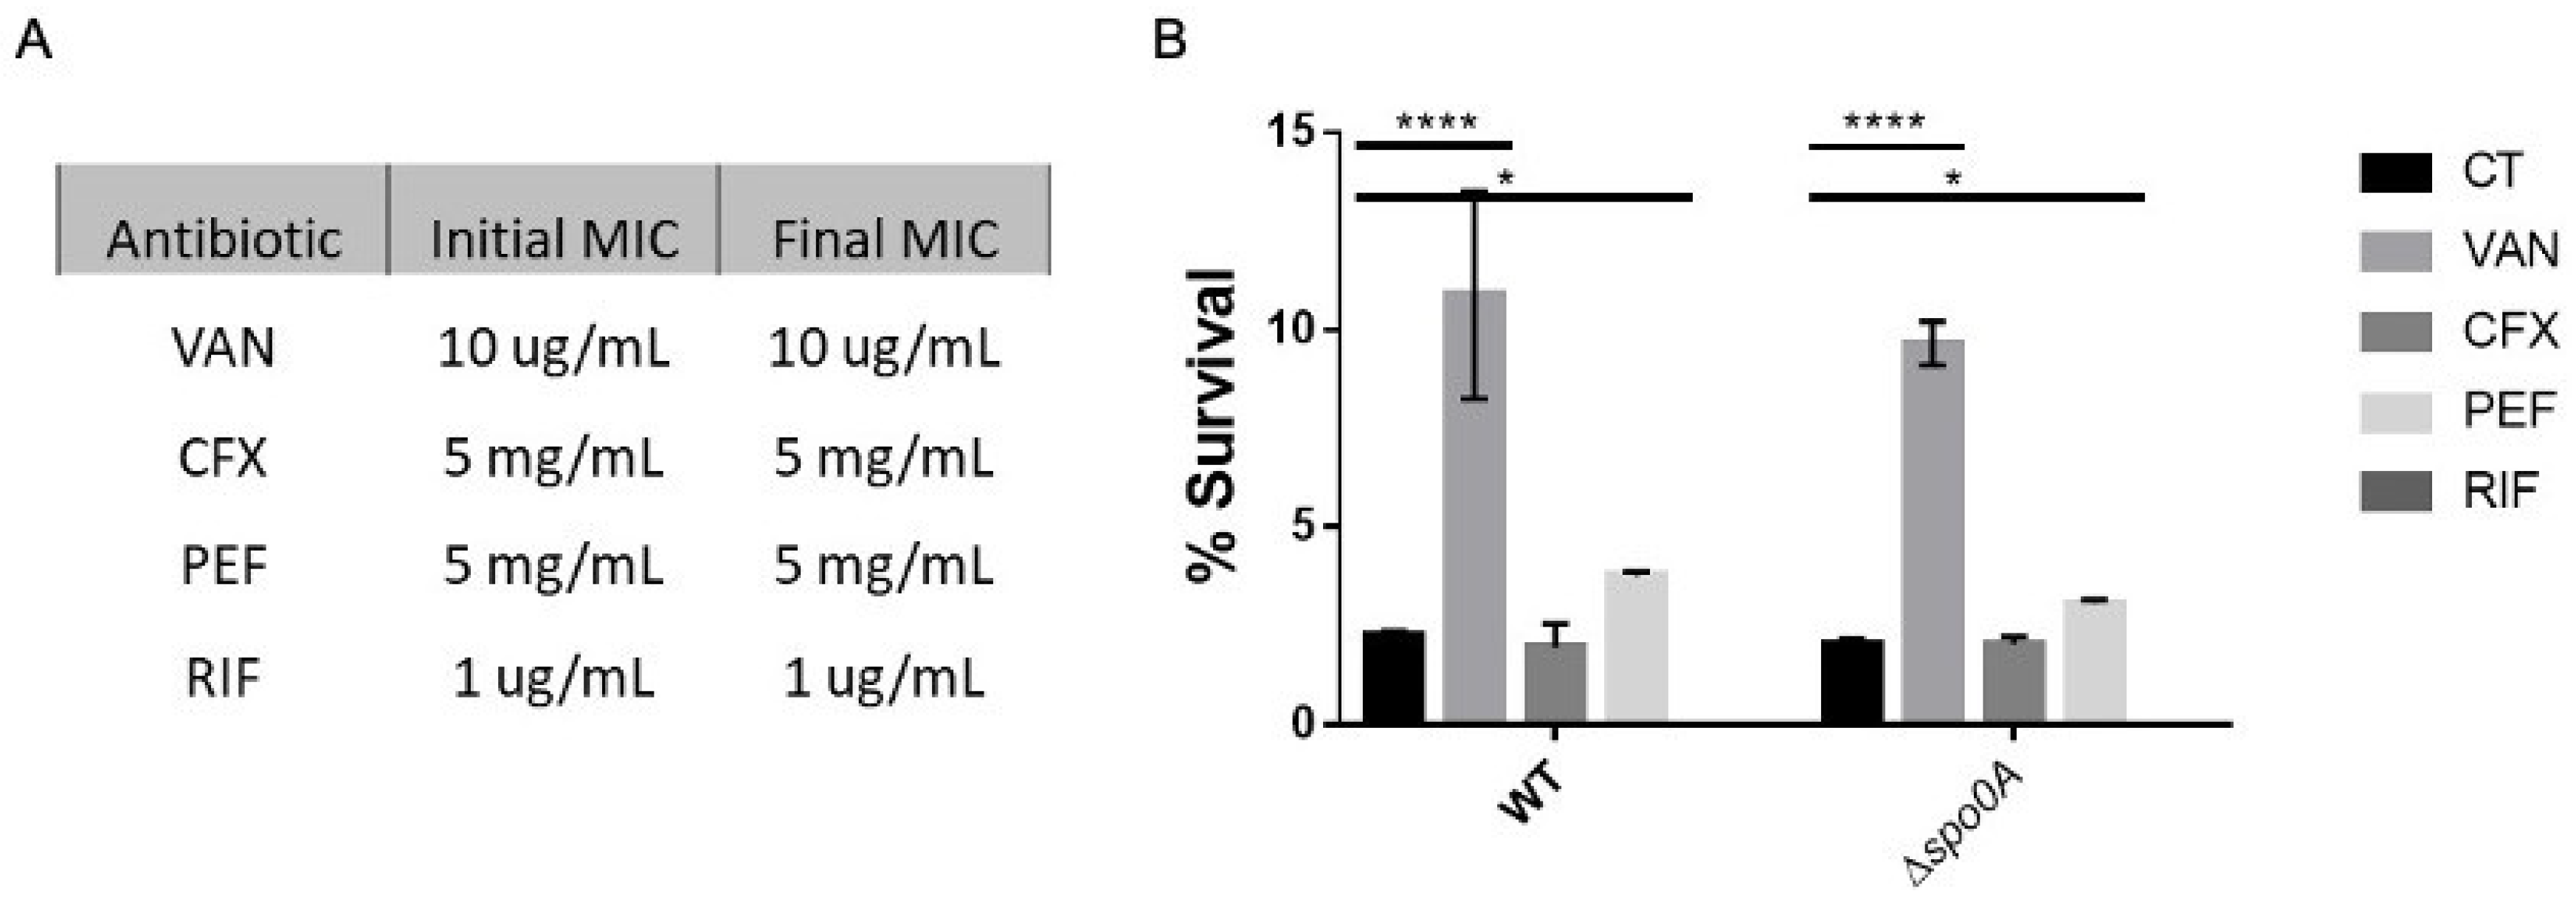
The antibiotic evaluation showed that vancomycin and pefloxacin increased the number of persister cells, with the former selected for further investigation due to its use in treating
C. difficile-associated diseases. This finding supports previous studies suggesting the involvement of vancomycin in the persister cells formation [
36].
In order to demonstrate the persister phenotype, bacteria were revived, and the protocol was replicated. This phenomenon mirrors observations conducted by other researchers using
E. coli as a model, where persister cells were isolated with antibiotics (without lysis treatment) [
15], and upon bacterial revival, the phenomenon recurred. Importantly, this consistency in occurrence appears independent of the antibiotic utilized, indicating that methods for isolating persister cells are generally unaffected by cells acquiring antibiotic resistance. Notably, these observations were made during the exponential phase, indicating the predominance of triggered persister cells.
Upon microscopic examination of these cultures, various bacterial morphologies were discernible. In phase contrast, elongated bacillus morphology predominated, alongside a significant presence of bacteria with short bacillus morphology.
Thioflavin-T and Propidium Iodide stains helped us observe C. difficile cells with inactive RNA metabolism and living cells after lysis treatment. This approach provided an alternative to cell sorting methods used for aerobic bacteria and revealed unique shapes in spontaneous persister cells, which appeared as short bacilli.
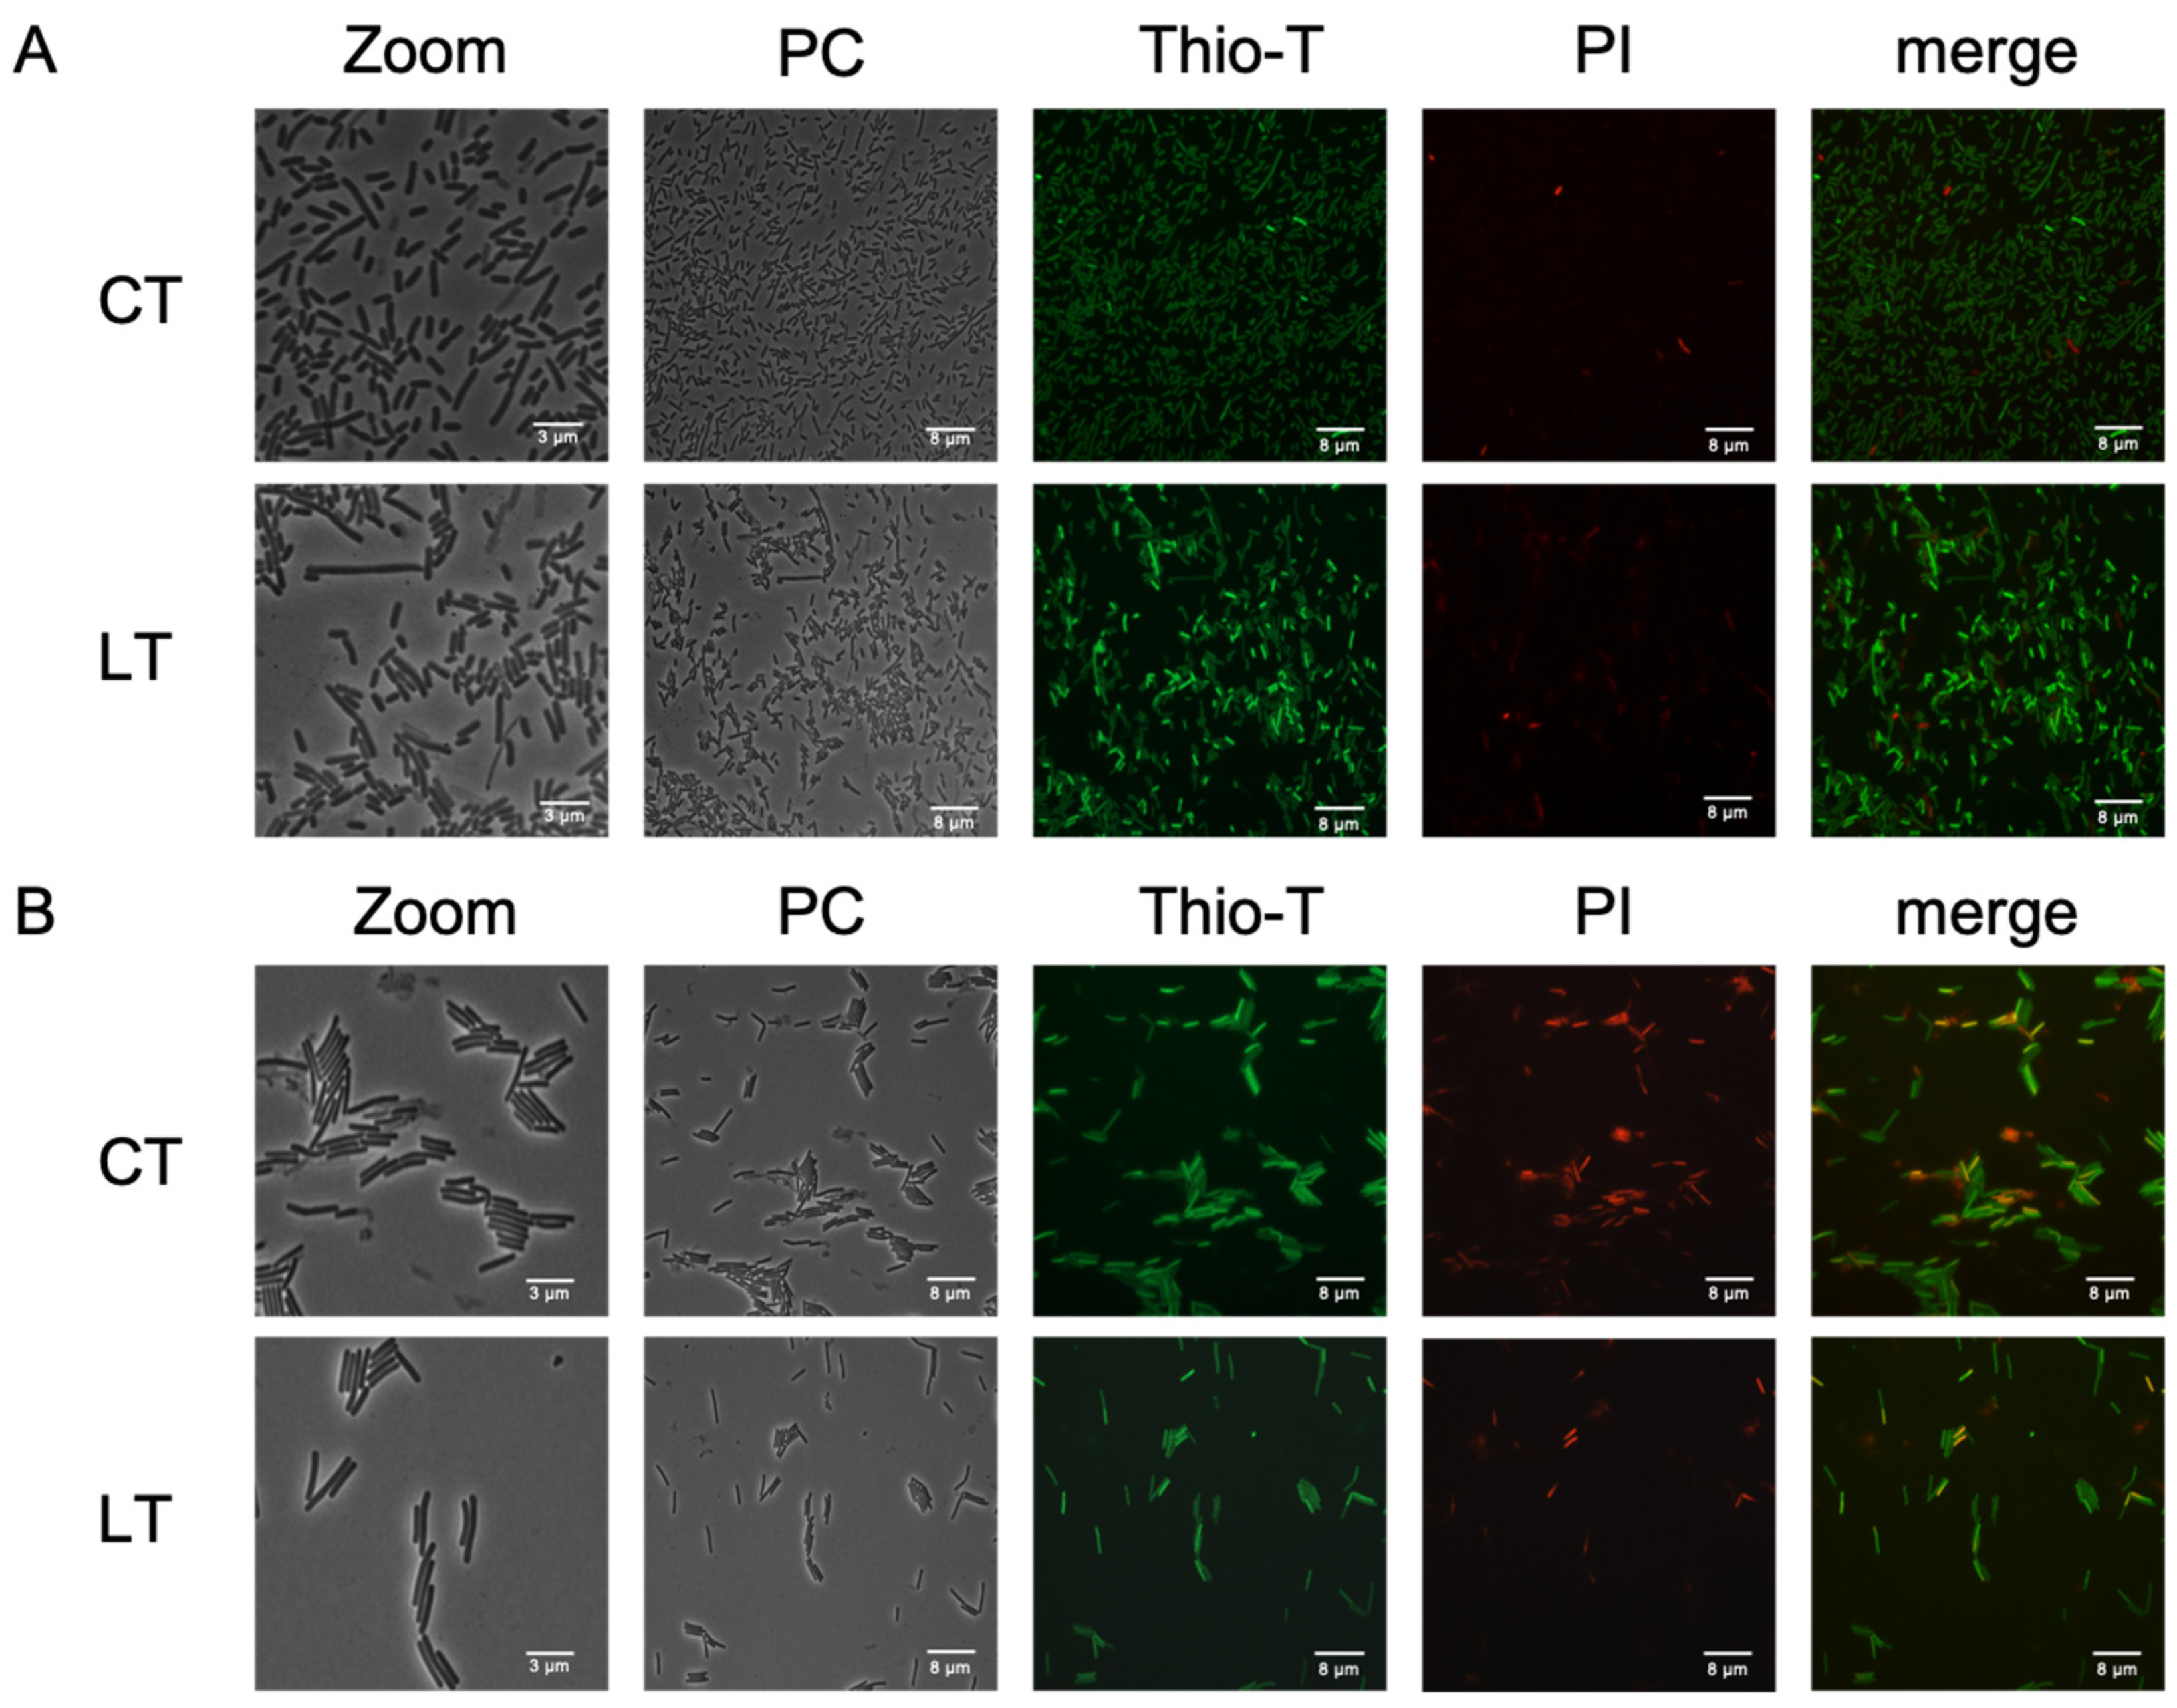
Examination of bacteria treated solely with vancomycin (VAN) revealed that many exhibited decreased RNA metabolisms but remained predominantly viable, with no apparent cell wall damage (
Figure 6A). However, observation of vancomycin treatment followed by lysis treatment revealed a mixture of morphologies, with numerous cells displaying activated RNA metabolism, suggesting a diverse bacterial population in the isolated subculture. These populations were observed through microscopy and flow cytometry, where differences in bacillus length, RNA metabolism, and bacterial complexity were noted (
Figure 5). Furthermore, when examining the complexity of the cells using flow cytometry, we found that most cells treated with LT had fewer complex bacilli. However, with vancomycin and vancomycin combined with LT, a new population of more complex cells emerged. We believe these more complex cells are the long and short bacilli seen under the microscope (
Figure 5A, LT with Zoom). This finding offers new insights into
C. difficile and adds to the growing understanding of the different shapes and electron densities of persister cells. Studies conducted with other models, such as
Salmonella enterica, have demonstrated that the persister subculture encompasses bacteria with arrested cell division but activated metabolism, termed viable but nonculturable (VBNC) [
21]. While these cells typically do not contribute to culture resurrection, they play roles in responses such as biofilm formation [
44]. In the context of
C. difficile, research suggests that vancomycin treatments induce biofilm formation in the stationary phase [
45], which could elucidate the observed results, as biofilm formation involves alterations in gene expression. Within these cellular subcultures, division ceases, but metabolism persists to facilitate the formation of these structures [
44].
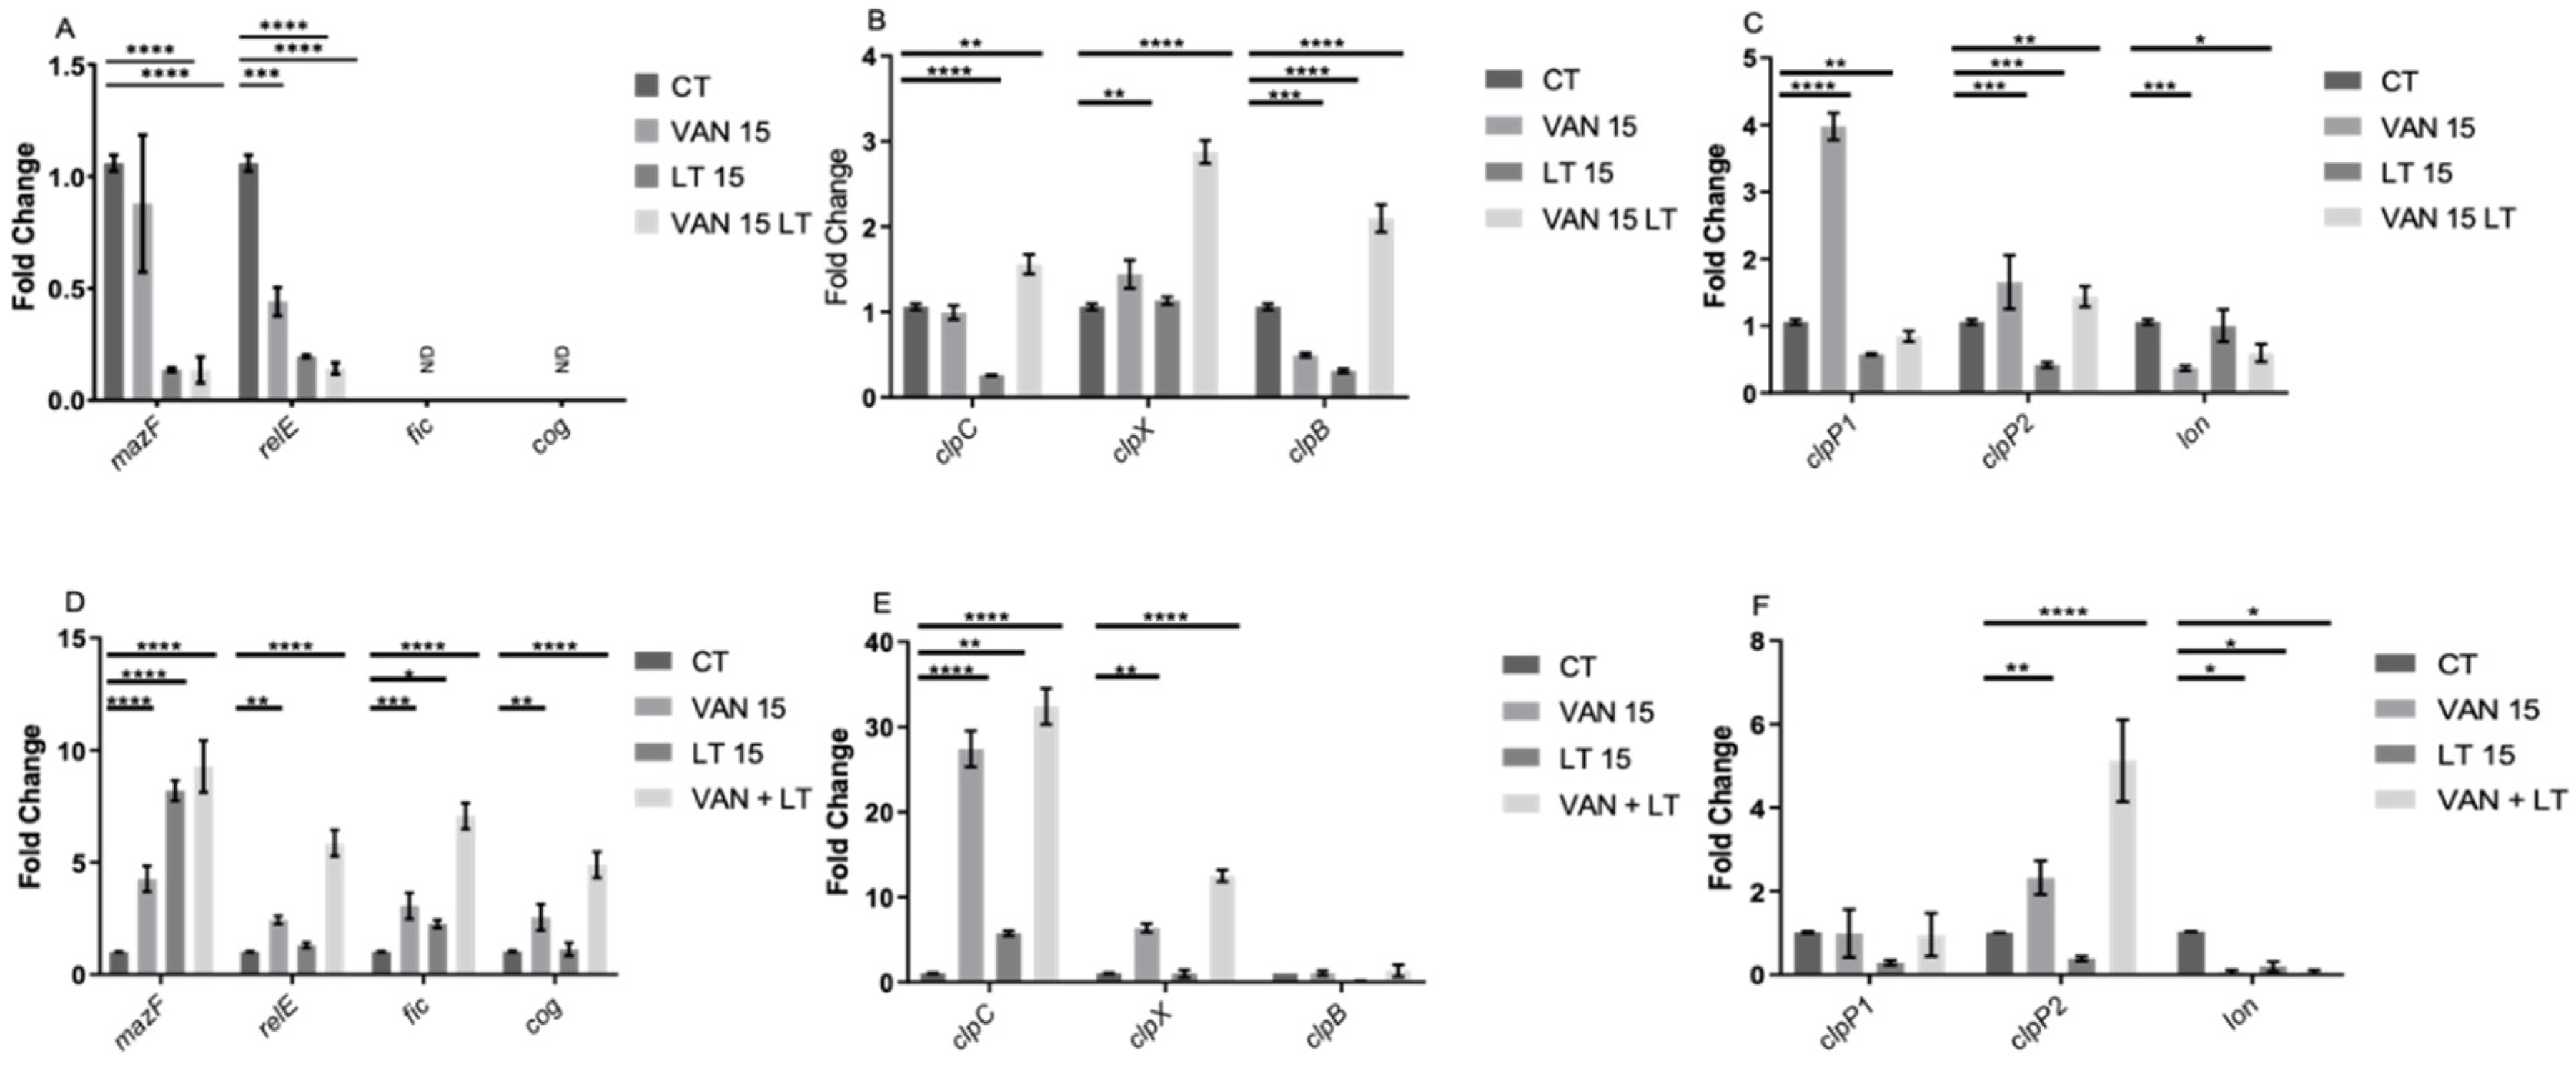
In the assessment of gene expression, an unexpected finding emerged: during the exponential phase, the TA system toxin genes
relE and
mazF were repressed under the applied treatments, while
fic and
cog were undetectable. Conversely, in the stationary phase, all four toxins were overexpressed. This suggests that the behavior of these TA systems mirrors that observed in other bacteria, where they are activated or overexpressed during stress-induced persister cell formation [
30,
32,
34,
46].
In the case of chaperones, during the exponential phase,
clpC and
clpB were implicated in forming spontaneous persister cells, while all three chaperones played a role in developing triggered persister cells. In the stationary phase, only
clpC and
clpX were notable for their involvement in forming triggered persisters, with
clpC implicated in both types. Regarding peptidases and proteases,
clpP2 emerged as the most intriguing candidate, exhibiting altered expression under treatments in both growth phases. This finding is compelling because Clp family chaperones and peptidases are closely linked to the activation of type II TA systems [
47,
48,
51], suggesting their joint participation, which warrants further investigation in subsequent studies. Additionally, it has been demonstrated that changes in chaperone expression influence the targets of Clp protease complexes, regulating, for example, the abundance of misfolded proteins (or total proteins) in the cell, a factor associated with persister cells [
18,
20].
In summary, this study not only validates the existence of persister cells in C. difficile induced by vancomycin but also sheds light on new perspectives regarding the morphology of these cells, their response to treatments, and their capacity to induce the formation of triggered persister cells. These findings enhance our comprehension of persistence of C. difficile and offer valuable insights for future research and therapeutic approaches.
Figure 1.
C. difficile persisters cells enriched with lysis treatment. The lysis treatment was conducted, after the culture were reached DO 0.5 with aliquots collected at 2, 10, 30, and 60-minute intervals. Colonies emerging from the 60-min seeding were further cultivated for 16 h, and the experiments were repeated, as depicted in Figure A. Additionally, another aliquot was taken from the overnight culture to growth until reached DO 0.9, to seed the stationary phase, and the lysis treatment was performed, with aliquots sampled at the same time intervals as before. Colonies obtained from the 60-min seeding were also regrown for 16 h, and the experiments were repeated, as shown in Figure B. The presence of persister cells reached a plateau starting from the 15-min point onwards in both cases A and B. Each experimental condition was replicated three times, resulting in three replicates for each condition. Utilizing one-way ANOVA with the Bonferroni post-hoc test, no significant differences were found when adjusting the survival values with each input.

Figure 2.
RNA metabolism of enriched spontaneous persister cells. An aliquot extracted from the culture during the exponential phase (A) was used for the experiment, both untreated (CT, control treatment) and following a 15-min lysis treatment (LT, lysis treatment). The presence of green fluorescence indicated active RNA metabolism, while the absence of color indicated inactive RNA metabolism. Cell wall damage and cell death were evaluated using propidium iodide (PI) staining, shown in red. The same methodology was applied to a culture in the stationary phase (B) with both CT and LT treatments. PC: Phase contrast; Thio-T: Thioflavin-T stain; PI: Propidium iodide stain. Each experimental condition was replicated three times (n=3).
Figure 3.
Antibiotic MICs and persisters cell survival enriched with LT. A survival assay was conducted during the exponential phase, involving a 1-hour antibiotic treatment with vancomycin (VAN), ceftriaxone (CFX), pefloxacin (PEF), and rifampicin (RIF). Each antibiotic was used separately, and after the treatment, an aliquot was plated to mark the input of the experiment. Subsequently, a 15-min lysis treatment was applied. The left table presents the minimum inhibitory concentration (MIC) values before the experiment and the MIC of the resurrected bacteria post-experiment. The right graph illustrates the comparison of cell viability under each treatment during the exponential phase. The experiment was replicated three times (n=3), and statistical analysis was performed using a one-way ANOVA with Post hoc Sidak’s test (* p<0.05; ** p<0.005; *** p<0.0005; **** p<0.0001).
Figure 4.
Vancomycin-induced persisters cells enriched with LT. Cultures of C. difficile were grown overnight (O/N), and an aliquot was transferred to reach the exponential phase (A), following the established procedure. At the experiment’s outset, an aliquot was seeded (input), followed by a 1-hour treatment with vancomycin before seeding again. Subsequently, a 60-min lysis treatment was administered, with samples collected at 2, 10, 30, and 60 min. The same experimental setup was repeated starting from the overnight culture (B), with aliquots seeded for the input, followed by one hour of vancomycin treatment, and then subjected to 2, 10, 30, and 60 min of lysis treatment. The plateau of persister cells was reached after 10 min of treatment. Resurrected bacteria from the 60-min lysis treatment aliquot were retrieved and used to repeat the experiment. Each experimental condition was replicated three times (n=3), with one-way ANOVA analysis revealing no significant differences in survival values among the input.

Figure 5.
RNA metabolism of enriched triggered persister cells under vancomycin treatment. Panel (A) illustrates the exponential phase growth culture treated for 1 h with vancomycin, with and without lysis treatment (LT), or control treatment (CT). A similar experiment is depicted in the stationary phase (Panel B). Thioflavin-T (Thio-T) staining was utilized to visualize active RNA metabolism (green color) or inactive metabolism (pale green staining), while propidium iodide (PI) staining was employed to observe cell wall damage or cell death, represented in red. In both experiments, a mixture of bacteria with active and inactive metabolism is observed, with the exponential phase exhibiting more cells with active RNA metabolism. Conversely, in the stationary phase, the CT condition reveals more cells with damaged cell walls or dead cells. PC: Phase contrast; Thio-T: Thioflavin-T stain; PI: Propidium iodide stain. Each experimental condition was replicated three times (n=3).
Figure 6.
Characterization of persister C. difficile cells by flow cytometry. (A) Identification of C. difficile stained with Thio-T and PI after application of the different treatments: Lysis treatment (LT), Vancomycin (VAN), Vancomycin + Lysis treatment (VAN + LT), (C+) Positive control of growth. (B) Identification of size and complexity of double negative (DN) (upper) and double positive (DP) (down) populations of C. difficile stained with Thio-T and PI. (C) A representative histogram of total Thio-T expression in C. difficile was previously treated with C+, LT, VAN, and VAN + LT. The black dotted line shows the negative signal for Thio-T to the left and the positive signal for Thio-T to the right of the line.
Figure 7.
Gene expression of enriched persister cells under vancomycin treatment. RNA extraction was performed during the exponential growth phase (A, B, and C) and the stationary phase (D, E, and F). In each growth phase, gene expression was evaluated under three conditions: a 15-min treatment with vancomycin (VAN 15), a 15-min lysis treatment (LT 15), and a sequential treatment involving vancomycin followed by a 15-min lysis treatment (VAN 15 LT). Expression of toxin genes from TA systems, namely relE, mazF, fic, and cog (A and D), chaperone genes from the clp family, including clpC, clpX, and clpB (B and E), as well as peptidase and protease genes, specifically clpP1, clpP2, and lon (C and F) were measured. The experiment was conducted with n=3 replicates, and statistical analysis was performed using one-way ANOVA with Post-hoc Bonferroni's test (* p<0.05; ** p<0.005; *** p<0.0005; **** p<0.0001).

