Submitted:
19 June 2024
Posted:
20 June 2024
You are already at the latest version
Abstract
Keywords:
Introduction
Materials and Methods
Animals, Low-Fat-Diet, High-Fat-Diet (Palmitic-Acid (PA) Diet), and Oleic-Acid Diet (OAD) Feeding
Electrocardiogram (ECG)
Estimation of Interstitial Fibrosis in Ventricular Tissue Slices form Guinea Pig
Enzyme-Linked Immunosorbent (ELISA) Assay
Preparation of Bovine Serum Albumin (BSA)-Conjugated FFA Solutions
Guinea Pig Ventricular Myocyte Isolation
LipidSpot Lipid Droplet Staining
Quantitative Reverse Transcription Polymerase Chain Reaction (qRT-PCR)
Immunofluorescence, Confocal Imaging, and Image Analysis
Statistical Analyses
Results
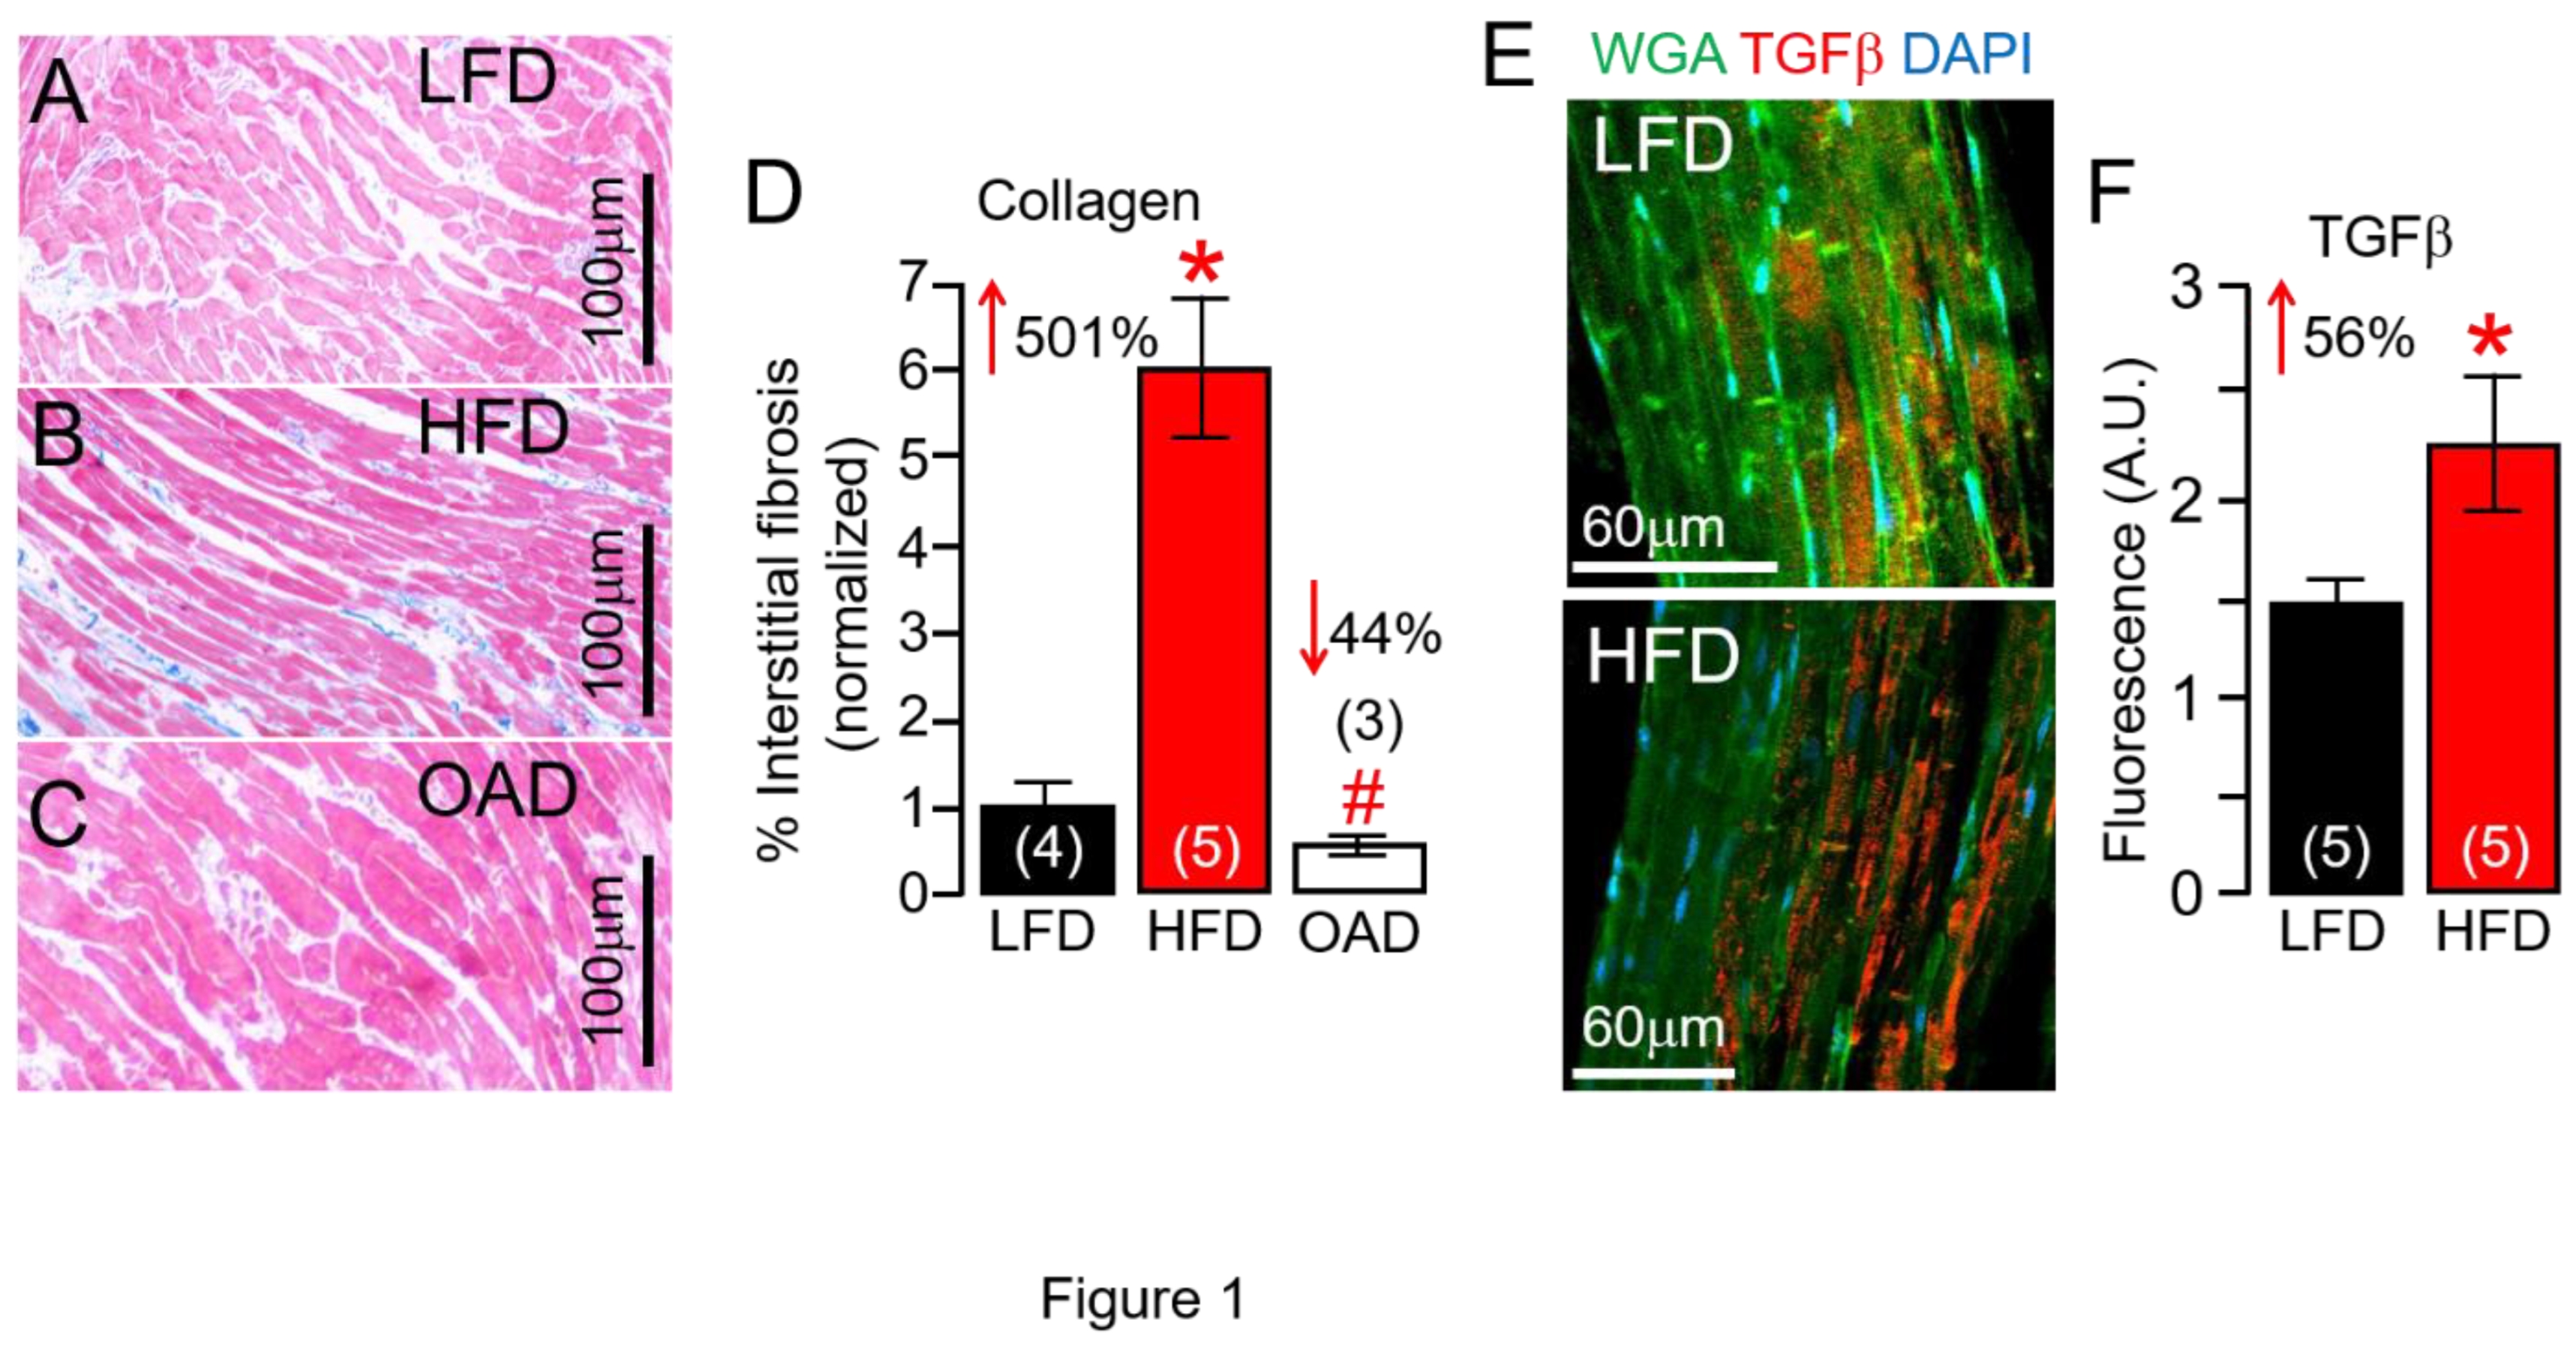
Effect of HFD on Cardiac Fibrosis in Guinea Pig
HFD feeding is associated with upregulated cardiac IL-6 linked inflammation in guinea pig ventricular tissue.
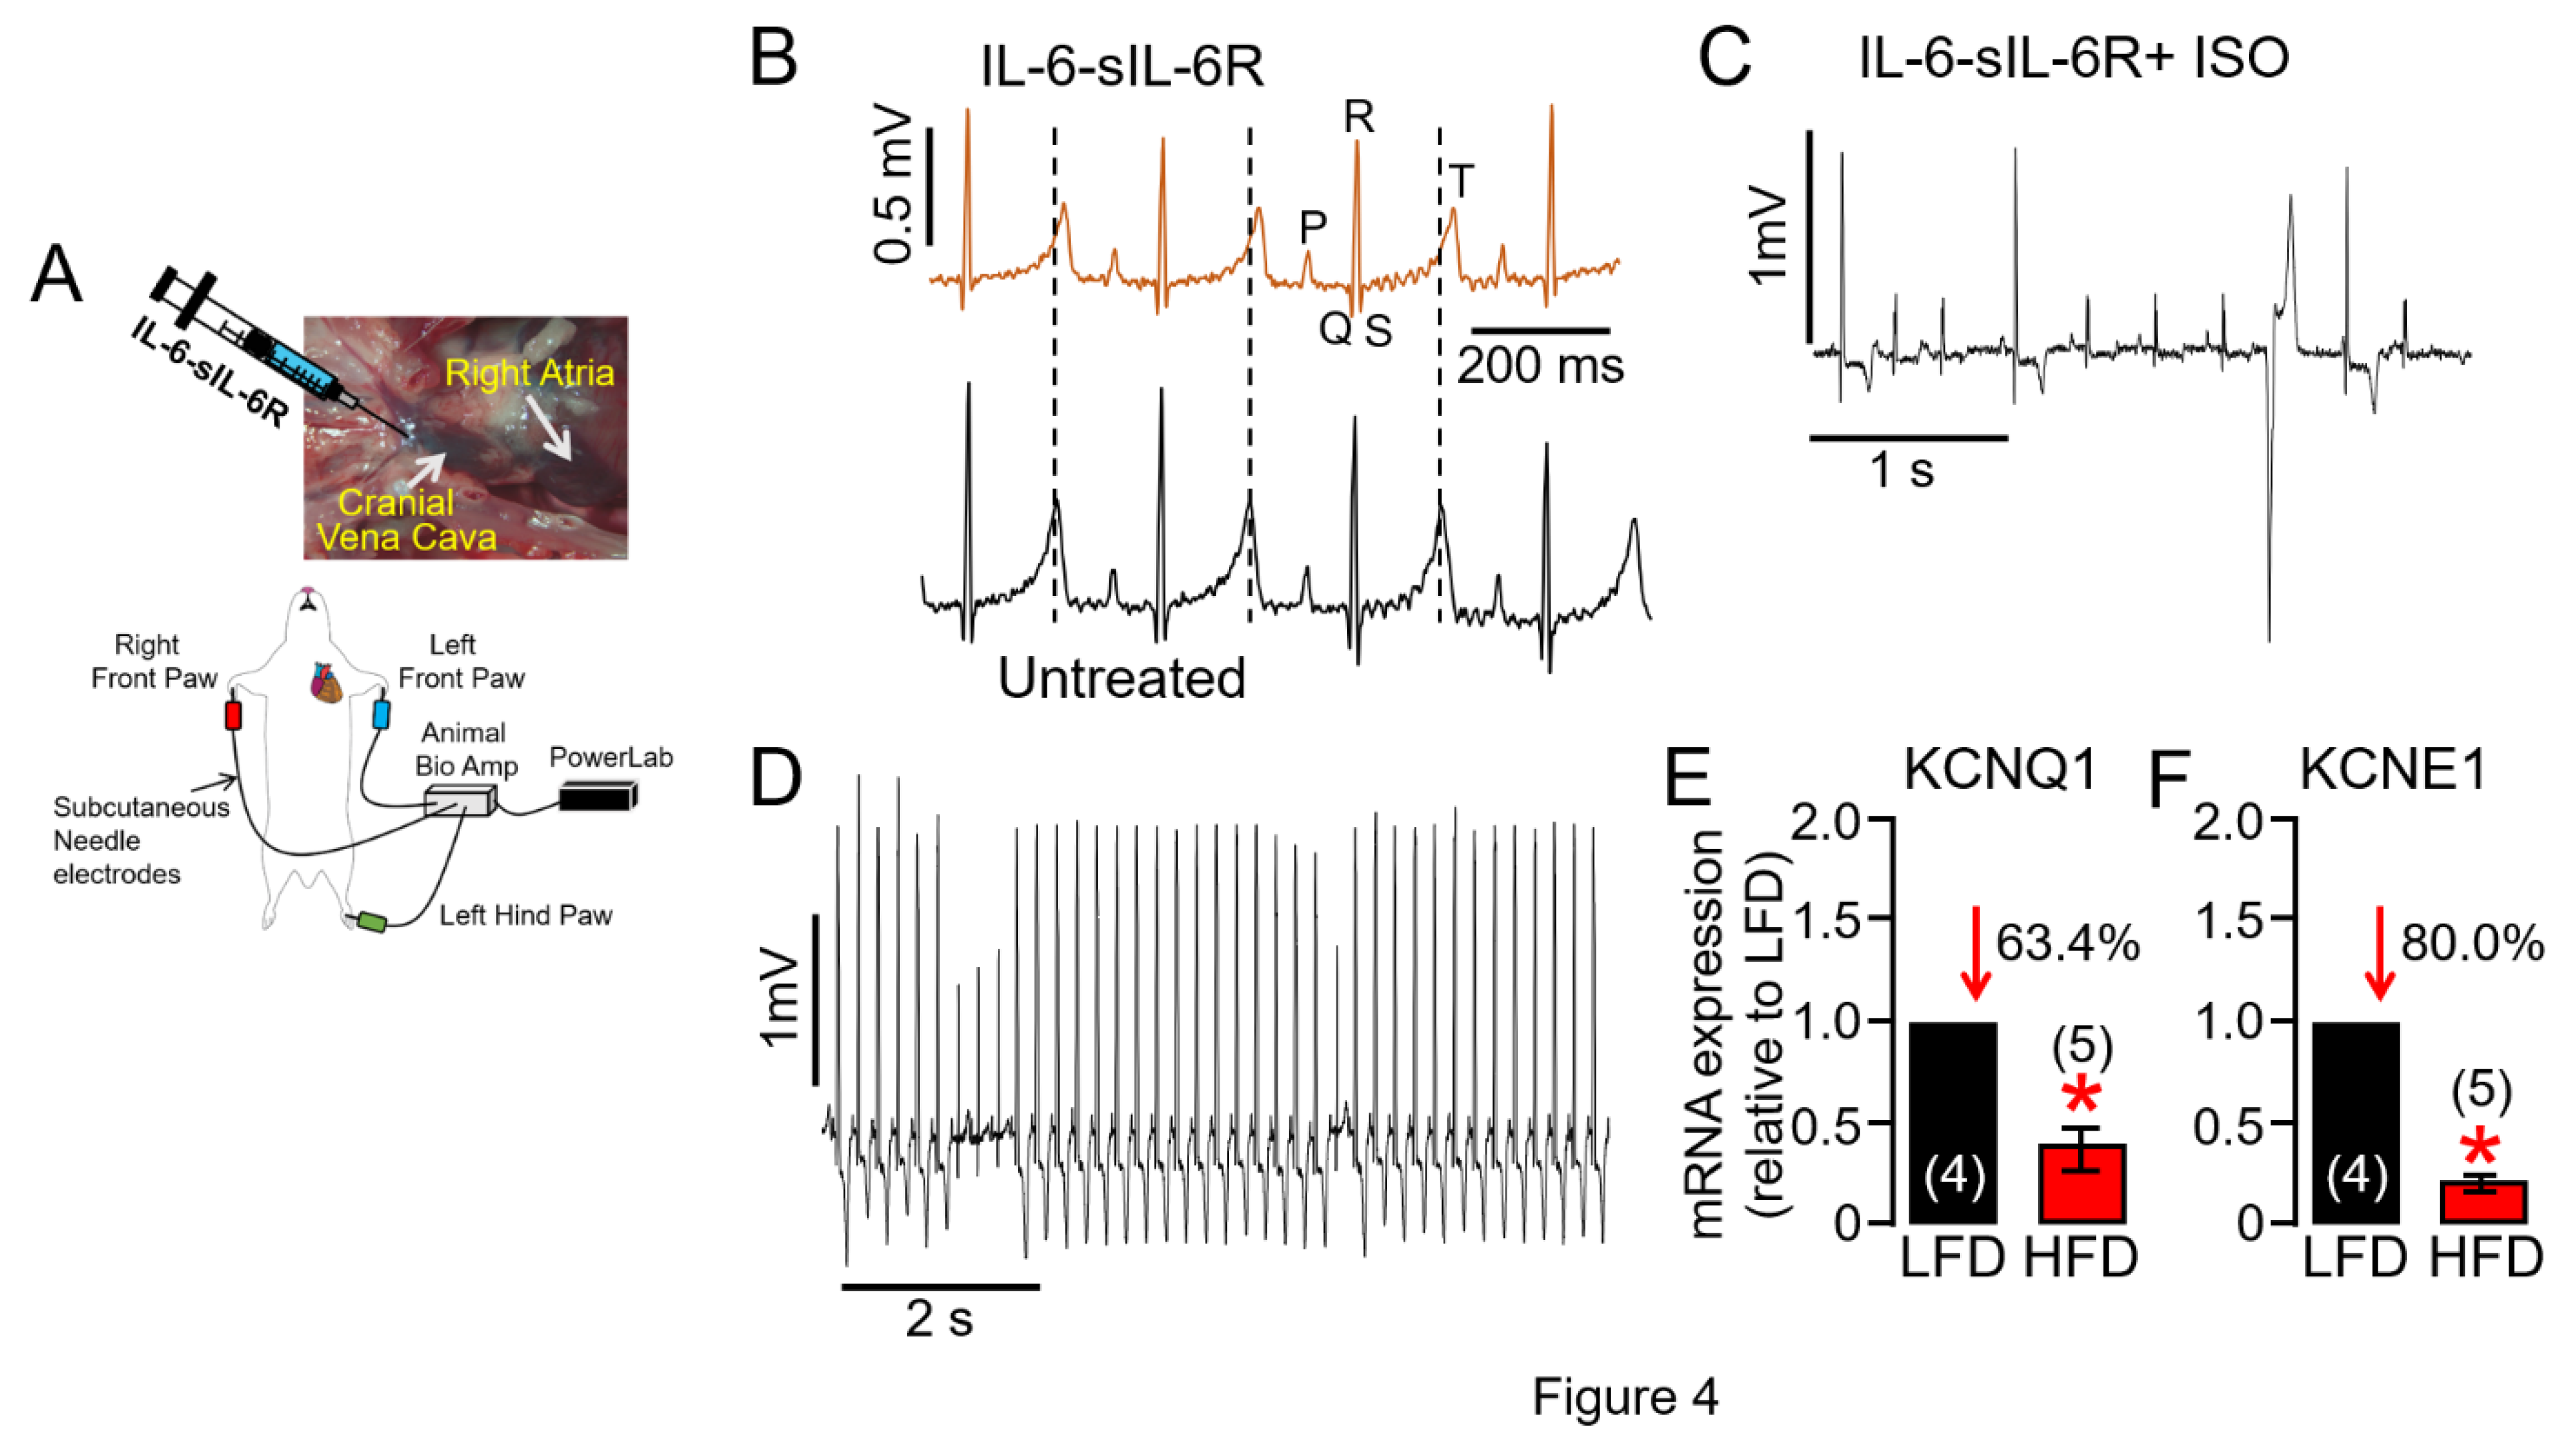
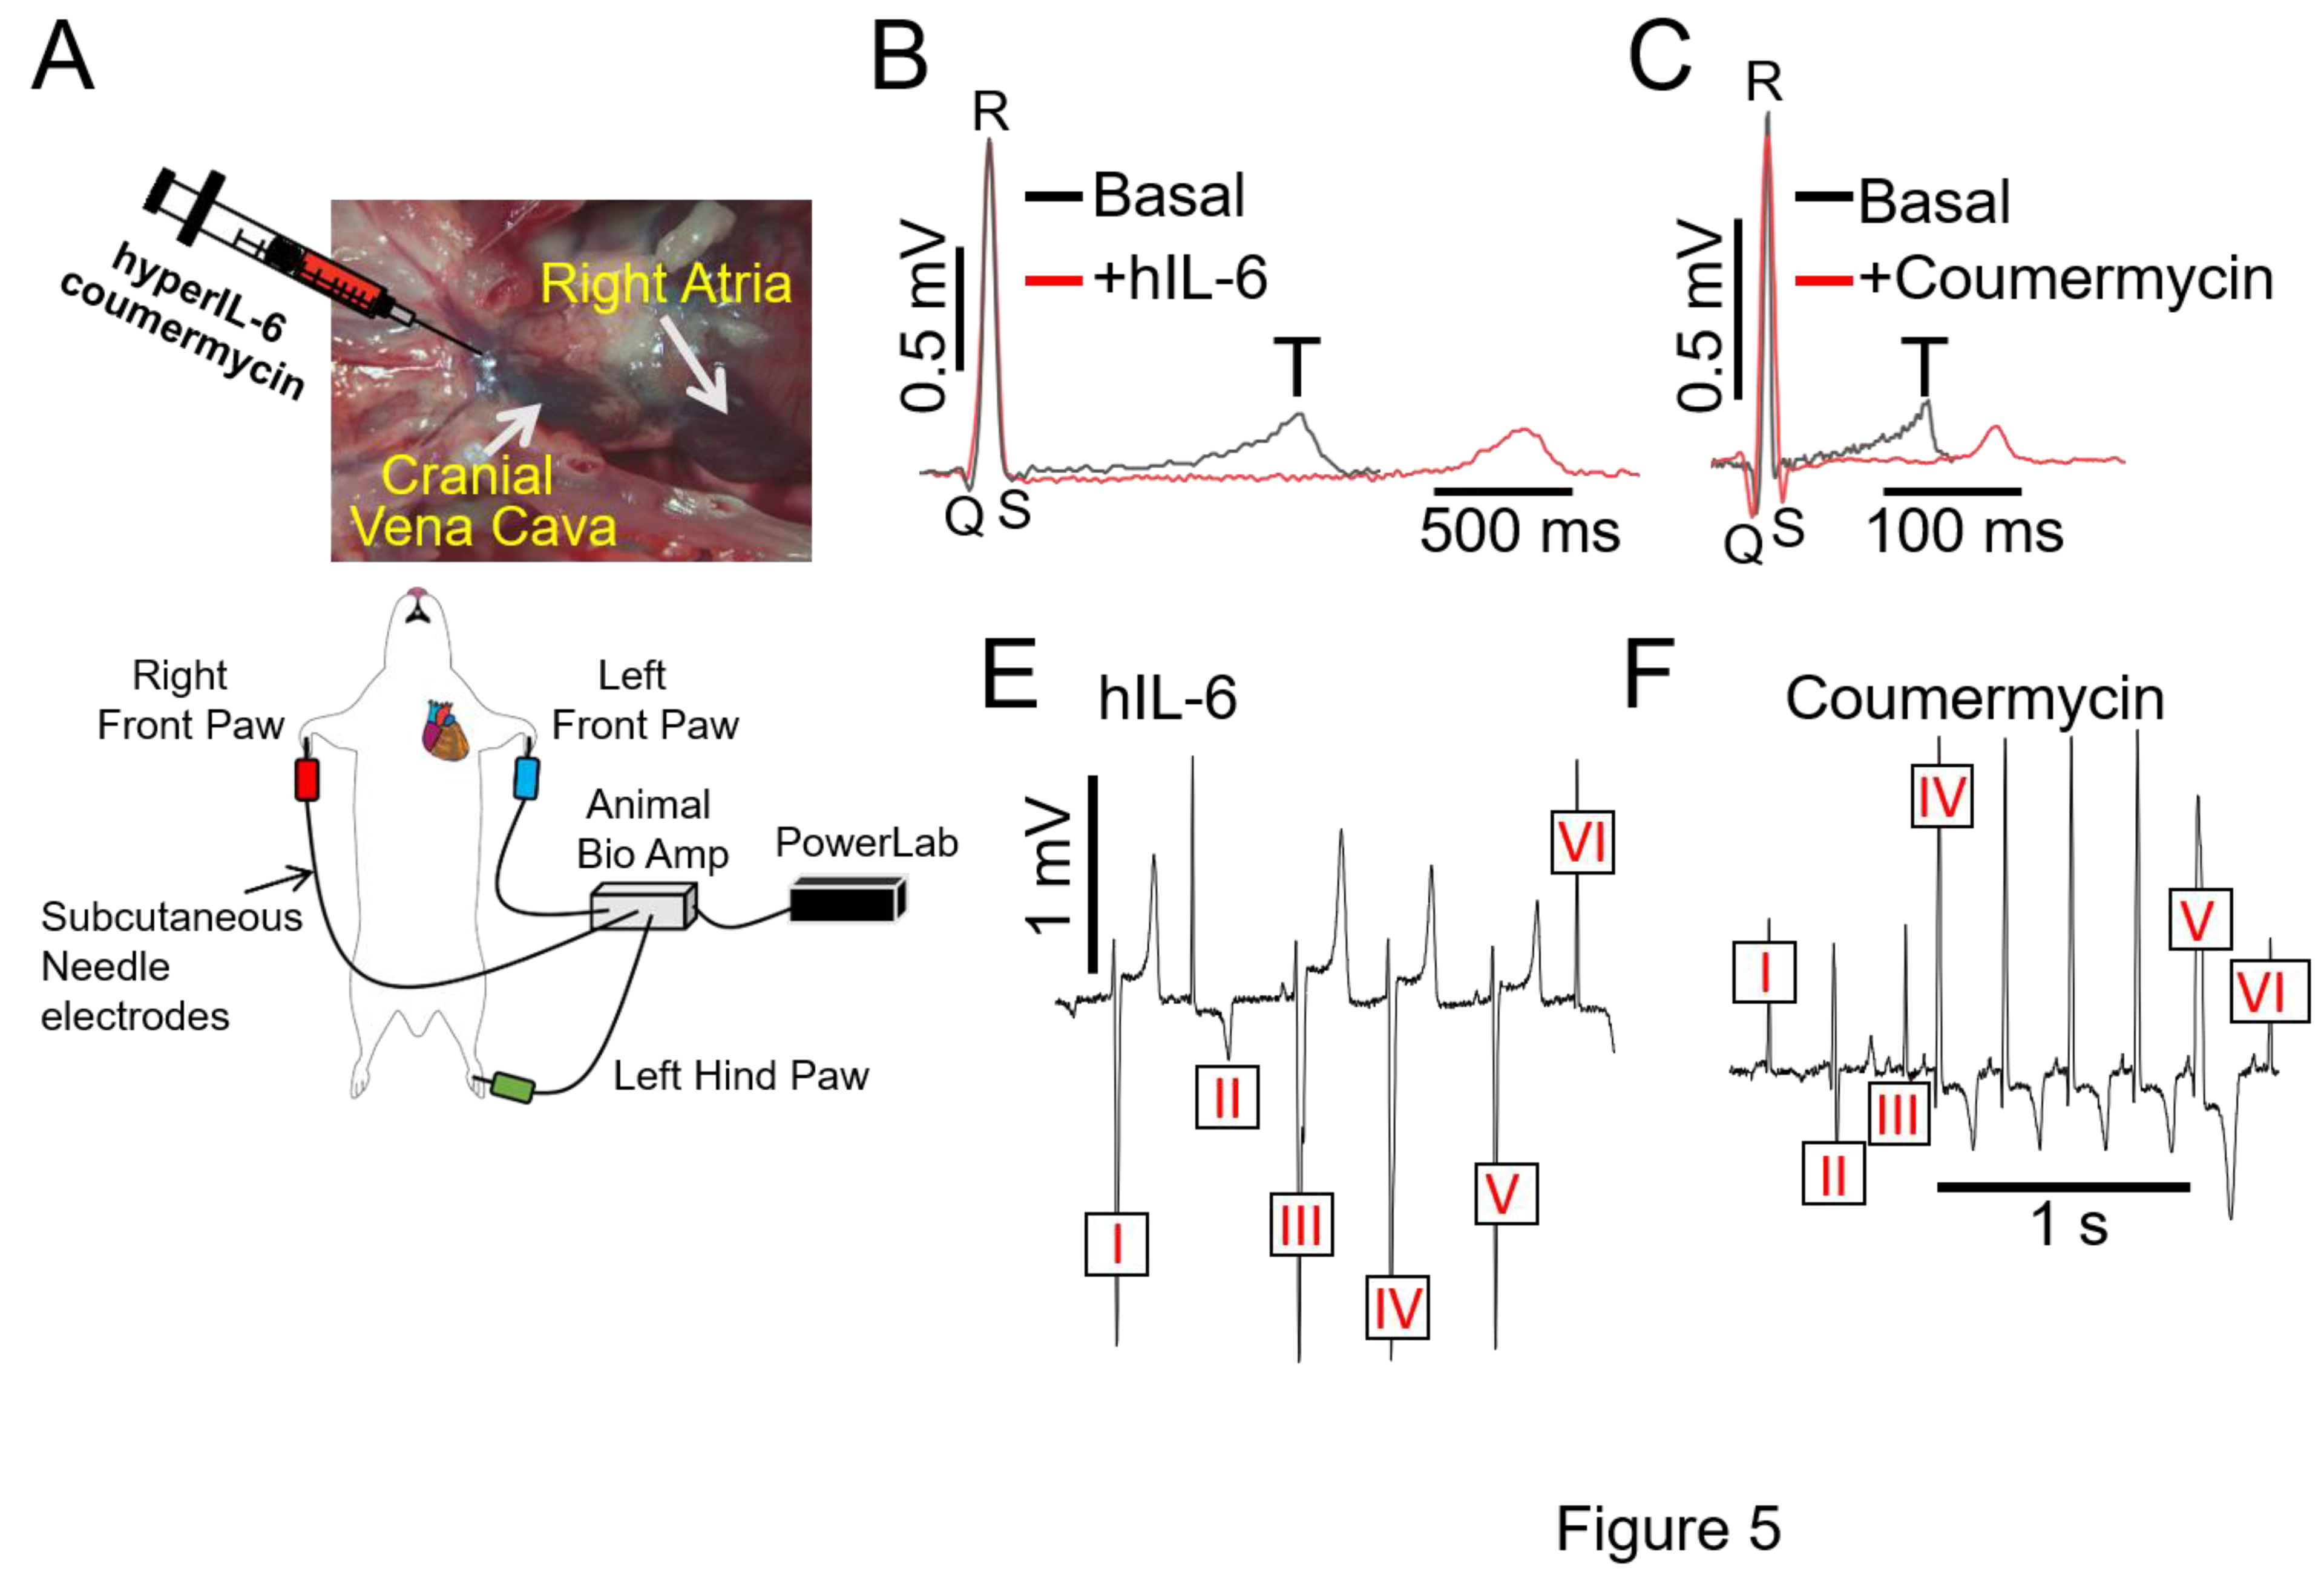
Overactivated IL-6 Trans-Signaling Causes Pathological Guinea Pig Heart Electrophysiology and Increased Arrhythmic Risk
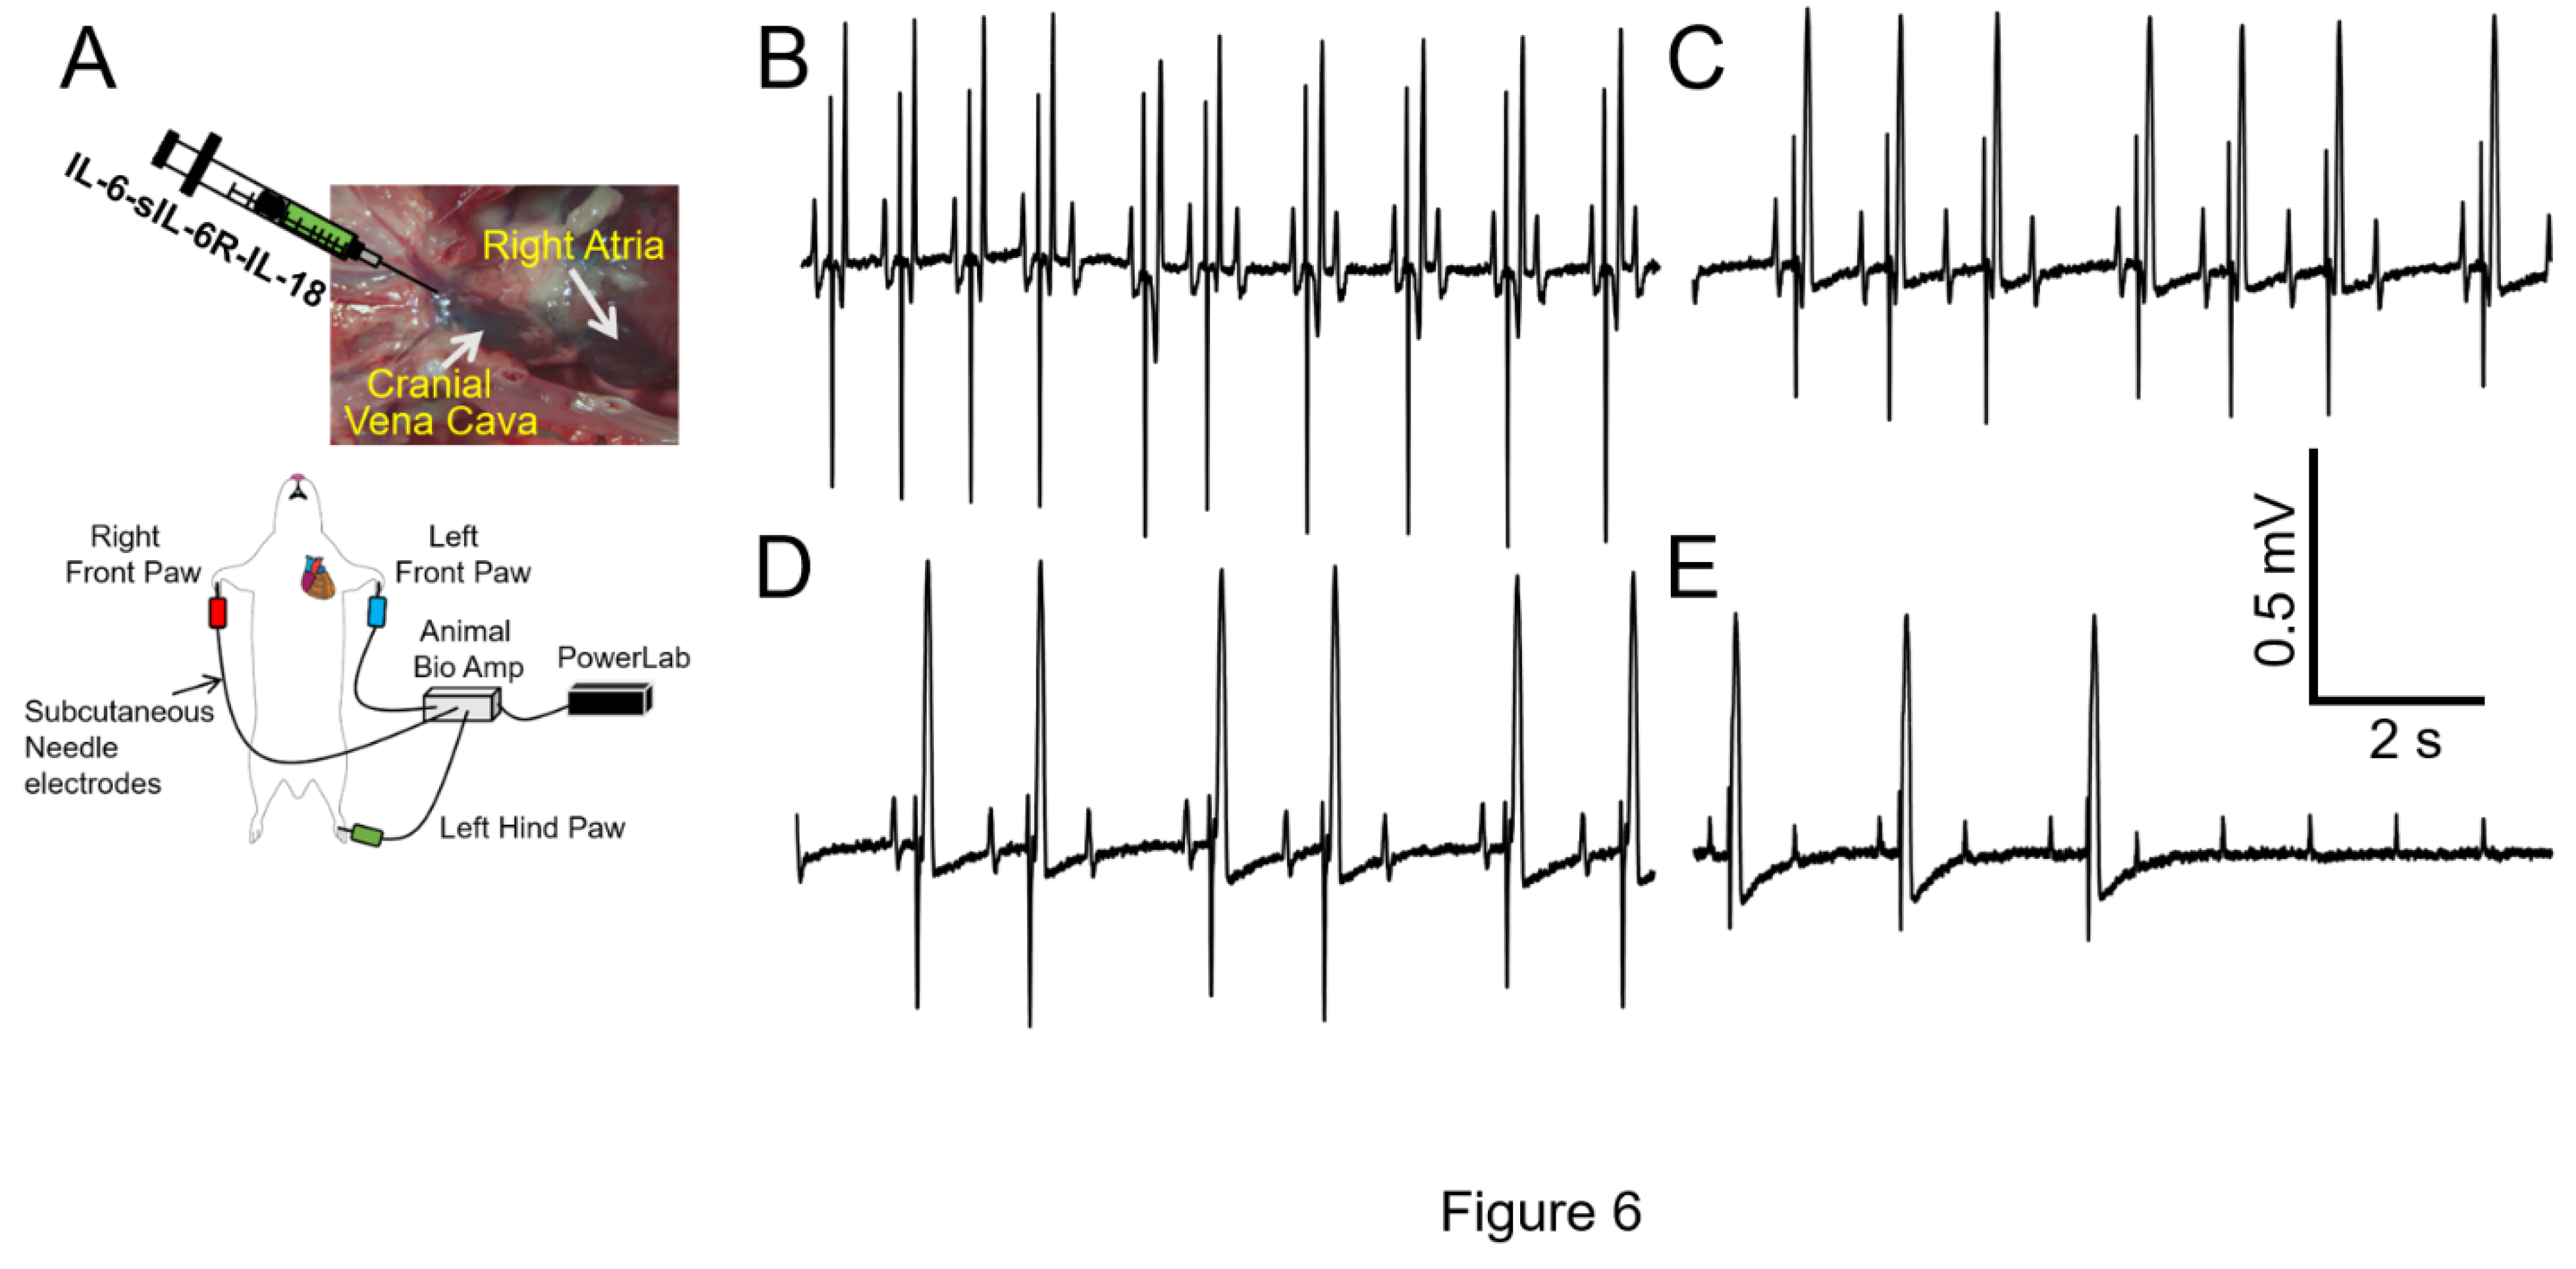
IL-18 Enhances IL-6 Trans-Signaling Effects on Guinea Pig Ventricular Cardiac Electrophysiology
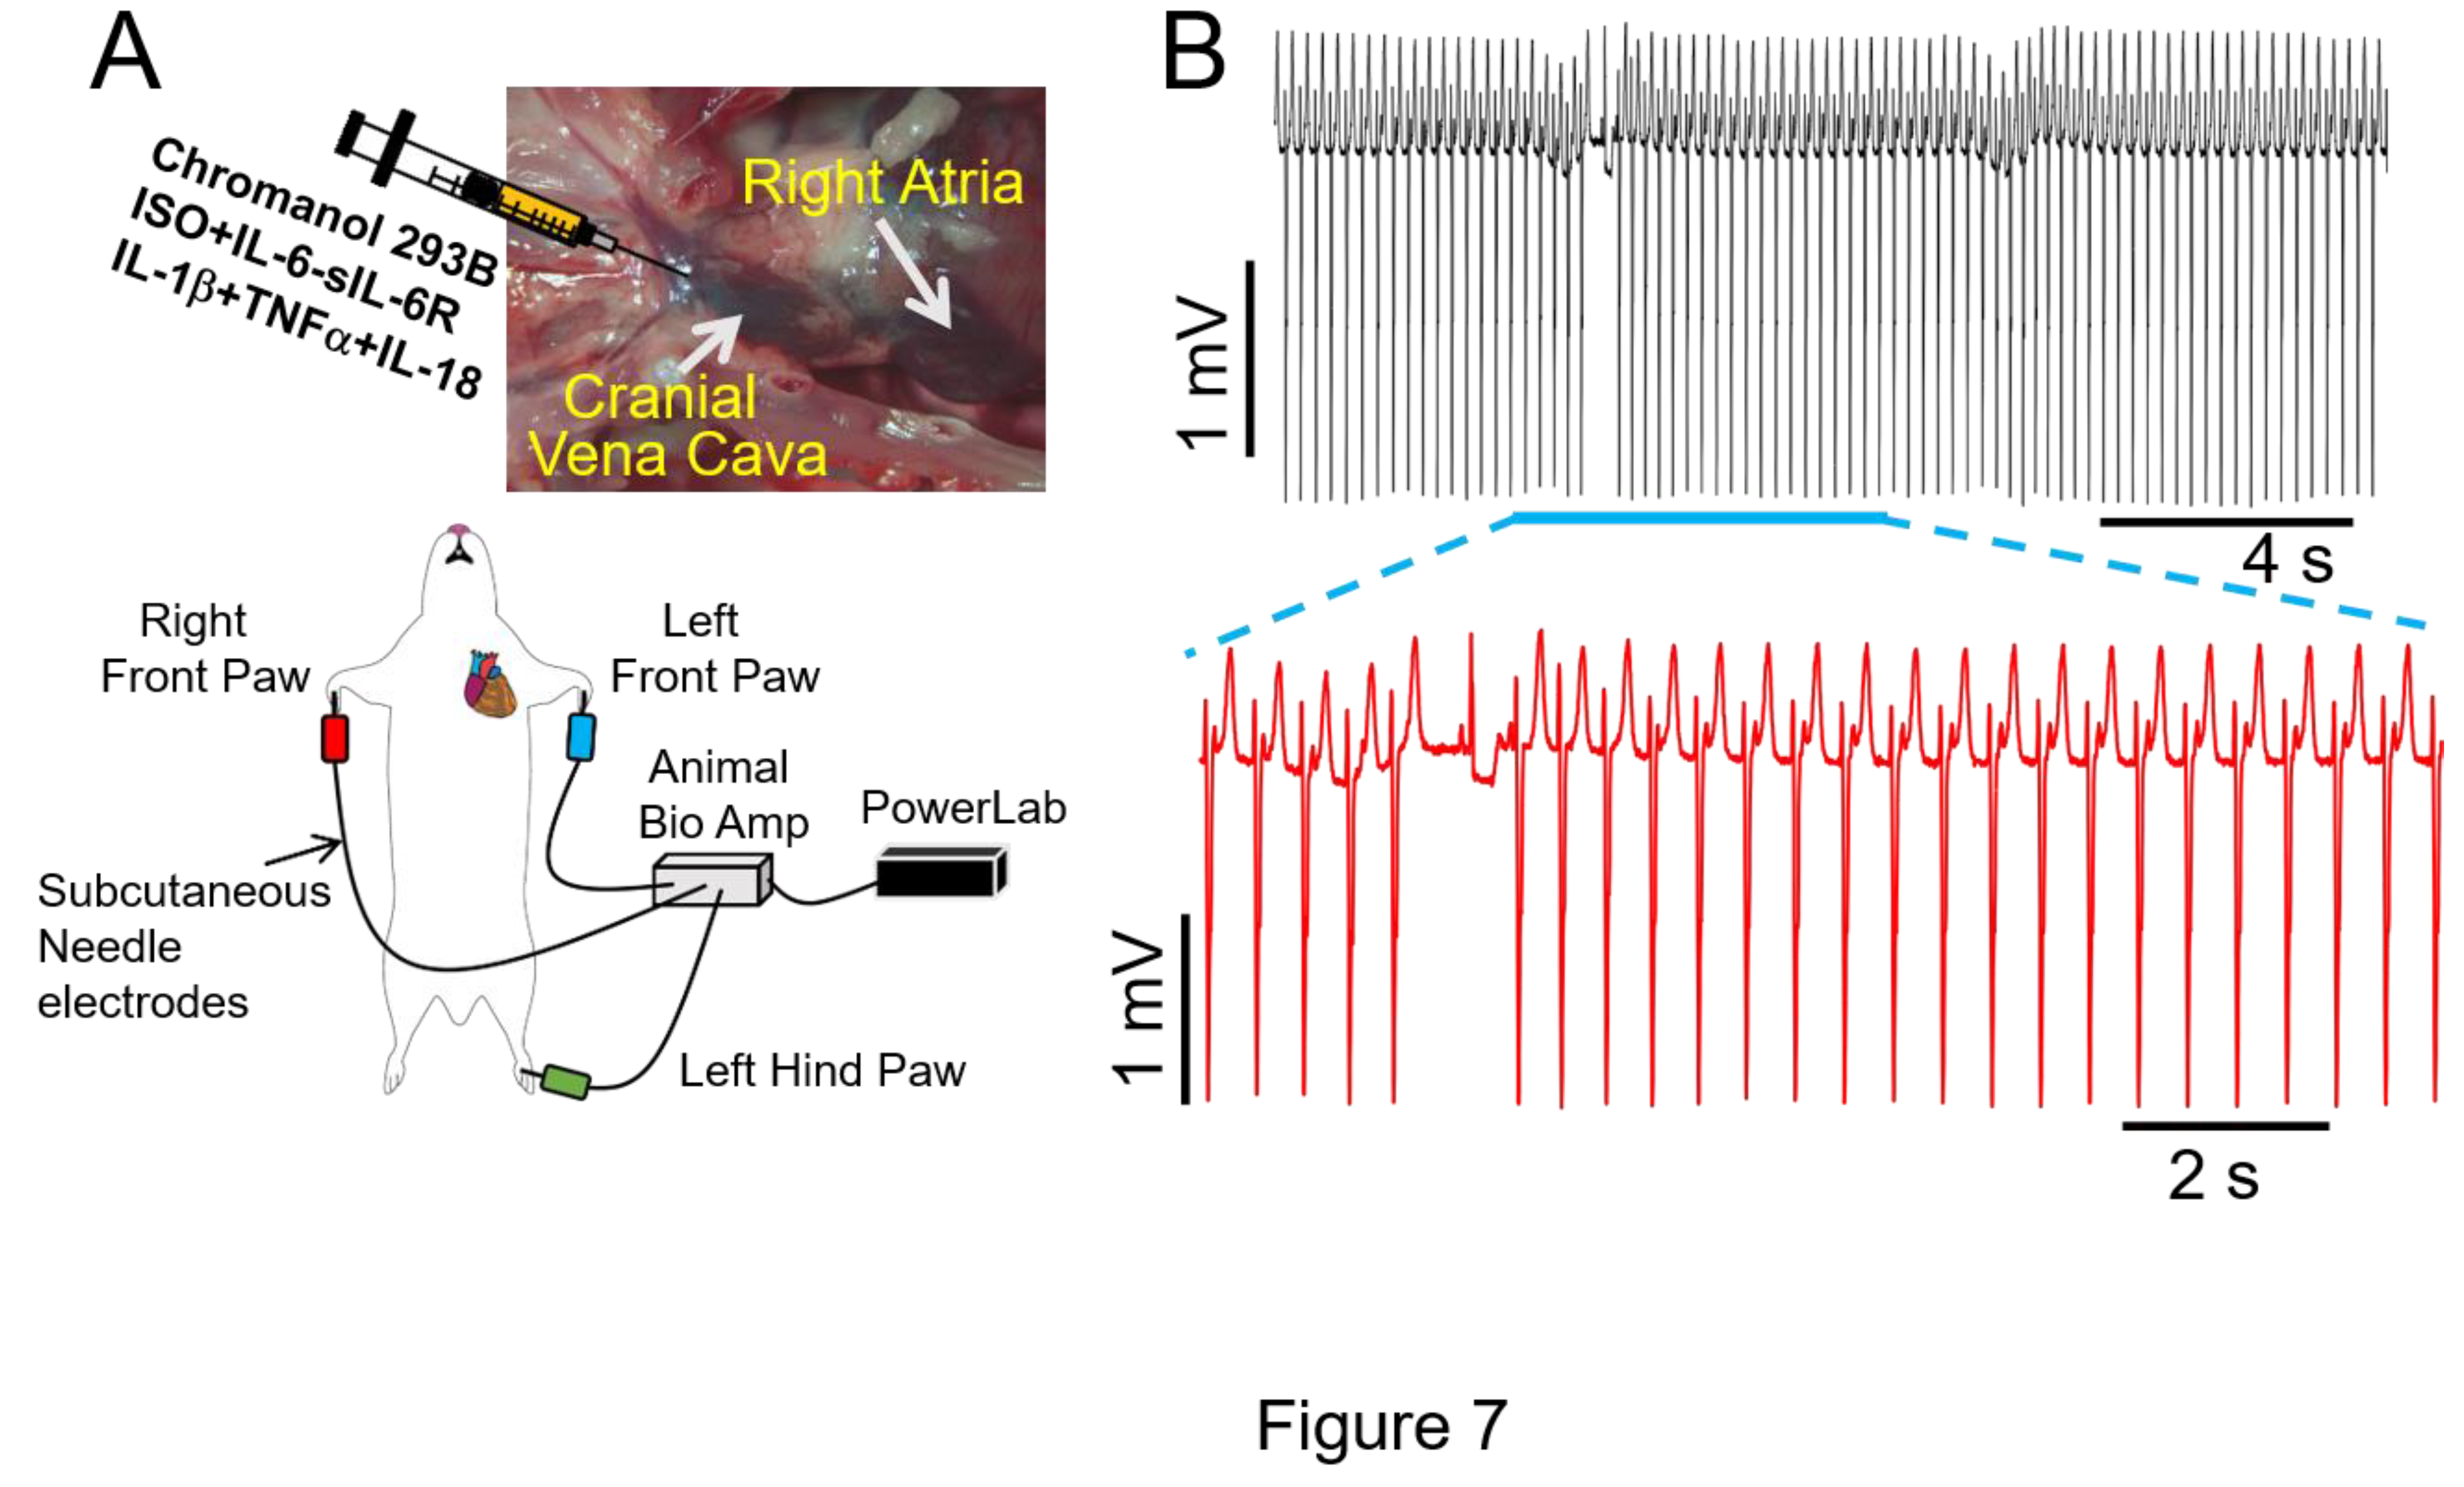
Proinflammatory Cytokines Induce Dramatic Ventricular Electrophysiology Remodeling during Adverse Sympathetic Regulation and is Associated with VT in Guinea Pig
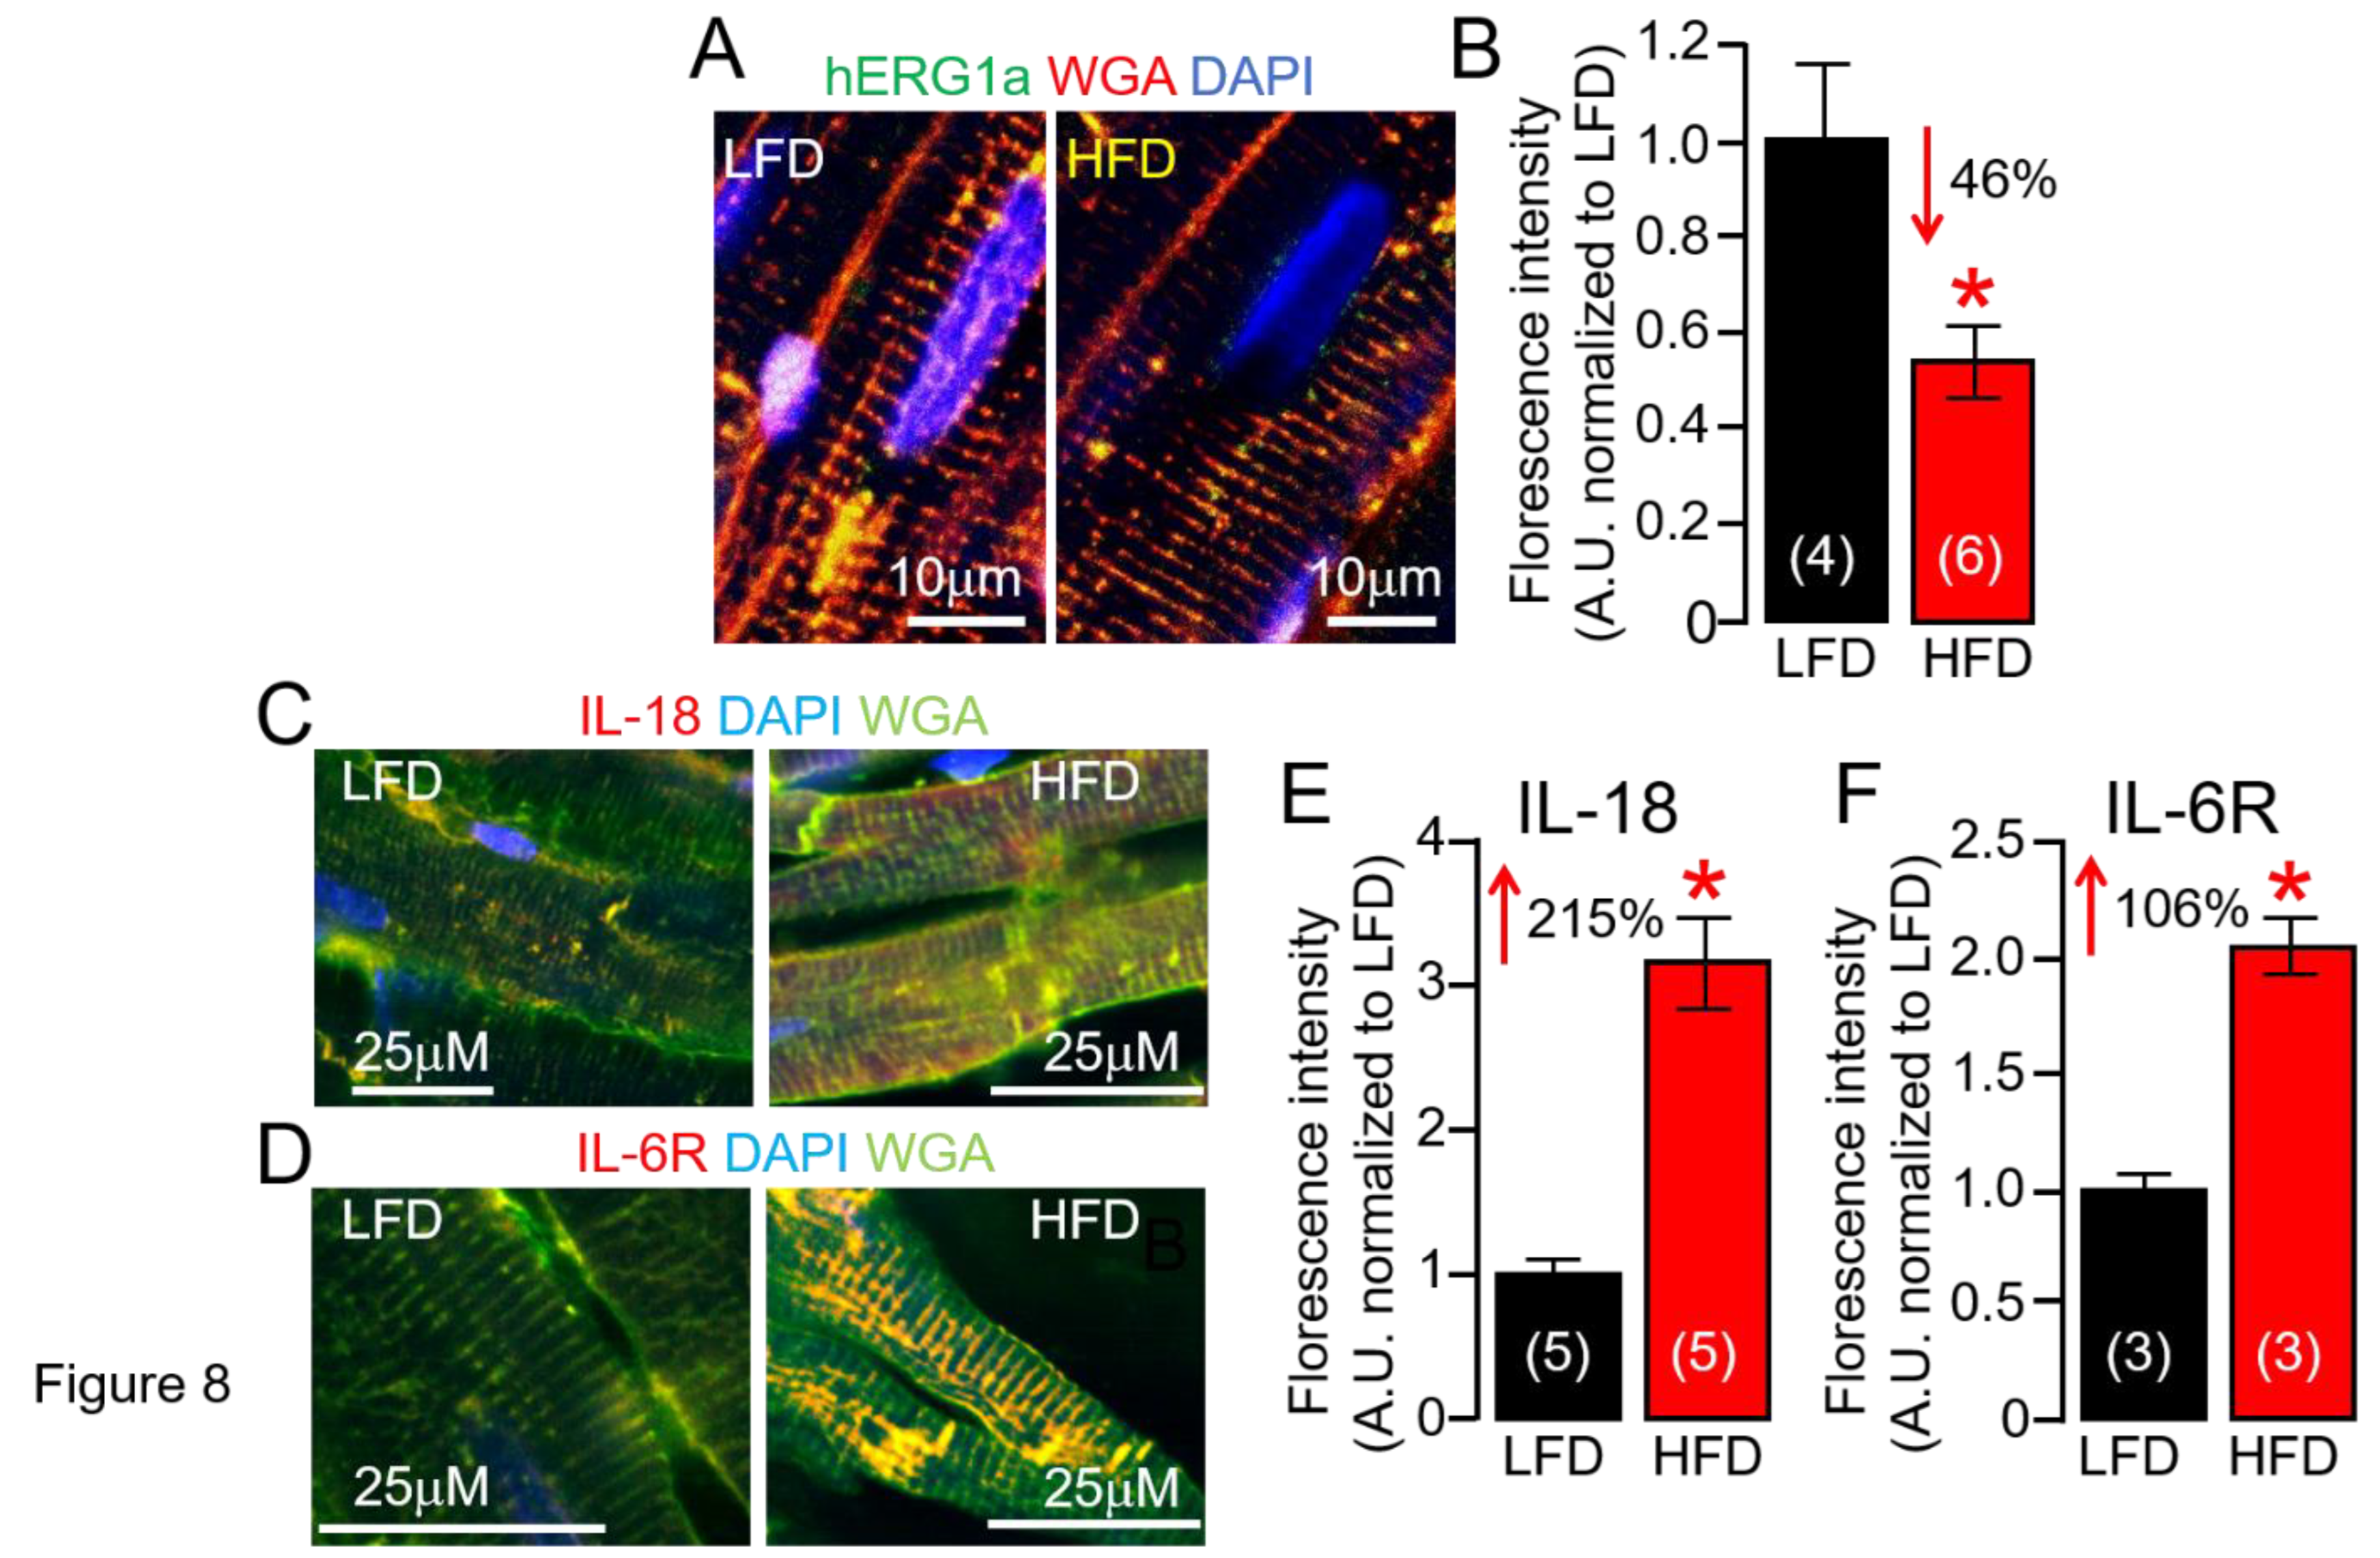
ERG1a Protein Expression is Reduced in HFD Hearts
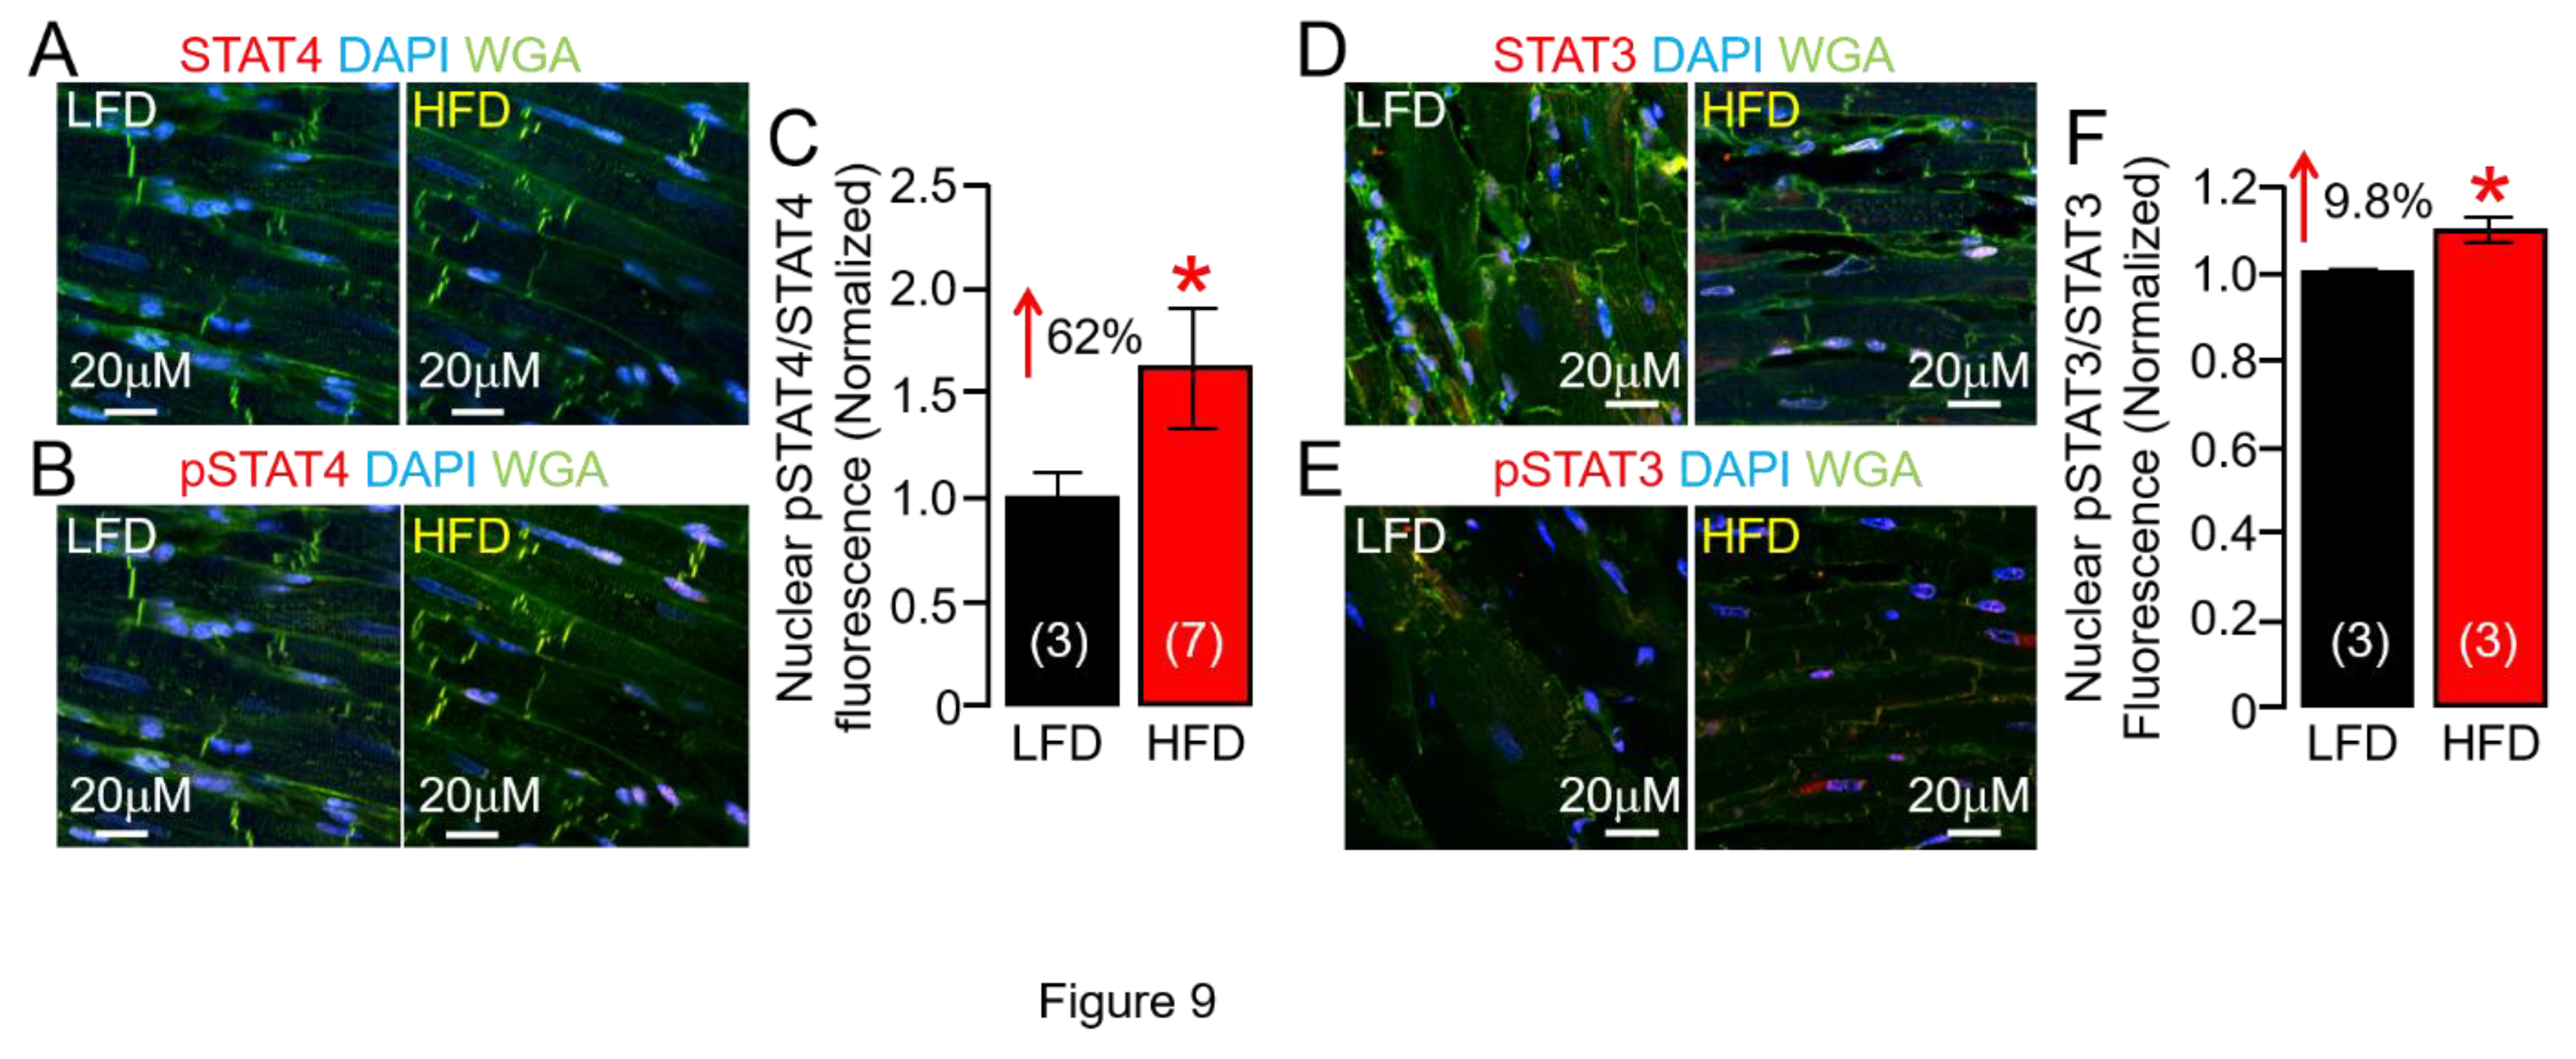
HFD Feeding is Associated with Increased STAT4 Expression in Guinea Pig Heart
Lipotoxicity Promotes Overactivation of IL-6 Trans-Signaling in Guinea Pig Ventricular Myocytes via Lipid Droplet Accumulation
Discussion
Study Limitations
Conclusion
Clinical Perspectives
Author Contributions
Funding
Institutional Review Board Statement
Data Availability Statement
Acknowledgments
Conflicts of Interest
Abbreviations
| Nonstandard Abbreviations and Acronyms | |
|
ERG CVC FFA QTc HFD hERG hIL-6 IL-6 IL-1β JAK2 LFD OAD PA IKr IKs STAT4 sIL-6 TGF-β TNF-α |
Ether-à-go-go related gene Cranial vena cava Free fatty acid Heart rate corrected QT interval High-fat diet Human ether-à-go-go related gene Hyper-IL-6 Interleukin-6 Interleukin-1 beta Janus kinase 2 Low-fat diet Oleic acid diet Palmitic acid Rapidly activating delayed rectifier K current Slowly activating delayed rectifier K current Signal transducer and activator of transcription 4 Soluble interleukin-6 receptor Transforming growth factor beta Tumor necrosis factor alpha |
References
- Marsman RF, Tan HL, and Bezzina CR. Genetics of sudden cardiac death caused by ventricular arrhythmias. Nature Reviews Cardiology 11: 96-111, 2014. [CrossRef] [PubMed]
- Kallergis EM, Goudis CA, Simantirakis EN, Kochiadakis GE, and Vardas PE. Mechanisms, Risk Factors, and Management of Acquired Long QT Syndrome: A Comprehensive Review. The Scientific World Journal 2012: 212178, 2012.
- El-Sherif N, Turitto G, and Boutjdir M. Acquired Long QT Syndrome and Electrophysiology of Torsade de Pointes. Arrhythm Electrophysiol Rev 8: 122-130, 2019. [CrossRef] [PubMed]
- Powell-Wiley TM, Poirier P, Burke LE, Després J-P, Gordon-Larsen P, Lavie CJ, Lear SA, Ndumele CE, Neeland IJ, Sanders P, and St-Onge M-P. Obesity and Cardiovascular Disease: A Scientific Statement From the American Heart Association. Circulation 143: e984-e1010, 2021.
- Ali A, Boutjdir M, and Aromolaran AS. Cardiolipotoxicity, Inflammation, and Arrhythmias: Role for Interleukin-6 Molecular Mechanisms. Front Physiol 9: 1866, 2018.
- Ridker PM, and Rane M. Interleukin-6 Signaling and Anti-Interleukin-6 Therapeutics in Cardiovascular Disease. Circulation Research 128: 1728-1746, 2021. [CrossRef] [PubMed]
- Rose-John S, Jenkins BJ, Garbers C, Moll JM, and Scheller J. Targeting IL-6 trans-signalling: past, present and future prospects. Nat Rev Immunol 1-16, 2023.
- Chowdhury MKH, Martinez-Mateu L, Do J, Aromolaran KA, Saiz J, and Aromolaran AS. Macrophage-Dependent Interleukin-6-Production and Inhibition of I(K) Contributes to Acquired QT Prolongation in Lipotoxic Guinea Pig Heart. Int J Mol Sci 22: 2021.
- Aromolaran AS, Colecraft HM, and Boutjdir M. High-fat diet-dependent modulation of the delayed rectifier K(+) current in adult guinea pig atrial myocytes. Biochem Biophys Res Commun 474: 554-559, 2016. [CrossRef] [PubMed]
- Puckerin A, Aromolaran KA, Chang DD, Zukin RS, Colecraft HM, Boutjdir M, and Aromolaran AS. hERG 1a LQT2 C-terminus truncation mutants display hERG 1b-dependent dominant negative mechanisms. Heart Rhythm 13: 1121-1130, 2016. [CrossRef]
- Martinez-Mateu L, Saiz J, and Aromolaran AS. Differential Modulation of IK and ICa,L Channels in High-Fat Diet-Induced Obese Guinea Pig Atria. Front Physiol 10: 1212, 2019. [CrossRef] [PubMed]
- Al-Kofahi Y, Lassoued W, Lee W, and Roysam B. Improved automatic detection and segmentation of cell nuclei in histopathology images. IEEE Trans Biomed Eng 57: 841-852, 2010. [CrossRef]
- Aromolaran AS, Colecraft HM, and Boutjdir M. High-fat diet-dependent modulation of the delayed rectifier K(+) current in adult guinea pig atrial myocytes. Biochem Biophys Res Commun 474: 554-559, 2016. [CrossRef]
- Roytblat L, Rachinsky M, Fisher A, Greemberg L, Shapira Y, Douvdevani A, and Gelman S. Raised interleukin-6 levels in obese patients. Obes Res 8: 673-675, 2000. [CrossRef]
- Kern L, Mittenbühler MJ, Vesting AJ, Ostermann AL, Wunderlich CM, and Wunderlich FT. Obesity-Induced TNFα and IL-6 Signaling: The Missing Link between Obesity and Inflammation-Driven Liver and Colorectal Cancers. Cancers (Basel) 11: 2018.
- El-Mikkawy DME, El-Sadek MA, El-Badawy MA, and Samaha D. Circulating level of interleukin-6 in relation to body mass indices and lipid profile in Egyptian adults with overweight and obesity. Egyptian Rheumatology and Rehabilitation 47: 7, 2020. [CrossRef]
- Ridker PM, Libby P, MacFadyen JG, Thuren T, Ballantyne C, Fonseca F, Koenig W, Shimokawa H, Everett BM, and Glynn RJ. Modulation of the interleukin-6 signalling pathway and incidence rates of atherosclerotic events and all-cause mortality: analyses from the Canakinumab Anti-Inflammatory Thrombosis Outcomes Study (CANTOS). Eur Heart J 39: 3499-3507, 2018. [CrossRef]
- Battineni G, Sagaro GG, Chintalapudi N, Amenta F, Tomassoni D, and Tayebati SK. Impact of Obesity-Induced Inflammation on Cardiovascular Diseases (CVD). Int J Mol Sci 22: 2021.
- Pietrasik G, Goldenberg I, McNitt S, Moss AJ, and Zareba W. Obesity as a risk factor for sustained ventricular tachyarrhythmias in MADIT II patients. J Cardiovasc Electrophysiol 18: 181-184, 2007. [CrossRef]
- Sabbag A, Goldenberg I, Moss AJ, McNitt S, Glikson M, Biton Y, Jackson L, Polonsky B, Zareba W, and Kutyifa V. Predictors and Risk of Ventricular Tachyarrhythmias or Death in Black and White Cardiac Patients: A MADIT-CRT Trial Substudy. JACC Clin Electrophysiol 2: 448-455, 2016.
- Sabbag A, Sidi Y, Kivity S, Beinart R, Glikson M, Segev S, Goldenberg I, and Maor E. Obesity and exercise-induced ectopic ventricular arrhythmias in apparently healthy middle aged adults. Eur J Prev Cardiol 23: 511-517, 2016. [CrossRef] [PubMed]
- Remme CA. Sudden Cardiac Death in Diabetes and Obesity: Mechanisms and Therapeutic Strategies. Can J Cardiol 38: 418-426, 2022. [CrossRef] [PubMed]
- Mukerji R, Terry BE, Fresen JL, Petruc M, Govindarajan G, and Alpert MA. Relation of left ventricular mass to QTc in normotensive severely obese patients. Obesity (Silver Spring) 20: 1950-1954, 2012. [CrossRef]
- Lazzerini PE, Laghi-Pasini F, Bertolozzi I, Morozzi G, Lorenzini S, Simpatico A, Selvi E, Bacarelli MR, Finizola F, Vanni F, Lazaro D, Aromolaran A, El Sherif N, Boutjdir M, and Capecchi PL. Systemic inflammation as a novel QT-prolonging risk factor in patients with torsades de pointes. Heart 2017.
- Rakemann T, Niehof M, Kubicka S, Fischer M, Manns MP, Rose-John S, and Trautwein C. The designer cytokine hyper-interleukin-6 is a potent activator of STAT3-dependent gene transcription in vivo and in vitro. J Biol Chem 274: 1257-1266, 1999.
- Fischer M, Goldschmitt J, Peschel C, Brakenhoff JP, Kallen KJ, Wollmer A, Grotzinger J, and Rose-John S. I. A bioactive designer cytokine for human hematopoietic progenitor cell expansion. Nat Biotechnol 15: 142-145, 1997.
- Rose-John S. Interleukin-6 signalling in health and disease. F1000Res 9: 2020.
- Gatsiou A, Tual-Chalot S, Napoli M, Ortega-Gomez A, Regen T, Badolia R, Cesarini V, Garcia-Gonzalez C, Chevre R, Ciliberti G, Silvestre-Roig C, Martini M, Hoffmann J, Hamouche R, Visker JR, Diakos N, Wietelmann A, Silvestris DA, Georgiopoulos G, Moshfegh A, Schneider A, Chen W, Guenther S, Backs J, Kwak S, Selzman CH, Stamatelopoulos K, Rose-John S, Trautwein C, Spyridopoulos I, Braun T, Waisman A, Gallo A, Drakos SG, Dimmeler S, Sperandio M, Soehnlein O, and Stellos K. The RNA editor ADAR2 promotes immune cell trafficking by enhancing endothelial responses to interleukin-6 during sterile inflammation. Immunity 56: 979-997 e911, 2023.
- Gong L, Manaenko A, Fan R, Huang L, Enkhjargal B, McBride D, Ding Y, Tang J, Xiao X, and Zhang JH. Osteopontin attenuates inflammation via JAK2/STAT1 pathway in hyperglycemic rats after intracerebral hemorrhage. Neuropharmacology 138: 160-169, 2018.
- Goumas FA, Holmer R, Egberts JH, Gontarewicz A, Heneweer C, Geisen U, Hauser C, Mende MM, Legler K, Röcken C, Becker T, Waetzig GH, Rose-John S, and Kalthoff H. Inhibition of IL-6 signaling significantly reduces primary tumor growth and recurrencies in orthotopic xenograft models of pancreatic cancer. Int J Cancer 137: 1035-1046, 2015.
- Aromolaran AS, and Boutjdir M. Cardiac Ion Channel Regulation in Obesity and the Metabolic Syndrome: Relevance to Long QT Syndrome and Atrial Fibrillation. Frontiers in Physiology 8: 2017.
- Mallat Z, Heymes C, Corbaz A, Logeart D, Alouani S, Cohen-Solal A, Seidler T, Hasenfuss G, Chvatchko Y, Shah AM, and Tedgui A. Evidence for altered interleukin 18 (IL)-18 pathway in human heart failure. Faseb j 18: 1752-1754, 2004. [CrossRef]
- O’Brien LC, Mezzaroma E, Van Tassell BW, Marchetti C, Carbone S, Abbate A, and Toldo S. Interleukin-18 as a therapeutic target in acute myocardial infarction and heart failure. Mol Med 20: 221-229, 2014. [CrossRef]
- Toldo S, Mezzaroma E, O’Brien L, Marchetti C, Seropian IM, Voelkel NF, Van Tassell BW, Dinarello CA, and Abbate A. Interleukin-18 mediates interleukin-1-induced cardiac dysfunction. Am J Physiol Heart Circ Physiol 306: H1025-1031, 2014.
- Enoksson SL, Grasset EK, Hagglof T, Mattsson N, Kaiser Y, Gabrielsson S, McGaha TL, Scheynius A, and Karlsson MC. The inflammatory cytokine IL-18 induces self-reactive innate antibody responses regulated by natural killer T cells. Proc Natl Acad Sci U S A 108: E1399-1407, 2011.
- Doyle SL, Lopez FJ, Celkova L, Brennan K, Mulfaul K, Ozaki E, Kenna PF, Kurali E, Hudson N, Doggett T, Ferguson TA, Humphries P, Adamson P, and Campbell M. IL-18 Immunotherapy for Neovascular AMD: Tolerability and Efficacy in Nonhuman Primates. Invest Ophthalmol Vis Sci 56: 5424-5430, 2015.
- Chiang HY, Lu HH, Sudhakar JN, Chen YW, Shih NS, Weng YT, and Shui JW. IL-22 initiates an IL-18-dependent epithelial response circuit to enforce intestinal host defence. Nat Commun 13: 874, 2022.
- Thompson E, Eldstrom J, Westhoff M, McAfee D, Balse E, and Fedida D. cAMP-dependent regulation of I(Ks) single-channel kinetics. J Gen Physiol 149: 781-798, 2017. [CrossRef]
- Jost N, Virag L, Bitay M, Takacs J, Lengyel C, Biliczki P, Nagy Z, Bogats G, Lathrop DA, Papp JG, and Varro A. Restricting excessive cardiac action potential and QT prolongation: a vital role for IKs in human ventricular muscle. Circulation 112: 1392-1399, 2005. [CrossRef] [PubMed]
- Sarkar AX, and Sobie EA. Quantification of repolarization reserve to understand interpatient variability in the response to proarrhythmic drugs: a computational analysis. Heart Rhythm 8: 1749-1755, 2011.
- Bosch RF, Gaspo R, Busch AE, Lang HJ, Li GR, and Nattel S. Effects of the chromanol 293B, a selective blocker of the slow, component of the delayed rectifier K+ current, on repolarization in human and guinea pig ventricular myocytes. Cardiovasc Res 38: 441-450, 1998. [CrossRef]
- Hancox JC, McPate MJ, El Harchi A, and Zhang YH. The hERG potassium channel and hERG screening for drug-induced torsades de pointes. Pharmacol Ther 119: 118-132, 2008.
- Garrido A, Lepailleur A, Mignani SM, Dallemagne P, and Rochais C. hERG toxicity assessment: Useful guidelines for drug design. Eur J Med Chem 195: 112290, 2020. [CrossRef] [PubMed]
- Taga T, and Kishimoto T. Gp130 and the interleukin-6 family of cytokines. Annual review of immunology 15: 797-819, 1997.
- Fontes JA, Rose NR, and Cihakova D. The varying faces of IL-6: From cardiac protection to cardiac failure. Cytokine 74: 62-68, 2015. [CrossRef] [PubMed]
- Akira S, Isshiki H, Sugita T, Tanabe O, Kinoshita S, Nishio Y, Nakajima T, Hirano T, and Kishimoto T. A nuclear factor for IL-6 expression (NF-IL6) is a member of a C/EBP family. Embo j 9: 1897-1906, 1990.
- Akira S, Nishio Y, Inoue M, Wang XJ, Wei S, Matsusaka T, Yoshida K, Sudo T, Naruto M, and Kishimoto T. Molecular cloning of APRF, a novel IFN-stimulated gene factor 3 p91-related transcription factor involved in the gp130-mediated signaling pathway. Cell 77: 63-71, 1994.
- Naka T, Narazaki M, Hirata M, Matsumoto T, Minamoto S, Aono A, Nishimoto N, Kajita T, Taga T, Yoshizaki K, Akira S, and Kishimoto T. Structure and function of a new STAT-induced STAT inhibitor. Nature 387: 924-929, 1997. [CrossRef] [PubMed]
- Zhong Z, Wen Z, and Darnell JE, Jr. Stat3: a STAT family member activated by tyrosine phosphorylation in response to epidermal growth factor and interleukin-6. Science 264: 95-98, 1994. [CrossRef]
- Darnell JE, Jr. STATs and gene regulation. Science 277: 1630-1635, 1997. [CrossRef]
- Horvath CM, and Darnell JE. The state of the STATs: recent developments in the study of signal transduction to the nucleus. Curr Opin Cell Biol 9: 233-239, 1997.
- Imada K, and Leonard WJ. The Jak-STAT pathway. Mol Immunol 37: 1-11, 2000.
- Koglin J, Glysing-Jensen T, Gadiraju S, and Russell ME. Attenuated Cardiac Allograft Vasculopathy in Mice With Targeted Deletion of the Transcription Factor STAT4. Circulation 101: 1034-1039, 2000. [CrossRef] [PubMed]
- Svenungsson E, Gustafsson J, Leonard D, Sandling J, Gunnarsson I, Nordmark G, Jönsen A, Bengtsson AA, Sturfelt G, Rantapää-Dahlqvist S, Elvin K, Sundin U, Garnier S, Simard JF, Sigurdsson S, Padyukov L, Syvänen A-C, and Rönnblom L. A <em>STAT4</em> risk allele is associated with ischaemic cerebrovascular events and anti-phospholipid antibodies in systemic lupus erythematosus. Annals of the rheumatic diseases 69: 834-840, 2010.
- Meinert C, Gembardt F, Böhme I, Tetzner A, Wieland T, Greenberg B, and Walther T. Identification of intracellular proteins and signaling pathways in human endothelial cells regulated by angiotensin-(1–7). Journal of Proteomics 130: 129-139, 2016. [CrossRef] [PubMed]
- Hotamisligil GS, Arner P, Caro JF, Atkinson RL, and Spiegelman BM. Increased adipose tissue expression of tumor necrosis factor-alpha in human obesity and insulin resistance. J Clin Invest 95: 2409-2415, 1995.
- Sharma S, Adrogue JV, Golfman L, Uray I, Lemm J, Youker K, Noon GP, Frazier OH, and Taegtmeyer H. Intramyocardial lipid accumulation in the failing human heart resembles the lipotoxic rat heart. Faseb j 18: 1692-1700, 2004. [CrossRef] [PubMed]
- Del Alamo JC, Lemons D, Serrano R, Savchenko A, Cerignoli F, Bodmer R, and Mercola M. High throughput physiological screening of iPSC-derived cardiomyocytes for drug development. Biochim Biophys Acta 1863: 1717-1727, 2016.
- D’Aquila T, Zembroski AS, and Buhman KK. Diet Induced Obesity Alters Intestinal Cytoplasmic Lipid Droplet Morphology and Proteome in the Postprandial Response to Dietary Fat. Front Physiol 10: 180, 2019.
- Zadoorian A, Du X, and Yang H. Lipid droplet biogenesis and functions in health and disease. Nature Reviews Endocrinology 19: 443-459, 2023.
- Martinez-Mateu L, Saiz J, and Aromolaran AS. Differential Modulation of I(K) and I(Ca,L) Channels in High-Fat Diet-Induced Obese Guinea Pig Atria. Front Physiol 10: 1212, 2019.
- Ridker PM, MacFadyen JG, Thuren T, and Libby P. Residual inflammatory risk associated with interleukin-18 and interleukin-6 after successful interleukin-1beta inhibition with canakinumab: further rationale for the development of targeted anti-cytokine therapies for the treatment of atherothrombosis. Eur Heart J 41: 2153-2163, 2020.
- Mazurek T, Zhang L, Zalewski A, Mannion JD, Diehl JT, Arafat H, Sarov-Blat L, O’Brien S, Keiper EA, Johnson AG, Martin J, Goldstein BJ, and Shi Y. Human epicardial adipose tissue is a source of inflammatory mediators. Circulation 108: 2460-2466, 2003.
- Barbarroja N, Lopez-Pedrera R, Mayas MD, Garcia-Fuentes E, Garrido-Sanchez L, Macias-Gonzalez M, El Bekay R, Vidal-Puig A, and Tinahones FJ. The obese healthy paradox: is inflammation the answer? Biochem J 430: 141-149, 2010. [CrossRef] [PubMed]
- Vyas V, Blythe H, Wood EG, Sandhar B, Sarker SJ, Balmforth D, Ambekar SG, Yap J, Edmondson SJ, Di Salvo C, Wong K, Roberts N, Uppal R, Adams B, Shipolini A, Oo AY, Lawrence D, Kolvekar S, Lall KS, Finlay MC, and Longhi MP. Obesity and diabetes are major risk factors for epicardial adipose tissue inflammation. JCI Insight 6: 2021. [CrossRef] [PubMed]
- Wu CK, Tsai HY, Su MY, Wu YF, Hwang JJ, Tseng WY, Lin JL, and Lin LY. Pericardial fat is associated with ventricular tachyarrhythmia and mortality in patients with systolic heart failure. Atherosclerosis 241: 607-614, 2015.
- Fuller B, Garland J, Anne S, Beh R, McNevin D, and Tse R. Increased Epicardial Fat Thickness in Sudden Death From Stable Coronary Artery Atherosclerosis. Am J Forensic Med Pathol 38: 162-166, 2017. [CrossRef] [PubMed]
- Packer M. Epicardial Adipose Tissue May Mediate Deleterious Effects of Obesity and Inflammation on the Myocardium. J Am Coll Cardiol 71: 2360-2372, 2018.
- Kelley N, Jeltema D, Duan Y, and He Y. The NLRP3 Inflammasome: An Overview of Mechanisms of Activation and Regulation. Int J Mol Sci 20: 2019.
- Vm M, Al S, Aa A, As Z, Av K, Rs O, Im M, and Ga K. Circulating interleukin-18: Association with IL-8, IL-10 and VEGF serum levels in patients with and without heart rhythm disorders. Int J Cardiol 215: 105-109, 2016. [CrossRef] [PubMed]
- Gupta A, Fei YD, Kim TY, Xie A, Batai K, Greener I, Tang H, Ciftci-Yilmaz S, Juneman E, Indik JH, Shi G, Christensen J, Gupta G, Hillery C, Kansal MM, Parikh DS, Zhou T, Yuan JX, Kanthi Y, Bronk P, Koren G, Kittles R, Duarte JD, Garcia JGN, Machado RF, Dudley SC, Choi BR, and Desai AA. IL-18 mediates sickle cell cardiomyopathy and ventricular arrhythmias. Blood 137: 1208-1218, 2021.
- Bers DM, and Despa S. Na+ transport in cardiac myocytes; Implications for excitation-contraction coupling. IUBMB life 61: 215-221, 2009.
- Varro A, Nanasi PP, and Lathrop DA. Potassium currents in isolated human atrial and ventricular cardiocytes. Acta Physiol Scand 149: 133-142, 1993. [CrossRef]
- Aromolaran AS, Subramanyam P, Chang DD, Kobertz WR, and Colecraft HM. LQT1 mutations in KCNQ1 C-terminus assembly domain suppress IKs using different mechanisms. Cardiovasc Res 104: 501-511, 2014.
- Cheng EP, Yuan C, Navedo MF, Dixon RE, Nieves-Cintron M, Scott JD, and Santana LF. Restoration of normal L-type Ca2+ channel function during Timothy syndrome by ablation of an anchoring protein. Circ Res 109: 255-261, 2011. [CrossRef] [PubMed]
- Aromolaran AS, Srivastava U, Ali A, Chahine M, Lazaro D, El-Sherif N, Capecchi PL, Laghi-Pasini F, Lazzerini PE, and Boutjdir M. Interleukin-6 inhibition of hERG underlies risk for acquired long QT in cardiac and systemic inflammation. PLoS One 13: e0208321, 2018.
- Hagiwara Y, Miyoshi S, Fukuda K, Nishiyama N, Ikegami Y, Tanimoto K, Murata M, Takahashi E, Shimoda K, Hirano T, Mitamura H, and Ogawa S. SHP2-mediated signaling cascade through gp130 is essential for LIF-dependent I CaL, [Ca2+]i transient, and APD increase in cardiomyocytes. J Mol Cell Cardiol 43: 710-716, 2007. [CrossRef] [PubMed]
- Landstrom AP, Dobrev D, and Wehrens XHT. Calcium Signaling and Cardiac Arrhythmias. Circ Res 120: 1969-1993, 2017. [CrossRef] [PubMed]
- Wang J, Wang H, Zhang Y, Gao H, Nattel S, and Wang Z. Impairment of HERG K(+) channel function by tumor necrosis factor-alpha: role of reactive oxygen species as a mediator. J Biol Chem 279: 13289-13292, 2004.
- Monnerat G, Alarcon ML, Vasconcellos LR, Hochman-Mendez C, Brasil G, Bassani RA, Casis O, Malan D, Travassos LH, Sepulveda M, Burgos JI, Vila-Petroff M, Dutra FF, Bozza MT, Paiva CN, Carvalho AB, Bonomo A, Fleischmann BK, de Carvalho AC, and Medei E. Macrophage-dependent IL-1beta production induces cardiac arrhythmias in diabetic mice. Nat Commun 7: 13344, 2016. [CrossRef] [PubMed]
- Li YH, and Rozanski GJ. Effects of human recombinant interleukin-1 on electrical properties of guinea pig ventricular cells. Cardiovasc Res 27: 525-530, 1993.
- Kotake S, Sato K, Kim KJ, Takahashi N, Udagawa N, Nakamura I, Yamaguchi A, Kishimoto T, Suda T, and Kashiwazaki S. Interleukin-6 and soluble interleukin-6 receptors in the synovial fluids from rheumatoid arthritis patients are responsible for osteoclast-like cell formation. J Bone Miner Res 11: 88-95, 1996. [CrossRef] [PubMed]
- Rose-John S. The Soluble Interleukin 6 Receptor: Advanced Therapeutic Options in Inflammation. Clin Pharmacol Ther 102: 591-598, 2017.
- Campbell L, Chen C, Bhagat SS, Parker RA, and Ostor AJ. Risk of adverse events including serious infections in rheumatoid arthritis patients treated with tocilizumab: a systematic literature review and meta-analysis of randomized controlled trials. Rheumatology (Oxford, England) 50: 552-562, 2011.
- Smolen JS, Beaulieu A, Rubbert-Roth A, Ramos-Remus C, Rovensky J, Alecock E, Woodworth T, Alten R, and Investigators O. Effect of interleukin-6 receptor inhibition with tocilizumab in patients with rheumatoid arthritis (OPTION study): a double-blind, placebo-controlled, randomised trial. Lancet 371: 987-997, 2008. [CrossRef] [PubMed]
- Ding C, and Jones G. Anti-interleukin-6 receptor antibody treatment in inflammatory autoimmune diseases. Rev Recent Clin Trials 1: 193-200, 2006.
- Kawashiri SY, Kawakami A, Yamasaki S, Imazato T, Iwamoto N, Fujikawa K, Aramaki T, Tamai M, Nakamura H, Ida H, Origuchi T, Ueki Y, and Eguchi K. Effects of the anti-interleukin-6 receptor antibody, tocilizumab, on serum lipid levels in patients with rheumatoid arthritis. Rheumatol Int 31: 451-456, 2011. [CrossRef] [PubMed]
- Chen B, Zhang S, Wang B, Chen H, Li Y, Cao Q, Zhong J, Xie M, Ran Z, Tang T, Yang M, Guo T, Xu B, Cai Z, Ma L, Schreiber S, and Chen M. 775b Olamkicept, an IL-6 Trans-Signaling Inhibitor, is Effective for Induction of Response and Remission in A Randomized, Placebo-Controlled Trial in Moderate to Severe Ulcerative Colitis. Gastroenterology 161: e28-e29, 2021.
- Chen B, Zhang S, Wang B, Chen H, Li Y, Cao Q, Zhong J, Xie M, Ran Z, Tang T, Yang M, Guo T, Xu B, Cai Z, Schreiber S, and Chen M. DOP01 Efficacy and safety of the IL-6 trans-signalling inhibitor olamkicept: a phase 2 randomized, placebo-controlled trial in moderately to severely active Ulcerative Colitis. Journal of Crohn’s and Colitis 15: S041-S042, 2021.
- Schreiber S, Aden K, Bernardes JP, Conrad C, Tran F, Hoper H, Volk V, Mishra N, Blase JI, Nikolaus S, Bethge J, Kuhbacher T, Rocken C, Chen M, Cottingham I, Petri N, Rasmussen BB, Lokau J, Lenk L, Garbers C, Feuerhake F, Rose-John S, Waetzig GH, and Rosenstiel P. Therapeutic Interleukin-6 Trans-signaling Inhibition by Olamkicept (sgp130Fc) in Patients With Active Inflammatory Bowel Disease. Gastroenterology 160: 2354-2366 e2311, 2021.
- Schulte DM, Waetzig GH, Schuett H, Marx M, Schulte B, Garbers C, Lokau J, Vlacil A-K, Schulz J, Seoudy AK, Schieffer B, Rosenstiel P, Seeger M, Laudes M, Rose-John S, Lützen U, Grote K, and Schreiber S. Case Report: Arterial Wall Inflammation in Atherosclerotic Cardiovascular Disease is Reduced by Olamkicept (sgp130Fc). Frontiers in Pharmacology 13: 2022.
- Salama A, Amin MM, and Hassan A. Effects of oleic acid and/or exercise on diet-induced thermogenesis and obesity in rats: involvement of beige adipocyte differentiation and macrophage M1 inhibition. Res Pharm Sci 18: 219-230, 2023.
- Conte M, Petraglia L, Poggio P, Valerio V, Cabaro S, Campana P, Comentale G, Attena E, Russo V, Pilato E, Formisano P, Leosco D, and Parisi V. Inflammation and Cardiovascular Diseases in the Elderly: The Role of Epicardial Adipose Tissue. Front Med (Lausanne) 9: 844266, 2022.
- Konwerski M, Gąsecka A, Opolski G, Grabowski M, and Mazurek T. Role of Epicardial Adipose Tissue in Cardiovascular Diseases: A Review. Biology (Basel) 11: 2022.
- Swifka J, Weiss J, Addicks K, Eckel J, and Rosen P. Epicardial fat from guinea pig: a model to study the paracrine network of interactions between epicardial fat and myocardium? Cardiovasc Drugs Ther 22: 107-114, 2008.
- Back M, Yin L, and Ingelsson E. Cyclooxygenase-2 inhibitors and cardiovascular risk in a nation-wide cohort study after the withdrawal of rofecoxib. Eur Heart J 33: 1928-1933, 2012.
- Schmidt M, Christiansen CF, Mehnert F, Rothman KJ, and Sorensen HT. Non-steroidal anti-inflammatory drug use and risk of atrial fibrillation or flutter: population based case-control study. BMJ 343: d3450, 2011.
- van der Hooft CS, Heeringa J, Brusselle GG, Hofman A, Witteman JC, Kingma JH, Sturkenboom MC, and Stricker BH. Corticosteroids and the risk of atrial fibrillation. Arch Intern Med 166: 1016-1020, 2006.
- De Caterina R, Ruigomez A, and Rodriguez LA. Long-term use of anti-inflammatory drugs and risk of atrial fibrillation. Arch Intern Med 170: 1450-1455, 2010.
- Granier M, Massin F, and Pasquie JL. Pro- and anti-arrhythmic effects of anti-inflammatory drugs. Antiinflamm Antiallergy Agents Med Chem 12: 83-93, 2013.



| Gene | Sequence (5’- > 3´) | Gene ID |
|---|---|---|
| IL-6R | sense GGGTCGGGCTTCAAGATGTTA antisense AACGGTGCCTGTATTCTGGG |
100730490 |
| JAK2 | sense CTTAGATTACGCCGCCCAGC antisense TGTGCCGGTATGACCCTCTA |
100722908 |
| KCNQ1 | sense GCTGTTCTCTGAGGGTCTTCCA antisense CCATCCACCCTGAACTCTTTCT |
100379230 |
| KCNE1 | sense TCCCAGGAAAACTGTCAGCTC antisense CGGTTCTGAGGAAGCGGATT |
100135562 |
| Conditions | QTc (ms) (Basal) |
QTc (ms) (Post-intervention) |
P Value |
Δ QTc (ms) |
n |
|---|---|---|---|---|---|
| Low fat diet (LFD) | 279.8±15.2 | 269.4±18.1 | 0.665 | -10.5±4.51 | 8 |
| High fat diet (HFD) | 260.4±15.1 | 323.9±15.2* | 0.0018 | 63.32±10.9 | 15 |
| Oleic acid diet (OAD) | 294.7±6.14 | 307.8±5.58 | 0.137 | 13.1±8.09 | 8 |
| Conditions | QTc (ms) (Basal) |
QTc (ms) (Post-intervention) |
P Value |
Δ QTc (ms) |
n |
|---|---|---|---|---|---|
| Vehicle | 297.3±2.54 | 302.7±3.94 | 0.298 | 5.42±1.45 | 4 |
| IL-6-sIL-6R | 289.3±0.72 | 310.9±4.22* | 0.003 | 21.66±6.12 | 5 |
| hyperIL-6 (hIL-6) | 299.7±2.61 | 333.9±8.63* | 0.004 | 34.8±8.15 | 8 |
| hIL-6+Olamkicept | 292.9±5.47 | 293.8±4.24 | 0.899 | 0.93±8.30 | 3 |
| Coumermycin | 299.1±5.40 | 337.5±10.7* | 0.01 | 38.4±10.9 | 7 |
| IL-6-sIL-6R+IL-18 | 292.3±10.7 | 319.2±10.7* | 0.0004 | 26.95±3.98 | 6 |
| Chromanol293B | 308.6±4.24 | 327.9±5.68* | 0.018 | 19.23±3.35 | 8 |
| Chromanol293B+ISO- 10 min | 308.6±4.24 | 342.5±7.69* | 0.004 | 33.0±10.4 | 6 |
| Chromanol293B+ISO+Cytomix- 10 min | 308.6±4.24 | 363.6±6.48* | 0.0036 | 54.2±11.02 | 3 |
| Chromanol293B+ISO+Cytomix- 30 min | 308.6±4.24 | 377.8±15.3* | 0.03 | 68.4±17.8 | 3 |
Disclaimer/Publisher’s Note: The statements, opinions and data contained in all publications are solely those of the individual author(s) and contributor(s) and not of MDPI and/or the editor(s). MDPI and/or the editor(s) disclaim responsibility for any injury to people or property resulting from any ideas, methods, instructions or products referred to in the content. |
© 2024 by the authors. Licensee MDPI, Basel, Switzerland. This article is an open access article distributed under the terms and conditions of the Creative Commons Attribution (CC BY) license (http://creativecommons.org/licenses/by/4.0/).


