Submitted:
20 June 2024
Posted:
20 June 2024
You are already at the latest version
Abstract
Keywords:
1. Introduction
2. Materials and Methods
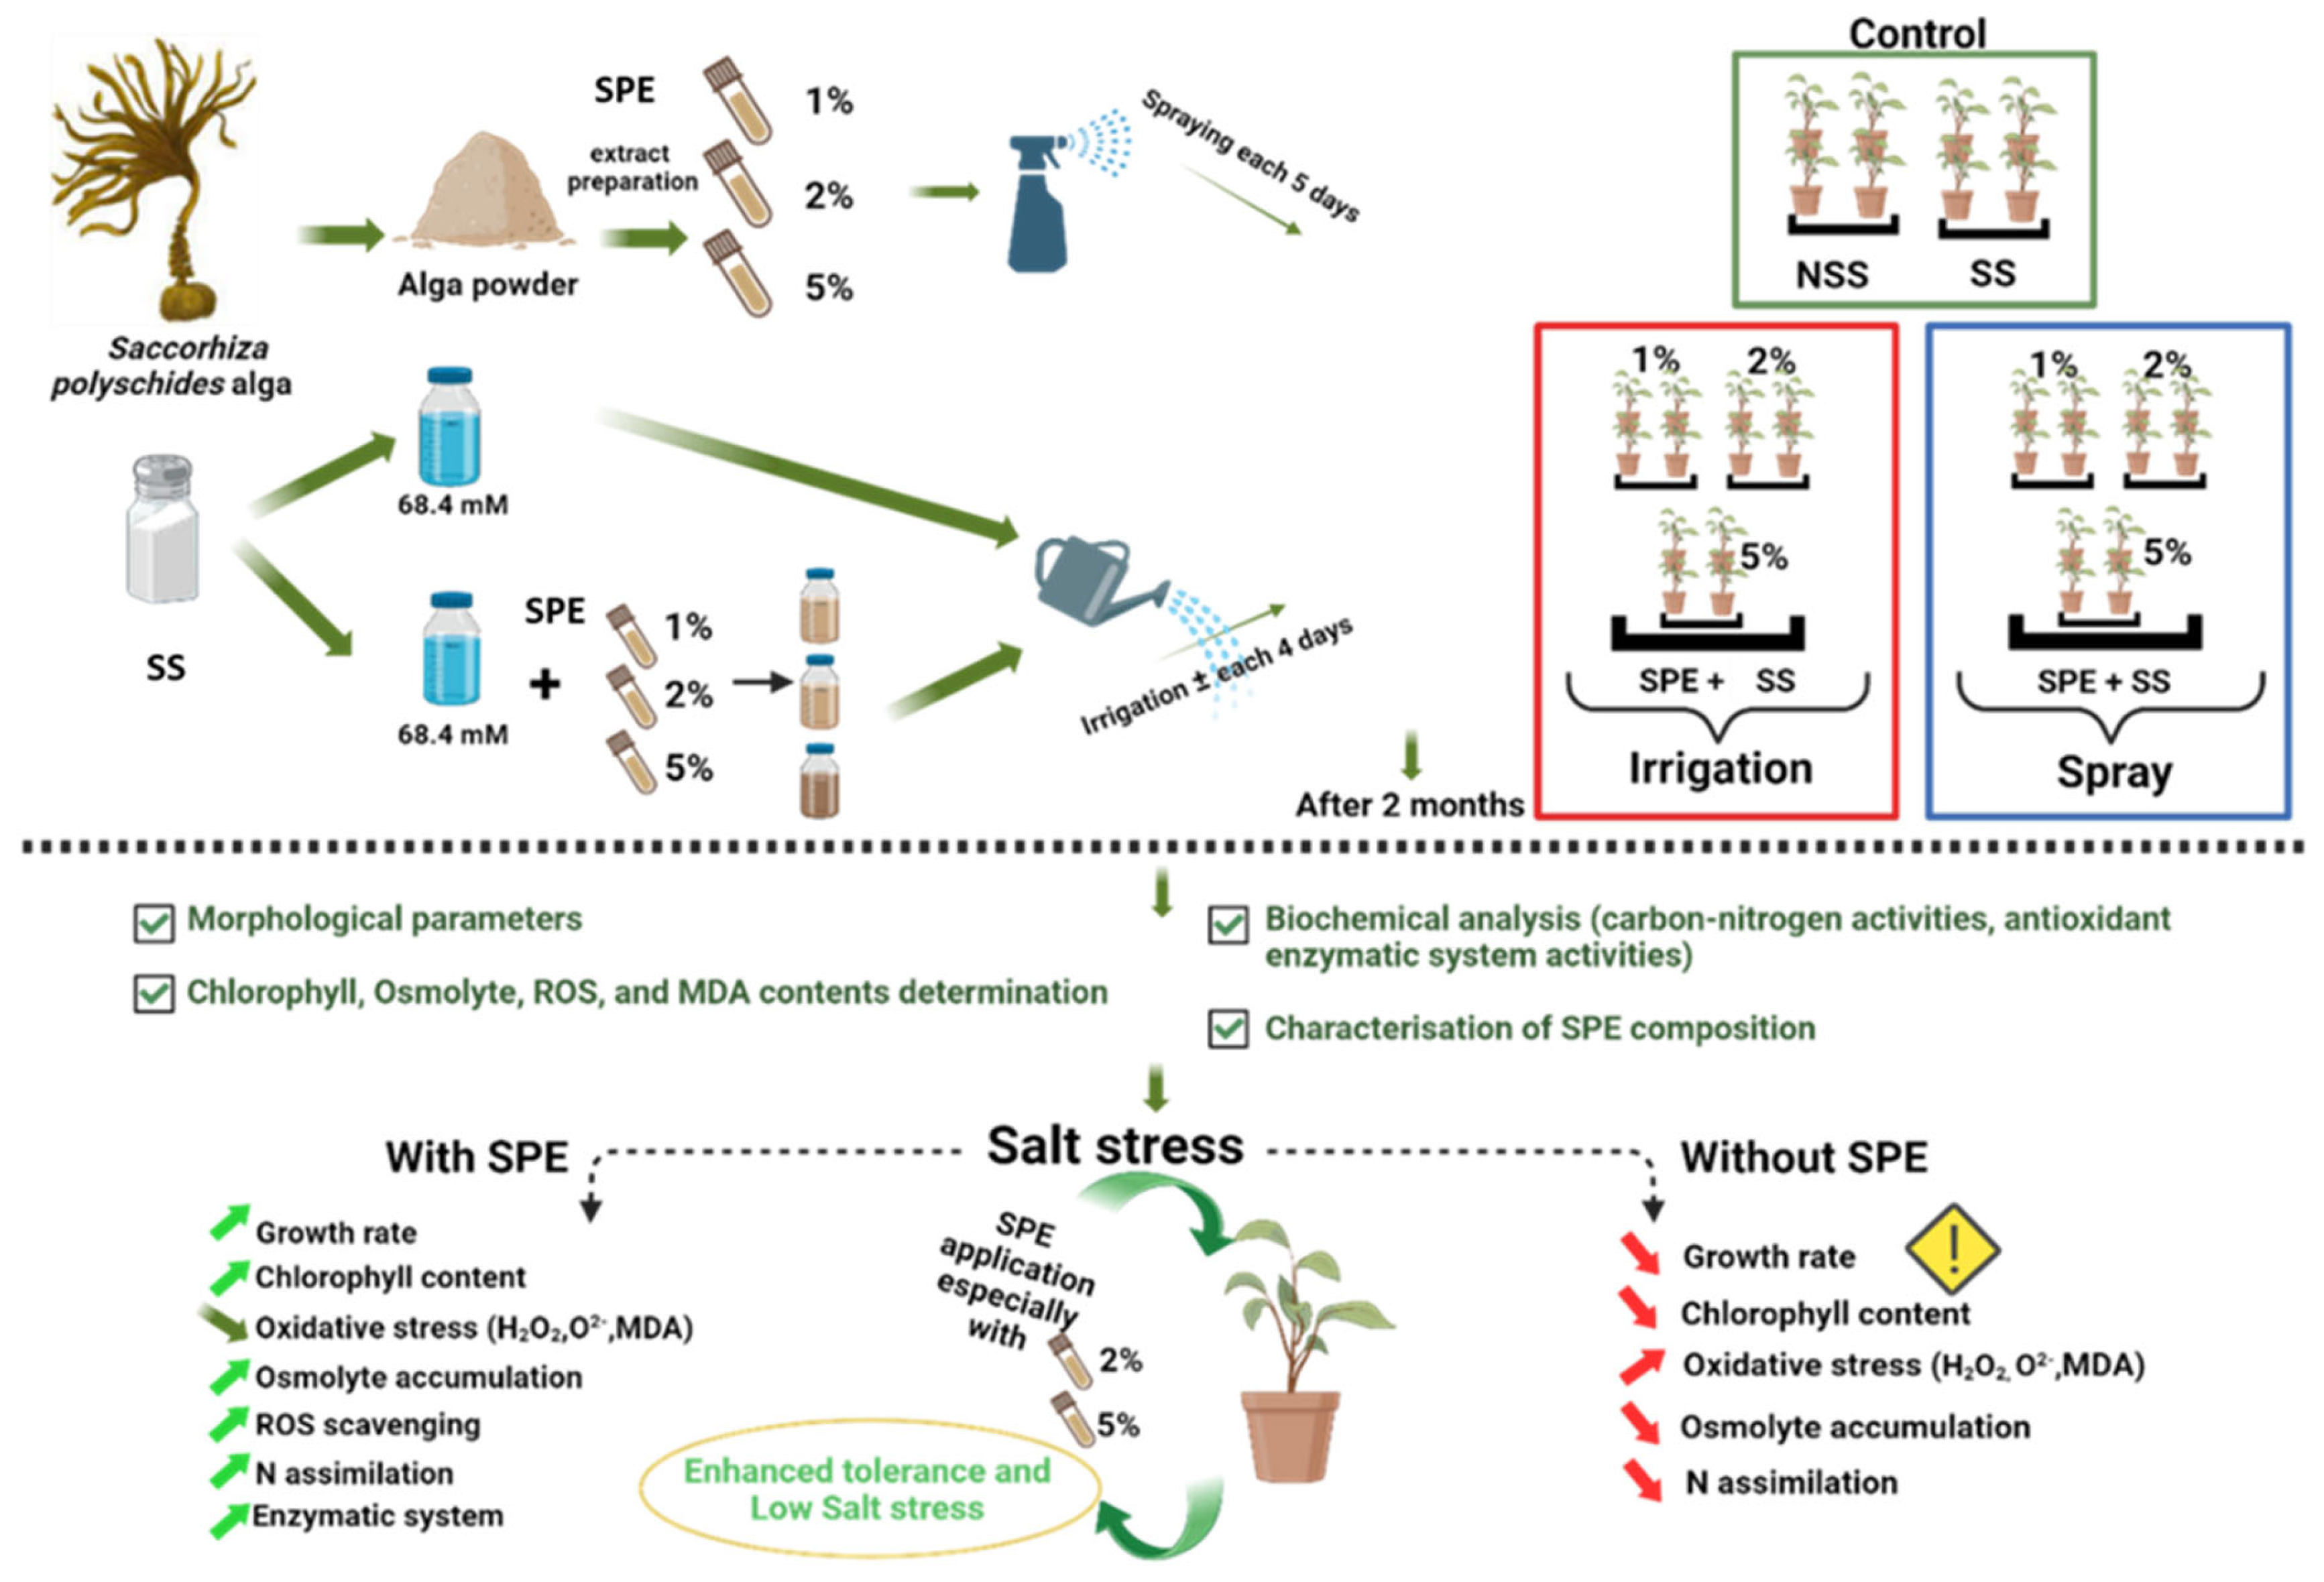
2.1. Graphical experimental design
2.2. Preparation of Seaweed Extract
2.2.1. Chemical composition of Saccorhiza polyschides Extract
2.3. Plant Material and Growth Conditions
2.4. Estimation of Malondialdehyde Content
2.5. Estimation of O2- Content
2.6. Estimation of H2O2 Content
2.7. Chlorophyll Assay
2.8. Plant Extract Preparation for Measurement of Soluble Sugar, Amino Acid, and Indole Acetic Acid Contents
2.8.1. Estimation of Indole Acetic Acid Content
2.8.2. Estimation of Amino Acid content
2.8.3. Estimation of Soluble Sugar Content
2.9. Extraction and Assay of Antioxidant Activities
2.10. Extraction and Assay of Nitrogen and Carbon Activities
Protein Determination
2.11. Statistical Analysis
3. Results
3.1. Saccorhiza polyschides Extract Composition
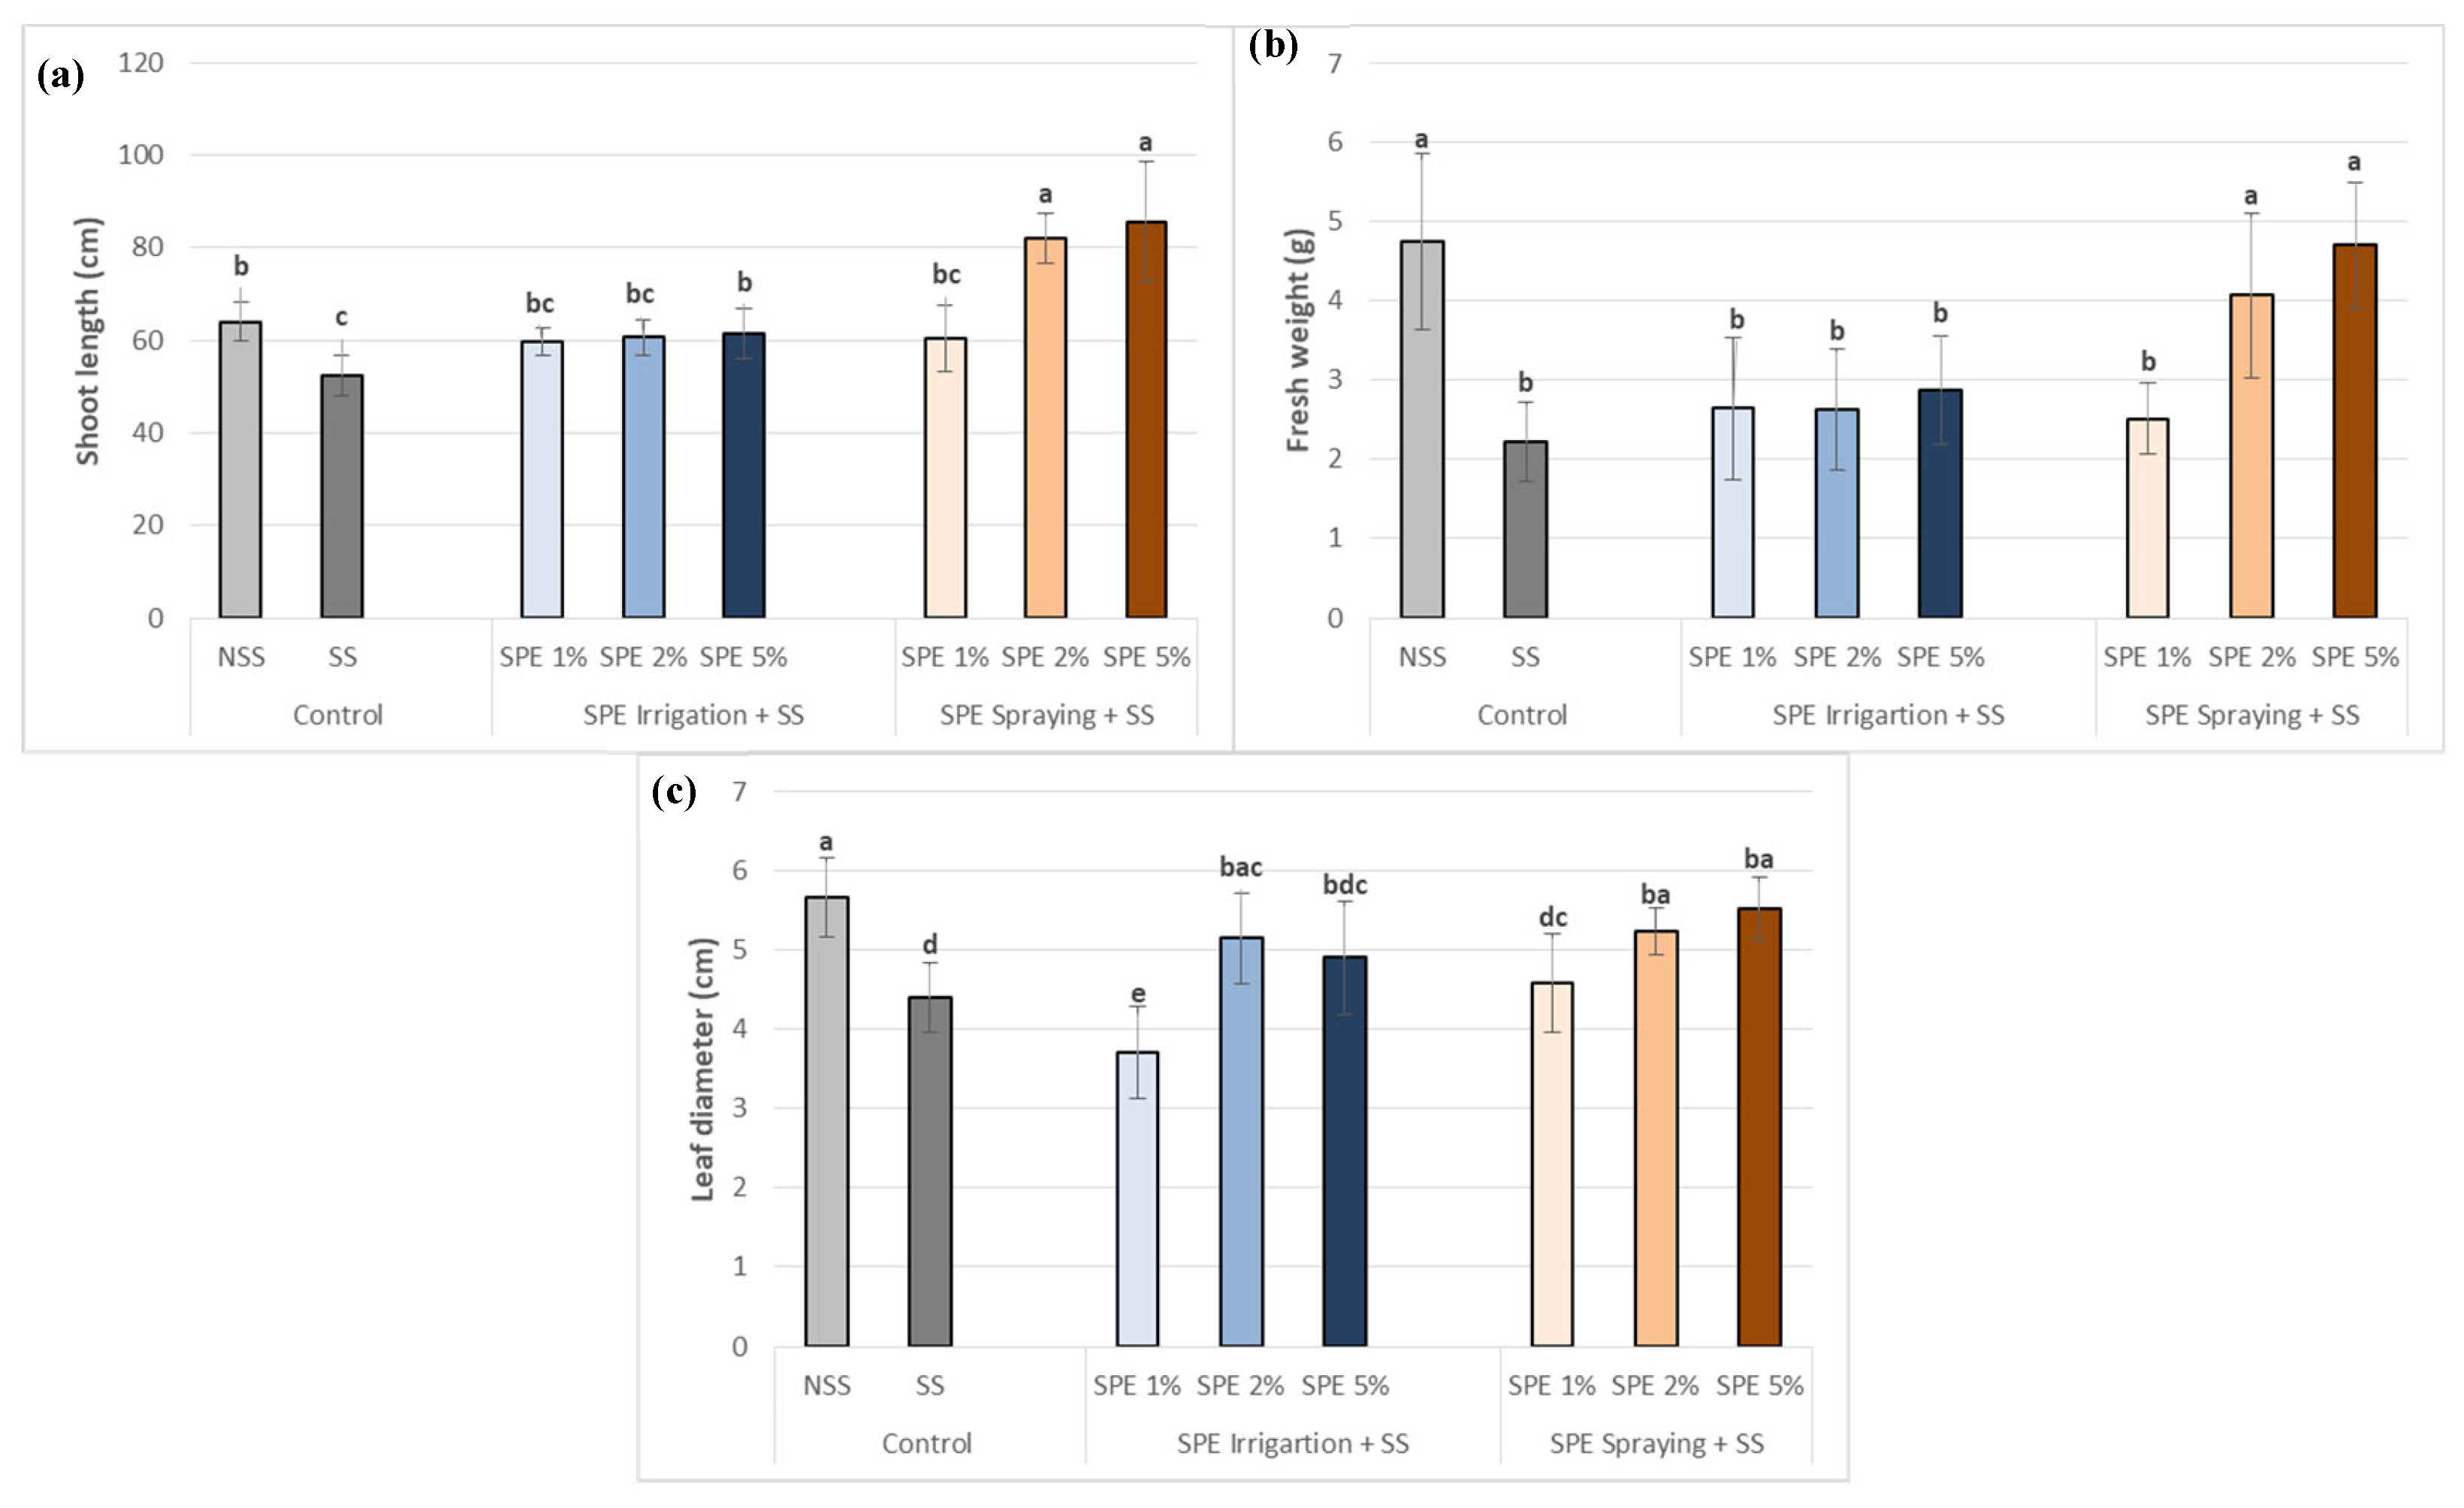
3.2. Saccorhiza polyschides Extract enhanced the Growth Parameters of Common Bean Plants under Salt Stress
3.3. Saccorhiza polyschides Extract Enhanced Chlorophyll and Osmolytes in Common Bean Plants under Salt Stress
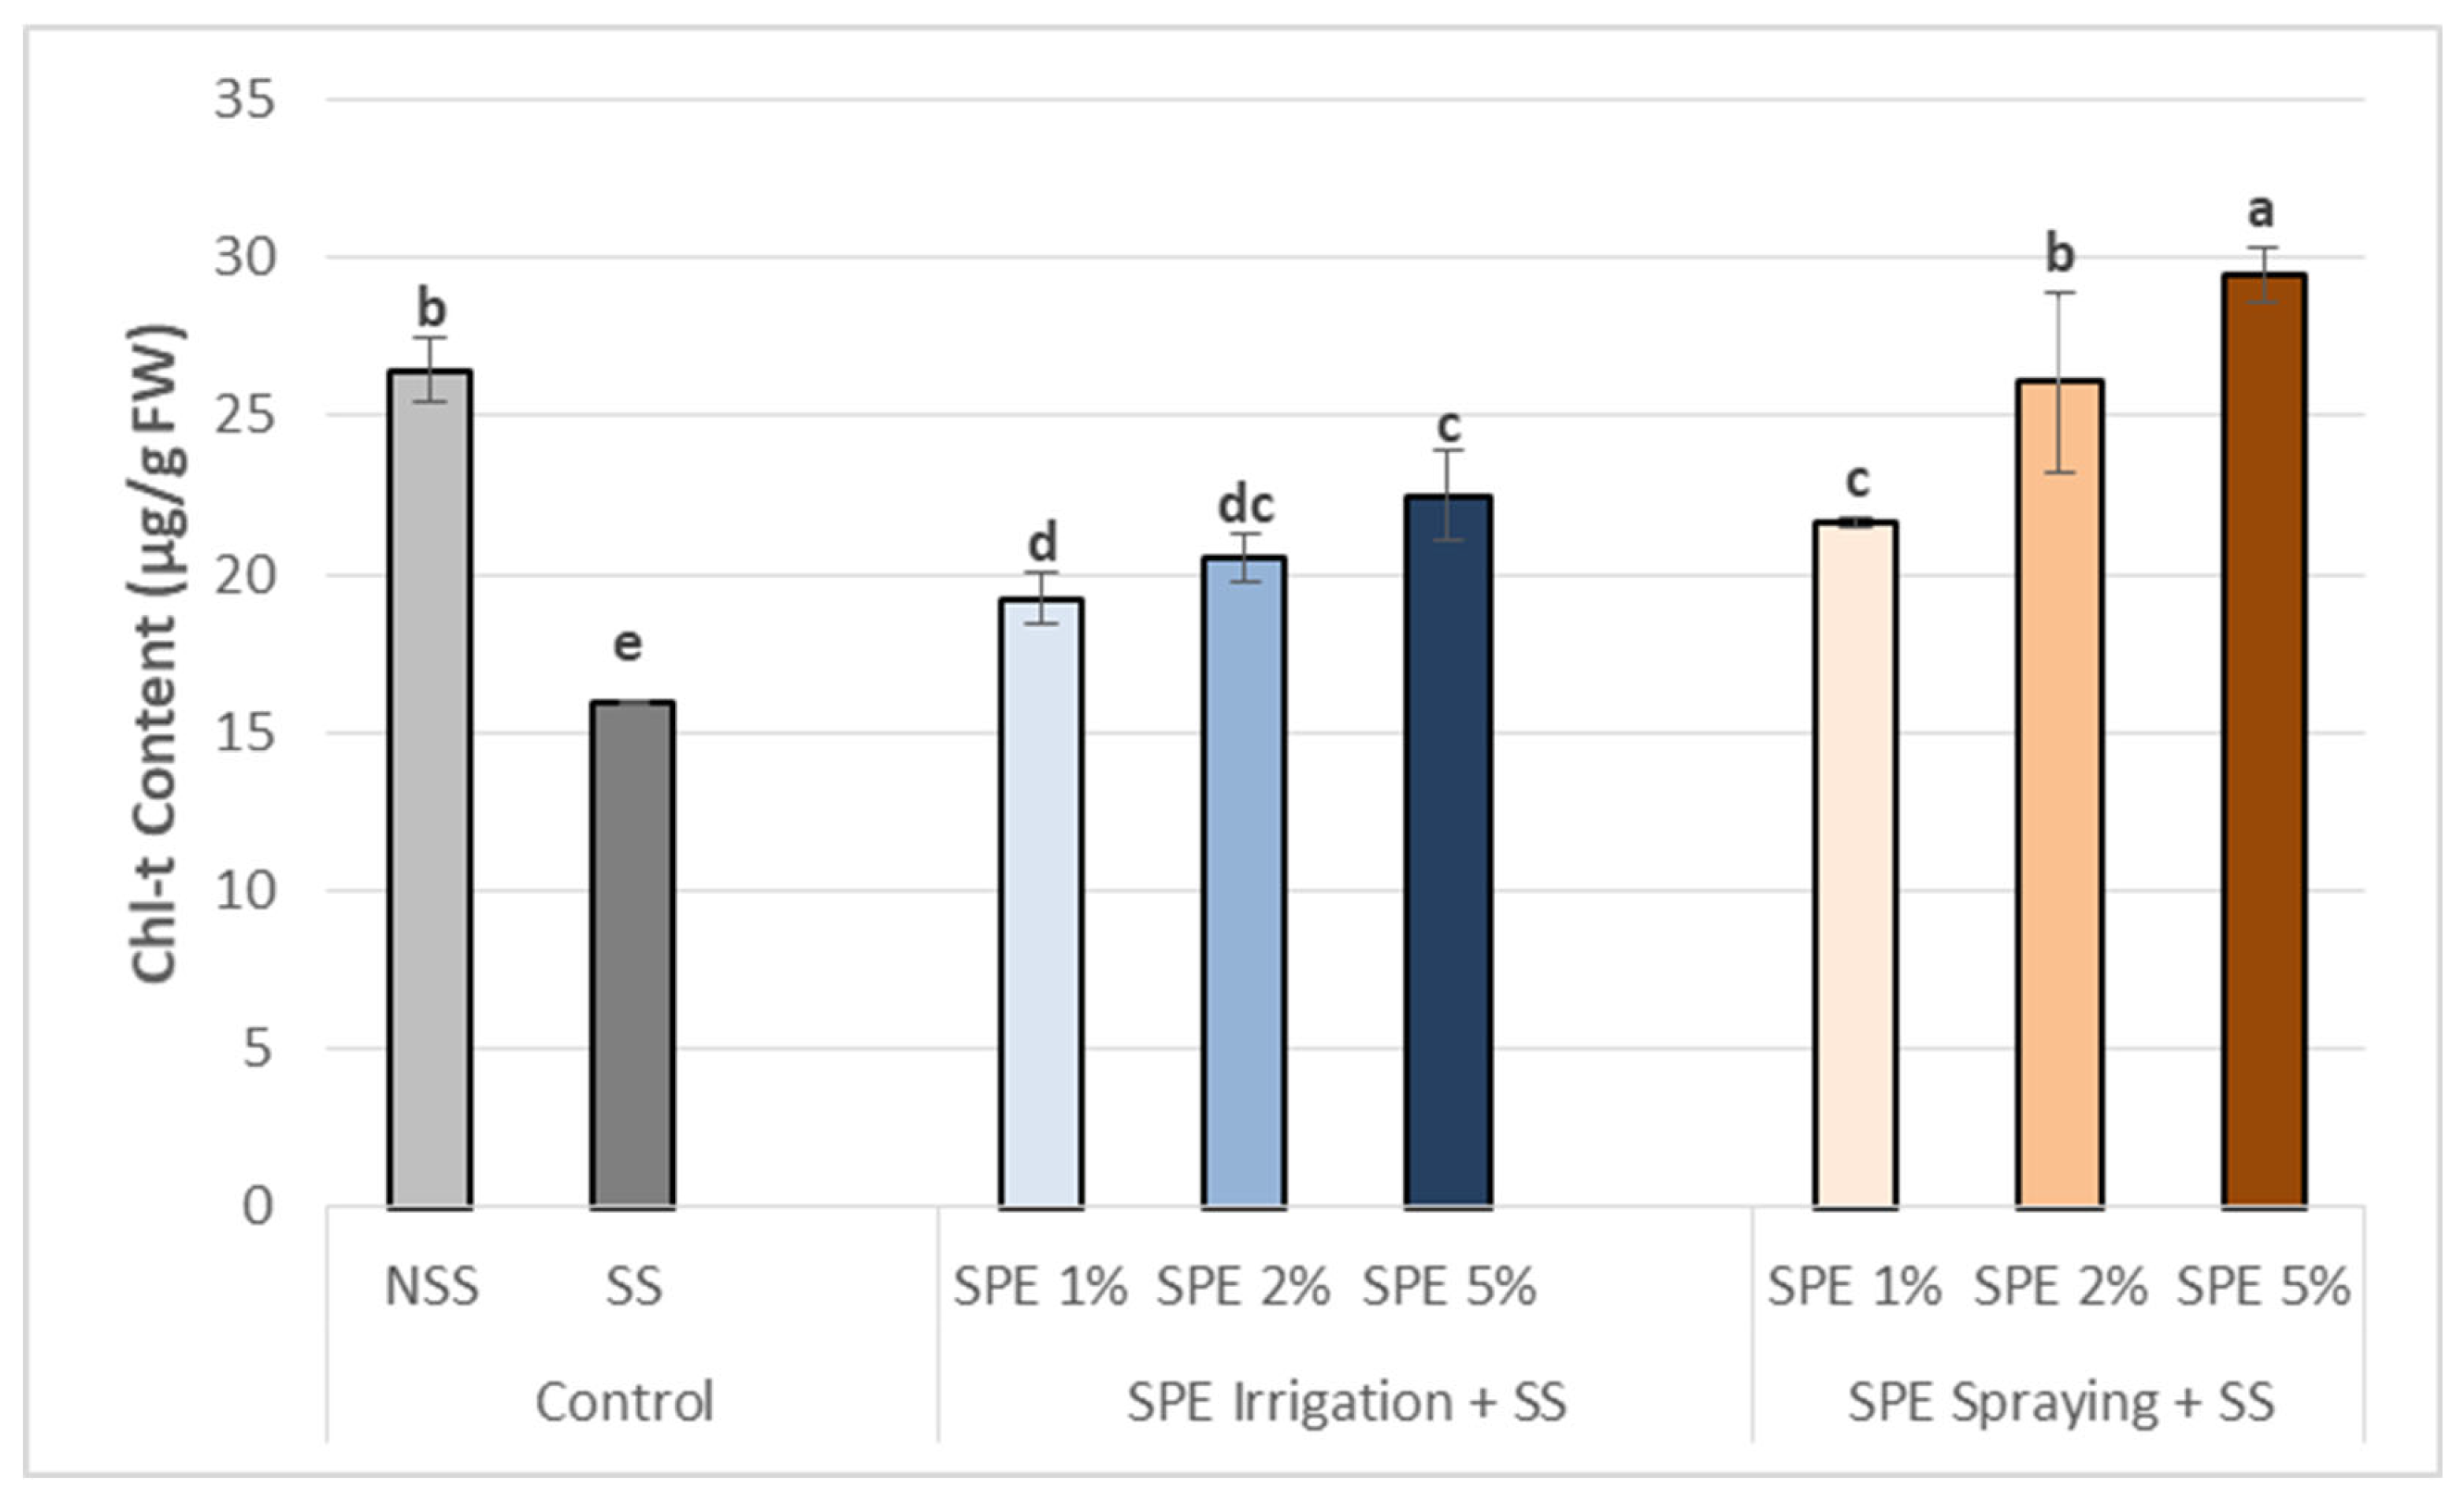
3.3.1. Chlorophyll content increase in common bean leaves after biostimulation
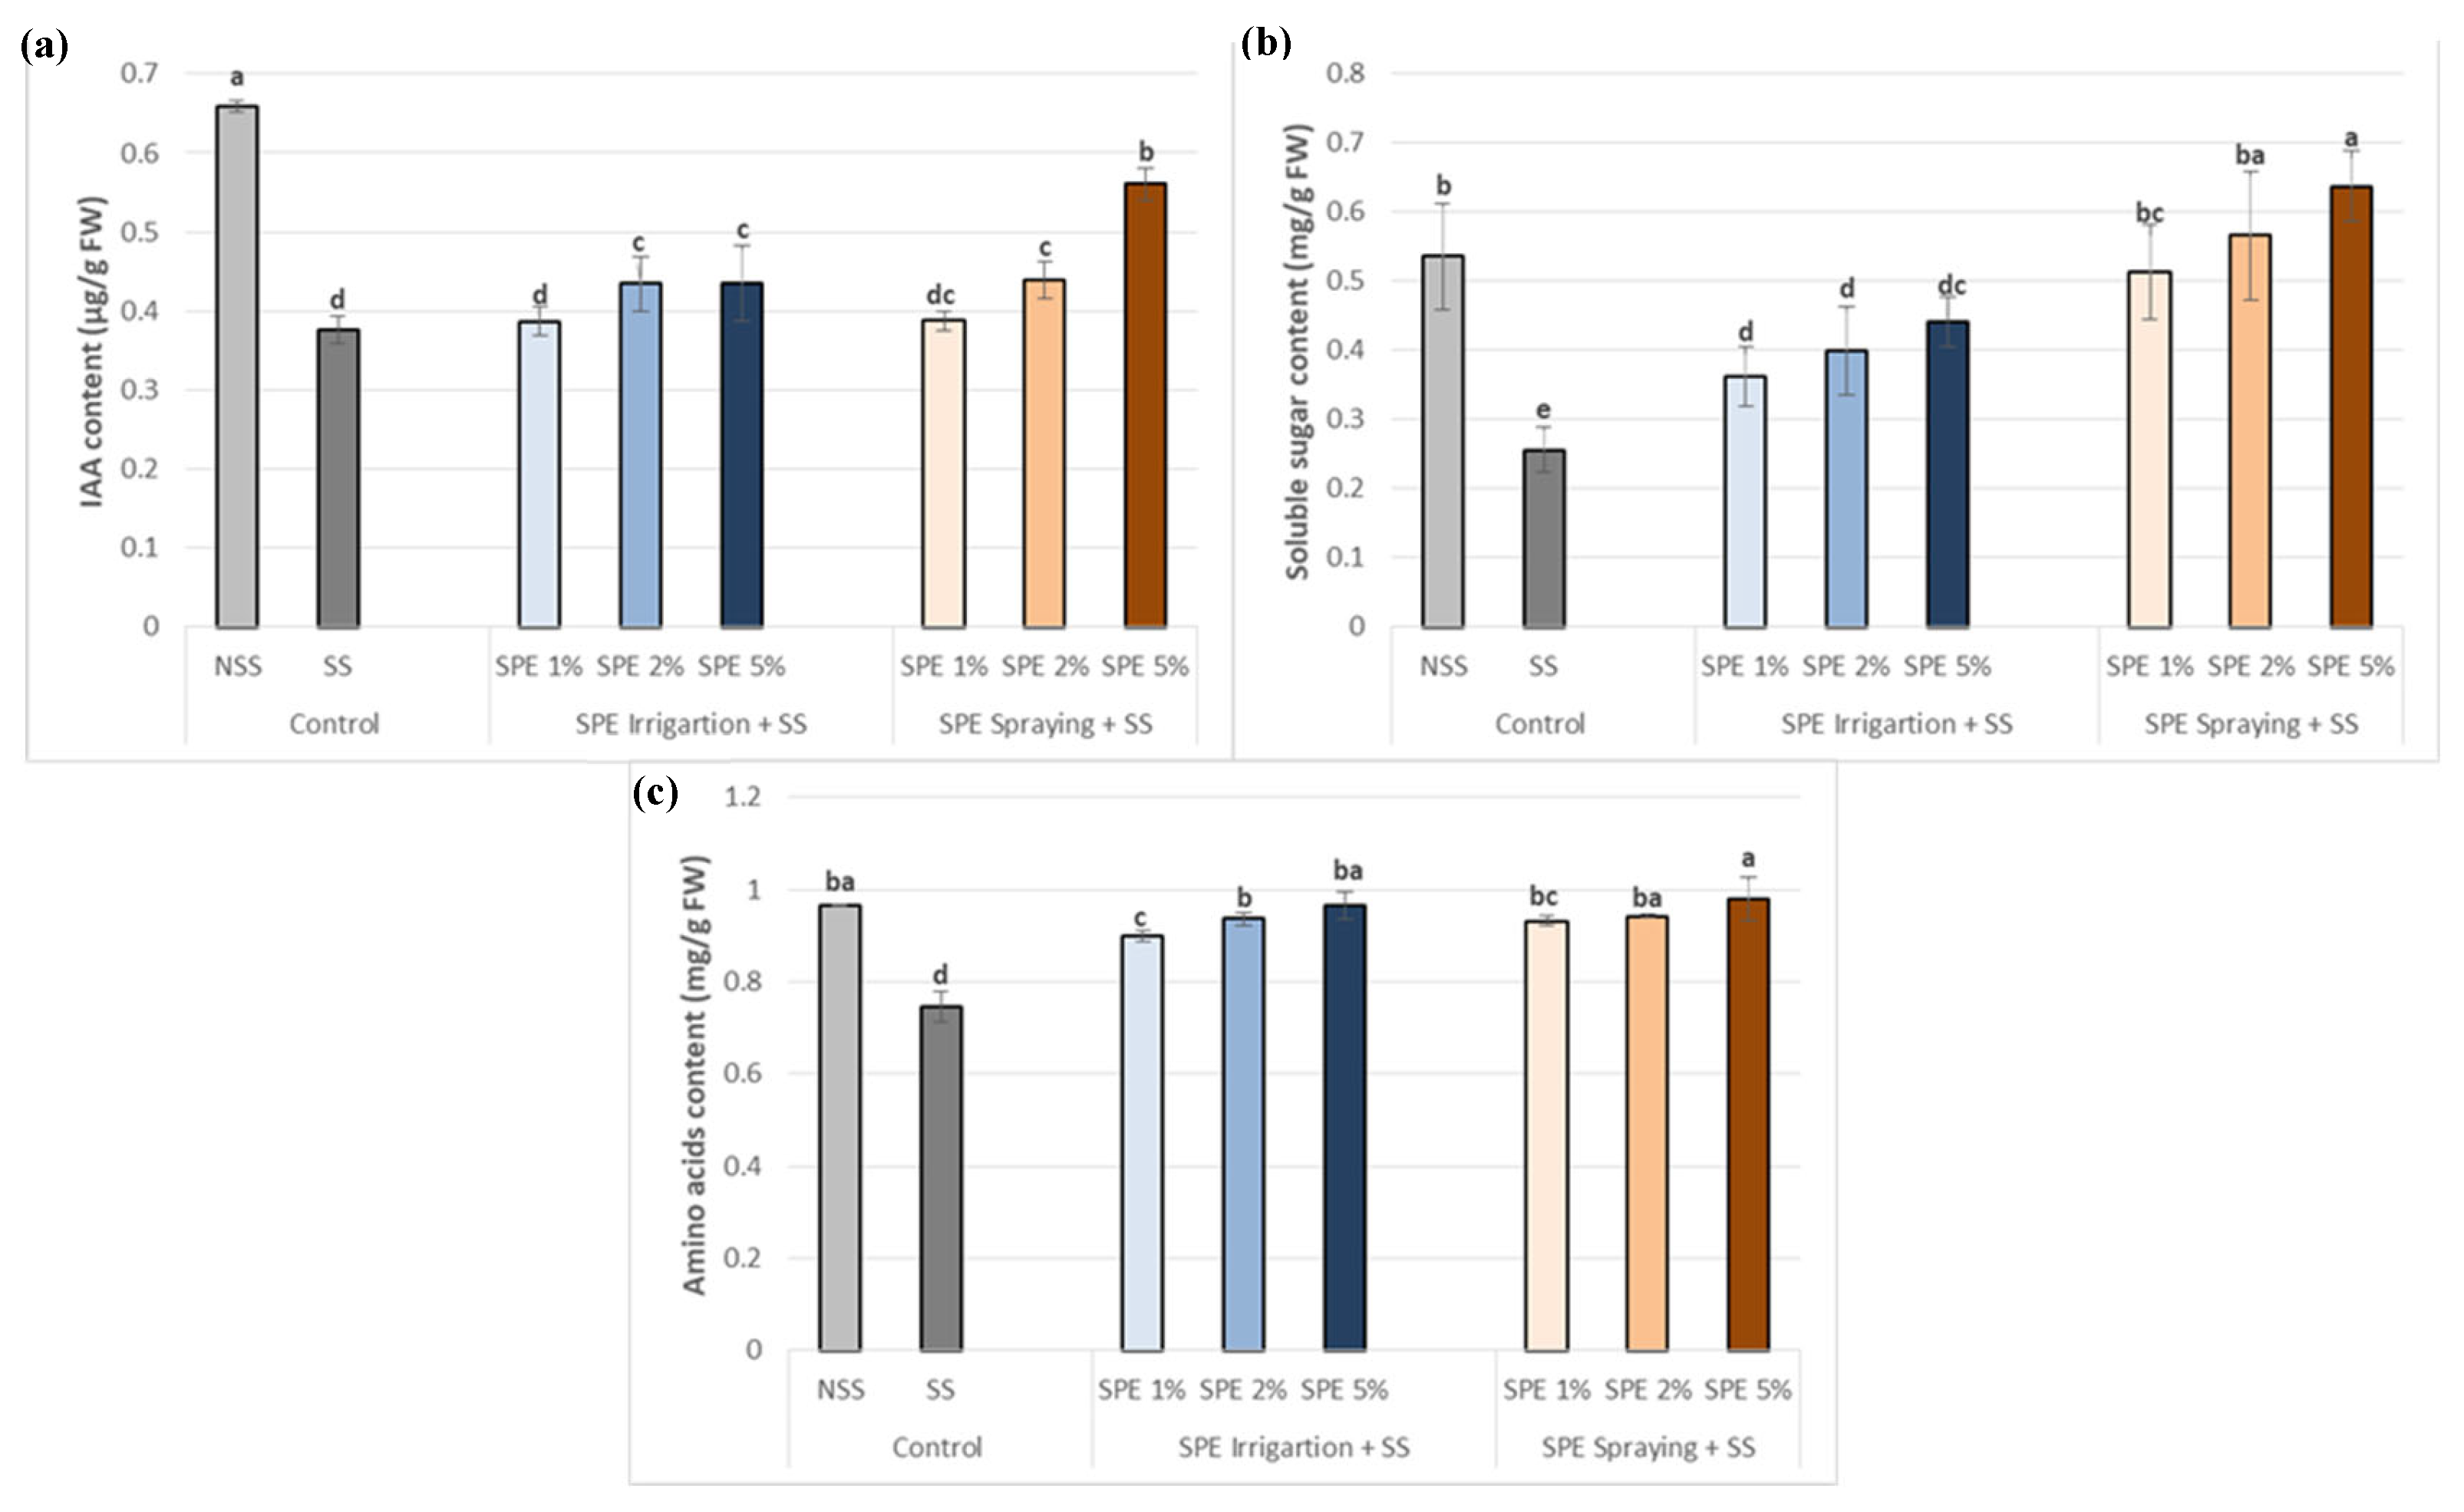
3.3.2. Indole Acetic Acid and Osmolytes content (Soluble sugars and Amino acids) increase in common bean leaves after biostimulation
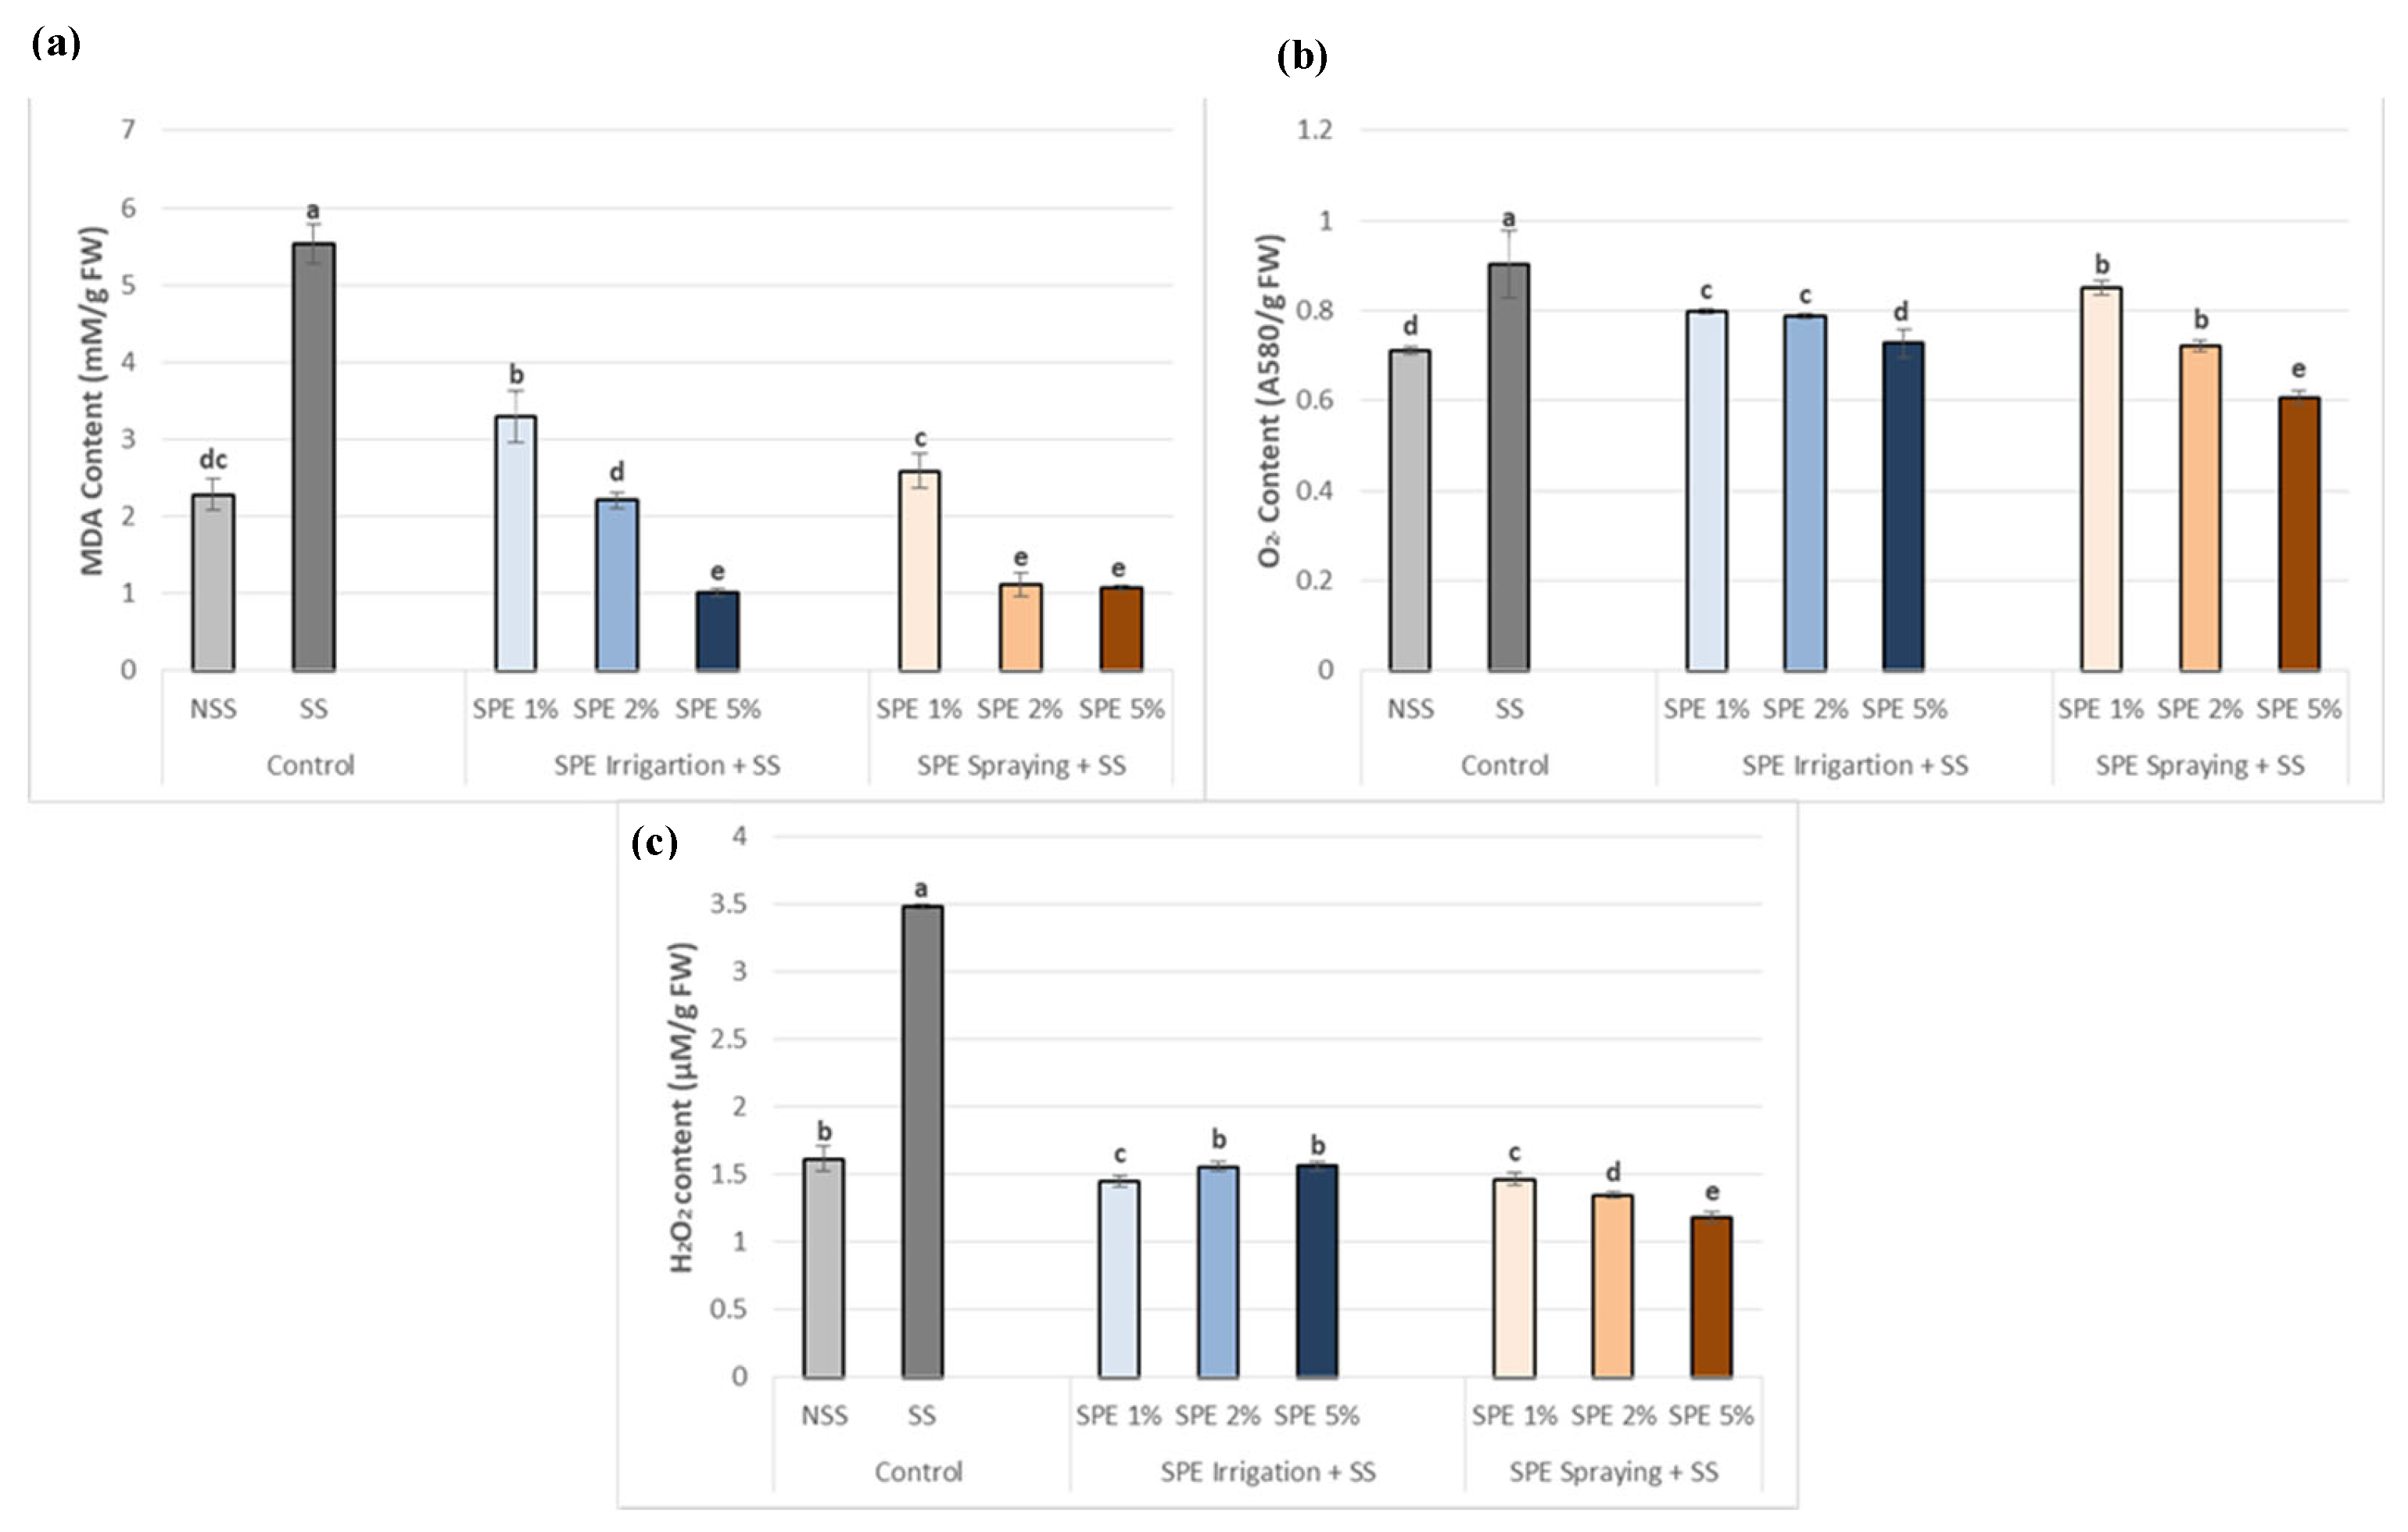
3.4. Saccorhiza polyschides Extract Limits Oxidative Stress Markers in Common Bean Plants under Salt Stress
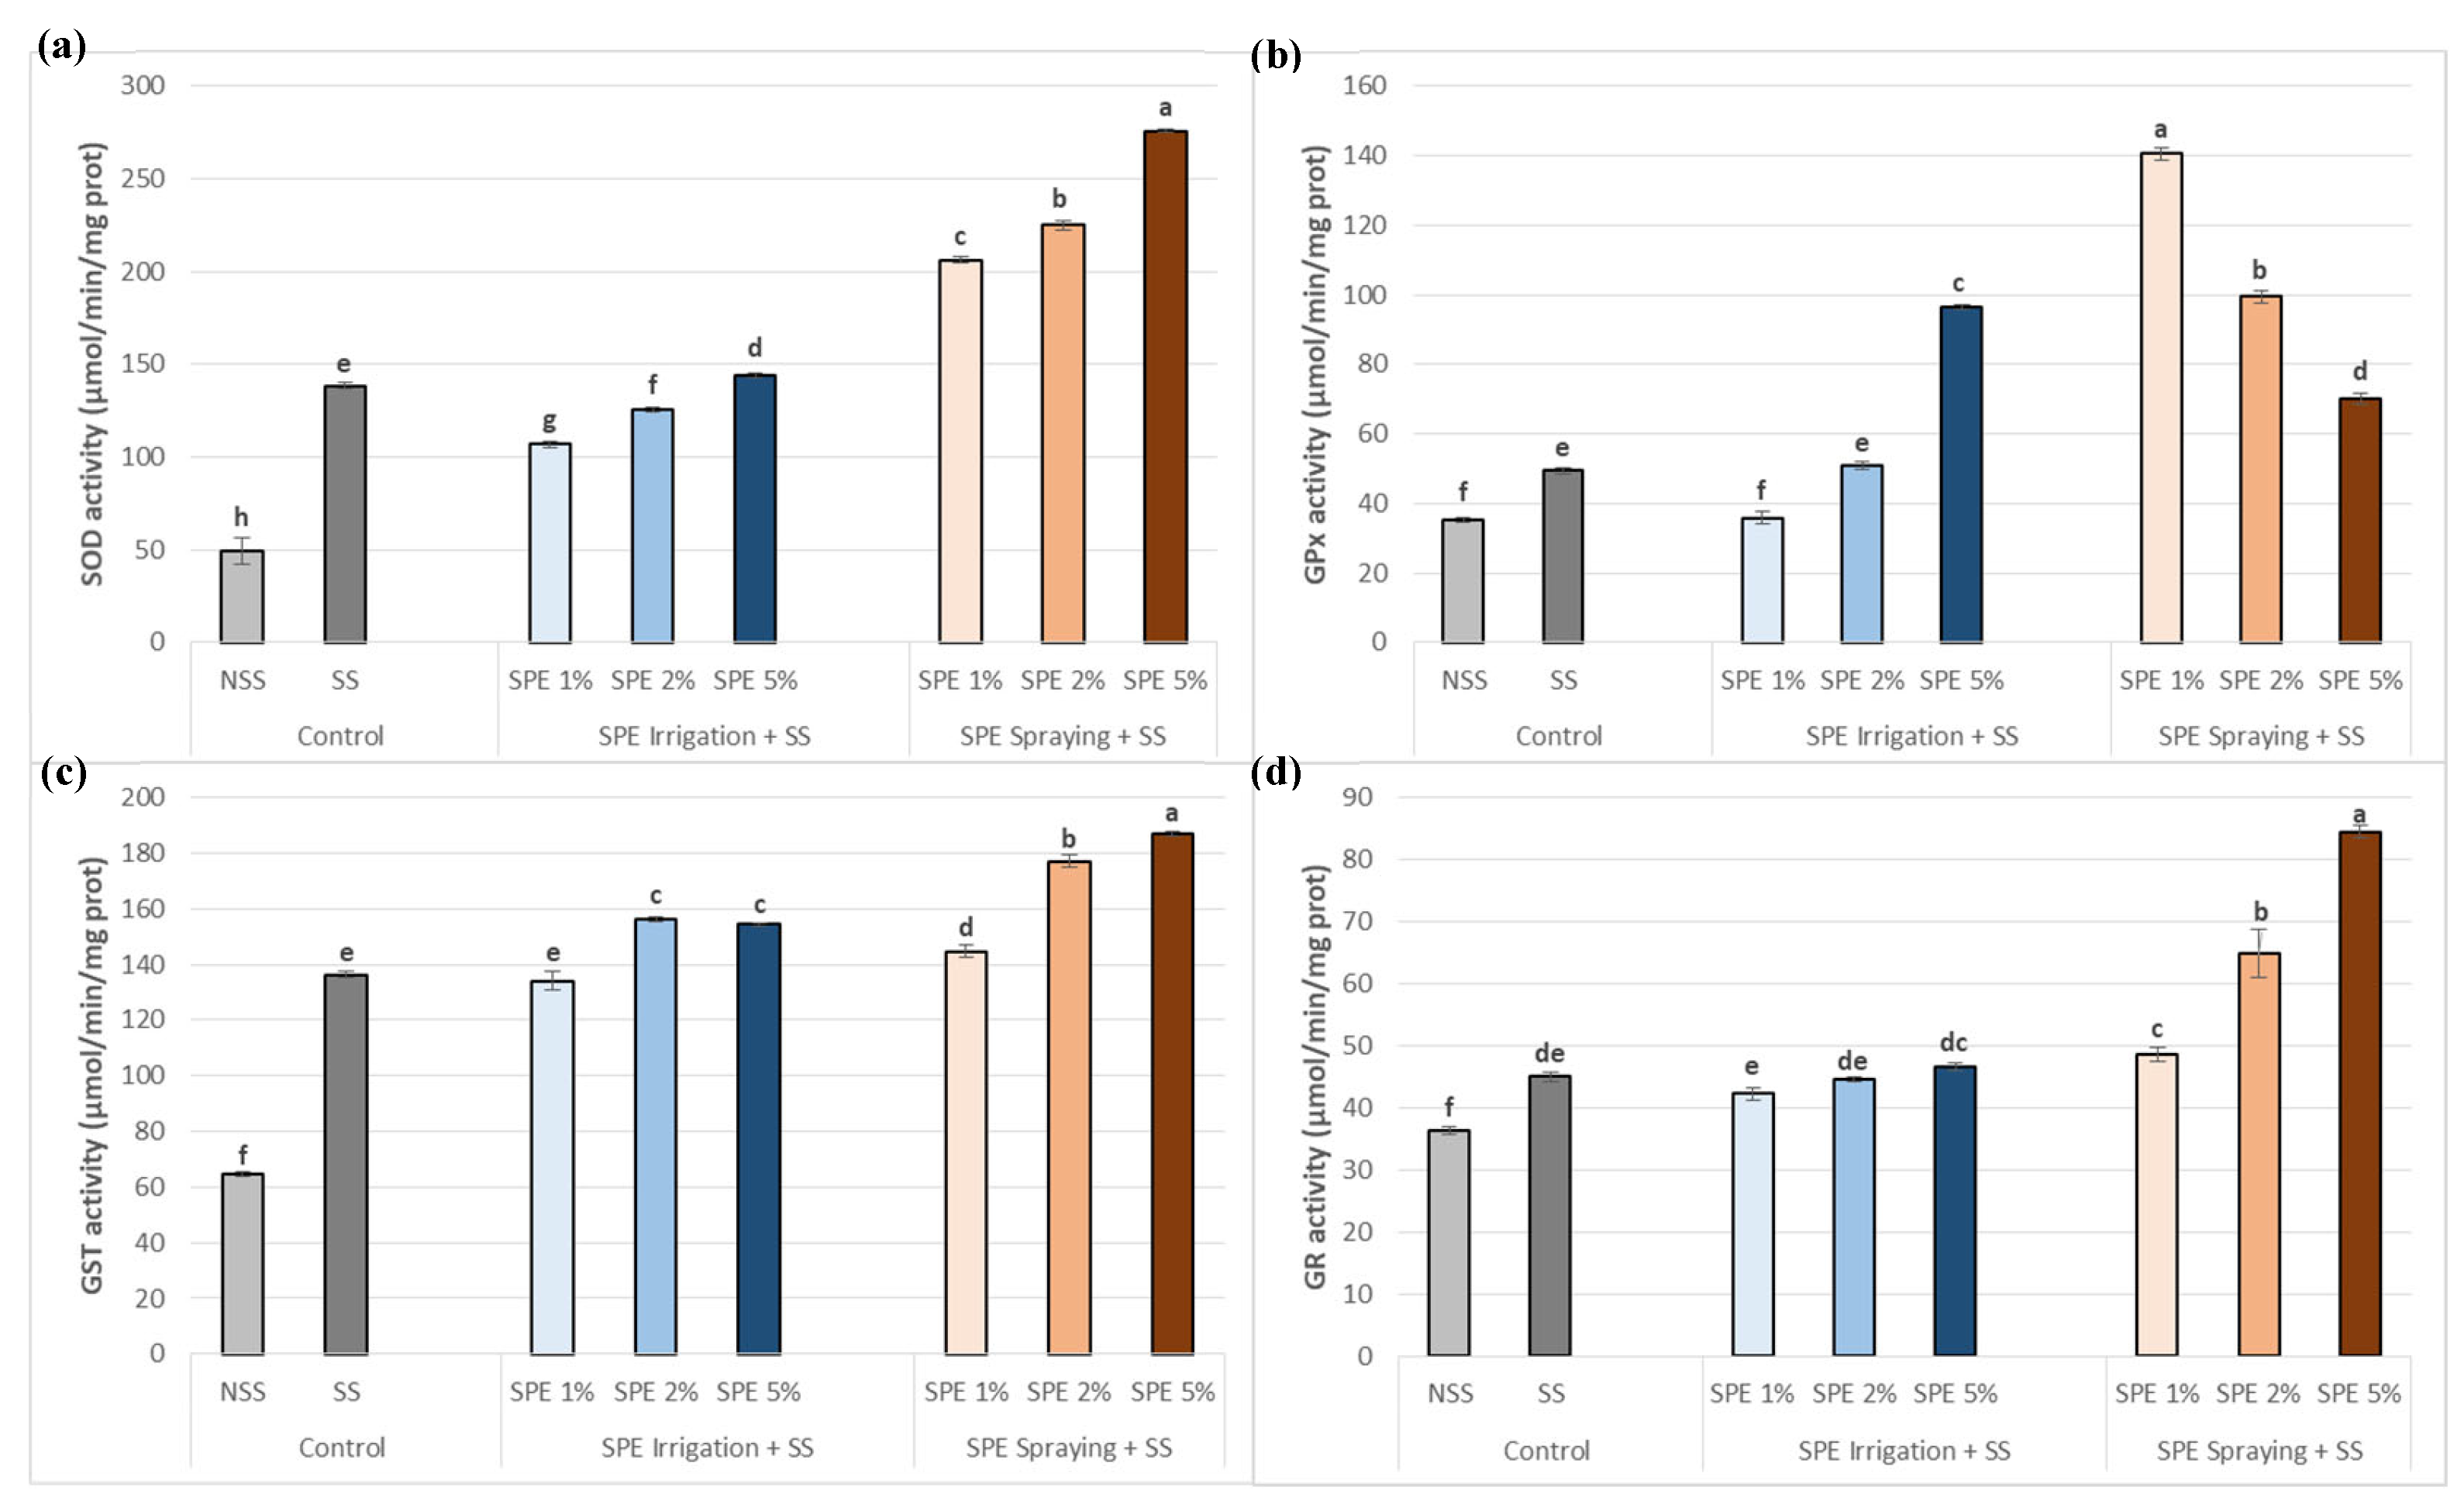
3.5. Saccorhiza polyschides Extract Boosts Antioxidant Enzymatic Activities in Common Bean Plants under Salt Stress
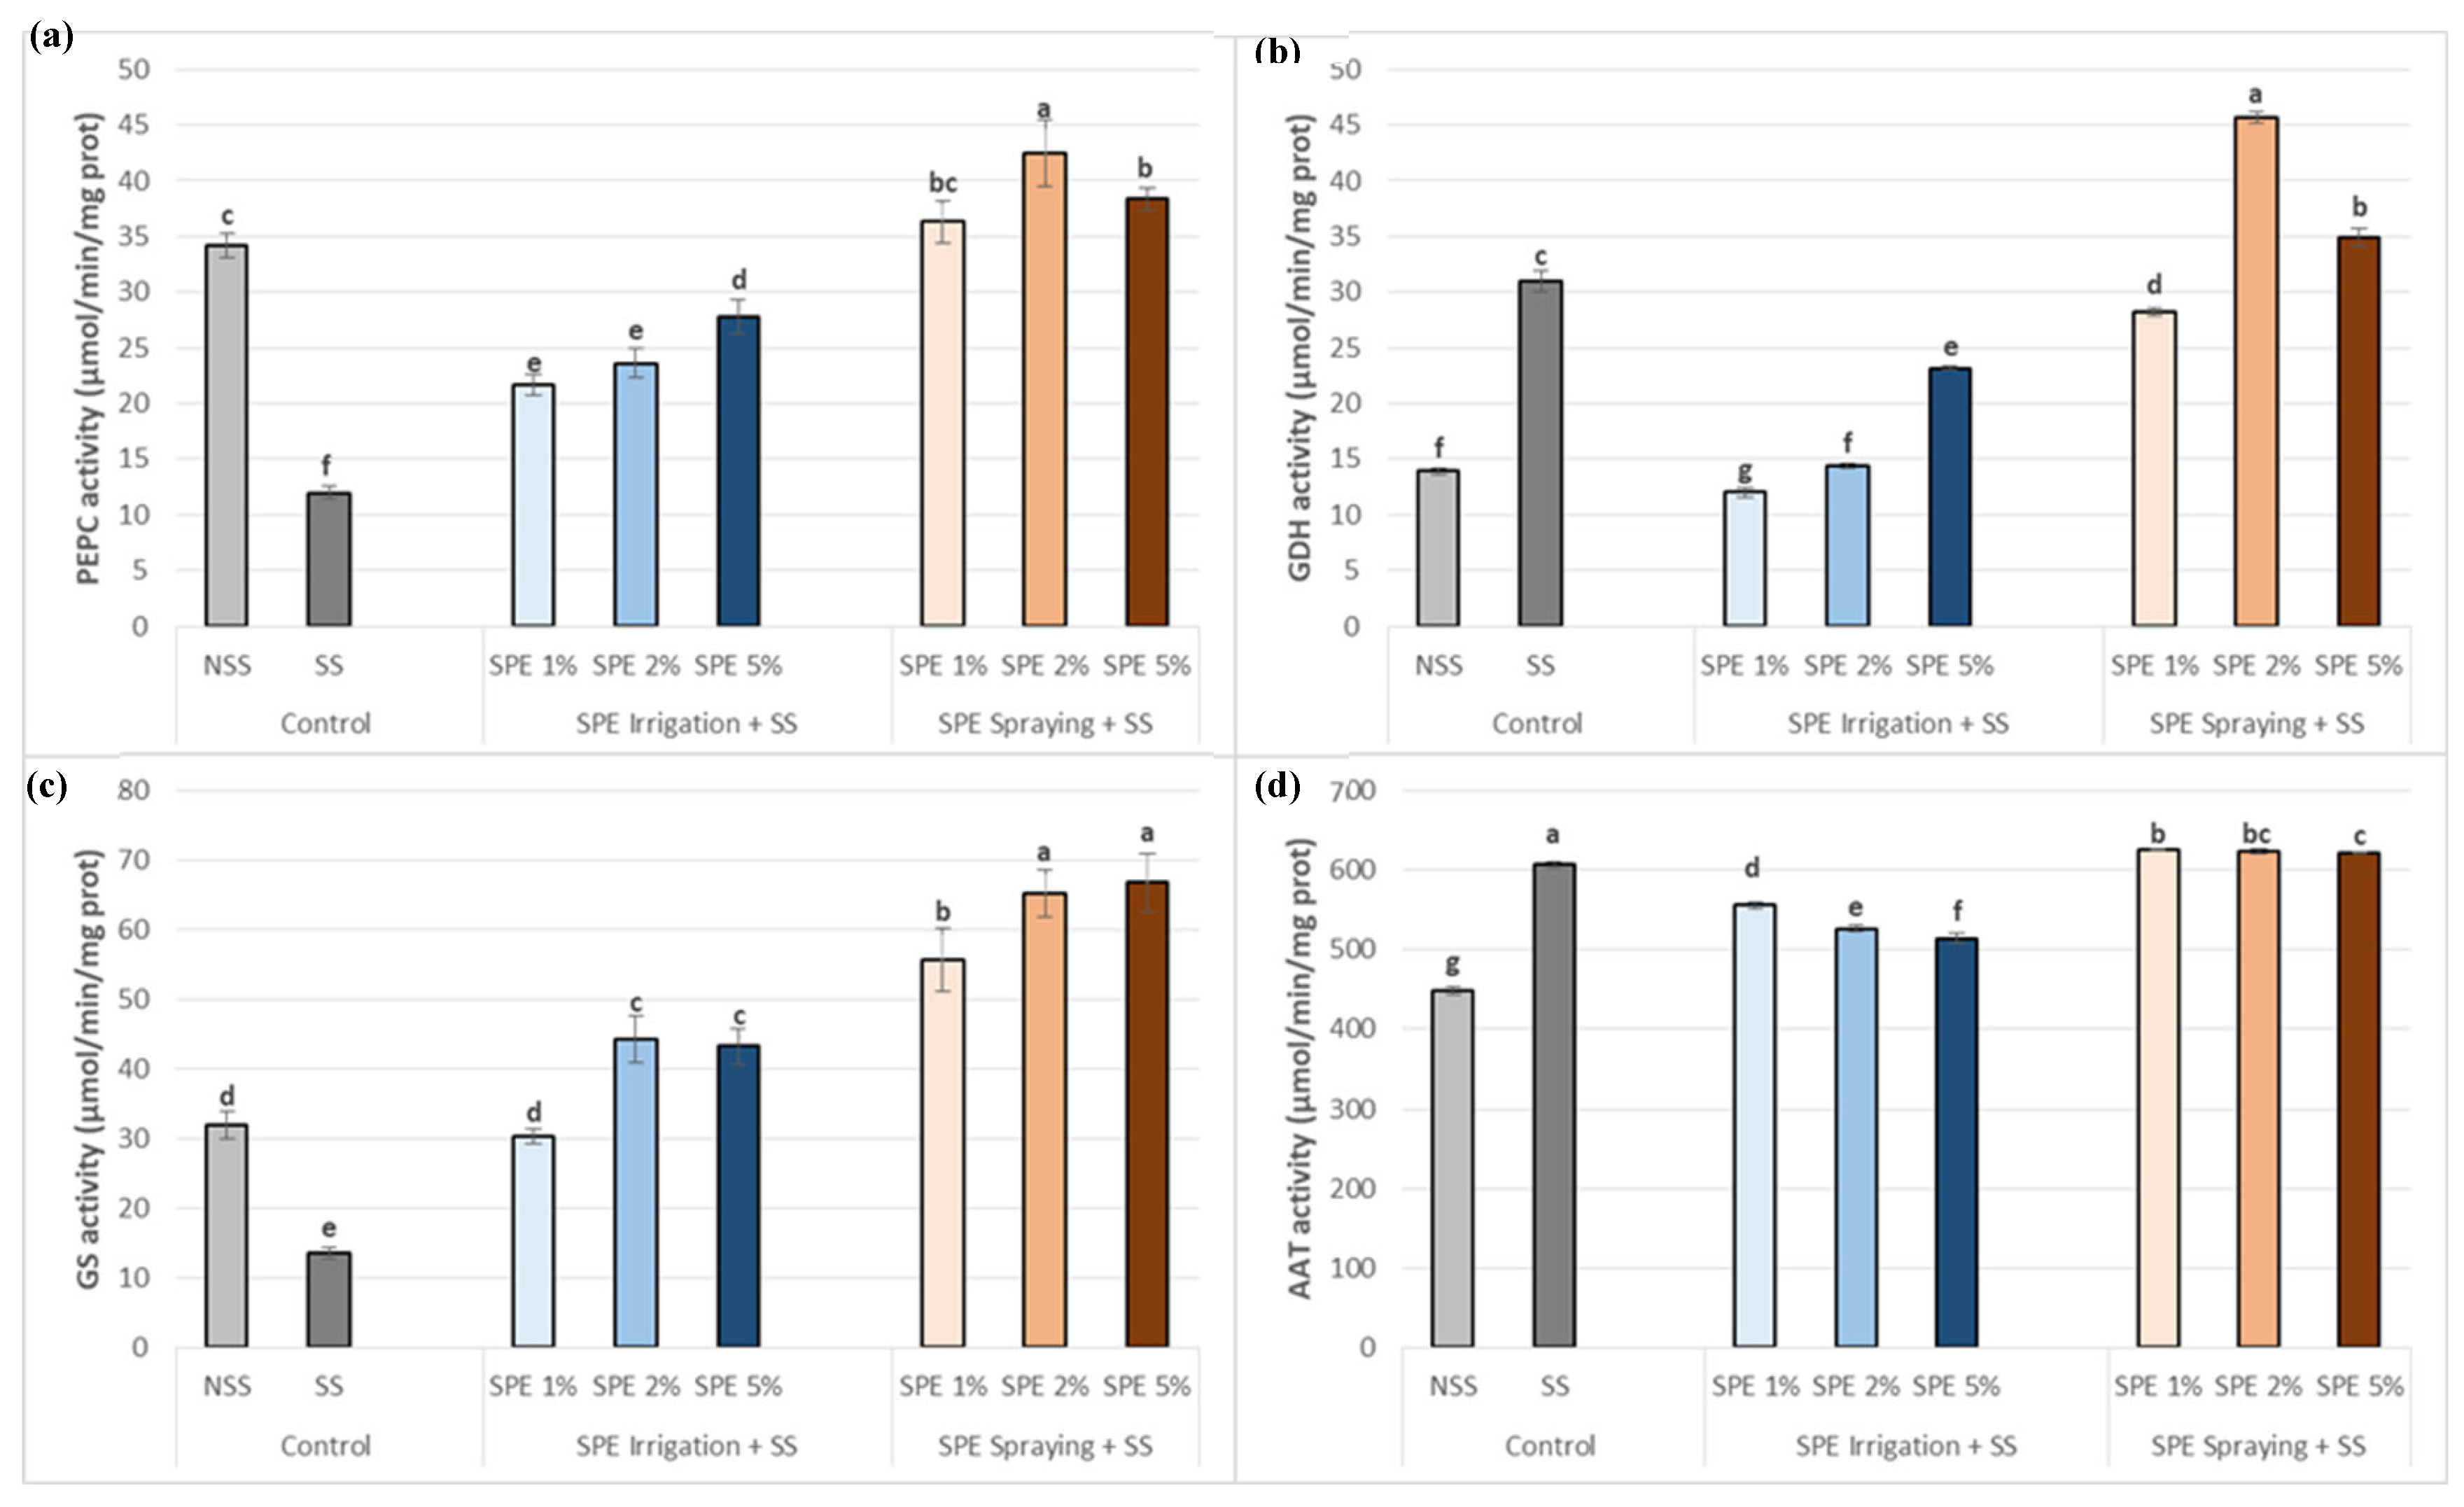
3.6. Saccorhiza polyschides Extract Boosts the Carbon-Nitrogen Enzymatic System of Common Bean Plants under Salt Stress
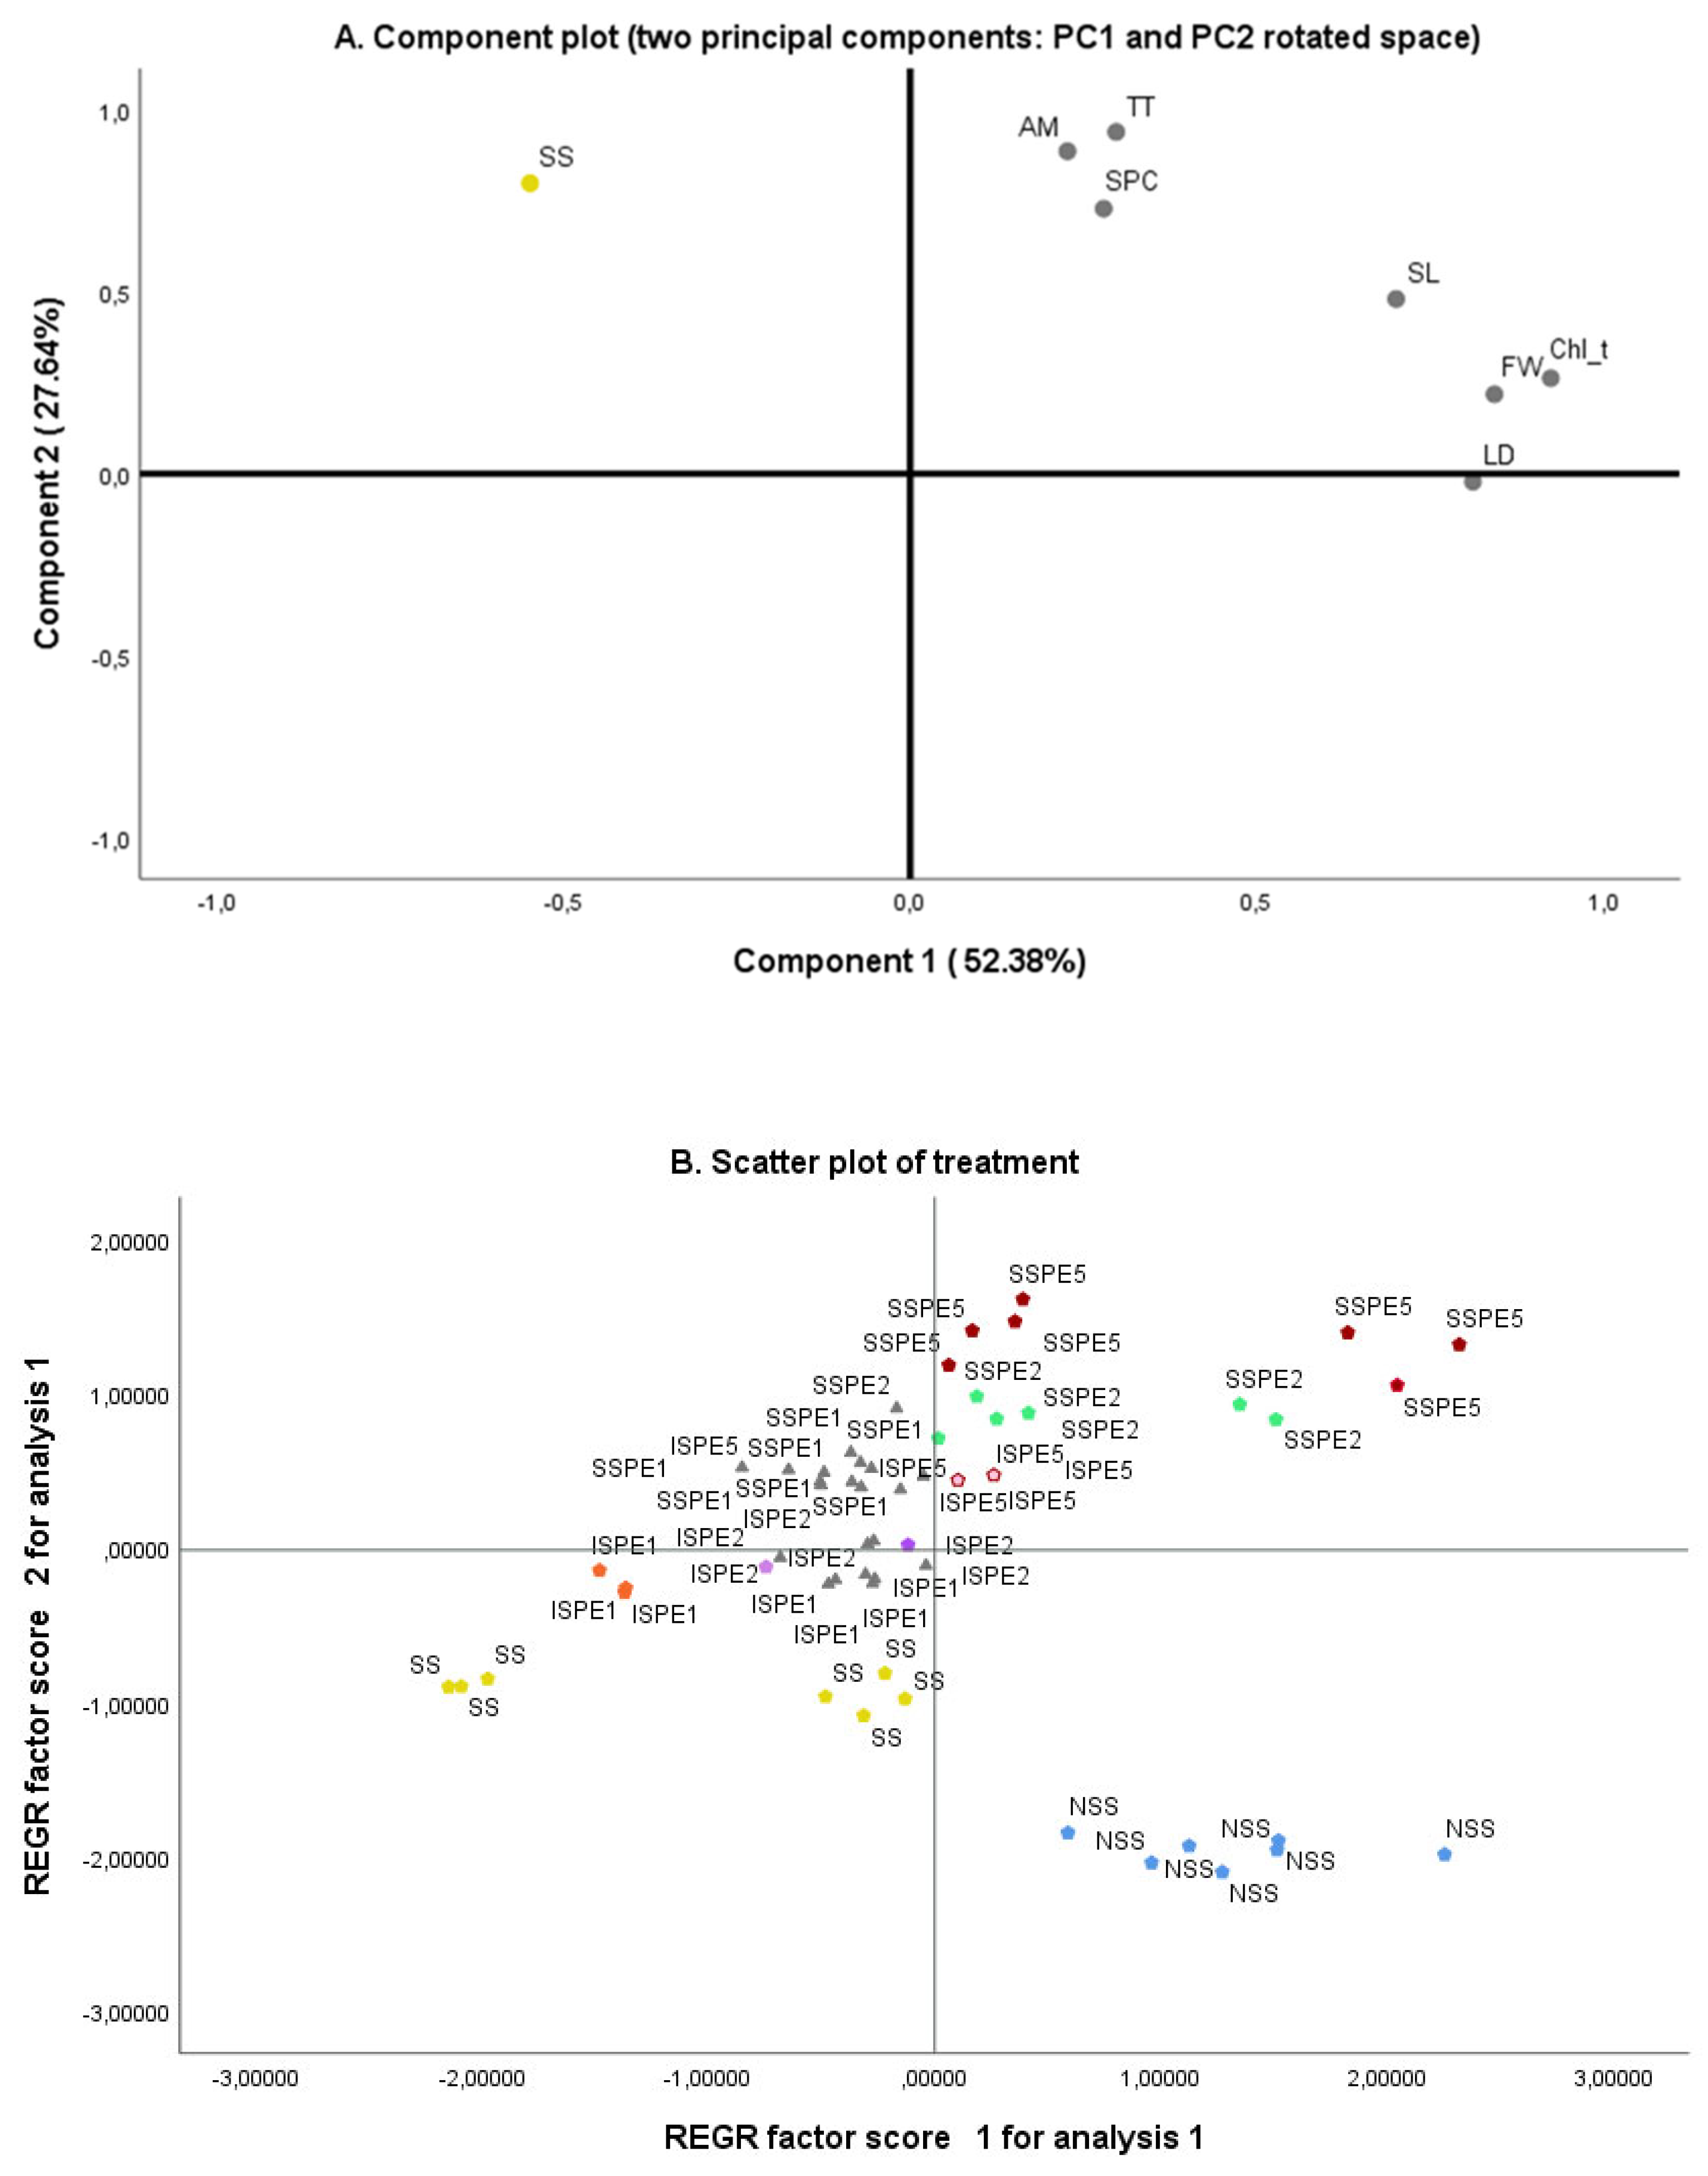
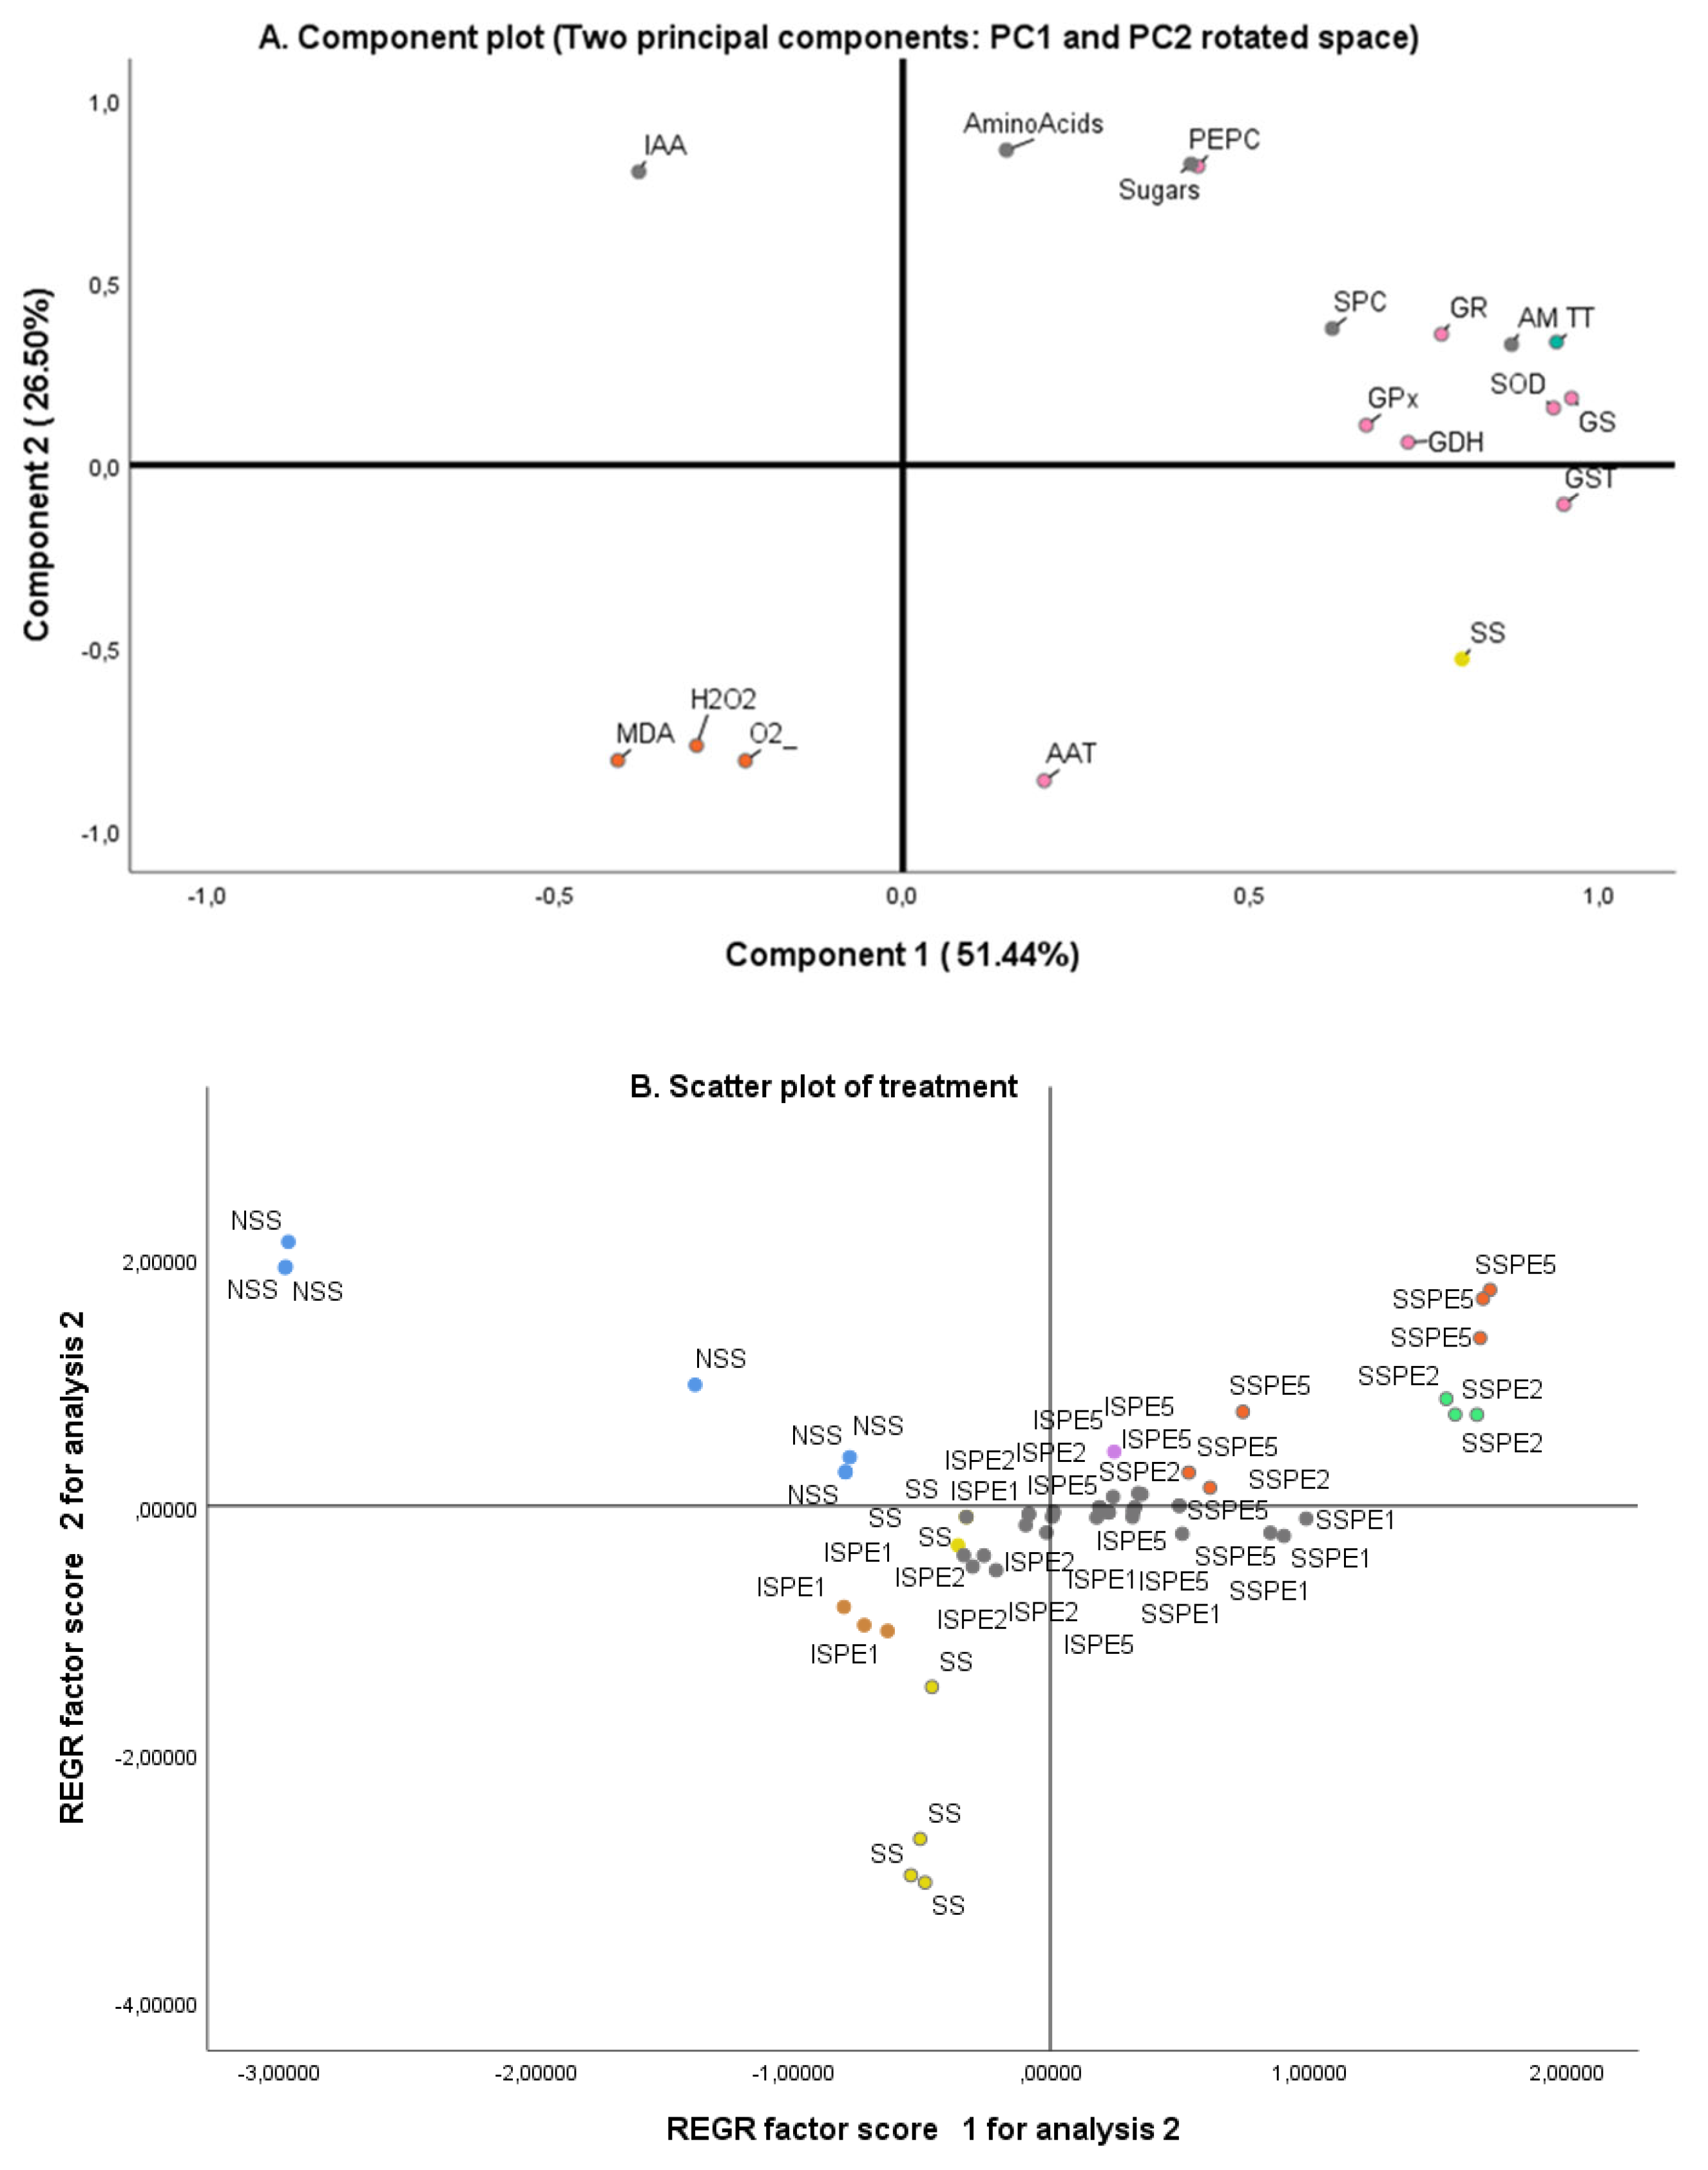
3.7. Principal Component Analysis (PCA)
4. Discussion
5. Conclusions
Author Contributions
Funding
Data Availability Statement
Acknowledgments
Conflicts of Interest
References
- Munns, R.; Tester, M. Mechanisms of Salinity Tolerance. Annu. Rev. Plant Biol. 2008, 59, 651–681. [Google Scholar] [CrossRef] [PubMed]
- Sofy, M.R.; Elhawat, N.; Tarek Alshaal Glycine Betaine Counters Salinity Stress by Maintaining High K+/Na+ Ratio and Antioxidant Defense via Limiting Na+ Uptake in Common Bean (Phaseolus Vulgaris L.). Ecotoxicol. Environ. Saf. 2020, 200. [CrossRef]
- Wekesa, C.; Asudi, G.O.; Okoth, P.; Reichelt, M.; Muoma, J.O.; Furch, A.C.U.; Oelmüller, R. Rhizobia Contribute to Salinity Tolerance in Common Beans (Phaseolus Vulgaris L.). Cells 2022, 11. [CrossRef]
- Ehtaiwesh, A.; 2022, U. The Effect of Salinity on Nutrient Availability and Uptake in Crop Plants. jas.sabu.edu.lyAF EhtaiweshScientific J. Appl. Sci. Sabratha Univ. 2022•jas.sabu.edu.ly.
- Bouzroud, S.; Henkrar, F.; Fahr, M.; Smouni, A. Salt Stress Responses and Alleviation Strategies in Legumes: A Review of the Current Knowledge. 3 Biotech 2023, 13. [Google Scholar] [CrossRef] [PubMed]
- Kronzucker, H.J.; Coskun, D.; Schulze, L.M.; Wong, J.R.; Britto, D.T. Sodium as Nutrient and Toxicant. Plant Soil 2013, 369, 1–23. [Google Scholar] [CrossRef]
- Nieves-Cordones, M.; Martínez, V.; Benito, B.; Rubio, F. Comparison between Arabidopsis and Rice for Main Pathways of K+ and Na+ Uptake by Roots. Front. Plant Sci. 2016, 7. [Google Scholar] [CrossRef] [PubMed]
- PLETT, D.C.; Plant, I.M.-; environment, cell &; 2010, Na+ Transport in Glycophytic Plants: What We Know and Would like to Know. Wiley Online Libr. CRAIG PLETT, IS MøllerPlant, cell Environ. 2010•Wiley Online Libr. 2009, 33, 612–626. [CrossRef]
- Cabot, C.; Sibole, J. V.; Barceló, J.; Poschenrieder, C. Lessons from Crop Plants Struggling with Salinity. Plant Sci. 2014, 226, 2–13. [Google Scholar] [CrossRef] [PubMed]
- Parida, A.K.; Das, A.B. Salt Tolerance and Salinity Effects on Plants: A Review. Ecotoxicol. Environ. Saf. 2005, 60, 324–349. [Google Scholar] [CrossRef] [PubMed]
- Höhn, A.; Jung, T.; Grune, T. Pathophysiological Importance of Aggregated Damaged Proteins. Free Radic. Biol. Med. 2014, 71, 70–89. [Google Scholar] [CrossRef] [PubMed]
- Fu, H.; Yang, Y. How Plants Tolerate Salt Stress. Curr. Issues Mol. Biol. 2023, 45, 5914–5934. [Google Scholar] [CrossRef] [PubMed]
- Ahmad, M.S.A.; Ashraf, M.; Ali, Q. Soil Salinity as a Selection Pressure Is a Key Determinant for the Evolution of Salt Tolerance in Blue Panicgrass (Panicum Antidotale Retz.). Flora Morphol. Distrib. Funct. Ecol. Plants 2010, 205, 37–45. [Google Scholar] [CrossRef]
- Jatav, K.S.; Agarwal, R.M.; Tomar, N.S.; Tyagi, S.R. Nitrogen Metabolism, Growth and Yield Responses of Wheat (Triticum Aestivum L.) to Restricted Water Supply and Varying Potassium Treatments. J Indian Bot Soc 2014, 93, 177–189. [Google Scholar]
- Francesca, S.; Arena, C.; Mele, B.H.; Schettini, C.; Ambrosino, P.; Barone, A.; Rigano, M.M. The Use of a Plant-Based Biostimulant Improves Plant Performances and Fruit Quality in Tomato Plants Grown at Elevated Temperatures. mdpi.comS Fr. C Arena, B Hay Mele, C Schettini, P Ambrosino, A Barone, MM RiganoAgronomy, 2020•mdpi.com 2020, 10. [CrossRef]
- Soares, C.; Švarc-Gajić, J.; Oliva-Teles, M.T.; Pinto, E.; Nastić, N.; Savić, S.; Almeida, A.; Delerue-Matos, C. Mineral Composition of Subcritical Water Extracts of Saccorhiza Polyschides, a Brown Seaweed Used as Fertilizer in the North of Portugal. J. Mar. Sci. Eng. 2020, 8, 244. [Google Scholar] [CrossRef]
- Cardoso, C.; Almeida, J.; Coelho, I.; Delgado, I.; Gomes, R.; Quintã, R.; Bandarra, N.M.; Afonso, C. Farming a Wild Seaweed and Changes to Its Composition, Bioactivity, and Bioaccessibility: The Saccorhiza Polyschides Case Study. Aquaculture 2023, 566, 739217. [Google Scholar] [CrossRef]
- Senousy, H.H.; Hamoud, Y.A.; Abu-Elsaoud, A.M.; Mahmoud Al zoubi, O.; Abdelbaky, N.F.; Zia-ur-Rehman, M.; Usman, M.; Soliman, M.H. Algal Bio-Stimulants Enhance Salt Tolerance in Common Bean: Dissecting Morphological, Physiological, and Genetic Mechanisms for Stress Adaptation. Plants 2023, 12, 3714. [Google Scholar] [CrossRef] [PubMed]
- Mamede, M.; Cotas, J.; Pereira, L.; Bahcevandziev, K. Seaweed Polysaccharides as Potential Biostimulants in Turnip Greens Production. Hortic. 2024, 10, 130. [Google Scholar] [CrossRef]
- Bouchmaa, N.; Mrid, R. Ben; Kabach, I.; Zouaoui, Z.; Karrouchi, K.; Chtibi, H.; Zyad, A.; Cacciola, F.; Nhiri, M. Beta Vulgaris Subsp. Maritima: A Valuable Food with High Added Health Benefits. Appl. Sci. 2022, 12, 1866. [Google Scholar] [CrossRef]
- Bouchmaa, N.; Ben Mrid, R.; Boukharsa, Y.; Nhiri, M.; Ait Mouse, H.; Taoufik, J.; Ansar, M.; Zyad, A. Cytotoxicity of New Pyridazin-3(2H)-One Derivatives Orchestrating Oxidative Stress in Human Triple-Negative Breast Cancer (MDA-MB-468). Arch. Pharm. (Weinheim). 2018, 351, 1800128. [Google Scholar] [CrossRef] [PubMed]
- Kubiś, J. Exogenous Spermidine Differentially Alters Activities of Some Scavenging System Enzymes, H2O2 and Superoxide Radical Levels in Water-Stressed Cucumber Leaves. J. Plant Physiol. 2008, 165, 397–406. [Google Scholar] [CrossRef] [PubMed]
- Mrid, R. Ben; Bouchmaa, N.; Bouargalne, Y.; Ramdan, B.; Karrouchi, K.; Kabach, I.; Karbane, M. El; Idir, A.; Zyad, A.; Nhiri, M. Phytochemical Characterization, Antioxidant and In Vitro Cytotoxic Activity Evaluation of Juniperus Oxycedrus Subsp. Oxycedrus Needles and Berries. Molecules 2019, 24, 502. [Google Scholar] [CrossRef]
- Arnon, D.I. Copper Enzymes in Isolated Chloroplasts. Polyphenoloxidase in Beta vulgaris. Plant Physiol. 1949, 24, 1–15. [Google Scholar] [CrossRef]
- Ennoury, A.; BenMrid, R.; Nhhala, N.; Roussi, Z.; Latique, S.; Zouaoui, Z.; Nhiri, M. River’s Ulva Intestinalis Extract Protects Common Bean Plants (Phaseolus Vulgaris L.) against Salt Stress. South African J. Bot. 2022, 150, 334–341. [Google Scholar] [CrossRef]
- Sun, S.W.; Lin, Y.C.; Weng, Y.M.; Chen, M.J. Efficiency Improvements on Ninhydrin Method for Amino Acid Quantification. J. Food Compos. Anal. 2006, 19, 112–117. [Google Scholar] [CrossRef]
- YEMM, E.W.; WILLIS, A.J. The Estimation of Carbohydrates in Plant Extracts by Anthrone. Biochem. J. 1954, 57, 508–514. [Google Scholar] [CrossRef] [PubMed]
- Beauchamp, C.; Fridovich, I. Superoxide Dismutase: Improved Assays and an Assay Applicable to Acrylamide Gels. Anal. Biochem. 1971, 44, 276–287. [Google Scholar] [CrossRef] [PubMed]
- Latique, S.; Mrid, R. Ben; Kabach, I.; Kchikich, A.; Sammama, H.; Yasri, A.; Nhiri, M.; El Kaoua, M.; Douira, A.; Selmaoui, K. Foliar Application of Ulva Rigida Water Extracts Improves Salinity Tolerance in Wheat (Triticum Durum L.). Agronomy 2021, 11, 265. [Google Scholar] [CrossRef]
- El Omari, R.; Ben Mrid, R.; Amakran, A.; Nhiri, M. Effect of Fungicide (Maneb) on Antioxydant System and Carbon Assimilation in Leaves of Sorghum Plants. Russ. J. Plant Physiol. 2018, 65, 237–243. [Google Scholar] [CrossRef]
- Kchikich, A.; El Omari, R.; Kabach, I.; Yasri, A.; Nhiri, M.; Ben Mrid, R. Effect of Arbuscular Mycorrhizal Fungus and the γ-Aminobutyric Acid Treatment in Nitrate Assimilation under Nitrogen Deficiency in Sorghum Plant. Russ. J. Plant Physiol. 2021, 68, 901–908. [Google Scholar] [CrossRef]
- Ben MRid, R.; El Omari, R.; BOuaRgalne, Y.; El Mourabit, N.; Nhiri, M. Activities of Carbon and Nitrogen Metabolism Enzymes during Germinating Sorghum Seeds and Early Seedlings Growth. Cereal Res. Commun. 2017, 45, 587–597. [Google Scholar] [CrossRef]
- Bradford, M.M. A Rapid and Sensitive Method for the Quantitation of Microgram Quantities of Protein Utilizing the Principle of Protein-Dye Binding. Anal. Biochem. 1976, 72, 248–254. [Google Scholar] [CrossRef] [PubMed]
- Carillo, P.; Ciarmiello, L.F.; Woodrow, P.; Corrado, G.; Chiaiese, P.; Rouphael, Y. Enhancing Sustainability by Improving Plant Salt Tolerance through Macro-and Micro-Algal Biostimulants. Biology (Basel). 2020, 9, 1–21. [Google Scholar] [CrossRef]
- Ashraf, M.; Harris, P.J.C. Potential Biochemical Indicators of Salinity Tolerance in Plants. Plant Sci. 2004, 166, 3–16. [Google Scholar] [CrossRef]
- Carillo, P.; Ciarmiello, L.F.; Woodrow, P.; Corrado, G.; Chiaiese, P.; Rouphael, Y. Enhancing Sustainability by Improving Plant Salt Tolerance through Macro-and Micro-Algal Biostimulants. Biology (Basel). 2020, 9, 1–21. [Google Scholar] [CrossRef] [PubMed]
- Rouphael, Y.; Colla, G. Editorial: Biostimulants in Agriculture. Front. Plant Sci. 2020, 11. [Google Scholar] [CrossRef] [PubMed]
- Stasio, E. Di; James, M.; Oosten, V.; Silletti, S.; Raimondi, G.; Dell’aversana, E.; Carillo, P.; Maggio, A. Ascophyllum Nodosum-Based Algal Extracts Act as Enhancers of Growth, Fruit Quality, and Adaptation to Stress in Salinized Tomato Plants. SpringerE Di Stasio, MJ Van Oosten, S Silletti, G Raimondi, E Dell’Aversana, P Carillo, A MaggioJournal Appl. Phycol. 2018•Springer 2018, 30, 2675–2686. [CrossRef]
- Jithesh, M.N.; Pushp, ·; Shukla, S.; Kant, · P; Joshi, J.; Critchley, A.T.; Prithiviraj, · B Physiological and Transcriptomics Analyses Reveal That Ascophyllum Nodosum Extracts Induce Salinity Tolerance in Arabidopsis by Regulating the Expression Of. SpringerMN Jithesh, PS Shukla, P Kant, J Joshi, Critchley, B PrithivirajJournal plant growth Regul. 2019•Springer 2019, 38, 463–478. [CrossRef]
- Carmody, N.; Goñi, O.; Łangowski, Ł.; O’Connell, S. Ascophyllum Nodosum Extract Biostimulant Processing and Its Impact on Enhancing Heat Stress Tolerance During Tomato Fruit Set. Front. Plant Sci. 2020, 11. [Google Scholar] [CrossRef] [PubMed]
- Khan, W.; Rayirath, U.P.; Subramanian, S.; Jithesh, M.N.; Rayorath, P.; Hodges, D.M.; Critchley, A.T.; Craigie, J.S.; Norrie, J.; Prithiviraj, B. Seaweed Extracts as Biostimulants of Plant Growth and Development. J. Plant Growth Regul. 2009, 28, 386–399. [Google Scholar] [CrossRef]
- Stirk, W.A.; Rengasamy, K.R.R.; Kulkarni, M.G.; van Staden, J. Plant Biostimulants from Seaweed: An Overview. Chem. Biol. Plant Biostimulants 2020, 33–55. [Google Scholar] [CrossRef]
- Hussein, M.H.; Eltanahy, E.; Al Bakry, A.F.; Elsafty, N.; Elshamy, M.M. Seaweed Extracts as Prospective Plant Growth Bio-Stimulant and Salinity Stress Alleviator for Vigna Sinensis and Zea Mays. J. Appl. Phycol. 2021, 33, 1273–1291. [Google Scholar] [CrossRef]
- Chinnusamy, V.; Jagendorf, A.; science, J.Z.-C.; 2005, Understanding and Improving Salt Tolerance in Plants. Wiley Online Libr. Chinnusamy, A Jagendorf, JK ZhuCrop Sci. 2005•Wiley Online Libr. 2005, 45, 437–448. [CrossRef]
- Negrão, S.; Schmöckel, S.; botany, M.T.-A. of; 2017, Evaluating Physiological Responses of Plants to Salinity Stress. Acad. Negrão, SM Schmöckel, M TesterAnnals Bot. 2017•academic.oup.com. [CrossRef]
- Rouphael, Y.; De Micco, V.; Arena, C.; Raimondi, G.; Colla, G.; De Pascale, S. Effect of Ecklonia Maxima Seaweed Extract on Yield, Mineral Composition, Gas Exchange, and Leaf Anatomy of Zucchini Squash Grown under Saline Conditions. SpringerY Rouphael, V Micco, C Arena, G Raimondi, G Colla, S PascaleJournal Appl. Phycol. 2017•Springer 2017, 29, 459–470. [CrossRef]
- Ibrahim, W.M.; Ali, R.M.; Hemida, K.A.; Sayed, M.A. Role of Ulva Lactuca Extract in Alleviation of Salinity Stress on Wheat Seedlings. Sci. World J. 2014, 2014. [Google Scholar] [CrossRef]
- Wally, O.S.D.; Critchley, A.T.; Hiltz, D.; Craigie, J.S.; Han, X.; Zaharia, L.I.; Abrams, S.R.; Prithiviraj, B. Regulation of Phytohormone Biosynthesis and Accumulation in Arabidopsis Following Treatment with Commercial Extract from the Marine Macroalga Ascophyllum Nodosum. J. Plant Growth Regul. 2013, 32, 324–339. [Google Scholar] [CrossRef]
- HM, A.; Shaddad, M.; & N.B.-J. of S.P.; 2010, The Role of Amino Acids in Improvement in Salt Tolerance of Crop Plants. cyberleninka.ruAES HM, MAK Shaddad, N BarakatJournal Stress Physiol. Biochem. 2010•cyberleninka.ru 2010, 6, 25–37.
- Battacharyya, D.D.; Babgohari, M. Seaweed Extracts as Biostimulants in Horticulture. 2015.
- Singh Kesawat, M.; Satheesh, N.; Singh Kherawat, B.; Kumar, A.; Kim, H.-U.; Chung, S.-M.; Kumar, M.; Vigyan Kendra, K.; Keshwanand, S. Regulation of Reactive Oxygen Species during Salt Stress in Plants and Their Crosstalk with Other Signaling Molecules—Current Perspectives and Future Directions. mdpi.com MS Kesawat, N Satheesh, BS Kherawat, A Kumar, HU Kim, SM Chung, M Kumar Plants, 2023•mdpi.com 2023. [CrossRef]
- Nabil-Adam, A.; Shreadah, M.A.; Abd El-Moneam, N.M.; El-Assar, S.A. Marine Algae of the Genus Gracilaria as Multi Products Source for Different Biotechnological and Medical Applications. Recent Pat. Biotechnol. 2020, 14, 203–228. [Google Scholar] [CrossRef]
- Rajput, V.D.; Harish; Singh, R.K.; Verma, K.K.; Sharma, L.; Quiroz-Figueroa, F.R.; Meena, M.; Gour, V.S.; Minkina, T.; Sushkova, S.; et al. Recent Developments in Enzymatic Antioxidant Defence Mechanism in Plants with Special Reference to Abiotic Stress. Biology (Basel). 2021, 10.
- Ighodaro, O.; Akinloye, O.A. First Line Defence Antioxidants-Superoxide Dismutase (SOD), Catalase (CAT) and Glutathione Peroxidase (GPX): Their Fundamental Role in the Entire Antioxidant Defence Grid. Alexandria J. Med. 2018, 54, 287–293. [Google Scholar] [CrossRef]
- De la Rubia, A.G.; Centeno, M.L.; Moreno-González, V.; De Castro, M.; García-Angulo, P. Perception and First Defense Responses Against Pseudomonas syringae Pv. phaseolicola in Phaseolus vulgaris: Identification of Wall-Associated Kinase Receptors. Phytopathology 2021, 111, 2332–2342. [Google Scholar] [CrossRef] [PubMed]
- Xiao, W.; Loscalzo, J. Metabolic Responses to Reductive Stress. Antioxidants Redox Signal. 2020, 32, 1330–1347. [Google Scholar] [CrossRef] [PubMed]
- Gapińska, M.; Skłodowska, M.; Gabara, B. Effect of Short- and Long-Term Salinity on the Activities of Antioxidative Enzymes and Lipid Peroxidation in Tomato Roots. Acta Physiol. Plant. 2008, 30, 11–18. [Google Scholar] [CrossRef]
- Latique, S.; Mohamed Aymen, E.; Halima, C.; Chérif, H.; Mimoun, E.K. Alleviation of Salt Stress in Durum Wheat (Triticum Durum L.) Seedlings Through the Application of Liquid Seaweed Extracts of Fucus Spiralis. Commun. Soil Sci. Plant Anal. 2017, 48, 2582–2593. [Google Scholar] [CrossRef]
- Sharma, S.; Joshi, J.; Kataria, S.; Verma, S.K.; Chatterjee, S.; Jain, M.; Pathak, K.; Rastogi, A.; Brestic, M. Regulation of the Calvin Cycle under Abiotic Stresses: An Overview. In Plant Life under Changing Environment: Responses and Management; 2020; pp. 681–717 ISBN 9780128182048.
- O’Leary, B.; Park, J.; Plaxton, W.C. The Remarkable Diversity of Plant PEPC (Phosphoenolpyruvate Carboxylase): Recent Insights into the Physiological Functions and Post-Translational Controls of Non-Photosynthetic PEPCs. Biochem. J. 2011, 436, 15–34. [Google Scholar] [CrossRef] [PubMed]
- Betti, M.; García-Calderón, M.; Pérez-Delgado, C.M.; Credali, A.; Estivill, G.; Galván, F.; Vega, J.M.; Márquez, A.J. Glutamine Synthetase in Legumes: Recent Advances in Enzyme Structure and Functional Genomics. Int. J. Mol. Sci. 2012, 13, 7994–8024. [Google Scholar] [CrossRef] [PubMed]
- Kumar, R.G.; Shah, K.; Dubey, R.S. Salinity Induced Behavioural Changes in Malate Dehydrogenase and Glutamate Dehydrogenase Activities in Rice Seedlings of Differing Salt Tolerance. Plant Sci. 2000, 156, 23–34. [Google Scholar] [CrossRef] [PubMed]
- Farhangi-Abriz, S.; Torabian, S. Biochar Improved Nodulation and Nitrogen Metabolism of Soybean under Salt Stress. Symbiosis 2018, 74, 215–223. [Google Scholar] [CrossRef]
- Zhang, X.; He, P.; Guo, R.; Huang, K.; Huang, X. Effects of Salt Stress on Root Morphology, Carbon and Nitrogen Metabolism, and Yield of Tartary Buckwheat. Sci. Rep. 2023, 13. [Google Scholar] [CrossRef]
- Zhou, Y.; Cai, H.; Xiao, J.; Li, X.; Zhang, Q.; Lian, X. Over-Expression of Aspartate Aminotransferase Genes in Rice Resulted in Altered Nitrogen Metabolism and Increased Amino Acid Content in Seeds. Theor. Appl. Genet. 2009, 118, 1381–1390. [Google Scholar] [CrossRef] [PubMed]
- Ramanjulu, S.; Veeranjaneyulu, K.; Sudhakar, C. Short-Term Shifts in Nitrogen Metabolism in Mulberry Morus Alba under Salt Shock. Phytochemistry 1994, 37, 991–995. [Google Scholar] [CrossRef]
| Saccorhiza polyschides | Polyphenols | Flavonoids | IAA | AA | |
| (mg/g DW) | |||||
| 5.494 ± 0.026 | 1.327 ± 0.012 | 0.264 ± 0.004 | 0.353 ± 0.009 | ||
Disclaimer/Publisher’s Note: The statements, opinions and data contained in all publications are solely those of the individual author(s) and contributor(s) and not of MDPI and/or the editor(s). MDPI and/or the editor(s) disclaim responsibility for any injury to people or property resulting from any ideas, methods, instructions or products referred to in the content. |
© 2024 by the authors. Licensee MDPI, Basel, Switzerland. This article is an open access article distributed under the terms and conditions of the Creative Commons Attribution (CC BY) license (http://creativecommons.org/licenses/by/4.0/).


