Preprint
Article

Timescales of ecological processes, settling, and estuarine transport to create estuarine turbidity maxima: An application of the Peter-Parker Model

Altmetrics

Downloads

111

Views

46

Comments

0

A peer-reviewed article of this preprint also exists.

This version is not peer-reviewed

Submitted:

19 June 2024

Posted:

21 June 2024

You are already at the latest version

Alerts
Abstract
The estuarine exchange flow increases longitudinal dispersion of passive tracers and traps sinking particles, potentially creating an estuarine turbidity maximum (ETM): a localized maximum of suspended particulate matter concentration in an estuary. The ETM can have many implications - dead zones due to increased turbidity or hypoxia from organic matter decomposition, naval navigation challenges, and other water quality problems. Using timescales, we investigate how the interaction between exchange flow and particle sinking leads to ETMs by modeling a sinking tracer in an idealized box model of the Total Exchange Flow (TEF) first developed by Parker MacCready. Results indicate that the balance of particle sinking and vertical mixing is critical to determining ETM size and location. We then focus on the role of ecology in ETM formation through the use of The Peter-Parker Model: a new biophysical model which combines the TEF box model with a Nutrient-Phytoplankton-Zooplankton-Detritus (NPZD) model, the likes of which were first developed by Peter J.S. Franks. Detritus sinking rates similarly influence detritus peak concentration and location (an ETM), but detritus ETMs occur in a different location than the sinking tracer due to the influence of the biological factors which create a time lag of about 1 day. Lastly, we characterize the flow of the models with a dimensionless parameter that compares timescales and summarizes the dynamics of the sinking tracer in ETM formation and can be used across systems.
Keywords: 
Subject: Environmental and Earth Sciences  -   Oceanography

1. Introduction

Estuarine exchange flow, driven directly by longitudinal density gradients [1] and indirectly by tidally-asymmetric flows [2], provides the foundational circulation and transport for estuaries and fjords (Figure 1). These flows carry freshwater seaward, typically in an upper surface layer, with dense saline waters replacing those outflows at depth. This exchange produces flushing and dispersion of river-sourced scalars. Sinking particles, whether they are biotic or abiotic, can result in trapping and retention within the estuary [2], forming the estuarine turbidity maximum (ETM): a localized maximum of suspended particulate matter concentration in an estuary. While naturally occurring, ETMs are frequently associated with deteriorated ecological and physical conditions, including ecological dead zones due to either decreased light or increased organic matter decomposition, naval navigation challenges, and other water quality problems [3]. This study aims to investigate this sinking particle trapping phenomena and how it relates to ETMs by looking at both a sinking tracer in isolation and sinking detritus within a planktonic ecosystem.
ETMs have been the subject of modeling studies for several decades. In 1978, [4] used an idealized numerical model to investigate ETM formation and found it to be a function of settling velocity and the strength of the estuarine circulation. In 1980 researchers began to realize ETMs could also be tidally caused [5]. Later studies found that there may be seasonal effects driving ETMs, especially for sediments deposited during large flooding events from winter storms [6]. While some estuaries get ETMs from bathymetry or lateral trapping processes, most basic ETM dynamics can be described using a constant settling velocity [4,5,7]. A summary is provided in the review [3], where one of their concluding thoughts is that more fundamental research in suspended particulate matter (SPM) dynamics is needed to be able to classify estuaries by their ETMs. Further, one of the main remaining questions those authors found in their review is: “How do the fast dynamics of SPM in the water column and the slow dynamics of the bottom pool interact to determine ETM locations and variability, and what processes govern the dynamics of the mobile bottom pool?" [3]. The analysis presented in this paper are motivated in part by this call for additional research on ETMs and how sinking particles contribute to these accumulations.
Sinking detritus can lead to hypoxic (low-oxygen) regions of the estuary, in addition to ETMs. For example, the Hood Canal section of the Puget Sound has seasonal periods of low dissolved oxygen [8], leading to fish kills and other ecosystem impacts [9]. One of the causes of hypoxic regions is the sinking of dead organic material which originally grew in the high-irradiance surface layer and is then decomposed at depth by aerobic microorganisms which use up the oxygen. Field studies have detected patchiness in dissolved oxygen levels in the depths of the Hood Canal [10]. An investigation of the interaction of detritus sinking with estuarine exchange flow will help develop an understanding of the physical and biological processes which lead to oxygen depletion in the Hood Canal and other similar fjordic and estuarine systems. While we do not study the formation of hypoxia directly, it serves as a motivation for this work, which we hope will inform further study of sinking decaying matter which leads to hypoxic regions via biological oxygen demand.
In order to capture dynamics similar to those in Puget Sound, we will simulate a partially mixed estuarine system, with a density-driven circulation dominating the along-estuary net transport, which is reflective of the fjord-like systems of the Puget Sound region [2,9]. The exchange flow increases longitudinal dispersion of passive tracers but traps sinking particles that enter the lower layer [2]. This study aims to investigate this sinking particle trapping phenomena and how it relates to ETMs/sinking particle/detritus accumulation as well as look to the future to understand how physical changes to the estuary will alter these ETMs.
The tool of this study is a numerical model of a two-layer estuary that divides the estuary into longitudinal compartments. This model was originally used by [11] to investigate residence times in the Salish Sea estuary by advecting a passive, non-sinking tracer. We expanded the box model of [11] with a sinking tracer to understand the relationship between particle sinking and exchange flow. First, we explore the implications of varying parameters in this model for estuarine turbidity maximum/sinking particle accumulation in a system inspired by, but not strictly tied to, the Puget Sound. We next assess the planktonic ecosystem impacts of sinking detritus with The Peter-Parker Model, which adds a biological component that tracks Nutrients, Phytoplankton, Zooplankton, and Detritus (NPZD) [12] concentrations through time with the Total Exchange Flow (TEF) box model [11]. Then we break apart the mechanisms leading to these accumulations by using a timescale analysis and compare the accumulations of systems with and without biology. Lastly, we characterize the flow of the models with a dimensionless parameter which summarizes the dynamics of the sinking tracer and can be used across systems.

2. Methods

2.1. Base: Total Exchange Flow Box Model

The fundamental model in this study is a box model for Total Exchange Flow (TEF) first developed by Parker MacCready [11]. TEF is defined as the “sub-tidal volume flux integrated over a salinity range" [13]. For our system of study, we assume a two-layer exchange flow consisting of a shallow and deep layer [13]. River flow drives the shallow layer seaward, and the density gradient brings in the deep oceanic layer. Tidal currents then mix these shallow and deep layers vertically. Together, these processes comprise the TEF [13]. In this work, the advective fluxes are quantified by the Knudsen relation [14] (as done in the original TEF framework from [13]), and the mixing between the shallow and deep layers is quantified by the Cokelet and Stewart efflux/reflux method [15]. The salinity distribution, which drives this TEF model, is obtained from the Chatwin solution [16] and follows the paradigm that the flow is predominantly density driven and tidal effects are limited to mixing.
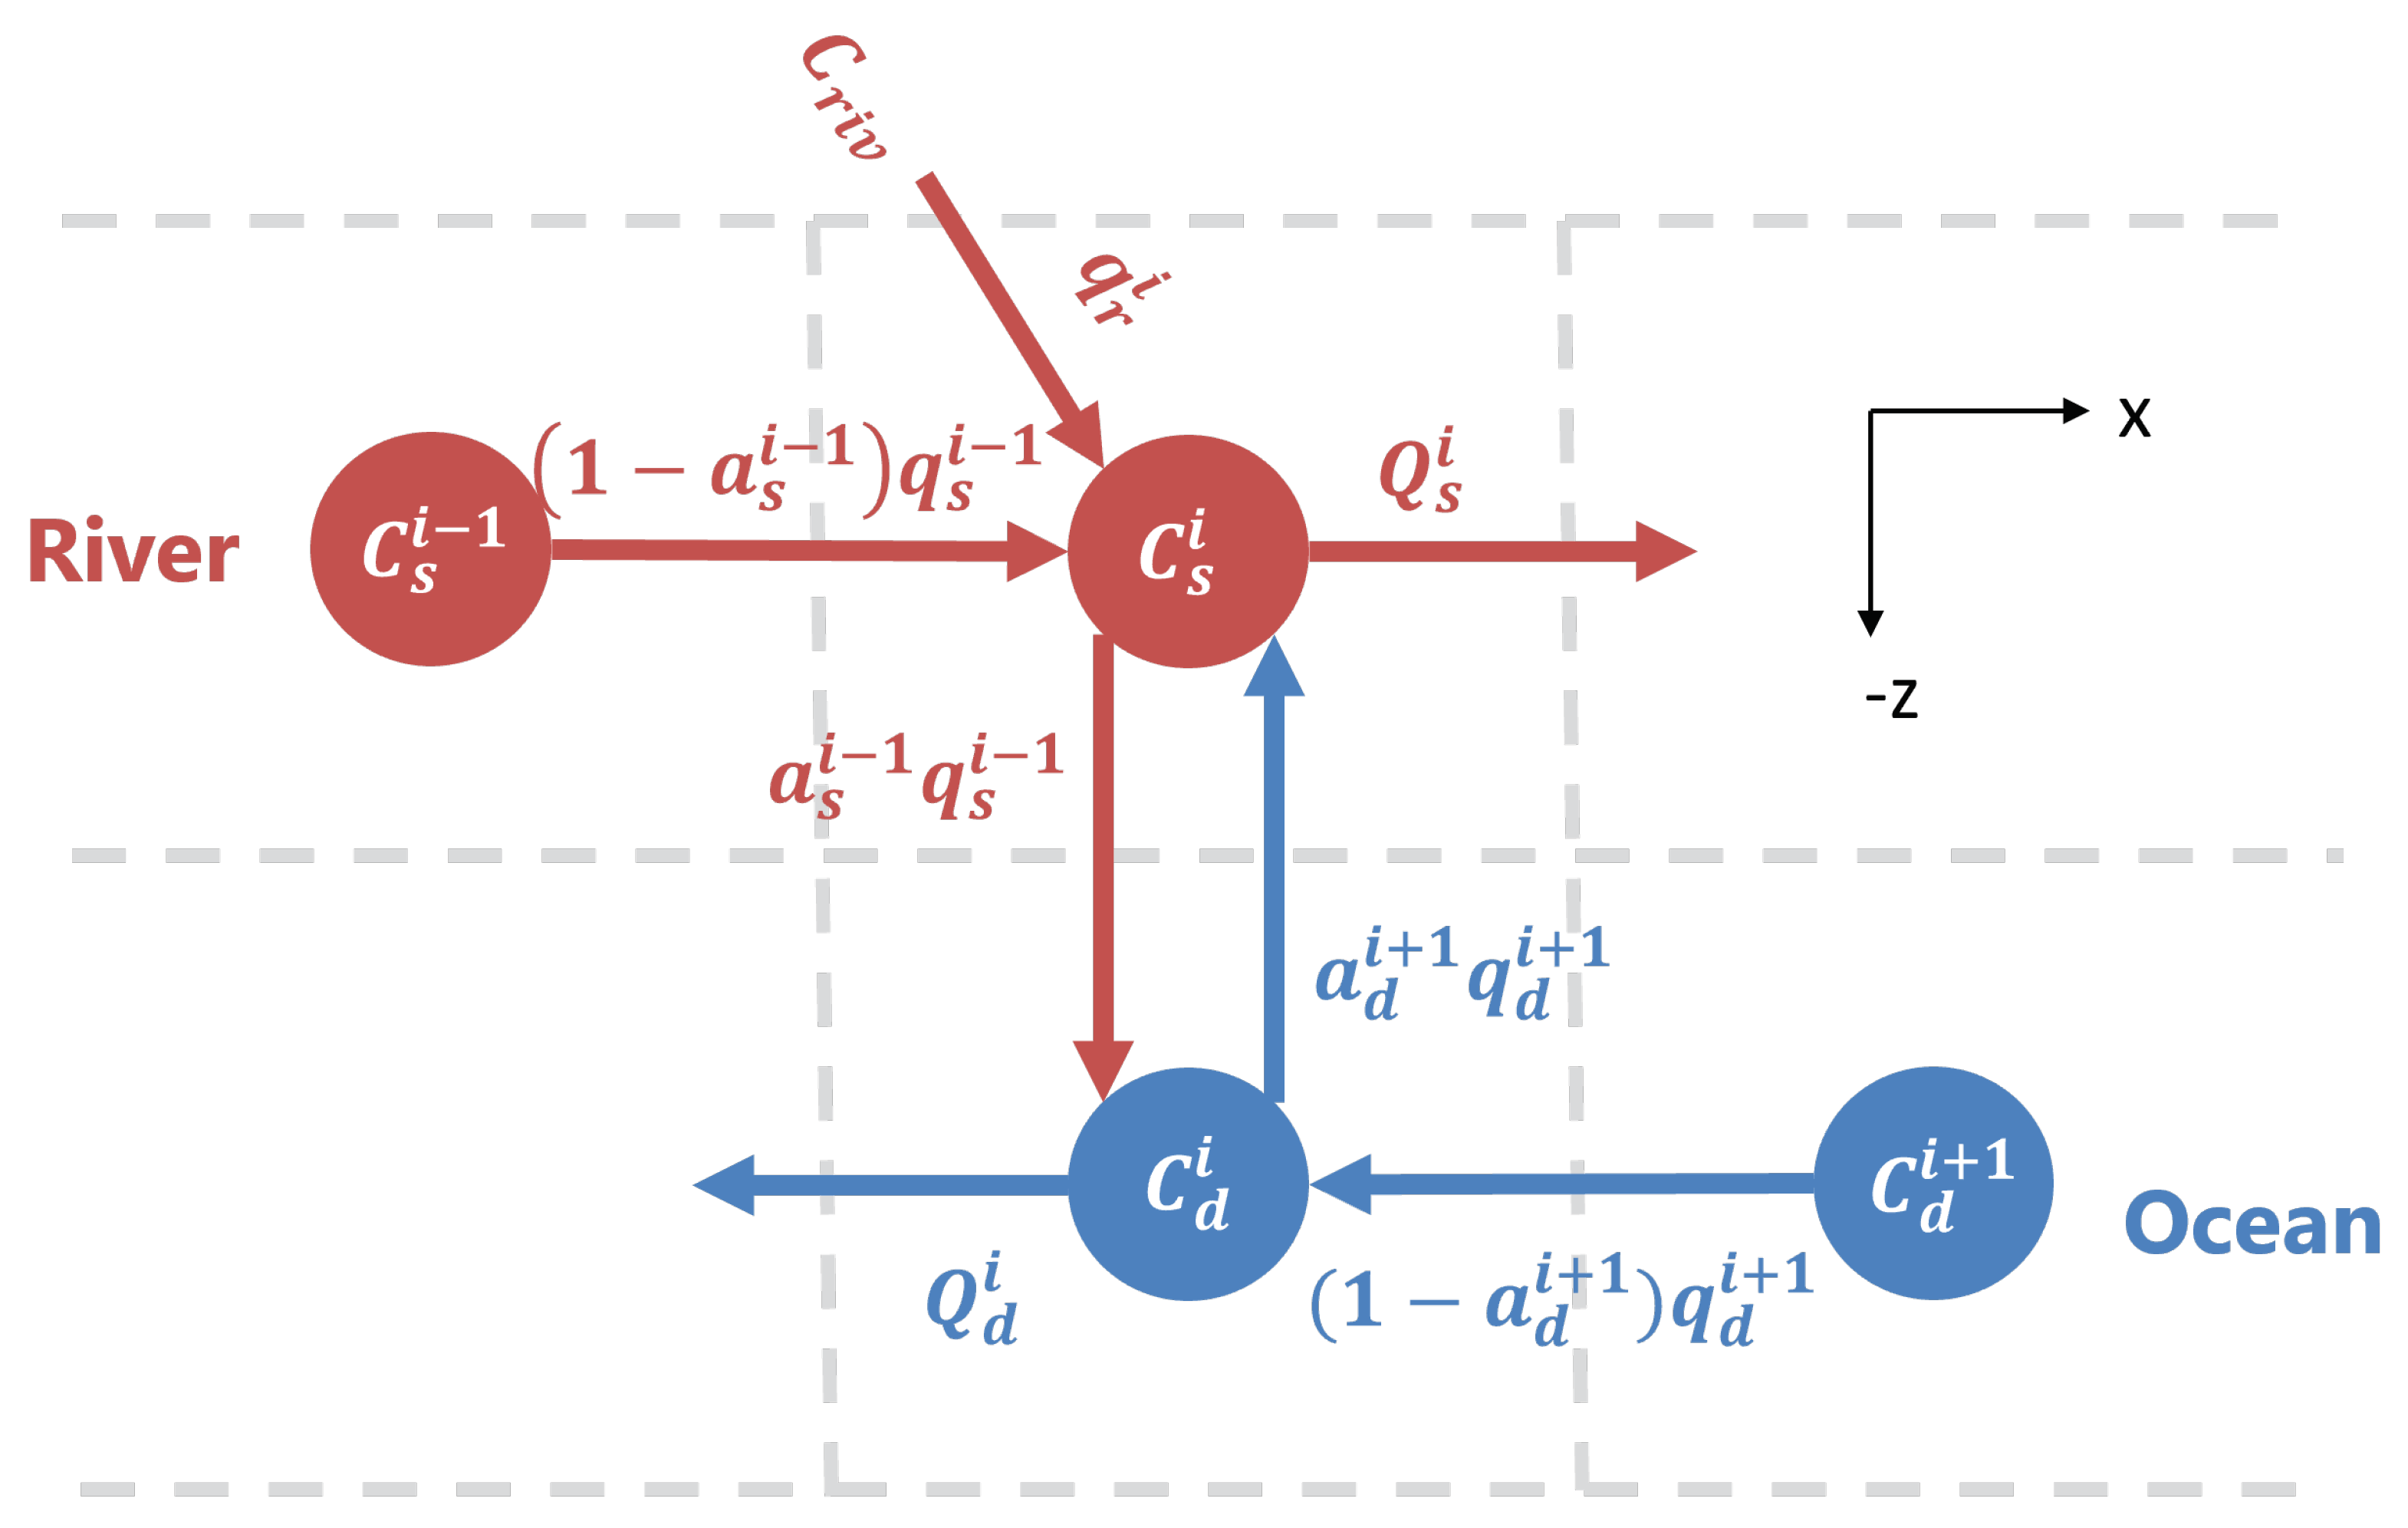
The box model reinterpretation of TEF for a tracer C is defined in Figure 2 and as follows:
d C s i d V s d t = ( 1 a s i 1 ) q s i 1 C s i 1 Q s i C s i + a d i + 1 q d i + 1 C d i + q r i C r i v d C d i d V d d t = ( 1 a d i + 1 ) q d i + 1 C d i + 1 Q d i C d i + a s i 1 q s i 1 C s i
C is general tracer concentration in either the shallow ( C s ) or deep ( C d ) layer at x-location i, d V is the volume per box in the shallow (s) or deep (d) layer, Q is the flow (defined in Eq. 3 with units of m 3 s 1 ), q s and q d are the fluxes which are a fraction of the flows calculated using the Cokelet and Stewart efflux-reflux theory (defined in Eq. 2, from [15], also with units of m 3 s 1 ) using a s and a d which are fractions of the flow solved to ensure mass and volume conservation (defined in Eq. 4,15]), a q is a flow rate in which both the fraction ( a s or a d ) and the total possible flow rate ( q s or q d ) vary according the details given below, and C r i v is the concentration of the scalar from the river transported by the river flux q r i (units m 3 s 1 ). As written, the river can input concentration into the estuary at any x-location. For this study, we only implement the river flux at X = 0 k m , so at all other locations q r i = 0 m 3 s 1 . The exchanges of Eq. 1 are illustrated in Figure 2. The flows/fluxes are related by Cokelet and Stewart salt and volume conservation [11,15]. The Cokelet and Stewart method separates the vertical fluxes as efflux and reflux, where efflux is the flow upward from the deep layer to the shallow layer ( a d i + 1 q d i + 1 in Figure 2) and reflux is the flow downward from the shallow to the deep layer ( a s i 1 q s i 1 in Figure 2). The net transport from longitudinal and vertical mixing only (no river flow) sums to:
Q s i = 1 a s i 1 q s i 1 + a d i + 1 q d i + 1 Q d i = 1 a d i + 1 q d i + 1 + a s i 1 q s i 1
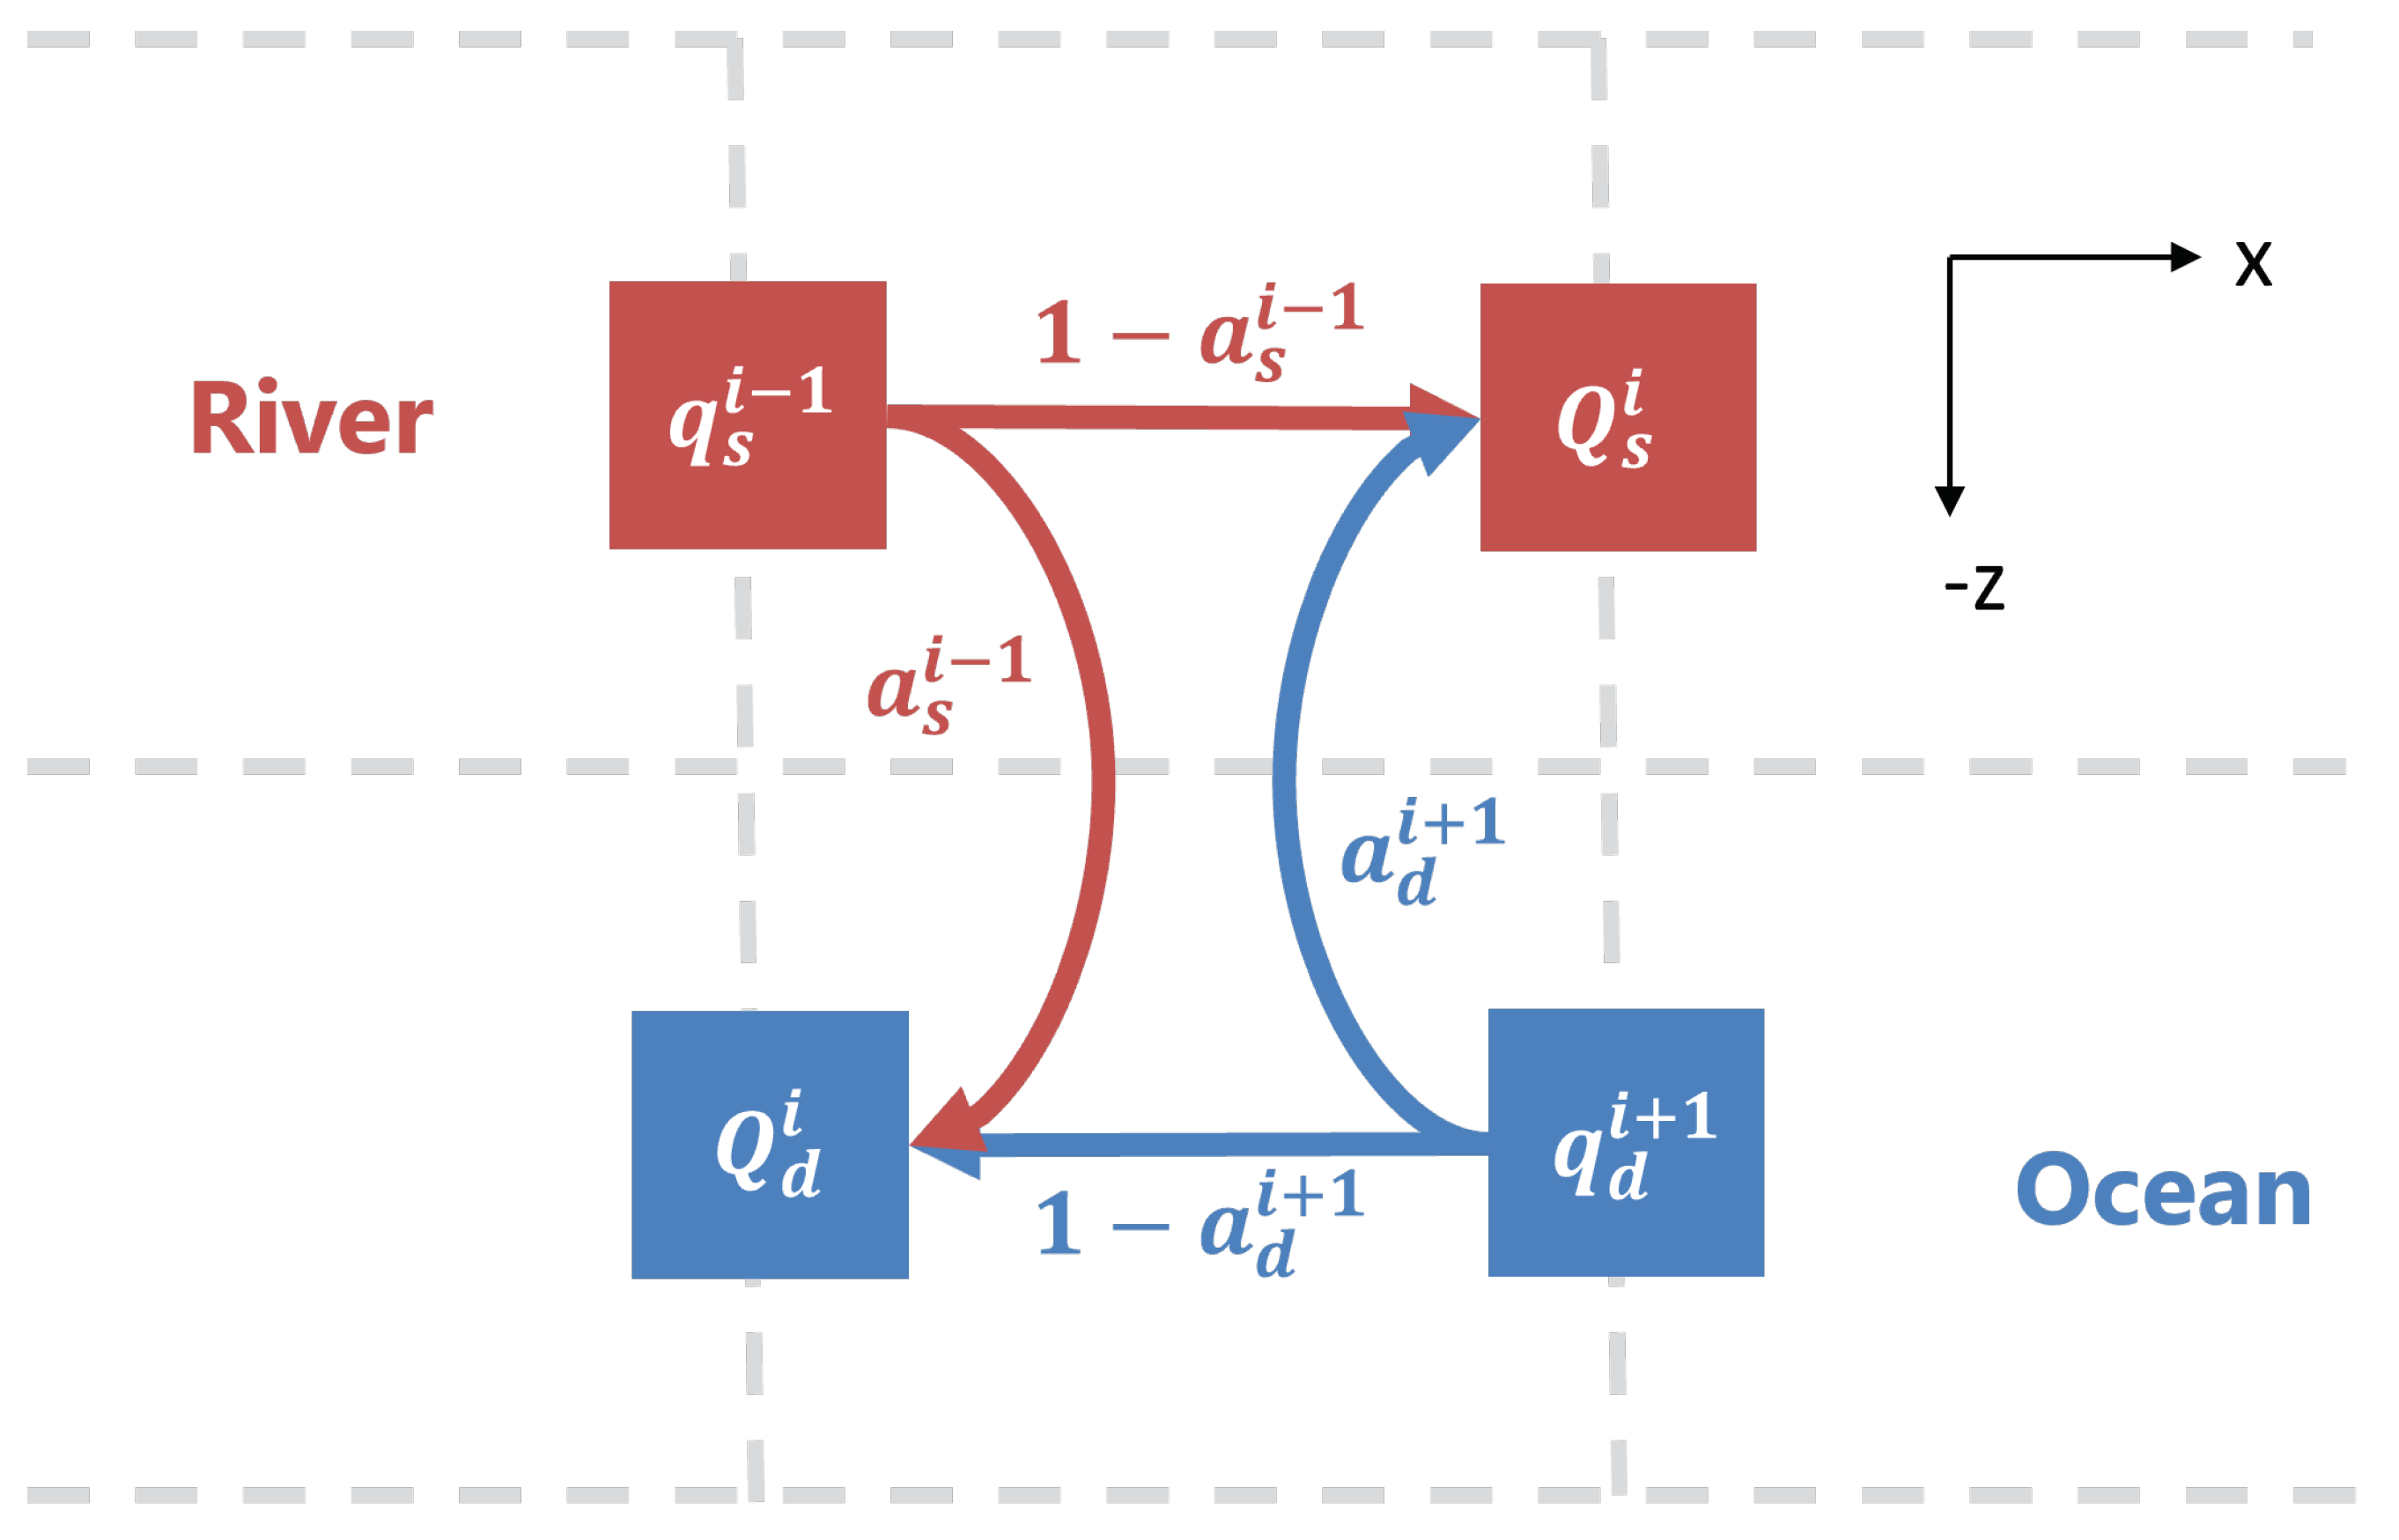
where Q s i and Q d i combine the flow of the efflux or reflux respectively and the remaining longitudinal flow in each respective layer in Figure 2 [11]. Figure 3 shows the efflux/reflux method and how the flows of Eq. 2 fit together. Note that the flows are located on the faces of the boxes, whereas the concentrations are at the center.
These flows depend on both the salinity distribution and the river flow. The flow divisions, with Q s being in the direction toward the ocean (shallow) and Q d being toward the river head (deep), are based on the Knudsen relation [13,14]:
Q s i = Q r S d i S d i S s i , Q d i = Q r S s i S d i S s i
Where S i is salinity (distinct from the tracer studied, C i ) at location i either in the shallow (subscript s) or deep (subscript d) layer of the estuary and Q r is the cumulative river flow along x. The following flow ratios ( a s and a d ) determine how much of the flow in Eq. 3 mixes vertically as determined by the Cokelet Stewart method:
a s i = S s i S d i S d i + 1 S d i S d i + 1 S s i , a d i = S d i S s i S s i S s i 1 S d i S s i 1
Where S is the salinity either heading longitudinally in (deep, d) or longitudinally out (shallow, s) of the estuary at x-locations denoted in the superscripts [15]. The along-estuary salinity distribution is externally specified and defined by the Chatwin solution [16]. Eq. 4 results in vertical exchanges that are roughly equal and opposite and approach zero near the ocean boundary (Figure 4). Approaching the upstream boundary, the upwards efflux approaches the upstream lower layer flux as is required by mass conservation, and the downwards reflux quickly approaches zero at the boundary.

2.2. Variation 1: Sinking Tracer Model

To investigate particle sinking, we added another flux in the base TEF model from the shallow layer to the deep layer, making the passive tracer now a sinking tracer. Thus, Eq. 1 changes to the following:
d C s i d V s d t = ( 1 a s i 1 ) q s i 1 C s i 1 Q s i C s i + a d i + 1 q d i + 1 C d i + q r i C r i v Q s e t C s i d C d i d V d d t = ( 1 a d i + 1 ) q d i + 1 C d i + 1 Q d i C d i + a s i 1 q s i 1 C s i + Q s e t C s i
where Q s e t is the settling flow rate, C s i is the tracer concentration in the surface layer at x-location i, and C d i is the tracer concentration in the deep layer at x-location i. To numerically implement this in the box model, the sinking rate is applied to a surface area through which the tracer is settling. In other words,
Q s e t = w s A s
where A s is shallow surface area and w s is the sinking speed. The sinking terms are not denoted on Figure 2, but act to increase the downwards reflux (or counteract the upwards efflux). In the deep layer, we assume that all mass is retained in the water column, with no accumulation at the bed. This is equivalent to assuming that particles that reach the bed are immediately re-suspended. As a result, no sinking flux needs be specified out of the lower layer. At the upstream boundary, we do not allow settling from the most up-estuary cell in the upper layer because such settling would add mass to an inactive cell in the lower layer due to the staggering of cells in the upper and lower layer (see Figure 1).
We set the height of each layer ( h s , h d ) to 20 m each, the spacing in x in the numerical model or the length of each box ( d x ) is 500 m, and the length of the estuary (L) is set to 50 k m . The width (B) is the dimension into and out of the page in Figure 2 and does not vary longitudinally or vertically. Thus, the box volumes are defined as d V s = B h s d x in the shallow layer and d V d = B h d d x in the deep layer, giving n = 2 100 grid cells.
For the sinking tracer study we examined cases with a tracer input of 1 μ M (0.0645 g L 1 ) at the river ( C r i v = 1 μ M ) enforced with a Dirichlet boundary condition. A Dirichlet boundary condition is also applied at the ocean ( C o c n = 0), so this study only looks at the effects of a terrestrially sourced sinking tracer in the estuary. These parameters are summarized in Table 1.

2.3. Variation 2: The Peter-Parker Model

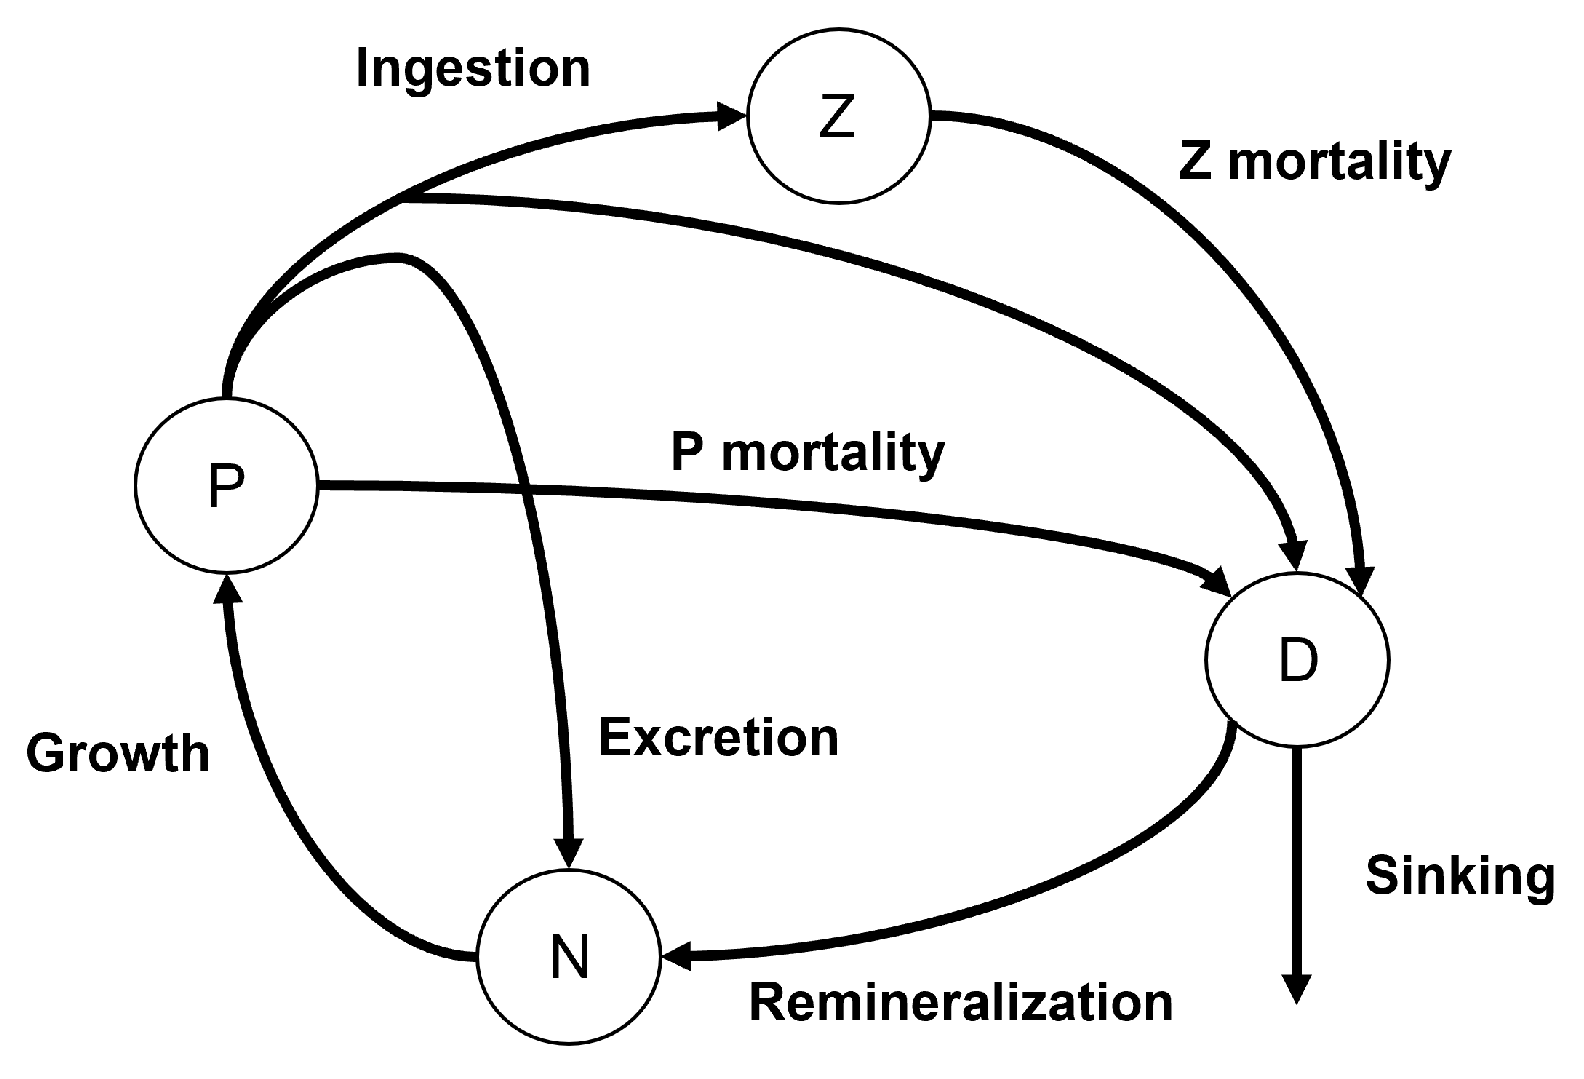
To study the ecological impact of ETMs, we implemented a Nutrient-Phytoplankton-Zooplankton-Detritus (NPZD) model into the base TEF-box model, with settling only active for the detritus component of the model. We used the NPZD model from [12], which is a variation of the Nutrient-Phytoplankton-Zooplankton idealized models first developed by Peter Franks [17]. This particular model includes a detritus box and is tuned for the pacific northwest [12]. The NPZD model provides a basic ecosystem structure with nutrients being taken up by phytoplankton, which is, in turn, grazed by zooplankton. Detritus provides a mechanism for waste to return to the nutrient pool. The nutrient component of the model should be based on whatever nutrient is limiting to phytoplankton growth; in our implementation we will consider this to be nitrogen, reflective of the limiting factor in the Salish Sea [12,18]. Figure 5 summarizes the NPZD relationships written in Eq. 7: nutrients are taken up by phytoplankton and allow for growth, phytoplankton excrete nutrients and become detritus due to reasons other than grazing, phytoplankton is consumed by zooplankton grazing, but a fraction of the phytoplankton is lost to detritus due to “messy eating" of the zooplankton, zooplankton become detritus, and the detritus sinks and remineralizes back to nutrients.
The equations for the dynamics shown in Figure 5 are as follows:
d N d t = μ i n s t ( E ( t , z ) , N ) P + ( 1 ϵ ) ( 1 f e g e s t ) I ( P ) Z + r D d P d t = μ i n s t ( E ( t , z ) , N ) P I ( P ) Z m P d Z d t = ϵ I ( P ) Z ξ Z 2 d D d t = ( 1 ϵ ) f e g e s t I ( P ) Z + m P + ξ Z 2 r D w s d D d z
Where μ i n s t is the instantaneous phytoplankton growth rate which depends on irradiance and nutrients, E is photosynthetically available radiation (irradiance) and is time and depth dependent, ϵ is zooplankton growth efficiency, f e g e s t is the fraction of losses egested of phytoplankton by zooplankton (“messy eating"), I is zooplankton ingestion/grazing of phytoplankton, r is remineralization rate of detritus to nutrients, m is non-grazing phytoplankton mortality, ξ is zooplankton mortality, and w s is detritus sinking rate [12]. The growth ( μ i n s t ) and grazing (I) rates are parameters which change in time based on available resources:
μ i n s t ( E , N ) = μ 0 N k s + N α E μ 0 2 + α 2 E 2
Where μ 0 is maximum instantaneous growth rate, k s is half-saturation for nitrate uptake, and α is initial slope of growth-light curve. Further,
I ( P ) = I 0 P 2 K s 2 + P 2
Where I 0 is maximum ingestion rate and K s is half-saturation for ingestion.
Irradiance (E) is time-dependent to reflect the day/night light cycle:
E ( t ) = E 0 2 1 + c o s ( 2 π t )
E 0 is maximum light, and t is in days.
So, treating N, P, Z, and D as passive scalars, we put the Peter Model (NPZD, Eq. 7) into the Parker Model (TEF, Eq. 1) to form The Peter-Parker Model:
d ( N s i d V s ) d t = ( 1 a s i 1 ) q s i 1 N s i 1 Q s i N s i + a d i + 1 q d i + 1 N d i + q r i N r i v + d V s μ i n s t i ( E s , N s i ) P s i + ( 1 ϵ ) ( 1 f e g e s t ) I i ( P s i ) Z s i + r D s i d ( N d i d V d ) d t = ( 1 a d i + 1 ) q d i + 1 N d i + 1 Q d i N d i + a s i 1 q s i 1 N s i + d V d μ i n s t i ( E d i , N d i ) P d i + ( 1 ϵ ) ( 1 f e g e s t ) I i ( P d i ) Z d i + r D d i d ( P s i d V s ) d t = ( 1 a s i 1 ) q s i 1 P s i 1 Q s i P s i + a d i + 1 q d i + 1 P d i + d V s μ i n s t i ( E s , N s i ) P s i I i ( P s i ) Z s i m P s i d ( P d i d V d ) d t = ( 1 a d i + 1 ) q d i + 1 P d i + 1 Q d i P d i + a s i 1 q s i 1 P s i + d V d μ i n s t i ( E d i , N d i ) P d i I i ( P d i ) Z d i m P d i d ( Z s i d V s ) d t = ( 1 a s i 1 ) q s i 1 Z s i 1 Q s i Z s i + a d i + 1 q d i + 1 Z d i + d V s ϵ I i ( P s i ) Z s i ξ Z s i 2 d ( Z d i d V d ) d t = ( 1 a d i + 1 ) q d i + 1 Z d i + 1 Q d i Z d i + a s i 1 q s i 1 Z s i + d V d ϵ I i ( P d i ) Z d i ξ Z d i 2 d ( D s i d V s ) d t = ( 1 a s i 1 ) q s i 1 D s i 1 Q s i D s i + a d i + 1 q d i + 1 D d i Q s e t D s i + d V s ( 1 ϵ ) f e g e s t I i ( P s i ) Z s i + m P s i + ξ Z s i 2 r D s i d ( D d i d V d ) d t = ( 1 a d i + 1 ) q d i + 1 D d i + 1 Q d i D d i + a s i 1 q s i 1 D s i + Q s e t D s i + d V d ( 1 ϵ ) f e g e s t I i ( P d i ) Z d i + m P d i + ξ Z d i 2 r D d i
where all the parameters are the same as in Eqs. 1 and 7. The values we used for the parameters are summarized in Table 1.
The boundary conditions for the biological components of the Peter-Parker Model are as follows. First, the nutrients are only supplied in the river ( N r i v = 5 μ M N ) and the ocean nutrients boundary condition is 0. The tests all had initial phytoplankton and zooplankton concentrations of 0.01 μ M N throughout the estuary as a starting population and boundary condition. We assume no river or ocean sourcing of phytoplankton, zooplankton, or detritus. The model is solved with an explicit forward Euler numerical method with Dirichlet boundary conditions on N, P, Z, and D. While this upwind scheme does introduce slight numerical diffusion, it did not influence our analysis as we perform sensitivity tests and compare results directly. We ran the model to an approximate steady state before analysis, to be discussed below (200 days).
We allow the shallow layer detritus to sink to the deep layer; the sinking detritus goes directly from the shallow concentration to the deep due to the same settling flux Q s e t as above (Eq. 6). We assume that detritus that reaches the bed is re-suspended (no net flux).
The light availability for the deep phytoplankton is more limited based on the water above and the shading caused by the shallow population. This changes Eq. 10 to the following:
E s ( t ) = E 0 2 1 + c o s ( 2 π t ) E d i ( t ) = E 0 2 1 + c o s ( 2 π t ) e a t t s w H s a t t p P s i ( t 1 ) H s
Where E s is irradiance in the shallow layer, E d i is irradiance in the deep layer at location i, a t t s w is the light attenuation of seawater, a t t P is the light attenuation by phytoplankton, P s i ( t 1 ) is the phytoplankton location in the shallow layer at location i from the previous time step, and H s is the height of the shallow layer.

3. Results: Effects of Sinking Speed on Tracer or Detritus Accumulation

We first present concentration results from a sinking tracer in the TEF box model (Eq. 1) without any biological considerations (variation 1 above). We then present the effects of detritus sinking as it interacts with the ecosystem with results from the Peter-Parker Model (Variation 2 above).
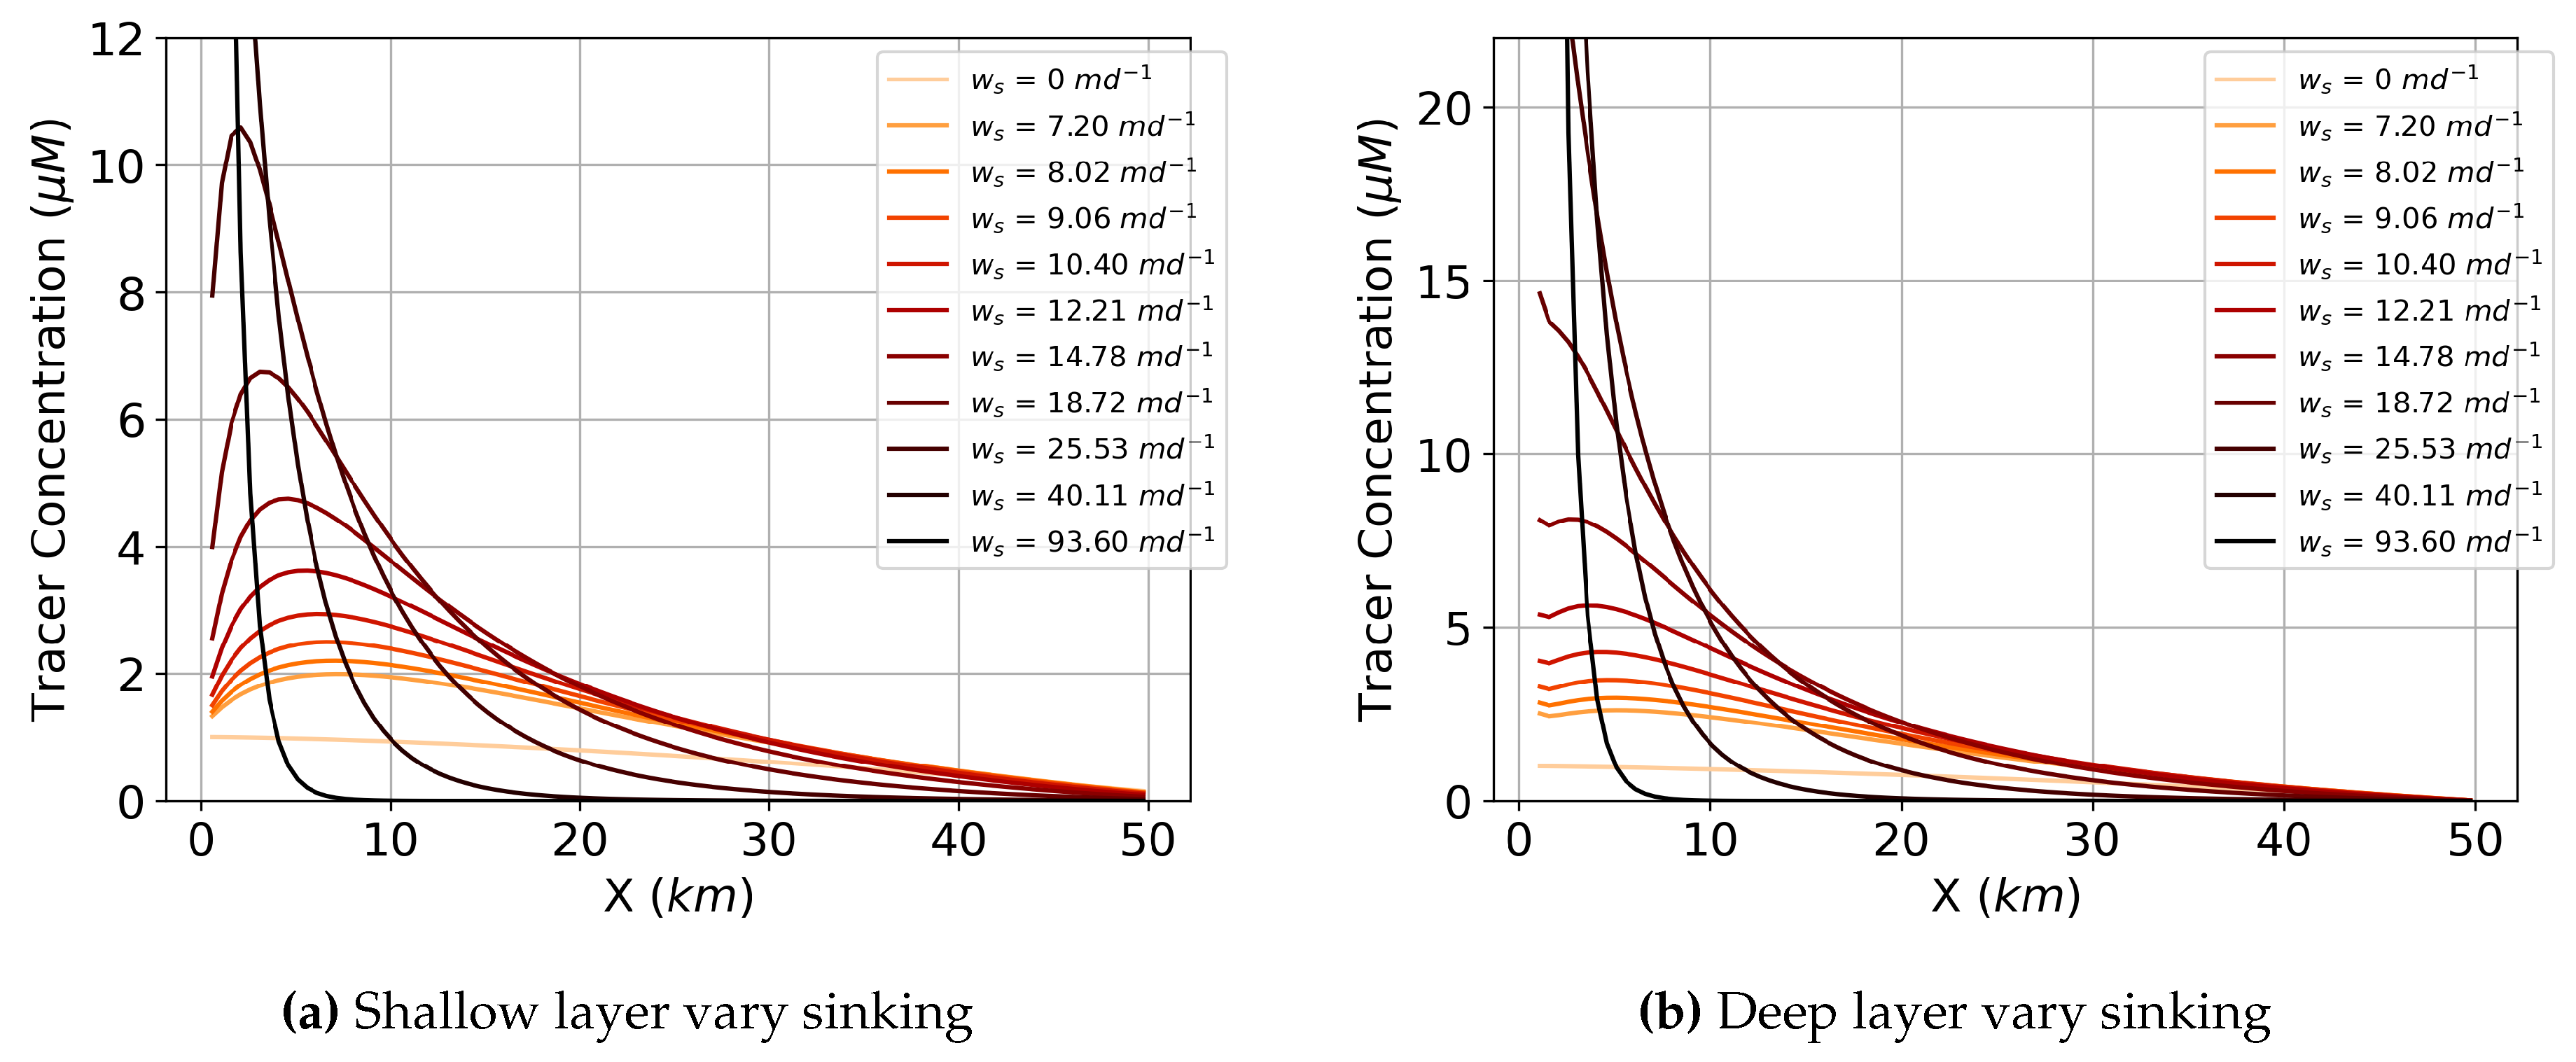
The tracer concentration profiles results for varying sinking while holding all other parameters constant (Figure 6) indicate that there is accumulation of the sinking tracer near the river ( X = 0 k m ) in both the shallow and deep layer for certain sinking speeds. We define accumulation as when the concentration gets above the river input value of 1 μ M . Without sinking, w s = 0 m d 1 , the tracer advects out or mixes down from its box and does not get above the river input concentration. Interestingly, the peak concentration increases with increased sinking rate to reach an inflection point at around 15 m d 1 in both the shallow and the deep layer, after which the peak grows unbounded at X = 0 k m (does not reach steady state within the 200 days of simulation time). In the deep layer, there is accumulation regardless of sinking speed, but the amount increases and becomes unbounded above the same sinking speed as the shallow layer. The deep layer always has a higher peak concentration than the shallow layer. Also, the locations of these peak concentrations shift toward the river with increasing sinking speed in both layers.
Why do sinking particles (Figure 6) lead to accumulation in the estuary? Following one particle starting in the shallow layer of the box model (Figure 2), as it sinks out of the shallow layer into the deep it then is pushed back towards the river ( X = 0 k m ). This happening to a group of particles leads to high concentration in the deep layer up-estuary ( X = 0 k m ). Some of that accumulated concentration is moved back into the shallow layer via efflux. The balance between the sinking and efflux creates a type of vertical circular eddy motion which maintains the tracer concentration at a higher value than the river input of 1 μ M in both the shallow and deep layer at X = 0 k m . The peak also occurs near X = 0 k m because that is where there is increased vertical mixing activity via efflux (Figure 4). When sinking passes a certain threshold of around 15 m d 1 , the effects of the efflux are diminished in the shallow layer as the efflux is no longer sufficient to balance the sinking flux anywhere in the estuary and the system grows unbounded (does not reach steady state within the simulation time of 200 days).
For large settling velocities, the peak concentration is constrained spatially by the up-estuary boundary condition at X = 0 k m and the mass conservation of the system: as tracer is not allowed to leave the system and thus get pushed against X = 0 with narrower peaks with higher sinking speeds. For sinking speeds less than 15 m d 1 steady state is reached, and the peak appears downstream of the boundary. If we compare the sinking speed to a ratio of the sinking flux to the vertical mixing flux, Q s e t a d q d , where Q s e t is the sinking flux (defined in Eq. 6) and a d q d is the vertical flux (arrow pointing from deep to shallow in Figure 1), sinking speeds greater than 15 m d 1 corresponds to when the ratio of settling flux to vertical flux is greater than 0.5. Thus, this balance of sinking and vertical flux is determining when the system accumulates unbounded: the sinking flux must be at most 50 % of the vertical flux to reach steady state.
Peak concentrations move closer to the river ( X = 0 k m ) because that is where the sinking tracer concentration is being sourced. So, the faster a particle sinks, the closer it will sink to its source because it is sinking faster than the estuarine flow which otherwise would move it further from its source. This is further investigated with timescales in the following section.
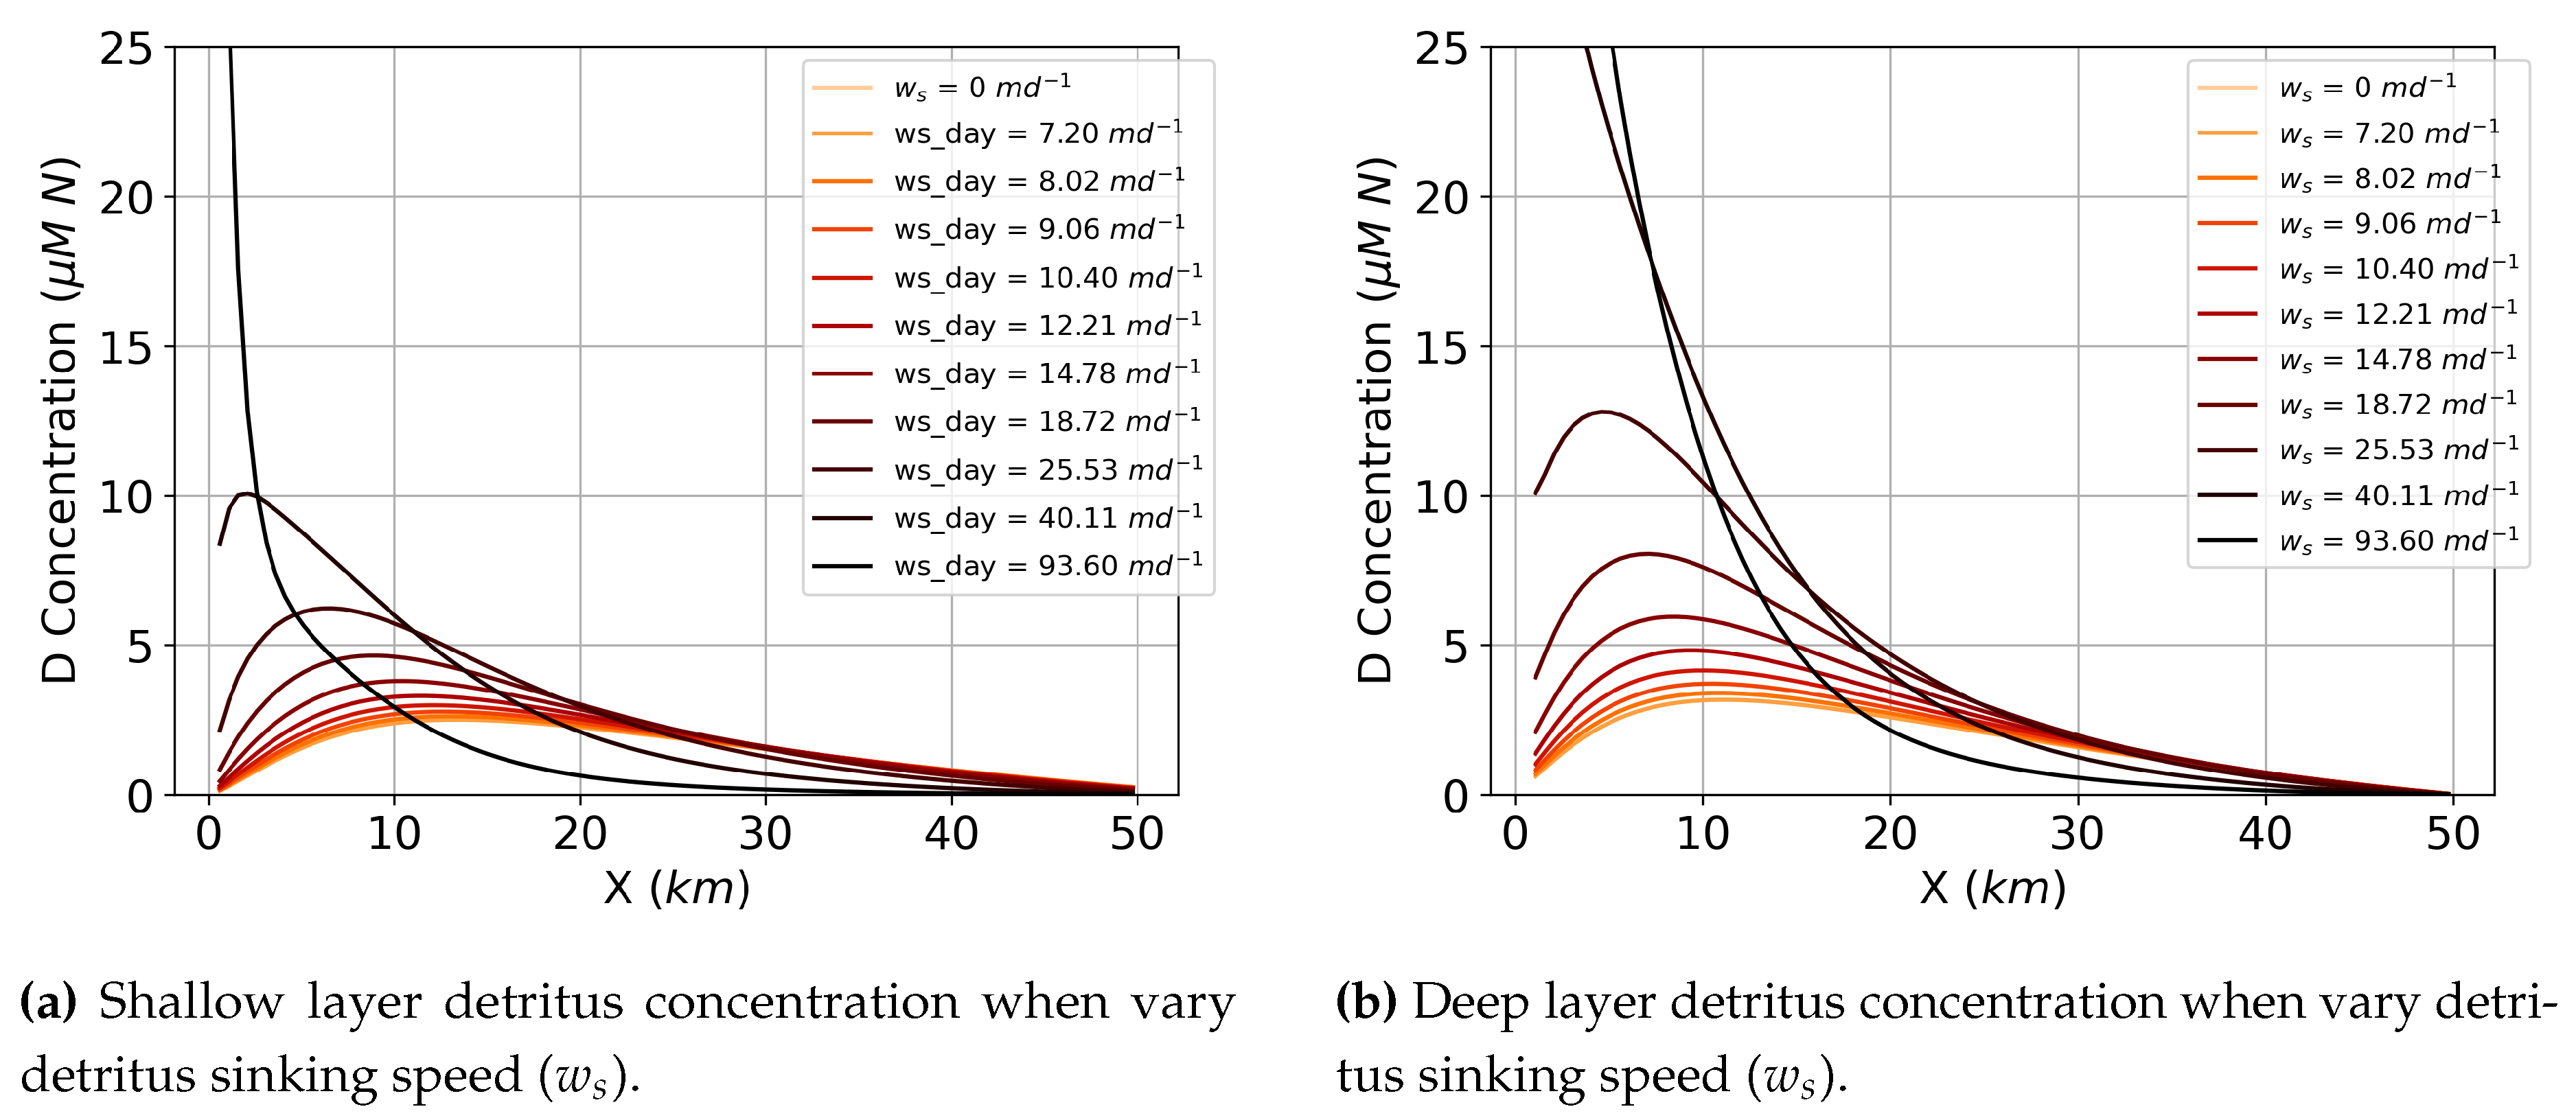
As was observed above, sinking speed can have a large influence on tracer accumulation in the estuary and there is a threshold of sinking speeds after which the accumulated concentration does not reach a steady state. Specifically, increasing sinking speed increases tracer concentration in the estuary in both the shallow and deep layer because of the balance between the sinking tracer and vertical mixing. When incorporating a biological model to evaluate sinking detritus, we also see this phenomenon with the peak detritus concentration in the estuary (Figure 7). Increasing detritus sinking speed leads to an increased detritus peak concentration that moves closer to the river end of the estuary ( X = 0 k m ). Also, the detritus grows unbounded (does not reach steady state) with a sinking speed above w s = 40 m d 1 .
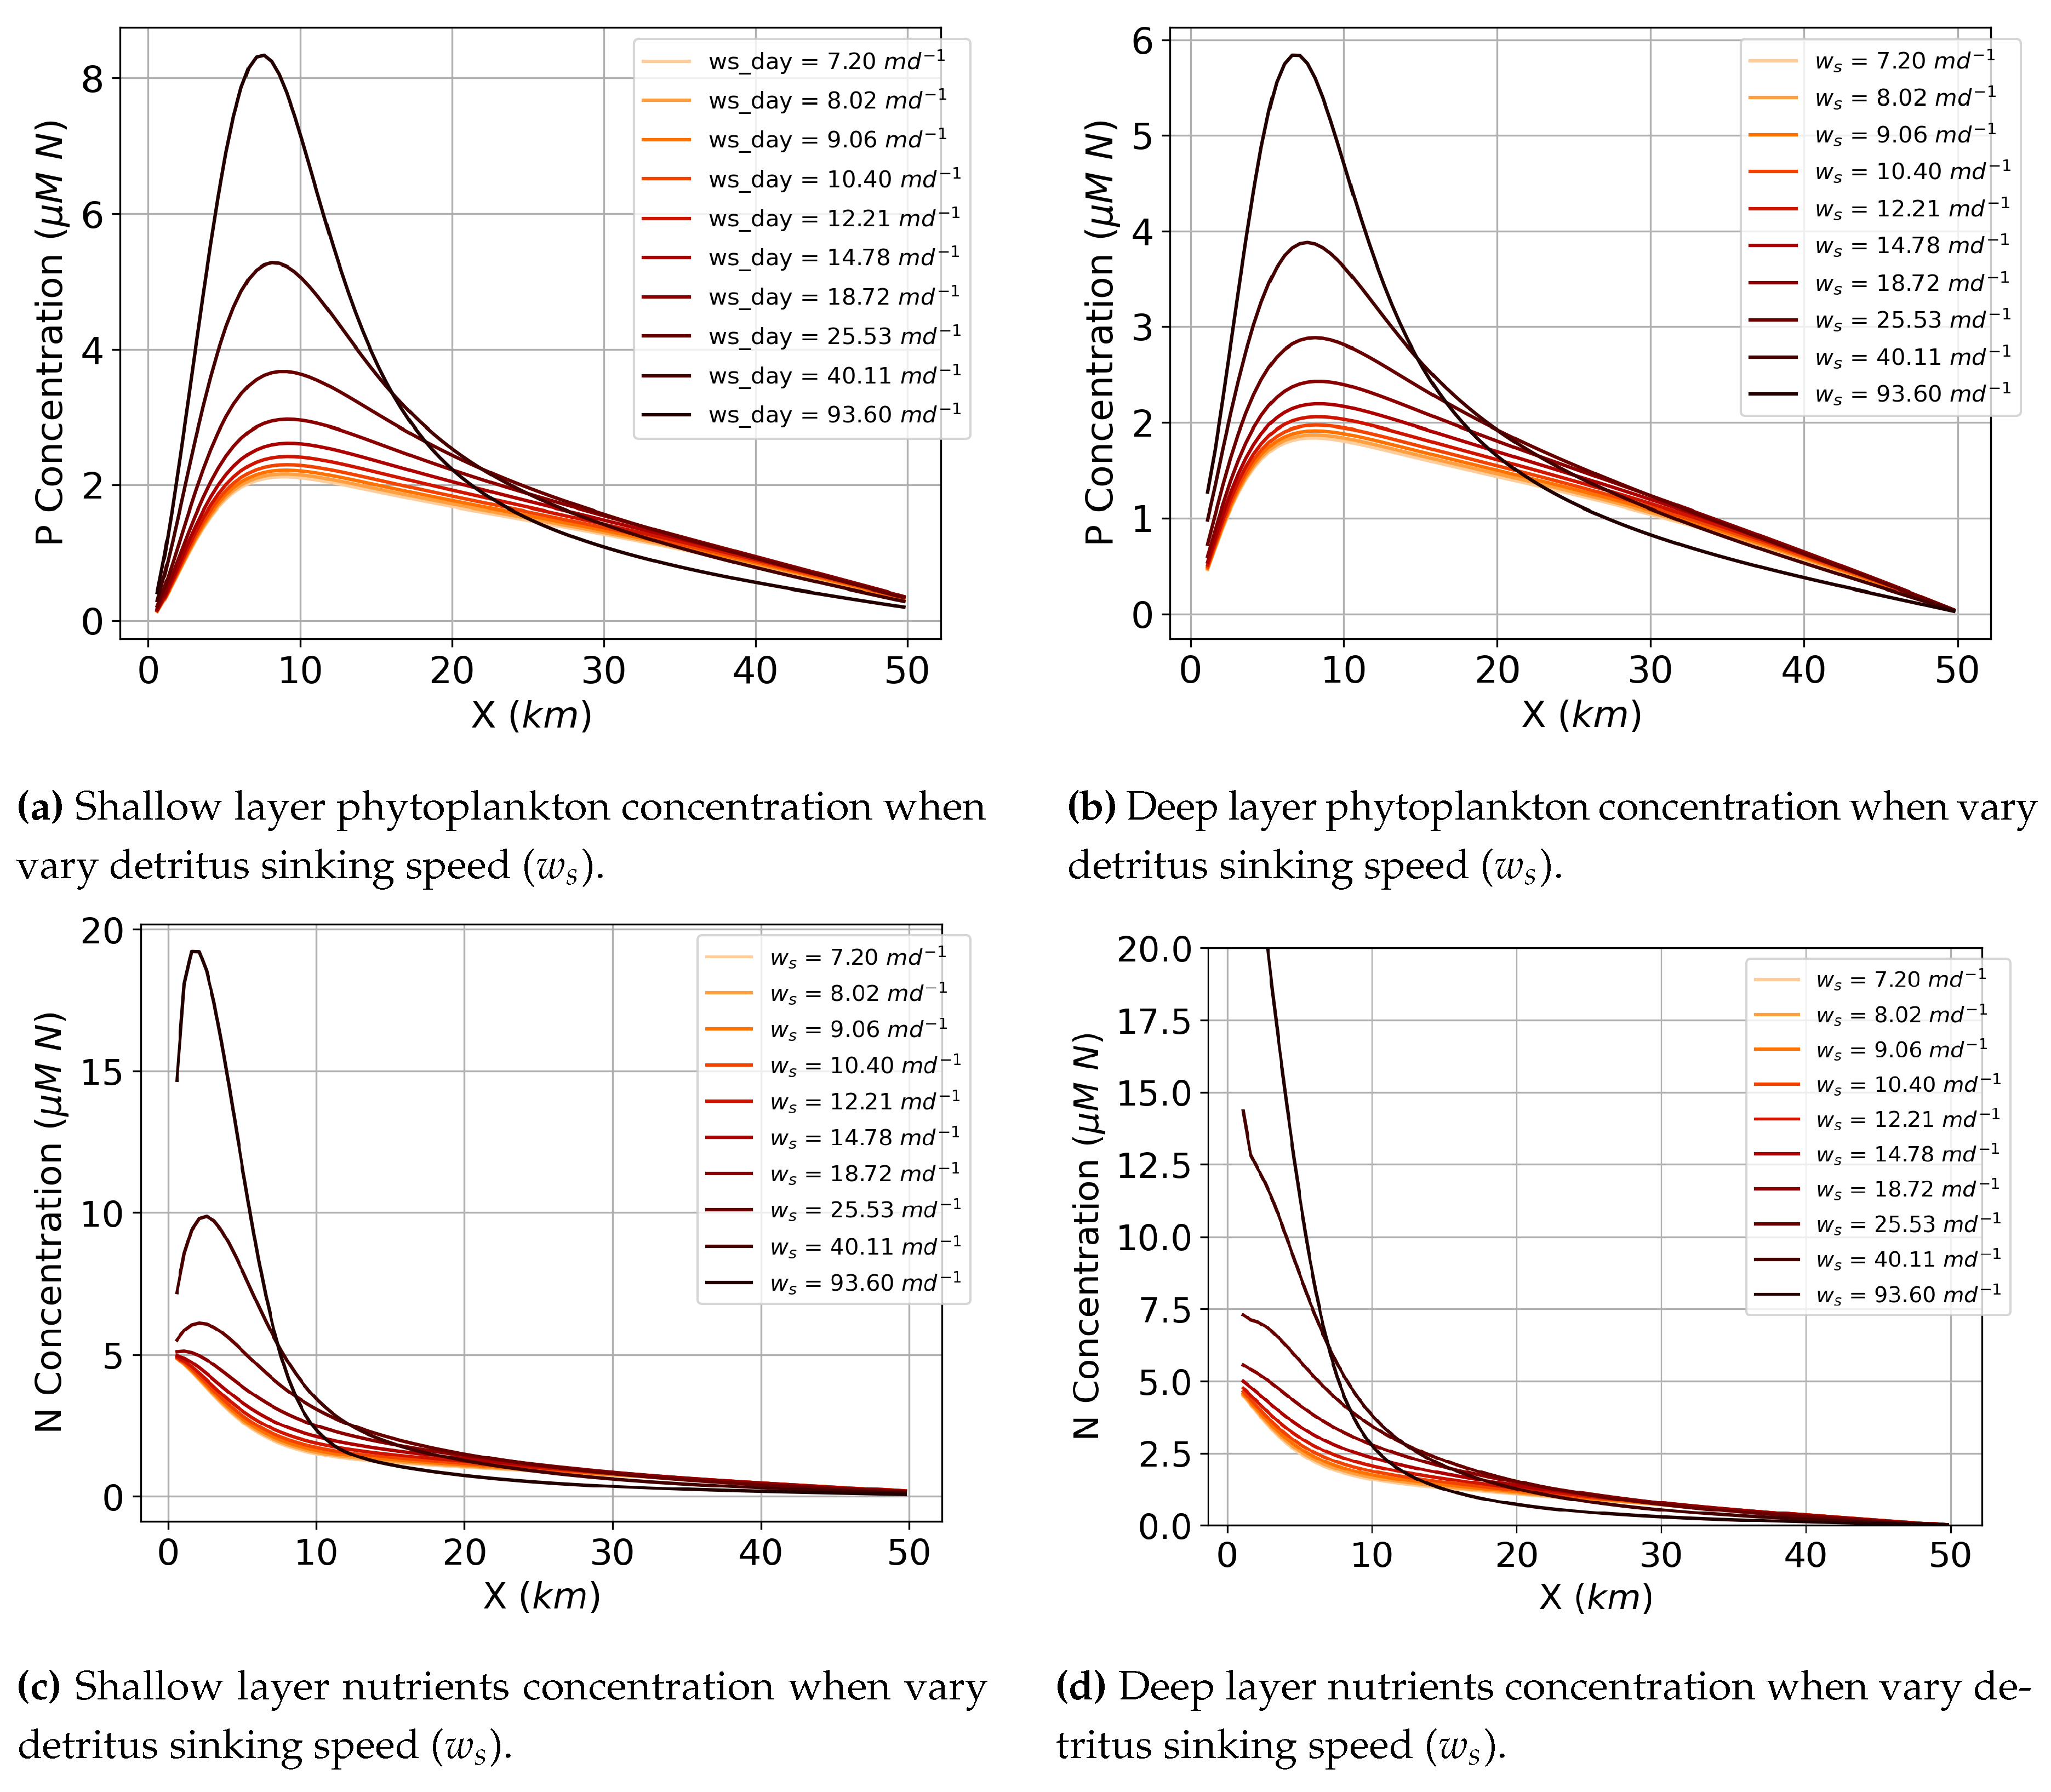
Increasing the sinking rate ( w s ) of detritus from the shallow to the deep layer leads to an increase in phytoplankton (P) concentration in both the shallow and deep layer (Figure 8a and Figure 8b) for all sinking speeds. P concentration reaches a maximum in both the shallow and deep layer at around X = 8 k m and the location of this peak does not significantly change with increasing sinking speed, contrary to the peak detritus concentration. Nutrients concentration follows a similar pattern: increasing detritus sinking speed leads to increased nutrient concentrations with peaks that do not move with increased sinking speed. Peak nutrient concentration occurs between 0-5 k m .
Increased detritus influences phytoplankton and nutrients peak concentration because more detritus accumulating in one spot of the estuary leads to more nutrients available to the phytoplankton via remineralization. As long as the location of the nutrients does not change, which is the case with increasing detritus sinking speed and constant remineralization rate (Figure 8c and Figure 8d), the location of the phytoplankton will not change. Increasing nutrients does not change the rate of nutrients uptake by the phytoplankton and thus does not change the location of the peak. But, their peaks themselves increase with the increase in detritus/nutrients supply.
As demonstrated above, the passive tracer accumulates indefinitely for sinking speeds greater than 15 m d 1 due to the balance of the sinking and vertical mixing flux. With biology, however, there are additional fluxes keeping the concentration from growing indefinitely (growth, grazing, remineralization, etc.). Thus, detritus and nutrients grow unbounded for sinking speeds greater than 40 m d 1 in the deep layer, but phytoplankton does not grow unbounded regardless of sinking speed. This is because there is a carrying capacity represented in the Michaelis-Menten phytoplankton growth expression (Eq. 8) which restricts unlimited phytoplankton growth even with unlimited nutrients N k s + N where k s is half-saturation N uptake by P. We explore the interplay of these physical-biological interactions in the following timescales section.
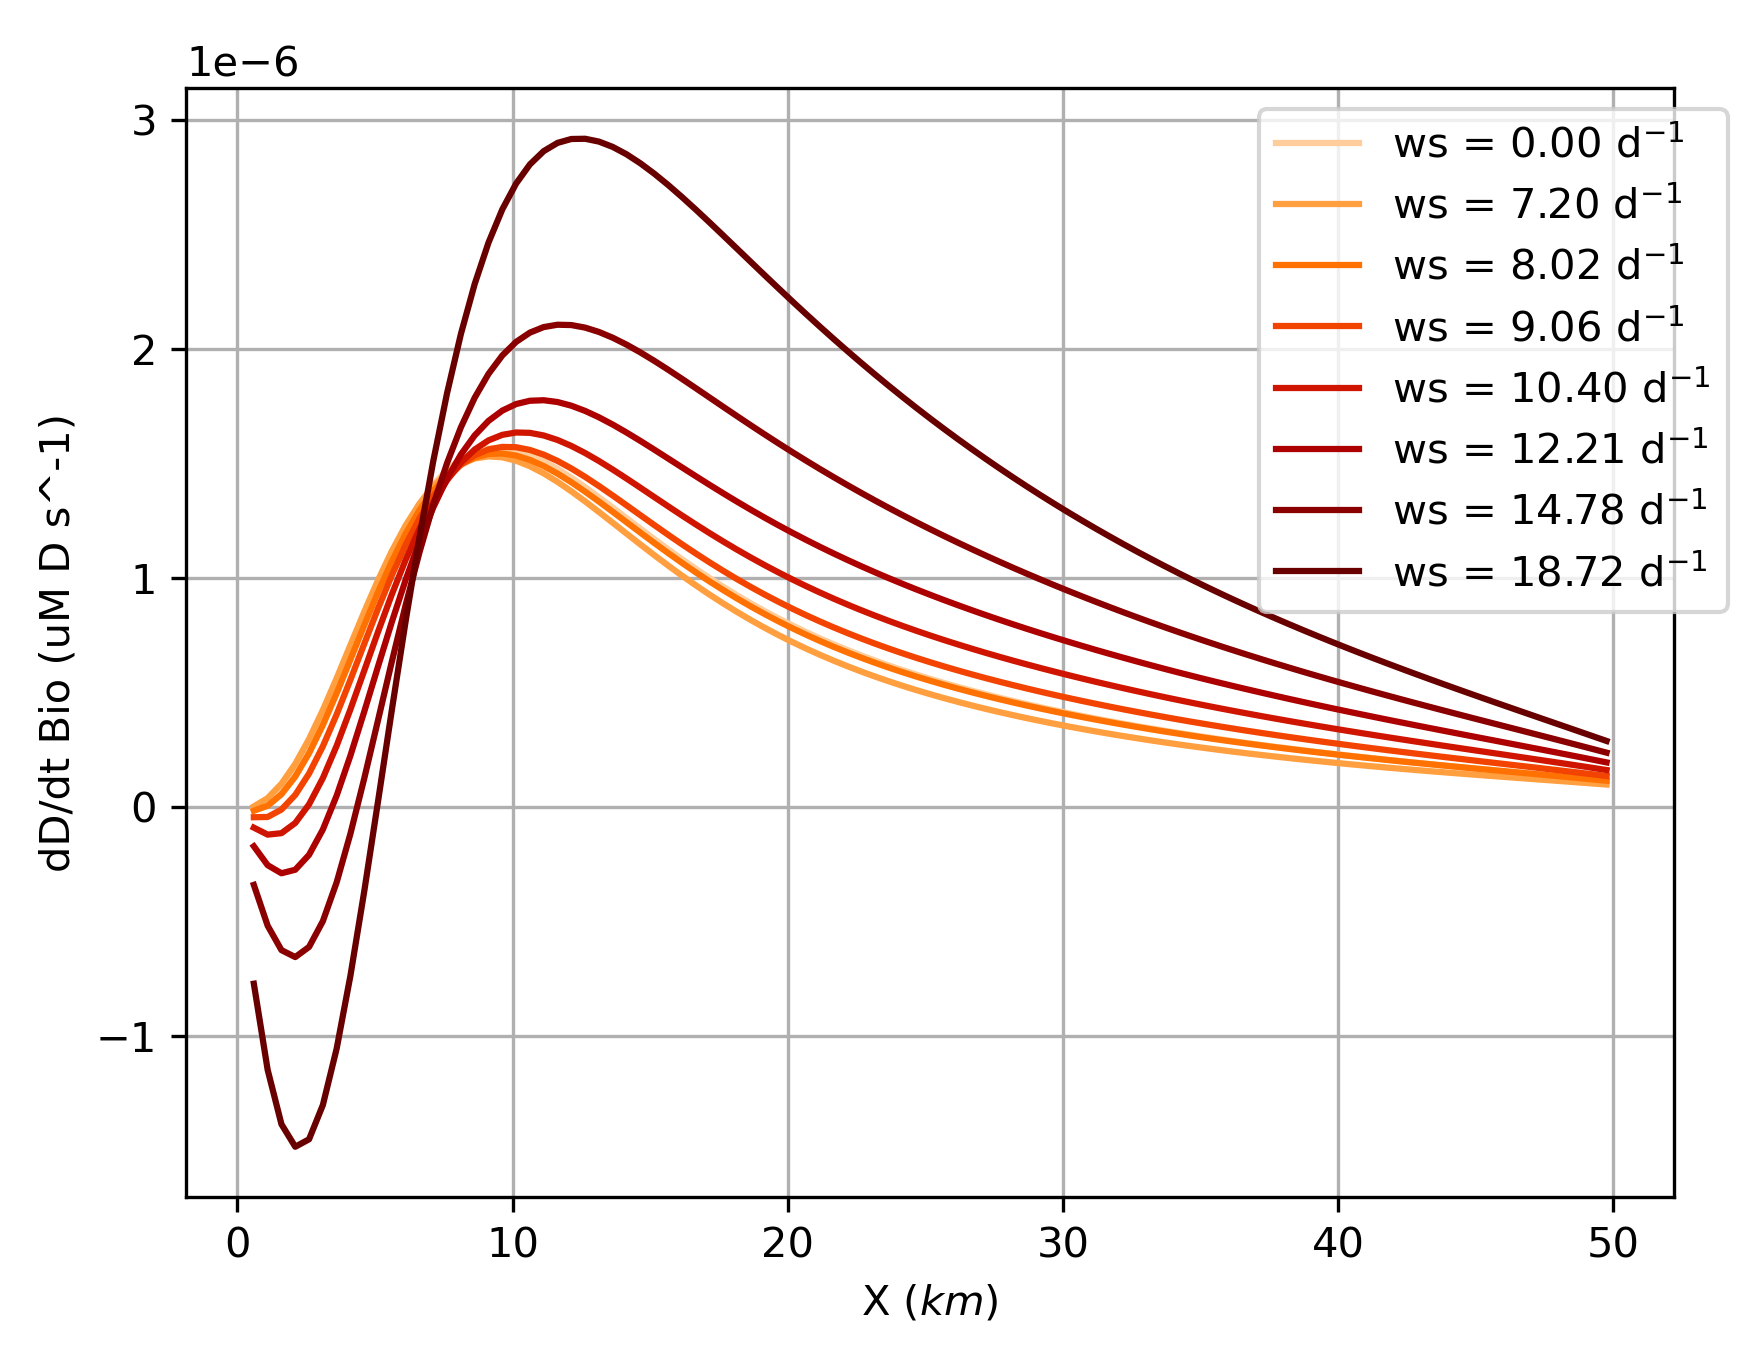
Interestingly, the peak detritus location moves closer to the river with higher detritus sinking speeds even though we only source nutrients in the river, not detritus. Phytoplankton will follow from the nutrients based on its growth rate, and zooplankton will then do the same following the phytoplankton. Detritus is sourced from where concentrations of phytoplankton and zooplankton are high. Where the detritus is formed via biological processes is then the source of the sinking tracer as in Figure 6, and as occurs with the sinking tracer the interaction of the detritus sinking and exchange flow lead to accumulation. Figure 9 shows the biological contribution to d D d t which include sources from zooplankton ”messy eating", phytoplankton and zooplankton mortality, and sinks from remineralization (Eqs. 7 and 11). This demonstrates that the source for the detritus is shifted 8 15 k m downstream of the river mouth and distributed over a broader reach of the estuary, as compared to the river-sourced sinking tracer considered in the previous section. Regardless, the peak detritus is positions based on a balance between efflux and sinking, which occurs near X = 0 k m , especially for larger sinking speeds, which results in a location for the peak detritus concentration that moves upstream as sinking increases. This is further explored with the timescales analysis in the following section.

4. Discussion: Timescales Analysis

To understand the processes which are leading to the different concentration states, we perform a timescales analysis below. First we define the timescales we will use in our analysis, and then we present the analysis for both the sinking tracer and sinking detritus timescales. For this discussion we focus only on the cases that reach steady state.

4.1. Timescales Definitions

We introduce the following timescales which are used in the analysis of the sinking tracer and sinking detritus in the estuary. The timescales are detailed below and summarized in Table 2.
We first introduce a sinking timescale, or the time it takes for the concentration to sink from the shallow to the deep layer:
τ s i n k = h s w s
where h s is the height of the shallow layer and w s is the sinking speed. Next are timescales for the vertical mixing, or the time for concentration to efflux up to the shallow from the deep layer ( τ e f f ) and the time for concentration to reflux down from the shallow layer to the deep ( τ r e f ). These timescales are calculated at each box and thus are determined at location i:
τ e f f i = d V s Q e f f n e t = d V s q s i 1 a s i 1 + q d i + 1 a d i + 1 τ r e f i = d V d Q r e f n e t = d V d q s i 1 a s i 1 q d i + 1 a d i + 1
where d V s is the volume of each box in the shallow layer, d V d is the volume of each box in the deep layer, Q e f f n e t is the net flow from the deep to the shallow layer, and Q r e f n e t is the net flow from the shallow to the deep layer. Q e f f n e t and Q r e f n e t are defined as the net vertical flow in either direction. So, looking at the vertical arrows in Figure 2, the net flux upwards is Q e f f n e t = q s i 1 a s i 1 + q d i + 1 a d i + 1 and the net flux downwards is Q r e f n e t = q s i 1 a s i 1 q d i + 1 a d i + 1 where the fluxes and fractions (q and a) are defined in Eqs. 2 and 4. There are also timescales for the flow of the estuary, or the time for the concentration to flow out towards the ocean ( τ o u t ) and the time for the concentration to flow in towards the river ( τ i n ) at location i. We calculated these timescales using the volume of each box over the flow at those boxes:
τ o u t i = d V s Q s i τ i n i = d V d Q d i
where d V s is the volume of each box in the shallow layer, d V d is the volume of each box in the deep layer, and Q s is the flow out of the estuary at location i and Q d is the flow into the estuary at location i as defined in Eq. 3. Lastly, we introduce an estuarine dispersion timescale ( τ d i s p ), or the time for the concentration peak to be reduced by longitudinal and vertical mixing alone at location i. We start with a definition for the timescale [19]:
τ d i s p i = L 2 K d i s p i = V a s i 1 q s i 1 + a d i + 1 q d i + 1 ( 1 a s i 1 ) q s i 1 + ( 1 a d i + 1 ) q d i + 1 2
where L is the length of the estuary, V is the total volume of the estuary ( V = B H L ), H is the total height of the estuary ( H = h s + h d ), K d i s p is the estuarine dispersion coefficient, and a and Q are defined as in Eqs. 2, 3, and 4. We solve for K d i s p using the following equations:
K d i s p = u 2 H 2 K z u = Δ Q x B H Q i n n e t + Q o u t n e t B H K z = Q z H B L Q e f f + Q r e f H B L K d i s p = Q i n n e t + Q o u t n e t 2 Q e f f + Q r e f L B H K d i s p i = ( 1 a s i 1 ) q s i 1 + ( 1 a d i + 1 ) q d i + 1 2 a s i 1 q s i 1 + a d i + 1 q d i + 1 L B H
where u is the velocity in the estuary in the x-direction, H is the total height of the estuary ( H = h s + h d ), Δ Q x is the difference in horizontal flow, Q i n n e t is the net flow moving into the estuary defined by the fraction not being effluxed up and Q o u t n e t is the net flow moving out of the estuary defined by the fraction not refluxed down, K z is vertical eddy diffusivity, Q z is all vertical flow, Q e f f is the flow moving upwards and Q r e f is the flow moving downwards.
Since we are only focusing on the effects of detritus settling speed in this study, we use only biological timescales within the Peter-Parker Model that relate to detritus in addition to the same timescales as above. We rewrite the detritus equation from the NPZD model (Eq. 7):
d D d t = ( 1 ϵ ) f e g e s t I ( P ) Z + m P + ξ Z 2 r D w s d D d z
where D is detritus, ϵ is zooplankton growth efficiency, f e g e s t is the fraction of losses egested of phytoplankton by zooplankton (“messy eating"), I is zooplankton ingestion/grazing of phytoplankton, r is remineralization rate of detritus to nutrients, m is non-grazing phytoplankton mortality, ξ is zooplankton mortality, and w s is detritus sinking rate [12].
We start with the messy eating timescale, or the time it takes for bits of phytoplankton missed by zooplankton to become detritus:
τ m e s s y , ( s , d ) i = 1 ( 1 ϵ ) f e g e s t I s , d i
where I s , d i is the zooplankton grazing rate of phytoplankton at location i in both the shallow (s) and deep (d) layer as defined in Eq. 9. The time for phytoplankton to die from causes other than grazing (mortality timescale) is:
τ P m o r t = 1 m
Similarly, the time for zooplankton to die from higher predation or other mortality is:
τ Z m o r t , ( s , d ) = Z s , d i ξ
This timescale depends on the current concentration of zooplankton to accommodate the units of ξ . Lastly, the remineralization timescale or the time for detritus to turn into nutrients is:
τ r e m i n = 1 r
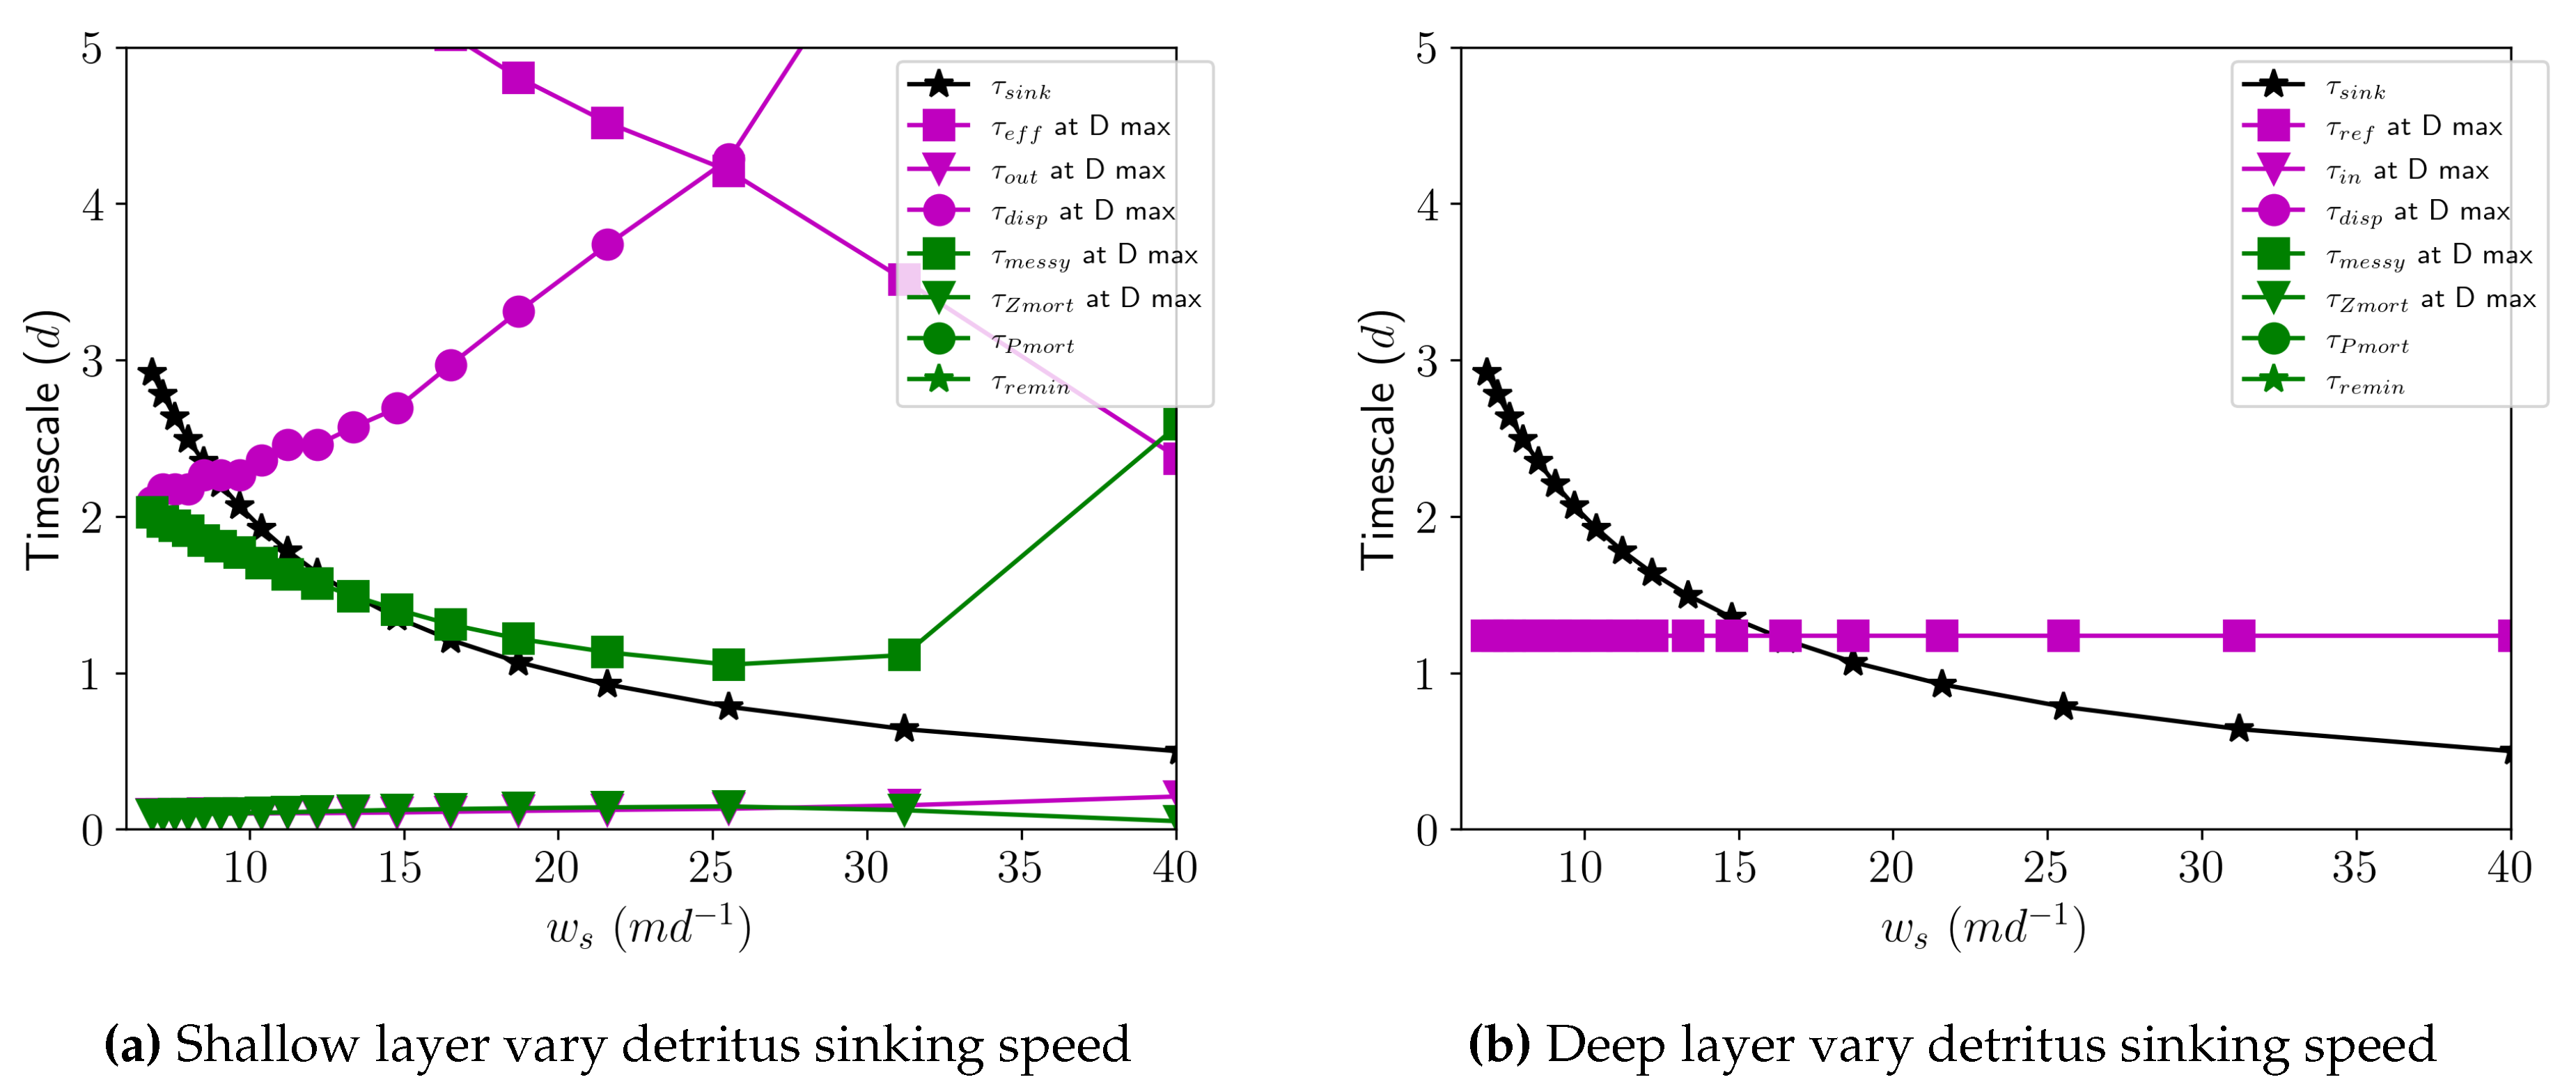
All of these timescales are summarized in Table 2. We will use the timescales to directly compare the processes contributing to the sinking tracer and detritus concentration. A faster timescale means that process is the fastest to occur and is dominant in determining the ETM.

4.2. Sinking Tracer Timescales

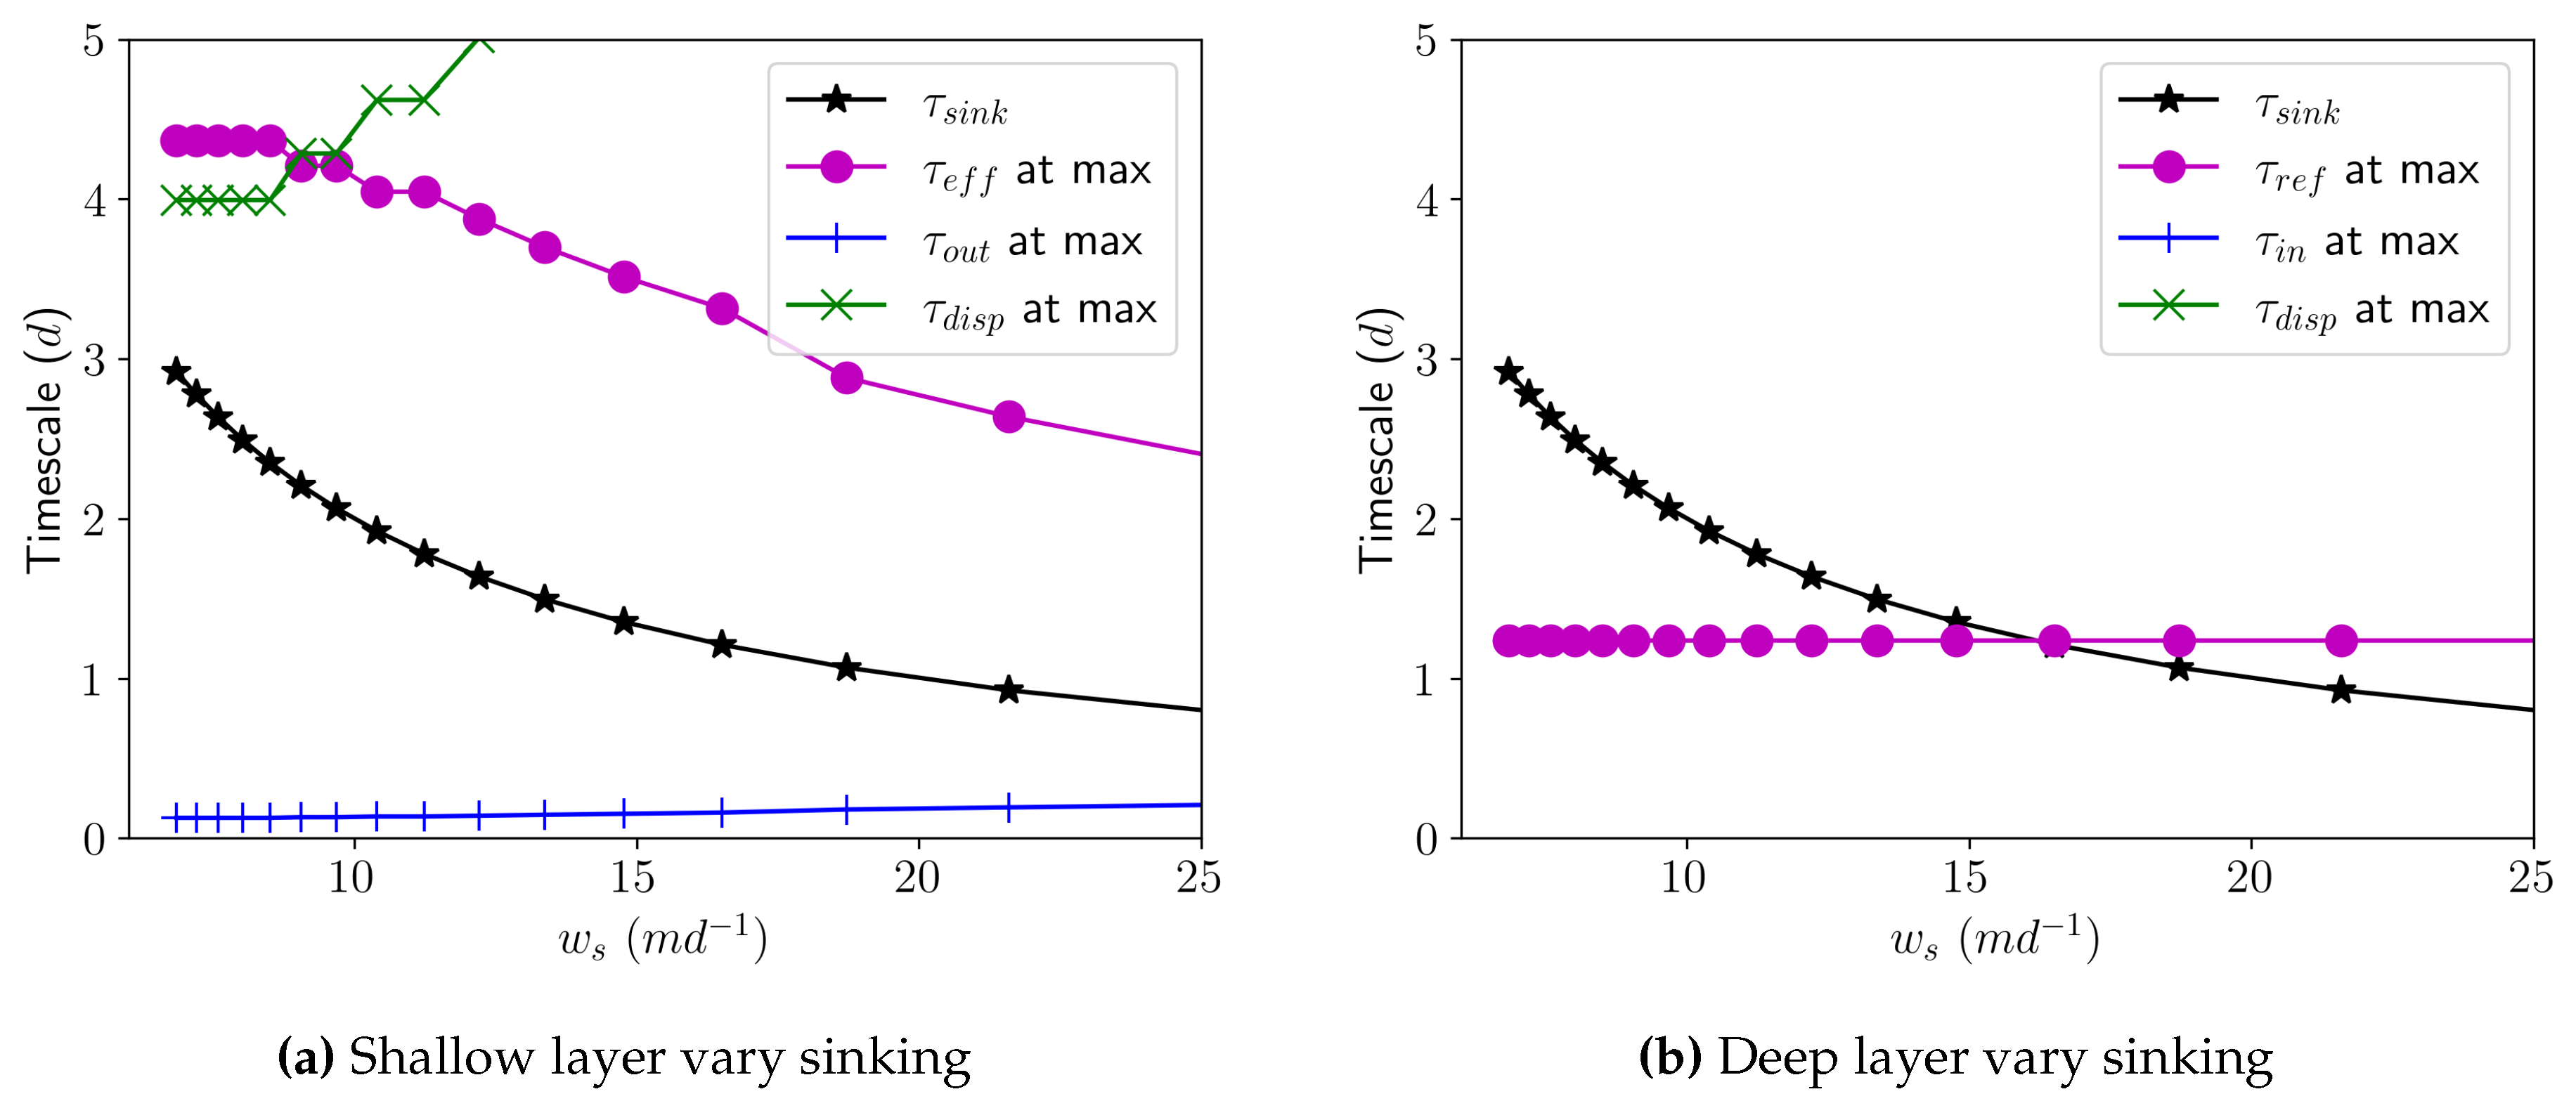
Looking at the timescales while changing sinking speed of the tracer only (Figure 10), the fastest (smallest value) timescale is the longitudinal exchange ( τ o u t , blue pluses) in the shallow layer when w s 7 30 m d 1 . This means the dominant process leading to the concentration profile at this sinking speed in the shallow layer estuary is longitudinal exchange. In the shallow layer, the sinking timescale ( τ s i n k , black stars) becomes faster with increasing sinking speed but is always the second fastest timescale. In the deep layer, the sinking timescale passes the reflux timescale as the fastest when w s 17 m d 1 , which also corresponds to when the system no longer reaches a steady state. Thus, the balance between vertical mixing and settling is critical in determining when the model gets to a steady state. In the shallow layer, the vertical mixing timescale ( τ e f f , purple dots) decreases with increasing sinking speed and gets closer in value to the sinking and longitudinal exchange timescales, so that process is becoming more important with increasing sinking speed. The dispersion timescale ( τ d i s p , green crosses) increases with increasing sinking speed, reflecting a reduction in the contribution of longitudinal dispersion that results in more “peaky" concentration distributions in Figure 6. We cut the vertical axis for these figures off at 5 days because timescales higher than this value are too extreme to be the relevant processes driving the outputs and we are only focusing on sinking speeds which reach steady state.

4.3. Sinking Detritus Timescales

In the shallow layer, Z mortality and longitudinal exchange are the fastest timescales for detritus sinking speeds less than 40 m d 1 (green and purple triangle, Figure 11). The sinking timescale decreases with increasing sinking speed, however, and therefore increases with influence on the detritus concentration. This highlights the interplay of sinking speed and the D concentration. A faster sinking speed corresponds to a larger sinking timescale, which means there is more time for the peak concentrations to spread out. In the deep layer, the vertical mixing timescale is the fastest until w s 17 m d 1 , after which sinking is the fastest timescale. This is the same thing that happens with the sinking tracer in the deep layer as well, highlighting that physical processes are the most significant for detritus concentration in the deep layer. However, the D concentration stops reaching a steady state above 40 m d 1 , not 17 m d 1 when the sinking speed surpasses the vertical mixing and the sinking tracer stops reaching the steady state. The biological processes in the shallow layer are thus playing an important role in maintaining the steady state of the detritus.

4.4. Sinking Tracer vs Sinking Detritus

Several differences occur between the accumulation of sinking tracers or detritus as discussed in the previous section. For one, the lack of a settling velocity ( w s = 0 m d 1 ) does not mean there is no detritus accumulation (Figure 7) like it does for the non-biological sinking tracer (Figure 6) because there are other sources that can lead to detritus accumulation besides just sinking (P mortality, messy eating, etc.). Also, detritus accumulates and reaches a steady state up to a sinking speed of 40 m d 1 , whereas the sinking speed of the sinking tracer accumulates unbounded for sinking speeds greater than w s = 15 m d 1 . This shows that sinking detritus have a larger range of sinking speeds which accumulate in the estuary before growing unbounded than a sinking tracer due to how detritus interacts in an ecosystem in addition to sinking via zooplankton/phytoplankton sources or nutrients remineralization losses (Eq. 7).
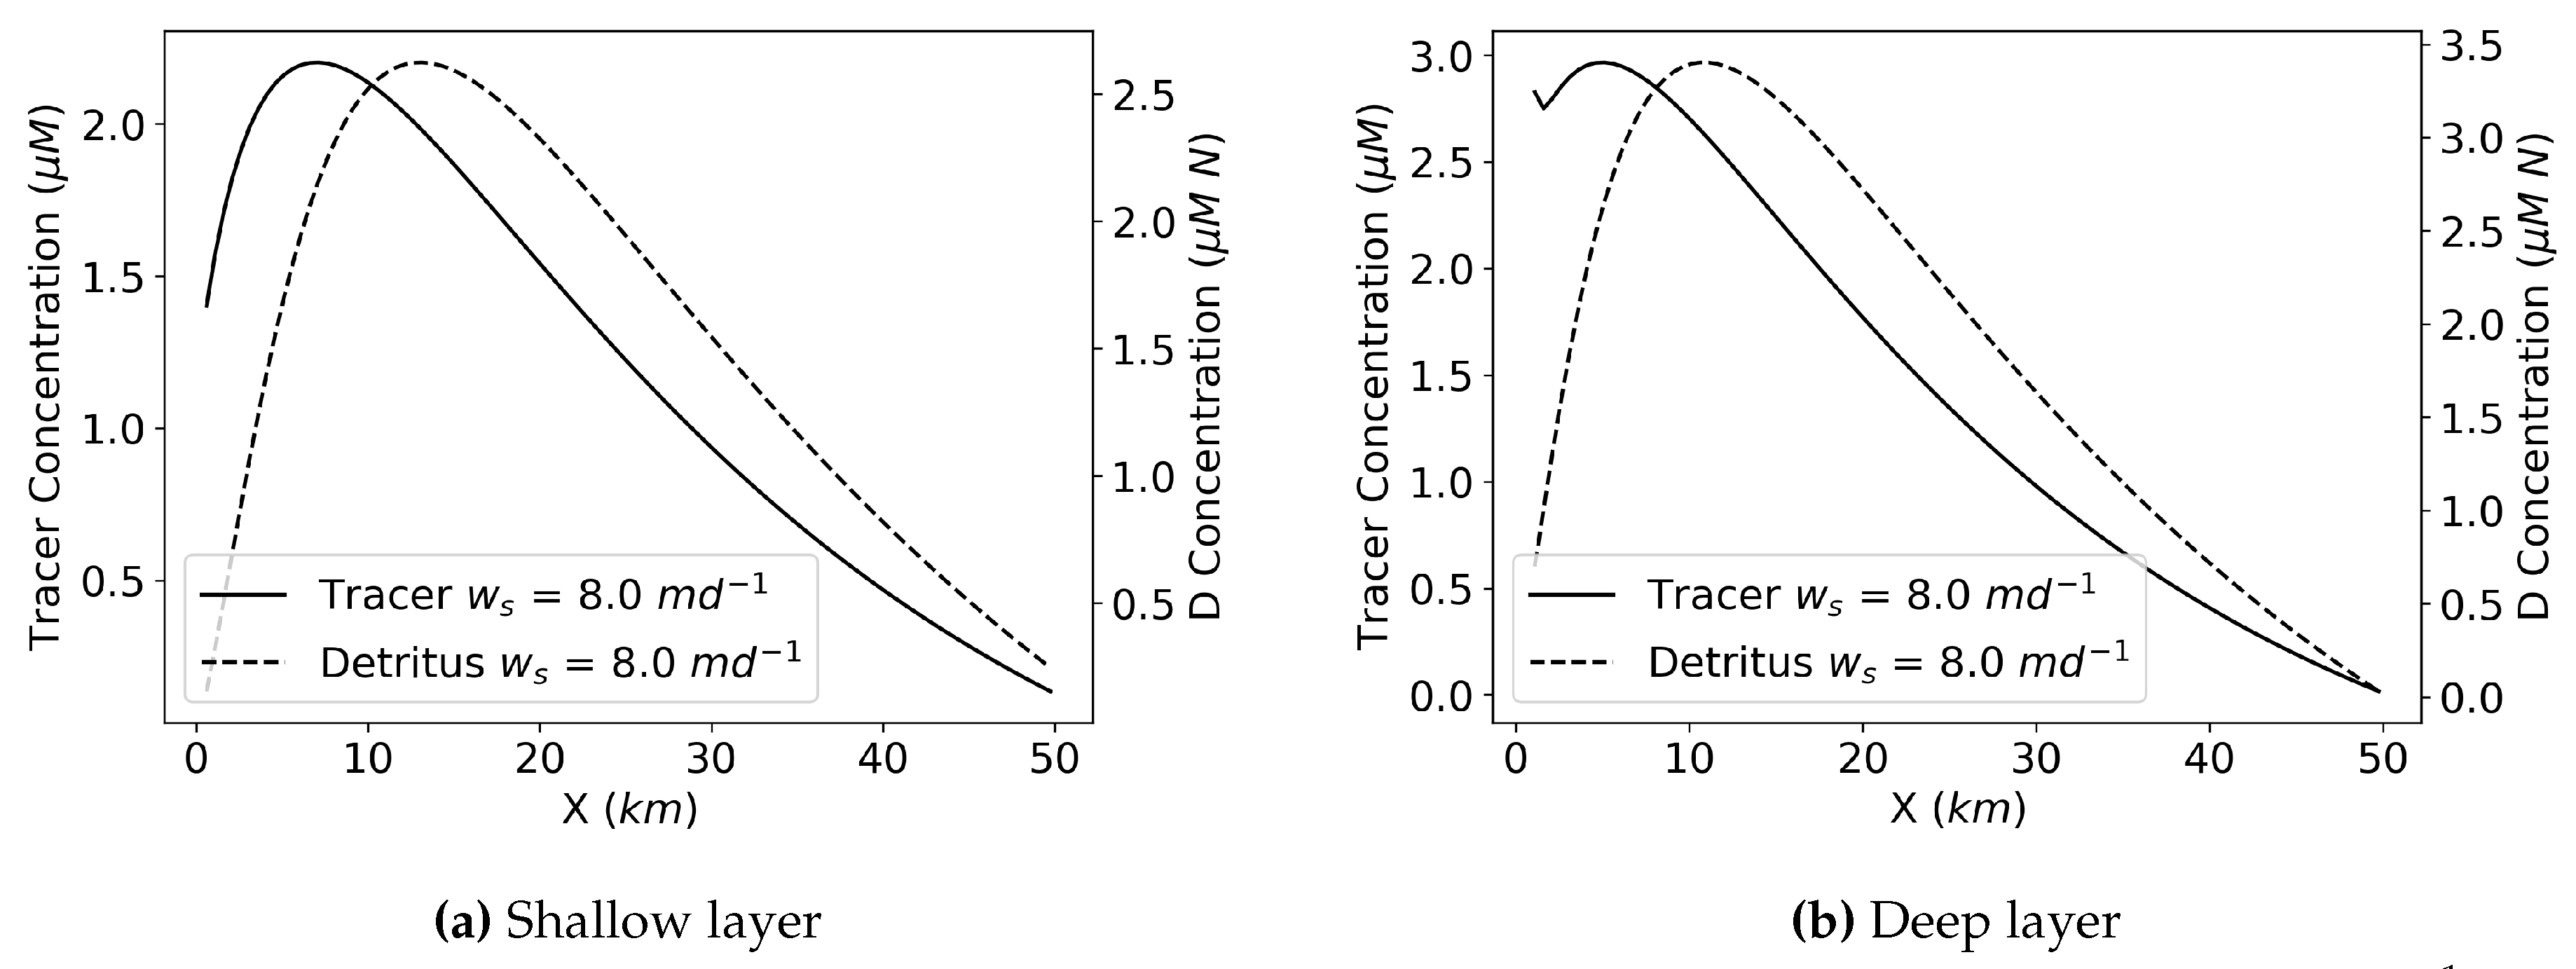
In addition, peak locations of tracer and detritus accumulations differ with the same sinking speed (Figure 12). In this example, the sinking tracer peak location is closer to the river end of the estuary ( X = 0 k m ) than the peak detritus (for w s = 8 m d 1 ). If settling velocity were to be increased (or decreased), the peaks would shift up-estuary (down-estuary) due to the vertical cycling between the two layers and the required balance between efflux and settling for the peak to establish. In all cases, however, the detritus peak is shifted down-estuary due to the fact that its source is distributed along the upper layer through phytoplankton and zooplankton populations (Figure 9). The longitudinal shift in peak concentration (shown in Figure 12) introduces a new timescale that describes the characteristic ecosystem cycling time, as the system converts nutrients to phytoplankton to zooplankton and then into the detritus pool (acknowledging that some detritus is also formed directly from the phytoplankton). From the perspective of a water parcel that enters at the river, these ecological processes can be thought of as a time-lag in the creation of detritus.
We further quantify the difference in these peak locations with the following timescale:
τ d i f f = ( X D m a x X C m a x ) B L Q f l u s h
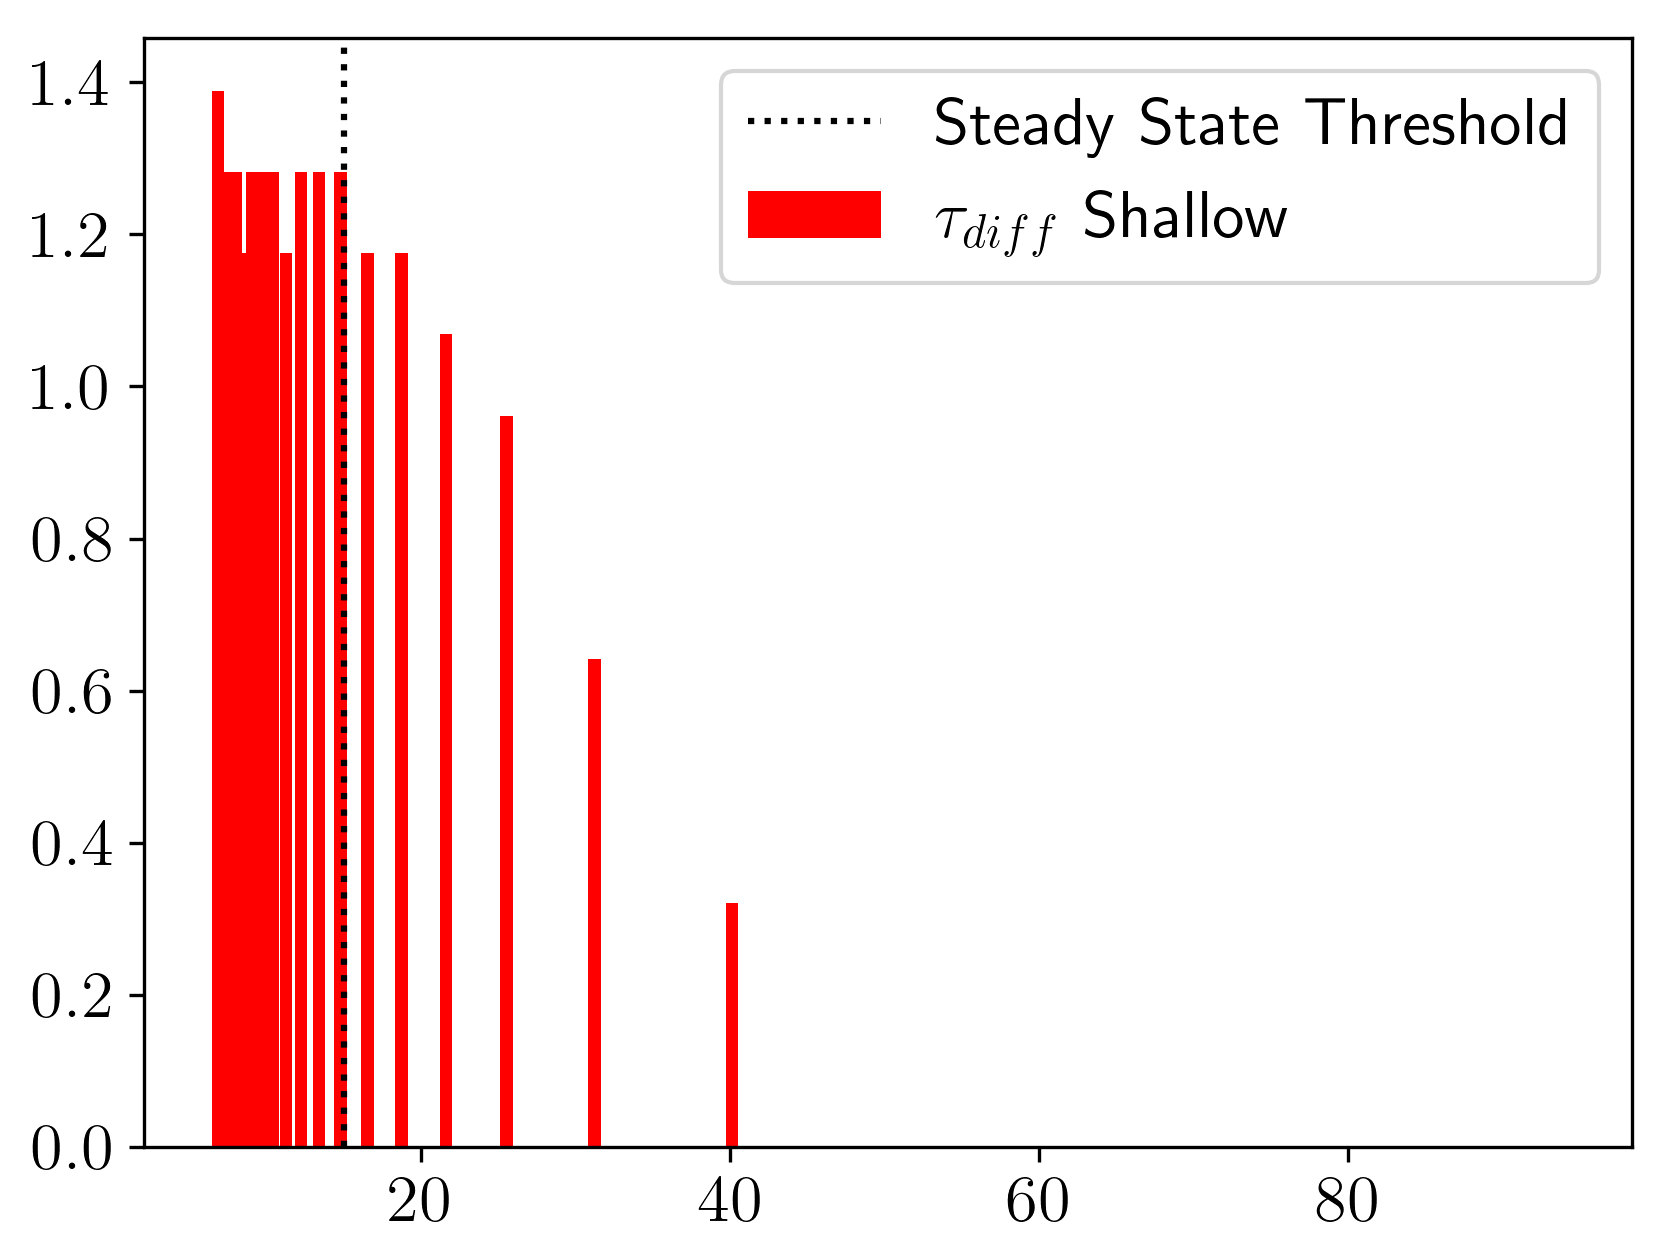
where τ d i f f is the lag timescale which leads to the difference between the peak locations at the same sinking speed, X D m a x is the X location of the peak D (detritus) concentration, X C m a x is the X location of the peak C (tracer) concentration, B is estuary width, L is estuary length, and Q f l u s h is estuarine flushing. τ d i f f can be interpreted as a characteristic cycling time for the ecosystem.
We see in Figure 13 that in the shallow layer this timescale is clustered around 1.2 days, but then decreases as the settling velocity increases beyond the steady state transition. For these larger settling velocities the peak concentration of both detritus and sinking tracer is constrained by the boundary at X = 0 k m and thus this transport timescale is no longer relevant. For the cases with a steady-state and well-defined peak in detritus (settling velocity less than about 30 m d 1 ), it is clear that the ecosystem cycles from nutrients through phytoplankton and zooplankton into detritus with a characteristic timescale of a little over 1 day. At the same time, large settling velocities are able to reduce the longitudinal difference in the location of the peak (between detritus and non-biological setting tracers) due to the tight cycling between the upper and lower layers at the upstream end of the estuary (Figure 4).

5. Summarizing the Behavior with a Dimensionless Group

Through further evaluations of varying sinking speed ( w s ), estuarine flushing rate ( Q f l u s h ), estuary width (B), and river flow rate ( Q r ), we found that increasing sinking speed and width and decreasing flushing rate and river flow leads to increased ETM magnitude, but only up to certain values of each parameter before the system does not reach a steady state (see Appendix for additional details). Through dimensional analysis we obtained the following dimensionless group:
w s B L Q r 0.50 Q f l u s h Q r 0.75 = τ s i n k τ f l u s h 0.5 τ r i v τ f l u s h 0.25
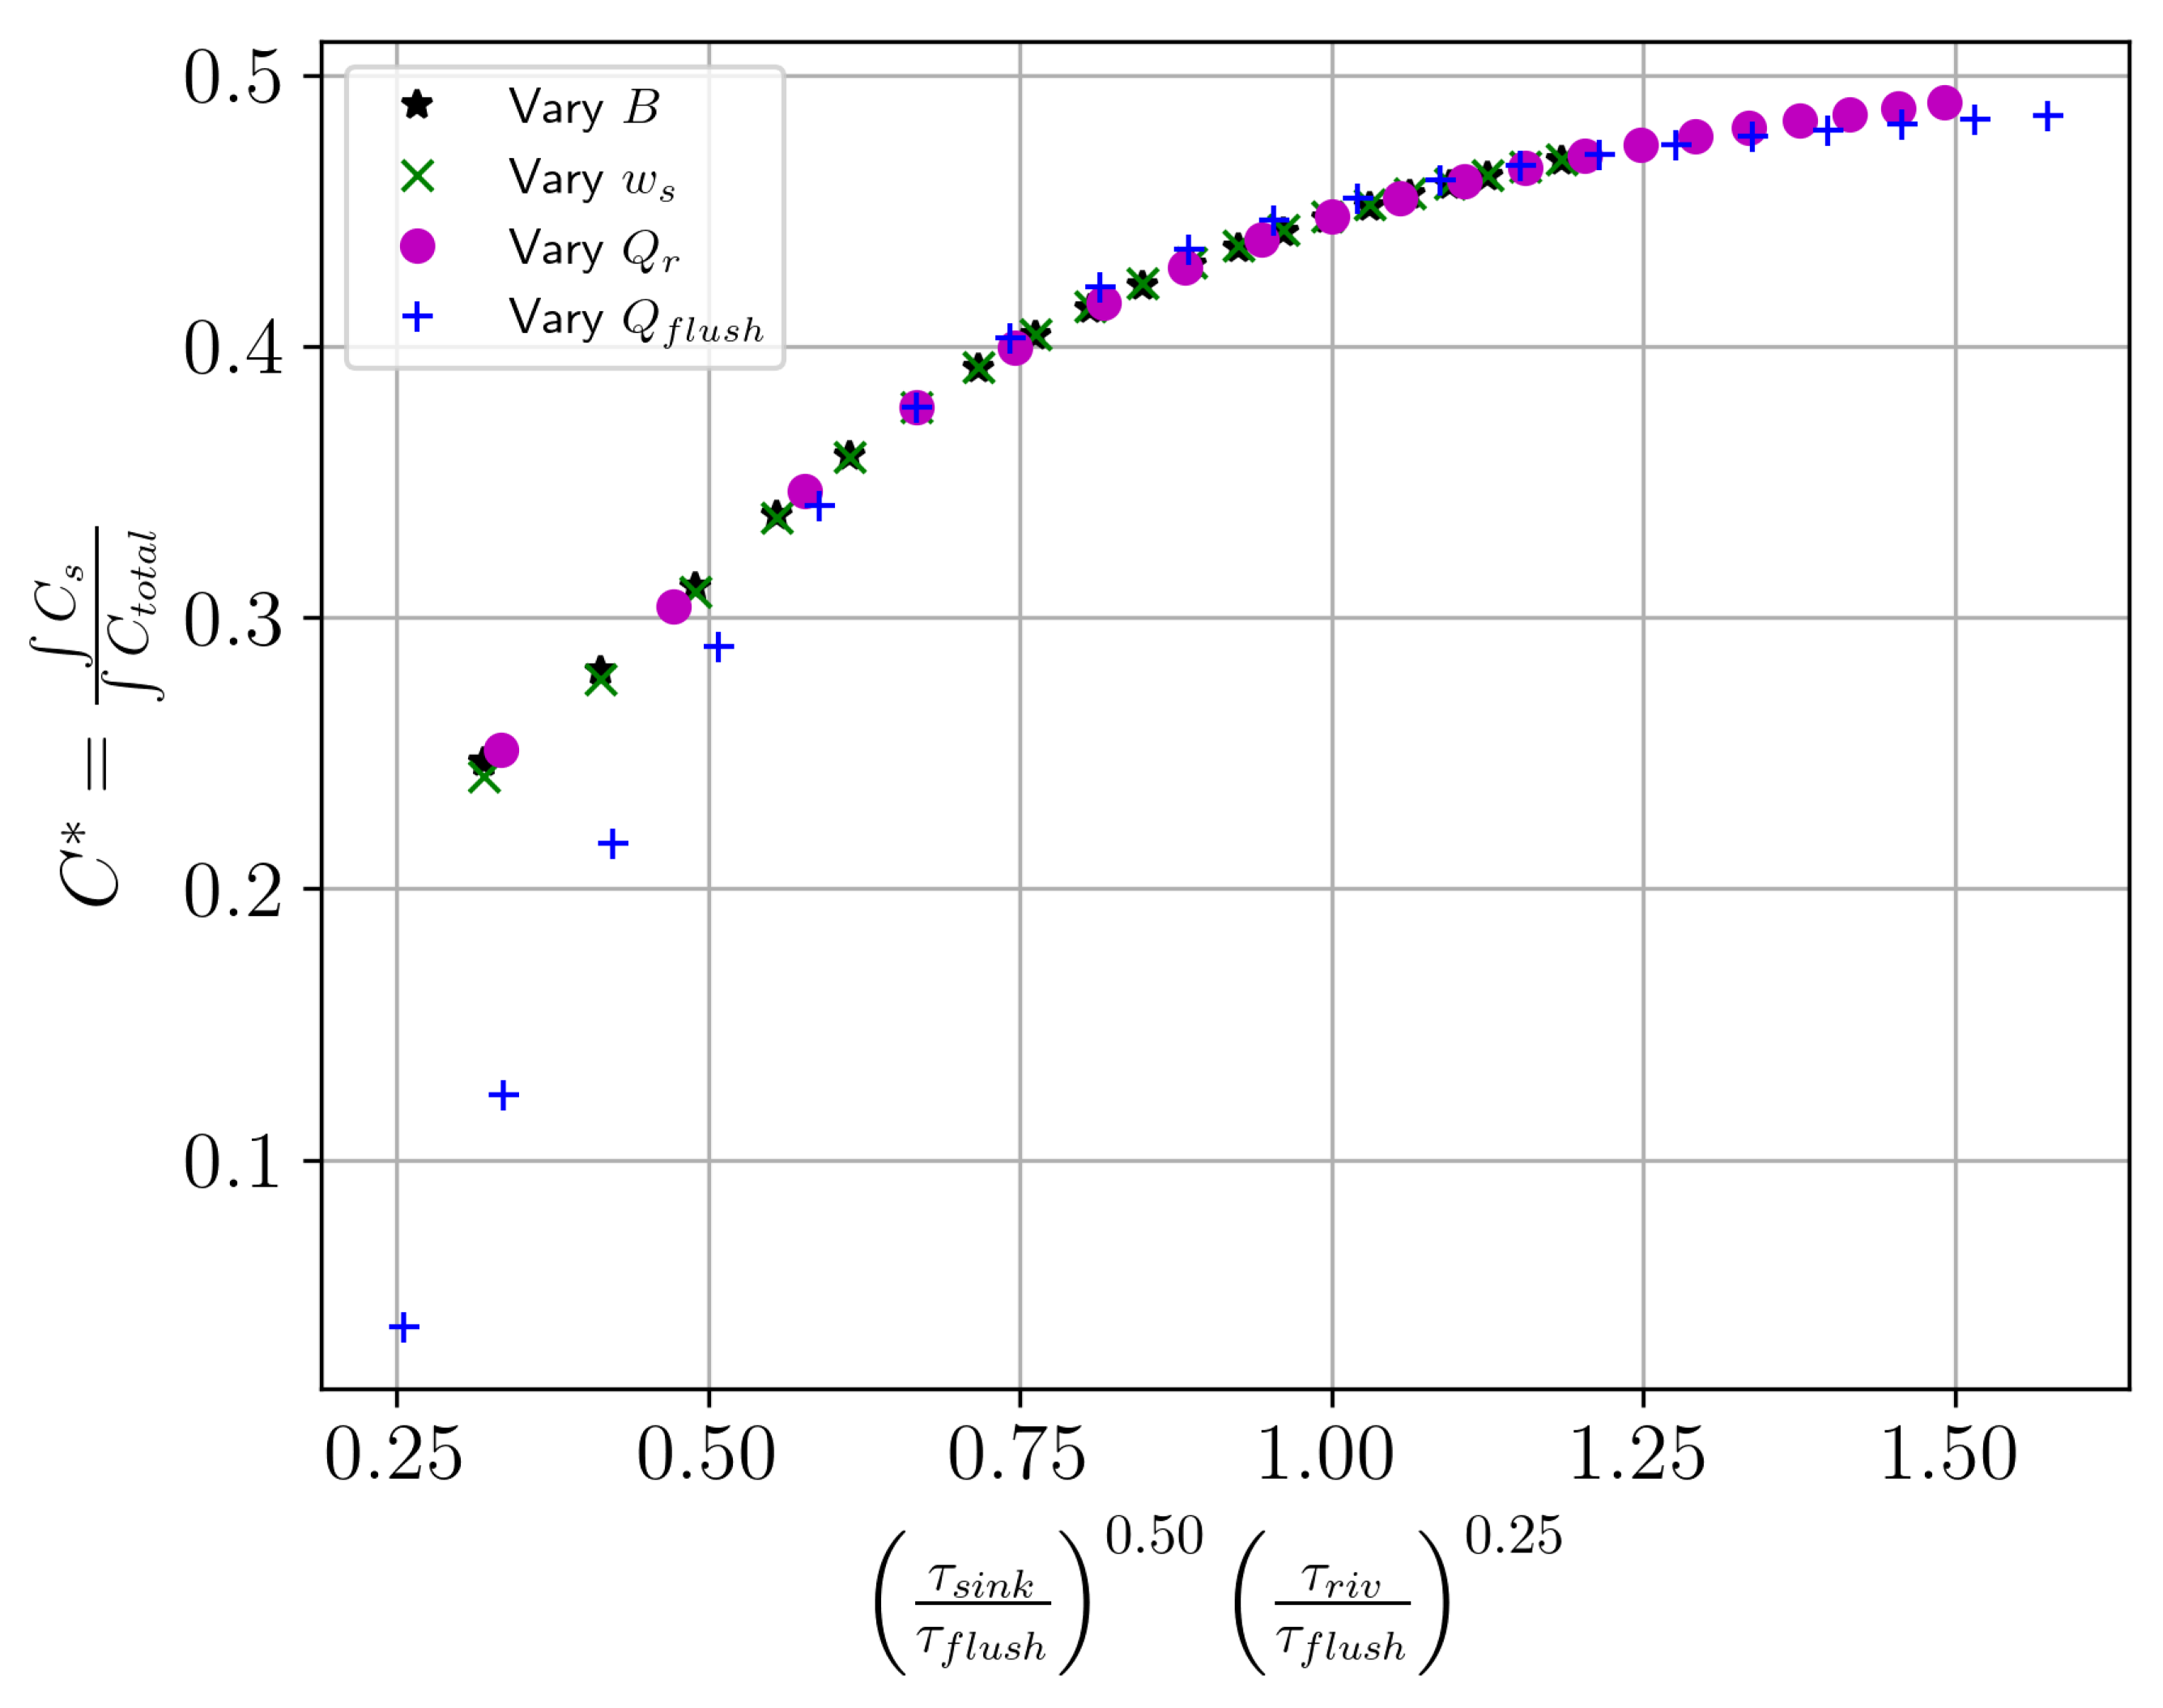
using general timescales τ r i v = V Q r , τ s i n k = h w s , and τ f l u s h = V Q f l u s h where V = B L h is total estuary volume and h is height. We validated this group by using the estuary length (L) as a constant parameter and dimensionless concentration ( C = C s C t o t a l ) which represents the shallow layer concentration normalized to the total (Figure 14). C focuses on the strength of the concentration peak in the estuary while taking away the x-dependence of the ETMs. The dimensionless concentration C increases as the shallow and total concentrations approach each other. Thus C alone does not tell us where the peak concentration is, but allows us to compare the state of concentration in the estuary. We performed this dimensionless analysis on both the sinking tracer and sinking detritus studies and found the outcomes to be similar, so we present the results from the tracer study only here to reduce redundancies.
Figure 14 shows that varying Q f l u s h , B, Q r , or w s will result in the same state in the estuary, C . This dimensionless group connects three timescales which represents three fluxes in the system: the estuarine flux, the sinking flux, and the river flux. The ratio of sinking to exchange flow and the ratio of river flow to exchange flow are the two drivers of the system - with the former having a stronger exponential dependence than the latter. So, increasing flushing has a similar effect as reducing sinking and increasing flushing has a similar effect to reducing river flow. These relationships are not one to one, so increasing flushing has a stronger effect than decreasing river flow or sinking. Flushing has this extra complexity because of how the flow is defined (Eq. 3): the in and outflow ( Q s and Q d ) depend on a fraction of the river flow that varies with the salinity difference taken at different locations in the estuary. Thus, unlike estuary width, sinking speed, and river flow, this parameter varies in space and cannot be combined with the others as cleanly.
This parameter informs the relative importance of particle sinking, estuary surface area, estuary flow, and river flow for accumulation of scalars in an estuary. As discussed above, particle sinking influences accumulation because of the interplay of sinking and vertical mixing. Varying estuarine flushing ( Q f l u s h ) rate also leads to accumulation because when the overall advection scheme is slower, the effects of the sinking tracers are more pronounced. In other words, if the estuary is flushing slower, the sinking tracer has more time to accumulate in the bottom layer. Thus, it is able to efflux back upwards with more ease and present more accumulation in both the shallow and deep layers. Accumulation occurs with varying estuarine surface area (B) due to similar logic as with reduced flushing rate; when the river flow is held constant, but the estuary is larger, the effects of the river on the longitudinal exchange in the estuary are reduced. Thus, the sinking tracer has more time to accumulate in both layers. Lastly, accumulation occurs with decreased river flow ( Q r ) for the same reason as altering estuary size and flushing; when the river is faster, the tracer has less time to settle and accumulate.

6. Conclusion

We would like to highlight several key findings from this work that establish the differences between ETM dynamics when considering a sinking tracer versus sinking detritus in an estuary. In both cases, concentration of sinking tracer or detritus accumulates in an estuary because the sinking of the tracer is in balance with the vertical mixing (efflux) of the system at some location along the estuary. Peak concentration of a river-sourced sinking tracer moves towards the river with increased sinking speed because it comes into balance with the efflux further upstream and creates a narrower vertical recirculation. Peak concentration of sinking detritus in a system where nutrients are sourced in the river moves towards the river with increased sinking speed as well, but the peak is displaced down-estuary. This shift in the position of the ETM is a result of the biological processes that govern the creation of detritus, which is tied to the peaks of phytoplankton and zooplankton. This shift in the peak is created by a temporal lag for nutrients to turn into detritus in the biological model. As nutrients are taken up by phytoplankton, which are, in turn, consumed by zooplankton, down-estuary transport in the surface layer means that the source of detritus (whether from messy eating or mortality) is shifted downstream from the river by a distance related to the surface layer advection and the characteristic cycling timescale of the ecosystem.
Accumulation increases until a distinct sinking speed for both sinking tracer and detritus, after which the peak does not reach a steady state. The sinking speed after which this happens is smaller for sinking tracer than detritus. The peak accumulates unbounded after the ratio of the sinking flux to the vertical flux passes 0.5 due to the retention of mass at the upstream boundary and the rapid recycling of a sinking tracer between the lower and upper layers (a balance between efflux and settling). It is interesting to note that the other components of the ecological model (phytoplankton, e.g.) maintain a steady state at the same sinking speed due to the other ecological controls on each component (grazing by zooplankton, e.g.).
We break apart the contributions of processes in our model by analyzing timescales. The fastest timescale indicates the process most influential on the concentration profiles. Longitudinal mixing is the shortest timescale for the sinking tracer in the shallow layer. In the deep layer the shortest timescale switches from vertical mixing to sinking at the same point the system switches from steady state to unbounded. With detritus, zooplankton mortality and longitudinal mixing are the fastest timescales in the shallow layer. In the deep layer the timescales are the same as the sinking tracer; this indicates that adding biology to the system influences the processes determining the concentration in the shallow layer. The shallow layer biology is influencing the deep layer concentration as the concentration profiles in the deep layer are not the same as the sinking tracer even though they have the same timescales.
The peak concentration occurs at a different location in the estuary at the same sinking speed because of the time lag of biological processes. This time lag is about 1 day for steady state cases, but it devolves for cases which grown unbounded because they all peak up-estuary at X = 0 k m where vertical mixing activity is the strongest.
Lastly, sinking tracer concentration depends on four different variables, which were summarized in a single nondimensional parameter (Section 5). This parameter allows us to directly compare the impacts of individual attributes of the estuary on ETMs. For instance, given an estuary of a certain size and river flow rate, we can determine how fast a particle needs to sink to accumulate.

Author Contributions

Conceptualization, L.E. and M.S.; methodology, L.E. and M.S.; software, L.E.; validation, L.E.; formal analysis, L.E. and M.S.; investigation, L.E. and M.S.; resources, L.E.; data curation, L.E.; writing—original draft preparation, L.E.; writing—review and editing, M.S.; visualization, L.E.; supervision, M.S.; project administration, M.S.; funding acquisition, L.E. and M.S. All authors have read and agreed to the published version of the manuscript.

Funding

L.E. and M.S. would like to acknowledge National Science Foundation Graduate Research Fellowship Program (NSF-GRFP) for funding this work under grant DGE2146752.

Data Availability Statement

Data can be reproduced using modeling scripts at the following GitHub repository: lmengel422/The-Peter-Parker-Model, DOI: 10.5281/zenodo.12169937.

Acknowledgments

L.E. named the Peter-Parker Model after two great mentors during her PhD, Peter J.S. Franks and Parker MacCready. They were instrumental for inspiration, assistance with model setup, and overall advice; huge thanks to them both. Thanks also to Albert Ruhi and Evan Variano for editorial suggestions of a previous version of this manuscript.

Conflicts of Interest

The authors declare no conflicts of interest.

Abbreviations

The following abbreviations are used in this manuscript:
ETM Estuarine Turbidity Maximum
NPZD Nutrient-Phytoplankton-Zooplankton-Detritus
SPM Suspended Particulate Matter
TEF Total Exchange Flow

Appendix A

Appendix A.1. Varying Flushing, River flow, and Estuary Surface Area
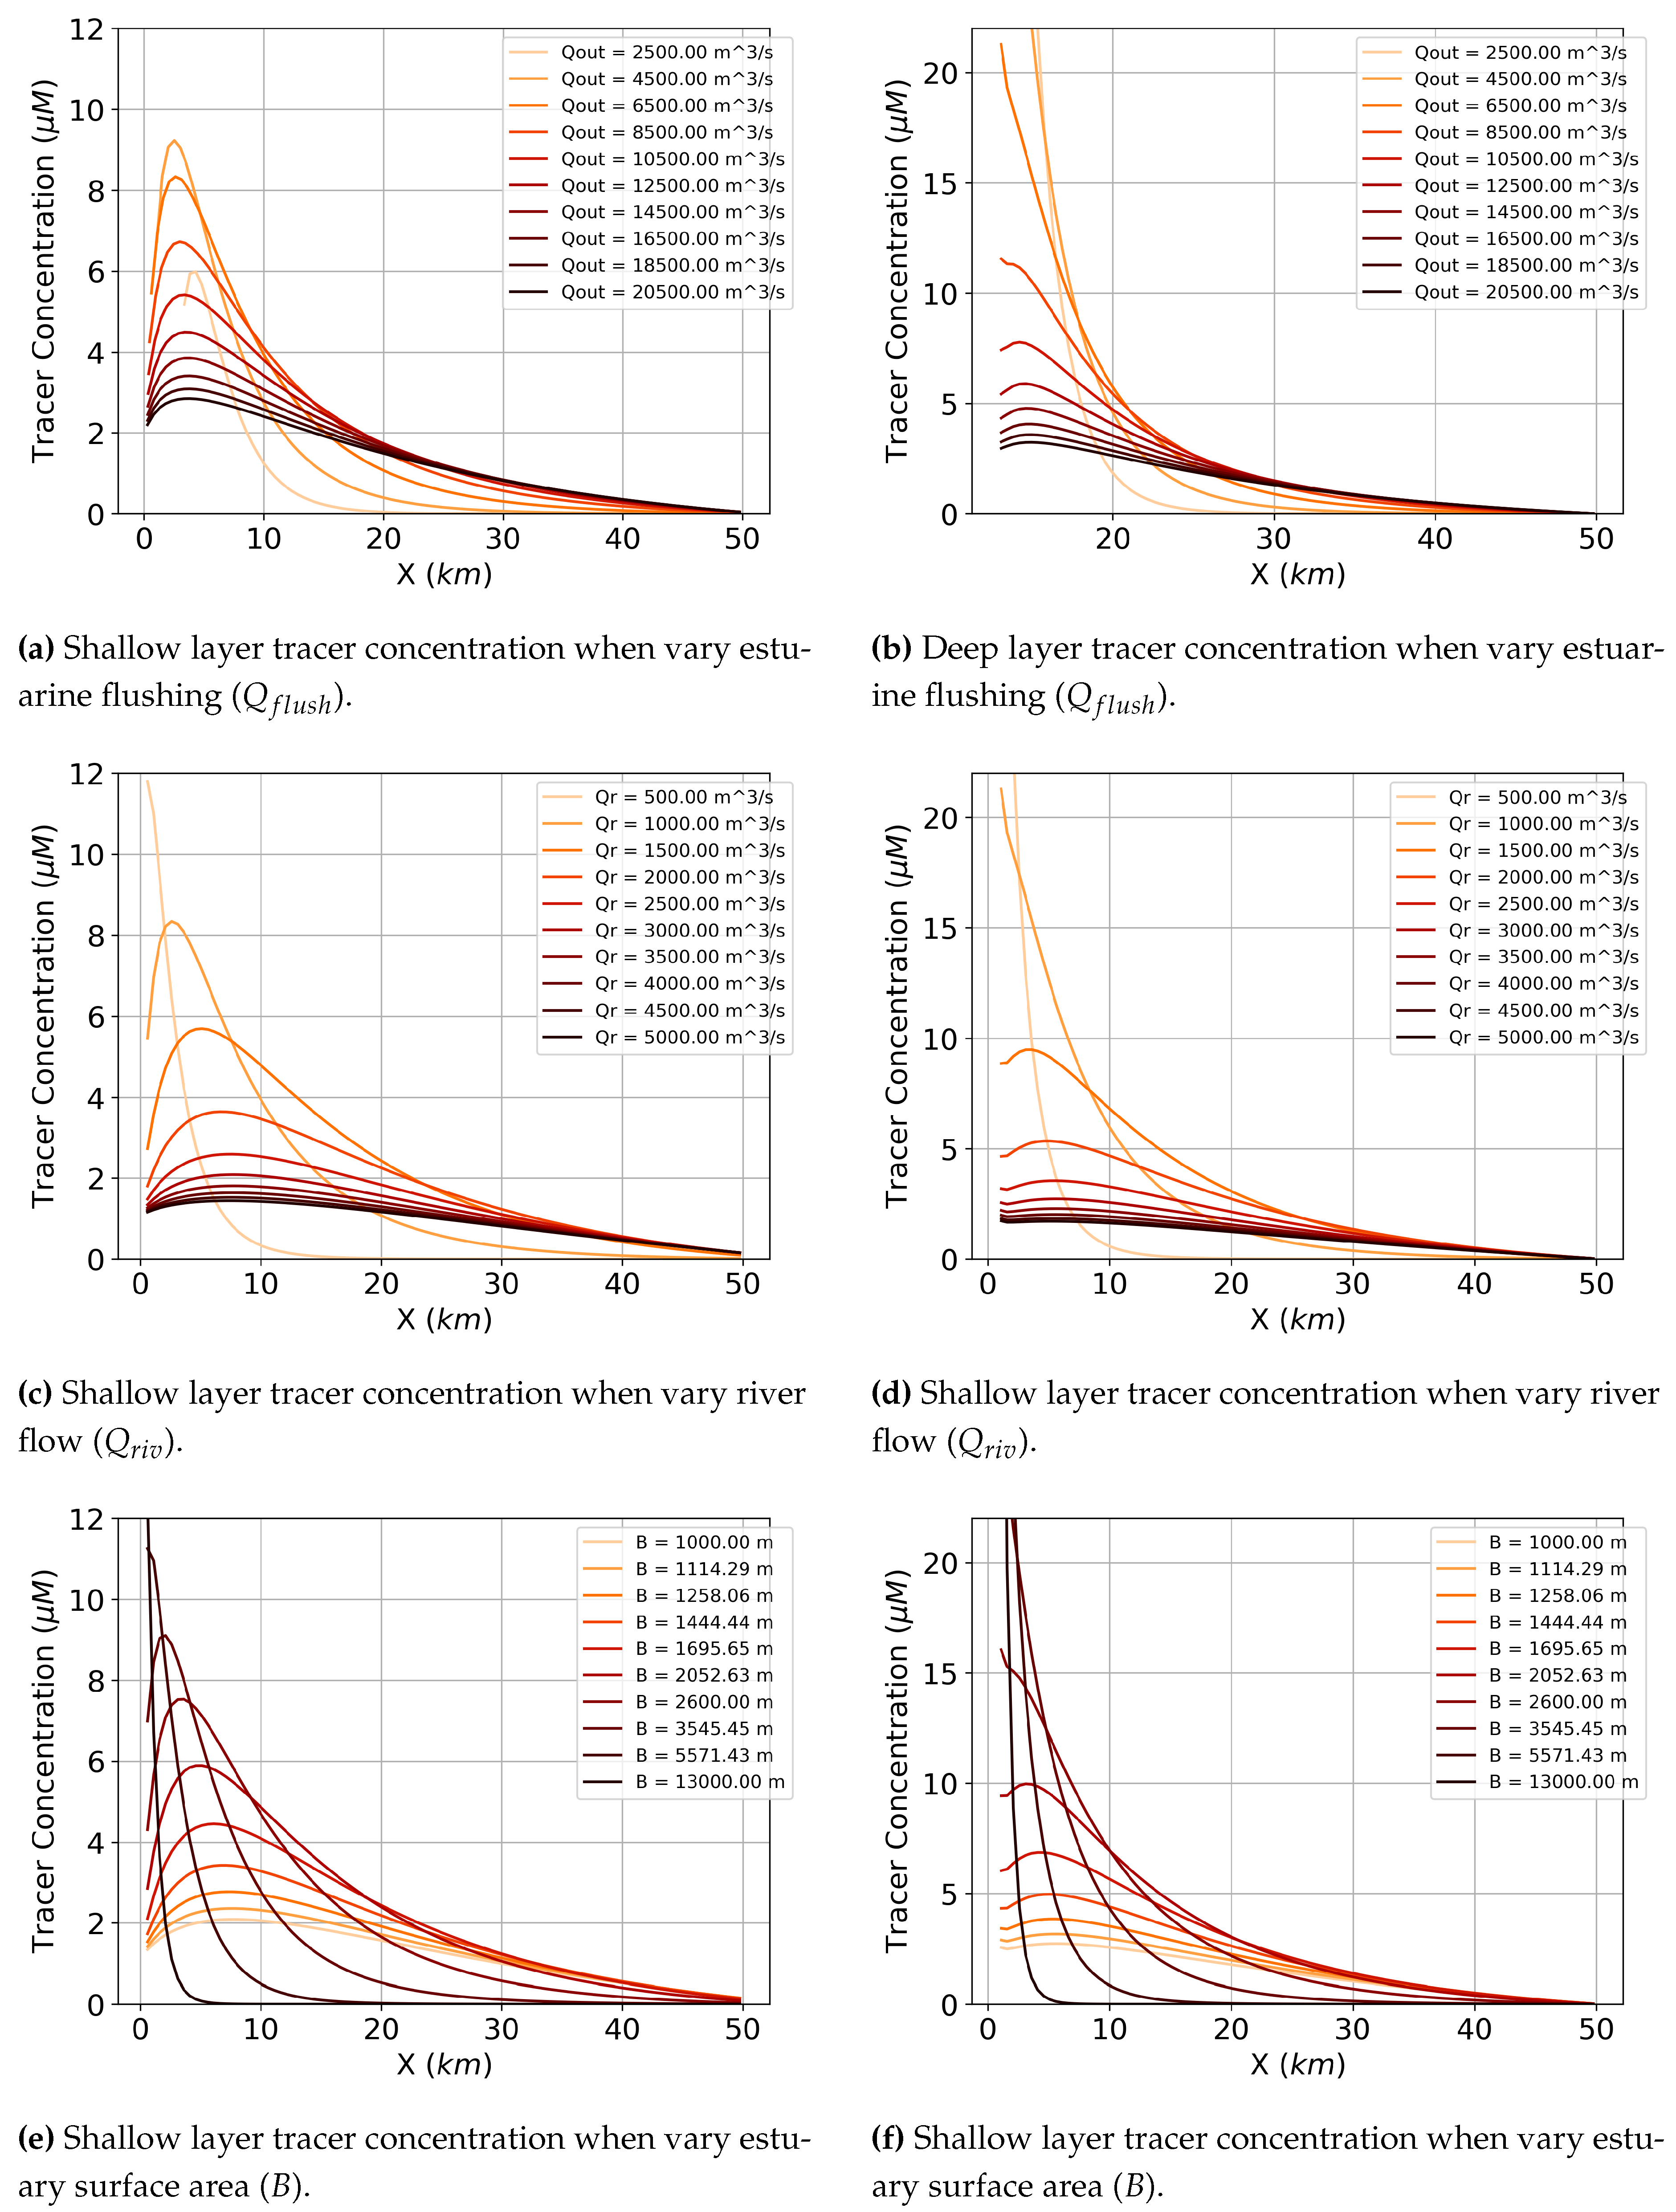
Figure A1. Sinking tracer concentration profiles when vary one parameter but hold all others constant. Results from this used to develop dimensionless group in Section 5.
Preprints 109839 g0a1

Appendix A.2. Development of Dimensionless Group

The results above show that certain sinking speeds, estuarine flushing rate, estuary size (width), and river flow lead to distinct sinking tracer concentrations. We obtain the same concentration profile by varying different parameters of the model and holding others constant. (Specifically, the concentration profiles when altering sinking and B are identical even though we altered different parameters.) This suggests there is a relationship among the parameters. We set out to find this relationship by developing a dimensionless group. We know the model should be able to be described by a finite number of dimensionless groups, based on the way it is formulated.
Thus, using the Buckingham Pi theorem, we define the following dimensionless groups from Eq. 1:
d i m 1 = B L , d i m 2 = Q f l u s h Q r , d i m 3 = w s L 2 Q r
We defined these dimensionless groups so that no more than two parameters are varying at a time. We next combine these dimensionless groups into one parameter. This parameter will inform the relative importance of tracer sinking, estuary surface area, estuary flow, and river flow on accumulation intensity in an estuary. We present the non-dimensional concentration, which we call C . C focuses on the strength of the concentration peak in the estuary while taking away the x-dependence of the ETMs. Thus, it summarizes the state of the estuary in a way that can be easily compared across multiple cases. For C we use the relationship of the integral of shallow layer concentration to the total concentration, C = C s C t o t a l . For C , we non-dimensionalize the concentration of the shallow layer as our metric to compare the different cases, but the results hold for the shallow and the deep layer.
We hypothesize C is determined by a function that is a product of these dimensionless groups, C = i = 1 3 d i m i a i . We performed a linear regression on the log of this equation to determine the values of the coefficients ( a i ) and obtain:
C d i m 1 0.50 d i m 2 0.75 d i m 3 0.50 = w s B L Q r 0.50 Q f l u s h Q r 0.75
Since d i m 1 and d i m 3 had the same coefficient, it suggests they collapse into their own group.

References

  1. Hansen, D.V.; Rattray Jr, M. Gravitational circulation in straits and estuaries. Technical report, Department of Oceanography, University of Washington, 1966.
  2. Geyer, W.R.; MacCready, P. The Estuarine Circulation. Annual Review of Fluid Mechanics 2014, 46, 175–197, Publisher: Annual Reviews. [Google Scholar] [CrossRef]
  3. Burchard, H.; Schuttelaars, H.M.; Ralston, D.K. Sediment Trapping in Estuaries. Annual Review of Marine Science 2018, 10, 371–395, Publisher: Annual Reviews. [Google Scholar] [CrossRef] [PubMed]
  4. Festa, J.F.; Hansen, D.V. Turbidity maxima in partially mixed estuaries: A two-dimensional numerical model. Estuarine and Coastal Marine Science 1978, 7, 347–359. [Google Scholar] [CrossRef]
  5. Allen, G.P.; Salomon, J.C.; Bassoullet, P.; Du Penhoat, Y.; de Grandpré, C. Effects of tides on mixing and suspended sediment transport in macrotidal estuaries. Sedimentary Geology 1980, 26, 69–90. [Google Scholar] [CrossRef]
  6. Sanford, L.P.; Suttles, S.E.; Halka, J.P. Reconsidering the physics of the Chesapeake Bay estuarine turbidity maximum. Estuaries 2001, 24, 655–669. [Google Scholar] [CrossRef]
  7. Burchard, H.; Baumert, H. The formation of estuarine turbidity maxima due to density effects in the salt wedge. A hydrodynamic process study. Journal of Physical Oceanography 1998, 28, 309–321. [Google Scholar] [CrossRef]
  8. Emmett, R.; Llansó, R.; Newton, J.; Thom, R.; Hornberger, M.; Morgan, C.; Levings, C.; Copping, A.; Fishman, P. Geographic signatures of North American West Coast estuaries. Estuaries 2012, 23, 765–792. [Google Scholar] [CrossRef]
  9. Babson, A.L.; Kawase, M.; MacCready, P. Seasonal and Interannual Variability in the Circulation of Puget Sound, Washington: A Box Model Study. null 2003, 44, 29–45, Publisher: Taylor & Francis. [Google Scholar] [CrossRef]
  10. Feely, R.A.; Alin, S.R.; Newton, J.; Sabine, C.L.; Warner, M.; Devol, A.; Krembs, C.; Maloy, C. The combined effects of ocean acidification, mixing, and respiration on pH and carbonate saturation in an urbanized estuary. ESTUARINE COASTAL AND SHELF SCIENCE 2010, 88, 442–449. [Google Scholar] [CrossRef]
  11. MacCready, P.; McCabe, R.M.; Siedlecki, S.A.; Lorenz, M.; Giddings, S.N.; Bos, J.; Albertson, S.; Banas, N.S.; Garnier, S. Estuarine Circulation, Mixing, and Residence Times in the Salish Sea. Journal of Geophysical Research: Oceans 2021, 126, e2020JC016738, Publisher: John Wiley & Sons, Ltd. [Google Scholar] [CrossRef]
  12. Banas, N.S.; Lessard, E.J.; Kudela, R.M.; MacCready, P.; Peterson, T.D.; Hickey, B.M.; Frame, E. Planktonic growth and grazing in the Columbia River plume region: A biophysical model study (vol 114, 2009). Journal of Geophysical Research-Oceans 2009, 114, C00B13, Place: WASHINGTON; 2000 FLORIDA AVE NW, WASHINGTON, DC 20009 USA Publisher: AMER GEOPHYSICAL UNION. [Google Scholar] [CrossRef]
  13. MacCready, P. Calculating Estuarine Exchange Flow Using Isohaline Coordinates. Journal of Physical Oceanography 2011, 41, 1116–1124, Place: BOSTON; 45 BEACON ST, BOSTON, MA 02108-3693 USA Publisher: AMER METEOROLOGICAL SOC. [Google Scholar] [CrossRef]
  14. Burchard, H.; Bolding, K.; Feistel, R.; Graewe, U.; Klingbeil, K.; MacCready, P.; Mohrholz, V.; Umlauf, L.; van der Lee, E.M. The Knudsen theorem and the Total Exchange Flow analysis framework applied to the Baltic Sea. Progress in Oceanography 2018, 165, 268–286, Place: OXFORD; THE BOULEVARD, LANGFORD LANE, KIDLINGTON, OXFORD OX5 1GB, ENGLAND Publisher: PERGAMON-ELSEVIER SCIENCE LTD. [Google Scholar] [CrossRef]
  15. Cokelet, E.D.; Stewart, R.J. The Exchange of Water in Fjords - the Efflux/reflux Theory of Advective Reaches Separated by Mixing Zones. Journal of Geophysical Research-Oceans 1985, 90, 7287–7306, Place: WASHINGTON; 2000 FLORIDA AVE NW, WASHINGTON, DC 20009 Publisher: AMER GEOPHYSICAL UNION. [Google Scholar] [CrossRef]
  16. Chatwin, P.C. Some remarks on the maintenance of the salinity distribution in estuaries. Estuarine and Coastal Marine Science 1976, 4, 555–566. [Google Scholar] [CrossRef]
  17. Franks, P.; Wroblewski, J.S.; Flierl, G.R. Behavior of a Simple Plankton Model with Food-Level Acclimation by Herbivores. Marine Biology 1986, 91, 121–129, Place: NEW YORK; 175 FIFTH AVE, NEW YORK, NY 10010 Publisher: SPRINGER VERLAG. [Google Scholar] [CrossRef]
  18. Davis, K.A.; Banas, N.S.; Giddings, S.N.; Siedlecki, S.A.; MacCready, P.; Lessard, E.J.; Kudela, R.M.; Hickey, B.M. Estuary-enhanced upwelling of marine nutrients fuels coastal productivity in the U.S. Pacific Northwest. Journal of Geophysical Research: Oceans 2014, 119, 8778–8799, Publisher: John Wiley & Sons, Ltd. [Google Scholar] [CrossRef]
  19. Fischer, H.B. Mixing and Dispersion in Estuaries. Annual Review of Fluid Mechanics 1976, 8, 107–133. [Google Scholar] [CrossRef]
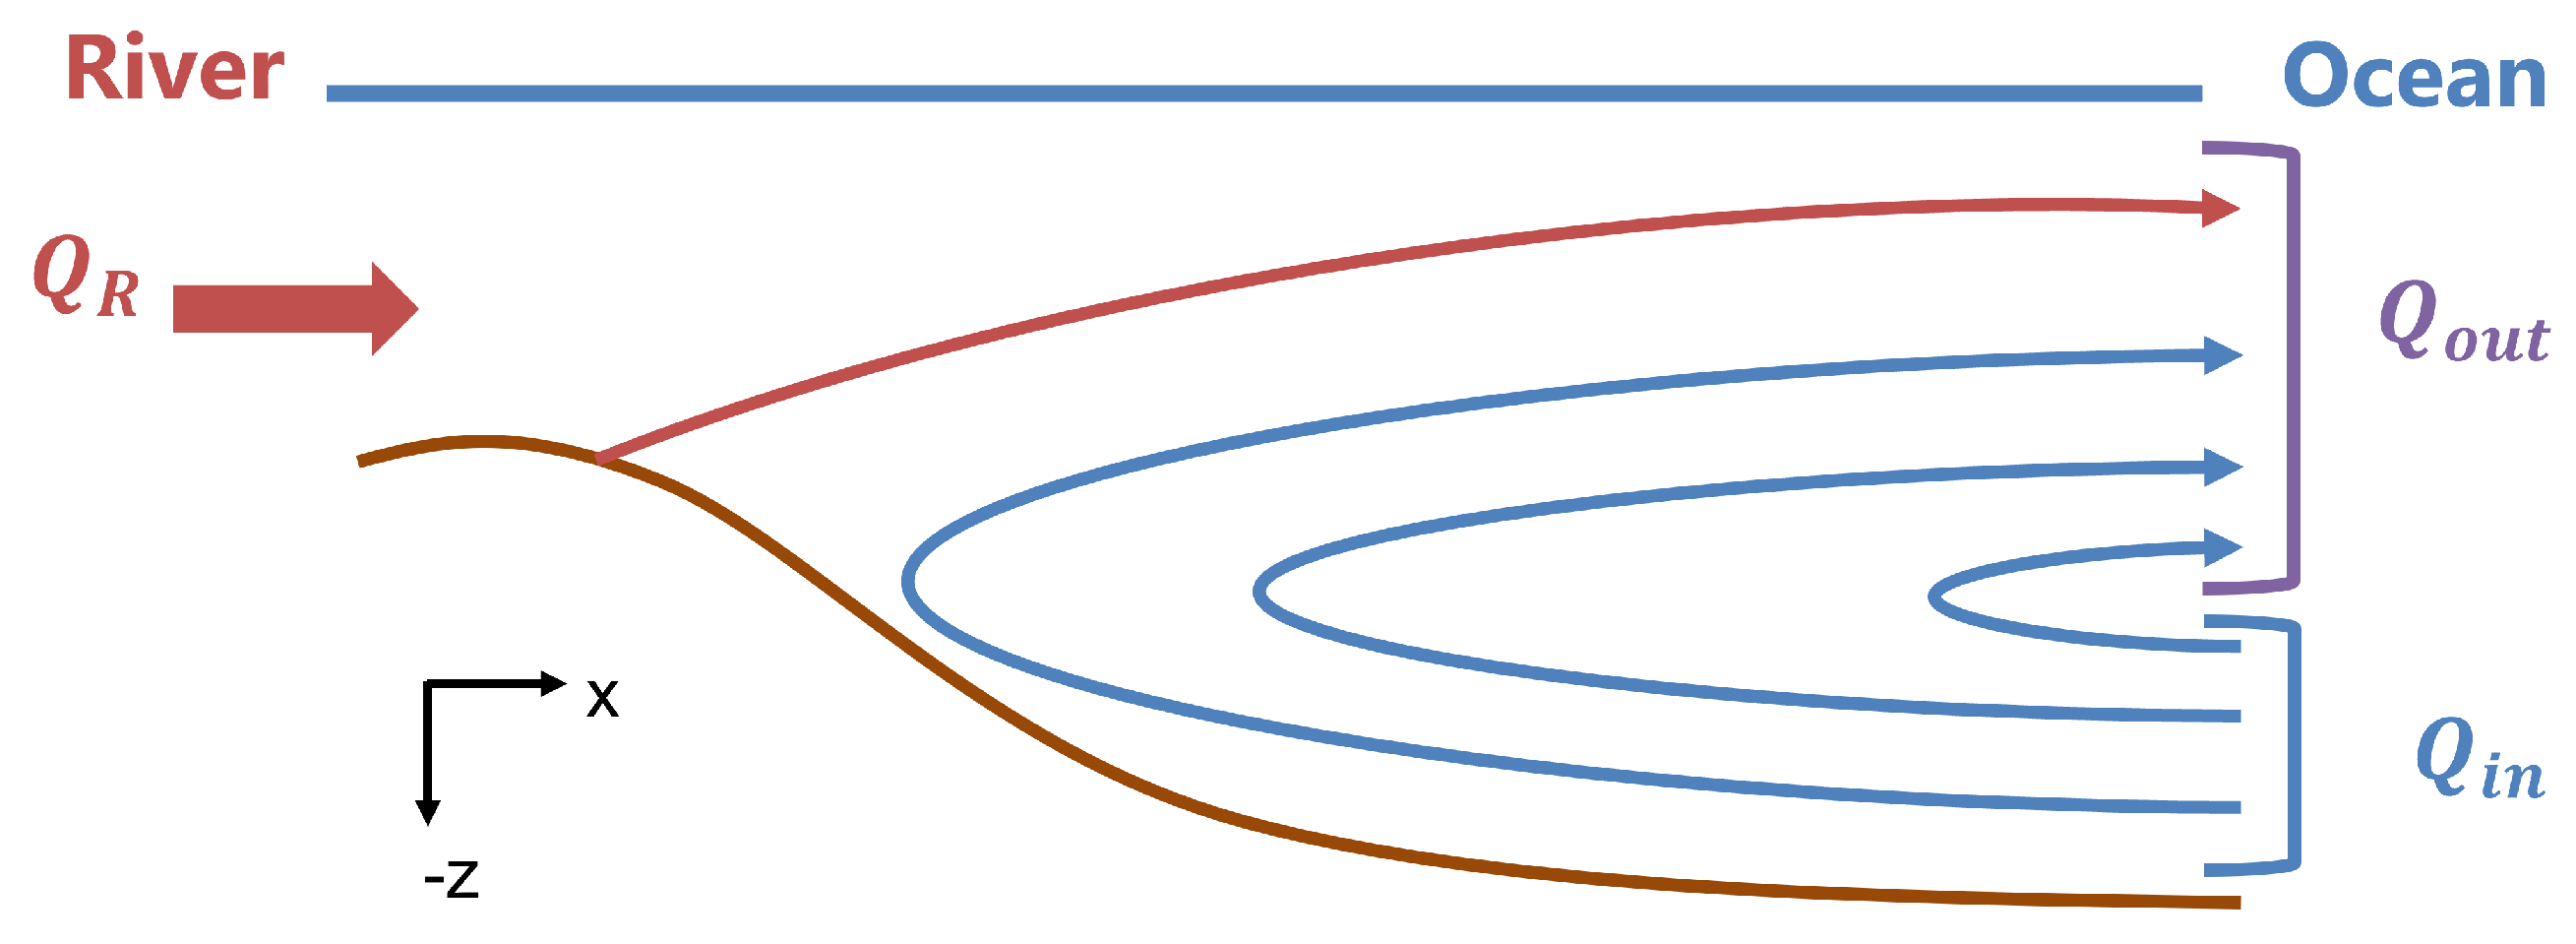
Figure 1. Schematic of longitudinal exchange. Q r is the river flow, Q i n is the flow into the estuary, and Q o u t is the cumulative outflow consisting of the inflow and the river flow. Replicated with slight modifications from [2].
Preprints 109839 g001
Figure 2. Simplification taken for box model experiment, showing only three x-locations and vertical separation denoted by the dashed gray line. Reproduced with modification from [11]. For explanation, see Eq. 1.
Preprints 109839 g002
Figure 3. Flows and the efflux/reflux method used in the TEF box model (Figure 2) recreated with modification from [11]. For explanation, see Eq. 2.
Preprints 109839 g003
Figure 4. Efflux (up)/reflux (down) fractions throughout the estuary for the test cases presented in this study. For explanation, see Eq. 4.
Preprints 109839 g004
Figure 5. Nitrogen flow diagram to Phytoplankton, Zooplankton, and Detritus (NPZD) summarized in Eq. 7. Recreated with slight modification from [12].
Preprints 109839 g005
Figure 6. Concentration of tracer distributed along the estuary after 200 days with varying sinking rates ( w s ). The lines of a lighter shade correspond to lower values of the parameter of interest. This shade increases in darkness with increasing value of that parameter.
Preprints 109839 g006
Figure 7. Varying detritus sinking speed detritus concentration profiles after 200 days of simulation time. X = 0 k m marks where the river enters the estuary and X = 50 k m marks the ocean. Increasing value of each parameter denoted with a darker shade of orange line. The left-hand panel is for the shallow layer, the right-hand panel is for the deep layer.
Preprints 109839 g007
Figure 8. Varying detritus sinking speed phytoplankton (a-b) and nutrients (c-d) concentration profiles after 200 days of simulation time. X = 0 k m marks where the river enters the estuary and X = 50 k m marks the ocean. Increasing value of each parameter denoted with a darker shade of orange line. The left-hand panel is for the shallow layer, the right-hand panel is for the deep layer.
Preprints 109839 g008
Figure 9. Distribution of the biological contributions to d D d t in the shallow layer for a variety of sinking speeds. Biological contributions include sources from zooplankton ”messy eating", phytoplankton and zooplankton mortality, and sinks from remineralization. See Eqs. 7 and 11.
Preprints 109839 g009
Figure 10. Timescales (d) for each case shown in Figure 6 taken at the location of the peak concentration. Black stars represent sinking timescales, purple dots are vertical mixing timescales, blue pluses are longitudinal exchange timescales, and green crosses are dispersion timescales. We intentionally truncated the y-axis at 5 days to focus on the interactions of the fastest timescales and the x-axis at 25 m d 1 to focus on the cases which reach steady state. Timescales defined as in Table 2.
Preprints 109839 g010
Figure 11. Timescales (d) for each case shown in Figure 7. Purple markers/lines denote physical processes, green denotes biological, and black denotes sinking. Marker type denotes the timescale: purple squares are for the vertical mixing timescale, purple triangles are for the longitudinal exchange (advection) timescale, purple circles are for the dispersion timescale, green squares are messy eating, green upside down triangles are Z mortality, green circles are P mortality, green stars are remineralization, and black stars are sinking. Each of the timescales which have x-dependence were calculated at the location of the peak D concentration for each case. We intentionally truncated the y-axis at 5 days to focus on the interactions of the fastest timescales and the x-axis at 25 m d 1 to focus on the cases which reach steady state. Timescales defined as in Table 2.
Preprints 109839 g011
Figure 12. Sinking tracer and sinking detritus concentrations with the same sinking speed ( w s = 8 m d 1 . Left-hand axis is tracer (solid line) concentration, right-hand is detritus (dashed line) concentration.
Preprints 109839 g012
Figure 13. Values of the introduced timescale τ d i f f which quantifies the lag leading to the difference in peak D and C locations. Red bars correspond to τ d i f f in the shallow layer and and vertical line corresponds to the steady state threshold of the system when run to 200 days.
Preprints 109839 g013
Figure 14. Relationship between the dimensionless group τ s i n k τ f l u s h 0.5 τ r i v τ f l u s h 0.25 and the dimensionless summary of the shallow layer concentration, C s C t o t a l ( C ). Black stars refer to values obtained by varying estuary width (B), green crosses are from varying sinking speed ( w s ), purple dots are from varying river flow ( Q r ), and blue pluses are from varying flushing rate ( Q f l u s h ). All of these variations were taken while holding the other parameters constant.
Preprints 109839 g014
Table 1. Model Parameters. Separated between parameters in the base model, parameters in the sinking tracer model only (Variation 1), parameters in both models (1 and 2), and parameters in the Peter-Parker Model only (Variation 2). Most biological parameter values obtained from [12].
Model Name Units Value/Definition Description
Base d V s m 3 B H s d x Volume shallow box
d V d m 3 B H d d x Volume deep box
V s m 3 B H s L Volume shallow section
V d m 3 B H d L Volume deep section
d x m 501.54 Length each box
L k m 50 Length entire estuary
H s m 20 Depth shallow layer
H d m 20 Depth deep layer
B k m 3 Estuary width
q s m s s 1 Eq. 2 Shallow layer flux
q d m s s 1 Eq. 2 Deep layer flux
Q s m s s 1 Eq. 3 Shallow layer flow
Q d m s s 1 Eq. 3 Deep layer flow
a s Eq. 4 Fraction of flow refluxed down
a d Eq. 4 Fraction of flow effluxed up
q r m s s 1 1,000 River flux
Q r m s s 1 6,500 Cumulative river flow
1 C r i v μ M N 1 Sinking tracer river loading concentration.
C o c n μ M N 0 Sinking tracer ocean loading concentration.
1 and 2 w s m d 1 Variable Tracer or D sinking speed
n d a y s d 200 Simulation time
2 μ i n s t d 1 Eq. 8 Instantaneous P growth rate
μ 0 d 1 2.2 Max inst. P growth rate
k s μ M N 4.6 Half-saturation N uptake by P
α ( W m 2 ) 1   d 1 0.07 Initial slope growth-light curve
E W m 2 Eq. 10 Photosynthetically available radiation
E 0 W m 2 200 Maximum light
a t t s w m 1 0.13 Light attenuation seawater
a t t P m 1 ( μ M N ) 1 0.018 Light attenuation by P
m d 1 0.1 Non-grazing P mortality
I d 1 Eq. 9 Z ingestion of P
I 0 d 1 4.8 Max Z ingestion rate of P
K s μ M N 3 Half-saturation Z ingestion of P
ξ d 1 ( μ M N ) 1 2.0 Z mortality
ϵ 0.3 Z growth efficiency
f e g e s t 0.5 Fraction losses Z egested
r d 1 0.1 Remineralization rate
N r i v μ M N 5 River nutrients
N o c n μ M N 0 N ocean boundary condition
P r i v μ M N 0.01 P river seed population
P o c n μ M N 0.01 P ocean seed population
Z r i v μ M N 0.01 Z river seed populations
Z o c n μ M N 0.01 Z ocean seed populations
D r i v μ M N 0 D river boundary conditions
D o c n μ M N 0 D ocean boundary conditions
Table 2. Summary of timescales to understand behavior as written in Eqs. 13-22
Name Process Formula
Sinking Time for concentration to sink from the shallow to deep layer τ s i n k = h s w s
Vertical Mixing Time for concentration to efflux to shallow from deep ( τ e f f ) or reflux to deep from shallow ( τ r e f ) at location i τ e f f i = d V s q s i 1 a s i 1 + q d i + 1 a d i + 1
τ r e f i = d V d q s i 1 a s i 1 q d i + 1 a d i + 1
Longitudinal Exchange Time for concentration to flow out towards the ocean ( τ o u t ) or in towards the river ( τ i n ) at location i τ o u t i = d V s Q s i
τ i n i = d V d Q d i
Estuarine Dispersion Time for concentration peak to be reduced by the longitudinal and vertical mixing at location i τ d i s p i = V a s i 1 q s i 1 + a d i + 1 q d i + 1 ( 1 a s i 1 ) q s i 1 + ( 1 a d i + 1 ) q d i + 1 2
Messy Eating Time for fraction of phytoplankton missed by zooplankton to become detritus τ m e s s y , s i = 1 ( 1 ϵ ) f e g e s t I s i
τ m e s s y , d i = 1 ( 1 ϵ ) f e g e s t I d i
P Mortality Time for phytoplankton to become detritus from methods other than grazing τ P m o r t = 1 m
Z Mortality/Higher Predation Time for zooplankton to become detritus due to mortality or higher predation τ Z m o r t , s i = Z s i ξ
τ Z m o r t , d i = Z d i ξ
Remineralization Time for detritus to become nutrients τ r e m i n = 1 r
Disclaimer/Publisher’s Note: The statements, opinions and data contained in all publications are solely those of the individual author(s) and contributor(s) and not of MDPI and/or the editor(s). MDPI and/or the editor(s) disclaim responsibility for any injury to people or property resulting from any ideas, methods, instructions or products referred to in the content.
Copyright: This open access article is published under a Creative Commons CC BY 4.0 license, which permit the free download, distribution, and reuse, provided that the author and preprint are cited in any reuse.
Prerpints.org logo

Preprints.org is a free preprint server supported by MDPI in Basel, Switzerland.

Subscribe

© 2024 MDPI (Basel, Switzerland) unless otherwise stated