Preprint
Article

Exploring the Microstructural Effect of FeCo Alloy on Carbon Microsphere Deposition and Enhanced Electromagnetic Wave Absorption

Altmetrics

Downloads

82

Views

47

Comments

0

A peer-reviewed article of this preprint also exists.

Submitted:

21 June 2024

Posted:

21 June 2024

You are already at the latest version

Alerts
Abstract
The rational design of magnetic carbon composites, encompassing both composition and microstructure, holds significant potential for achieving exceptional electromagnetic wave absorbing materials (EAMs). In this study, FeCo@CM composites was efficiently fabricated through an advanced microwave plasma assisted reduction chemical vapor deposition (MPARCVD) technique, offering high efficiency, low cost, and energy-saving benefits. By depositing graphitized carbon microspheres, the dielectric properties were significantly enhanced, resulting in improved electromagnetic wave absorption performances through optimized impedance matching and a synergistic effect with magnetic loss. A systematic investigation revealed that the laminar-stacked structure of FeCo exhibited superior properties compared to its spherical counterpart, supplying a higher number of exposed edges and enhanced catalytic activity, which facilitated the deposition of uniform and low-defect graphitized carbon microspheres. Consequently, the dielectric loss performance of the FeCo@CM composites was dramatically improved due to increased electrical conductivity and the formation of abundant heterogeneous interfaces. At a 40 wt% filling amount and a frequency of 7.84 GHz, the FeCo@CM composites achieved a minimum reflection loss value of -58.2 dB with an effective absorption bandwidth (fE) of 5.13 GHz. This study presents an effective strategy for developing high-performance EAMs.
Keywords: 
Subject: Chemistry and Materials Science  -   Materials Science and Technology

1. Introduction

With the rapid advancement of radar detection technology and the fifth generation (5G) electromagnetic communication technology, significant progress has been achieved for humanity. Nevertheless, this has also led to significant electromagnetic pollution and interference issues [1,2,3,4], posing formidable challenges to electronic information security, military security, and even human life and health [5,6,7,8]. Consequently, the development of electromagnetic wave absorbing materials (EAMs) that adhere to the criteria of “thin, light, wide, and strong” holds immense significance [9,10,11,12].
Magnetic materials with high magnetization and permeability, including carbonyl iron [13], ferrite [14], and metals and their alloys [15], have been extensively employed owing to their proficiency in achieving high electromagnetic loss with reduced thickness [16]. In comparison to traditional ferrites, FeCo alloy have exhibited higher Curie temperatures, lower coercivity, greater magnetocrystalline anisotropy, and a higher Snoek’s limit, positioning them as promising candidates for EAMs [17,18,19,20]. Jiang et al [21] synthesized CoxFe10-x alloy nanochains with varying iron molar fractions, utilizing NaBH4 as a reducing agent. Among these, the Co4Fe6 alloy displayed the most promising microwave absorbing performance, attaining a minimum reflection loss (RLmin) of -38.7 dB with an effective absorption bandwidth (defined as RL < − 10 dB, fE) of 6.9 GHz. Cheng et al [22] successfully synthesized diverse morphologies of FeCo alloys with varying atomic ratios through a hydrothermal reduction process. Among these, Fe7Co3 exhibited optimal microwave absorption properties, achieving the RLmin of -53.6 dB at an fE of 6.8 GHz. Yang et al [23] prepared magnetic FeCo alloy materials with an evolved micro-scale succulent plant-like morphology through a simplified hydrothermal reaction-hydrogen reduction synthesis strategy involving multiple equilibrium/competition mechanisms, which attained an RLmin of -53.81 dB at an fE of 5.68 GHz. However, as a sole magnetic loss material, FeCo alloy lacks a dielectric loss mechanism, which could contribute to its suboptimal impedance matching performance [24]. Moreover, FeCo encountered challenges in oxidation resistance and thermal stability in a natural environment [25]. Additionally, the dense magnetic FeCo alloy faced practical application constraints due to the increasing demand for lightweight electronic devices [26]. To tackle these limitations, the optimal approach involved introducing dielectric loss components into the FeCo magnetic system [27,28,29,30], which capitalized on the synergistic and complementary dielectric-magnetic coupling effect between the magnetic and dielectric components [31,32,33].
Carbon materials, as typical dielectric loss materials, exhibit significant advantages including lightness, chemical stability, and environmental friendliness [34,35,36,37]. Furthermore, the dielectric properties are highly tunable, rendering magnetic carbon composites, which combine carbon materials with magnetic components, as an ideal EAMs [38,39,40]. Currently, high-temperature carbonization of organic materials is the prevalent method for obtaining carbon sources. For example, Wang et al [41] synthesized porous CoFe@C nanorods with a hierarchical nested structure, utilizing CoFe-MOF-74 as a precursor through high-temperature pyrolysis. This approach achieved an RLmin of -61.8 dB at an fE of 9.2 GHz. Similarly, Wang et al. [42] employed FeCo Prussian blue analogues as nucleation sites, polymerized dopamine on their surfaces, and converted the precursor into ideal core-shell FeCo@C nanoparticles via high-temperature pyrolysis. This approach attained an RLmin of -67.8 dB at an fE of 5.3 GHz. Based on various published research findings, it is evident that the electromagnetic wave absorption performance of FeCo@C composites is notably enhanced compared to single magnetic FeCo material components. Nonetheless, the preparation methods of these FeCo@C composites involved intricate processes, high energy consumption, and low yield, resulting in elevated production costs and impeding large-scale production for practical applications. Therefore, adopting a simpler, more energy-efficient, and cost-effective synthesis route for FeCo@C composites is of significant importance.
In this study, an advanced microwave plasma assisted reduction chemical vapor deposition (MPARCVD) technique was utilized to efficiently fabricate FeCo@CM composites with high efficiency, low cost and energy-saving. The deposition of graphitized carbon microspheres significantly enhanced the dielectric properties, leading to improved electromagnetic wave absorption performance via enhanced impedance matching and a synergistic effect with the magnetic loss. Furthermore, a systematic investigation was conducted to examine the effect of the FeCo microstructure, specifically spherical versus laminar, on the regulation of the dielectric properties of the FeCo@CM composites. It was demonstrated that the laminar-stacked structure of FeCo exhibited a higher number of exposed edges and increased catalytic activity, offering more energy sites for the deposition of carbon species. As a result, a large number of uniform and low-defect graphitized carbon microspheres were successfully deposited on the surface of the laminar microstructure of the FeCo alloy. The dielectric loss performance of the FeCo@CM composites was significantly improved due to the increased electrical conductivity and the newly formed abundant heterogeneous interfaces. Consequently, when the filling amount of the FeCo@CM composites reached 40 wt%, at a frequency of 7.84 GHz, the RLmin value achieved -58.2 dB, accompanied by a fE of 5.13 GHz. This study provided an effective strategy and means for acquiring high-performance EMAs.

2. Materials and Methods

2.1. Materials

Ferric chloride hexahydrate (FeCl3·6H2O), cobalt chloride hexahydrate (CoCl2·6H2O), hexamethylenetetramine (HMT), and absolute ethanol (C2H5OH) were all procured from Alfa Aesar, while the iron-cobalt alloy powder (FeCo) with an atomic ratio of 1:1, labeled s-FeCo, was sourced from Qinghe County Hengbei Metal Materials Co., Ltd. Additionally, H2 (99.999%), Ar (99.999%), and CH4 (99.999%) gases were obtained from Chongqing Ruixin Gas Co., Ltd. All these reagents were utilized without any further purification. Deionized water, prepared using an ultrapure water machine (ATSelem 1810A), served as the medium throughout the entire experimental process.

2.2. Preparation of f-Fe(OH)3/Co(OH)2 Precursor

Utilizing HMT as the hydrolyzing agent, the precursor f-Fe(OH)3/Co(OH)2 was synthesized via a hydrothermal approach. Initially, FeCl3·6H2O (2 mmol), CoCl2·6H2O (2 mmol), and HMT (96 mmol) were dissolved in a mixed solvent consisting of 70 ml water and ethanol (9:1, v/v) and agitated at room temperature for 20 minutes. Subsequently, the reaction solution was transferred to a 100 ml hydrothermal reactor and heated to 150°C for 2 hours. Following the reaction, the obtained dark brown precipitate was gathered, rinsed alternately with anhydrous ethanol and deionized water four times, and ultimately dried in an oven at 70°C for 12 hours, resulting in the acquisition of the f-Fe(OH)3/Co(OH)2 precursor.

2.3. Preparation of f-FeCo Alloy

The FeCo alloy was synthesized by reducing the precursor using a homemade microwave plasma apparatus, and was designated as f-FeCo. The apparatus comprised a household microwave oven, a vacuum controller, a vacuum pump, and a quartz tube. Upon activation, the device generated purple microwave plasma with an operating frequency of 2450 MHz and an output power of 700 W. A total of 0.5g of the f-Fe(OH)3/Co(OH)2 precursor was positioned in a quartz boat and subsequently transported to the center of the quartz tube. Following evacuation of the reaction chamber to a vacuum state, Ar (100 sccm) and H2 (100 sccm) were introduced into the furnace. Subsequently, the microwave oven switch was activated to initiate the reduction reaction. The reaction duration was set for 20 minutes, ensuring the complete reduction of f-Fe(OH)3/Co(OH)2 to f-FeCo alloy. After the reaction, the H2 flow was terminated, and the sample was cooled to room temperature under an Ar atmosphere.

2.4. Preparation of f-FeCo@CM and s-FeCo@CM

A total of 0.2 g of f-FeCo or s-FeCo alloy particles were positioned in a quartz boat, which was then placed at the center of a quartz tube. Once the reaction apparatus was evacuated to a vacuum state, Ar (100 sccm), H2 (200 sccm), and CH4 (100 sccm) were introduced into the furnace. Subsequently, the microwave oven switch was activated to commence the reaction, which proceeded for 20 minutes. During this process, carbon material was deposited onto the surfaces of FeCo alloys. Following the reaction, the flows of H2 and CH4 were terminated, and the samples were cooled to room temperature under an Ar atmosphere, ultimately yielding FeCo@CM samples named as f-FeCo@CM or s-FeCo@CM, respectively.

2.5. Characterization

The phase structures of the samples were characterized by X-ray powder diffraction (XRD) patterns, which were acquired using an X-ray diffractometer (X’Pert 3 powder) with Cu Kα radiation (λ = 1.54 Å). The surface morphology was observed with a field emission scanning electron microscope (FESEM, JSM-7800F), while the elemental composition was determined via energy dispersive spectroscopy (EDS). Furthermore, Raman spectra were recorded using a laser Raman spectrometer (Raman, InVia Reflex) with 532 nm laser excitation to assess the defect concentration and graphitization degree of the samples. The thermal stability of the samples in an air atmosphere was evaluated using a thermogravimetric analyzer (TGA DSC1) at a scanning rate of 10 °C min-1 over a temperature range from room temperature to 1100 °C. Surface composition analysis was performed using X-ray photoelectron spectroscopy (XPS, Thermo ESCALAB-250Xi). The magnetization hysteresis curves were measured with a vibrating sample magnetometer (SQUID, MPMS XL). For electromagnetic parameter measurement, the samples were mixed with paraffin at a filling factor of 40 wt% and compressed into rings with an approximate thickness of 2 mm. The relative permittivity and permeability were then determined within the frequency range of 2-18 GHz using a vector network analyzer (N5234A, Agilent) via the coaxial method. The reflection loss value (RL) was calculated based on transmission line theory, expressed by the following equation:
Z i n = Z 0 ε r μ r tanh j 2 π f d c μ r ε r
R L = 20 log Z i n Z 0 Z i n   + Z 0
Among them, Z0 and Zin are the free space impedance and the absorber input impedance respectively, εr and μr distribution are the complex dielectric constant and complex permeability respectively, f is the electromagnetic wave frequency, d is the thickness of the absorber, and c is the speed of light.

3. Results and Discussion

The preparation process and the underlying reaction mechanism of f-FeCo@CM were delineated in Figure 1. Utilizing the MPARCVD technique, the magnetron in the microwave oven proficiently converted electrical energy into microwaves, efficiently inducing low-pressure H2 molecules to generate plasma, which comprised hydrogen ions (H+, H2+, H3+) and hydrogen atoms in both the ground (H) and excited (H*) states. As a highly potent reducing agent, hydrogen plasma possessed a greater activation energy than H2 molecules obtained through traditional thermal reduction [43], thereby significantly enhancing reduction efficiency. During the carbon growth phase, CH4 molecules decomposed under the influence of H2 plasma, where C-H bonds were disrupted by the etching action of the plasma. The liberated C atoms were subsequently adsorbed onto the FeCo substrate surface, seeking locations of minimum energy for deposition. According to the previous literature [44,45], it was demonstrated the remarkable activity of Fe-Co bimetallic catalysts in the fabrication of carbon nanomaterials via the CVD method. Given that both Fe and Co lattices exhibited a certain solubility for C atoms, the combination of Fe and Co metals generated a synergistic effect, enhancing the affinity for C atoms and augmenting the diffusion coefficient of C atoms, thus promoting the efficient growth of carbon nanomaterials [46,47]. Therefore, the MPARCVD technique could efficiently achieved the reduction of the f-Fe(OH)3/Co(OH)2 precursor and the growth of carbon microspheres on f-FeCo/s-FeCo alloy particles with the assistance of H2 plasma, exhibiting high efficiency and energy-saving attributes.
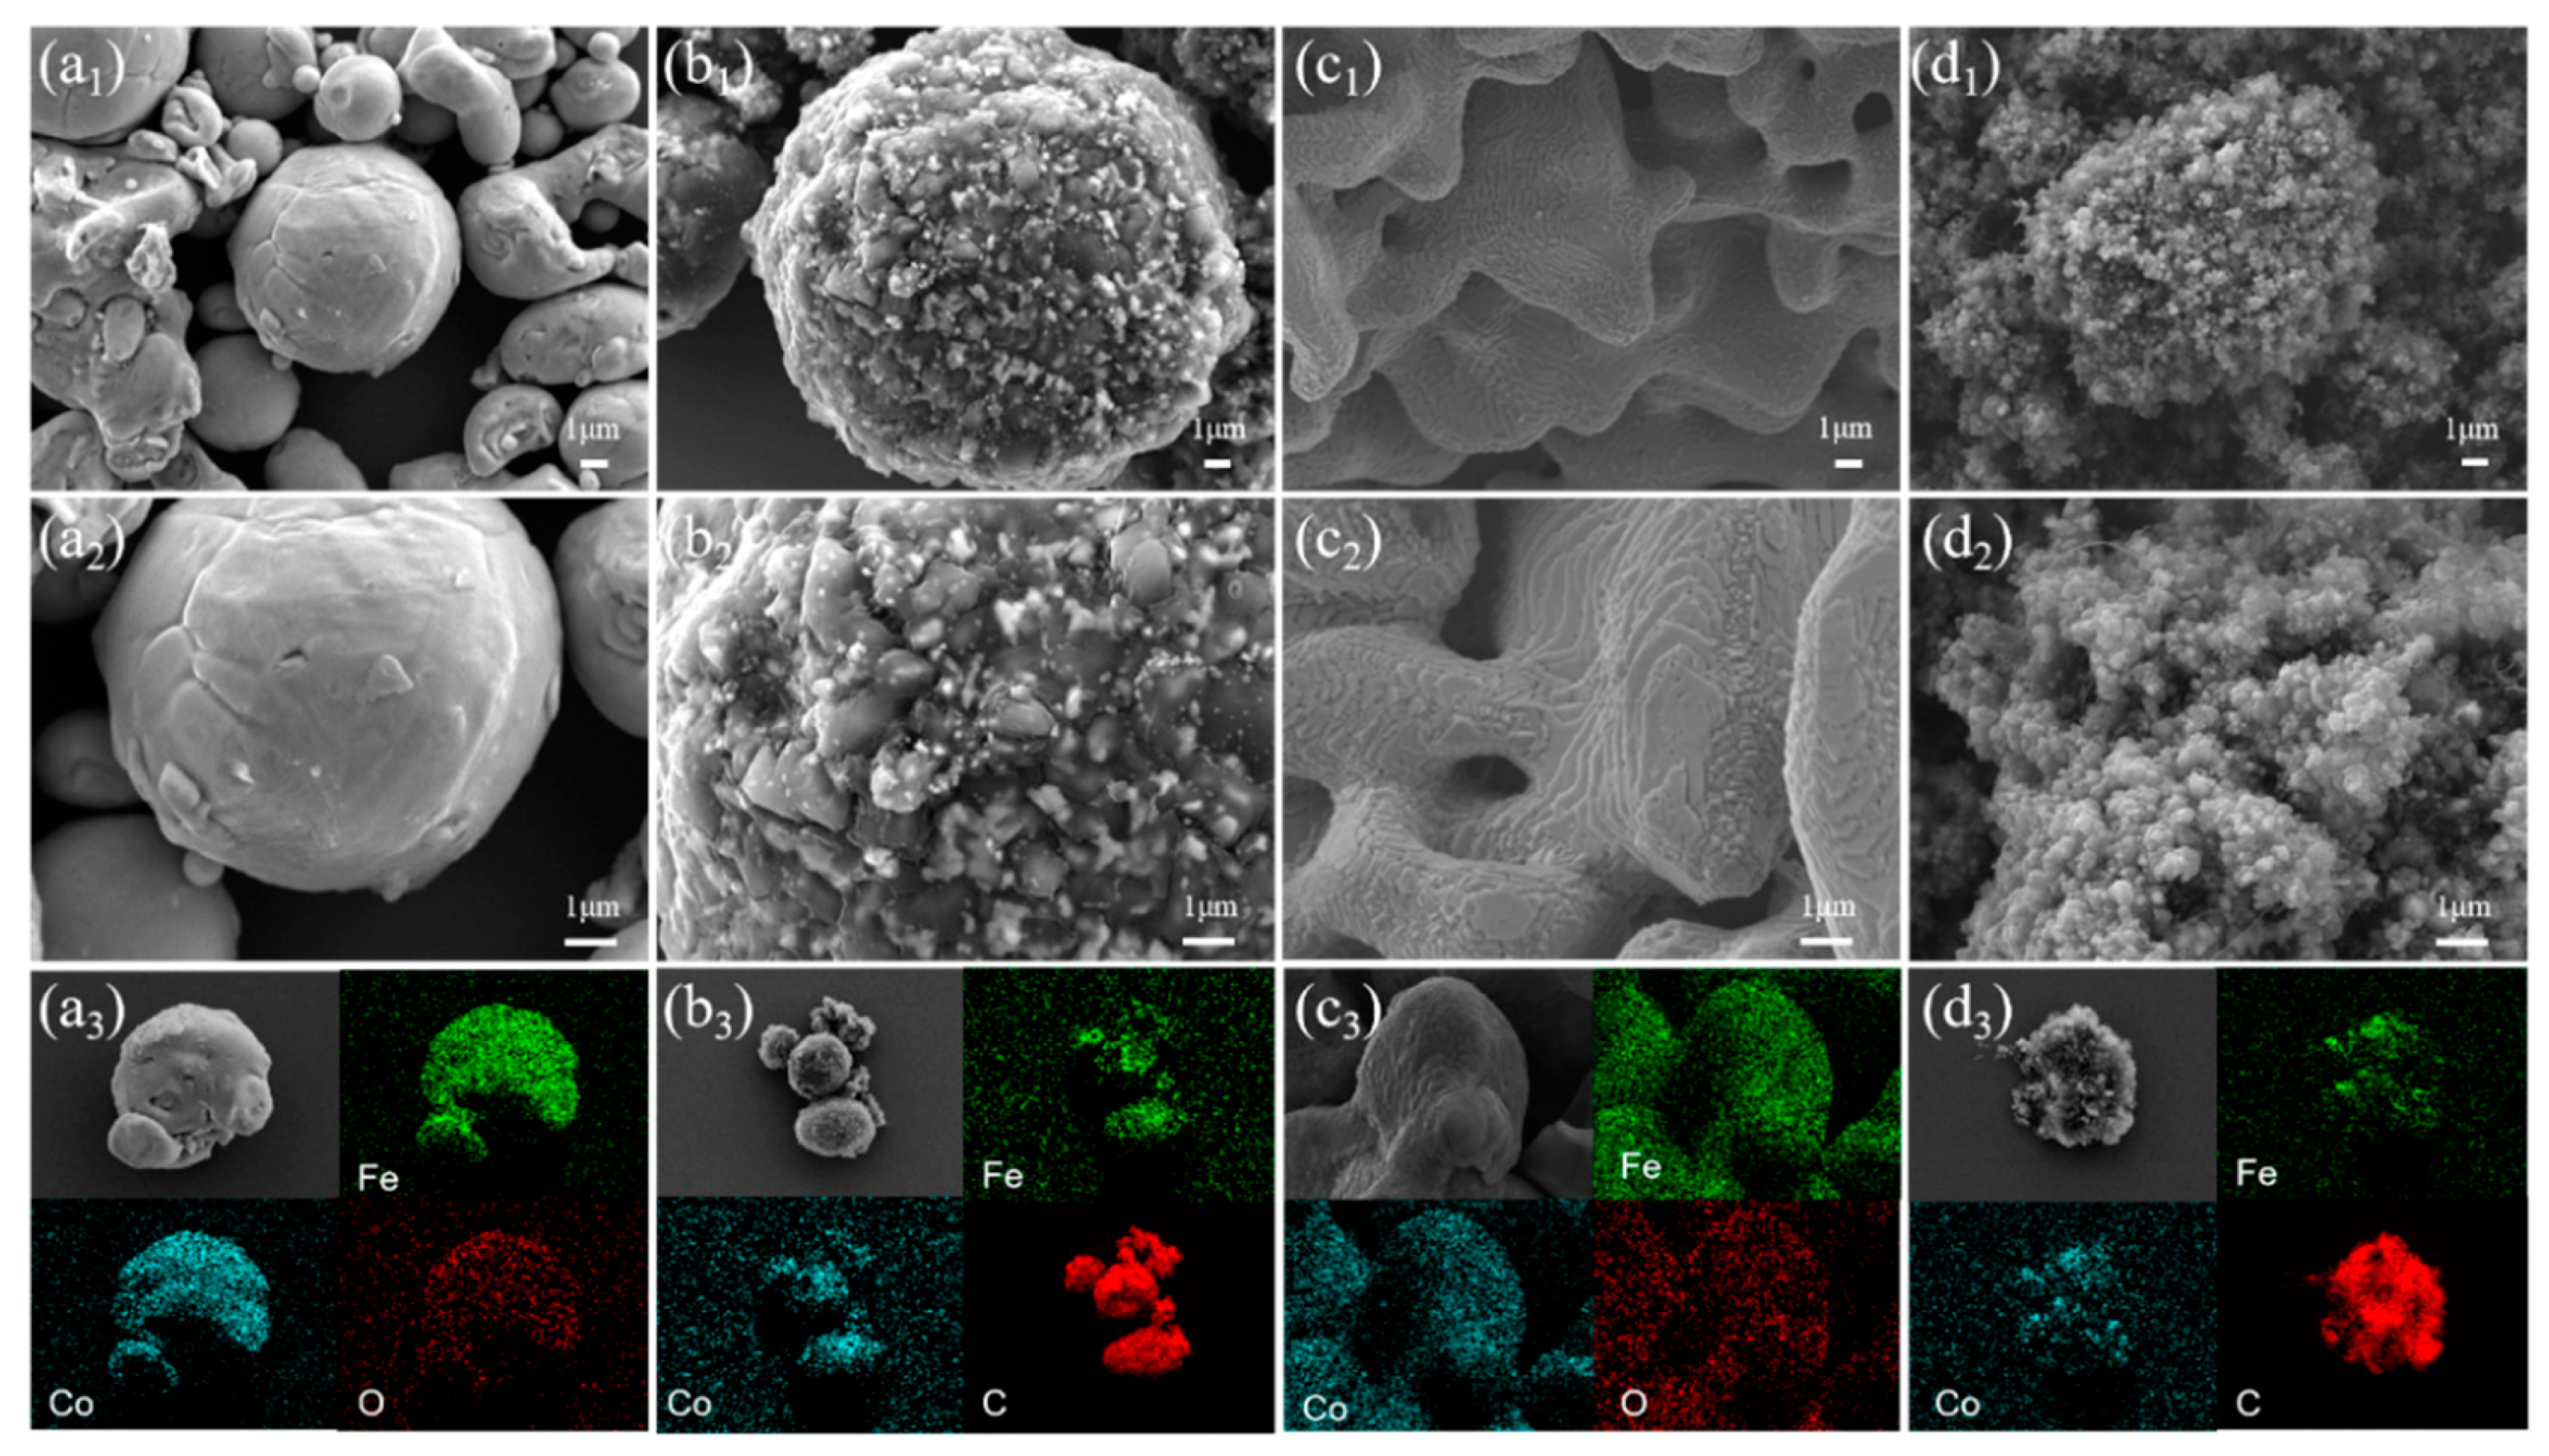
The morphological analysis of the samples was observed using FESEM. Initially, the low-magnification SEM images (Figure S1a-b) demonstrated that the f-Fe(OH)3/Co(OH)2 precursor exhibited irregular bulk particles, composed of numerous sheet structures that were challenging to discern visually. The Fe and Co elements within the precursor exhibited a uniform distribution, with an atomic ratio approximating 1:1 (Figure S1c), confirming the successful synthesis of the precursor with a Fe:Co atomic ratio of 1:1. The SEM images of commercially acquired s-FeCo alloy particles were presented in Figure 2a1-a2, revealing a smooth surface morphology and predominantly spherical particle shapes. Conversely, the SEM images of f-FeCo alloy particles synthesized via MPARCVD technology were displayed in Figure 2c1-c2. Under a H2 atmosphere, the hydrogen and oxygen atoms in the f-Fe(OH)3/Co(OH)2 precursor were liberated, resulting in the formation of pores of varying sizes and coral-like f-FeCo alloy particles. As evident from the high-magnification SEM image (Figure 2c2), these coral-like f-FeCo alloy particles were constructed by the stacking of two-dimensional alloy nanosheets, which possessed the potential to serve as catalysts for the subsequent growth of carbon materials. The FESEM images of f-FeCo@CM were depicted in Figure 2d1-d2. The high-magnification SEM image (Figure 2d2) disclosed that following the introduction of CH4, carbon nanoparticles adopted the form of carbon spheres, densely covering the surface of f-FeCo. The accumulation of these carbon spheres resulted in the formation of a flower-like f-FeCo@CM composite, as shown in Figure 2d1. Additionally, the elemental mapping depicted in Figure 2c3 and 2d3 revealed a uniform distribution of Fe and Co elements in the f-FeCo alloy particles and f-FeCo@CM composites. Notably, the C element content detected on the surface of the f-FeCo@CM composite significantly exceeded the Fe and Co elements, confirming the successful coating of numerous carbon microspheres onto the surface of f-FeCo alloy. Conversely, as observed in the FESEM images of s-FeCo@CM (Figure 2b1-b2), the density of carbon spheres deposited on the surface of s-FeCo alloy particles was significantly lower compared to that of f-FeCo@CM. This discrepancy suggested a lower coating efficiency of carbon materials grown on the surface of s-FeCo. This was attributed to the stacked laminar structure of f-FeCo, which provided more exposed edges than spherical particles. These edges possessed higher catalytic activity, and the abundance of edges enabled f-FeCo to possess a greater number of active sites for carbon deposition [48,49,50]. Consequently, the surface of f-FeCo could deposit and coat significantly more carbon microspheres than s-FeCo. The increased deposition and coating of carbon materials provided more dielectric loss components for the magnetic materials, thereby enhancing their impedance matching performance.
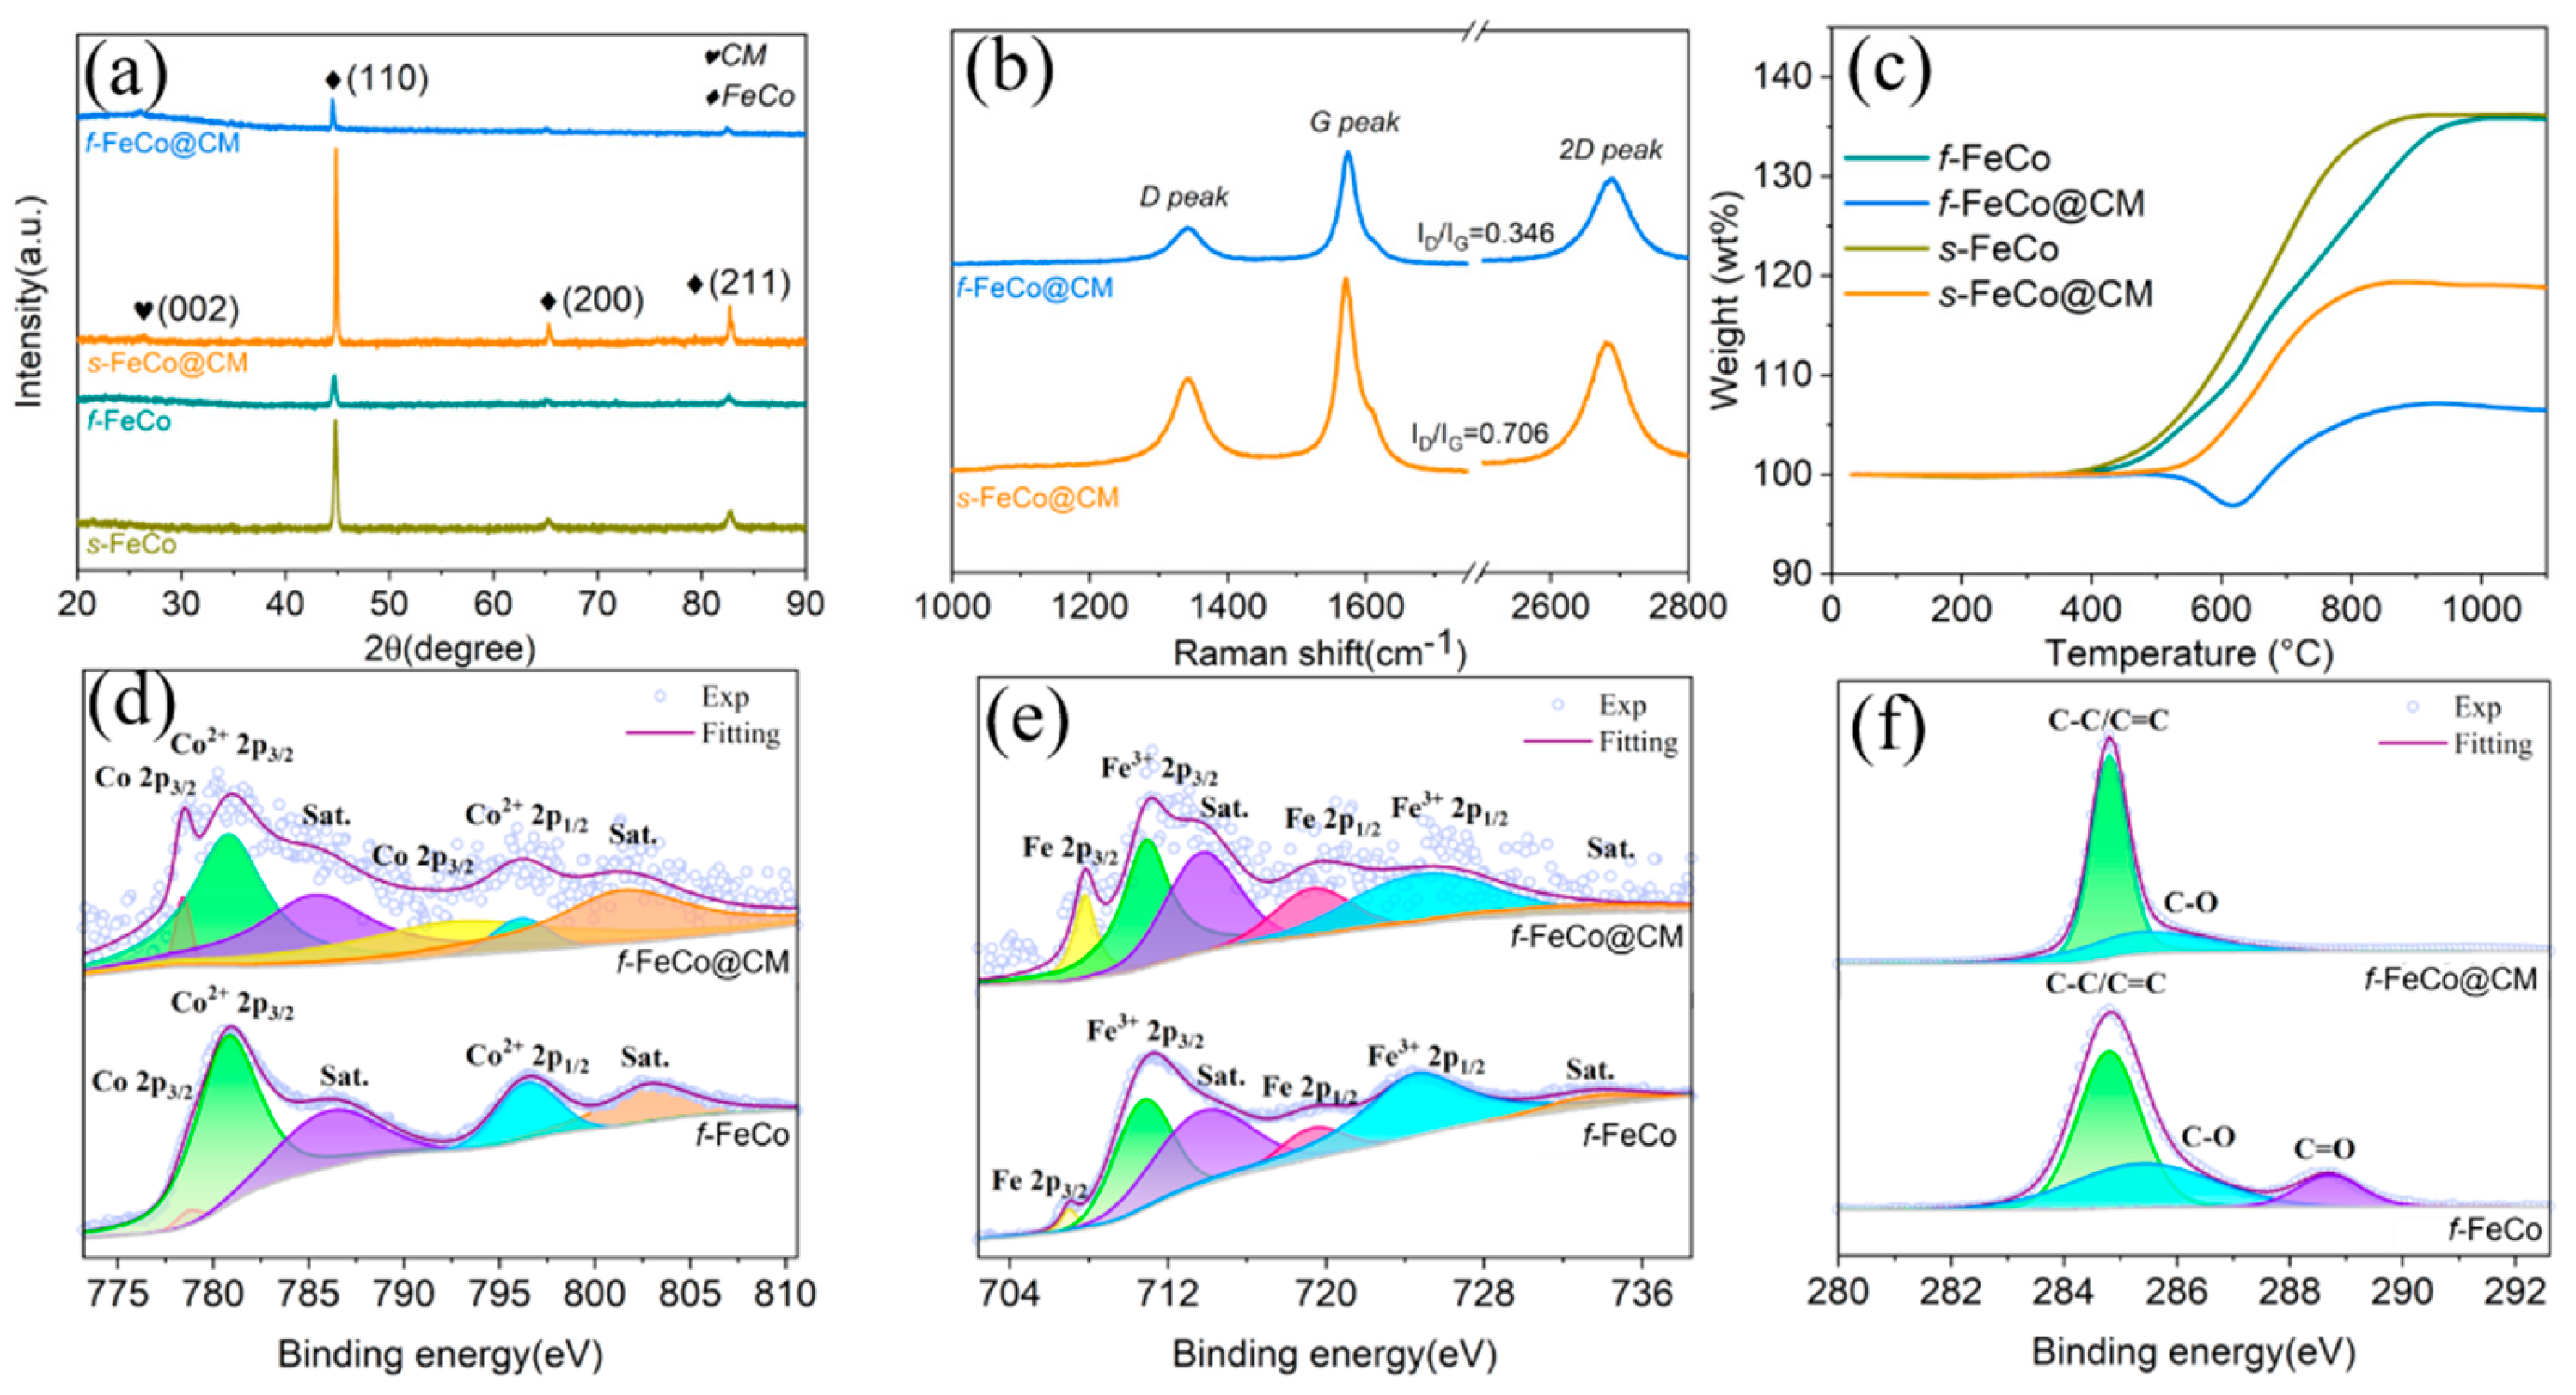
The microstructural and phase compositional analyses of the samples were conducted through XRD patterns. Initially, the XRD pattern of the f-Fe(OH)3/Co(OH)2 precursor (Figure S2a) was examined, revealing peaks at 11°, 22.1°, and 36.8°, attributable to the (0 0 3), (0 0 6), and (1 0 1) crystal planes of the Co(OH)2 (JCPDS #01-0357), respectively. Additionally, characteristic peaks observed at 30.8° and 62.7° corresponded to the (1 1 1) and (4 4 0) crystal planes of the Fe(OH)3 (JCPDS #22-0346), thereby confirming the successful synthesis of the f-Fe(OH)3/Co(OH)2 precursor. Subsequently, XRD phase analysis (Figure 3a) revealed distinct peaks at 44.8°, 65.3°, and 82.7° for both s-FeCo and f-FeCo samples, which matched the (1 1 0), (2 0 0), and (2 1 1) crystal planes of the FeCo (JCPDS #44-1433). This indicated the successful preparation of f-FeCo metal particles utilizing the MPARCVD technique in this study. Moreover, both the XRD patterns of s-FeCo@CM and f-FeCo@CM samples exhibited a peak at 26.4°, corresponding to the (0 0 2) crystal plane of the graphitized carbon (JCPDS #01-0640). This finding confirmed the successful deposition and coating of carbon materials on the surfaces of s-FeCo and f-FeCo samples.
To further probe into the graphitization level of the deposited carbon, Raman spectroscopy was employed. As depicted in Figure 3b, both s-FeCo@CM and f-FeCo@CM samples exhibited three distinctive characteristic peaks, situated near 1350 cm⁻¹, 1580 cm⁻¹, and 2700 cm⁻¹, corresponding to the D, G, and 2D peaks of graphitized carbon, respectively. The D peak serves as an indicator of the proportion of defects, structural distortions, and amorphous regions within the samples. Meanwhile, the G peak represents the primary characteristic peak of graphene. The ID/IG ratio, which measures the intensity ratio between the D and G peaks, can be used to assess the graphitization degree of the carbon material. Specifically, a lower ID/IG value suggests a reduced defect density and a higher graphitization level [51,52]. Based on the analysis in Figure 3b, the ID/IG ratio for f-FeCo@CM was determined to be 0.348, whereas the corresponding value for s-FeCo@CM was 0.706. This significantly lower ID/IG ratio observed for f-FeCo@CM compared to s-FeCo@CM indicated that the carbon microspheres deposited onto the f-FeCo alloy exhibited fewer defects, a higher crystallinity, and a superior graphitization level. This finding validated the successful deposition of carbon microspheres and the coating of a graphite layer onto the surface of f-FeCo metal particles using the MPARCVD technique, resulting in the production of high-purity f-FeCo@CM composite materials. Furthermore, the quality of the deposited carbon material surpassed that coated onto the surface of s-FeCo.
To gain further insights into the variation in oxidation resistance between f-FeCo and f-FeCo@CM, a chemical element analysis was performed using XPS. Upon the XPS survey spectrum of f-FeCo@CM (Figure S2b), distinct peaks corresponding to C 1s, O 1s, Fe 2p, and Co 2p were observed, indicating the presence of C, O, Fe, and Co elements in the composite. Notably, a substantial increase in the C 1s peak intensity of f-FeCo@CM compared to f-FeCo was discerned after carbon deposition, whereas the Co 2p and Fe 2p peaks exhibited a dramatical reduction. This phenomenon was attributed to the coating of a significant amount of carbon material on the surface of f-FeCo@CM, which attenuated the Fe 2p and Co 2p peaks. To evaluate the valence states and bonding states of each element, high-resolution spectra were further analyzed. The Co 2p spectrum (Figure 3d) revealed six distinct peaks, with Co 2p3/2 detected at 778.7 eV and 793.5 eV, indicating the presence of zerovalent cobalt. Peaks corresponding to Co2+ 2p3/2 and its satellite peak were observed at 781.2 eV and 786.0 eV, while Co2+ 2p1/2 and its satellite peak were detected at 797.3 eV and 802.8 eV, both representative of divalent cobalt. The Fe 2p spectrum (Figure 3e) displayed six small peaks, comprising Fe 2p3/2 characteristic peaks and their satellite peaks at 707.5 eV and 713.7 eV, and Fe 2p1/2 detected at 719.0 eV, all attributed to zerovalent iron. Additionally, Fe3+ 2p3/2 was identified at 710.9 eV, and Fe3+ 2p1/2 along with its satellite peaks were observed at 724.8 eV and 733.4 eV, both indicative of trivalent iron. The presence of divalent cobalt and trivalent iron was attributed to the inevitable oxidation process that occurs on the surface of f-FeCo. Furthermore, the deconvoluted areas of Co2+ 2p3/2, Co2+ 2p1/2, Fe3+ 2p3/2, and Fe3+ 2p1/2 in the XPS spectra of f-FeCo@CM were obviously smaller than those of f-FeCo, while the deconvoluted areas of Co 2p3/2 and Fe 2p3/2 were significantly larger. This observation suggested that the carbon microspheres coating on the surface of f-FeCo@CM shielded the inner f-FeCo effectively, significantly improving the oxidation resistance. In the C 1s spectrum (Figure 3f), three distinct peaks were observed. The peaks corresponding to C-C/C=C bonds (representing the bonding state of graphitic carbon) were detected at 284.8 eV and 285.3 eV, while C-O bonds and C=O bonds were identified at 288.7 eV. Notably, the deconvoluted area of the C-O bond peak in f-FeCo@CM was reduced, and the characteristic peak of the C=O bond disappeared, indicating a decrease in oxidized carbon species. In contrast, the deconvoluted area of the C-C/C=C bond was significantly larger than that of f-FeCo, which further validated that carbon deposition could significantly enhance the oxidation resistance of f-FeCo alloy particles.
To assess the relative composition content and antioxidant capacity of different samples, TG analysis was performed in air atmosphere (Figure 3c). The s-FeCo commenced weight gain at 248°C, reaching 136% and remaining stable at 907°C. Similarly, the f-FeCo initiated weight gain at 295°C, achieving 136% and maintaining it until 942°C. The substantial weight increase in both samples was predominantly attributed to the oxidation of FeCo species, reflecting their relatively low antioxidant capacity. In contrast, the s-FeCo@CM sample started gaining weight at 443°C, peaking at 119% and remaining stable at 860°C. Interestingly, the f-FeCo@CM sample exhibited a change in weight only at 500°C, differing from s-FeCo@CM by initially decreasing to 96% at 620°C, followed by an increase to 107% at 893°C. The weight gain in both s-FeCo@CM and f-FeCo@CM samples was due to the oxidation of FeCo species, while the weight loss in f-FeCo@CM was attributed to the combustion of carbon species. Notably, the initial change temperatures for both samples were significantly higher than those of the FeCo samples, indicating that the deposition of carbon material on the FeCo surface effectively enhanced the antioxidant properties. Furthermore, the temperature at which the f-FeCo@CM sample began to exhibit weight changes was higher than that of s-FeCo@CM, suggesting that the high-density carbon coating of f-FeCo@CM resulted in a more significant improvement in antioxidant performance. Besides, only the f-FeCo@CM sample exhibited a significant weight reduction due to carbon combustion, indicating a higher carbon deposition content compared to s-FeCo, which aligned with FESEM observations. Additionally, calculations revealed that the s-FeCo@CM contained 88% s-FeCo species and 12% carbon species, while the f-FeCo@CM comprised 78% f-FeCo species and 22% carbon species.
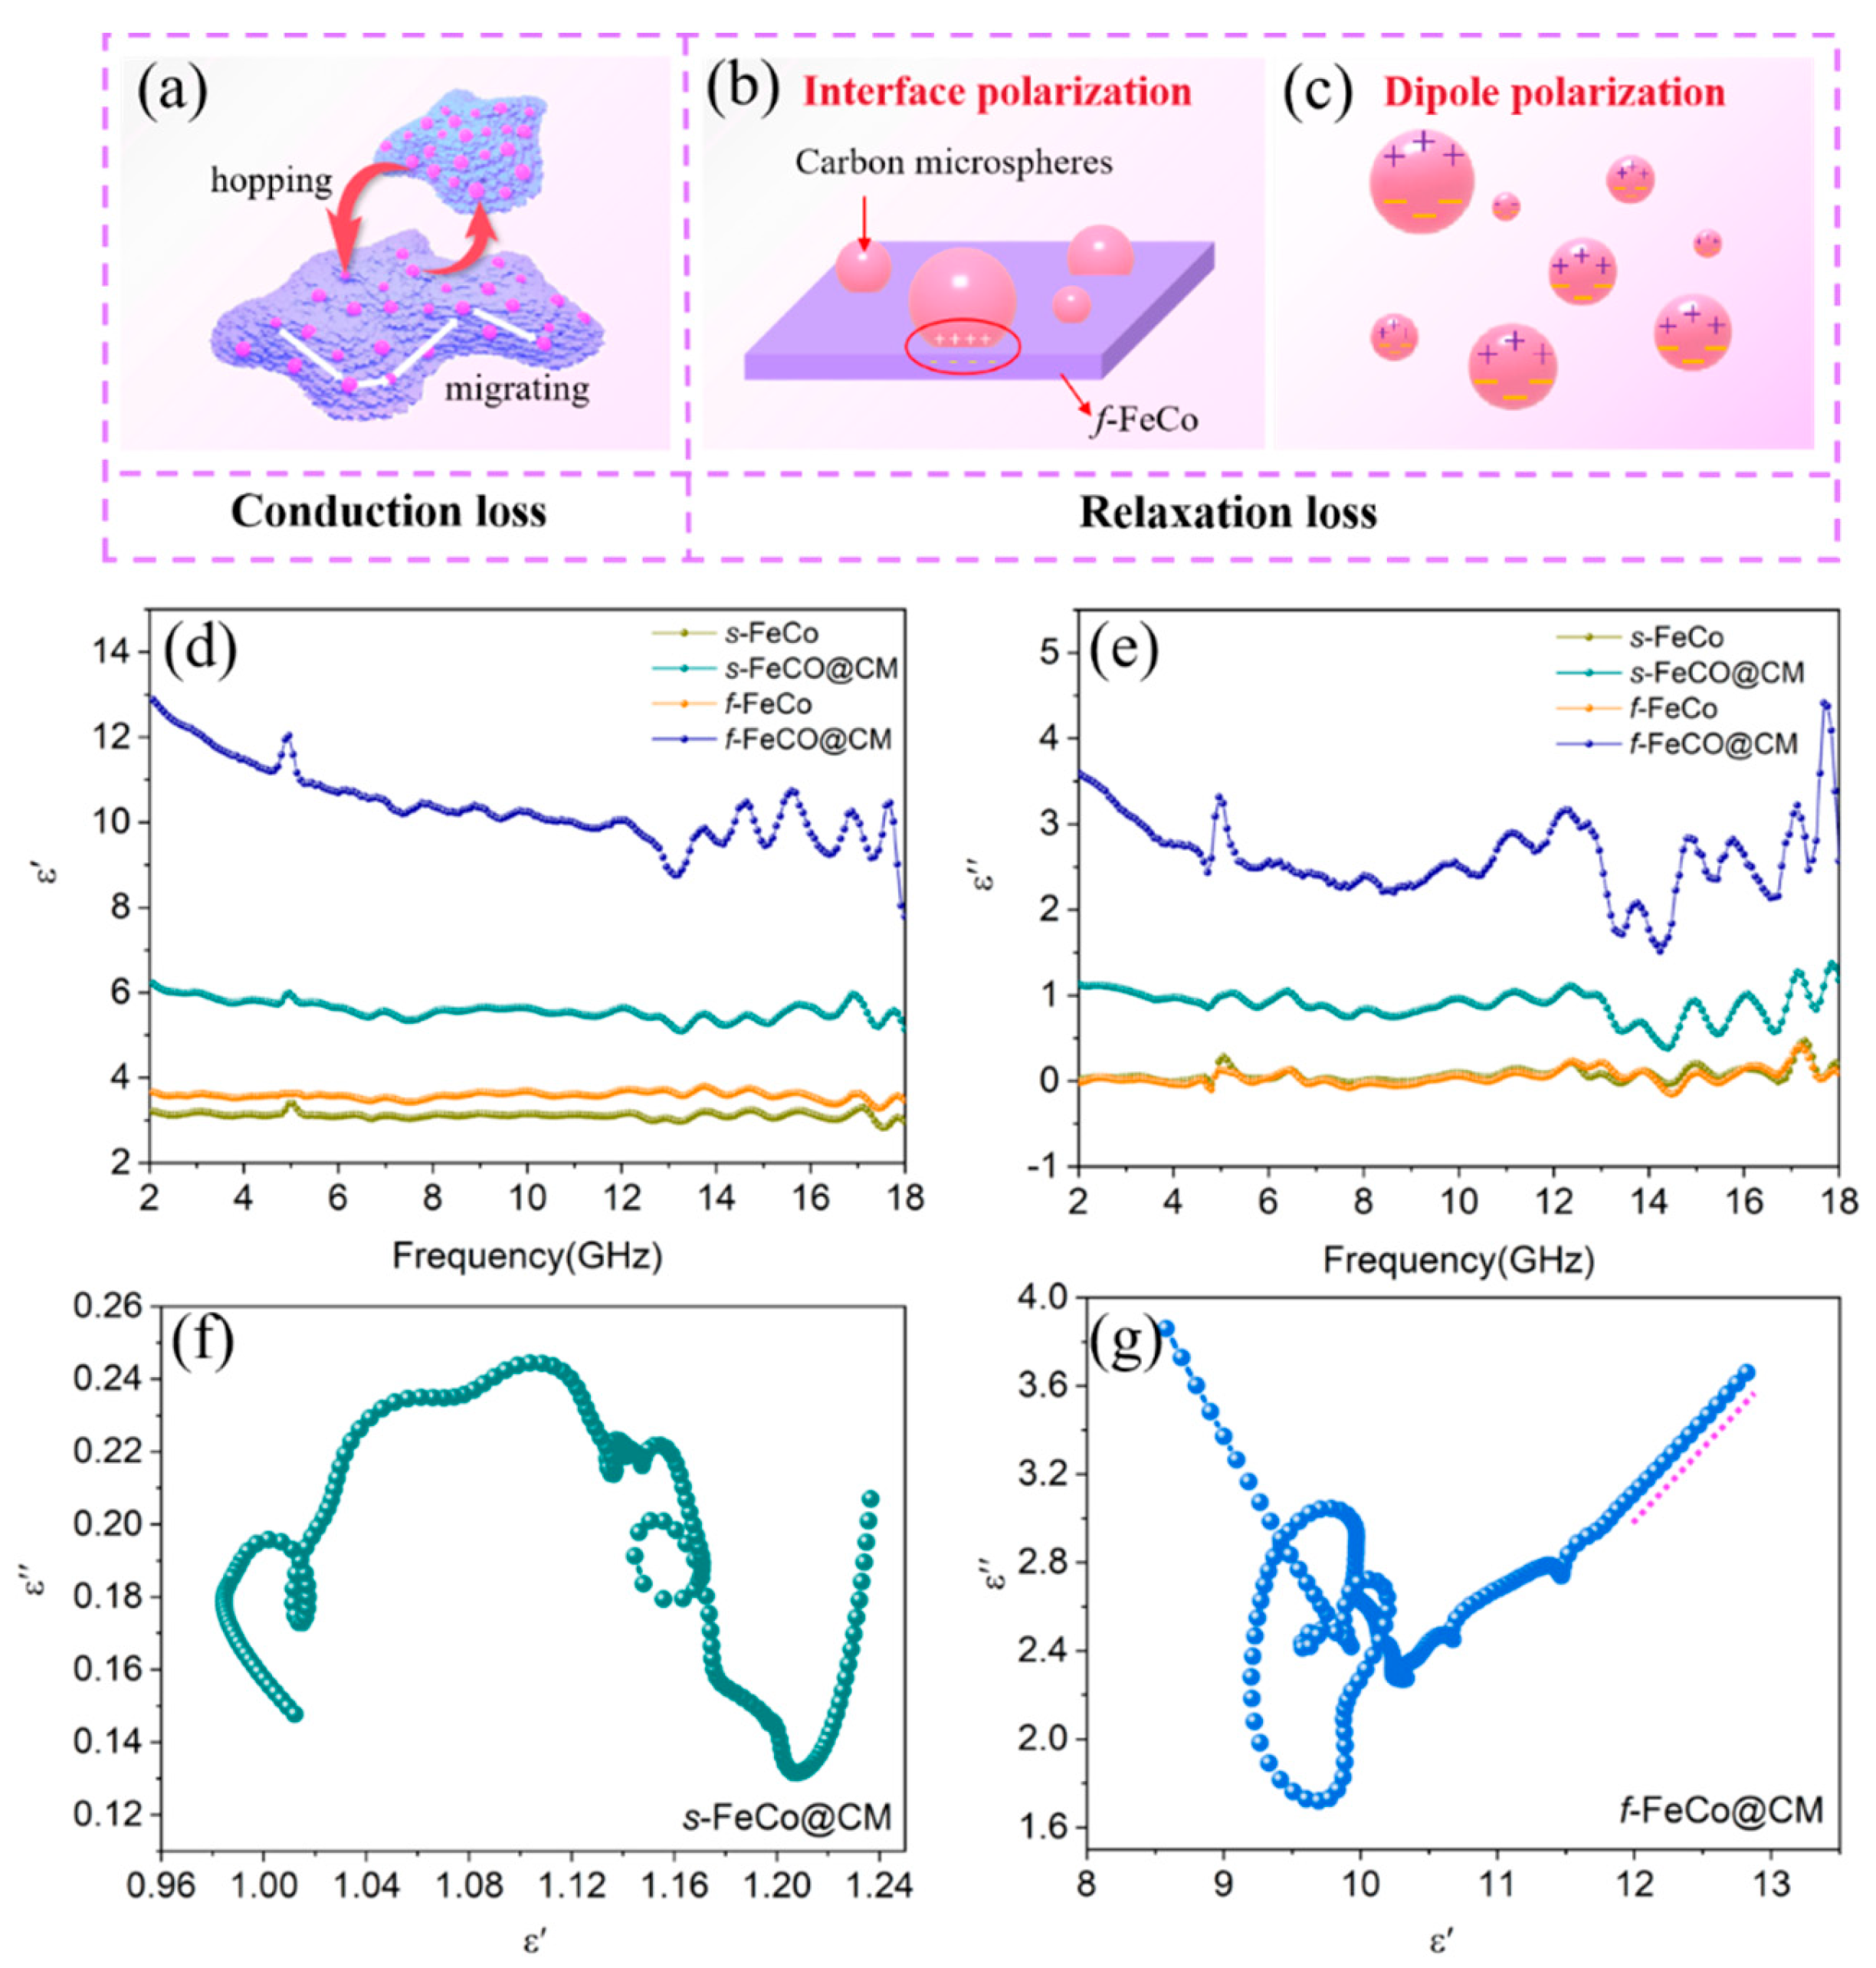
The electromagnetic parameters of various samples, encompassing the complex permittivity (ɛr = ɛ’ - jɛ”) and complex permeability (μr = μ’ - jμ”), were employed to elucidate the influence of composition and microstructural characteristics on microwave absorption properties. Specifically, the real parts (ɛ’ and μ’) signify the storage capacity of electric and magnetic energy, while the imaginary parts (ɛ” and μ”) reflect the dissipation capability of these energies. As depicted in Figure 4d-e, the ɛ” values of s-FeCo and f-FeCo were apparently small, remaining below 1.0 across the entire measurement spectrum. However, following the deposition of carbon microspheres, both ɛ’ and ɛ” values underwent a significant increase. Precisely, the ɛ’ values of s-FeCo@CM and f-FeCo@CM spanned ranges from 12.90 to 7.82 and 6.25 to 5.05, respectively, whereas the ɛ” values of these samples ranged from 4.42 to 1.51 and 1.38 to 0.38, respectively. This marked augmentation underscored the prominent enhancement in the dielectric loss capacity achieved through the integration of FeCo and carbon materials. Additionally, the ɛ’ and ɛ” values of f-FeCo@CM were substantially higher than those of s-FeCo@CM, with the ɛ’ value of f-FeCo also being significantly elevated compared to s-FeCo, which suggested that the f-FeCo exhibited superior carbon deposition catalysis due to its lamellar structure, resulting in a denser and more homogeneous carbon coating. This optimal configuration allowed f-FeCo@CM to possess superior dielectric loss performance. Furthermore, the presence of multiple resonance peaks in the ɛ” value of f-FeCo@CM indicated the existence of diverse dielectric loss mechanisms. Based on the permittivity curves, the tangent of the dielectric loss (tanδε = ɛ”/ɛ’) was calculated (seen in Figure S3c) to assess the dielectric loss capabilities. As observed, the tanδε values of f-FeCo and s-FeCo were exceptionally low. However, following the deposition of carbon, both samples exhibited a substantial increase in tanδε values. Moreover, the tanδε value of f-FeCo@CM was significantly higher than that of s-FeCo@CM, which confirmed that the coating of carbon microspheres effectively enhanced the dielectric loss capability, and the deposition of carbon microspheres on f-FeCo synthesized via MPARCVD technology further improved the dielectric loss performance of f-FeCo@CM, in alignment with the findings derived from the permittivity analysis.
Typically, dielectric loss is attributed to conduction loss and polarization loss. Conduction loss is inherently linked to conductivity, whereas polarization loss depends on interfacial polarization and dipole polarization [53]. The Debye theory [54] is employed to analyze dielectric loss and can be described by the following equations:
ε = ε + ε s ε 1 + ω 2 τ 2
ε = ε s ε 1 + ω 2 τ 2 ω τ + σ ω ε 0
ε ε s + ε 2 2 + ε 2 = ε s + ε 2 2
Wherein, ɛs represents the static permittivity, ɛ represents the optical permittivity, ω is the angular frequency, τ is the relaxation time, and σ is the conductivity. The relationship between ε’ and ε” is expressed in Equation (5). When the ε’-ε” curve forms a semicircle, referred to as the Cole-Cole semicircle, it signifies a polarization relaxation process [55]. Conversely, the presence of a straight-line segment indicates the occurrence of a conductive loss process [56]. The ε’-ε” curve of the f-FeCo@CM sample was illustrated in Figure4g, exhibiting multiple semicircles, indicative of multiple polarization relaxation processes. As depicted in Figure 4b, the f-FeCo@CM exhibited numerous heterogeneous interfaces between carbon microspheres and f-FeCo, which triggered current hysteresis displacement and uneven distribution of positive and negative charges under alternating electric fields, which facilitated the generation of spatial electric dipole moments, ultimately inducing abundant interface polarization. Under the application of an external electromagnetic field, dipole pairs concentrated at the heterogeneous interfaces may become sources of dipole polarization (Figure 4c). Additionally, a distinct straight-line segment at the tail of the ε’-ε” curve indicated that the loss process in the sample was accompanied by conductive loss. As shown in Figure 4a, the carbon microspheres deposited on the surface of f-FeCo provided an ample supply of free electrons, enabling their movement on the f-FeCo alloy sheets and jumps between alloy particles. Consequently, an efficient conductive network was established within the matrix, leading to an enhancement in conductivity. Conversely, the ε’-ε” curve of s-FeCo@CM (Figure 4f) solely exhibited semicircles, devoid of straight-line segments, suggesting that the loss mechanism was exclusively attributed to polarization relaxation loss, excluding conductive loss. Furthermore, the ε’-ε” curves of s-FeCo and f-FeCo, as depicted in Figure S3a-b, did not exhibit distinct semicircles or straight-line segments, indicating that the loss process in FeCo alloys hardly involved polarization relaxation loss or conductive loss under relatively low loading content, resulting in significantly lower dielectric loss intensity compared to materials compounded with carbon materials.
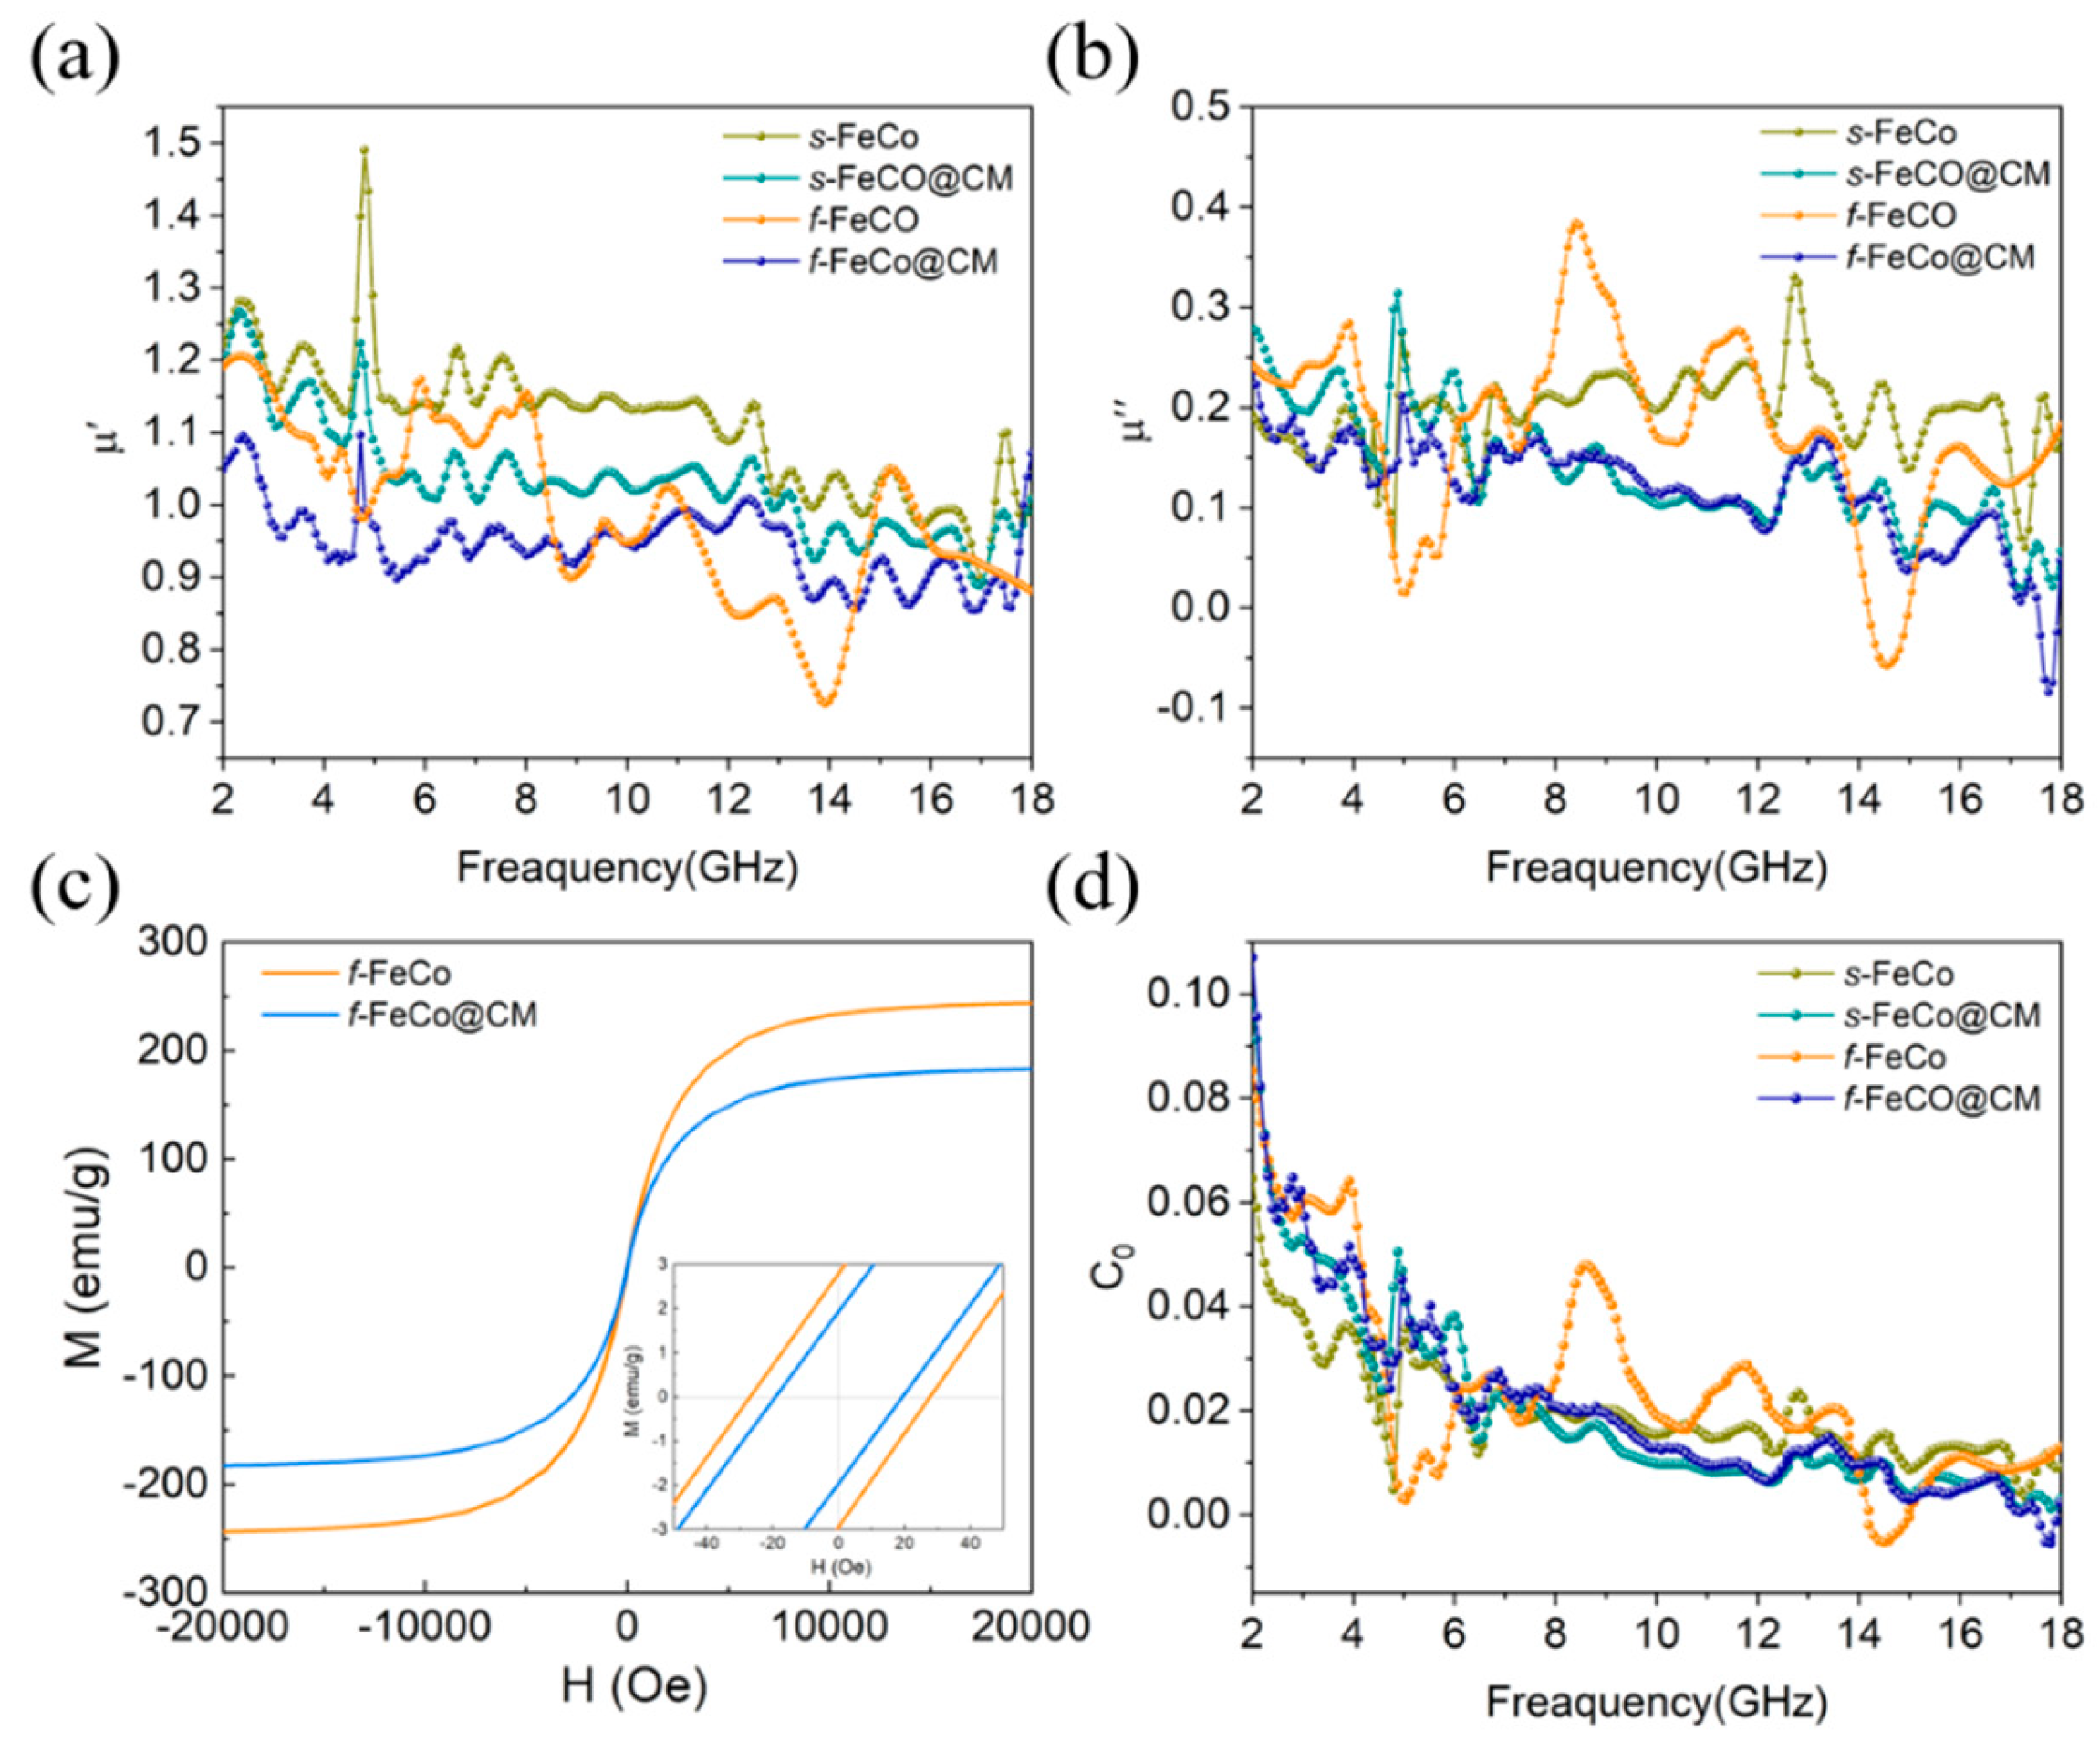
The variation of μ’ and μ” values with frequency for various samples were depicted in Figure 5a-b. The f-FeCo sample exhibited μ’ and μ” values fluctuating within the ranges of 1.29-0.70 and 0.73-0.03, respectively. In the case of f-FeCo@CM, the μ’ and μ” values varied between 1.07-0.85 and 0.24-0, respectively. The μ’ and μ” values for s-FeCo ranged from 1.49-0.91 and 0.33-0.05, while those of s-FeCo@CM were within 1.27-0.89 and 0.31-0.02, respectively. In contrast to the dielectric constant curves of these four samples, the differences in μ’ and μ” values were minimal, indicating that the introduction of carbon materials had a limit effect on the magnetic properties of the FeCo alloy. This observation was attributed to the excellent chemical stability of carbon microspheres, which effectively enhanced the oxidation resistance of magnetic metals, thereby minimizing structural damage and preserving their inherent magnetic properties. The magnetization curves (M-H) of the four samples were measured at room temperature, as shown in Figure 5c-d. According to the literature [57], the μr can be calculated using the following equation:
μ r = M s 2 μ 0 ( α κ H c M s + b λ ξ )
where α and b are constants determined by the material composition, κ is the proportionality coefficient, λ is the magnetostrictive coefficient, and ξ is the elastic strain parameter. As can be seen from the above equation, a higher magnetic saturation (Ms) value and a lower coercivity (Hc) value were found to enhance the permeability (μr) of the material, thereby indicating improved magnetic loss capability. As displayed in Figure 5c, the Ms values for f-FeCo and f-FeCo@CM were recorded as 243.9 emu/g and 182.8 emu/g, respectively, while the Hc values were 28.1 Oe and 19.1 Oe, correspondingly. Notably, the Ms and Hc values of f-FeCo@CM exhibited a slight reduction compared to f-FeCo, as evident from the bar chart depicted in Figure S4b. The Ms value was influenced by the atomic magnetic moment and the density of ferromagnetic atoms per unit volume [58]. The deposition of non-ferromagnetic carbon microspheres could reduce the number of ferromagnetic atoms per unit volume, thus leading to a decrease in the Ms value. Furthermore, the coercivity of magnetic materials was closely linked to magnetic crystal anisotropy and material defects [59]. Given the similarity in composition and morphology of f-FeCo alloy, the variations in Hc in this study were dependent on the defect conditions within the material system. According to the magnetic domain wall pinning model [60], disordered defects within the material impede the movement of magnetic domain walls, resulting in elevated Hc values. However, in this study, the deposition of graphitized carbon microspheres mitigated the disordered defects on the surface of f-FeCo alloy particles, thereby resulting in a lower Hc value for f-FeCo@CM compared to f-FeCo. Upon thorough analysis, it was discerned that the magnetic properties of f-FeCo less influenced after coating with carbon microspheres, aligning with the permeability analysis results. Further examination of the magnetic loss tangent (tanδμ = μ”/μ’) for the four samples, as depicted in Figure S3c, revealed the presence of multiple resonance peaks. These peaks were attributed to surface effects, nano-size effects, and spin-wave excitations [61]. In the context of magnetic theory, magnetic loss was intricately linked to domain wall resonance, hysteresis loss, natural resonance, exchange resonance, and eddy current loss. For the microwave absorption band spanning 2-18 GHz, domain wall resonance and hysteresis loss can be disregarded [62]. According to Aharoni’s theory [63], the resonance peaks observed in the 2-8 GHz range of the tanδμ curve were attributed to natural resonance, while those in the higher frequency range correspond to exchange resonance. Additionally, eddy current effects constituted a significant contributor to magnetic loss [64]. To gain a deeper understanding of the role of eddy current loss, the C0 coefficient were introduced and calculated by the following equation:
C 0 = μ ' ' ( μ ' ) 2 f 1
According to commonly accepted standards, the eddy current loss is considered a component of magnetic loss when the C0 value remains constant with increasing frequency. Conversely, if the C0 value is invariant across frequencies, the impact of eddy current loss is negligible. As depicted in Figure 5d, the eddy current curves of all four samples underwent substantial variations with frequency, thereby excluding the influence of eddy current loss on the magnetic loss. This observation suggested that the magnetic loss in s-FeCo@CM and f-FeCo@CM composites was primarily attributed to natural resonance and exchange resonance, stemming from the intrinsic magnetic properties of s-FeCo and f-FeCo.
The impedance matching characteristics and attenuation constant are significant factors determining the absorption performance of EAMs. The impedance matching characteristics can be evaluated using the following formula [65]:
Z i n = Z 0 μ r ε r tan h j 2 π f d c μ r ε r
| Z | = Z i n Z 0
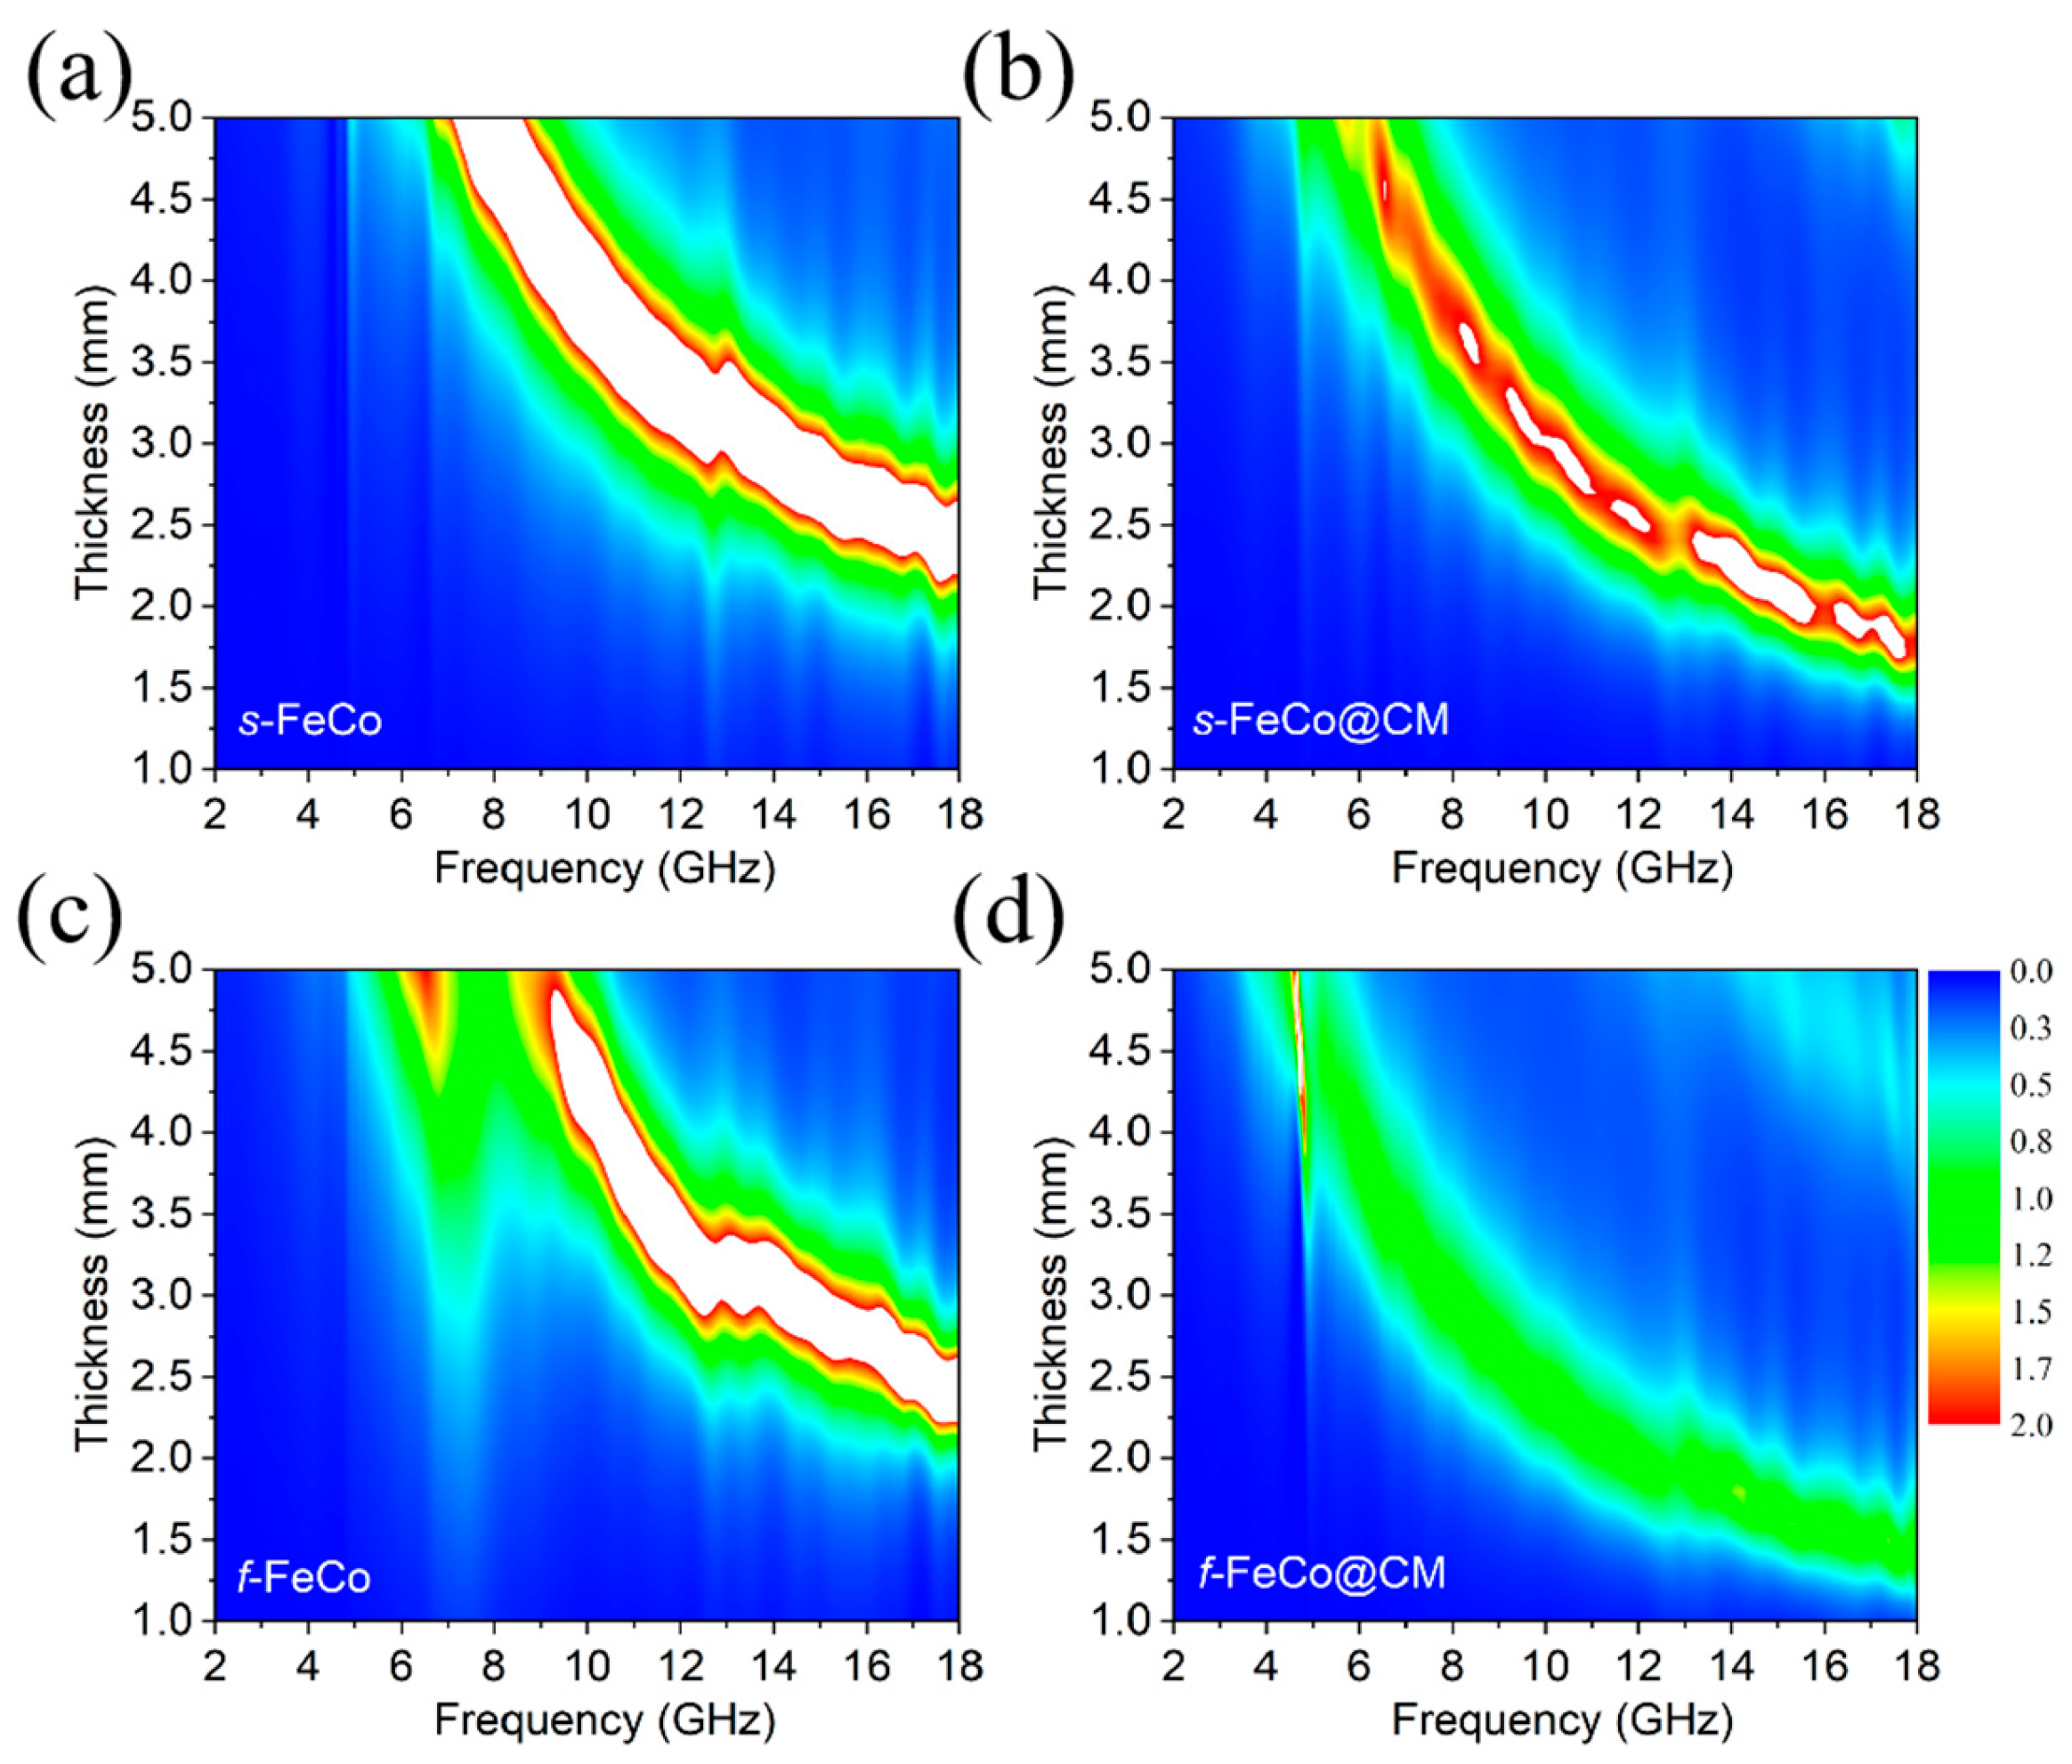
wherein, Z0 and Zin represent the impedance of free space and the input impedance of the electromagnetic wave absorber, respectively, ɛr and μr are the complex permittivity and complex permeability, respectively, f is the frequency of the electromagnetic wave, d is the thickness of the electromagnetic wave absorber, c is the speed of light. Good impedance matching typically requires that the absolute value of the impedance (|Z|) approximates or equals 1. The |Z| values of the four samples were presented in 2D color maps in Figure 6a-d, where green areas signified the proximity of |Z| to 1. Upon introducing carbon materials into the magnetic material system, whether in the form of s-FeCo@CM or f-FeCo@CM, a remarkable expansion in the green regions of their respective 2D color maps was observed, indicating a significant enhancement in impedance matching characteristics. Specifically, f-FeCo@CM (depicted in Figure 6d) exhibited the most optimal impedance matching characteristic, suggesting that the utilization of lamellar f-FeCo alloy as a catalyst for growing carbon microspheres on its surface could enhance the dielectric properties of the composite, thus attaining the best impedance matching performance. The attenuation constant serves as a crucial parameter for evaluating the capacity of EAMs to attenuate electromagnetic waves, where a higher value indicates a stronger ability to absorb and convert electromagnetic wave energy. The attenuation constant (α) was calculated using the following formula [66]:
α = 2 π f c × μ ε μ ε + μ ε μ ε 2 μ ε + μ ε 2
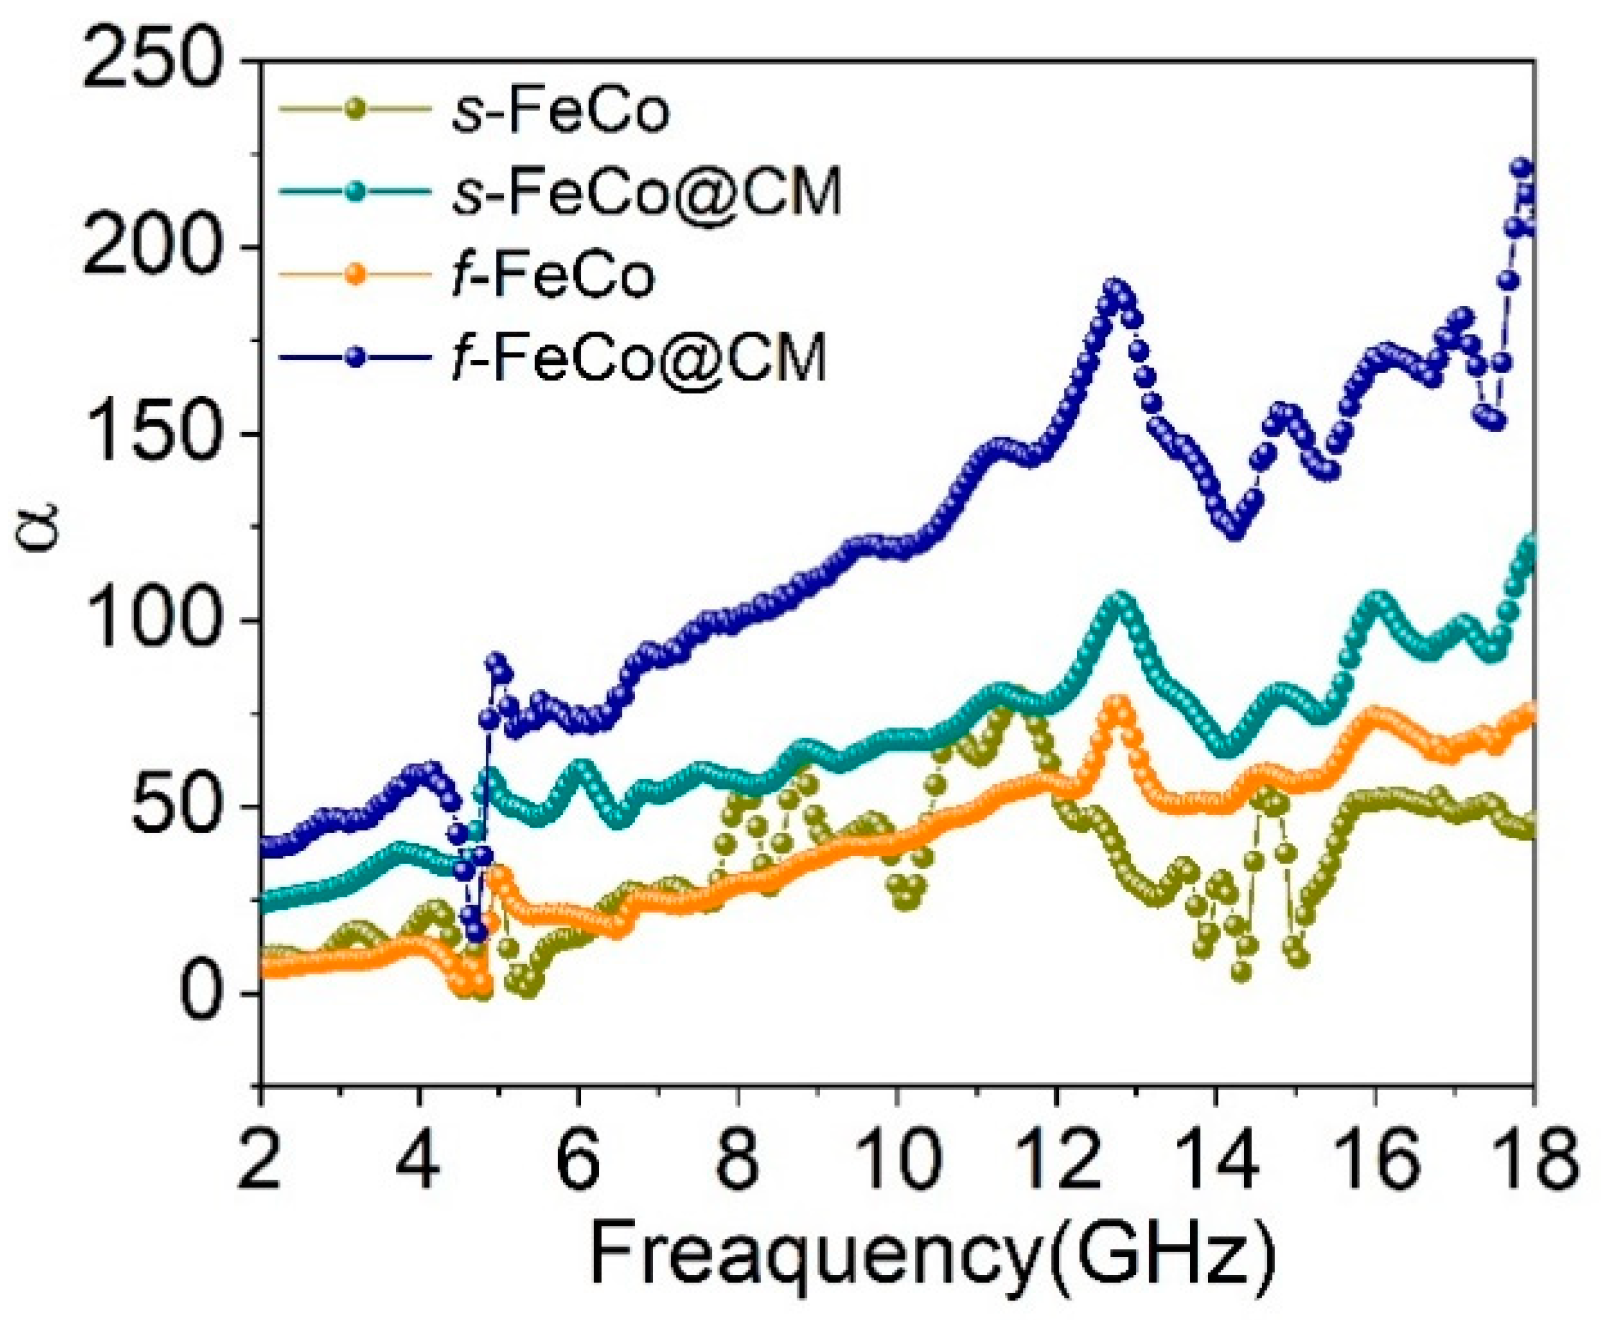
The correlation between the α values and frequency for the four samples were displayed in Figure7. Initially, it was evident that following the integration of carbon microspheres into the magnetic material system, the α values of both s-FeCo@CM and f-FeCo@CM underwent an increase, although the enhancement in α for f-FeCo@CM was more significant than that observed for s-FeCo@CM. This augmentation was attributed to the superior quality and quantity of carbon microspheres deposited onto the surface of f-FeCo. Specifically, f-FeCo@CM exhibited the highest α value, peaking at 221, indicative of its superior electromagnetic wave attenuation capabilities. Furthermore, as the frequency escalated, an upward trend in the α values of all samples was observed. Consequently, the growth of graphitized carbon microspheres on the surface of lamellar f-FeCo alloy was found to concurrently optimize the impedance matching and electromagnetic wave attenuation performance of the magnetic FeCo alloy.
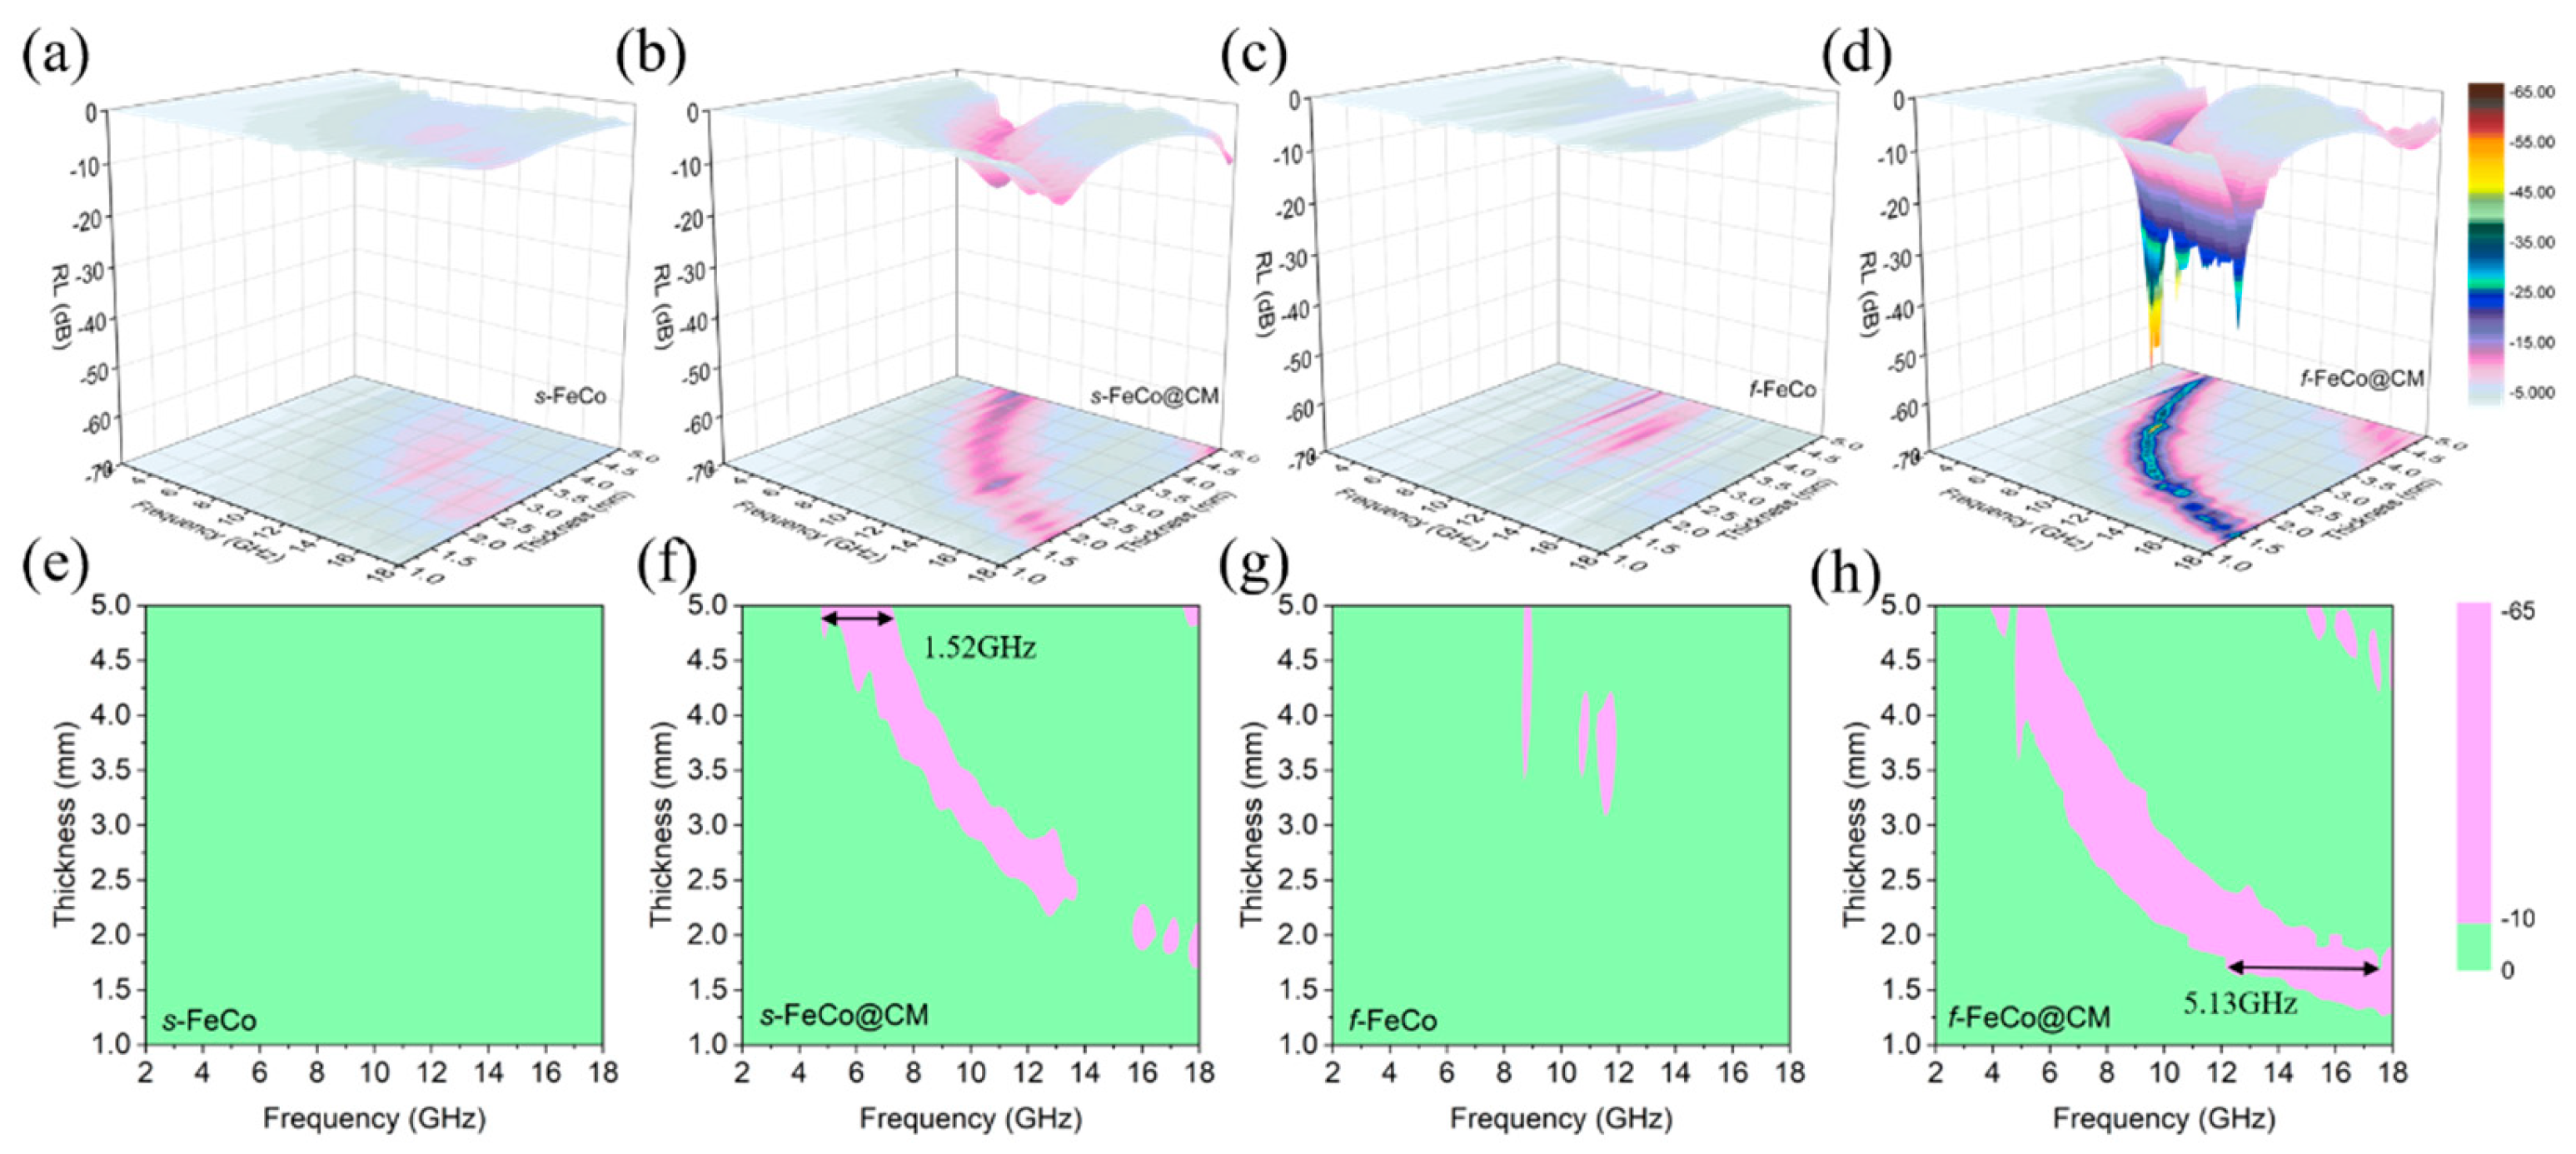
The RL values for four different samples were calculated, and their respective 3D color maps representing the frequency and thickness dependences were depicted in Figure 8a-d, while the corresponding 2D color maps were presented in Figure 8e-h. Upon growing carbon microspheres onto the surface of FeCo magnetic alloy metals, both the performances of RL and the fE improved significantly. Specifically, s-FeCo attained an RLmin value of -7.1 dB at 12.8 GHz with a matching thickness of 3.5 mm. In contrast, s-FeCo@CM achieved an RLmin value of -15.1 dB at 6 GHz, accompanied by a matching thickness of 5 mm and an fE of 1.52 GHz (5.68-7.20 GHz). For f-FeCo, an RLmin value of -12.8 dB was recorded at 8.8 GHz, with a matching thickness of 4.4 mm and an fE of 0.16 GHz (8.72-8.88 GHz). However, f-FeCo@CM demonstrated a remarkably RLmin value of -58.2 dB at 7.84 GHz, accompanied by a significantly reduced matching thickness of only 3.0 mm and an expanded fE of 5.13 GHz (12.31-17.44 GHz). This exceptional reflection loss performance of f-FeCo@CM was attributed to the composite structure of lamellar f-FeCo alloy and carbon microspheres, which concurrently enhanced its impedance matching and electromagnetic wave dissipation capabilities, thus making it a promising candidate for achieving high-strength EAM.

4. Conclusions

In summary, the f-FeCo@CM composite was successfully synthesized via an advanced MPARCVD technique, efficiently decorating the lamellar f-FeCo particles with a substantial amount of high-quality graphitized carbon microspheres. This approach introduced numerous heterogeneous interfaces, leading to the creation of spatial electric dipole moments and triggering robust interface polarization. Additionally, the carbon microspheres imparted a considerable number of free electrons, thereby augmenting conduction loss. Consequently, the dielectric loss of the f-FeCo@CM composite primarily stemmed from interface and dipole polarization, along with conduction loss. The magnetic loss of f-FeCo@CM was primarily attributed to natural resonance and exchange resonance, stemming from the inherent magnetic properties of f-FeCo, which remained largely unaffected following carbon deposition. This allowed for effective modulation of the permittivity value of f-FeCo@CM without compromising its magnetic loss capabilities, significantly enhancing the dielectric loss capacity and further optimizing impedance matching. Notably, f-FeCo@CM exhibited exceptional electromagnetic wave absorption performance at a 40 wt% filling content. Specifically, at a frequency of 7.84 GHz, it achieved an RLmin of -58.2 dB and a fE spanning 5.13 GHz (12.31-17.44 GHz). In contrast, the s-FeCo@CM composite synthesized under identical conditions displayed a significantly lower RLmin of -15.1 dB and a narrower fE of 1.52 GHz (5.68-7.2 GHz). This demonstrates that the flaky f-FeCo synthesized through the combined hydrothermal synthesis and MPARCVD techniques in this study possessed a superior electromagnetic wave absorption potential, positioning f-FeCo@CM composites as promising candidates for advanced EAMs in various future applications.

Supplementary Materials

The following supporting information can be downloaded at the website this paper posted on Preprints.org, Figure S1: (a-b) SEM images and (c) EDS scanning element distribution map of Fe(OH)3/Co(OH)2 precursor. Figure S2: (a) XRD pattern of f-Fe(OH)3/Co(OH)2 precursor; (b) XPS spectra scan of f-FeCo and f-FeCo@CM samples. Figure S3: (a) ɛ’-ɛ’’ curves of s-FeCo and (b) f-FeCo; (c) Dielectric loss tangent curves of different samples. Figure S4: (a) Tangent curves of magnetic loss for different samples; (b) Bar chart of saturation magnetization (Ms) and coercivity (Hc) for f-FeCo and f-FeCo@CM samples.

Author Contributions

Conceptualization, X.J. and F.L.; Methodology, X.J. and C.L.; Data curation, X.J. and H.Z.; Software, Q.Y.; Funding acquisition, X.W. and M.P.; Formal analysis, C.L.; Investigation; X.W and F.L.; Project administration; M.P.; Writing—original draft preparation, X.J.; Writing—review and editing, M.P. All authors have read and agreed to the published version of the manuscript.

Funding

This research was funded by the National Natural Science Foundation of China (No. 51602306, No.52272096), Natural Science Foundation of Chongqing, China (No. CSTB2022NSCQ-MSX1351), Venture Innovation Support Program for Chongqing Overseas Returnees (No. cx2019074).

Data Availability Statement

Data are contained within the article.

Conflicts of Interest

The authors declare no conflicts of interest.

References

  1. Yang, Y.; Han, M.; Liu, W.; Wu, N.; Liu, J. Hydrogel-based composites beyond the porous architectures for electromagnetic interference shielding. Nano. Res. 2022, 15(10), 9614–9630. [Google Scholar] [CrossRef]
  2. Wang, Q.; Niu, B.; Han, Y.; Zheng, Q.; Li, L.; Cao, M. Nature-inspired 3D hierarchical structured “vine” for efficient microwave attenuation and electromagnetic energy conversion device. Chem. Eng. J. 2023, 452, 139042. [Google Scholar] [CrossRef]
  3. Wang, X.; Zhang, F.; Hu, F.; Li, Y.; Chen, Y.; Wang, H.; Min, Z.; Zhang, R. N-doped honeycomb-like Ag@N-Ti3C2Tx foam for electromagnetic interference shielding. Nanomaterials 2022, 12(17), 2967. [Google Scholar] [CrossRef] [PubMed]
  4. Li, K.; Han, L.; Wang, X.; Gao, F.; Zhang, J.; Cheng, J. MOF-derived CoNC@rGO/amine-rich@rGO/fluorinated-epoxy nanocomposites with EMI shielding, mechanical robustness, superamphiphobicity and long-term anticorrosion properties. Chem. Eng. J. 2023, 455, 140542. [Google Scholar] [CrossRef]
  5. Liu, H.; Cui, G.; Li, L.; Zhang, Z.; Lv, X.; Wang, X. Polypyrrole chains decorated on CoS spheres: A core-shell like heterostructure for high-performance microwave absorption. Nanomaterials 2020, 10(1), 166. [Google Scholar] [CrossRef] [PubMed]
  6. Ma, M.; Zheng, Q.; Zhang, X.; Li, L.; Cao, M. VSe2/CNTs nanocomposites toward superior electromagnetic wave absorption performance. Carbon 2023, 212, 118159. [Google Scholar] [CrossRef]
  7. Yang, X.; Qin, Y.; Peng, L.; Pan, M.; Xu, H. Lightweight and anti-corrosive carbon nanotubes (CNTs)/bamboo fiber/HDPE composite for efficient electromagnetic interference shielding. Colloid Surface A 2023, 672, 131746. [Google Scholar] [CrossRef]
  8. Zhang, H.; Liu, J.; Xu, J.; Zhang, F.; Cui, X.; Sun, S. Electromagnetic radiation-based IC device identification and verification using deep learning. Eurasip J. Wirel. Comm. 2020, 2020, 206. [Google Scholar] [CrossRef]
  9. Che, R.; Peng, L.; Duan, X.; Chen, Q.; Liang, X. Microwave absorption enhancement and complex permittivity and permeability of Fe encapsulated within carbon nanotubes. Adv. Mater. 2004, 16(5), 401–405. [Google Scholar] [CrossRef]
  10. Lv, H.; Yang, Z.; Wang, P.; J, G.; Song, J.; Zheng, L.; Zeng, H.; Xu, Z. A voltage-boosting strategy enabling a low-frequency, flexible electromagnetic wave absorption device. Adv. Mater. 2018, 30(15), 1706343. [Google Scholar] [CrossRef]
  11. Liu, Q.; Cao, Q.; Bi, H.; Liang, C.; Yuan, K.; She, W.; Yang, Y.; Che, R. CoNi@SiO2@TiO2 and CoNi@ Air@TiO2 microspheres with strong wideband microwave absorption. Adv. Mater. 2016, 28(3), 486–490. [Google Scholar] [CrossRef] [PubMed]
  12. Cao, M.; Wang, X.; Cao, W.; Fang, X.; Wen, B.; Yuan, J. Thermally driven transport and relaxation switching self-powered electromagnetic energy conversion. Small 2018, 14(29), 1800987. [Google Scholar] [CrossRef] [PubMed]
  13. Sista, Ka.; Dwarapudi, S.; Kumar, D.; Sinha, G.; Moon, A. Carbonyl iron powders as absorption material for microwave interference shielding: A review. J. Alloys Compd. 2021, 853, 157251. [Google Scholar] [CrossRef]
  14. Cheng, J.; Zhang, H.; Ning, M.; Raza, H.; Zhang, D.; Zheng, G.; Zheng, Q.; Che, R. Emerging materials and designs for low- and multi-band electromagnetic wave absorbers: The search for dielectric and magnetic synergy. Adv. Funct. Mater. 2022, 32(23), 2200123. [Google Scholar] [CrossRef]
  15. Liu, Q.; Cao, Q.; Bi, H.; Liang, C.; Yuan, K.; She. W.; Yang, Y.; Che, R. CoNi@SiO2@TiO2 and CoNi@Air@TiO2 microspheres with strong wideband microwave absorption. Adv. Mater. 2015, 28(3), 486–490. [Google Scholar] [CrossRef]
  16. Zhang, Y.; Kong, J.; Gu, J. New generation electromagnetic materials: harvesting instead of dissipation solo. Sci. Bull. 2022, 67(14), 1413–1415. [Google Scholar] [CrossRef]
  17. Liang, B.; Wang, S.; Kuang, D. Facile synthesis and excellent microwave absorption properties of FeCo-C core–shell nanoparticles. Nanotechnology 2018, 29(8), 085604. [Google Scholar] [CrossRef] [PubMed]
  18. Lv, H.; Ji, G; Wang, M. Hexagonal-cone like of Fe50Co50 with broad frequency microwave absorption, Effect of ultrasonic irradiation time. J. Alloys Compd. 2014, 615, 1037–1042. [Google Scholar] [CrossRef]
  19. Chen, N.; Jiang, J.; Xu, C. Co7Fe3 and Co7Fe3@SiO2 nanospheres with tunable diameters for high-performance electromagnetic wave absorption. ACS Appl. Mater. Interfaces. 2017, 9(26), 21933–21941. [Google Scholar] [CrossRef]
  20. Kuang, D.; Hou, L.; Wang, S. Large-scale synthesis and outstanding microwave absorption properties of carbon nanotubes coated by extremely small FeCo-C core-shell nanoparticles. Carbon 2019, 153, 52–61. [Google Scholar] [CrossRef]
  21. Jiang, Q.; Liu, H.; Cao, Z. Synthesis and enhanced electromagnetic wave absorption performance of amorphous CoxFe10-x alloys. J. Alloys Compd. 2017, 726, 1255–1261. [Google Scholar] [CrossRef]
  22. Cheng, Y.; Ji, G.; Li, Z. Facile synthesis of FeCo alloys with excellent microwave absorption in the whole Ku-band, Effect of Fe/Co atomic ratio. J. Alloys Compd. 2017, 704, 289–295. [Google Scholar] [CrossRef]
  23. Yang, Z.; You, W.; Xiong, X. Morphology-evolved succulent-like FeCo microarchitectures with magnetic configuration regulation for enhanced microwave absorption. ACS Appl. Mater. Interfaces 2022, 14(28), 32369–32378. [Google Scholar] [CrossRef] [PubMed]
  24. Wang, Y.; Sun, Y.; Zong, Y. Carbon nanofibers supported by FeCo nanocrystals as difunctional magnetic/dielectric composites with broadband microwave absorption performance. J. Alloys Compd. 2020, 824, 153980. [Google Scholar] [CrossRef]
  25. Wang, B.; Ding, M.; Shao, C. Facile synthesis of CoxFey@C nanocomposite fibers derived from pyrolysis of cobalt/iron chelate nanowires for strong broadband electromagnetic wave absorption. Chem. Eng. J. 2023, 465, 142803. [Google Scholar] [CrossRef]
  26. Kuang, D.; Hou, L.; Wang, S. Large-scale synthesis and outstanding microwave absorption properties of carbon nanotubes coated by extremely small FeCo-C core-shell nanoparticles. Carbon 2019, 153, 52–61. [Google Scholar] [CrossRef]
  27. Ajia, S.; Asa, H; Toyoda, Y. Development of an alternative approach for electromagnetic wave absorbers using Fe–Cr–Co alloy powders. J. Alloys Compd. 2022, 903, 163920. [Google Scholar] [CrossRef]
  28. Zhu, H.; Jiao, Q.; Fu, R. Cu/NC@Co/NC composites derived from core-shell Cu-MOF@Co-MOF and their electromagnetic wave absorption properties. J. Colloid Interf. Sci. 2022, 613, 182–193. [Google Scholar] [CrossRef]
  29. Amini, M.; Kamkar, M.; Rahmani, F. Multilayer structures of a Zn0.5Ni0.5Fe2O4-reduced graphene oxide/PVDF nanocomposite for tunable and highly efficient microwave absorbers. ACS Appl. Electron. Mater. 2021; 3, 12, 5514–5527. [Google Scholar]
  30. Wen, C.; Xiao, L.; Zhang, R. High-density anisotropy magnetism enhanced microwave absorption performance in Ti3C2Tx MXene@Ni microspheres. ACS Nano 2021, 16(1), 1150–1159. [Google Scholar]
  31. Qiang, R.; Du, Y.; Zhao, H. Metal organic framework-derived Fe/C nanocubes toward efficient microwave absorption. J. Mater. Chem. A 2015, 3(25), 13426–13434. [Google Scholar] [CrossRef]
  32. Lu, M.; Cao, M.; Chen, Y.; Cao, W.; Liu, J.; Shi, H.; Zhang, D.; Wang, W.; Yuan, J. Multiscale assembly of grape-like ferroferric oxide and carbon nanotubes: A smart absorber prototype varying temperature to tune intensities. ACS Appl. Mater. Interfaces 2015, 7(34), 19408–19415. [Google Scholar] [CrossRef] [PubMed]
  33. Chen, X.; Wang, W.; Shi, T.; Wu, G.; Lu, Y. One pot green synthesis and EM wave absorption performance of MoS2@nitrogen doped carbon hybrid decorated with ultrasmall cobalt ferrite nanoparticles. Carbon 2020, 163, 202–212. [Google Scholar] [CrossRef]
  34. Zhang, N.; Huang, Y.; Liu, D.; Wang, M. High efficiency microwave absorption nanocomposites of multiple-phase core-shell CoNi alloy@C loaded on rGO conducting network. Compos. Part A-Appl. S. 2018, 115, 283–293. [Google Scholar] [CrossRef]
  35. Li, H.; Hou, Y.; Li, L. Synthesis of the SiO2@C composites with high-performance electromagnetic wave absorption. Powder Technol. 2019, 343, 129–136. [Google Scholar] [CrossRef]
  36. Liang, B.; Wang, S.; Kuang, D. Facile synthesis and excellent microwave absorption properties of FeCo-C core–shell nanoparticles. Nanotechnology 2018, 29(8), 085604. [Google Scholar] [CrossRef] [PubMed]
  37. Kuang, D.; Hou, L.; Wang, S. Large-scale synthesis and outstanding microwave absorption properties of carbon nanotubes coated by extremely small FeCo-C core-shell nanoparticles. Carbon 2019, 153, 52–61. [Google Scholar] [CrossRef]
  38. Liu, D.; Qiang, R.; Du, Y. Prussian blue analogues derived magnetic FeCo alloy/carbon composites with tunable chemical composition and enhanced microwave absorption. J. Colloid Interf. Sci. 2018, 514, 10–20. [Google Scholar] [CrossRef]
  39. Fan, Y.; Li, Y.; Yao, Y. Hierarchically porous carbon sheets/Co nanofibers derived from corncobs for enhanced microwave absorbing properties. Appl. Surf. Sci. 2020, 534, 147510. [Google Scholar] [CrossRef]
  40. Li, J.; Miao, P.; Chen, K. Highly effective electromagnetic wave absorbing Prismatic Co/C nanocomposites derived from cubic metal-organic framework. Compos. Part B-Eng. 2020, 182, 107613. [Google Scholar] [CrossRef]
  41. Wang, L.; Wen, B.; Yang, H. Hierarchical nest-like structure of Co/Fe MOF derived CoFe@C composite as wide-bandwidth microwave absorber. Compos. Part A-Appl. S. 2020, 135, 105958. [Google Scholar] [CrossRef]
  42. Wang, F.; Wang, N.; Han, X. Core-shell FeCo@carbon nanoparticles encapsulated in polydopamine-derived carbon nanocages for efficient microwave absorption. Carbon 2019, 145, 701–711. [Google Scholar] [CrossRef]
  43. Duan, Y.; Hu, T.; Yang, L. Facile fabrication of electroactive microporous Co3O4 through microwave plasma etching for supercapacitors. J. Alloys Compd. 2019, 771, 156–161. [Google Scholar] [CrossRef]
  44. Nagaraju, N.; Fonseca, A.; Konya, Z.; Nagy, J. Alumina and silica supported metal catalysts for the production of carbon nanotubes. J. Mol. Catal. A-Chem. 2002; 181, 1-2, 57–62. [Google Scholar]
  45. Willems, I.; Kónya, Z.; Colomer, J.; Tendeloo, G.; Nagaraju, N.; Fonseca, A.; Nagy, J. Control of the outer diameter of thin carbon nanotubes synthesized by catalytic decomposition of hydrocarbons. Chem. Phys. Lett. 2000; 317, 1-2, 71–76. [Google Scholar]
  46. Kónya, Z.; Kiss, J.; Oszkó, A.; Siska, A.; Kiricsi, I. XPS characterization of catalysts during production of multiwalled carbon nanotubes. Phys. Chem. Chem. Phys. 2001, 3(1), 155–158. [Google Scholar] [CrossRef]
  47. Wen, J.; Chu, W.; Jiang, C.; Tong, D. Growth of carbon nanotubes on the novel FeCo-Al2O3 catalyst prepared by ultrasonic coprecipitation. J. Nat. Gas Chem. 2010, 19(2), 156–160. [Google Scholar] [CrossRef]
  48. Liu, M.; Yu, F.; Ma, C.; Xue, X.; Fu, H.; Yuan, H.; Yang, S.; Wang, G.; Guo, X.; Zhang, L. Effective Oxygen reduction reaction performance of FeCo alloys in situ anchored on nitrogen-doped carbon by the microwave-assistant carbon bath method and subsequent plasma etching. Nanomaterials 2019, 9(9), 1284. [Google Scholar] [CrossRef] [PubMed]
  49. Yi, Q.; Zhang, F.; Song, Y.; Wang, X.; Zhang, H.; Li, C.; Piao, M. One-step synthesis of cobalt nanosheets depositing with carbon microsphere by microwave plasma assisted reduction chemical vapor deposition technique against electromagnetic pollution. Carbon 2023, 214, 118322. [Google Scholar] [CrossRef]
  50. Shen, A.; Zou, Y.; Wang, Q.; Dryfe, R.A.W.; Huang, X.; Dou, S.; Dai, L.; Wang, S. Oxygen reduction reaction in a droplet on graphite, direct evidence that the edge is more active than the basal plane. Angew. Chem. Int. Edit. 2014, 53(40), 10804–10808. [Google Scholar] [CrossRef] [PubMed]
  51. Sivkov, D.; Petrova, O.; Mingaleva, A.; Ob’edkov, A.; Kaverin, B.; Gusev, S. Vilkov, I.; et al.; The structure and chemical composition of the Cr and Fe pyrolytic coatings on the MWCNTs’ surface according to NEXAFS and XPS Spectroscopy. Nanomaterials 2020, 10(2), 374. [Google Scholar] [CrossRef]
  52. Ma, Y.; Ma, Y.; Ding, X.; Liu, Q.; Pang, Y.; Cao, Y.; Zhang, T. Safety assessment of graphene oxide and microcystin-LR complex, a toxicological scenario beyond physical mixture. Part. Fibre Toxicol. 2022, 19, 26. [Google Scholar] [CrossRef]
  53. Zhi, D.; Li, T.; Li, J.; Ren, H.; Meng, F. A review of three-dimensional graphene-based aerogels, synthesis, structure and application for microwave absorption. Compos. Part B-Eng. 2021, 211, 108642. [Google Scholar] [CrossRef]
  54. Zhang, D.; Wang, H.; Cheng, J.; Han, C.; Yang, X.; Xu, J. Conductive WS2-NS/CNTs hybrids based 3D ultra-thin mesh electromagnetic wave absorbers with excellent absorption performance. Appl. Surf. Sci. 2020, 528, 147052. [Google Scholar] [CrossRef]
  55. Zhou, J.; Wei, B.; Wang, M.; Yao, Z.; Chen, P.; Zhou, C.; Li, Z. Three dimensional flowerlike ZnFe2O4 ferrite loaded graphene, enhancing microwave absorption performance by constructing microcircuits. J. Alloys Compd. 2021, 889, 161734. [Google Scholar] [CrossRef]
  56. Zhou, J.; Guo, F.; Luo, J.; Hao, G.; Liu, G.; Hu, Y.; Zhang, G.; Guo, H.; Zhou, H.; Jiang, W. Mater. Designed 3D heterostructure with 0D/1D/2D hierarchy for low-frequency microwave absorption in the S-band. J. Mater. Chem. C, 2022; 10, 4, 1470–1478. [Google Scholar]
  57. Yuan, M.; Zhao, B.; Which, C.; Pei, K.; Money, L.; Zhang, R.; You, W.; Liu, X.; Zhang, X.; Che, R. Remarkable magnetic exchange coupling via constructing bi-magnetic interface for broadband lower-frequency microwave absorption. Adv. Funct. Mater. 2022, 32(33), 2203161. [Google Scholar] [CrossRef]
  58. Du, Y.; Liu, W.; Qiang, R.; Wang, Y.; Han, X.; Ma, J.; Xu, P. Shell thickness-dependent microwave absorption of core-shell Fe3O4@C composites. Chem. Eng. J. 2021, 420, 129875. [Google Scholar] [CrossRef] [PubMed]
  59. Lv, H.; Liang, X.; Cheng, Y.; Zhang, H.; Tang, D.; Zhang, B.; Ji, G.; Du, Y. Coin-like α-Fe2O3@CoFe2O4 Core–Shell Composites with Excellent Electromagnetic Absorption Performance. ACS Appl. Mater. Interfaces 2015, 7(8), 4744–4750. [Google Scholar] [CrossRef] [PubMed]
  60. Hadjipanayis, G.; Kim, A. Domain wall pinning versus nucleation of reversed domains in R-Fe-B magnets (invited). J. Appl. Phys. 1988, 63(8), 3310–3315. [Google Scholar] [CrossRef]
  61. Jiang, J.; Li, D.; Geng, D.; An, J.; He, J.; Liu, W.; Zhang, Z. Microwave absorption properties of core double-shell FeCo/C/BaTiO3 nanocomposites. Nanoscale 2014, 6(8), 3967–3971. [Google Scholar] [CrossRef] [PubMed]
  62. Lu, B.; Dong, X.; Huang, H.; Zhang, X.; Zhu, X.; Lei, J.; Sun, J. Microwave absorption properties of the core/shell-type iron and nickel nanoparticles. J. Magn. Magn. Mater. 2008, 320(6), 1106–1111. [Google Scholar] [CrossRef]
  63. Lim, J.; Garg, A.; Ketterson, J. Ferromagnetic resonance modes in the exchange-dominated limit in cylinders of finite length. Phys. Rev. Appl. 2021, 16(6), 064007. [Google Scholar] [CrossRef]
  64. Lv, H.; Ji, G.; Liu, W.; Zhang, H.; Du, W. Achieving hierarchical hollow carbon@Fe@Fe3O4 nanospheres with superior microwave absorption properties and lightweight features. J. Mater. Chem. C, 2015; 3, 39, 10232–10241. [Google Scholar]
  65. Wang, W.; Zhang, H.; Zhao, Y.; Wang, J.; Zhao, H.; Li, P.; Yun, J.; et al. A novel MOF-drived self-decomposition strategy for CoO@N/C-Co/Ni-NiCo2O4 multi-heterostructure composite as high-performance electromagnetic wave absorbing materials. Chem. Eng. J. 2021, 426, 131667. [Google Scholar] [CrossRef]
  66. Wang, Z.; Tao, J.; Zhang, X.; Wei, B.; Yao, Z.; Jiang, H.; Liu, J.; Zhou, J.; Tao, X. Constructing FeCo@C core-shell structure with strong polarization behavior towards excellent microwave absorption performance. Mater. Chem. Phys. 2023, 300, 127553. [Google Scholar] [CrossRef]
Figure 1. Schematic diagram of the synthesis process of f-FeCo@CM using MPARCVD technology.
Preprints 109969 g001
Figure 2. The FESEM images and corresponding elemental mapping of the samples: (a1-a3) s-FeCo; (b1-b3) s-FeCo@CM; (c1-c3) f-FeCo; (d1-d3) f-FeCo@CM.
Preprints 109969 g002
Figure 3. (a) XRD patterns of different samples; (b) Raman spectra of s-FeCo@CM and f-FeCo@CM; (g) TGA patterns of f-FeCo and f-FeCo@CM samples; XPS spectra of (d) Co 2p, (e) Fe 2p, and (f) C 1s for f-FeCo and f-FeCo@CM samples.
Preprints 109969 g003
Figure 4. (a-c) Schematic diagrams illustrating the dielectric loss mechanism of f-FeCo@CM; (d-e) Real and imaginary parts of the permittivity values for different samples; (f) ɛ’-ɛ” curve of s-FeCo@CM, and (g) ɛ’-ɛ” curve of f-FeCo@CM.
Preprints 109969 g004
Figure 5. (a-b) The real and imaginary parts of the permeability values for different samples; (c) hysteresis loops of f-FeCo and f-FeCo@CM; (d) the eddy-current modeling plots.
Preprints 109969 g005
Figure 6. Two-dimensional representations of the Z-value for different samples: (a) s-FeCo; (b) s-FeCo@CM; (c) f-FeCo; (d) f-FeCo@CM.
Preprints 109969 g006
Figure 7. Plots of the attenuation constant (α) as a function of frequency for different samples.
Preprints 109969 g007
Figure 8. Three-dimensional color maps of reflection loss (RL) for different samples: (a) s-FeCo; (b) s-FeCo@CM; (c) f-FeCo; (d) f-FeCo@CM; Two-dimensional color maps of reflection loss (RL) for different samples: (e) s-FeCo; (f) s-FeCo@CM; (g) f-FeCo; (h) f-FeCo@CM.
Preprints 109969 g008
Disclaimer/Publisher’s Note: The statements, opinions and data contained in all publications are solely those of the individual author(s) and contributor(s) and not of MDPI and/or the editor(s). MDPI and/or the editor(s) disclaim responsibility for any injury to people or property resulting from any ideas, methods, instructions or products referred to in the content.
Copyright: This open access article is published under a Creative Commons CC BY 4.0 license, which permit the free download, distribution, and reuse, provided that the author and preprint are cited in any reuse.
Prerpints.org logo

Preprints.org is a free preprint server supported by MDPI in Basel, Switzerland.

Subscribe

© 2024 MDPI (Basel, Switzerland) unless otherwise stated