1. Introduction
The large-scale production of high-quality graphene is a crucial area of research due to its extensive industrial applications [
1]. Researchers have reported techniques for producing large-scale graphene, such as chemical vapor deposition (CVD), top-down liquid exfoliation of 2D materials and bottom-up wet chemical synthesis [
2]. In this paper, we present a novel technique for producing graphene using renewable materials.
Agriculture production has surged alongside the exponential growth of the world's population over the past 50 years, a trend projected to continue. Consequently, the increase in agricultural waste has become more pronounced [
3]. Industries like palm oil, rice, and corn utilize only a fraction of the crops they produce, leaving substantial waste in their wake. For instance, in palm oil production, a mere 10 % of the fruit yields oil, while the remainder turns into waste [
4]. Unfortunately, improper disposal of this agricultural waste, often through burning, poses serious risks as it releases toxic gases and haze, becoming a potential pollutant and health hazard [
5,
6].
On the flip side, concerns surrounding excessive consumption of non-renewable fuels have driven extensive research into renewable energy sources. Notably, carbon-based materials have been the focus in energy storage supercapacitors [
5]. In order addressing the mounting agricultural waste issue and increasing electrode production costs, researchers turn to carbon-based materials derived from this waste for the supercapacitor electrodes application. Through pyrolysis, the agricultural waste is heated in the absence of oxygen before undergoing chemical or physical activation to yield a porous carbon-based material, graphene, a carbon nanostructure with a large specific surface area [
6]. Graphene's abundance of electro-active sites on its surface results in enhanced super capacitive performance, offering superb electronic qualities [
7]. Consequently, when employed as electrode material in supercapacitors, these carbon-based materials provide extended cycling life and rapid charging capabilities [
5].
While research has been published on doping carbon-based electrodes with elements such as Nitrogen (N), Phosphorus (P), and Boron (B) [
8] [
9]. Doping carbon-based electrodes with these heteroatoms can introduce defects and modify the electronic structure of the carbon material. These heteroatoms can create new active sites for redox reactions during the charging and discharging processes in supercapacitors, leading to improved electrochemical properties and higher specific capacitance [
10,
11]. Introducing nitrogen into activated carbon has been discovered to enhance capacitance through pseudocapacitive behavior [
12,
13]. In addition, doping with these elements can increase the surface area of the carbon-based electrode and act as electron donors or acceptors in the carbon lattice, which improves the electrical conductivity of the electrode material [
14,
15]. Better conductivity translates to faster electron transport during charge and discharge cycles, enhancing the overall performance of the supercapacitor. However, there is ongoing research to explore other doping strategies, such as rare earth metals, to further improve supercapacitor technology and expand its potential applications [
16,
17]. Only a few studies have explored doping with rare earth metals or other novel materials. This indicates an unexplored realm in the realm of carbon-based electrodes. Therefore, further investigation into carbon-based electrodes doped with rare earth metals is essential to unlock potential advancements in supercapacitor technology and foster sustainable energy solutions.
Rare earth metals, including lanthanoids and actinoids, belong to the f-block transition metals often find applications in nuclear energy, clean energy, and catalysis [
18]. When doped into transition metal oxides and hydroxides, they exhibit the ability to enhance electrochemical activity, structural stability, and ionic conductivity of electrode materials. Their large ionic radii and involvement of partially filled 5f orbitals in bonding facilitate improved electronic and ionic transportation during electrochemical reactions [
7], making them promising candidates for graphene doping.
In this study, bio-sourced carbons derived from candlenut shells were doped with varying weight percentages (10, 20, and 30 wt.%) of rare earth metals, i.e. Cerium (Ce), known for enhancing redox performance in many industrial catalytic reactions [
18], and Neodymium (Nd), which has shown to improve the electrochemical properties of lithium-ion batteries when doped into LiNiPO
4 [
19]. The synthesis and fabrication methods of these doped carbons from agricultural waste were characterized using various techniques, including Scanning Electron Microscopy attached with Energy-Dispersive Spectroscopy (SEM-EDS), X-ray Diffraction (XRD), X-ray Photoelectron Spectroscopy (XPS), Transmission Electron Microscopy (TEM), Thermogravimetric Analysis (TGA), and Fourier Transform Infrared (FTIR).
Subsequently, doped carbon samples were employed to modify the surface of glassy carbon electrodes (GCE). Cyclic voltammetry (CV) and linear sweep voltammetry (LSV) were utilized to investigate the electrochemical properties, shedding light on the performance enhancement achieved through rare earth metal doping. This research explores the potential of utilizing agricultural waste-derived graphene doped with rare earth metals as a promising avenue for advanced electrode materials, contributing to the development of sustainable and high-performance energy storage systems.
2. Materials and Methods
2.1. Preparations of Candlenut Graphene Nano Sheets (GNS)
Candlenut shells were subjected to pyrolysis in a furnace at 600 ⁰C for 5 hours to produce charcoal chips. An equal amount of activated carbon was added to the charcoal chips to remove any functional groups formed from oxidation and the mixture was pulverized. This mixture underwent pyrolysis again at 600 ⁰C for 1 hour. After cooling, the mixture was washed with water and subsequently dried in an oven at 100 – 105 ⁰C. The dried mixture was pulverized again and filtered with a 200 mesh to separate powdered GNS from activated carbon. This product was then labelled as Candlenut graphene.
The Mapewrap 31SP epoxy resin was purchased from Mapei Far East Pte. Ltd., Singapore. The resin has a resin-to-hardener mixing ratio of 3:1 by weight, with a working time of 40 minutes, and a curing duration of 24 hours in ambient conditions, as per manufacturer’s instructions.
2.2. Doping of GNS
In this experiment, GNS were doped with 10, 20 and 30 wt% Ce, respectively. The 10 wt% Ce/GNS was prepared as follows: 500 mg of GNS powder and 169.5 mg of (CeO
8S
2).H
2O crystals were measured out and placed into separate beakers before the addition of 50 ml of ethanol. The mixtures were then stirred for 1 hour using a magnetic stirrer to produce a uniform solution. Subsequently, the GNS solution was mixed with the Ce precursor and stirred for another 3 hours. The resulting mixture was dried in an oven at 80 ⁰C for 12 hours and then ground into fine powder using a mortar and pestle [
20].
Characterization of the doped cerium samples (labelled 10-30 wt% Ce/Graphene) was performed using SEM-EDS, XRD, XPS, TEM, TGA and FTIR to confirm the presence of doped cerium.
2.3. Preparation of Electrodes
After confirming the presence of doped cerium, the fabrication of glassy carbon electrodes (GCEs) coated with doped GNS began. The GCEs were first cleaned by soaking in distilled water and ultrasonicated for 30 minutes, followed by soaking in ethanol and ultrasonicated for another 30 minutes. The electrodes were then dried with nitrogen gas and subjected to plasma cleaning. Next, 10 mg of doped GNS powder was added to 0.75 ml of ethanol and ultrasonicated for 30 minutes. Then, 1 ml of NafionTM 117 containing solution was added to the mixture and ultrasonicated for another 30 minutes to obtain the solution for drop casting. For each sample, 1 cm2 GCEs were coated evenly with 50 μl of the solution using a dropper and dried thoroughly in an oven at 80 ⁰C for 30 minutes. This step was repeated 3 times such that each sample has three coatings with a total of 150 μl of solution.
Finally, all biocarbon of Candlenut graphene, Ce/Graphene and electrodes were characterized by using SEM-EDX, TEM, XRD, FTIR, XPS, TGA, and Raman, respectively. For instance, SEM-EDX (JEOL, JSM-7600F), TEM (ACTEM JEOL JEM-ARM300F), XRD (LabX XRD-600 Shimadzu), FTIR (Nicolet iS50 FTIR Spectrometer, Thermo), XPS (XPS Kratos AXIS Supra, Shimadzu), TGA (NETZSCH 409C TGA / Perkin Elmer DSC 4000), and Raman spectroscopy was done with WITEC Confocal Raman (Oxford instruments, United Kingdom) with laser wavelength of 488 nm. A 20X objective lens was used and the scanning is done from -2000-3000 cm-1.
2.4. Electrochemistry experiment
Lastly, electrochemical studies of GNS doped with cerium and neodymium were performed with Cyclic Voltammetry (CV) and Linear Sweep Voltammetry (LSV) in a three-electrode system. Redox potential and stability of working electrode (doped GNS on GCE) was observed using CV with platinum (Pt) wire as the counter electrode and Ag/AgCl as the reference electrode. LSV was used to measure the change in overpotential. The 1 M KOH electrolyte solution was prepared by mixing 56.11 g of KOH pallets and 1 L of distilled water in a glass beaker and mixing for 30 minutes with a magnetic stirrer
2.5. AC Electrical Resistance Experiment
The fabrication process of the epoxy-graphene samples at 0.24 and 2.4 wt% is as follows: the prescribed amount of graphene and acetone was placed in a glass beaker with a mass ratio of 1:20 to create a graphene suspension. Initial mixing was conducted using an IKA overhead stirrer at 600 rpm to disperse larger clumps of graphene powder. This was followed by ultrasonication in a bath sonicator for 1 hour to minimize the effect of aggregation. Subsequently, the epoxy resin was added to the graphene-acetone suspension and mixed under the same conditions mentioned earlier to create a uniform resin-graphene-acetone suspension. This suspension was then placed in an oven set at 80 °C overnight to ensure complete evaporation of the acetone. The prescribed amount of hardener by weight was poured into the same mixing cup and stirred using an IKA overhead mechanical stirrer at 1,500 rpm for 3 minutes to ensure homogeneous mixing. Once a consistent graphene-epoxy mixture was obtained, the mixing cup was placed in a vacuum chamber and set to low vacuum for a degassing period of 20 minutes to remove any entrapped air bubbles introduced during the mixing process. These bubbles could create defects in the cured composite, hindering electrical conductivity. The degassed graphene-epoxy mixture was then poured into silicone rubber molds and allowed to cure in ambient conditions for 24 hours. After curing, the epoxy-graphene samples underwent surface preparation methods to remove defects such as bubbles on the surface. The dimensions of each sample were measured using a pair of digital vernier calipers accurate to 0.01 mm. The average dimensions for each sample were 12.63 x 1.25 x 0.33 cm (Length x Width x Depth).
To measure the AC electrical resistivity of the samples, a handheld LCR meter (model RS-PRO LCR-1703) purchased from RS Components Pte. Ltd., Singapore, was used. The edges of the samples were connected to the LCR meter, and an AC current with a frequency of 1 kHz was applied. After obtaining a stable reading, nine AC resistance measurements were recorded per sample, and the average and standard deviation of these measurements were reported.
3. Results and Discussions
3.1. XRD
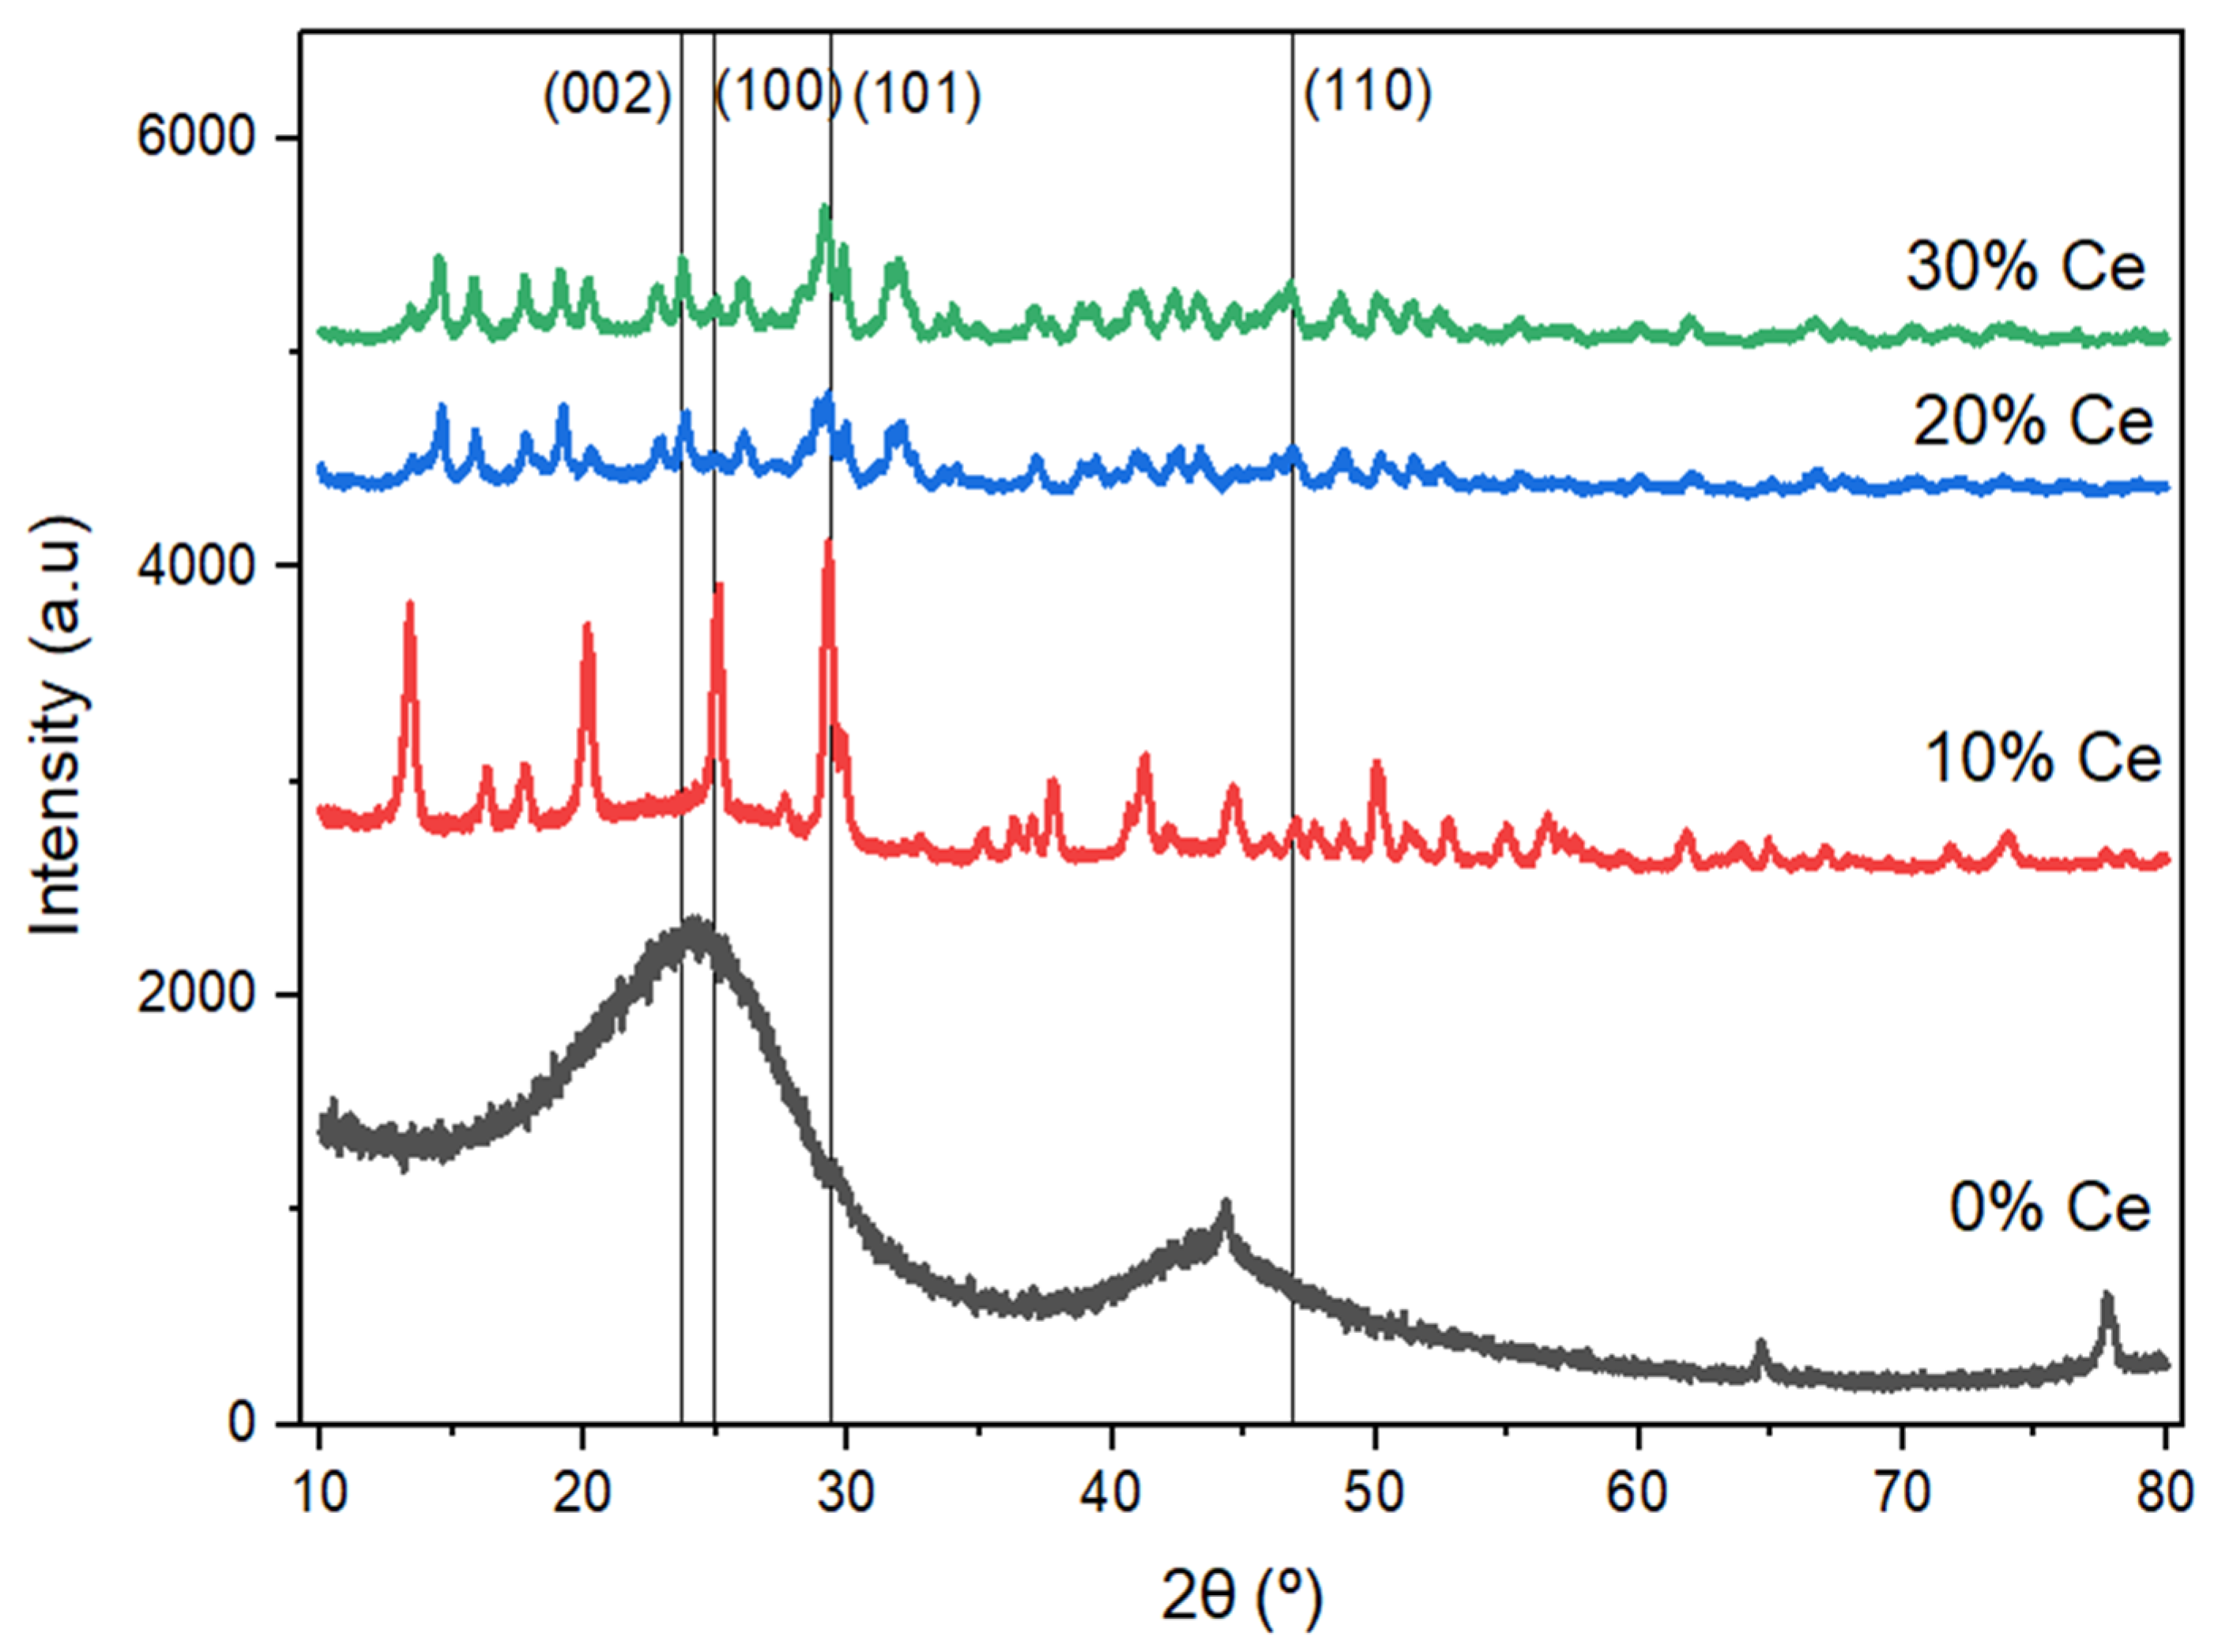
The XRD diffraction pattern of graphene doped with varying weight percentages of Ce are shown in
Figure 1.
There are three prominent peaks were identified at 2θ = 25.19, 29.33 and 31.94⁰ (
Figure 1), which corresponds to planes (002), (111) and (200) respectively. Plane (002) indicates the presence of graphene in the samples and planes (111) and (200) suggests the presence of Ce deposited in graphene. The peak at (111) is relatively more intense as compared to the other peaks and is from the cubic face (FCC) [111] lattice plane of CeO
2 [
21,
22].
3.2. SEM – EDX
Moreover, the SEM EDX data may assist us to make clearer the undoped and doped effect.
The Candlenut graphene has thin and flat surfaces (
Figure 2a) and C element is major element containing of graphene (
Figure 2b – e). The element containing graphene may be seen in
Table 1 (EDX data).
The SEM EDX data proves that graphene is well formed from candlenut as a raw material with remnant product around 19 – 21 %. The morphological structure of graphene is totally different compared to graphite, graphite oxide, graphene oxide and reduced graphene oxide [
23,
24,
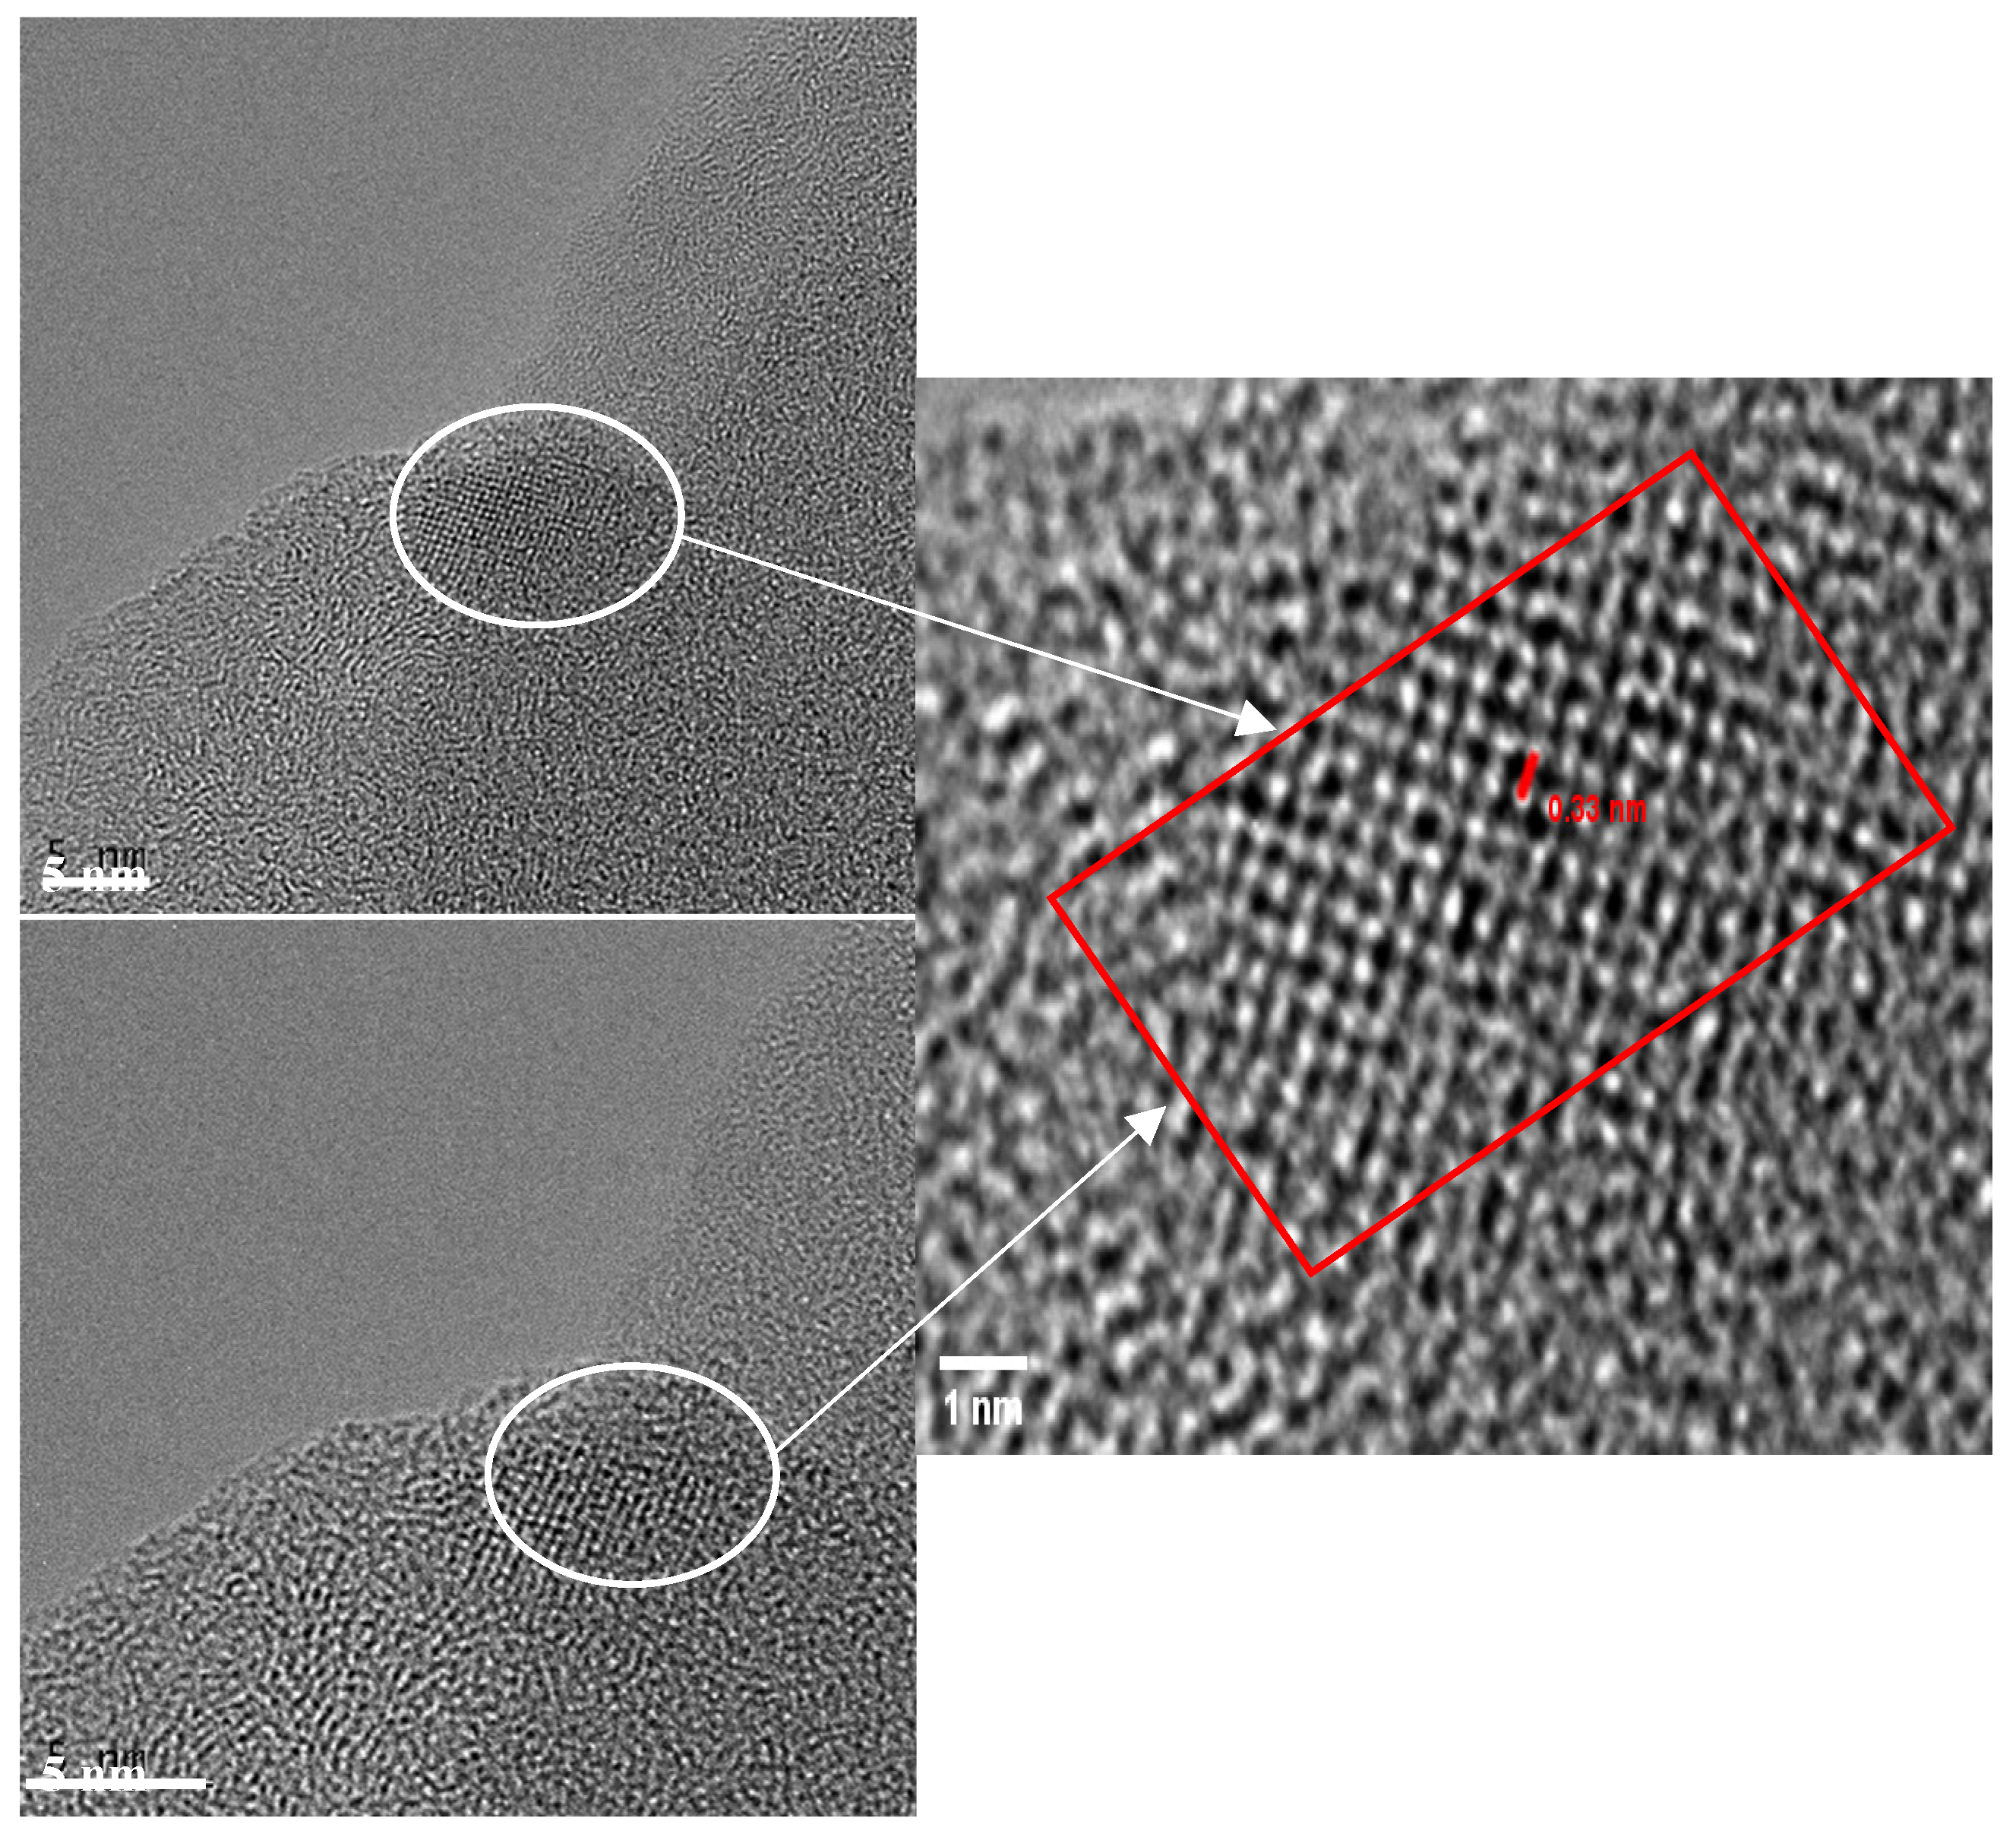
25]. Interestingly, the C element containing graphene is more than 90 wt.% and it has flat and thin surfaces respect to large surface area. In addition, TEM was also used to characterize graphene to prove that graphene may be produced from candlenut as a raw material (
Figure 3).
TEM image (
Figure 3) shows the Candlenut graphene has flat, thin, large surface area and d-spacing lattice is 0.33 nm, meaning produced Candlenut graphene is similar to a 2D planar structure of sp
2 hybridized carbon atoms arranged in a honeycomb crystal lattice with an inter-layer spacing [
26].
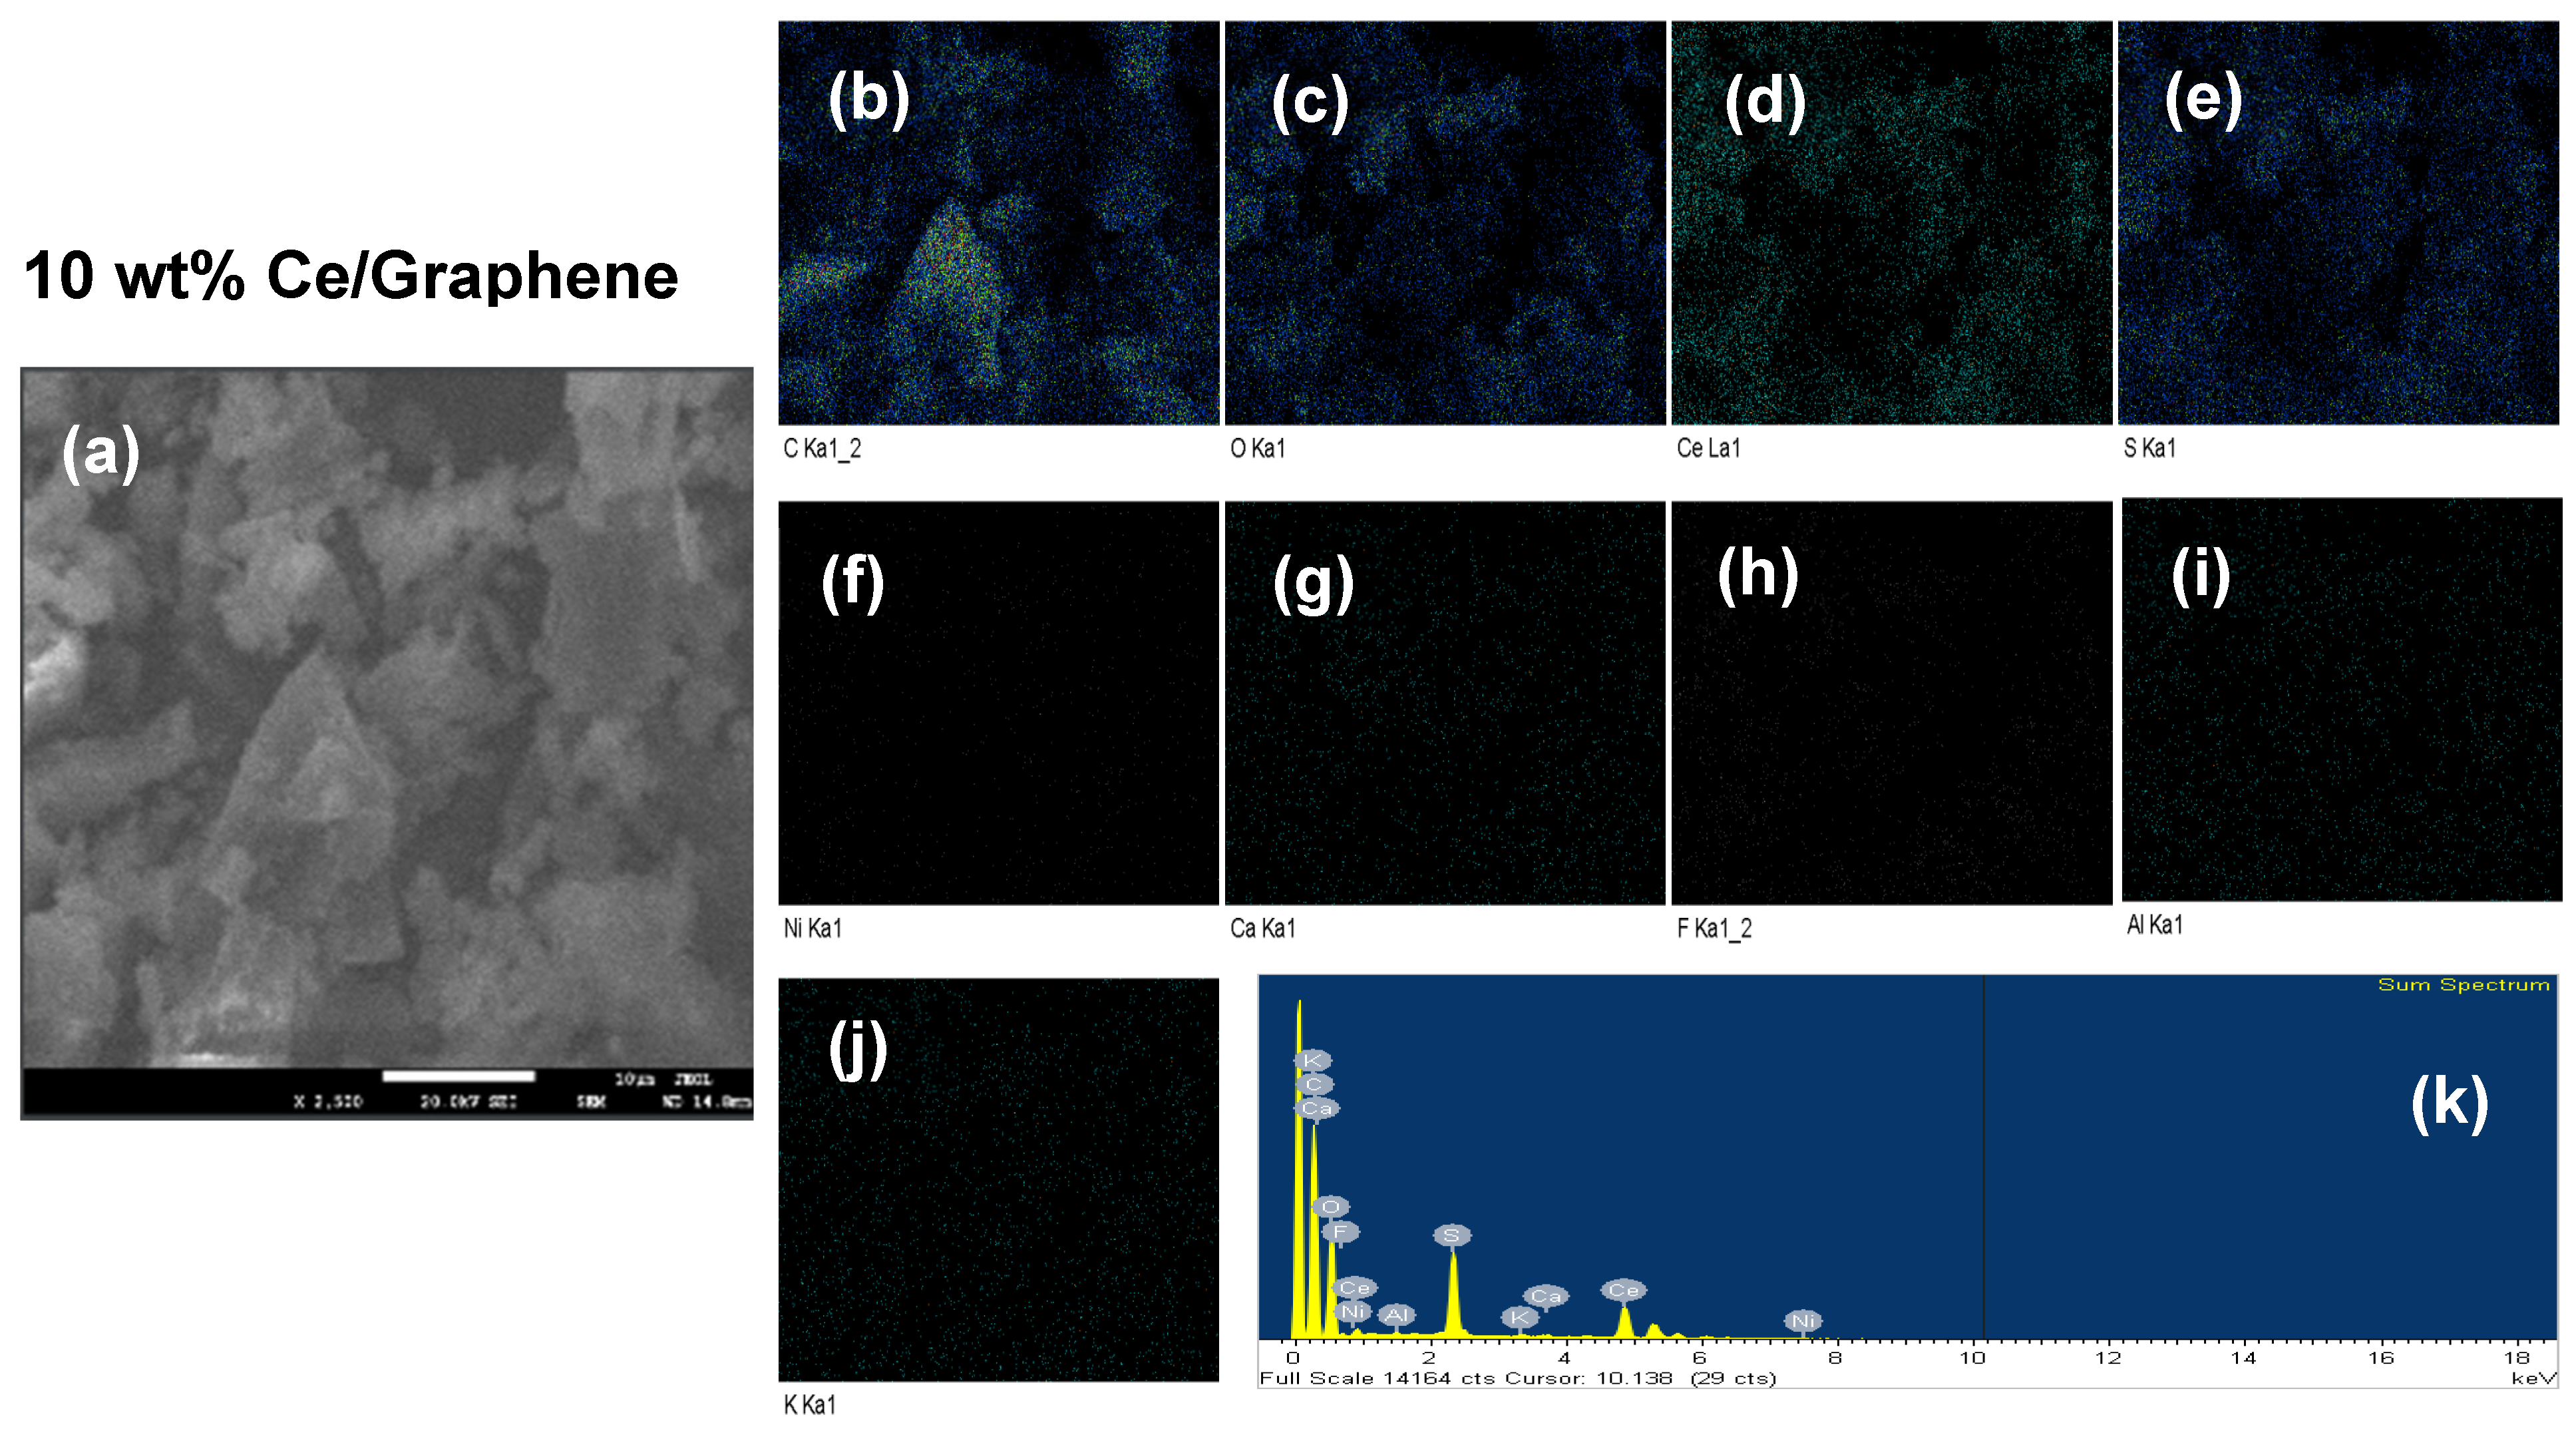
Subsequently, the property of Candlenut graphene was evaluated with Ce deposited on it. SEM EDX was used to analyze them (
Figure 4).
Figure 4 (a), (c) and (k) clearly show that C and Ce elements exist on 10 wt.% Ce/Graphene, meaning the Ce is well deposited on graphene. The elements composition of 10 wt% Ce/Graphene may be seen in
Table 2.
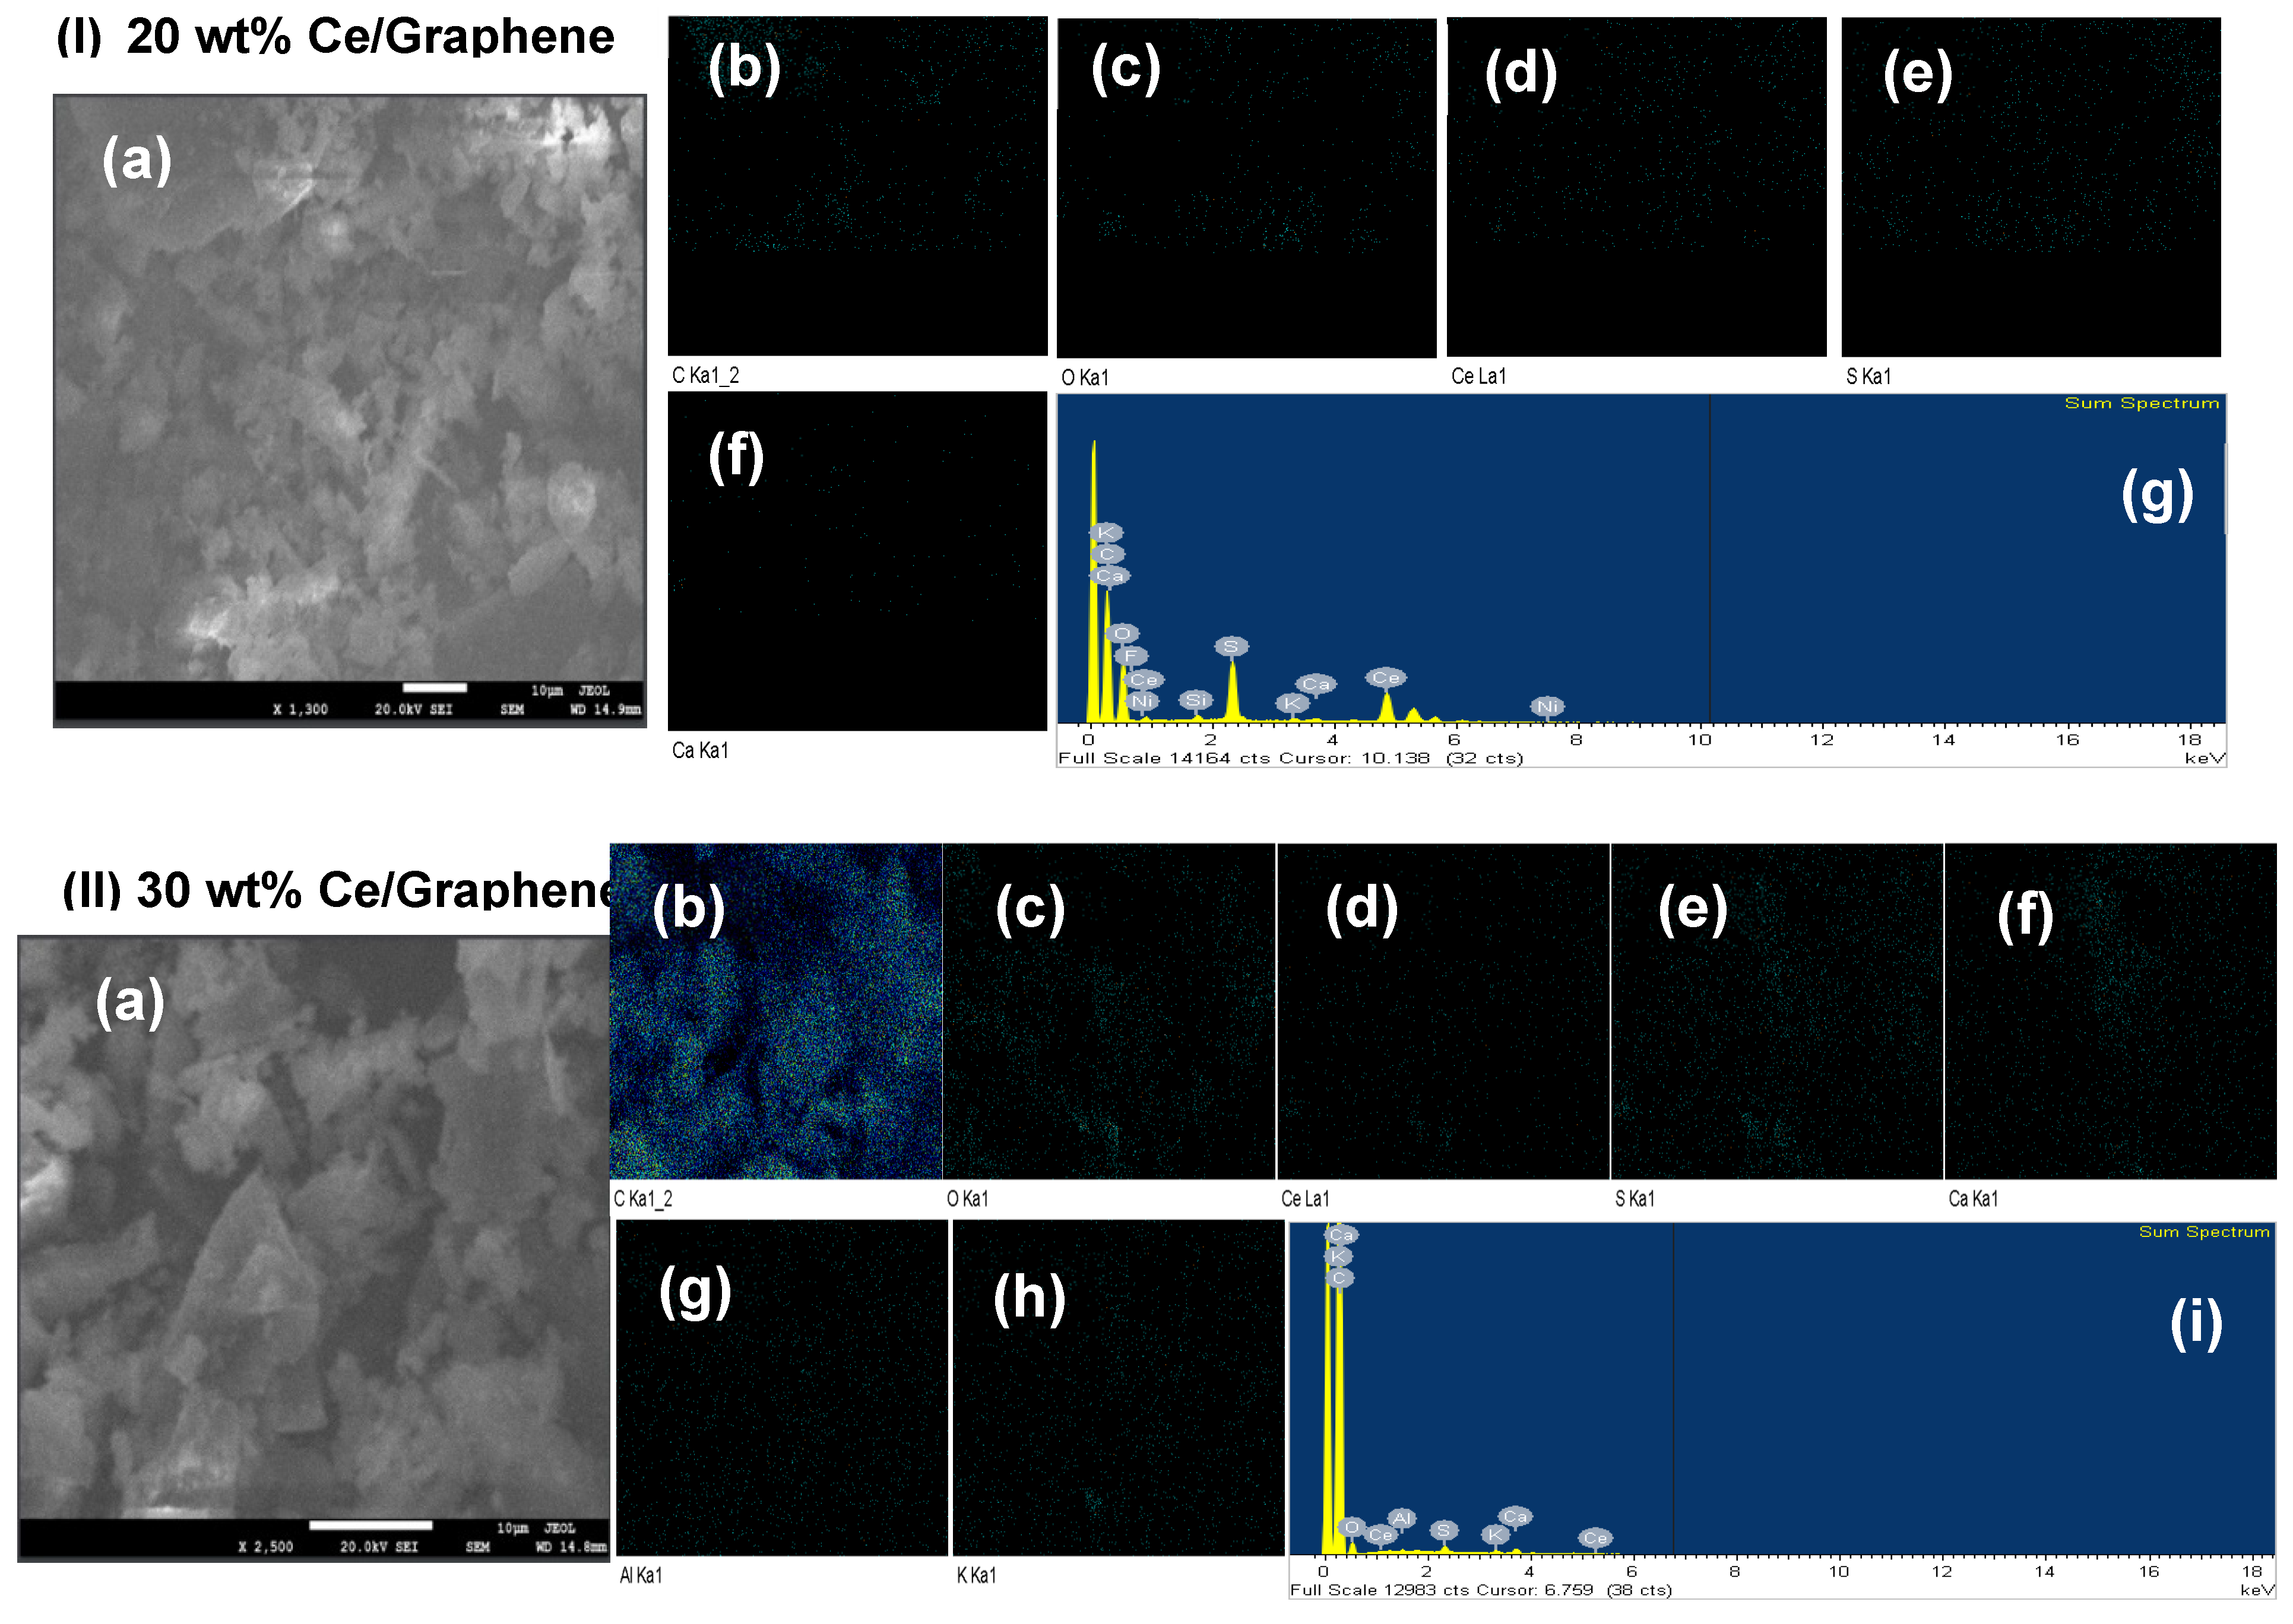
More depositing performance of graphene as well as a supporting material, evaluating by depositing variation of Ce on graphene (20 and 30 wt.% Ce/Graphene) are shown (
Figure 5 (I) and (II)).
Figure 5 (I) and (II) show that Ce particles exist on graphene for both 20 and 30 wt.% Ce/Graphene. Those data are very important because i) graphene base on candlenut shell may be developed as a supporting material; ii) large scale and sustainable graphene production is possible produced by using simple method and renewable material as a starting material and iii) there is chemically interaction between Ce and graphene. The elements composition of 20 and 30 wt.% Ce/Graphene can be seen in
Table 3.
Based on SEM – EDX data (
Figure 4-5 and
Table 2-3) clearly show the Ce atoms are well deposited on graphene and the preparation method of Ce/Graphene may be recognized. In addition, the GNS role is very important to control distribution and size of Ce particles.
3.3. TGA
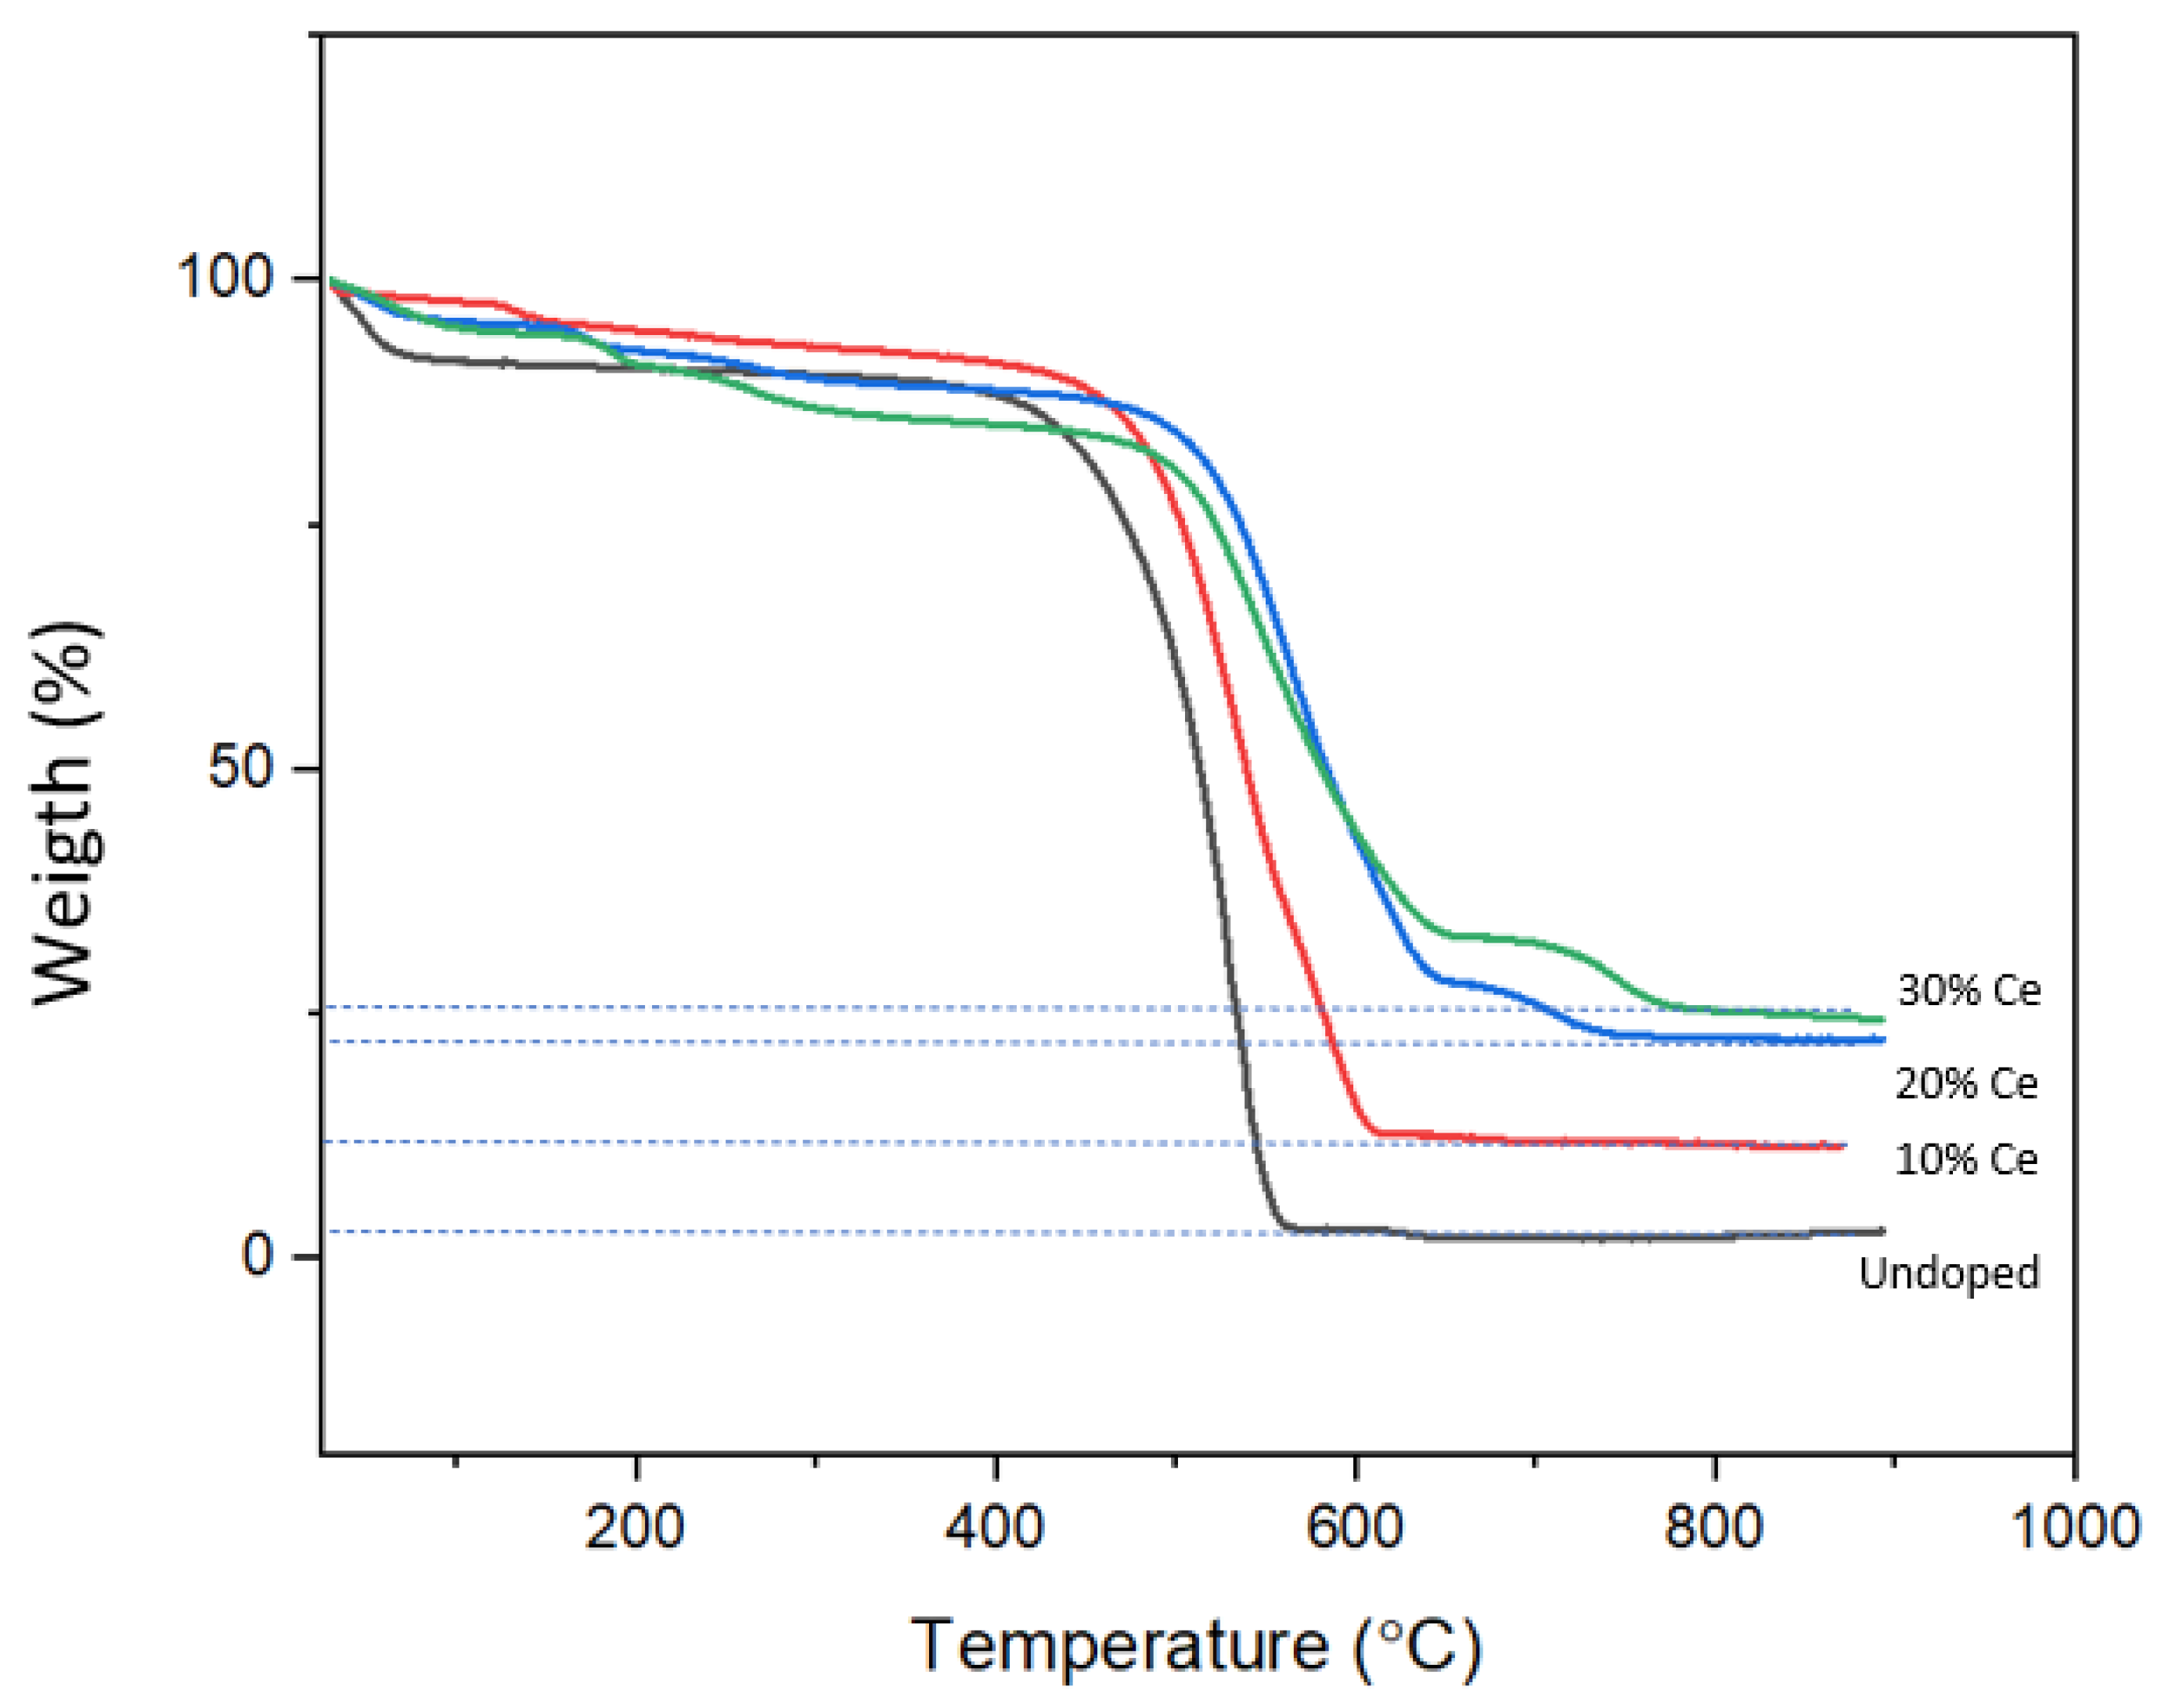
Further, the thermal properties of graphene and Ce amount on graphene moreover were evaluated with TGA (
Figure 6).
The TGA thermogram in
Figure 6 shows the weight percentage with respect to the temperature. The initial gentle decrease of weight percentage seen across all samples could be due to the decomposition of water and other low-molecular-weight compounds [
27]. Interestingly, graphene is thermally stable until T = 400
oC and it significantly decreases weight amount with increasing temperature at 400 – 600
oC and then it is stable again at T = 600 – 1000
oC, meaning the graphene has the thermally stable performance. The preparation of deposited Ce particles on graphene were well prepared. Each of Ce particles are well deposited on graphene thus the prepared and measured Ce amount are similar, meaning graphene may be expected to control Ce particle sizes.
3.4. FTIR
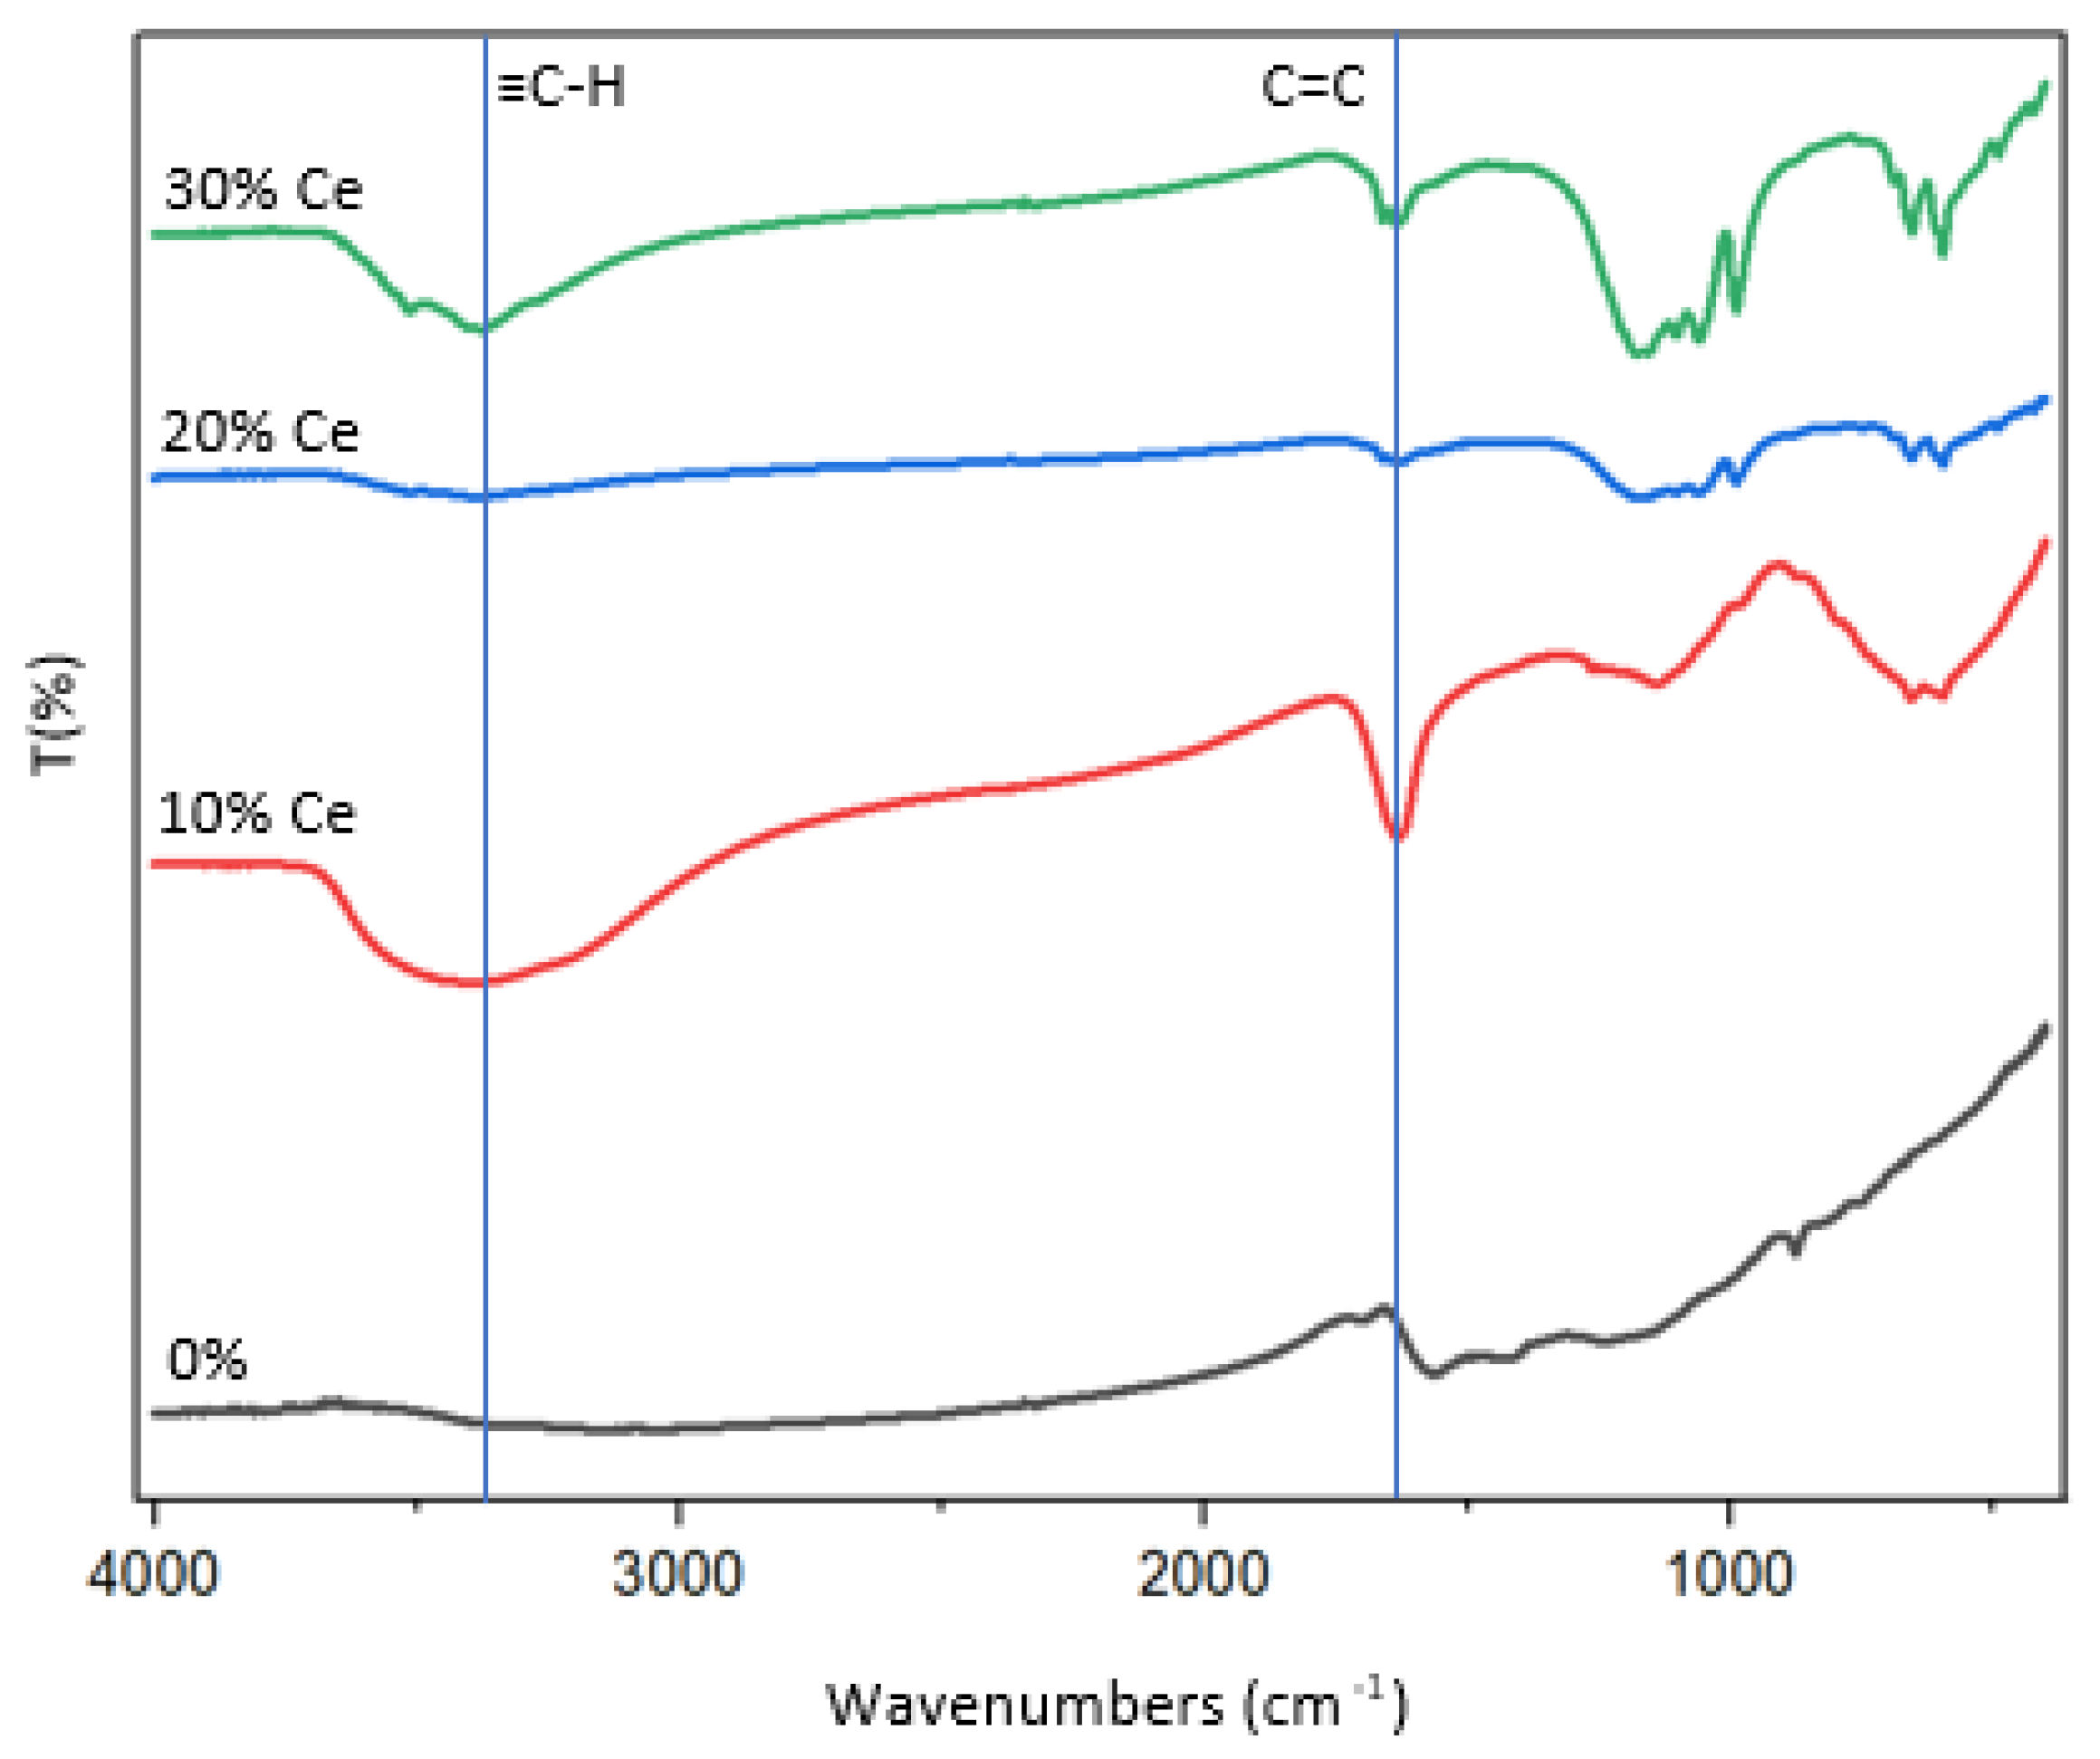
The FTIR data of graphene and 10 – 30 wt% Ce/Graphene is presented in
Figure 7.
In
Figure 7, there is a dip around 1450 to 1700 cm
-1 which could indicate the presence of aromatic C=C bond and alkene C=C bond which have a range of 1475 to 1625 cm
-1 and 1635 to 1690 cm
-1 respectively. There is also a dip near 3450 cm
-1 that could indicate the presence of hydroxyl group due to the hydrogen bonding interactions between the hydroxyl group and the carbon-hydrogen bond.
Figure 7 shows there are two dips in percentage of transmittance, the first dip from 500 to 700 cm
-1 could be due to lattice vibrations associated with Ce-O-Ce bond angle and Ce-O bond length and the second dip from 900 to 1200 cm
-1 could be due to asymmetric stretching mode of Ce-O bond.
3.5. XPS
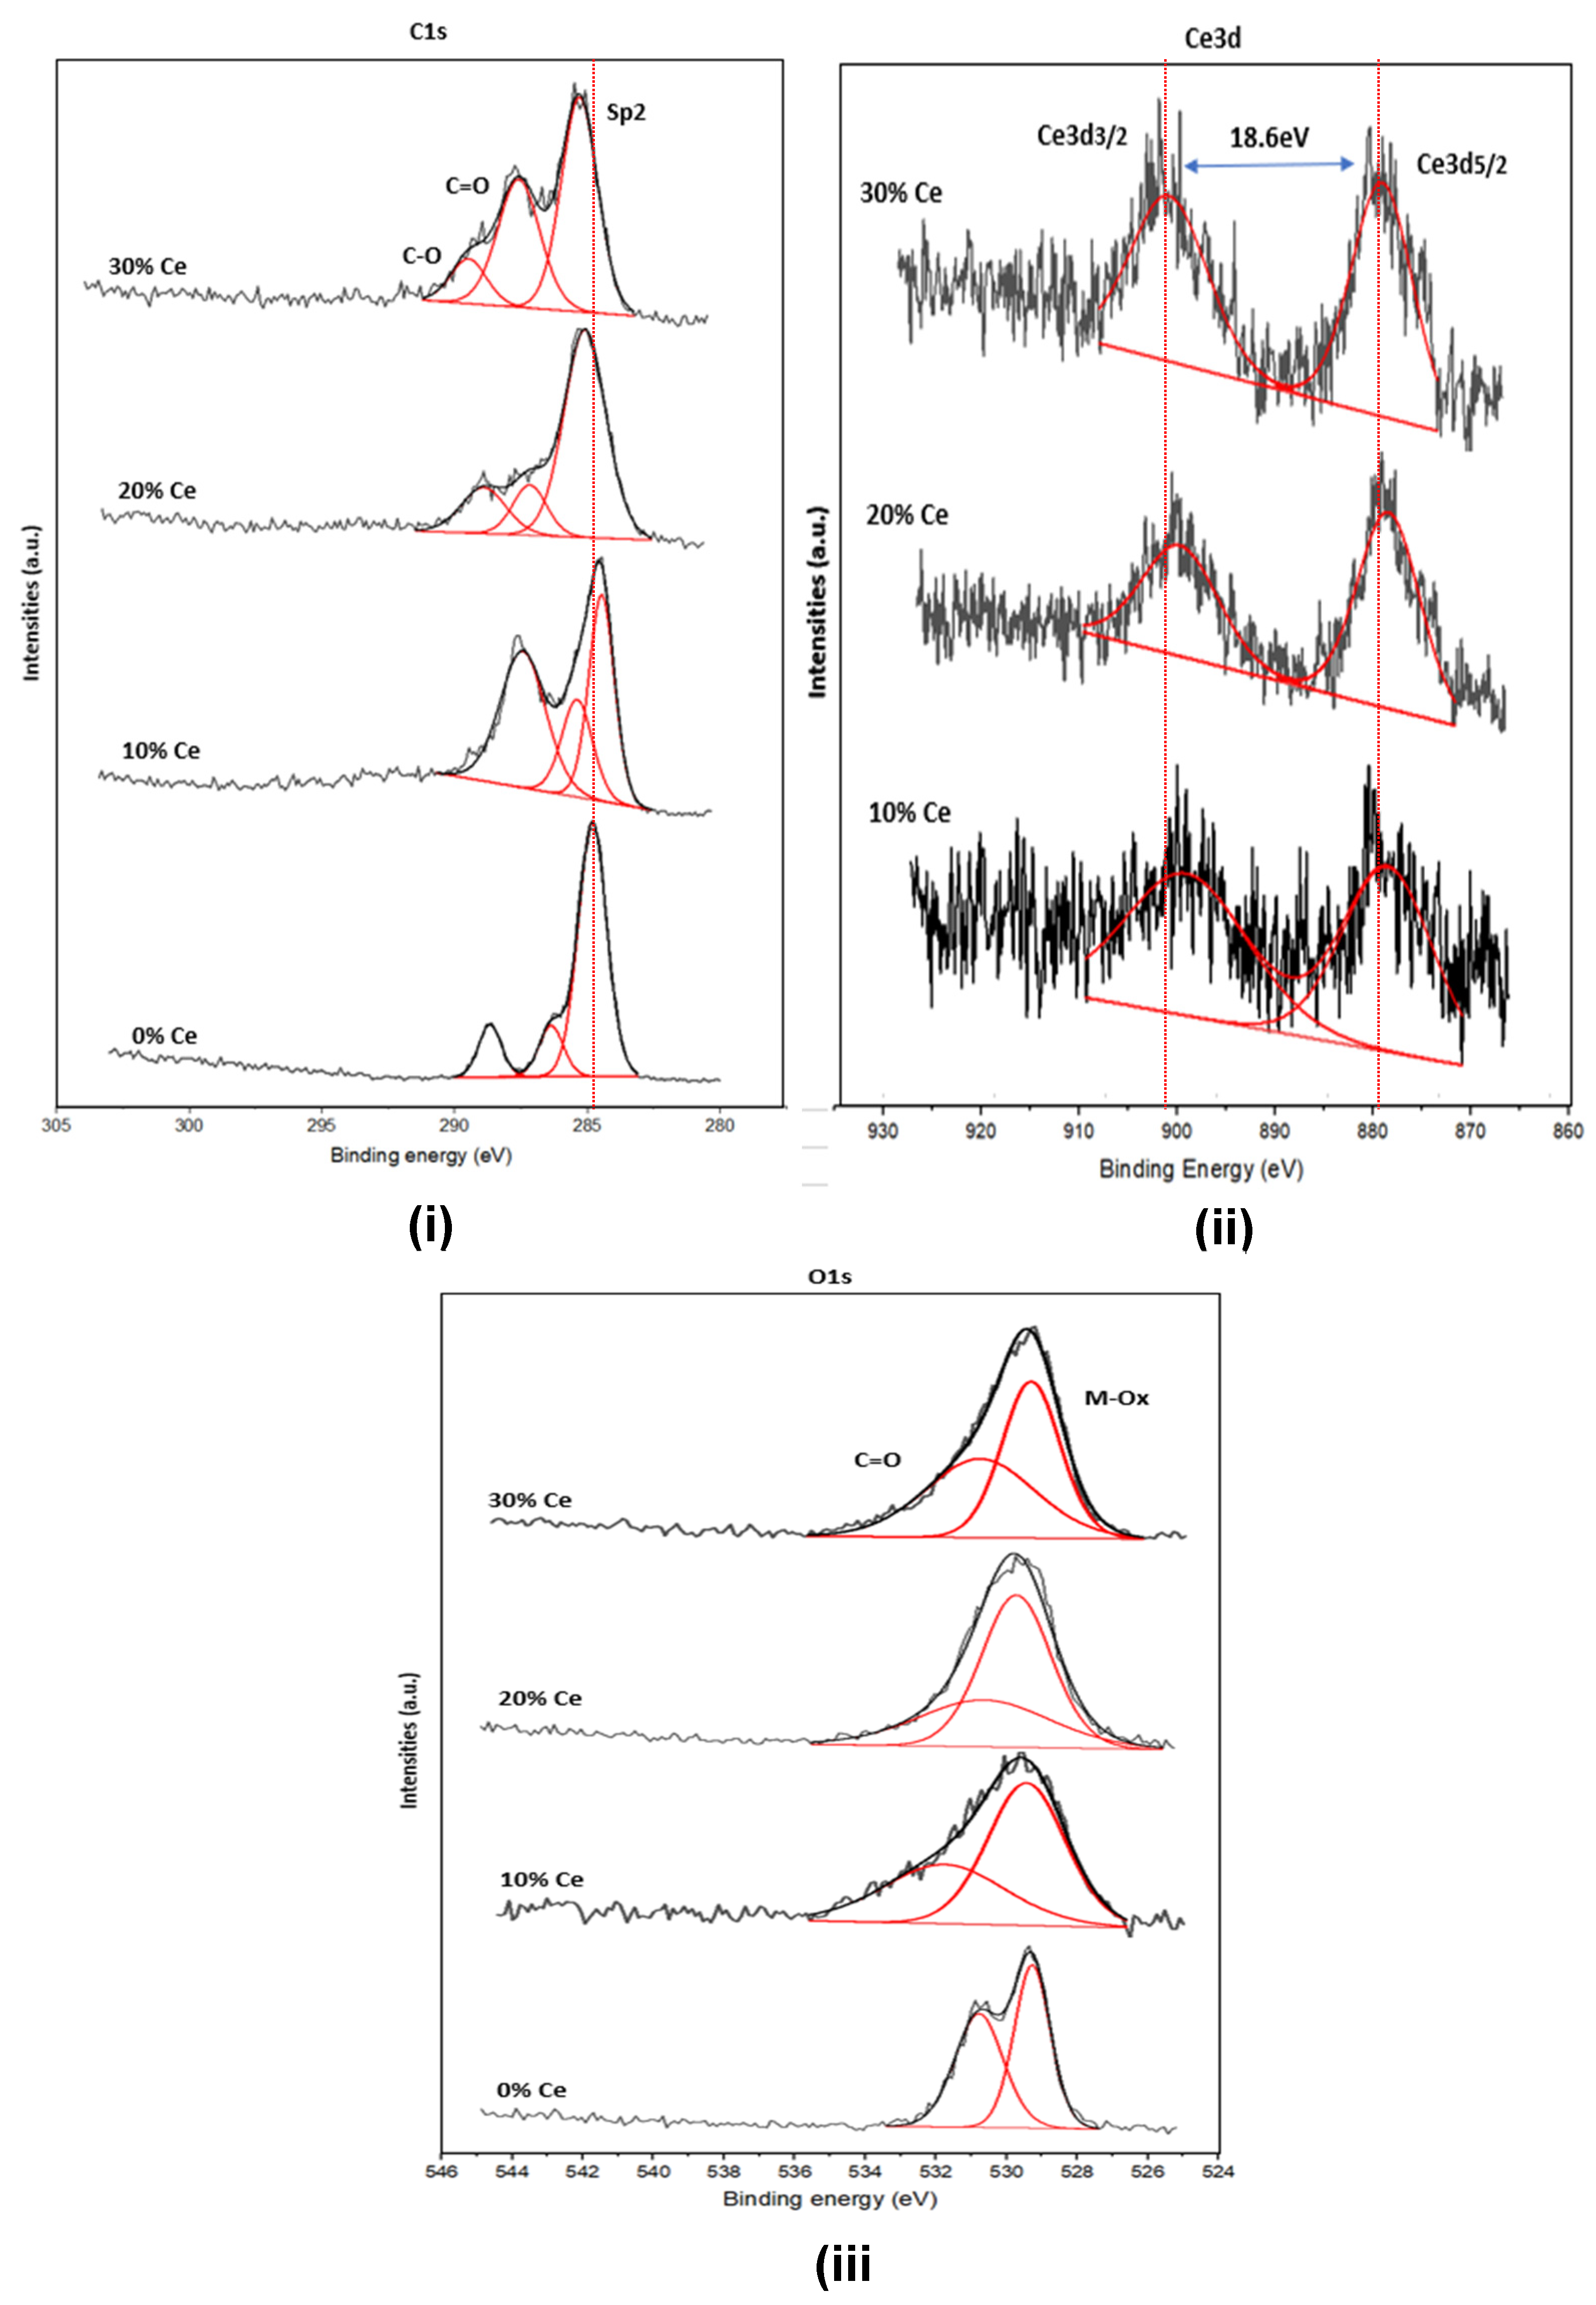
To further study the bonds present in the graphene and 10 – 30 wt% Ce/Graphene, XPS measurements were conducted. The XPS spectra of graphene and 10 – 30 wt% Ce/Graphene may be seen in
Figure 8.
Figure 8 (i) shows the XPS graph for C1s, 3 peaks can be observed at 284.8, 286 and 288-290 eV, which corresponds to C-sp
2, C-O and C=O bonds respectively. C=O and sp
2 bonding are typically found in C1s spectrum of Candlenut graphene [
28,
29]. The presence peak at 284.8 eV is solid evidence to prove the formation of graphene. Note, the XPS spectrum of C1s graphite is 284.5 eV. However, graphene still has oxygen functional group, causing its peak shifts to higher binding energy compared to graphite. That is possible due to the formation of graphene using candlenut shell as a starting material. The pyrolyzed candlenut shell normally produces oxygen functional groups embedded on charcoal. It is then reduced by using non-chemical reductor namely activated carbon, the physically interaction between charcoal and activated carbon may be expected both reducing oxygen functional groups and producing carbon containing graphene like Graphene Nano Sheets (GNS) [
30]. Furthermore, the performance of graphene as a supporting material is evaluated on Ce (10 – 30 wt% Ce/Graphene) by using XPS. This XPS data is very important to know the chemical interaction between graphene (π-bond) and Ce (f-block metal).
Figure 8 (ii) shows there are couple broad and weak peaks at XPS graph for Ce 3d
5/2 and Ce 3d
3/2 at 879 and 901 eV, which coincides with the Ce (III) oxide binding energy of 875 to 920 eV which is in the spectra of Ce 3d
3/2 and 3d
5/2 due to the separated spin-orbit components (∆ = 18.6eV) [
31,
32]. It is consistent with the O 1s of XPS data. There are peaks on 531,5 and 529 eV (
Figure 8 (iii)) which correspond to O 1s and metal oxides. Thus, this confirms the presence of Ce oxide or Ce (III) state. The reducing state of Ce (IV) to be Ce (III) may possibly occur be assisted by graphene. Interestingly, the presence of graphene and varies of weight amount of Ce on Ce/Graphene may affect the binding energy position, meaning the catalytic activity of Ce metal can be modified by graphene and weight amount of Ce deposited on Candlenut graphene. The role of Candlenut graphene is very pivotal, namely acting as a supporting material. The large surface area of graphene may be expected to distribute and deposit much more amount of Ce particles on it. The other role of Candlenut graphene is controlling the particle size and catalytic activity of Ce via chemical interaction between graphene and Ce [
33,
34]. These findings are very important to provide and develop the high catalytic activity of Ce catalyst for industry and other applications [
35,
36].
3.6. Raman
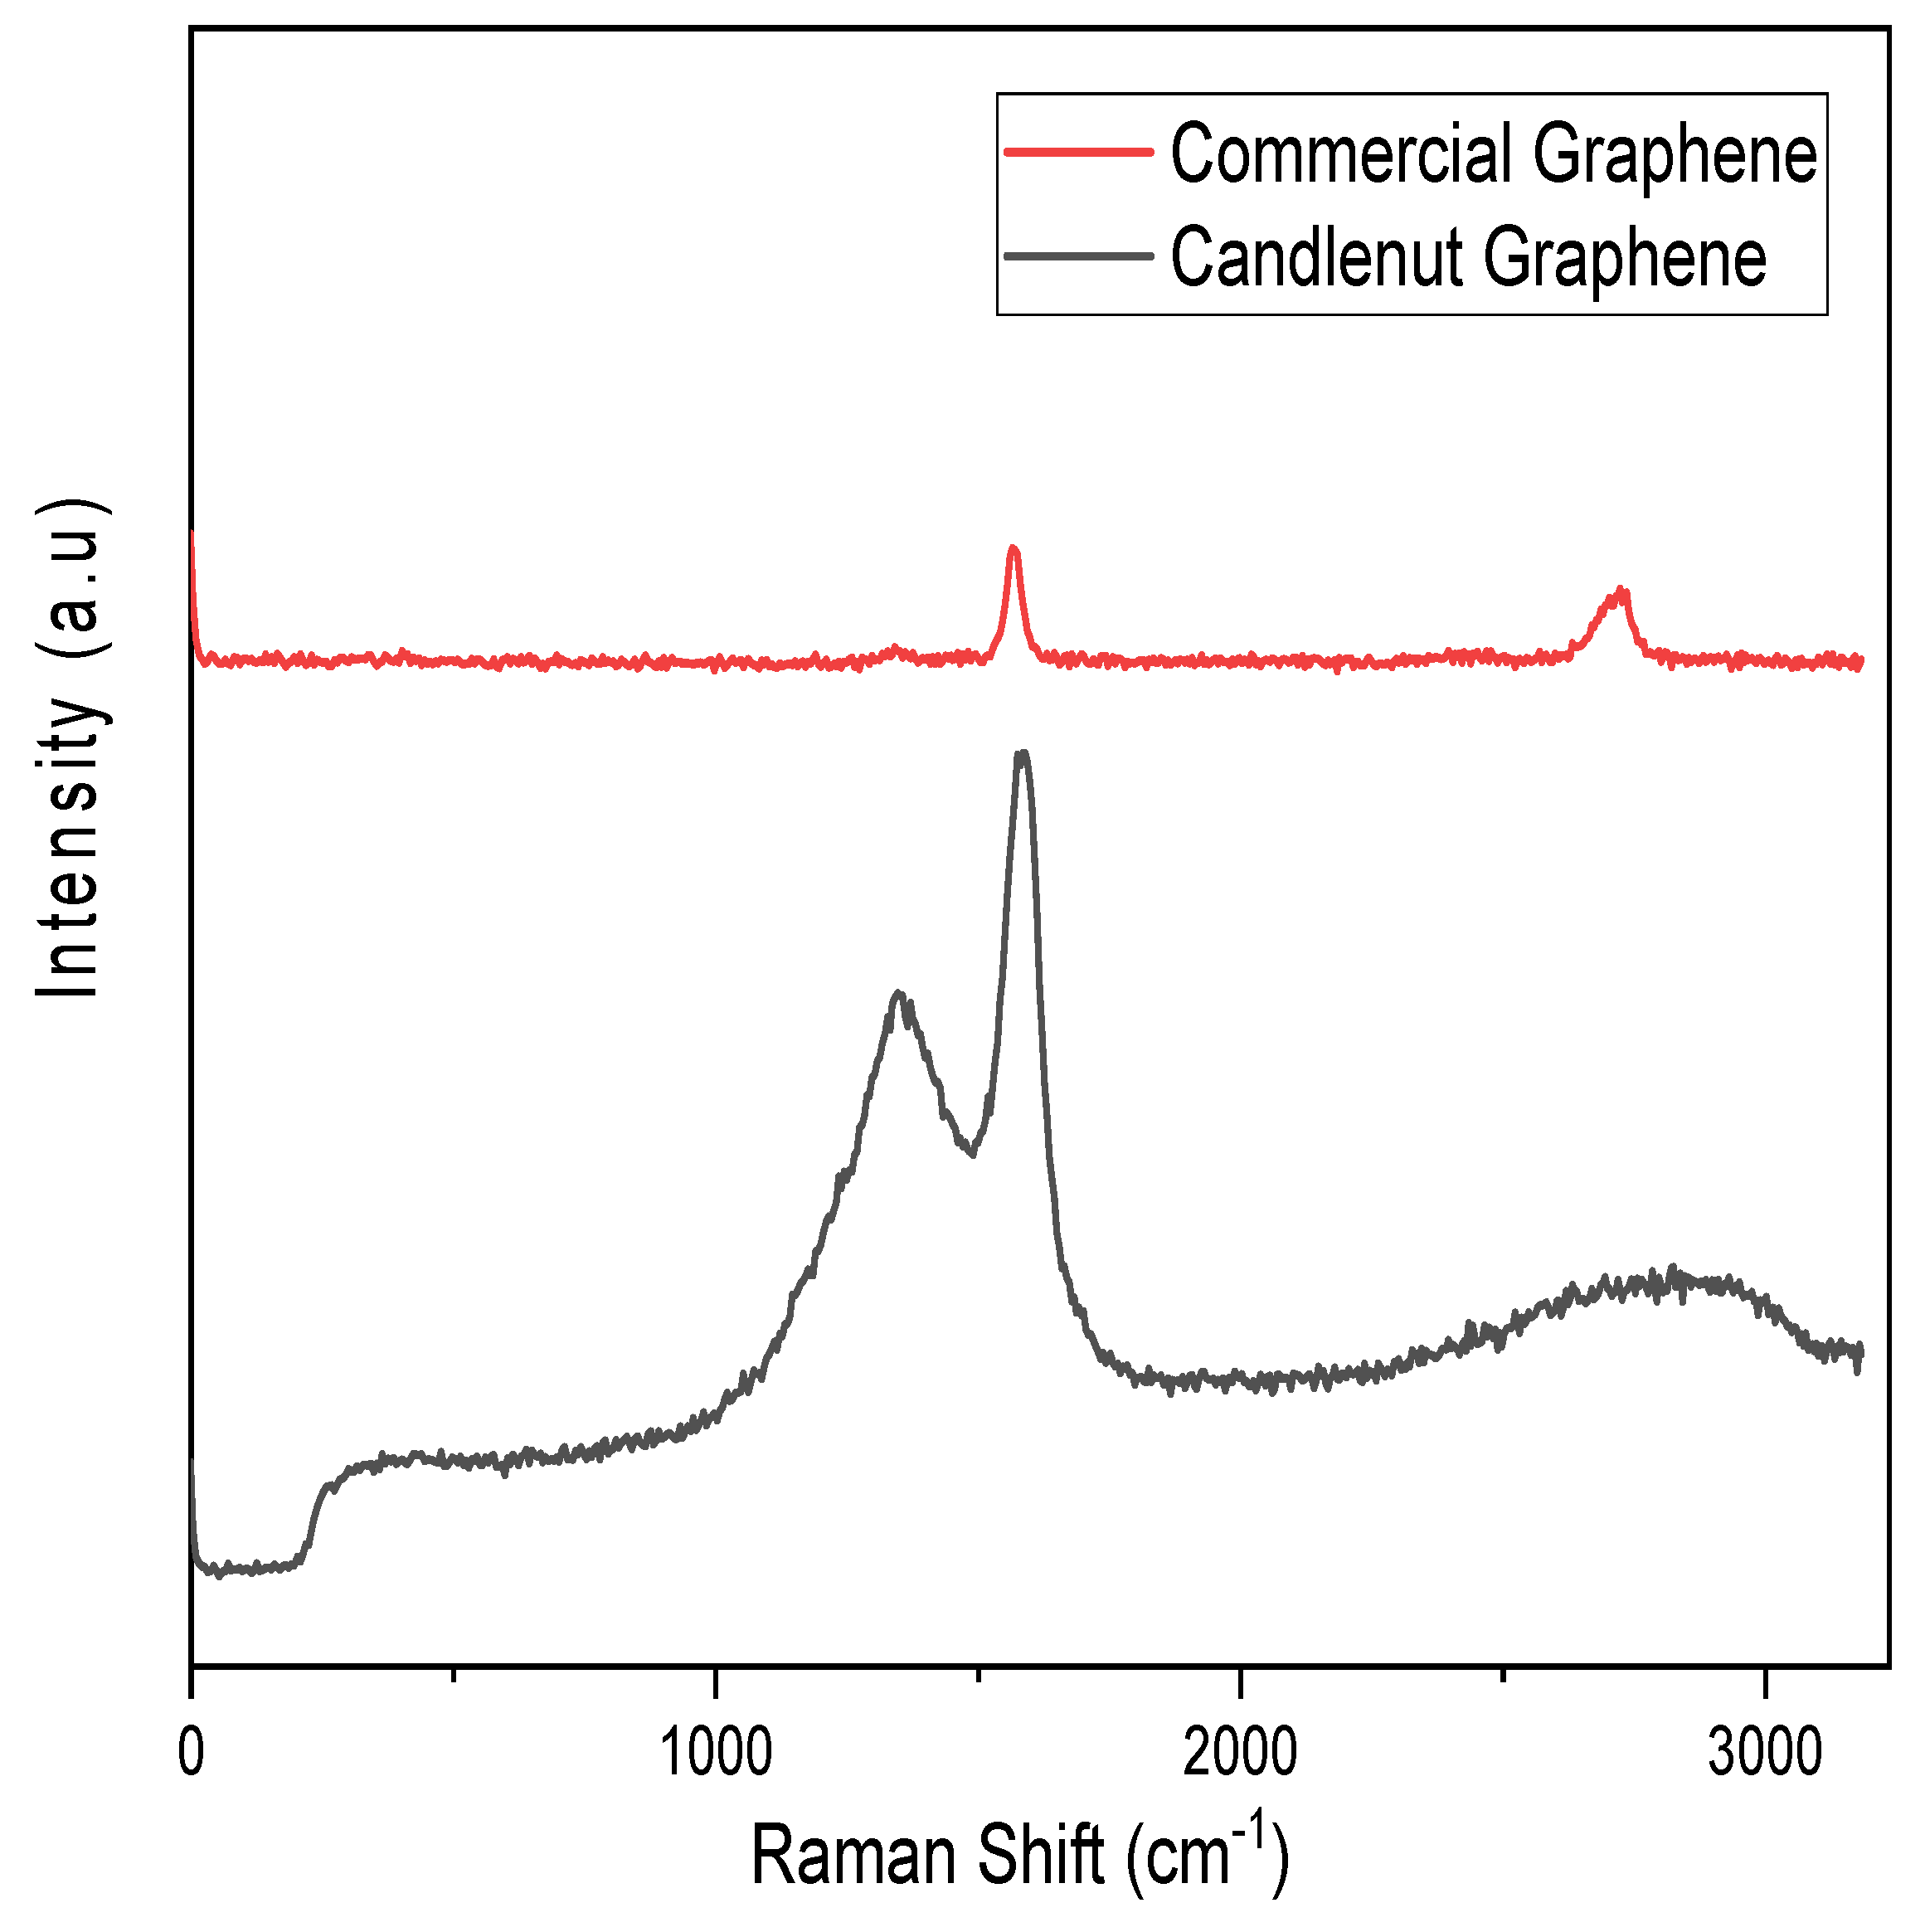
Raman spectroscopy was done on commercial and candlenut graphene to analyze the presence of defects and graphitization of carbon-based materials. As seen in
Figure 9.
The peak at 1330 cm
-1 of both materials were matched to the D band which indicates the presence of defects in the crystal lattice which causes the broken symmetry of the hexagonal carbon structure [
37,
38]. The peak at around 1600 cm
-1 is matched to the G band which indicates sp
2 hybrid configurations of carbon atoms [
39]. Peak around 2697 cm
-1 is attributed to the 2D band which is used to distinguish the number of layers for carbon structure. A sharp peak was observed for Commercial Graphene which is expected as it represents a monolayer structure which is typical of graphene. The 2D peak for the Candlenut graphene is broad which indicates the presence of multilayered carbon structure [
40].
The ratio of the intensity of D band over G band (ID/IG) is used to determine the degree of graphitization of the carbon material. The lower the ID/IG value, the higher the degree of graphitization. As can be seen in
Figure 9, the ID/IG (0.98) of the Candlenut graphene is as low as commercial Graphene (0.99) which suggests a very high degree of graphitization and the number of defects. In addition, the Candlenut graphene has lower ID/IG than other biochar that was previously reported [
37,
39]. A material with higher degree of graphitization has been reported to have higher electrical conductivity [
41] and greater electrochemical performance by accelerating ion diffusion [
42].
3.7. Electrochemistry tests
The catalytic activities of Candlenut graphene and 10 – 30 wt% Ce/Graphene are necessary to observe. The electrochemistry tests those are CV and LSV may be carried out to answer their catalytic activities.
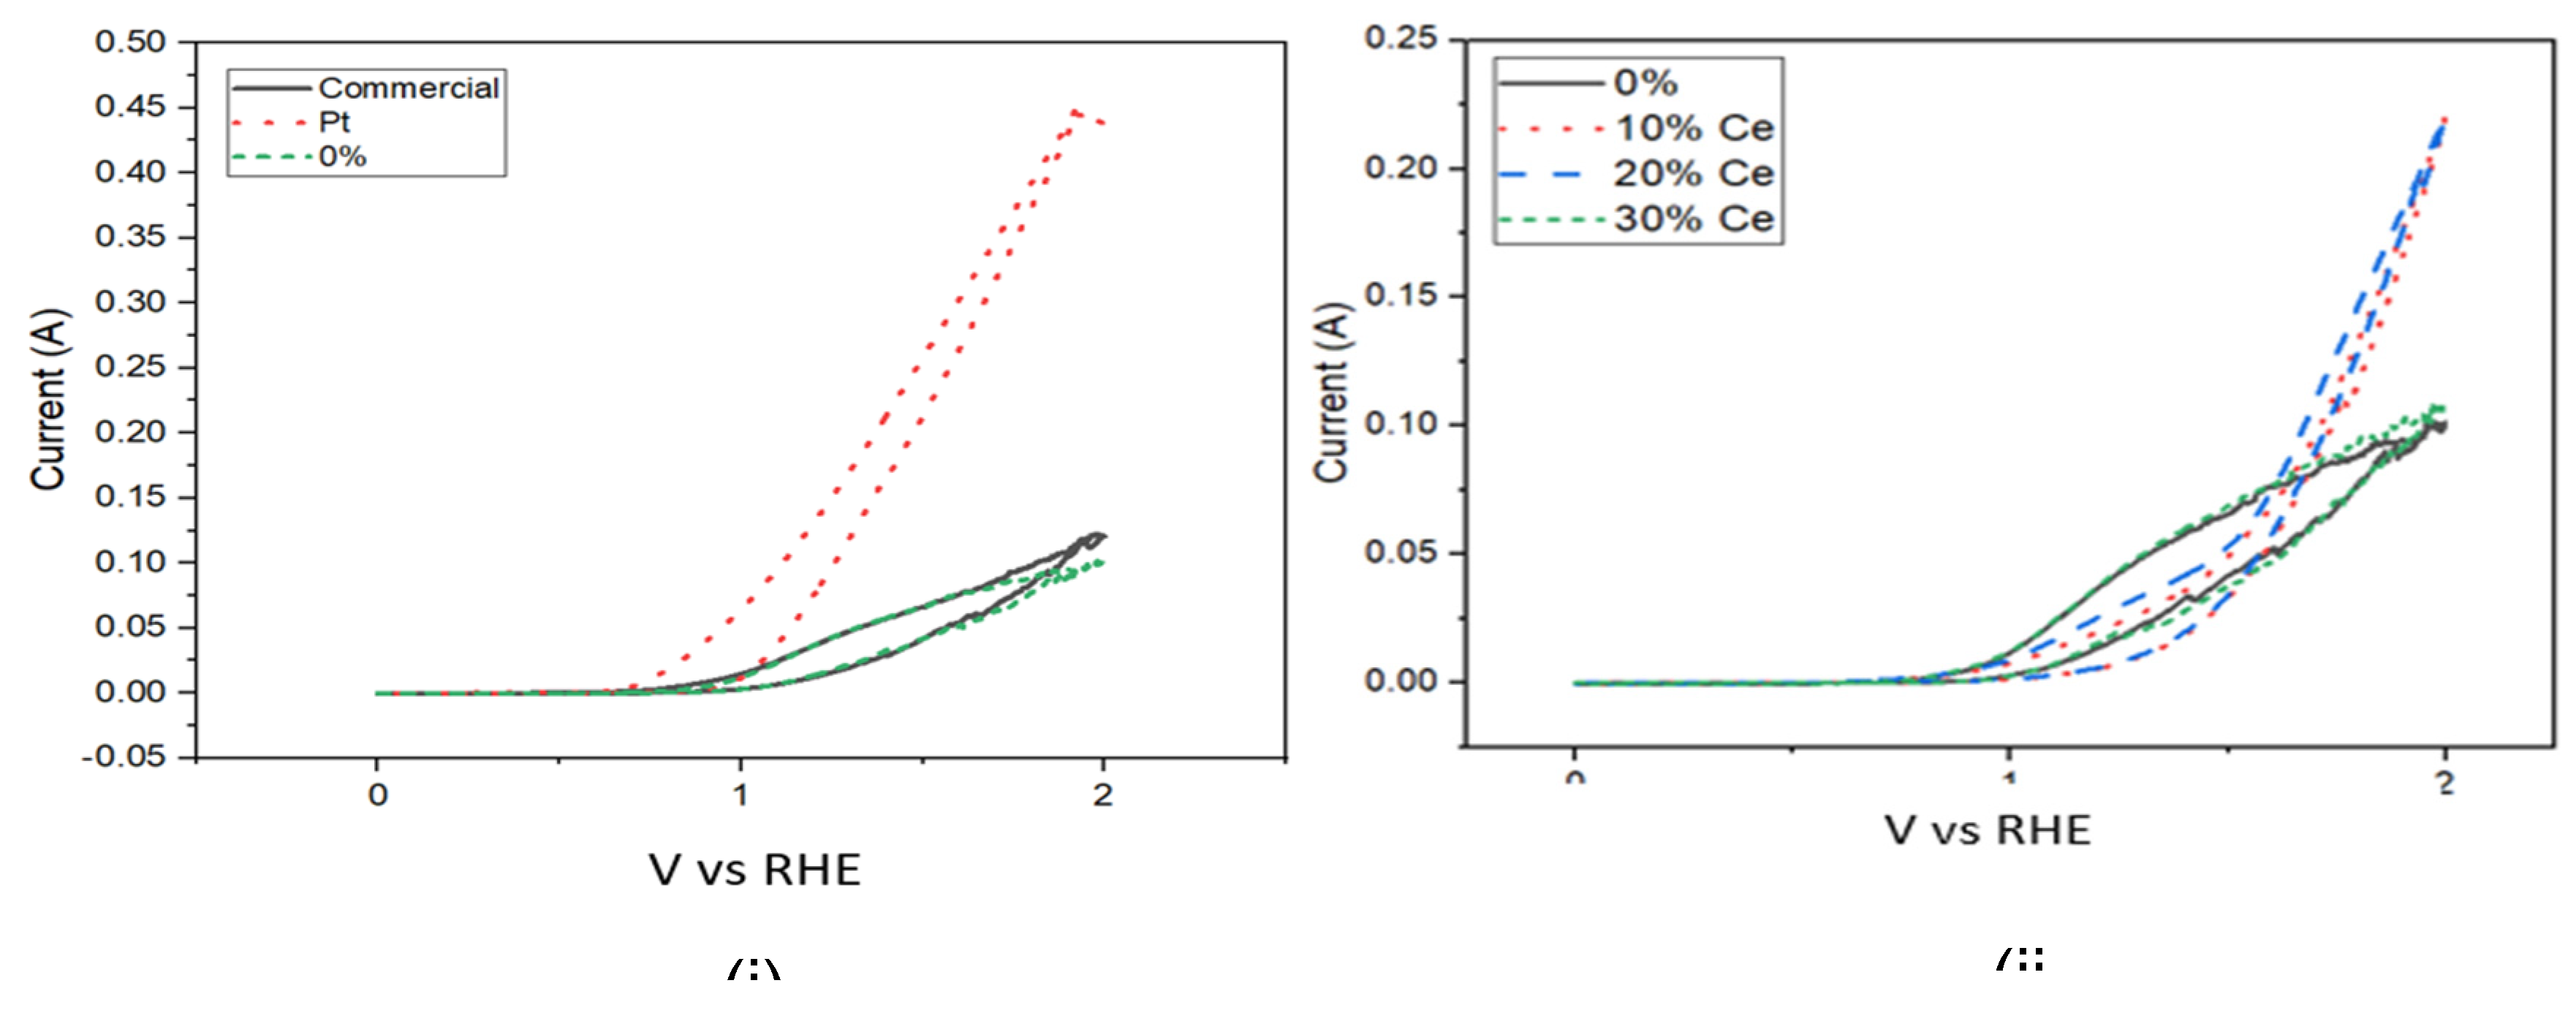
The CV graphs obtained for Candlenut graphene and Ce/Graphene are shown in
Figure 10. It should be noted the commercial graphene and Pt are used as well as references on both CV and LSV measurements.
Figure 10 (i) obviously shows that the current value of commercial graphene is close to Candlenut graphene, however the Pt current value is the highest among others. Interestingly, the current values of 10 and 20 wt% Ce/Graphene are totally different compared to 30 wt% Ce/Graphene (
Figure 10 (ii)). That is possibly caused the Candlenut graphene as a supporting material and the particle sizes Ce effect. These findings are very important due to the small amount of Ce on Candlenut graphene (10 wt% Ce/Graphene) has higher current compared to 30 wt% Ce/Graphene, meaning the small amount Ce attached on Candlenut graphene may be expected to improve the catalytic activity of Ce. Therefore, the usage Ce amount may be reduced, and it tends to economically cost. The other advantage of this finding is the controlling size, or other properties of Ce may be done when it attaches on Candlenut graphene.
In addition, the maximum current and area enclosed in the CV graphs may be seen in
Table 4.
Based on
Table 4, the Candlenut graphene has lower maximum current density of 1,016 A cm
-1 and smaller enclosed area of 0.1096 as compared to commercial graphene which has a maximum current density of 1,224 A cm
-1 and enclosed area of 0.1183, meaning the higher maximum current tends to give higher electrode surface area. However, upon the addition of Ce on Candlenut graphene may decrease its maximum current density and area enclosed numbers. That is caused the Ce state is still Ce oxide. The existence and type of oxygen functional groups on Ce for CeO
2 can affect the current density number of CeO
2 [
43,
44]. For Ce doped Candlenut graphene, 10 wt% Ce shows the best results with a maximum current density of 1,081 A cm
-1 and an enclosed area of 1.117, followed by 20 and 30 wt% Ce/Graphene. This shows that the optimal amounts of dopants to add is 10 wt% for Ce/Graphene. It means the 10 wt% Ce/Graphene has a higher concentration of electroactive species thus faster rate higher electron transfer. However, the Pt working electrode produces the highest maximum current density and area enclosed, however, as mentioned in the literature review, Pt can be quite costly, thus the doped graphene samples made from agricultural waste can be considered as a cheaper alternative. Thus, it can be concluded that graphene doped with 10 wt% Ce yielded the best results when looking at the maximum current and enclosed area of the CV curve. The maximum current, or peak current (I
p) can be used to examine the electrochemical properties. The maximum current density is affected by the concentration of electroactive species in the solution, thus higher maximum current density indicates higher concentration of electroactive species. Higher maximum current density also indicates that a faster rate of electron transfer, and the redox reaction is more favorable. The enclosed area in CV curve, or integrated charge, is proportional to the number of electrons transferred during the redox reaction as well as the electroactive species in the solution [
45].
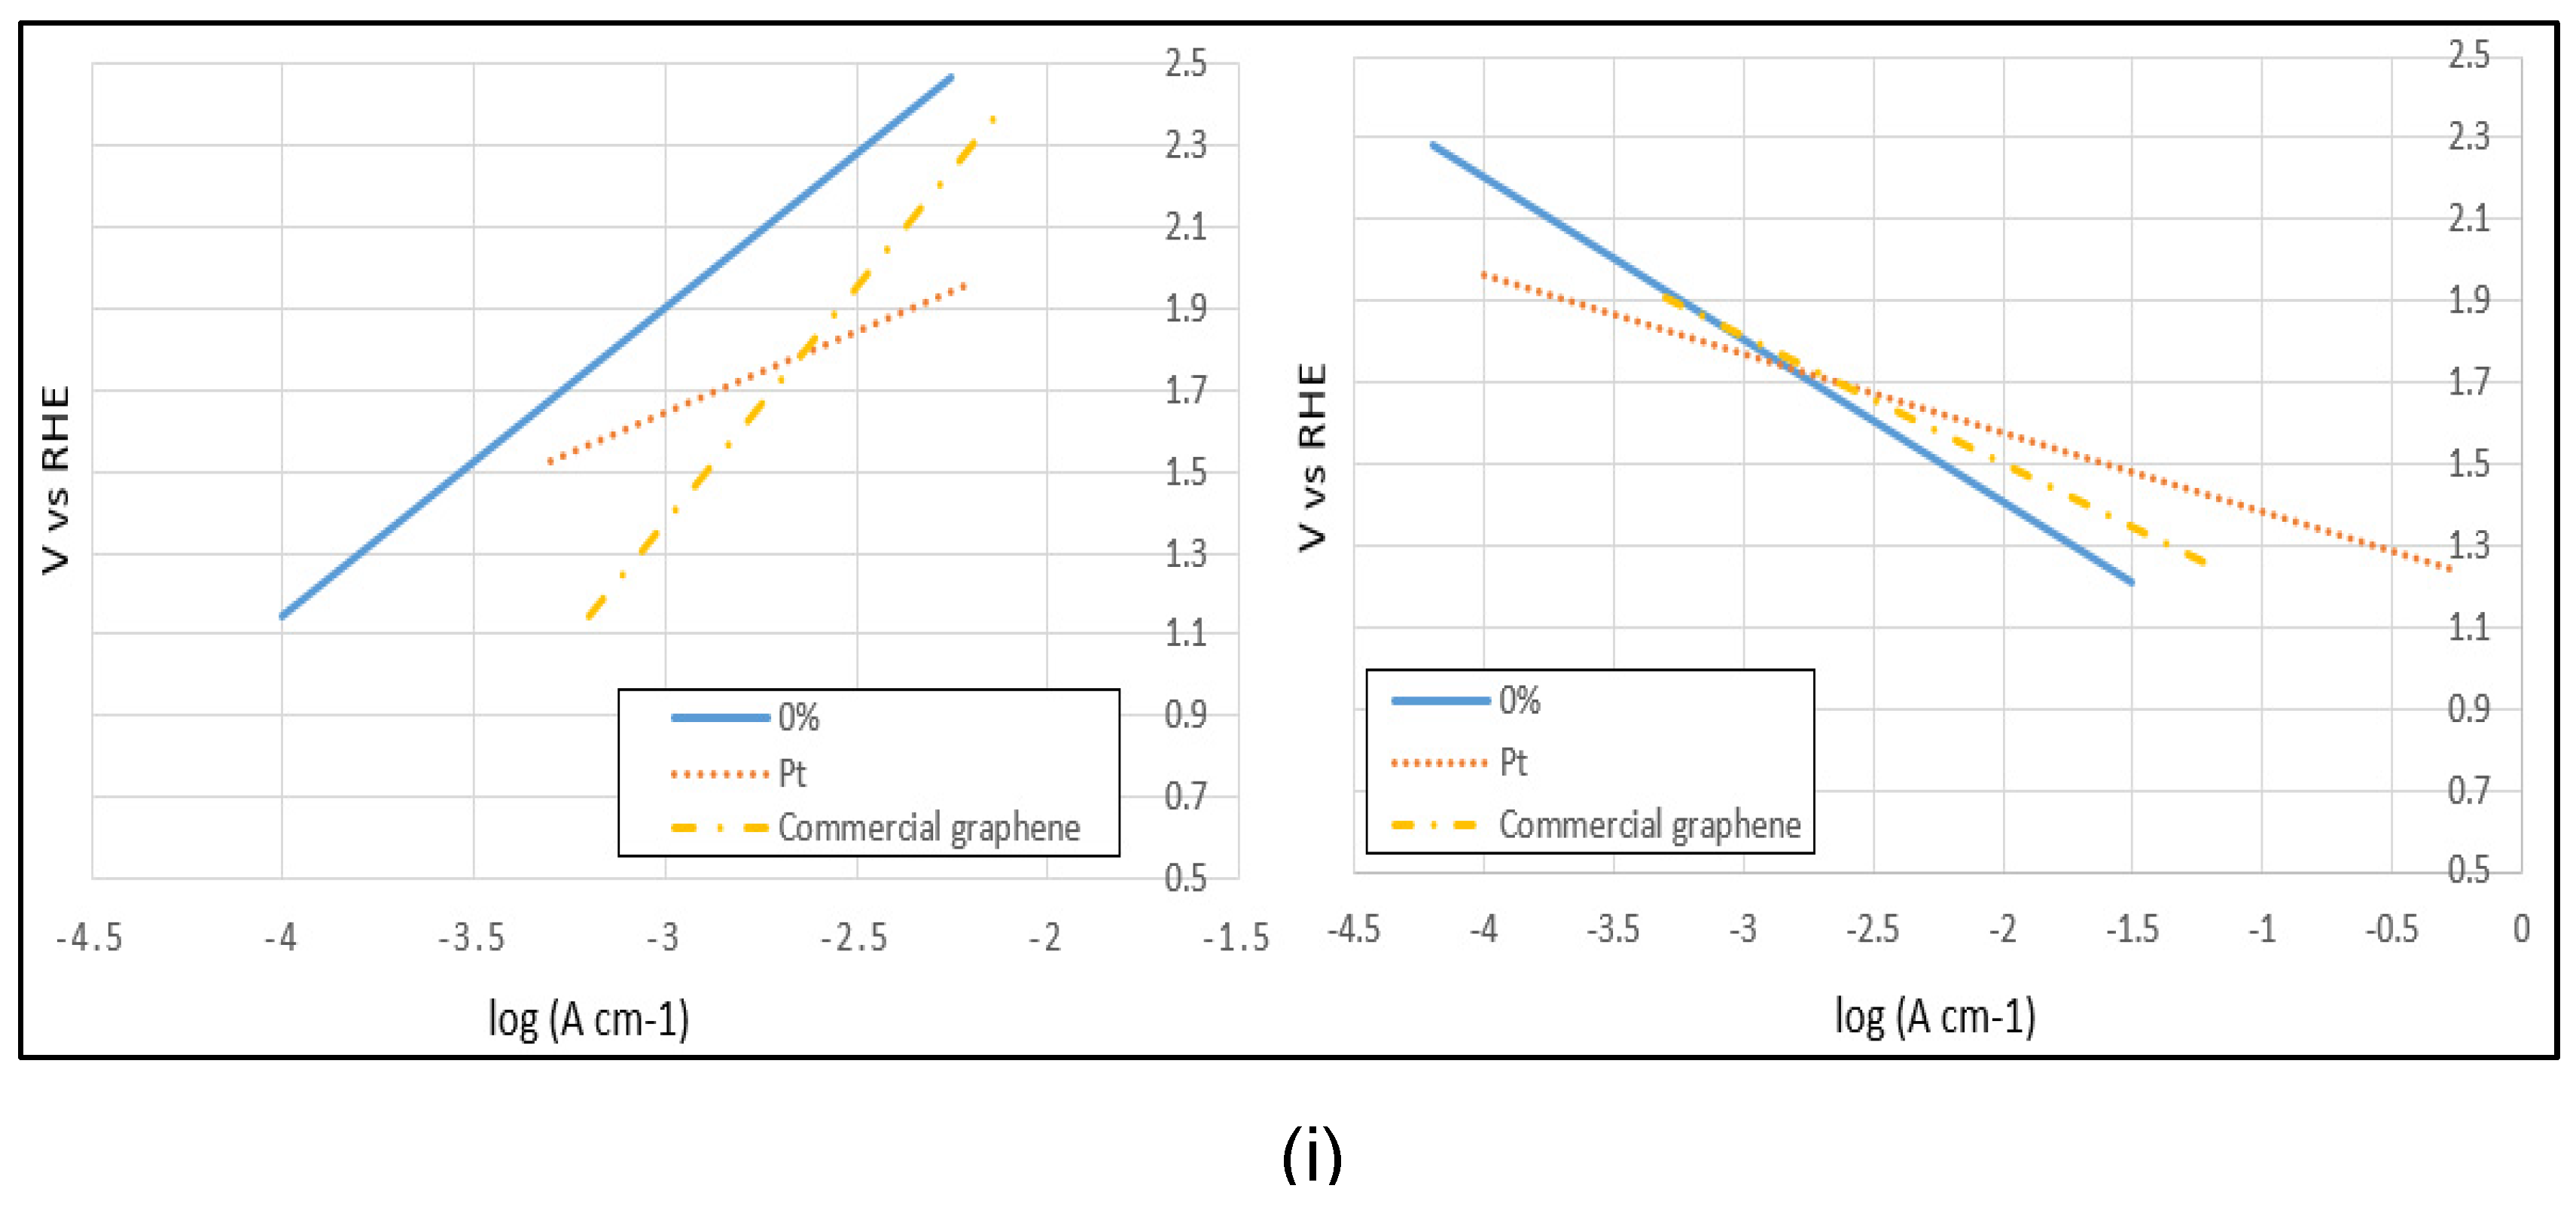
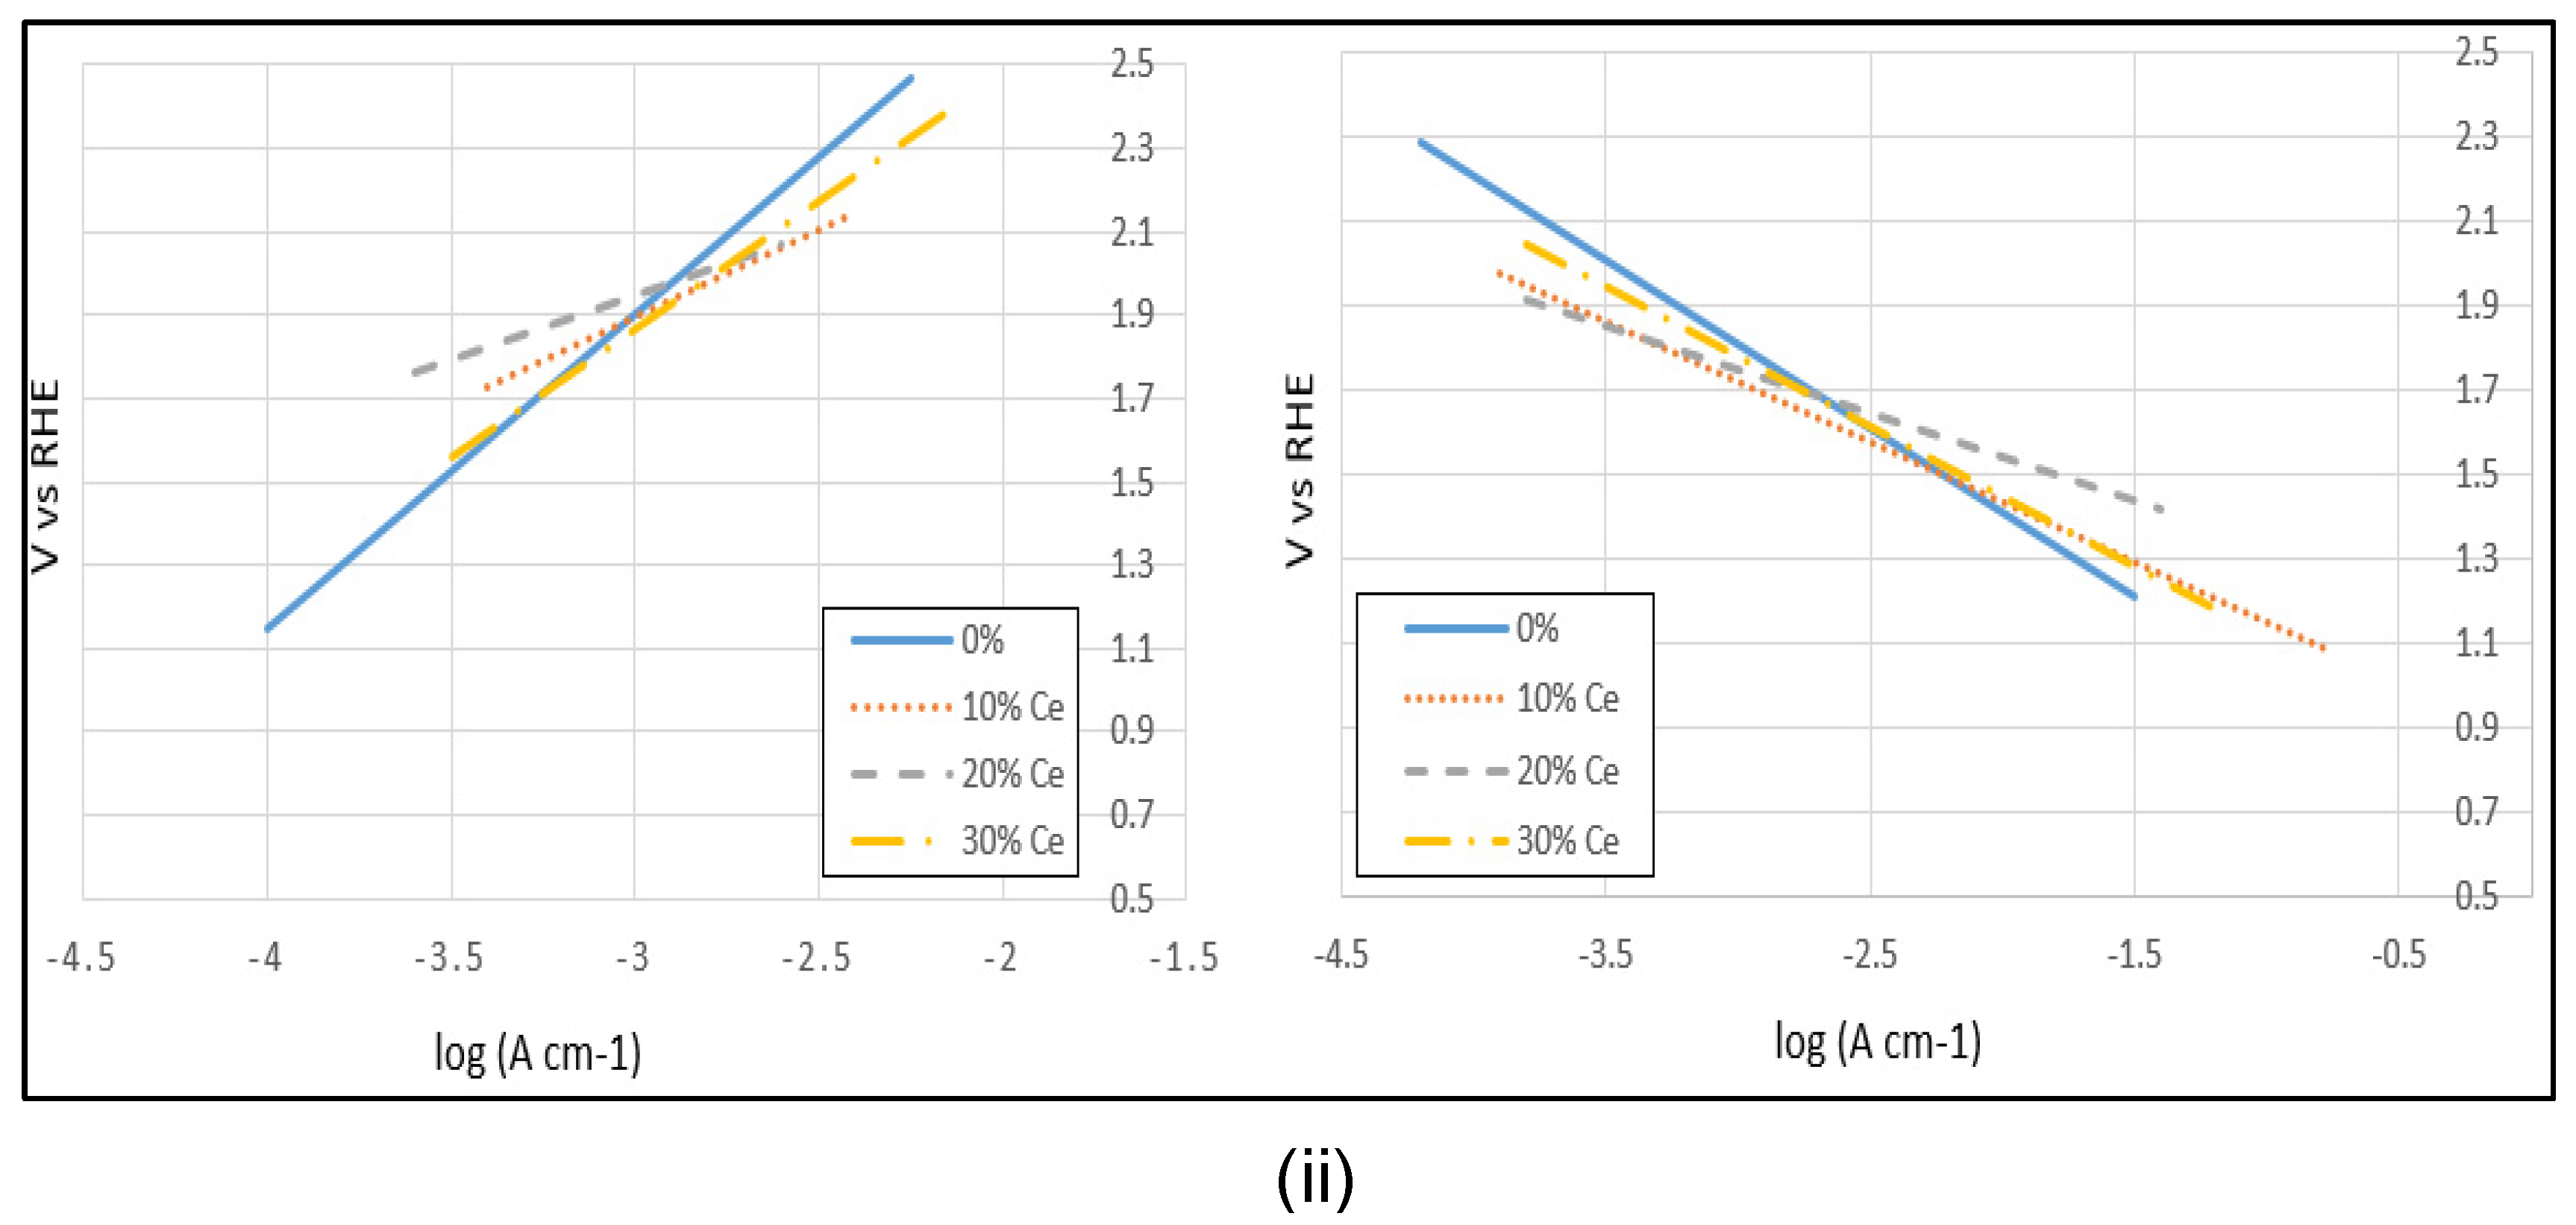
Moreover, analyzing to depict the relationship between overpotential of the anode/cathode and the current density is needed. The LSV analysis and Tafel slope may be expected to address it (
Figure 11 and
Table 5).
Tafel slope is used to describe the link between overpotential of the anode/cathode and the current density. The anodic Tafel slope describes the rate of oxidation reaction, where the electrode becomes more positive after losing electrons, thus it illustrates the rate of electron transfer from electrode to the oxidizing species in electrolyte. The cathodic Tafel slope describes the reduction reaction where the electrode becomes more negative after gaining electrons, thus, it illustrates the rate of electron transfer from reducing species in the electrolyte to the electrode. Therefore, catalysts which have smaller Tafel slope value tend to hasten electrocatalytic reaction and lower overpotential [
46,
47,
48,
49].
The Tafel plot may be seen in
Table 5.
From
Figure 11 and
Table 5, the 10 wt% Ce/Graphene has the best results among 20, 30 wt% Ce/Graphene and Candlenut graphene base on Tafel slope data. That is caused it has lower overpotential and faster electrocatalytic reaction. Briefly, the anodic and cathodic slope numbers of 10, 20, 30 wt% and Candlenut graphene are 0.3091, 0.4167, 0.6111, 0.7564 and -0.2071, -0.2854, -0.3330, -0.3993, respectively. Thus, we can see that 10 wt% Ce/Graphene has the best results. These performances are consistent with the CV results where the 10 wt% Ce/Graphene demonstrates the best electrocatalytic activity compared to 20, 30 wt% Ce/Graphene and Candlenut graphene. Thereby, interaction between Ce and Candlenut graphene may affect and modify their electrocatalytic activity properties. The other important property is corrosion resistance property. The best corrosion resistance results (I
corr and E
corr) are found at 10 wt% Ce/Graphene (-3.3787 μA cm
-2 and 1.8387 V), followed 20, 30 wt% Ce/Graphene and Candlenut graphene (
Table 5). Interestingly, comparing Ce/Graphene and Pt samples based on corrosion resistance, Ce gives better results compared to Pt. A similar result occurs for Candlenut graphene compares Commercial graphene. Therefore, we can conclude that 10 wt% Ce/Graphene has the best corrosion resistance among others thus it indicates more stable electrode potential [
50,
51,
52,
53,
54].
Concerning the electrochemistry tests, Candlenut graphene and 10 wt% Ce catalyst achieve better electrochemical measurement results compared to the other weight percentage doped. The 10 wt% Ce/Graphene produces a higher maximum current density and Ecorr which indicates that it has faster electron transfer and more stable electrode potential. In addition, 10 wt% Ce/Graphene has larger area enclosed within the CV graphs, which indicates higher concentration of electroactive species, gentler anodic and cathodic slope, which indicates lower overpotential and higher electrocatalytic reaction, and higher corrosion resistance, resulting in stronger interactions between Ce and carbon atoms in Candlenut graphene.
3.8. AC Electrical Resistance
To investigate the conductivity of Candlenut graphene and 10 – 30 wt% Ce/Graphene, we carried out the electrical resistance measurements. The AC electrical resistance measurements are recorded in
Table 6.
At a loading level of 0.24 wt.% (
Table 6), the composites containing Candlenut graphene and Candlenut graphene powder additives exhibit reduced values of AC electrical resistance compared to the Commercial graphene obtained from Sigma Aldrich. This reduction could be attributed to the presence of functional groups on the surface of the graphene structure, which facilitate better compatibility between the conductive additive and the epoxy resin matrix, improving its dispersion. Furthermore, the lack of significant improvement in electrical resistance between loading levels at 0.24 and 2.4 wt.% suggests that electrical percolation had already been achieved at the lower loading level.
The effect of doping the biocarbon (Candlenut graphene) with various cations to improve electrical conductivity is also studied. Nitrogen (N) and transition metal cations dopants such as iron (Fe), zinc (Zn), and nickel (Ni) showed reductions in AC resistance, with nitrogen-doped graphene demonstrating the most significant improvement in electrical conductivity. However, metal cations belonging to the lanthanide series of the periodic table, such as cerium (Ce) do not show significant improvement. This suggests that the electronic structure of the cationic dopant and its effect on the graphene structure play a crucial role in facilitating the transfer of charge across the composite.
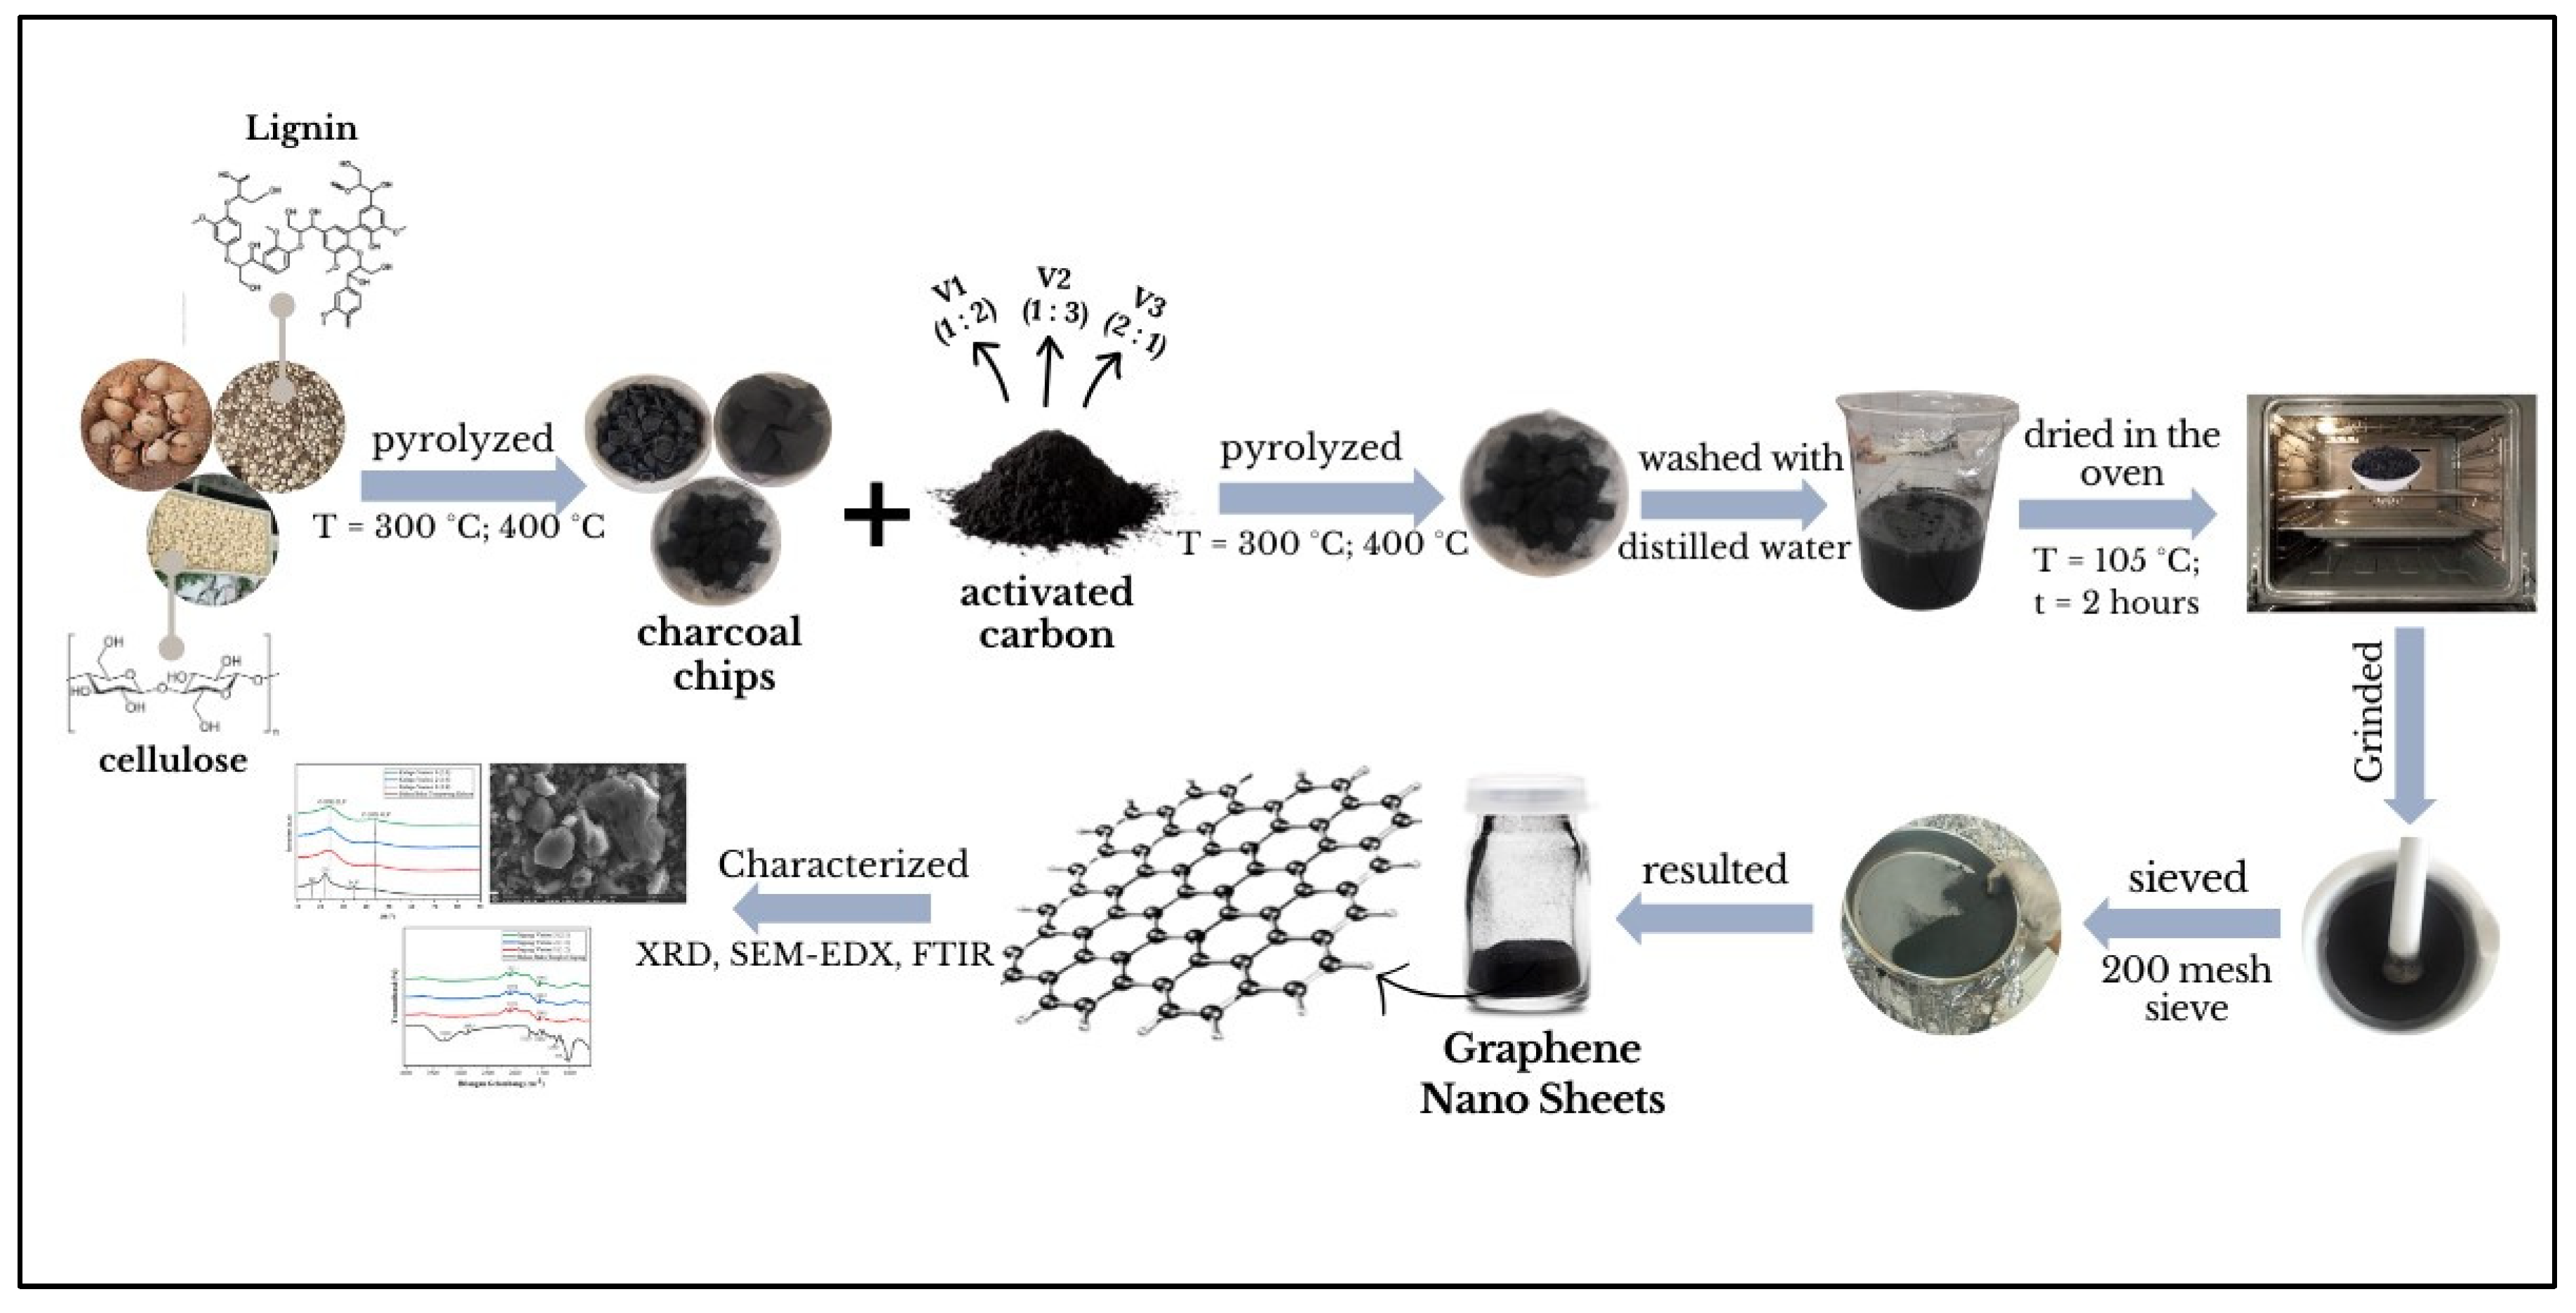
Based on all data, we propose the model of converting Candlenut shell to be carbon containing Graphene (
Figure 12).
Figure 12 shows that there are three steps converting Candlenut shells to be carbon containing graphene namely:
Step-1: Candlenut shells contain lignin and cellulose pyrolyzed to form charcoal chips. In this step, the lignin and cellulose should be oxidized and oxygen functional groups containing on it.
Step-2: To reduce oxygen functional groups and reconstruct graphitic carbon structure, pyrolyzed carbon is reduced and attached with activated carbon and further pyrolyzed to generate carbon containing graphene.
Step-3: Finally, in this step, carbon containing graphene is cleaned with distilled water, dried and grinded to separate between graphene and activated carbon, graphene part is collected and characterized.
This route is a very facile route to produce large scale graphene using sustainable raw material.
4. Conclusions
This study showcases the fabrication of bio sourced carbons containing graphene (Candlenut graphene) derived from candlenut wastes through a two-step pyrolysis process. The introduction of activated carbons is a critical factor in catalytic graphitization, enabling the transformation of amorphous carbon into graphene-like carbon. The great electrode current performance indicates its potential for application toward electrode battery. This research explores the potential of utilizing agricultural waste-derived biocarbon doped with rare earth metals as a promising avenue for advanced electrode materials, contributing to the development of sustainable and high-performance electrode.
Author Contributions
Rikson Siburian: Conceptualization, Data curation, Investigation, Methodology, Validation, Funding acquisition, Writing – original draft. Kerista Tarigan: Valida-tion, Visualization, Writing – original draft. Resources, Investigation. Yosia Gopas Oetama Manik: Investigation, Data curation. Fajar Hutagalung: Visualization. Yatimah Alias: Writing – review & editing. Chan Yong Ching: Investigation, Data curation. Boon Peng Chang: Writing – review & editing. Jonathan Siow: Conceptu-alization. Amanda Jiamin Ong: Conceptualization, Data curation. Jingfeng Huang: Writing – review & editing. Suriati Paiman: Writing – review & editing. Boon Tong Goh: Methodology, Validation, Writing – review & editing. Lisnawaty Simatupang: Project administration, Validation, Investigation, Methodology, Writing – original draft. Ronn Goei: Conceptualization, Investigation, Methodology, Validation, Writ-ing – original draft. Alfred Iing Yoong Tok: Validation, Conceptualization. Yahya Mohd Fakharul Zaman Raja: Data curation, Investigation, Methodology, Validation. Fathan Bahfie: Data curation, Investigation.
Funding
Please add: This research received no external funding or This research was funded by [name of funder] grant number [xxx] And The APC was funded by [XXX]. Information regarding the funder and the funding number should be provided. Please check the accuracy of funding data and any other information carefully.
Data Availability Statement
We encourage all authors of articles published in MDPI journals to share their research data. In this section, please provide details regarding where data supporting reported results can be found, including links to publicly archived datasets analyzed or generated during the study. Where no new data were created, or where data is unavailable due to privacy or ethical restrictions, a statement is still required. Suggested Data Availability Statements are available in section “MDPI Research Data Policies” at
https://www.mdpi.com/ethics.
Acknowledgments
The authors would like to thanks for financial support from: All of the authors would like to thank the Rector of the University of Sumatera Utara and DAPT-LPDP under the scheme “Penelitian Aliansi Internasional–WCU” (SK Rektor USU, No. 3721/UN5.1.R/SK/PPM/2022) who support us in this paper.
Conflicts of Interest
The authors declare there are no personal relationships which may be considered as potential competing interests.
References
- S.H. Choi, S.J. Yun, Y.S. Won, C.S. Oh, S.M. Kim, K.K. Kim, Y.H. Lee, Large-scale synthesis of graphene and other 2D materials towards industrialization, Nature Communications 13 (2022) 1484-1, . [CrossRef]
- P. Lv, X. Li, Z. Zhang, B. Nie, Y. Wu, N. Deng, H. Tian, T.L. Ren, G. Wang, Industrial-scale production of high-quality graphene sheets by millstone grinders, Journal of Physics D: Applied Physics 55 (2022) 164022, . [CrossRef]
- B. Koul, M. Yakoob, M.P. Shah, Agricultural waste management strategies for environmental sustainability, Environ. Res. 206 (2022) 112285, . [CrossRef]
- M. Shahbaz, S.A.A. Taqvi, M. Inayat, A. Inayat, S.A. Sulaiman, G. McKay, T. Al-Ansari, Air catalytic biomass (PKS) gasification in a fixed-bed downdraft gasifier using waste bottom ash as catalyst with NARX neural network modelling, Computers and Chemical Engineering 142 (2020) 107048, . [CrossRef]
- G.A.M. Ali, O.A. Habeeb, H. Algarni, K.F. Chong, CaO impregnated highly porous honeycomb activated carbon from agriculture waste: symmetrical supercapacitor study, Journal of Materials Science 54 (2019) 683–692, . [CrossRef]
- I.F. Sukmana, P. Widiatmoko, I. Nurdin, Devianto, T. Prakoso, Effect of ZnCl2 on properties of graphene produced from palm empty fruit bunch, IOP Conference Series Materials Science and Engineering 778 (2020) 012011, . [CrossRef]
- S. Arunachalam, B. Kirubasankar, D. Pan, H. Liu, C. Yan, Z. Guo, S. Angaiah, Research progress in rare earths and their composites based electrode materials for supercapacitors, Green Energy and Environment 5 (2020) 259–273, . [CrossRef]
- L.F. Chen, Y. Lu, L. Yu, and X. W.(D). Lou, Designed formation of hollow particle-based nitrogen-doped carbon nanofibers for high-performance supercapacitors, Energy and Environmental Science 10 (2017) 1777–1783, 2017, . [CrossRef]
- K. Zhang, S. Irmak, J.M. Catchmark, Preparation and properties of heteroatom-doped bacterial cellulose-derived carbonaceous materials, Carbohydrate Polymer Technologies and Applications 6 (2023) 100400, . [CrossRef]
- G. Kothandam, G. Singh, X. Guan, J.M. Lee, K. Ramadass, S. Joseph, M. Benzigar, A. Karakoti, J. Yi, P. Kumar, A. Vinu, Recent Advances in Carbon-Based Electrodes for Energy Storage and Conversion, Advanced Science 10 (2023) 2301045, . [CrossRef]
- Z. Zhao, H. Chen, W. Zhang, S. Yi, H. Chen, Z. Su, B. Niu, Y. Zhang, D. Long, Defect engineering in carbon materials for electrochemical energy storage and catalytic conversion, Materials Advances 4 (2023) 835–867, . [CrossRef]
- S. Ghosh, S.K. Behera, A. Mishra, C.S. Casari, K.K. Ostrikov, Quantum Capacitance of Two-Dimensional-Material-Based Supercapacitor Electrodes, Energy Fuels 37 (2023) 17836–17862, . [CrossRef]
- Y.Q. Mao, G.H. Dong, Y.Q. Li, P. Huang, S.Y. Fu, One-step fabrication of N/O self-doped porous carbon derived from 2-MeIM for high-performance supercapacitor electrode, Journal of Energy Storage, 74 (2023) 109263, . [CrossRef]
- Y. Fang, H. Wang, S. Ji, X. Wang, P. Kannan, R. Wang, Ag, N and O co-doped carbon cloth as high-capacitance electrodes for high-energy capacitors, Diamond and Related Materials 129 (2022) 109343, . [CrossRef]
- Z. Li, J. Lin, B. Li, C. Yu, H. Wang, Q. Li, Construction of heteroatom-doped and three-dimensional graphene materials for the applications in supercapacitors: A review, Journal of Energy Storage 44 (2021) 103437, . [CrossRef]
- S.S. Shah, Md.A. Aziz, P.I. Rasool, N.Z.K. Mohmand, A.J. Khan, H. Ullah, X. Feng, M. Oyama, Electrochemical synergy and future prospects: Advancements and challenges in MXene and MOFs composites for hybrid supercapacitors, Sustainable Materials and Technologies 39 (2024) e00814, . [CrossRef]
- S.M. Benoy, M. Pandey, D. Bhattacharjya, B.K. Saikia, Recent trends in supercapacitor-battery hybrid energy storage devices based on carbon materials, Journal of Energy Storage 52 (2022) 104938, . [CrossRef]
- R.M. Pallares, R.J. Abergel, Transforming lanthanide and actinide chemistry with nanoparticles, Nanoscale 12 (2020) 1339, . [CrossRef]
- S. Karthickprabhu, D. Vikraman, A. Kathalingam, K. Prasanna, H.S. Kim, K. Karuppasamy, Electrochemical and cycling performance of neodymium (Nd3+) doped LiNiPO4 cathode materials for high voltage lithium-ion batteries, Mater. Lett. 237 (2019) 224, . [CrossRef]
- R. Siburian, S. Paiman, F. Hutagalung, Ab.M.M. Ali, L. Simatupang, R. Goei, M.M. Rusop, Facile method to synthesize of magnesium-graphene nano sheets for candidate of primary battery electrode, Colloid and Interface Science Communications 48 (2022) 100612. [CrossRef]
- [21] M.V. Zdorovets, A.L. Kozlovskiy, Study of the stability of the structural properties of CeO2 microparticles to helium irradiation, Surface and Coatings Technology 383 (2020) 125286, . [CrossRef]
- J. Li, R. He, G. Guo, Y. Li, Y. Liao, Y. Li, Synthesis of Hierarchical Layered Quasi-Triangular Ce(OH)CO3 and Its Thermal Conversion to Ceria with High Polishing Performance, ACS Omega 8 (2023) 8519–8529, . [CrossRef]
- R. Chuah, S.C.B. Gopinath, P. Anbu, M.N. Salimi, A.R.W. Yaakub, T. Lakshmipriya, Synthesis and characterization of reduced graphene oxide using the aqueous extract of Eclipta prostrata, Biotech 10 (2020) 364, . [CrossRef]
- R.G. Abaszade, S.A. Mamedova, F.H. Agayev, S.I. Budzulyak, O.A. Kapush, M.A. Mamedova, A.M. Nabiyev, V.O. Kotsyubynsky, Synthesis and Characterization of Graphene Oxide Flakes for Transparent Thin Films, Physics and chemistry of solid state 22 (2021) 595, . [CrossRef]
- N.G. Barros, A.C.G. Neto, K.B. Vaccioli, H.R.V. Angulo, L.G.A. Silva, S.M. Toffoli, T.S. Valera, Graphene Oxide: A Comparison of Reduction Methods, Journal of Carbon Research 9 (2023) 73, . [CrossRef]
- P. Anagbonu, M. Ghali, A. Allam, Low-temperature green synthesis of few-layered graphene sheets from pomegranate peels for supercapacitor applications, Scientific Reports 13 (2023) 15627, . [CrossRef]
- T. Chenniappan, N. Uttamchand, Effect of graphene on thermal, mechanical, and shape memory properties of polyurethane nanocomposite, Applied Physics A 128 (2022) 937, . [CrossRef]
- D.N. Gopala Krishna, J. Philip, Review on surface-characterization applications of X-ray photoelectron spectroscopy (XPS): Recent developments and challenges, Applied Surface Science Advances 12 (2022) 100332, . [CrossRef]
- Aarva, S. Sainio, V.L. Deringer, M.A. Caro, T. Laurila, X-ray Spectroscopy Fingerprints of Pristine and Functionalized Graphene, J. Phys. Chem. C 125 (2021) 18234–18246, . [CrossRef]
- R. Siburian, A.M.M. Ali, K. Sebayang, M. Supeno, K. Tarigan, C. Simanjuntak, S.P. Aritonang, F. Hutagalung, The loading effect of Pt clusters on Pt/graphene nano sheets catalysts, Scientific Reports 11 (2021) 2532, . [CrossRef]
- M.A. Isaacs, C. Drivas, R. Lee, R. Palgrave, C.M.A. Parlett, D.J. Morgan, XPS surface analysis of ceria-based materials: Experimental methods and considerations, Applied Surface Science Advances 18 (2023) 100469, . [CrossRef]
- D.J. Morgan, Photoelectron spectroscopy of ceria: Reduction, quantification and the myth of the vacancy peak in XPS analysis, Surface and Interface Analysis 55 (2023) 787–850, . [CrossRef]
- S. Zou, X. Zhu, L. Zhang, F. Guo, M. Zhang, Y. Tan, A. Gong, Z. Fang, H. Ju, C. Wu, F. Du, Biomineralization-Inspired Synthesis of Cerium-Doped Carbonaceous Nanoparticles for Highly Hydroxyl Radical Scavenging Activity, Nanoscale Research Letters, Nanoscale Research Letters 13 (2018) 76, . [CrossRef]
- G. Vári, L. Óvári, J. Kiss, Z. Kónya, LEIS and XPS investigation into the growth of cerium and cerium dioxide on Cu(111), Physical Chemistry Chemical Physics 17 (2015) 5124–5132, . [CrossRef]
- G.B. Della Mea, L.P. Matte, A.S. Thill, F.O. Lobato, E.V. Benvenutti, L.T. Arenas, A. Jürgensen, R. Hergenröder, F. Poletto, F. Bernardi, Tuning the oxygen vacancy population of cerium oxide (CeO2−x, 0 < x < 0.5) nanoparticles, Applied Surface Science 422 (2017) 1102–1112, . [CrossRef]
- A.B. Yaacov, L.J. Falling, R.B. David, S. Attia, M.A. Andrés, S. Nemšák, B. Eren, Oxidation and Reduction of Polycrystalline Cerium Oxide Thin Films in Hydrogen, J Phys Chem Lett. 14 (2023) 7354–7360, . [CrossRef]
- M.G. Hourcade, G.S. Reis, A. Grimm, V.M. Dinh, E.C. Lima, S.H. Larsson, F.G. Gentili, Microalgae biomass as a sustainable precursor to produce nitrogen-doped biochar for efficient removal of emerging pollutants from aqueous media, Journal of Cleaner Production 348 (2022) 131280, . [CrossRef]
- J. Omiri, Y. Snoussi, A.K. Bhakta, S. Truong, S. Ammar, A.M. Khalil, M. Jouini, M.M. Chehimi, Citric-Acid-Assisted Preparation of Biochar Loaded with Copper/Nickel Bimetallic Nanoparticles for Dye Degradation, Colloids Interfaces 6 (2022) 18, . [CrossRef]
- R. Ji, Y. Wu, Y. Bian, Y. Song, Q. Sun, X. Jiang, L. Zhang, J. Han, H. Cheng, Nitrogen-doped porous biochar derived from marine algae for efficient solid-phase microextraction of chlorobenzenes from aqueous solution, Journal of Hazardous Materials 407 (2021) 124785, . [CrossRef]
- Y. Yan, S. Manickam, E. Lester, T. Wu, C.H. Pang, Synthesis of graphene oxide and graphene quantum dots from miscanthus via ultrasound-assisted mechano-chemical cracking method, Ultrasonics Sonochemistry 73 (2021) 105519, . [CrossRef]
- D. Cheng, M. Tian, B. Wang, J. Zhang, J. Chen, X. Feng, Z. He, L. Dai, L. Wang, One-step activation of high-graphitization N-doped porous biomass carbon as advanced catalyst for vanadium redox flow battery, Journal of Colloid and Interface Science 572 (2020) 216–226, . [CrossRef]
- W. Sun, J. Bai, C. Li, J. Liu, Effect of graphitization degree of electrospinning carbon fiber on catalytic oxidation of styrene and electrochemical properties, Chemical Physics Letters 715 (2019) 299–309, . [CrossRef]
- C. Qiu, Q. Zhou, R. Gao, Y. Guo, J. Qin, D. Wang, Y. Song, An Unprecedented CeO2/C Non-Noble Metal Electrocatalyst for Direct Ascorbic Acid Fuel Cells, Nanomaterials 13 (2023) 2669, . [CrossRef]
- Shaheen, I. Hussain, T. Zahra, M.S. Javed, S.S.A. Shah, K. Khan, M.B. Hanif, M.A. Assiri, Z. Said, W.U. Arifeen, B. Akkinepally, K. Zhang, Recent advancements in metal oxides for energy storage materials: Design, classification, and electrodes configuration of supercapacitor, Journal of Energy Storage 72 (2023) 108719, . [CrossRef]
- N. Elgrishi, K.J. Rountree, B.D. McCarthy, E.S. Rountree, T.T. Eisenhart, J.L. Dempsey, A Practical Beginner’s Guide to Cyclic Voltammetry, J. Chem. Educ. 95 (2018) 197–206, . [CrossRef]
- C. Wan, Y. Ling, S. Wang, H. Pu, Y. Huang, X. Duan, Unraveling and Resolving the Inconsistencies in Tafel Analysis for Hydrogen Evolution Reactions, ACS Cent. Sci. 10 (2024) 658–665, . [CrossRef]
- A.S. Sabir, E. Pervaiz, R. Khosa, U. Sohail, An inclusive review and perspective on Cu-based materials for electrochemical water splitting, RSC Adv., 13 (2023) 4963–4993, . [CrossRef]
- S. Anantharaj, S. Noda, V.R. Jothi, S.C. Yi, M. Driess, P.W. Menezes, Strategies and Perspectives to Catch the Missing Pieces in Energy-Efficient Hydrogen Evolution Reaction in Alkaline Media, Angew Chem Int Ed Engl. 60 (2021) 18981–19006, . [CrossRef]
- G.K. Gebremariam, A.Z. Jovanović, I.A. Pašti, The Effect of Electrolytes on the Kinetics of the Hydrogen Evolution Reaction, Hydrogen 4 (2023), 776–806, . [CrossRef]
- V.S. Saji, Corrosion and Materials Degradation in Electrochemical Energy Storage and Conversion Devices, ChemElectroChem 10 (2023) e202300136, . [CrossRef]
- X. Fang, D. Wu, J. Liu, Y. Yang, S. Lv, S. Wu, Y. Chen, Microstructure evolution and corrosion resistance of high-pressure rheo-cast Mg–Zn–Y alloy containing quasicrystal, Journal of Materials Research and Technology 24 (2023) 542–556, . [CrossRef]
- A.F. Sotillo, P.F. Aparicio, Durable corrosion-resistant coating based in graphene oxide for cost-effective fuel cells components, iScience 26 (2023) 106569, . [CrossRef]
- T. Wirtanen, T. Prenzel, J.P. Tessonnier, S.R. Waldvogel, Cathodic Corrosion of Metal Electrodes—How to Prevent It in Electroorganic Synthesis, Chem. Rev. 121 (20210 10241–10270, . [CrossRef]
- L. Weia, Z. Gao, Recent research advances on corrosion mechanism and protection, and novel coating materials of magnesium alloys: a review, RSC Adv. 13 (2023) 8427–8463, . [CrossRef]
Figure 1.
XRD pattern of Graphene (0 wt% Ce) and 10 – 30 wt% Ce/Graphene.
Figure 1.
XRD pattern of Graphene (0 wt% Ce) and 10 – 30 wt% Ce/Graphene.
Figure 2.
SEM image (a); C element mapping (b); O element mapping (c); K element mapping (d); Ca element mapping (e); and EDX graph (f) for Candlenut graphene. .
Figure 2.
SEM image (a); C element mapping (b); O element mapping (c); K element mapping (d); Ca element mapping (e); and EDX graph (f) for Candlenut graphene. .
Figure 3.
TEM image of Candlenut graphene.
Figure 3.
TEM image of Candlenut graphene.
Figure 4.
SEM image (a); C element mapping (b); O element mapping (c); Ce element mapping (d); S element mapping (e); Ni element mapping (f); Ca element mapping (g); F element mapping (h); Al element mapping (i); K element mapping (j) and EDX graph (f) for 10 wt% Ce/Graphene.
Figure 4.
SEM image (a); C element mapping (b); O element mapping (c); Ce element mapping (d); S element mapping (e); Ni element mapping (f); Ca element mapping (g); F element mapping (h); Al element mapping (i); K element mapping (j) and EDX graph (f) for 10 wt% Ce/Graphene.
Figure 5.
(I). SEM image (a); C element mapping (b); O element mapping (c); Ce element mapping (d); S element mapping (e); Ca element mapping (f); EDX graph (g) for 20 wt% Ce/Graphene; and Fig. 5 (II). SEM image (a); C element mapping (b); O element mapping (c); Ce element mapping (d); S element mapping (e); Ca element mapping (f); Al element mapping (g); K element mapping (h); EDX graph (i) for 30 wt% Ce/Graphene.
Figure 6.
TGA graph of Undoped (graphene), 10, 20 and 30 wt% Ce/Graphene.
Figure 6.
TGA graph of Undoped (graphene), 10, 20 and 30 wt% Ce/Graphene.
Figure 7.
FTIR graph of Candlenut graphene doped with 0, 10, 20 and 30 wt% Ce/Graphene.
Figure 7.
FTIR graph of Candlenut graphene doped with 0, 10, 20 and 30 wt% Ce/Graphene.
Figure 8.
(i) C1s, (ii) Ce 3d and (iii) O1s XPS graph of Candlenut graphene doped with 0, 10, 20 and 30 wt% Ce.
Figure 8.
(i) C1s, (ii) Ce 3d and (iii) O1s XPS graph of Candlenut graphene doped with 0, 10, 20 and 30 wt% Ce.
Figure 9.
Raman spectra of commercial and Candlenut graphene.
Figure 9.
Raman spectra of commercial and Candlenut graphene.
Figure 10.
CV graph for (i) commercial graphene, platinum, blank GCE and undoped graphene, (ii) graphene from candlenut doped with 0, 10, 20 and 30 wt% Ce/Graphene.
Figure 10.
CV graph for (i) commercial graphene, platinum, blank GCE and undoped graphene, (ii) graphene from candlenut doped with 0, 10, 20 and 30 wt% Ce/Graphene.
Figure 11.
Anodic (left) and cathodic (right) Tafel slope of (i) Commercial graphene, Platinum, blank GCE and Candlenut graphene, (ii) graphene from candlenut doped with 0, 10, 20 and 30 wt% Ce.
Figure 11.
Anodic (left) and cathodic (right) Tafel slope of (i) Commercial graphene, Platinum, blank GCE and Candlenut graphene, (ii) graphene from candlenut doped with 0, 10, 20 and 30 wt% Ce.
Figure 12.
The route of converting Candlenut shells to carbon containing graphene.
Figure 12.
The route of converting Candlenut shells to carbon containing graphene.
Table 1.
Composition elements of Candlenut graphene.
Table 1.
Composition elements of Candlenut graphene.
| Element |
Weight (%) |
Atomic (%) |
| C |
94.95 |
95.00 |
| O |
4.15 |
4.72 |
| K |
0.65 |
0.20 |
| Ca |
0.24 |
0.07 |
Table 2.
Composition elements of 10 wt% Ce/Graphene.
Table 2.
Composition elements of 10 wt% Ce/Graphene.
| Element |
Weight (%) |
Atomic (%) |
| C |
78.49 |
80.36 |
O
Ce
S
Ni
Ca
F
Al |
9.60
10.49
0.48
0.02
0.52
0.10
0.13 |
9.10
10.04
0.19
0.03
0.16
0.12
0.06 |
| K |
0.30 |
0.10 |
Table 3.
Composition elements of 20 and 30 wt% Ce/Graphene.
Table 3.
Composition elements of 20 and 30 wt% Ce/Graphene.
| |
20 wt% Ce/Graphene |
30 wt% Ce/Graphene |
| Element |
Weight (%) |
Atomic (%) |
Weight (%) |
Atomic (%) |
| C |
77.13 |
77.12 |
67.63 |
68.03 |
O
Ce
S
Ni
Ca
F
Al |
1.43
20.45
0.06
0.00
0.27
0.00
0.00 |
1.29
20.64
0.51
0.00
0.11
0.00
0.00 |
1.11
30.18
0.55
0.00
0.22
0.00
0.12 |
1.47
30.01
0.21
0.00
0.05
0.00
0.17 |
K
Si |
0.29
0.38 |
0.12
0.21 |
0.19
0.00 |
0.07
0.00 |
Table 4.
Maximum current and area enclosed of CV graph for each sample.
Table 4.
Maximum current and area enclosed of CV graph for each sample.
| Working electrode |
Maximum Current (A) |
Area enclosed |
| Pt |
0.4474 |
0.4932 |
| Blank GCE |
0.2184 |
0.1486 |
| GCE coated with Commercial graphene |
0.1224 |
0.1183 |
| GCE coated with Candlenut graphene |
0.1016 |
0.1096 |
| GCE coated with 10 wt% Ce/Graphene |
0.1081 |
0.1117 |
| GCE coated with 20 wt% Ce/Graphene |
0.0944 |
0.0952 |
| GCE coated with 30 wt% Ce/Graphene |
0.0795 |
0.0815 |
Table 5.
Anodic, cathodic slope and Icorr and Ecorr obtained from Tafel plot for each sample.
Table 5.
Anodic, cathodic slope and Icorr and Ecorr obtained from Tafel plot for each sample.
| Working electrode |
Anodic slope |
Cathodic Slope |
Icorr (μA cm-2) |
Ecorr (V) |
| Pt |
0.3966 |
-0.1951 |
-2.7829 |
1.7572 |
| Commercial graphene |
1.1489 |
-0.3131 |
-2.6894 |
1.7114 |
| Candlenut graphene |
0.7564 |
-0.3993 |
-3.0316 |
1.7308 |
| 10 wt% Ce/Graphene |
0.3091 |
-0.2071 |
-3.3787 |
1.8387 |
| 20 wt% Ce/Graphene |
0.4167 |
-0.2854 |
-3.1983 |
1.7708 |
| 30 wt% Ce/Graphene |
0.6111 |
-0.3330 |
-3.0752 |
1.7641 |
Table 6.
AC electrical resistance measurements for epoxy-graphene samples at frequency of 1kHz.
Table 6.
AC electrical resistance measurements for epoxy-graphene samples at frequency of 1kHz.
| Sample |
AC Resistance (MΩ) |
| Commercial Graphene (0.24 wt.%) |
5.80 ± 0.40 |
| Candlenut Graphene (0.24 wt.%) |
4.10 ± 0.54 |
| Candlenut Graphene-Commercial Graphene (0.24 wt%) |
4.42 ± 0.22 |
| Candlenut Graphene-Ce-Commercial Graphene (0.24 wt.%) |
4.27 ± 0.29 |
| Candlenut Graphene-Commercial Graphene (2.4 wt%) |
4.43 ± 0.22 |
| Candlenut Graphene-N Commercial Graphene (2.4 wt.%) |
4.19 ± 0.17 |
| Candlenut Graphene-Fe-Commercial Graphene (2.4 wt.%) |
4.35 ± 0.54 |
| Candlenut Graphene-Zn-Commercial Graphene (2.4 wt.%) |
4.31 ± 0.26 |
| Candlenut Graphene-Ni-Commercial Graphene (2.4 wt.%) |
4.21 ± 0.17 |
|
Disclaimer/Publisher’s Note: The statements, opinions and data contained in all publications are solely those of the individual author(s) and contributor(s) and not of MDPI and/or the editor(s). MDPI and/or the editor(s) disclaim responsibility for any injury to people or property resulting from any ideas, methods, instructions or products referred to in the content. |
© 2024 by the authors. Licensee MDPI, Basel, Switzerland. This article is an open access article distributed under the terms and conditions of the Creative Commons Attribution (CC BY) license (http://creativecommons.org/licenses/by/4.0/).

