
Submitted:
20 June 2024
Posted:
21 June 2024
You are already at the latest version
Abstract
Serum biochemical indicators serve as vital proxies that reflect the physiological state and functions of different organs. The genetic parameters and molecular mechanisms underlying serum biochemical indicators of sheep (Ovis aries) have not been well understood. Therefore, the aim of the present study was to identify genetic architecture and genomic loci underlying ten serum biochemical indicators in sheep, including alanine transaminase, aspartate transferase, lactate dehydrogenase, cholesterol, glucose, phosphorus, calcium, creatinine, urea concentrations and total protein levels. We implemented genetic parameter estimations and GWAS for each trait in 422 Akkaraman lambs. Overall, low to moderate heritability estimates were found, in the range 0.14–0.55. Additionally, low to high genetic correlations were observed among traits. In total, 23 SNP loci were associated with serum biochemical indicators leading to 19 genes . These are SPTA1, MGST2, CACUL1, IGFBP7, PARD3, PHB1, SLC15A5, TRIM35, RGS6, NUP93, CNTNAP2, SLC7A11, B3GALT5, DPP10, HST2ST1, NRP1, LRP1B, MAP3K9, ENSOARG00020040484.1 as well as LOC101103187, LOC101117162, LOC105611309 and LOC101118029. To our knowledge, these data provide the first association between SPTA1 and serum cholesterol and between ENSOARG00020040484.1 and serum glucose. The current findings provide a comprehensive inventory of the relationships between serum biochemical parameters, genetic variants, and disease-relevant characteristics. This information may facilitate the identification of therapeutic targets and fluid biomarkers and establish a strong framework for comprehending the pathobiology of complex diseases as well as providing targets for sheep genetic improvement programmes.
Keywords:
Serum biochemical indicators
; Ovis aries
; GWAS
; QTL
; genetic correlation
; heritability
1. Introduction
Animal blood components reflect their immune system and metabolism of nutrients. Serum is the fluid and solute fraction of blood that lacks erythrocytes, platelets, leukocytes, and clotting factors [1]. Serum contains a wide range of nutrients, including proteins, electrolytes, antigens, antibodies, hormones, and exogenous elements not needed for clotting. Serum is also required for the body's delivery of nutrients, preservation of the homeostasis of the intracellular environment, and electrolyte and acid-base balance [2,3].
Serum biochemical indicators serve as vital proxies that reflect the physiological state and functions of different organs. As molecular phenotypic biomarkers, they are commonly employed as general indicators to assess an organism's immunological status and overall health conditions [4-6]. Many of these parameters appear to have moderate to high heritability in various species including human, pigs, and horses [7-9]. Correspondingly, these traits were expected to be under tighter genetic control compared to the associated diseases and complex traits, since they are directly linked to the biochemical pathways, which might provide valuable information about the underlying biological control [7,10,11]. Therefore, identifying the genetic architecture responsible for their variability may contribute to a better understanding of the biological processes involved in various diseases and complex traits that are linked to these molecular phenotypes.
Animal welfare and health status have paramount importance for all livestock enterprises since any deviation from good health might have adverse effects on the profitability, productivity, and sustainability of production systems [12]. Mounting evidence suggest that serum biochemical parameters have a wide range of associations with disease resistance, resilience, immune functions, productivity, and feed efficiency in various livestock species [7,13-17]. Ruminant production in particular holds significant relevance in addressing two fundamental global challenges: 1) enhancing the food security and nutrition for an expanding global population and 2) addressing the imperative of climate change mitigation [18,19]. However, conventional breeding strategies fall short of meeting expectations, especially for those traits that are difficult and costly to measure directly including traits that are expressed later in life such as disease resistance, immunity, and longevity [5,20]. Nonetheless, the economic benefits of prioritizing disease resistance and robustness through genome-based selection are suggested to surpass the potential drawbacks of slower genetic progress in other traits in livestock [21]. Strong relationships between serum biochemical parameters and other economically important traits in livestock would allow those parameters to be used as indicators of indirect selection on many traits, which is expected to mitigate the limitations of a conventional breeding scheme.
Due to the rapid emergence of high-throughput sequencing and genotyping technologies, GWAS has become a widely used statistical approach to discover QTL related to complex traits in various species including human, pigs, cattle, goat, and sheep [4,7,22-25]. Genome-based selection methods are suggested to speed up the genetic progress in selection schemes by reducing generation interval and increasing accuracy and intensity of selection in livestock production systems [26-30]. Sheep play a significant role in ensuring food security and sustainable production within the livestock species, thanks to their resilient adaptability and robust characteristics [19]. Furthermore, various studies suggest sheep as a more suitable model than rodents for the investigation and developing treatment for several human clinical conditions [31,32]. Therefore, dissection of the genetic basis underlying serum biochemical traits observed in sheep is a potential approach to design a comprehensive marker-assisted selection program to prioritize sustainability, enhance resilience, and support animal model development. To date, various genomic loci were associated with serum biochemical parameters in human as well as in livestock such as pigs, cattle and ducks [4,5,7,10,33,34]. However, only one study has been identified that specifically investigates the genomic heritabilities and QTL associated exclusively with serum protein levels in sheep [12].
Akkaraman sheep is an adaptive fat-tailed breed representing an extensive share of Turkey’s sheep population and spread through diverse terrain, from harsh, semi-arid regions to the mild climates with comparatively moderate productivity characteristics [24]. Recently, the genome of the breed has also been characterized against various world-wide sheep breeds to understand genomic relationships [35]. The large spread of the populations, close genomic relationships with various sheep breeds and its hardy and robust nature indicate potential of the breed’s physiology for sustainable production under increased temperatures and extreme environmental conditions due to global warming. Therefore, the aim of the present study was to identify the genetic architecture and genomic loci underlying measurements of certain serum biochemical indicators in Akkaraman sheep including alanine transaminase, aspartate transferase, lactate dehydrogenase, cholesterol, glucose, phosphorus, calcium, creatinine, urea concentrations and total protein levels. Our findings are expected to profoundly contribute insights into the genomic basis of complex serum biochemical traits that are of clinical and physiological importance.
2. Materials and Methods
Authors have followed the ARRIVE guidelines and EU regulations on animal research throughout the research process with animals of the study [36]. The approval of the Local Ethics Committee of the Experimental Animals of the Ministry of Agriculture and Forestry in Turkey, with a file number of 20 November 2020/183 was taken for the studied population.
2.1. Animal Population and Blood Serum Indicators
The experimental population consisted of 422 Akkaraman lambs (252 female and 170 males) of the prior study population described in [24]. Briefly, animals are sourced from three commercial farms located at the districts of Ankara, Turkey (39°41' N; 33°01' E). The region is characterized by its harsh and cold winters, dry and parching heat during summers as well as meagre, poor-quality grassland. A phenotypic selection was applied across generations where growth rate was considered for mating designs. Animals were registered to the National Small Ruminant Breeding Program. They were born between January-February 2021 and weaned between April-May 2021. Once weaned 101 of those animals were maintained in feedlot until the six months of age, while the remaining 321 were based on pasture grazing.
While collecting blood samples for the genotyping stage to EDTA-coated vacutainers at the six months of age, a separate set of samples were collected to a yellow biochemical analysis tube with gel and clot activator, reaching a total of 8-10 mL of blood sampled per animal. Yellow biochemical analysis tubes were immediately centrifuged at 4100 rpm for 5-6 minutes and the serum was separated from the clot and stored in -80°C freezer until use. Serum samples were later sent to a private biochemistry lab for the measurements of alanine transaminase (ALT), aspartate transferase (AST), lactate dehydrogenase (LDH), cholesterol (CHO), glucose (GLU), inorganic phosphorus (IP), calcium (CA), creatinine (CRE), urea (UREA) concentrations and total protein (TPRO) levels. The serum biochemical indicators were assessed with the chemical analyzer, Architect C8000, series AS1242 (Abbott Diagnostics, USA).
The fixed environmental factors tested to be accounted for were sex (i.e., male and female), birth type (i.e., singlets and twins), herd (i.e., three herds), feeding type (i.e., feedlot, pasture), and the age of the lamb in days (covariate). The descriptive statistics, data cleaning, and model fitting were exercised via the R statistical environment [37]. Phenotypic distributions of each trait were visually inspected and outliers with observations deviating three standard deviations ± mean for each trait were excluded from further analyses. Furthermore, the heteroscedasticity of variances was tested with the Breusch–Pagan test [38]. Additionally, since most of the serum biochemical parameters showed skewed distributions, Box-Cox transformation was applied to the traits of interest preceding model fitting, genetic parameter estimates and association analysis [39]. The descriptive statistics of the phenotypic observations after the outliers removed are provided in Table S1. Phenotypic correlations among the traits were obtained as pairwise Pearson’s correlation coefficients and they were given in Table 1.
2.2. Genotyping and Quality Control
DNA of the studied animals was extracted from blood samples using a QIACube HT instrument and Blood/Tissue DNA extraction kit following manufacturer’s protocol (Qiagen, Hilden, Germany). After obtaining high quality DNA for each sample, genotyping was carried out with Axiom™ Ovine 50K SNP Genotyping Array on the GeneTitan™ Multi-Channel Instrument following the manufacturer’s guide (Axiom™ 2.0 Assay 96-Array Format Manual Workflow, ThermoFisher Scientific, Waltham, MA, USA). A quality control (QC) followed genotyping, where SNPs that have minor allele frequency and call rate below 0.05 and 0.95 respectively, deviate from HWE (0.05/SNP numbers) and mapped to sex chromosomes were excluded from further analysis. Additionally, animals with too high heterozygosity (FDR<1%), call rate below 0.90 and identity by state (IBS) above 0.95 were set to be omitted while no animals were lost at this stage. 40,868 SNPs passed the QC criteria. All QC process was undertaken with ‘GenABEL’ R package [40].
2.3. Estimation of Genetic Parameters
Univariate and bivariate analyses of linear animal mixed model were implemented respectively to obtain genomic heritability estimates and pairwise genetic correlations among the serum biochemical traits, which are presented in Table 2. The model description and variance-covariance structure of the estimations, which are carried out using ‘sommer’ R package is detailed below [41]:
y is the vector of observations; is the vector of significant fixed effects to be accounted for in the model (i.e., significant environmental factors after model fitting); and the random effects of additive genomic breeding values and residual errors that are assumed to be drawn from a MVN (0, ) and MVN (0, ) respectively; and Z here are the matrices mapping fixed effects and the breeding values to the observations of the traits focused. and presented here are the additive genetic variance and environmental variances for each trait of interest while appended ‘i’ and ‘j’ are the specific traits recorded for each animal that handled for bivariate analyses. Finally, I is an identity matrix and G is the genomic relationship matrix (GRM) obtained by the ‘Model 1’ described by [42]. Fixed environmental effects were not included in bivariate analysis to avoid convergence problems. The (co)variance components of the models for univariate and bivariate analyses were estimated with Newton-Raphson optimization approach to the direct inversion (DI) based restricted maximum likelihood (REML) using the GRM provided [43,44]. Standard errors of genetic correlations were estimated with the delta method by a second order Taylor series expansion [45]. Table 2 provides the estimated heritabilities (on diagonal), genetic correlations (below diagonal) and phenotypic correlations (above diagonal).
2.4. Genome-Wide Association Studies (GWAS)
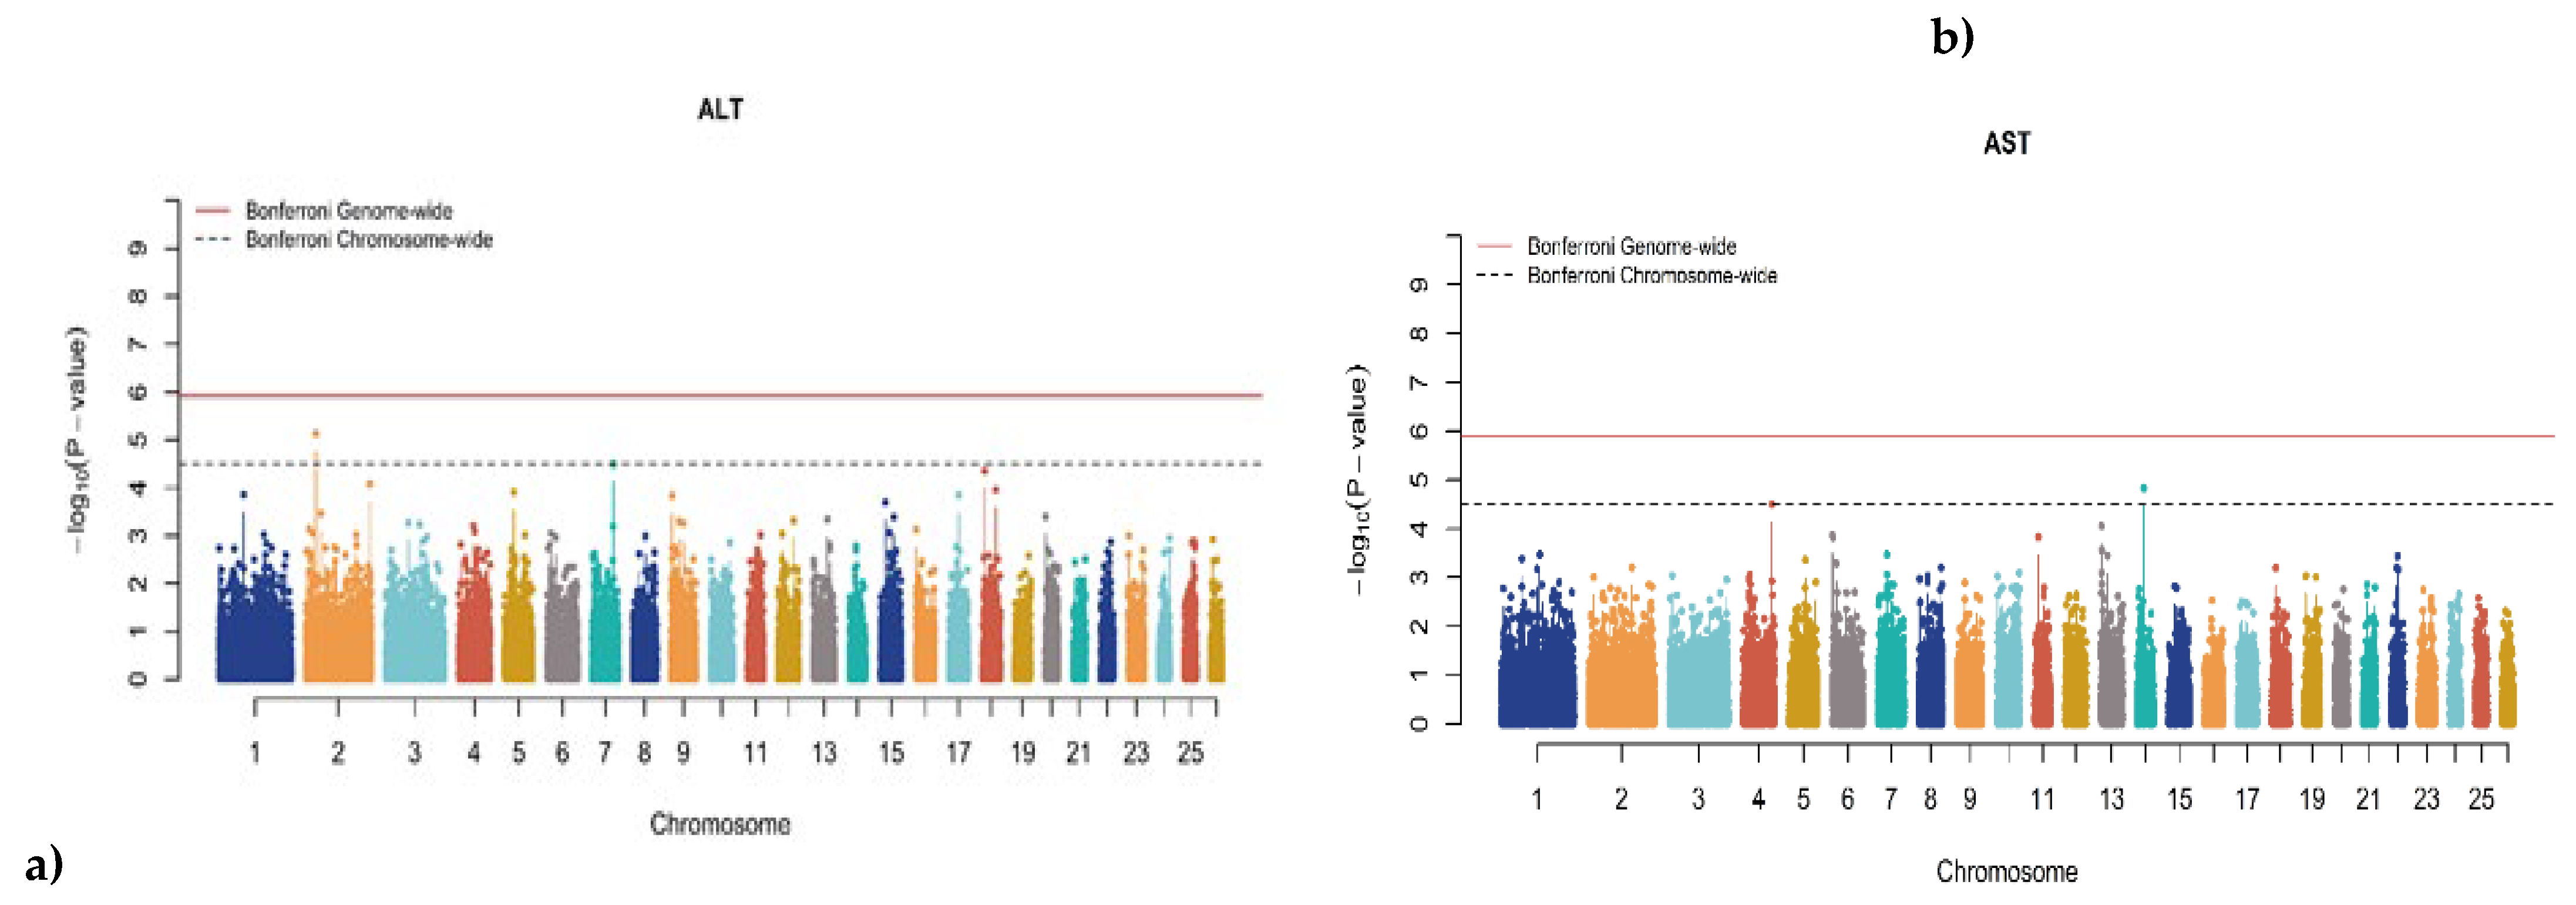
Following the genetic parameter estimation, univariate genome-wide association studies were implemented for each trait by using the linear mixed model and GRM described above to avoid bias and minimize false positive rates due to population stratification and cryptic relatedness [46,47]. The same significant environmental factors were used, and the SNPs were fitted as fixed factors consecutively one at a time, each assuming a trend for the copy number of the minor allele (i.e., ‘0’ for homozygous major allele, ‘1’ for heterozygotes and ‘2’ for homozygous minor allele), for holding additivity. Details of the mixed model-based association test and its previous applications can be found in [24,47]. Concisely, it is an animal mixed model approach to family-based association tests that accommodates a GRM weighted with allele frequencies, to avoid inflation of the test statistics because of possible population stratification and relatedness as originally proposed by [47]. Following the association tests, the inflation factor (λ) and the Quantile-Quantile plots of the p-values were obtained. The ‘genomic control’ correction was utilized to adjust for any possible inflation of the test statistics by setting λ to 1 [48]. The p-values of the SNPs were illustrated as ‘−log10 (p-value)’ on Manhattan plots for each trait, considering the corresponding chromosome, while two significance thresholds were imposed to detect genome-wide significant (i.e., solid line) and genome-wide suggestive significance (i.e., dashed line). To prevent false associations due to multiple testing, Bonferroni correction was applied to the significance thresholds. This correction involved dividing the initial significance level of 0.05 by the total number of SNPs passing quality control (40,868 SNPs) for genome-wide significance, while this value was multiplied with the number of chromosomes to obtain the representative chromosome-wide significance. Thus, the genome-wide significance threshold was 1.223×10⁻⁶ and the chromosome-wide was 3.181×10⁻⁵, which are 5.91 and 4.50 respectively on the −log10 (p-value) scale on the Manhattan plots. All the steps of genome-wide association analysis for each trait were carried out using the ‘GenABEL’ R package [40].
2.5. Functional Annotation Analysis
Genomic positions and nearby genes related to associated SNPs were retrieved from the Oar_v4.0 genome assembly on NCBI Genome Data Viewer [49]. Genes that directly contained significant SNPs were suggested as candidates. However, when the SNP was not within a described gene, the area of the chromosome covering nearly ± 500 Kbp from the identified SNP was scanned for the nearest candidate gene with a reasonable explanation. Identified genes were functionally enriched to recover biological information and KEGG (Kyoto Encyclopedia of Genes and Genomes) pathways involved by using The Database for Annotation, Visualization, and Integrated Discovery (DAVID) Bioinformatics Resources 2021 [50,51]. Where the sheep genome suffers from the lack of annotation, the orthology among species was exploited to annotate relevant genes from other species such as cattle, mice, and humans. The biological processes of the identified genes were given with their Gene Ontology (GO) terms and can be further detailed on QuickGO by EMBL’s European Bioinformatics Institute [52]. Finally, the animal QTL Database was scanned to identify whether detected SNPs in this study were previously associated with any serum biochemical traits [53].
3. Results
3.1. Phenotypic Correlation and Genetic Parameter Analyses between Serum Biochemical Indicators
Ten serum biochemical parameters were detected in this study, including ALT, AST, CHO, LDH, CA, IP, CRE, GLU, TPRO and UREA. The descriptive statistics for the serum biochemical indicators are listed in Supplementary Table S1. Table 1 shows the genetic and phenotypic correlations between serum biochemical indicators to provide context for the use of blood serum components in sheep breeding. A wide range of Pearson correlation coefficients were observed, ranging from −0.04 to 0.91, among serum biochemical indicators. Results showed that ALT, AST, CHO, and CA were strongly positively correlated, as were AST, LDH, TPRO, CRE, respectively. In contrast, traits such as IP and GLU were negatively correlated with UREA (Table 1).

Table 1.
Heritability, genetic and phenotypic correlations of serum biochemical indicators in Akkaraman sheep.
Table 1.
Heritability, genetic and phenotypic correlations of serum biochemical indicators in Akkaraman sheep.
| Traits | ALT | AST | CHO | LDH | CA | IP | CRE | GLU | TPRO | UREA |
|---|---|---|---|---|---|---|---|---|---|---|
| ALT | 0.21 ± 0.11 | 0.48 ± 0.04 | 0.18 ± 0.04 | 0.49 ± 0.04 | -0.01 ± 0.05 | 0.22 ± 0.04 | -0.01 ± 0.05 | 0.02 ± 0.05 | 0.35 ± 0.04 | 0.09 ± 0.05 |
| AST | 0.91 ± 0.08 | 0.14 ± 0.10 | 0.40 ± 0.04 | 0.53 ± 0.04 | 0.28 ± 0.04 | 0.18 ± 0.04 | 0.30 ± 0.04 | 0.14 ± 0.05 | 0.47 ± 0.04 | 0.27 ± 0.04 |
| CHO | 0.48 ± 0.16 | 0.77 ± 0.12 | 0.43 ± 0.14 | 0.35 ± 0.04 | 0.19 ± 0.04 | 0.26 ± 0.04 | 0.20 ± 0.04 | 0.19 ± 0.04 | 0.54 ± 0.04 | 0.32 ± 0.04 |
| LDH | 0.82 ± 0.08 | 0.87 ± 0.07 | 0.70 ± 0.13 | 0.36 ± 0.14 | 0.14 ± 0.05 | 0.32 ± 0.04 | 0.14 ± 0.04 | 0.20 ± 0.04 | 0.52 ± 0.04 | 0.07 ± 0.06 |
| CA | -0.03 ± 0.20 | 0.64 ± 0.12 | 0.39 ± 0.11 | 0.36 ± 0.14 | 0.27 ± 0.13 | 0.11 ± 0.05 | 0.99 ± 0.01 | 0.24 ± 0.04 | 0.35 ± 0.04 | 0.28 ± 0.04 |
| IP | 0.84 ± 0.23 | 0.88 ± 0.33 | 0.53 ± 0.14 | 0.80 ± 0.15 | 0.37 ± 0.17 | 0.29 ± 0.13 | 0.10 ± 0.05 | 0.19 ± 0.04 | 0.36 ± 0.04 | -0.10 ± 0.05 |
| CRE | -0.04 ± 0.22 | 0.66 ± 0.12 | 0.42 ± 0.11 | 0.28 ± 0.14 | 0.11 ± 0.06 | 0.35 ± 0.19 | 0.20 ± 0.11 | 0.23 ± 0.04 | 0.34 ± 0.04 | 0.29 ± 0.04 |
| GLU | 0.13 ± 0.23 | 0.77 ± 0.34 | 0.54 ± 0.19 | 0.78 ± 0.25 | 0.61 ± 0.14 | 0.76 ± 0.24 | 0.62 ± 0.15 | 0.15 ± 0.10 | 0.23 ± 0.04 | -0.11 ± 0.05 |
| TPRO | 0.71 ± 0.12 | 0.81 ± 0.09 | 0.81 ± 0.07 | 0.98 ± 0.08 | 0.64 ± 0.09 | 0.80 ± 0.13 | 0.64 ± 0.10 | 0.59 ± 0.17 | 0.55 ± 0.14 | 0.21 ± 0.04 |
| UREA | 0.27 ± 0.32 | 0.73 ± 0.17 | 0.74 ± 0.14 | 0.29 ± 0.34 | 0.76 ± 0.16 | -0.52 ± 0.38 | 0.78 ± 0.15 | -0.63 ± 0.46 | 0.59 ± 0.18 | 0.18 ± 0.11 |
Diagonal values represent the genomic heritability of the overlapping trait, where phenotypic correlations (± standard errors) were given above the diagonal and genetic correlations (± standard errors) below the diagonal.
Narrow-sense genomic heritability estimates were presented on the diagonals in Table 1. Overall, low to moderate heritability estimates were found, with a range 0.14–0.55 for serum biochemical indicators (Table 1). The trait demonstrating highest heritability was TPRO (h2 = 0.55), while the serum concentration of AST had the lowest heritability (h2 =0.14). Heritabilities for the traits TPRO (0.55), CHO (0.43) and LDH (0.36) can be classified as moderate while ALT (0.21), AST (0.14), CA (0.27), IP (0.29), CRE (0.20), GLU (0.15) and UREA (0.18) as low estimates. Genetic correlations were estimated using the multivariate mixed linear models and they are shown in the lower diagonals in Table 1. The trait TPRO showed high genetic correlations with LDH, CHO, and AST (r = 0.98, 0.81 and 0.81, respectively). The serum concentration of UREA was found to have negative genetic correlations with the level of GLU, and IP, r = -0.63 and -0.52, respectively (Table 1).
3.2. Genome-Wide Association Studies (GWAS)
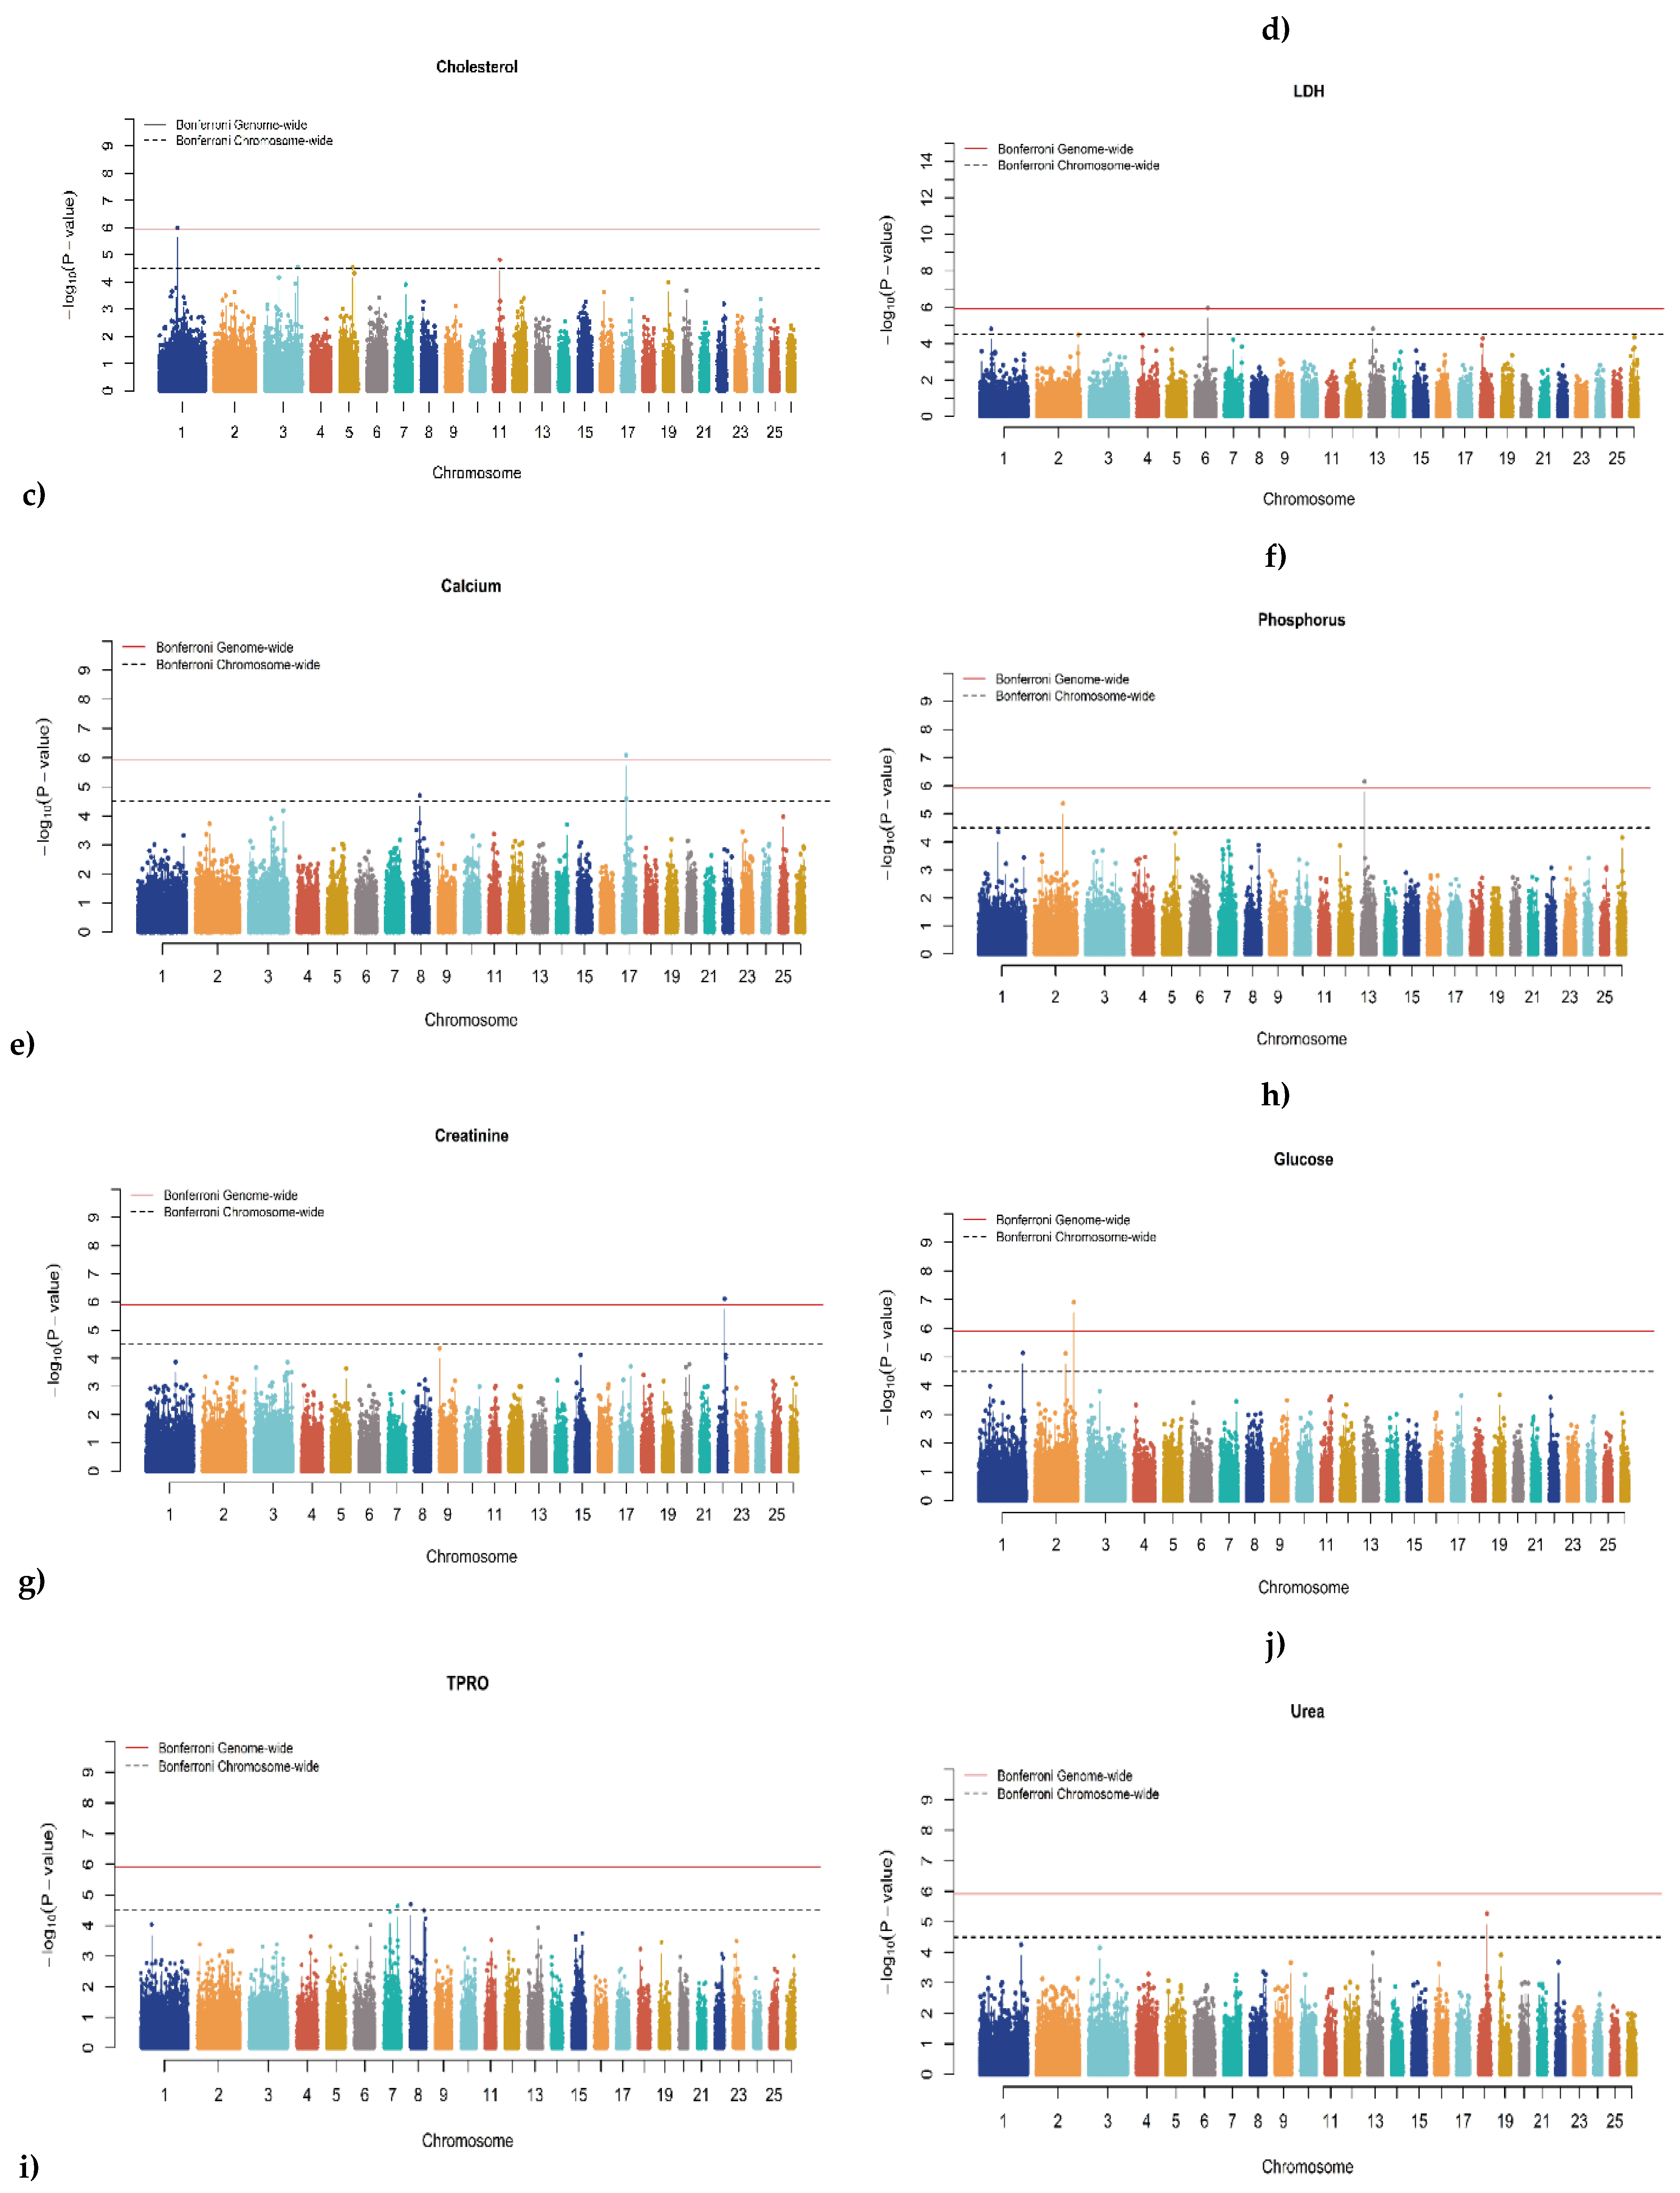
In the current study, 10 serum biochemical indicators of Akkaraman lambs, were selected as phenotypes for GWAS analysis. The univariate mixed model analysis was used to carry out genome-wide association studies for serum biochemical indicators (see Supplementary Table S1). This involved iteratively fitting 40,439 SNPs one at a time and using a genomic relationship matrix. The corrected p-values of the SNPs were visualized with Manhattan plots present in Figure 1, where the values were converted to −log10 (p-value). Genome-wide significant signals in Manhattan plots were only observed for traits encompassing CHO, CA, CRE, GLU, LDH, and IP (Figure 1). The Q-Q plots (Supplementary Figure S1) showed that the model we used was reasonable, most of the observed p-values were consistent with the expected values, and significant SNPs were found, indicating that the above association analysis results for serum parameter traits are reliable. All traits were forced to have a lambda (λ) of approximately 1 by correcting the p-values with the genomic control.
The significant putative QTL with the candidate genes and the top associated SNPs within each region is shown in Table 2 and Table 3. A total of 23 significant loci were identified, of which 6 were genome-wide (GW) significant associated with CHO, CA, CRE, GLU, LDH, and IP (Table 2) and 17 were chromosome-wide significant (CW) associated with CHO, ALT, AST, CA, GLU, LDH, IP, TPRO, and UREA (Table 3). CHO has 4 putative QTLs distributed in 4 ovine chromosomes (OAR). For CHO, the top significant locus (rs415766081 with p-value = 1.022×10-06) was in the intron region of Spectrin alpha, erythrocytic 1 (SPTA1) gene. GW significant SNP for CA was identified on OAR17 (rs427096440 with p-value = 8.033×10-07) in the vicinity of Microsomal glutathione S-transferase 2 (MGST2) gene. The GW significant SNP for CRE (rs423178582 with p-value = 7.716×10-07) was identified on OAR22 which is 42 Kb apart from CDK2 associated cullin domain 1 (CACUL1) gene. The SNP rs428784360 (p-value = 1.207×10-07) GW significantly associated with GLU is located on the OAR2 (Table 2). This marker is located within the intron of the ENSOARG00020040484.1 gene. Another SNP (rs410665381 with a p-value = 1.216×10-06) is found to be GW associated with LDH. The locus was observed to be located at 267 Kb upstream of Insulin-like growth factor binding protein 7 (IGFBP7) on OAR6. Finally, another GW significant SNP (rs404995480 with p-value= 6.902×10-07) was associated with IP within an intron of the gene Par-3 family cell polarity regulator (PARD3) on OAR13. Additional information on loci with GWS association are shown in Table 3.
Table 2.
Genome-wide significant SNP markers for serum biochemical indicators.
| Trait | SNP | Chr | Oar_v4.0 Position (bp) |
P-Value | MAF | Effect Size | Candidate Gene | Distance |
|---|---|---|---|---|---|---|---|---|
| CHO | rs415766081 | 1 | 107,828,780 | 1.022×10-06 | 0.110 | 0.084 | Spectrin alpha, erythrocytic 1 (SPTA1) | Intron variant |
| CA | rs427096440 | 17 | 17,753,256 | 8.033×10-07 | 0.414 | 0.004 | Microsomal glutathione S-transferase 2 (MGST2) | ~31 Kb upstream |
| CRE | rs423178582 | 22 | 37,960,974 | 7.716×10-07 | 0.157 | 0.068 | CDK2 associated cullin domain 1 (CACUL1) | ~42 Kb upstream |
| GLU | rs428784360 | 2 | 227,357,948 | 1.207×10-07 | 0.160 | 0.092 | ENSOARG00020040484.1 | Intron variant |
| LDH | rs410665381 | 6 | 72,632,996 | 1.216×10-06 | 0.129 | 0.117 | Insulin-like growth factor binding protein 7 (IGFBP7) | ~267 Kb upstream |
| IP | rs404995480 | 13 | 17,678,848 | 6.902×10-07 | 0.388 | 0.063 | Par-3 family cell polarity regulator (PARD3) | Intron variant |
Chr= Chromosome; MAF= Minor allele frequency; CHO= Cholesterol; CA= Calcium; CRE= Creatinine; GLU= Glucose; LDH= Lactate dehidrogenase; IP= Phosphorus.
Table 3.
Chromosome-wide significant SNP markers for serum biochemical indicators.
| Trait | SNP | Chr | Oar_v4.0 Position (bp) |
P-Value | MAF | Effect Size | Candidate Gene | Distance |
|---|---|---|---|---|---|---|---|---|
| CHO | rs415259159 | 11 | 36,648,365 | 1.536×10-05 | 0.417 | 0.047 | Prohibitin 1 (PHB1) | ~35 Kb upstream |
| CHO | rs408900631 | 3 | 198,343,644 | 2.820×10-05 | 0.432 | 0.047 | Solute Carrier Family 15 Member 5 (SLC15A5) | ~55 Kb downstream |
| CHO | rs403535835 | 5 | 75,927,368 | 2.923×10-05 | 0.101 | 0.073 | LOC101117162 | ~19 Kb upstream |
| ALT | rs413251030 | 2 | 38,421,272 | 7.175×10-06 | 0.194 | 0.380 | Tripartite Motif Containing 35 (TRIM35) | ~71 Kb downstream |
| ALT | rs421887664 | 7 | 80,842,728 | 3.158×10-05 | 0.158 | 0.439 | Regulator Of G-Protein Signaling 6 (RGS6) | Intron variant |
| AST | rs405842437 | 14 | 24,175,813 | 1.453×10-05 | 0.449 | 0.013 | Nucleoporin 93 (NUP93) | Intron variant |
| AST | rs423986212 | 4 | 109,758,783 | 3.111×10-05 | 0.269 | 0.014 | Contactin Associated Protein 2 (CNTNAP2) | Intron variant |
| CA | rs421266853 | 8 | 39,031,937 | 1.967×10-05 | 0.417 | 0.003 | LOC105611309 | ~56 Kb downstream |
| CA | rs408365736 | 17 | 19,135,137 | 2.576×10-05 | 0.077 | 0.006 | Solute Carrier Family 7 Member 11 (SLC7A11) | Intron variant |
| GLU | rs412782784 | 1 | 257,987,356 | 7.143×10-06 | 0.067 | 0.118 | Beta-1,3-Galactosyltransferase 5 (B3GALT5) | ~288 Kb downstream |
| GLU | rs410943504 | 2 | 178,724,382 | 7.415×10-06 | 0.457 | 0.059 | Dipeptidyl Peptidase Like 10 (DPP10) | Intron variant |
| LDH | rs402703943 | 1 | 63,683,463 | 1.665×10-05 | 0.218 | 0.090 | Heparan Sulfate 2-O-Sulfotransferase 1 (HST2ST1) | ~185 Kb downstream |
| LDH | rs410138359 | 13 | 18,806,069 | 1.678×10-05 | 0.169 | 0.087 | Neuropilin 1 (NRP1) | ~44 Kb downstream |
| IP | rs420848991 | 2 | 168,420,121 | 4.201×10-06 | 0.191 | 0.077 | LDL Receptor Related Protein 1B (LRP1B) | Intron variant |
| TPRO | rs423075621 | 8 | 963,780 | 2.017×10-05 | 0.488 | 0.045 | LOC101118029 | ~74 Kb upstream |
| TPRO | rs401111582 | 7 | 79,289,788 | 2.319×10-05 | 0.386 | 0.044 | Mitogen-Activated Protein 3 Kinase 9 (MAP3K9) | Intron variant |
| UREA | rs403791299 | 18 | 48,405,490 | 5.277×10-06 | 0.432 | 1.971 | LOC101103187 | ~127 Kb upstream |
Chr= Chromosome; MAF= Minor allele frequency; CHO= Cholesterol; ALT= Alanine aminotransferase; AST= Aspartate aminotransferase; CA= Calcium; CRE: Creatinine; GLU: Glucose; LDH: Lactate dehidrogenase; IP: Phosphorus; TPRO= Total protein; UREA= Urea.
4. Discussion
Blood measurements known as serum biochemical indicators are widely used biomarkers for monitoring the physiological status of human and animals. These signals are utilized across the entire course of the disease, spanning from diagnosis to prognosis and the recovery, primarily in humans and increasingly in animals that may have exposed to different environmental and genetic triggers of disease susceptibility and adverse conditions. Therefore, these traits are frequently thought of as accurate representations of an animal's health and metabolism. Despite the utmost importance of the serum indicators such as lipids, proteins, enzyme activities, minerals and metabolites to the livestock production systems, exceptionally rare studies have investigated the underlying genetic architecture and mechanisms behind those complex traits [5,7,33,34]. In this investigation, we measured 10 serum biochemical indicators. Certain serum biochemical indicators demonstrated strong phenotypic and genetic correlations among each other. To the best of our knowledge and according to animal QTL database, no published study has systematically demonstrated the genetic parameters among some or all the 10 serum biochemical indicators and genomic loci using a GWAS of SNPs in lambs [53]. Additionally, only one study was observed to have focused on the genetic basis of protein levels in sheep [12]. The aim of the current study was to identify the underlying genetic architecture for blood serum indicators in lambs. ALT and AST averages were in the range with the previous reports for Akkaraman lambs and other breeds such as Ba sheep, Karakul and Tzurcana ewes, Balami ewes, Lori-Bakhtiari and Mehraban sheep and Santa Inês ewes. On the other hand, similarly, low heritability estimate was detected for UREA in Santa Inês sheep [54,55].
Genetic variance in serum parameters plays a crucial role in understanding animals' ability to combat infections and stress. This insight can aid in devising better strategies to enhance disease resistance and resilience [7]. The identified low to moderate genomic heritability estimates for blood serum biochemical traits indicate the potential of genomic selection to result in a gradual improvement in breeding programs in sheep. In the present study, heritabilities were estimated for instance TPRO (0.55±0.14), UREA (0.18±0.11), LDH (0.36±0.14) and ALT (0.14±0.10) (Table 1), which indicates considerable genetic effects on these protein fractions and probably their potential use as biomarkers for genetic selection. This result differs from the reported studies in Lori-Bakhtiari sheep, where genomic heritability was found as low (0.00 ± 0.29) due to the limited number of animals, causing high standard errors of the heritability estimates [12]. Similarly, low heritability estimate was detected for UREA in Santa Inês sheep and in Holstein-Friesian cows [55,56]. Our study suggests a genomic heritability estimate for serum CA to be 0.27±0.13 in Akkaraman lambs, which is higher than that of described for cattle [56]. The current study is the first research focusing on the genetic parameters of a wide range of serum biochemical indicators for Akkaraman sheep while one of very first among global sheep populations. However, further research is still required to determine the genetic background of blood serum indicators precisely, as also indicated by the slightly high standard errors of the heritability estimates, which were caused by the relatively low number of animals studied.
Multiple candidate genes were identified in the present study (Table 2; Table 3). One of the most striking results of our study is the enrichment of biological processes for the candidate genes that aid disease response and immune system regulation. Many candidate genes suggested by our study are predicted to be part of biological processes such as physiological response to stimulus (GO:0050896), regulation of metabolic process (GO:0019222), immune system process (GO:0002376), regulation of immune system process (GO: 0002682), immune response (GO:0006955), regulation of response to stress (GO:0080134), cell communication (GO:0007154) and regulation of signaling (GO:0023051) in various organisms. Additionally, some of those candidate genes were predicted to have molecular functions such as catalytic and transferase activities as well as ion, small molecule, and enzyme binding.
A genome-wide associated SNP (rs415766081; p = 1.022×10-06; Table 2) was located in the intron of Spectrin alpha, erythrocytic 1 (SPTA1) gene on OAR1 for CHO. Cholesterol is a vital molecule for cellular processes such as membrane fluidity and permeability to gene transcription, growth and development and serving as backbone of steroid hormones and vitamin D analogs [57]. Spectrins are big, flexible proteins made up of head-to-head connections between α-β dimers, which combine to form the standard heterotetrameric spectrin structure. Functional annotation of SPTA1 shows that it is involved in fundamental biological processes such as actin cytoskeleton organization (GO:0030036), immune system process (GO:0002376), lymphocyte homeostasis (GO:0002260) and positive regulation of T-cell proliferation (GO:0042102) with molecular functions such as actin filament binding (GO:0051015) and calcium-ion binding (GO:0005509) in various mammals. KEGG enrichment also shows that it is involved in apoptosis. Together with the cytoskeletal network, the spectrin-based membrane skeleton primarily preserves the mechanical characteristics and integrity of the cell membrane [58]. Both actin filament organization and calcium have long been recognized for their critical role in serum cholesterol levels [59,60]. Spectrins are highly conserved across several species and were once thought to be only present in the human erythrocytic membrane [61]. Orthologues of this gene has been associated with increased B cell number, IgG levels and T cell number in mice [62].
Another genome-wide associated SNP on OAR17 was found 31 Kb apart of the microsomal glutathione S-transferase 2 (MGST2) gene for CA (Table 1). The MGST2 is a member of the superfamily designated MAPEG (membrane-associated proteins in eicosanoid and glutathione metabolism), and has a role in the interactions between proteins that detoxify foreign and endogenous highly reactive lipophilic substances and proteins involved in the endogenous metabolism of reactive lipophilic intermediates (leukotrienes) [63]. Functional enrichment showed that the MGST2 is involved in biological processes such as Eicosanoid metabolic process (GO:0006690), specifically leukotriene metabolic process (GO:0006691) and glutathione biosynthetic process (GO:0006750) as well as response to stress (GO:0006950), defense response (GO:0006952) and inflammatory response (GO:0006954) in various mammals including sheep. MGST2 has been annotated by KEGG to be involved in the glutathione metabolism, drug metabolism, metabolic pathways, drug resistance, chemical carcinogenesis by receptor activation as well as fluid shear stress and atherosclerosis. Within the functionally varied MAPEG family, MGST2 is a mainly glutathione-dependent peroxidase and cytoprotective glutathione S-transferase and has high homology with Leukotriene C4 Synthase (LTC4S) [63]. Eicosanoid metabolism, in terms of functional coupling of calcium-dependent phospholipase A2 (cPLA2) plays role in role in the regulation of intracellular Ca2+ concentration in different cells [64]. It is worth noting that an association between LTC4S promoter polymorphism and coronary artery calcium thickness was identified in women [65].
The genome-wide associated SNP for serum creatinine levels is located at 42 Kb upstream of CACUL1 (CDK2 associated cullin domain 1) on OAR22. CACUL1 is predicted to engage in a wide range of organic substance metabolic processes (GO: 0071704) such as proteolysis (GO: 0006508), positive regulations of cell population proliferation (GO:0008284) and protein kinase activity (GO: 0045860) with its ubiquitin protein ligase and protein kinase binding activities. Serum creatinine, as a waste product of muscle metabolism, is one of the primary indicators of renal dysfunction or impaired filtration [66]. Various CDKs (cyclin-dependent kinases) has previously been associated with kidney functions including cell proliferation and filtration in human [67,68]. Additionally, a study in mice showed that increased expression of CDK2 protects podocytes (i.e., a layer of cells around glomerulus where filtration of blood takes place) from apoptosis while reduced expression of CDK2 leads to increased susceptibility to diabetic nephropathy [69].
The genome-wide associated SNP for serum glucose (rs428784360) was intronic to ENSOARG00020040484.1 (Table 2). This long noncoding RNA has not had much annotated function as yet. The only other gene nearby was LOC121818761, which has RNA evidence but little assigned function as yet. To our knowledge, this study is the first report linking these genes to blood glucose. Further work will be required to investigate their connection to blood glucose and diabetes.
Insulin-like growth factor binding protein 7 (IGFBP7) on OAR6, as a regulator of insulin-like growth factors (IGFs), was suggested by our study as a genome-wide candidate for serum Lactate dehydrogenase (LDH) levels in sheep. LDH is an enzyme found throughout cells in diverse living organisms, participating in carbohydrate metabolism by facilitating the conversions of lactate and pyruvate using the NAD+/NADH coenzyme system. The IGFBP7 takes part in diverse biological processes such as the regulation of cell growth (GO:0001558), response to stimulus (GO:0048583), signaling (0023051) as well as the regulation of steroid metabolic process (GO:0019218) and response to corticosteroid (GO:0031969), glucocorticoid (GO:0051384), chemicals (GO:0042221) and steroid hormones (GO:0048545). Its protein shows molecular functions such as insulin-like growth factor binding and structural molecule activity. IGFBPs and IGFs has been consistently documented to play a pivotal role in immune response of animals and human [70-72]. Elevated plasma IGFBP7 levels was recently found to be correlated with chronic inflammation in human [73]. Simultaneously, IGFs are known to have a regulatory role in glucose uptake, glycogen and lactate metabolisms, especially in Warburg effect (i.e., increased rates of glucose uptake and preferential breakdown of glucose into lactate, even when mitochondria are operating normally), where LDH is also a key enzyme [74,75]. Therefore, IGFBP7 as a regulator of IGFs can be suggested to have an indirect regulatory role in serum LDH levels.
Finally, a putative QTN (rs404995480; p = 6.902×10-07; Table 2) was detected in the intron of Par-3 Family Cell Polarity Regulator (PARD3) gene on OAR13 for IP. PARD3 is known to have significant roles in cytoskeleton organization (GO:0007010), establishment of cell polarity (GO:0030010), organelle organization (GO:0006996) and establishment of the localization in cell (GO:0051649) with its molecular functions such as protein binding and phosphatidylinositol binding. It is annotated by KEGG to have roles in Rap1 and chemokine signaling pathways, endocytosis, Hippo signaling pathway as well as adherens and tight junctions. Inorganic phosphorus plays numerous metabolic roles as a reactant (glycolysis, oxidative phosphorylation, glycogen phosphorolysis, and mineralization) and product (nucleic acid synthesis, ATPases, GTPases, and phosphatases) and recognized as a signaling molecule as well [76]. Many studies have suggested that PARD3 is regulated by phosphorylation [77]. PARD3 is a PDZ-domain-containing scaffold protein that forms a trimetric complex with PAR6 and atypical protein kinase C (aPKC) to regulate the initial cell polarity cues. Cell polarity, the asymmetric distribution of proteins, organelles, and cytoskeleton, plays an important role in development, homeostasis, and disease, which might be crucial during many types of asymmetric cell division to set up functional asymmetries between daughter cells [78]. PARD3, as a member of PAR complex, is one of the cell polarity complexes that can regulate vesicle transport and control the localization of cytoplasmic proteins primarily by regulating the phosphorylation of phospholipids called phosphoinositides [79]. Phosphoinositides in which one of the isomers is phosphate, serve as docking sites for proteins at the cell membrane, and their state of phosphorylation determines which proteins can bind [80].
Taken together, our results suggest 6 genome-wide and 17 chromosome-wide SNPs and 19 candidate genes as well as 4 uncharacterized regions to be underlying 10 serum biochemical parameters. The relevant importance of suggested candidate genes to immune system, defense response, cytoskeleton organization and other biological processes are mostly characterized in various species. Simultaneously, our study revealed various genetic parameters and phenotypic correlations for those serum biochemical indicators in sheep. None of the associated SNPs had previously been linked to serum biochemical traits in sheep, mainly because there has been only one study implemented GWAS for only protein levels in sheep. Therefore, results of this study can be used to shed a light on the research of underlying molecular mechanisms behind serum biochemical traits in sheep, which are directly related to welfare and health status of animals and indirectly of high economic importance for sheep production systems. Additionally, since sheep can be observed as a model organism to study welfare and diseases in human, our results also confer significance medical research in human. In any case, further molecular and population-based validation studies are required to prove causality of the associated SNPs and suggested genes for their use in sheep genetic improvement programs, gene editing studies and targeted drug applications that aim better immune system, health, and welfare both in human and sheep.
5. Conclusions
In this work, we reported for the first time GWAS together with genetic parameter estimations for the level of serum biochemical indicators in sheep. Detection of QTL for serum biochemical parameters, due to their strong relationship with many disorders, have a unique potential for disease intervention and targeted drug applications. Our research offers genetic tools for additional investigations into causal linkages for particular cases; nonetheless, mechanistic and experimental investigations are necessary to identify the underlying cause chains behind these intricate associations. In total, 23 SNP loci were associated with serum biochemical indicators leading to 19 candidate genes as well as 4 uncharacterised regions to be suggested for underlying 10 serum biochemical parameters. These are SPTA1, MGST2, CACUL1, IGFBP7, PARD3, PHB1, SLC15A5, TRIM35, RGS6, NUP93, CNTNAP2, SLC7A11, B3GALT5, DPP10, HST2ST1, NRP1, LRP1B, MAP3K9, ENSOARG00020040484.1 as well as LOC101103187, LOC101117162, LOC105611309 and LOC101118029. The current findings provide a comprehensive inventory of the relationships between serum components as well as genetic variants for disease-relevant characteristics. This information may facilitate the identification of therapeutic targets and fluid biomarkers and establish a strong framework for comprehending the pathobiology of complex diseases while highlighting specific loci for targeted genome-editing or gene-knockout studies. However, more research is needed to identify the specific functional mutations in linkage disequilibrium with the markers in this study. In addition, the functional mutations will need to be validated and examined for potential correlated responses to selection, including production and reproduction traits as well as disease and parasite resistance in sheep.
Supplementary Materials
The following supporting information can be downloaded at the website of this paper posted on Preprints.org. Figure S1: title; Table S1: Descriptive statistics of serum biochemical parameters in Akkaraman sheep.
Author Contributions
Conceptualization, M.K., Y.A., S.N.W. and M.U.C.; methodology, M.K., Y.A., S.N.W. and M.U.C.; software, M.K.; validation, M.K., Y.A. and M.U.C.; formal analysis, M.K.; investigation, M.,K, Y.A., S.B. E.Y. and M.U.C.; resources, M.K., Y.A., S.B., E.Y. and M.U.C.; data curation, M.K. and M.U.C.; writing—original draft preparation, M.K. and M.U.C.; writing—review and editing, M.K., Y.A., S.B., E.Y., S.N.W. and M.U.C.; visualization, M.K.; supervision, M.U.C. and S.N.W; project administration, M.U.C. and M.K.; funding acquisition, M.K. and M.U.C. All authors have read and agreed to the published version of the manuscript.
Funding
Genotyping of this research was funded by the Scientific Research Projects Coordination Unit of Erciyes University (Project ID: FDK-2021-10811).
Institutional Review Board Statement
The animal study protocol was approved by a Local Ethics Committee of the of the Experimental Animals of the Ministry of Agriculture and Forestry in Turkiye, with a file number of 20 November 2020/183.
Data Availability Statement
All relevant data of the study is available from corresponding author upon reasonable request.
Acknowledgements
Genotyping of the animals was funded as part of a research project by the Scientific Research Projects Coordination Unit of Erciyes University (Project ID: FDK-2021-10811). Therefore, the authors thank the Scientific Research Projects Coordination Unit of Erciyes University for funding and support. The animal material for the study was provided by the National Community-based Small Ruminant Breeding Program. Therefore, we gratefully acknowledge the contribution of the General Directorate of Agricultural Research an Policies (Ministry of Agriculture and Forestry) of the Republic of Turkiye which provide funding and run the breeding program. The authors are also indebted to the Genome and Stem Cell Center (GENKOK) at Erciyes University for providing laboratory facilities. Finally, the authors of the study are also grateful to the Genetics Laboratory of the International Center for Livestock Research and Training (ICLRT), where the genotyping was carried out.
Conflicts of Interest
The authors of the study have no conflict of interest to declare.
References
- Bobbo, T.; Ruegg, P. L.; Fiore, E.; Gianesella, M.; Morgante, M.; Pasotto, D.; Cecchinato, A. Association between udder health status and blood serum proteins in dairy cows. J Dairy Sci 2017, 100, 9775-9780. [CrossRef]
- Psychogios, N.; Hau, D.D.; Peng, J.; Guo, A.C.; Mandal, R.; Bouatra, S.; Wishart, D.S. The human serum metabolome. PloS One 2011, 6, e16957. [CrossRef]
- Yu, Z.; Kastenmüller, G.; He, Y.; Belcredi, P.; Möller, G.; Prehn, C.; Wang-Sattler, R. Differences between human plasma and serum metabolite profiles. PloS One 2011, 6, e21230. [CrossRef]
- Meyer, T.E.; Verwoert, G.C.; Hwang, S.J.; Glazer, N.L.; Smith, A.V.; van Rooij, F.J.A.; Ehret, G.B.; Boerwinkle, E.; Felix, J.F.; Leak, T.S.; Harris, T.B.; Yang, Q.; Dehghan, A.; Aspelund, T.; Katz, R.; Homuth, G.; Kocher, T.; Rettig, R.; Ried, J.S.; Gieger, C.; Prucha, H.; Pfeufer, A.; Meitinger, T.; Coresh, J.; Hofman, A.; Sarnak, M.J.; Chen, Y.D.I.; Uitterlinden, A.G.; Chakravarti, A.; Psaty, B.M.; van Duijn, C.M.; Linda-Kao, W.H.; Witteman, J.C.M.; Gudnason, V.; Siscovick, D.S.; Fox, C.S.; Köttgen, A. Genome-wide association studies of serum magnesium, potassium, and sodium concentrations identify six loci influencing serum magnesium levels. PLoS Genet 2010, 6. [CrossRef]
- Song, H.; Li, W.; Li,Y.; Zhai, B.; Guo, Y.; Chen, Y.; Han, R.; Sun, G.; Jiang, R.; Li, Z.; Yan, F.; Li, G.; Liu, X.; Zhang, Y.; Tian, Y.; Kang, X. Genome-wide association study of 17 serum biochemical indicators in a chicken F2 resource population. BMC Genomics 2023, 24, 1–12. [CrossRef]
- Wallace, C.; Newhouse, S.J.; Braund, P.; Zhang, F.; Tobin, M.; Falchi, M.; Ahmadi, K.; Dobson, R.J.; Marçano, A.C.B.; Hajat, C.; Burton, P.; Deloukas, P.; Brown, M.; Connell, J.M.; Dominiczak, A.; Lathrop, G.M.; Webster, J.; Farrall, M.; Spector, T.; Samani, N.J.; Caulfield, M.J.; Munroe, P.B. Genome-wide Association Study Identifies Genes for Biomarkers of Cardiovascular Disease: Serum Urate and Dyslipidemia. AJHG 2008, 82, 139–149. [CrossRef]
- Bovo, S.; Mazzoni, G.; Bertolini, F.; Schiavo, G.; Galimberti, G.; Gallo, M.; Dall’Olio, S.; Fontanesi, L. Genome-wide association studies for 30 haematological and blood clinical-biochemical traits in Large White pigs reveal genomic regions affecting intermediate phenotypes. Sci Rep 2019, 9, 1–17. [CrossRef]
- Escribano, B.M.; Molina, A.; Valera, M.; Tovar, P.; Agüera, E.I.; Santisteban, R.; Vivo, R.; Agüera, S.; Rubio, M.D. Genetic analysis of haematological and plasma biochemical parameters in the Spanish purebred horse exercised on a treadmill. Animal 2013, 7, 1414–1422. [CrossRef]
- Whitfield, J.B. Genetics of Biochemical Phenotypes. Twin Res Hum Genet 2020, 23, 77–79. [CrossRef]
- Gieger, C.; Geistlinger, L.; Altmaier, E.; De Angelis, M.H.; Kronenberg, F.; Meitinger, T.; Mewes, H.W.; Wichmann, H.E.; Weinberger, K.M.; Adamski, J.; Illig, T.; Suhre, K. Genetics meets metabolomics: A genome-wide association study of metabolite profiles in human serum. PLoS Genet 2008, 4. [CrossRef]
- Mitchell, B.D.; Kammerer, C.M.; Blangero, J.; Mahaney, M.C.; Rainwater, D.L.; Dyke, B.; Hixson, J.E.; Henkel, R.D.; Sharp, R.M.; Comuzzie, A.G.; VandeBerg, J.L.; Stern, M.P.; MacCluer, J.W. Genetic and environmental contributions to cardiovascular risk factors in mexican americans. Circulation 1996, 94, 2159–2170. [CrossRef]
- Zamani, P.; Mohammadi, H.; Mirhoseini, S.Z. Genome-wide association study and genomic heritabilities for blood protein levels in Lori-Bakhtiari sheep. Sci Rep 2021, 11, 1–10. [CrossRef]
- Andjelić, B.; Djoković, R.; Cincović, M.; Bogosavljević-Bošković, S.; Petrović, M.; Mladenović, J.; Čukić, A. Relationships between milk and blood biochemical parameters and metabolic status in dairy cows during lactation. Metabolites 2022, 12. [CrossRef]
- Bovo, S.; Mazzoni, G.; Galimberti, G.; Calò, D.G.; Fanelli, F.; Mezzullo, M.; Schiavo, G.; Manisi, A.; Trevisi, P.; Bosi, P.; Dall’Olio, S.; Pagotto, U.; Fontanesi, L. Metabolomics evidences plasma and serum biomarkers differentiating two heavy pig breeds. Animal 2016, 10, 1741–1748. [CrossRef]
- Karisa, B.K.; Thomson, J.; Wang, Z.; Li, C.; Montanholi, Y.R.; Miller, S.P.; Moore, S.S.; Plastow, G.S. Plasma metabolites associated with residual feed intake and other productivity performance traits in beef cattle. Livest Sci 2014, 165, 200–211. [CrossRef]
- Li, J.; Akanno, E.C.; Valente, T.S.; Abo-Ismail, M.; Karisa, B.K.; Wang, Z.; Plastow, G.S. Genomic Heritability and Genome-Wide Association Studies of Plasma Metabolites in Crossbred Beef Cattle. Front Genet 2020, 11, 1–12. [CrossRef]
- Zhang, H.L.; Xu, Z.Q.; Yang, L.L.; Wang, Y.X.; Li, Y.M.; Dong, J.Q.; Zhang, X.Y.; Jiang, X.Y.; Jiang, X.F.; Li, H.; Zhang, D.X.; Zhang, H. Genetic parameters for the prediction of abdominal fat traits using blood biochemical indicators in broilers. Br Poult Sci 2018, 59, 28–33. [CrossRef]
- FAO. The state of the world’s animal genetic resources for food and agriculture. FAO, Rome, Italy, 2008.
- Scherf, B.D.; Pilling, D. The second report on the state of the world’s animal genetic resources for Food and Agriculture. FAO, Rome, Italy, 2015.
- Bishop, S.C.; Woolliams, J.A. Genomics and disease resistance studies in livestock. Livest Sci 2014, 166, 190–198. [CrossRef]
- Bishop, S.C.; Axford, R.F.E.; Nicholas, F.W.; Owen, J.B. Breeding for disease resistance in farm animals. CABI, UK, 2010.
- Arzik, Y.; Kizilaslan, M.; White, S. N.; Piel, L. M.; Cinar, M. U. Estimates of genomic heritability and genome-wide association studies for blood parameters in Akkaraman sheep. Sci Rep 2022, 12, 18477. [CrossRef]
- Chinchilla-Vargas, J.; Kramer, L.M.; Tucker, J.D.; Hubbell, D.S.; Powell, J.G.; Lester, T.D.; Backes, E.A.; Anschutz, K.; Decker, J.E.; Stalder, K.J.; Rothschild, M.F.; Koltes, J.E. Genetic basis of blood-based traits and their relationship with performance and environment in beef cattle at weaning. Front Genet 2020, 11, 1–13. [CrossRef]
- Kizilaslan, M.; Arzik, Y.; White, S.N.; Piel, L.M.W.; Cinar, M.U. Genetic Parameters and Genomic Regions Underlying Growth and Linear Type Traits in Akkaraman Sheep. Genes (Basel) 2022, 13, 1414. [CrossRef]
- Mucha, S.; Mrode, R.; Coffey, M.; Kizilaslan, M.; Desire, S.; Conington, J. Genome-wide association study of conformation and milk yield in mixed-breed dairy goats. J Dairy Sci 2018, 101, 2213–2225. [CrossRef]
- Dekkers, J.C.M. Prediction of response to marker-assisted and genomic selection using selection index theory. J Anim Breed Genet 2007, 124, 331–341. [CrossRef]
- Doormaal, B.V. Increased rates of genetic gain with genomics. Canadian Dairy Network, Canada, 2012; 1–3.
- Goddard, M.E.; Hayes, B.J. Mapping genes for complex traits in domestic animals and their use in breeding programmes. Nat Rev Genet 2009, 10, 381–391. [CrossRef]
- Meuwissen, T.; Hayes, B.; Goddard, M. Accelerating improvement of livestock with genomic selection. Annu Rev Anim Biosci 2013, 1, 221–237. [CrossRef]
- Rupp, R.; Mucha, S.; Larroque, H.; McEwan, J.; Conington, J. Genomic application in sheep and goat breeding. Anim Front 2016, 6, 39–44. [CrossRef]
- Banstola, A.; Reynolds, J.N.J. The Sheep as a Large Animal Model for the Investigation and Treatment of Human Disorders. Biology 2022, 11, 1–26. [CrossRef]
- Pinnapureddy, A.R.; Stayner, C.; McEwan, J.; Baddeley, O.; Forman, J.; Eccles, M.R. Large animal models of rare genetic disorders: Sheep as phenotypically relevant models of human genetic disease. Orphanet J Rare Dis 2015, 10, 1–8. [CrossRef]
- Shi, K.; Niu, F.; Zhang, Q.; Ning, C.; Yue, S.; Hu, C.; Wang, Z. Identification of whole-genome significant single nucleotide polymorphisms in candidate genes associated with serum biochemical traits in Chinese Holstein cattle. Front Genet 2020, 11, 163. [CrossRef]
- Tang, H.; Zhang, H.; Liu, D.; Wang, Z.; Yu, D.; Fan, W.; Zhou, Z. Genome-wide association study reveals the genetic determinism of serum biochemical indicators in ducks. BMC Genomics 2022, 23, 856. [CrossRef]
- Kizilaslan, M.; Arzik, Y.; Behrem, S.; White, S.N.; Cinar, M.U. Comparative genomic characterization of indigenous fat-tailed Akkaraman sheep with local and transboundary sheep breeds. Food Eng Sec 2024, 13, e508. [CrossRef]
- Percie du Sert, N.; Hurst, V.; Ahluwalia, A.; Alam, S.; Avey, M.T.; Baker, M.; Browne, W.J.; Clark, A.; Cuthill, I.C.; Dirnagl, U.; Emerson, M.; Garner, P.; Holgate, S.T.; Howells, D.W.; Karp, N.A.; Lazic, S.E.; Lidster, K.; MacCallum, C.J.; Macleod, M.; Pearl, E.J.; Petersen, O.H.; Rawle, F.; Reynolds, P.; Rooney, K.; Sena, E.S.; Silberberg, S.D.; Steckler, T.; Würbel, H. The ARRIVE guidelines 2.0: Updated guidelines for reporting animal research. PloS Biol 2020, 18, e3000410. [CrossRef]
- R Core Team. R: A Language and Environment for Statistical Computing, R Foundation for Statistical Computing, Vienna, Austria. Vienna, Austria, 2021.
- Breusch, T.S.; Pagan, A.R. A simple test for heteroscedasticity and random coefficient variation. Econometrica 1979, 47, 1287–1294. [CrossRef]
- Box, G.E.P.; Cox, D.R. An analysis of transformations. J R Stat: Series B (Methodological) 1964, 26, 211–243. [CrossRef]
- Aulchenko, Y.S.; Ripke, S.; Isaacs, A.; van Duijn, C.M. GenABEL: an R library for genome-wide association analysis. Bioinformatics 2007, 23, 1294–1296. [CrossRef]
- Covarrubias-Pazaran, G. Genome-Assisted prediction of quantitative traits using the r package sommer. PLoS One 2016, 11, 1–15. [CrossRef]
- VanRaden, P.M. Efficient methods to compute genomic predictions. J Dairy Sci 2008, 91, 4414–4423. [CrossRef]
- Lee, S.H.; Van der Werf, J.H.J. MTG2: an efficient algorithm for multivariate linear mixed model analysis based on genomic information. Bioinformatics 2016, 32, 1420– 1422. [CrossRef]
- Wilson, G.T. On the use of marginal likelihood in time series model estimation. J R Stat: Series B (Methodological) 1989, 51, 15–27. [CrossRef]
- Lynch, M.; Walsh, B. Genetics and analysis of quantitative traits. Sinauer, United States, 1998.
- Astle, W.; Balding, D.J. Population structure and cryptic relatedness in genetic association studies. Stat Sci 2009, 24, 451–471. [CrossRef]
- Chen, W.M.; Abecasis, G.R. Family-based association tests for genomewide association scans. AJHG 2007, 81, 913–926. [CrossRef]
- Devlin, B.; Roeder, K. Genomic control for association studies. Biometrics 1999, 55, 997–1004. [CrossRef]
- Rangwala, S.H.; Kuznetsov, A.; Ananiev, V.; Asztalos, A.; Borodin, E.; Evgeniev, V.; Joukov, V.; Lotov, V.; Pannu, R.; Rudnev, D. Accessing NCBI data using the NCBI Sequence Viewer and Genome Data Viewer (GDV). Genome Res 2021, 31, 159–169. [CrossRef]
- Huang, D.W.; Sherman, B.T.; Lempicki, R.A. Bioinformatics enrichment tools: paths toward the comprehensive functional analysis of large gene lists. Nucleic Acids Res 2009a, 37, 1–13. [CrossRef]
- Huang, D.W.; Sherman, B.T.; Lempicki, R.A. Systematic and integrative analysis of large gene lists using DAVID bioinformatics resources. Nat Protoc 2009b, 4, 44–57. [CrossRef]
- Binns, D.; Dimmer, E.; Huntley, R.; Barrell, D.; O’donovan, C.; Apweiler, R. QuickGO: a web-based tool for Gene Ontology searching. Bioinformatics 2009, 25, 3045-3046. [CrossRef]
- Hu, Z.-L., Park, C.A., & Reecy, J.M. Bringing the Animal QTLdb and CorrDB into the future: meeting new challenges and providing updated services. Nucleic Acids Res 2022, 50, D956–D961. [CrossRef]
- Aksoy, N.H.; Karaşahin, T.; Dursun, Ş.; Akbulut, N.K.; Haydardedeoğlu, A.E.; Ilgün, R.; Büyükleblebici, O. Comparative investigation of some liver enzyme functions considering age and gender distinctions in healthy Akkaraman sheep. JECM 2018, 35, 71-75.
- de Souza, T.C.; de Souza, T.C.; Rovadoscki, G.A.; Coutinho, L.L.; Mourao, G.B.; de Camargo, G.M.F.; Pinto, L.F.B. Genome-wide association for plasma urea concentration in sheep. Livest Sci, 2021, 248, 104483. [CrossRef]
- Luke, T. D. W., Rochfort, S., Wales, W. J., Bonfatti, V., Marett, L., & Pryce, J. E. Metabolic profiling of early-lactation dairy cows using milk mid-infrared spectra. J Dairy Sci, 2019, 102, 1747-1760. [CrossRef]
- Schade, D.S.; Shey, L.; Eaton, R.P. Cholesterol review: a metabolically important molecule. Endocr Pract 2020, 26, 1514-1523. [CrossRef]
- Machnicka, B.; Grochowalska, R.; Bogusławska, D. M.; Sikorski, A.F. The role of spectrin in cell adhesion and cell–cell contact. Expl Biol Med, 2019, 244, 1303-1312. [CrossRef]
- Iacono, J.M.; Ammerman, C.B. The effect of calcium in maintaining normal levels of serum cholesterol and phospholipids in rabbits during acute starvation. Am J Clin Nutr 1966, 18, 197-202. [CrossRef]
- Suica, V.I.; Uyy, E.; Boteanu, R.M.; Ivan, L.; Antohe, F. Alteration of actin dependent signaling pathways associated with membrane microdomains in hyperlipidemia. Proteome Sci, 2015, 13, 30. [CrossRef]
- Zhang, R.; Zhang, C.; Zhao, Q.; Li, D. Spectrin: structure, function and disease. Sci China Life Sci, 2013, 56, 1076-1085. [CrossRef]
- Blake, J.A.; Baldarelli, R.; Kadin, J.A.; Richardson, J.E.; Smith, C.L.; Bult, C.J.; Mouse Genome Database Group. Mouse Genome Database (MGD): Knowledgebase for mouse-human comparative biology. Nucleic Acids Res 2021, 49, 981-987. [CrossRef]
- Jakobsson, P.J.; Morgenstern, R.; Mancini, J.; Ford-Hutchinson, A.; Persson, B. Common structural features of MAPEG—a widespread superfamily of membrane associated proteins with highly divergent functions in eicosanoid and glutathione metabolism. Prot Sci 1999, 8, 689-692. [CrossRef]
- Dennis, E.A.; Norris, P.C. Eicosanoid storm in infection and inflammation. Nat Rev Immunol 2015, 15, 8:511-23. [CrossRef]
- Iovannisci, D.M.; Lammer, E.J.; Steiner, L.; Cheng, S.; Mahoney, L.T.; Davis, P.H.; Lauer, R.M.; Burns, T.L. Association between a leukotriene C4 synthase gene promoter polymorphism and coronary artery calcium in young women: the Muscatine Study. Arterioscler Thromb Vasc Biol 2007, 27, 2:394-9. [CrossRef]
- Onopiuk, A.; Tokarzewicz, A.; Gorodkiewicz, E. Cystatin C: a kidney function biomarker. Adv Clin Chem 2015, 68, 57-69. [CrossRef]
- Taniguchi, Y.; Pippin, J.W.; Hagmann, H.; Krofft, R.D.; Chang, A.M.; Zhang, J.; Terada, Y.; Brinkkoetter, P.; Shankland, S.J. Both cyclin I and p35 are required for maximal survival benefit of cyclin-dependent kinase 5 in kidney podocytes. Am J Physiol Renal Physiol 2012, 302, F1161-F1171. [CrossRef]
- Zhang, C.; Balbo, B.; Ma, M.; Zhao, J.; Tian, X.; Kluger, Y.; Somlo, S. Cyclin-dependent kinase 1 activity is a driver of cyst growth in polycystic kidney disease. Am J Nephrol, 2021, 32, 41-51. [CrossRef]
- Saurus, P.; Kuusela, S.; Dumont, V.; Lehtonen, E.; Fogarty, C.L.; Lassenius, M.I.; Forsblom, C.; Lehto, M.; Saleem, M.A.; Groop, P.H.; Lehtonen, S. Cyclin-dependent kinase 2 protects podocytes from apoptosis. Sci Rep, 2016, 6, 21664. [CrossRef]
- van Buul-Offers, S.C.; Kooijman, R. The role of growth hormone and insulin-like growth factors in the immune system. Cell Mol Life Sci 1998, 54, 1083-1094. [CrossRef]
- Alzaid, A.; Castro, R.; Wang, T.; Secombes, C.J.; Boudinot, P.; Macqueen, D.J.; Martin, S.A. Cross talk between growth and immunity: coupling of the IGF axis to conserved cytokine pathways in rainbow trout. Endocrinology, 2016, 157, 1942-1955. [CrossRef]
- Liso, A.; Venuto, S.; Coda, A.R.D.; Giallongo, C.; Palumbo, G.A.; Tibullo, D. IGFBP-6: at the crossroads of immunity, tissue repair and fibrosis. Int J Mol Sci, 2022, 23, 4358. [CrossRef]
- Zhang, L.; Smyth, D.; Al-Khalaf, M.; Blet, A.; Du, Q.; Bernick, J.; Gong, M.; Chi, X.; Oh, Y.; Roba-Oshin, M.; Coletta, E. Insulin-like growth factor-binding protein-7 (IGFBP7) links senescence to heart failure. Nat Cardiovasc Res 2022, 1, 1195-1214. [CrossRef]
- Sonnewald, U.; Wang, A.Y.; Schousboe, A.; Erikson, R.; Skottner, A. New aspects of lactate metabolism: IGF-I and insulin regulate mitochondrial function in cultured brain cells during normoxia and hypoxia. Dev Neurosci 1996, 18, 443-448. [CrossRef]
- Kasprzak, A. Insulin-like growth factor 1 (IGF-1) signaling in glucose metabolism in colorectal cancer. Int J Mol Sci 2021, 22, 6434. [CrossRef]
- Jennings, M. L. Role of transporters in regulating mammalian intracellular inorganic phosphate. Front Pharmacol 2023, 14, 1163442. [CrossRef]
- Lv, X.B.; Liu, C.Y.; Wang, Z.; Sun, Y.P.; Xiong, Y.; Lei, Q.Y.; Guan, K.L. PARD 3 induces TAZ activation and cell growth by promoting LATS 1 and PP 1 interaction. EMBO Rep 2015, 16, 975-985. [CrossRef]
- Piroli, M.E.; Blanchette, J.O.; Jabbarzadeh, E. Polarity as a physiological modulator of cell function. Front Biosci (Landmark edition) 2019, 24, 451. [CrossRef]
- Bryant, D.M.; Mostov, K.E. From cells to organs: building polarized tissue. Nat Rev Mol Cell Bio, 2008, 9, 887-901. [CrossRef]
- Orlando, K.; Guo, W. Membrane organization and dynamics in cell polarity. ColdSpring Harb Perspect Biol 2009, 1, a001321. [CrossRef]
Figure 1.
Manhattan plots for all serum biochemical indicators. Genome scaffolds sorted by length were numbered starting at 1. The red line denotes a genome-wide significance threshold (p = 1.223×10⁻⁶) and the dashed line denotes a suggestive (chromosome-wide) significance threshold (p = 3.181×10⁻⁵).
Disclaimer/Publisher’s Note: The statements, opinions and data contained in all publications are solely those of the individual author(s) and contributor(s) and not of MDPI and/or the editor(s). MDPI and/or the editor(s) disclaim responsibility for any injury to people or property resulting from any ideas, methods, instructions or products referred to in the content. |
© 2024 by the authors. Licensee MDPI, Basel, Switzerland. This article is an open access article distributed under the terms and conditions of the Creative Commons Attribution (CC BY) license (http://creativecommons.org/licenses/by/4.0/).
Copyright: This open access article is published under a Creative Commons CC BY 4.0 license, which permit the free download, distribution, and reuse, provided that the author and preprint are cited in any reuse.


