Submitted:
21 June 2024
Posted:
21 June 2024
You are already at the latest version
Abstract
Keywords:
1. Introduction
2. Materials and Methods
2.1. Ethic Statements
2.2. Animal Batches
2.3. Evaluation of Superficial Temperature by Infrared Imaging
2.4. CO2 Exposition
2.5. Hyperbaric Exposure
2.6. Physical Examination
2.7. Anaesthesia and Biopsy
2.8. Blood Biochemical Analysis
2.9. Stools Bacterial Content: 16s rDNA Extraction and Sequencing
2.10. Bioinformatic Processing
2.11. Statistical Analyses
3. Results
3.1. Clinical Status of the Animals Following the Dive
3.2. General Description of the Data
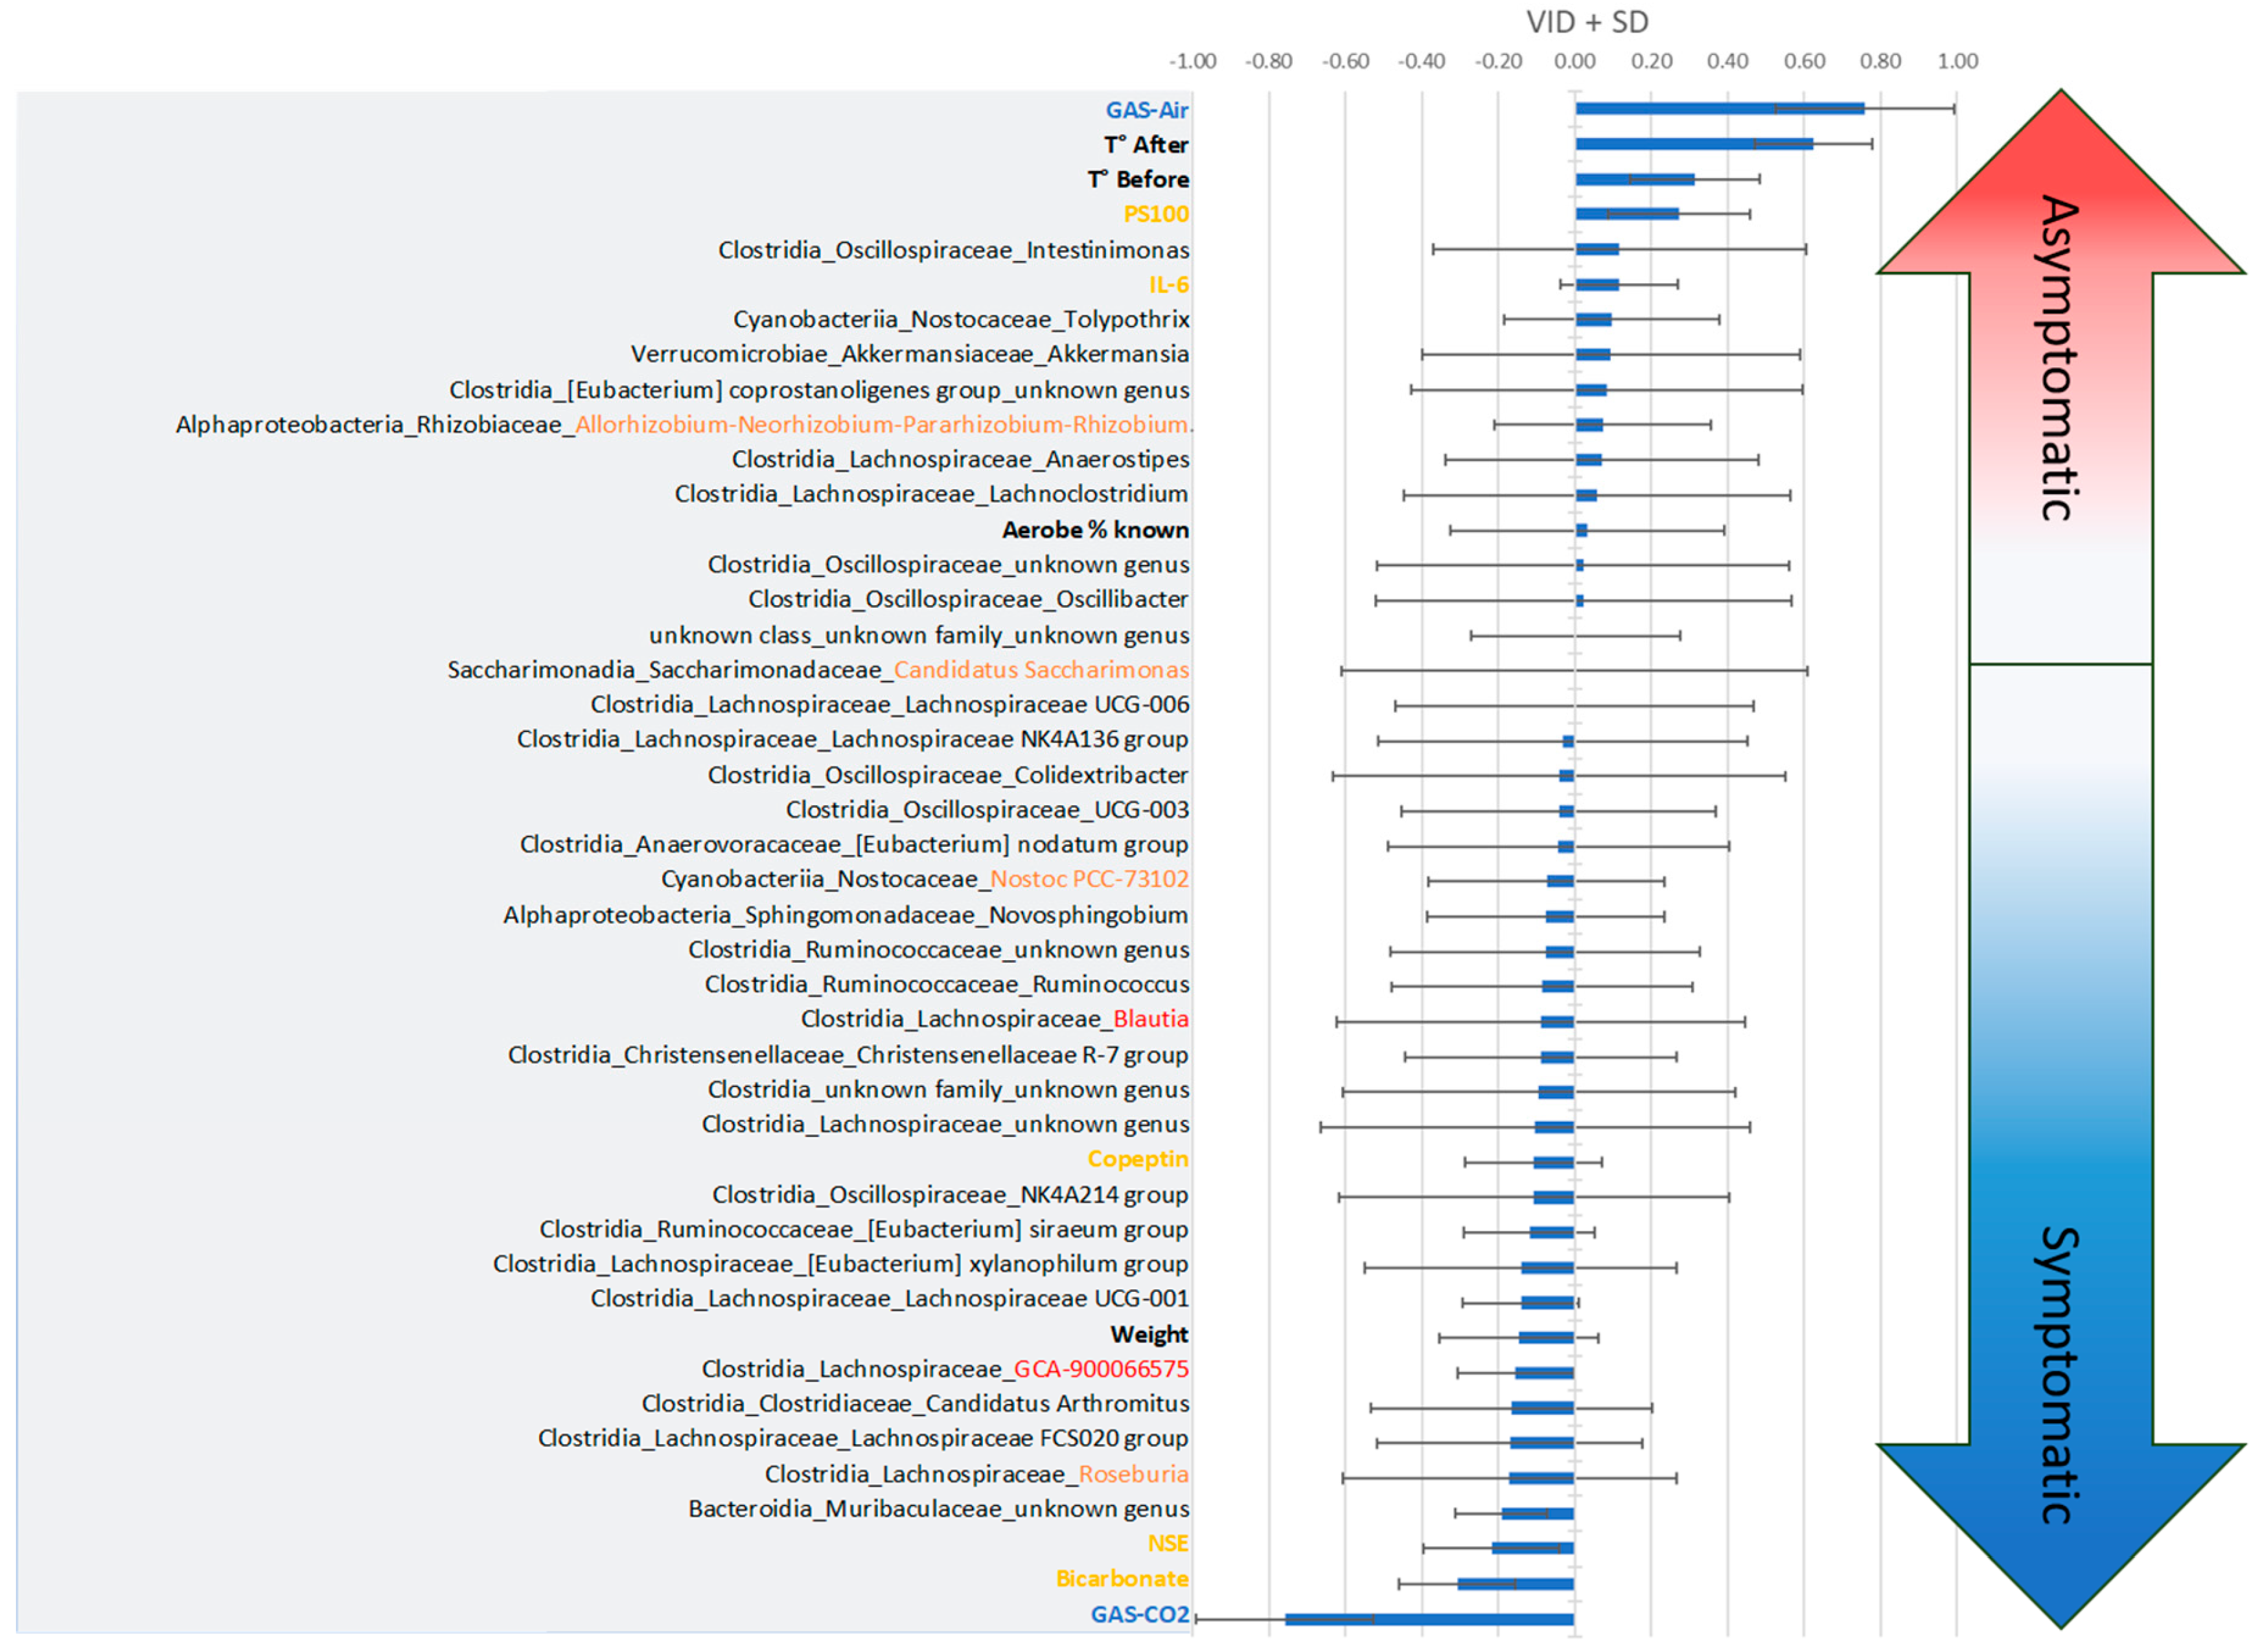
3.3. Two-Way Analysis
3.3.1. Body Temperature
3.3.2. Plasma Analysis
3.4. Initial Fecal Content Analysis
4. Discussion
4.1. Effects of CO2 and Diving on Circulating Markers of Neuronal Stress
4.2. Effects of CO2 and Diving on Plasma Markers, Thermoregulation and Vasomotion
Temperature
4.3. Impact of the Microbiota in the Stress Response
4.4. Context
4.5. Moderation, Study Limits
5. Conclusions
5.1. Grants and Funding
5.2. Caption for the Figures
Author Contributions
Conflicts of Interest
References
- Andicochea, C.T.; Henriques, M.E.; Fulkerson, J.; Jay, S.; Chen, H.; Deaton, T. Elevated environmental carbon dioxide exposure confounding physiologic events in aviators? Military medicine 2019, 184, e863–e867. [Google Scholar] [CrossRef] [PubMed]
- Doolette, D.J.; Mitchell, S.J. Hyperbaric conditions. Comprehensive Physiology 2010, 1, 163–201. [Google Scholar]
- Gennser, M.; Blogg, S.L. Oxygen or carbogen breathing before simulated submarine escape. Journal of applied physiology 2008, 104, 50–56. [Google Scholar] [CrossRef] [PubMed]
- Daubresse, L.; Amara, J.J.; Grau, M.M.; De Maistre, S.; Guillaume, C.G.; Lehot, H.H.; Texier, G.G.; Blatteau, J.-E. Case series of unusual neurologic symptoms after scuba diving training sessions, in the context of SARS COV2 preventive measures and restrictions. In Proceedings of the EUBS; 2022. [Google Scholar]
- Mano, Y.; D'Arrigo, J. Relationship between CO2 levels and decompression sickness: implications for disease prevention. Aviation, space, and environmental medicine 1978, 49, 349–355. [Google Scholar] [PubMed]
- Le Chatelier, H.L. Sur un énoncé général des lois des équilibres chimiques. Comptes Rendus Académie des Sciences 1884, 99, 786–789. [Google Scholar]
- Caldwell, H.G.; Carr, J.M.; Minhas, J.S.; Swenson, E.R.; Ainslie, P.N. Acid–base balance and cerebrovascular regulation. The Journal of Physiology 2021, 599, 5337–5359. [Google Scholar] [CrossRef] [PubMed]
- Brubakk, A.O.; Ross, J.A.; Thom, S.R. Saturation diving; physiology and pathophysiology. Comprehensive physiology 2011, 4, 1229–1272. [Google Scholar]
- Pickles, D.; Ogston, D.; MacDonald, A. Effects of gas bubbling and other forms of convection on platelets in vitro. Journal of Applied Physiology 1989, 67, 1250–1255. [Google Scholar] [CrossRef] [PubMed]
- Giry, P.B.; Porlier, G.; Eastman, D.; Radomski, M.W. Dive-induced modifications in platelet kinetics in rats. Undersea Biomed Res 1977, 4, 147–157. [Google Scholar] [PubMed]
- Pontier, J.M.; Jimenez, C.; Blatteau, J.E. Blood platelet count and bubble formation after a dive to 30 msw for 30 min. Aviation, space, and environmental medicine 2008, 79, 1096–1099. [Google Scholar] [CrossRef] [PubMed]
- Thorsen, T.; Klausen, H.; Lie, R.T.; Holmsen, H. Bubble-induced aggregation of platelets: effects of gas species, proteins, and decompression. Undersea Hyperb Med 1993, 20, 101–119. [Google Scholar] [PubMed]
- Brubakk, A.O.; Neuman, T.S.; Elliott, D.H. Bennett and Elliott’s Physiology and Medicine of Diving; Saunders: 2003; pp. 578-650.
- Gempp, E.; Blatteau, J.E. Risk factors and treatment outcome in scuba divers with spinal cord decompression sickness. J Crit Care 2010, 25, 236–242. [Google Scholar] [CrossRef] [PubMed]
- Lillo, R.; Maccallum, M.; Caldwell, J. Intravascular bubble composition in guinea pigs: a possible explanation for differences in decompression risk among different gases. Undersea biomedical research 1992, 19, 375–386. [Google Scholar] [PubMed]
- Ishiyama, A. Analysis of gas composition of intravascular bubbles produced by decompression. The Bulletin of Tokyo Medical and Dental University 1983, 30, 25–35. [Google Scholar] [PubMed]
- Hayashi, K.; Honda, Y.; Miyakawa, N.; Fujii, N.; Ichinose, M.; Koga, S.; Kondo, N.; Nishiyasu, T. Effect of CO2 on the ventilatory sensitivity to rising body temperature during exercise. Journal of Applied Physiology 2011, 110, 1334–1341. [Google Scholar] [CrossRef] [PubMed]
- Hodes, R.; Larrabee, M.G. The relation between alveolar carbon dioxide tension and susceptibility to decompression sickness. American Journal of Physiology-Legacy Content 1946, 147, 603–615. [Google Scholar] [CrossRef] [PubMed]
- Camporesi, E.M.; Bosco, G. Ventilation, Gas Exchange and Exercise Under Pressure. In Bennett and Elliott's Physiology and Medicine of Diving; Elsevier Science Limited: 2003; pp. 77-114.
- Lanphier, E.H. Carbon dioxide poisoning. Case histories of diving and hyperbaric accidents 1988, 199–213. [Google Scholar]
- Eynan, M.; Arieli, Y.; Taran, B.; Yanir, Y. Symptoms of central nervous system oxygen toxicity during 100% oxygen breathing at normobaric pressure with increasing inspired levels of carbon dioxide: a case report. Diving and Hyperbaric Medicine 2020, 50, 70. [Google Scholar] [CrossRef]
- Eynan, M.; Arieli, R.; Adir, Y. Response to CO2 in novice closed-circuit apparatus divers and after 1 year of active oxygen diving at shallow depths. Journal of applied physiology 2005, 98, 1653–1659. [Google Scholar] [CrossRef] [PubMed]
- Vallée, N.; Dugrenot, E.; Desruelle, A.-V.; Richard, S.; Coupé, S.; Ramdani, C.; Guieu, R.; Risso, J.-J.; Gaillard, S.; Guerrero, F. Highlighting of the interactions of MYD88 and NFKB1 SNPs in rats resistant to decompression sickness: toward an autoimmune response. Frontiers in Physiology 2023, 14. [Google Scholar] [CrossRef] [PubMed]
- Blatteau, J.E.; Gaillard, S.; De Maistre, S.; Richard, S.; Louges, P.; Gempp, E.; Druelles, A.; Lehot, H.; Morin, J.; Castagna, O.; et al. Reduction in the Level of Plasma Mitochondrial DNA in Human Diving, Followed by an Increase in the Event of an Accident. Front Physiol 2018, 9, 1695. [Google Scholar] [CrossRef] [PubMed]
- Lambrechts, K.; de Maistre, S.; Abraini, J.H.; Blatteau, J.-E.; Risso, J.-J.; Vallée, N. Tirofiban, a Glycoprotein IIb/IIIa Antagonist, Has a Protective Effect on Decompression Sickness in Rats: Is the Crosstalk Between Platelet and Leukocytes Essential? Frontiers in Physiology 2018, 9. [Google Scholar] [CrossRef] [PubMed]
- Desruelle, A.V.; Louge, P.; Richard, S.; Blatteau, J.E.; Gaillard, S.; De Maistre, S.; David, H.; Risso, J.J.; Vallee, N. Demonstration by Infra-Red Imaging of a Temperature Control Defect in a Decompression Sickness Model Testing Minocycline. Front Physiol 2019, 10, 933. [Google Scholar] [CrossRef] [PubMed]
- Cosnard, C.; De Maistre, S.; Abraini, J.H.; Chazalviel, L.; Blatteau, J.E.; Risso, J.J.; Vallee, N. Thirty-five Day Fluoxetine Treatment Limits Sensory-Motor Deficit and Biochemical Disorders in a Rat Model of Decompression Sickness. Front Physiol 2017, 8, 604. [Google Scholar] [CrossRef] [PubMed]
- Vallee, N.; Lambrechts, K.; De Maistre, S.; Royal, P.; Mazella, J.; Borsotto, M.; Heurteaux, C.; Abraini, J.; Risso, J.J.; Blatteau, J.E. Fluoxetine Protection in Decompression Sickness in Mice is Enhanced by Blocking TREK-1 Potassium Channel with the "spadin" Antidepressant. Front Physiol 2016, 7, 42. [Google Scholar] [CrossRef] [PubMed]
- Oya, M.; Tokunaga, T.; Tadano, Y.; Ogawa, H.; Fujii, S.; Murakami, W.; Tamai, K.; Ikomi, F.; Morimoto, Y. The composition of the human fecal microbiota might be significantly associated with fecal SCFA levels under hyperbaric conditions. Bioscience of Microbiota, Food and Health 2021, 40, 168–175. [Google Scholar] [CrossRef] [PubMed]
- Hagberg, M.; Ornhagen, H. Incidence and risk factors for symptoms of decompression sickness among male and female dive masters and instructors--a retrospective cohort study. Undersea Hyperb Med 2003, 30, 93–102. [Google Scholar] [PubMed]
- Oya, M.; Tadano, Y.; Takihata, Y.; Murakami, W.; Fujii, S.; Tamai, K.; Morimoto, Y.; Ikomi, F.; Tokunaga, T. Effects of hyperbaric conditions on fecal microbiota. Bioscience of microbiota, food and health 2019, 38, 35–39. [Google Scholar] [CrossRef] [PubMed]
- Bo, T.; Tang, L.; Xu, X.; Liu, M.; Wen, J.; Lv, J.; Wang, D. Role of gut microbiota in the postnatal thermoregulation of Brandt’s voles. Cell Reports 2023, 42. [Google Scholar] [CrossRef] [PubMed]
- Li, S.; Li, X.; Wang, K.; Li, Y.; Nagaoka, K.; Li, C. Gut microbiota intervention attenuates thermogenesis in broilers exposed to high temperature through modulation of the hypothalamic 5-HT pathway. Journal of Animal Science and Biotechnology 2023, 14, 159. [Google Scholar] [CrossRef]
- Boucher, J. The cause of multiple sclerosis is autoimmune attack of adenosyltransferase thereby limiting adenosylcobalamin production. Medical Hypotheses 2017, 109, 29–37. [Google Scholar] [CrossRef] [PubMed]
- Phan, H.T.; Ho, T.T.; Chu, H.H.; Vu, T.H.; Gresch, U.; Conrad, U. Neutralizing immune responses induced by oligomeric H5N1-hemagglutinins from plants. Veterinary research 2017, 48, 1–13. [Google Scholar] [CrossRef] [PubMed]
- Khakisahneh, S.; Zhang, X.-Y.; Nouri, Z.; Wang, D.-H. Gut microbiota and host thermoregulation in response to ambient temperature fluctuations. Msystems 2020, 5, 10–1128. [Google Scholar] [CrossRef] [PubMed]
- Zhang, L.; Yang, Z.; Yang, F.; Wang, G.; Zeng, M.; Zhang, Z.; Yang, M.; Wang, Z.; Li, Z. Gut microbiota of two invasive fishes respond differently to temperature. Frontiers in Microbiology 2023, 14, 1087777. [Google Scholar] [CrossRef] [PubMed]
- Tang, Y.; Wang, Y.-D.; Wang, Y.-Y.; Liao, Z.-Z.; Xiao, X.-H. Skeletal muscles and gut microbiota-derived metabolites: novel modulators of adipocyte thermogenesis. Frontiers in Endocrinology 2023, 14. [Google Scholar] [CrossRef] [PubMed]
- Chevalier, C.; Stojanović, O.; Colin, D.J.; Suarez-Zamorano, N.; Tarallo, V.; Veyrat-Durebex, C.; Rigo, D.; Fabbiano, S.; Stevanović, A.; Hagemann, S. Gut microbiota orchestrates energy homeostasis during cold. Cell 2015, 163, 1360–1374. [Google Scholar] [CrossRef] [PubMed]
- Worthmann, A.; John, C.; Rühlemann, M.C.; Baguhl, M.; Heinsen, F.-A.; Schaltenberg, N.; Heine, M.; Schlein, C.; Evangelakos, I.; Mineo, C. Cold-induced conversion of cholesterol to bile acids in mice shapes the gut microbiome and promotes adaptive thermogenesis. Nature medicine 2017, 23, 839–849. [Google Scholar] [CrossRef] [PubMed]
- Tian, Y.; Fu, M.; Su, J.; Yan, M.; Yu, J.; Wang, C.; Niu, Z.; Du, Y.; Hu, X.; Zheng, J. Gut microbiota dysbiosis and intestinal barrier impairment in diarrhea caused by cold drink and high-fat diet. Toxicology 2024, 502, 153728. [Google Scholar] [CrossRef] [PubMed]
- Lv, R.; Liu, X.; Zhang, Y.; Dong, N.; Wang, X.; He, Y.; Yue, H.; Yin, Q. Pathophysiological mechanisms and therapeutic approaches in obstructive sleep apnea syndrome. Signal transduction and targeted therapy 2023, 8, 218. [Google Scholar] [CrossRef]
- Campaña-Duel, E.; Ceccato, A.; Morales-Quinteros, L.; Camprubí-Rimblas, M.; Artigas, A. Hypercapnia and its relationship with respiratory infections. Expert Review of Respiratory Medicine 2024. [Google Scholar] [CrossRef]
- Ruiz, A. Carbon dioxide response curves during hypothermia. Pflügers Archiv 1975, 358, 125–133. [Google Scholar] [CrossRef]
- Santiago-Marrero, I.; Liu, F.; Wang, H.; Arzola, E.P.; Xiong, W.-C.; Mei, L. Energy expenditure homeostasis requires ErbB4, an obesity risk gene, in the paraventricular nucleus. Eneuro 2023, 10. [Google Scholar] [CrossRef] [PubMed]
- Branco, L.; Wood, S.C. Role of central chemoreceptors in behavioral thermoregulation of the toad, Bufo marinus. American Journal of Physiology-Regulatory, Integrative and Comparative Physiology 1994, 266, R1483–R1487. [Google Scholar] [CrossRef] [PubMed]
- Tsuji, B.; Hayashi, K.; Kondo, N.; Nishiyasu, T. Characteristics of hyperthermia-induced hyperventilation in humans. Temperature 2016, 3, 146–160. [Google Scholar] [CrossRef] [PubMed]
- White, M.D. Components and mechanisms of thermal hyperpnea. Journal of Applied Physiology 2006, 101, 655–663. [Google Scholar] [CrossRef] [PubMed]
- Sunanaga, J.; Deng, B.-S.; Zhang, W.; Kanmura, Y.; Kuwaki, T. CO2 activates orexin-containing neurons in mice. Respiratory physiology & neurobiology 2009, 166, 184–186. [Google Scholar]
- Hacquemand, R.; Buron, G.; Pourié, G.; Karrer, M.; Jacquot, L.; Brand, G. Effects of CO2 inhalation exposure on mice vomeronasal epithelium. Cell biology and toxicology 2010, 26, 309–317. [Google Scholar] [CrossRef] [PubMed]
- Rodrigues, L.T.C.; da Silva, E.N.; José de Anchieta, C.; Gargaglioni, L.H.; Dias, M.B. Glutamate metabotropic receptors in the lateral hypothalamus/perifornical area reduce the CO2 chemoreflex. Respiratory physiology & neurobiology 2019, 260, 122–130. [Google Scholar]
- Blatteau, J.E.; Barre, S.; Pascual, A.; Castagna, O.; Abraini, J.H.; Risso, J.J.; Vallee, N. Protective effects of fluoxetine on decompression sickness in mice. PLoS One 2012, 7, e49069. [Google Scholar] [CrossRef] [PubMed]
- Vallee, N.; Meckler, C.; Risso, J.J.; Blatteau, J.E. Neuroprotective role of the TREK-1 channel in decompression sickness. J Appl Physiol (1985) 2012, 112, 1191–1196. [Google Scholar] [CrossRef] [PubMed]
- Andrews, S. FastQC: a quality control tool for high throughput sequence data. Available online. Retrieved May 2010, 17, 2018. [Google Scholar]
- Callahan, B.J.; McMurdie, P.J.; Rosen, M.J.; Han, A.W.; Johnson, A.J.A.; Holmes, S.P. DADA2: High-resolution sample inference from Illumina amplicon data. Nature methods 2016, 13, 581–583. [Google Scholar] [CrossRef] [PubMed]
- R Core Team, R. R: A language and environment for statistical computing. 2013. [Google Scholar]
- Wang, Q.; Garrity, G.M.; Tiedje, J.M.; Cole, J.R. Naive Bayesian classifier for rapid assignment of rRNA sequences into the new bacterial taxonomy. Applied and environmental microbiology 2007, 73, 5261–5267. [Google Scholar] [CrossRef] [PubMed]
- Quast, C.; Pruesse, E.; Yilmaz, P.; Gerken, J.; Schweer, T.; Yarza, P.; Peplies, J.; Glöckner, F.O. The SILVA ribosomal RNA gene database project: improved data processing and web-based tools. Nucleic acids research 2012, 41, D590–D596. [Google Scholar] [CrossRef] [PubMed]
- Bokulich, N.A.; Subramanian, S.; Faith, J.J.; Gevers, D.; Gordon, J.I.; Knight, R.; Mills, D.A.; Caporaso, J.G. Quality-filtering vastly improves diversity estimates from Illumina amplicon sequencing. Nature methods 2013, 10, 57–59. [Google Scholar] [CrossRef] [PubMed]
- Pinard, E.; Rigaud, A.; Riche, D.; Naquet, R.; Seylaz, J. Continuous determination of the cerebrovascular changes induced by bicuculline and kainic acid in unanaesthetized spontaneously breathing rats. Neuroscience 1987, 23, 943–952. [Google Scholar] [CrossRef] [PubMed]
- Bailey, D.M.; Evans, K.A.; McEneny, J.; Young, I.S.; Hullin, D.A.; James, P.E.; Ogoh, S.; Ainslie, P.N.; Lucchesi, C.; Rockenbauer, A. Exercise-induced oxidative–nitrosative stress is associated with impaired dynamic cerebral autoregulation and blood–brain barrier leakage. Experimental physiology 2011, 96, 1196–1207. [Google Scholar] [CrossRef] [PubMed]
- Watson, P.; Shirreffs, S.M.; Maughan, R.J. Blood-brain barrier integrity may be threatened by exercise in a warm environment. American Journal of Physiology-Regulatory, Integrative and Comparative Physiology 2005, 288, R1689–R1694. [Google Scholar] [CrossRef] [PubMed]
- Stacey, M.J.; Hill, N.E.; Parsons, I.T.; Wallace, J.; Taylor, N.; Grimaldi, R.; Shah, N.; Marshall, A.; House, C.; O’Hara, J.P. Relative changes in brain and kidney biomarkers with Exertional Heat Illness during a cool weather marathon. Plos one 2022, 17, e0263873. [Google Scholar] [CrossRef] [PubMed]
- Gempp, E.; Louge, P.; De Maistre, S.; Emile, L.; Blatteau, J.E. Neuron-specific enolase and S100B protein levels in recreational scuba divers with neurological decompression sickness. Diving Hyperb Med 2014, 44, 26–29. [Google Scholar] [PubMed]
- Havnes, M.B.; Hjelde, A.; Brubakk, A.O.; Møllerløkken, A. S100B and its relation to intravascular bubbles following decompression. Diving Hyperb Med 2010, 40, 210–212. [Google Scholar] [PubMed]
- Havnes, M.B.; Kerlefsen, Y.; Møllerløkken, A. S100B and NSE serum concentrations after simulated diving in rats. Physiological Reports 2015, 3, e12546. [Google Scholar] [CrossRef] [PubMed]
- Linér, M.H.; Andersson, J. Hypoxic syncope in a competitive breath-hold diver with elevation of the brain damage marker S100B. Aviation, space, and environmental medicine 2009, 80, 1066–1068. [Google Scholar] [CrossRef]
- Li, J.; Kong, X.; Shu, W.; Zhang, W. The association of serum neuron-specific enolase with other disease markers in chronic obstructive pulmonary disease: A case-control study. Pakistan Journal of Medical Sciences 2018, 34, 1172. [Google Scholar] [PubMed]
- Blatteau, J.E.; Brubakk, A.O.; Gempp, E.; Castagna, O.; Risso, J.J.; Vallee, N. Sidenafil pre-treatment promotes decompression sickness in rats. PLoS One 2013, 8, e60639. [Google Scholar] [CrossRef] [PubMed]
- Espey, M.G. Role of oxygen gradients in shaping redox relationships between the human intestine and its microbiota. Free Radical Biology and Medicine 2013, 55, 130–140. [Google Scholar] [CrossRef] [PubMed]
- Albenberg, L.; Esipova, T.V.; Judge, C.P.; Bittinger, K.; Chen, J.; Laughlin, A.; Grunberg, S.; Baldassano, R.N.; Lewis, J.D.; Li, H. Correlation between intraluminal oxygen gradient and radial partitioning of intestinal microbiota. Gastroenterology 2014, 147, 1055–1063. [Google Scholar] [CrossRef] [PubMed]
- Moreno-Indias, I.; Torres, M.; Montserrat, J.M.; Sanchez-Alcoholado, L.; Cardona, F.; Tinahones, F.J.; Gozal, D.; Poroyko, V.A.; Navajas, D.; Queipo-Ortuño, M.I. Intermittent hypoxia alters gut microbiota diversity in a mouse model of sleep apnoea. European Respiratory Journal 2015, 45, 1055–1065. [Google Scholar] [CrossRef]
- Desruelle, A.V.; de Maistre, S.; Gaillard, S.; Richard, S.; Tardivel, C.; Martin, J.C.; Blatteau, J.E.; Boussuges, A.; Rives, S.; Risso, J.J.; et al. Cecal Metabolomic Fingerprint of Unscathed Rats: Does It Reflect the Good Response to a Provocative Decompression? Front Physiol 2022, 13, 882944. [Google Scholar] [CrossRef] [PubMed]
- de Maistre, S.; Gaillard, S.; Martin, J.C.; Richard, S.; Boussuges, A.; Rives, S.; Desruelle, A.V.; Blatteau, J.E.; Tardivel, C.; Risso, J.J.; et al. Cecal metabolome fingerprint in a rat model of decompression sickness with neurological disorders. Sci Rep 2020, 10, 15996. [Google Scholar] [CrossRef]
- Vallee, N.; Dugrenot, E.; Desruelle, A.V.; Tardivel, C.; Martin, J.C.; Guernec, A.; Boussuges, A.; Rives, S.; Risso, J.J.; Guerrero, F. Evidence of a hormonal reshuffle in the cecal metabolome fingerprint of a strain of rats resistant to decompression sickness. Sci Rep 2021, 11, 8317. [Google Scholar] [CrossRef] [PubMed]
- Vacca, M.; Celano, G.; Calabrese, F.M.; Portincasa, P.; Gobbetti, M.; De Angelis, M. The controversial role of human gut lachnospiraceae. Microorganisms 2020, 8, 573. [Google Scholar] [CrossRef] [PubMed]
- de Maistre, S.; Vallee, N.; Gaillard, S.; Duchamp, C.; Blatteau, J.E. Stimulating fermentation by the prolonged acceleration of gut transit protects against decompression sickness. Sci Rep 2018, 8, 10128. [Google Scholar] [CrossRef] [PubMed]
- de Maistre, S.; Vallee, N.; Gempp, E.; Lambrechts, K.; Louge, P.; Duchamp, C.; Blatteau, J.E. Colonic Fermentation Promotes Decompression sickness in Rats. Sci Rep 2016, 6, 20379. [Google Scholar] [CrossRef] [PubMed]
- de Maistre, S.; Vallee, N.; Gempp, E.; Louge, P.; Duchamp, C.; Blatteau, J.E. Gut fermentation seems to promote decompression sickness in humans. J Appl Physiol (1985) 2016, 121, 973–979. [Google Scholar] [CrossRef] [PubMed]
- Brooks, J.P.; Layman, J.; Willis, J. Physiologic effects of surgical masking in children versus adults. PeerJ 2023, 11, e15474. [Google Scholar] [CrossRef] [PubMed]
- Kisielinski, K.; Hirsch, O.; Wagner, S.; Wojtasik, B.; Funken, S.; Klosterhalfen, B.; Kanti Manna, S.; Prescher, A.; Sukul, P.; Sönnichsen, A. Physio-metabolic and clinical consequences of wearing face masks—Systematic review with meta-analysis and comprehensive evaluation. Frontiers in Public Health 2023, 11, 749. [Google Scholar] [CrossRef] [PubMed]
- Kisielinski, K.; Giboni, P.; Prescher, A.; Klosterhalfen, B.; Graessel, D.; Funken, S.; Kempski, O.; Hirsch, O. Is a mask that covers the mouth and nose free from undesirable side effects in everyday use and free of potential hazards? International journal of environmental research and public health 2021, 18, 4344. [Google Scholar] [CrossRef] [PubMed]
- Gireesan, S.; Pandit, A.B. Modeling the effect of carbon-dioxide gas on cavitation. Ultrasonics sonochemistry 2017, 34, 721–728. [Google Scholar] [CrossRef] [PubMed]
- Lautridou, J.; Buzzacott, P.; Belhomme, M.; Dugrenot, E.; Lafere, P.; Balestra, C.; Guerrero, F. Evidence of Heritable Determinants of Decompression Sickness in Rats. Med Sci Sports Exerc 2017, 49, 2433–2438. [Google Scholar] [CrossRef] [PubMed]

Disclaimer/Publisher’s Note: The statements, opinions and data contained in all publications are solely those of the individual author(s) and contributor(s) and not of MDPI and/or the editor(s). MDPI and/or the editor(s) disclaim responsibility for any injury to people or property resulting from any ideas, methods, instructions or products referred to in the content. |
© 2024 by the authors. Licensee MDPI, Basel, Switzerland. This article is an open access article distributed under the terms and conditions of the Creative Commons Attribution (CC BY) license (http://creativecommons.org/licenses/by/4.0/).


