Submitted:
18 September 2024
Posted:
19 September 2024
You are already at the latest version
Abstract
Keywords:
1. Introduction
2. Material and Methods
- -
- Glucose - hexokinase method,
- -
- Triglycerides - GPO-PAP method,
- -
- Urea – Uryase/GLDH method
- -
- Total protein - Biuret End Point method
- -
- ASAT, ALAT, GGT and alkaline phosphatase - enzymatic IFCC method at 37oC
- -
- Cortisol - ECLIA method
- -
- Inorganic phosphorus and calcium - ammonium phosphomolybdate UV method and Arsenaso III method.
2.1. Statistical Data Analysis
3. Results
4. Discussion
5. Conclusions
Author Contributions
Funding
Institutional Review Board Statement
Informed Consent Statement
Data Availability Statement
Acknowledgments
Conflicts of Interest
References
- Renaudeau, D.; Collin, A; Yahav, S; de Basilio, V; Gourdine, J.L.; Collier, R.J. Adaptation to hot climate and strategies to alleviate heat stress in livestock production. Animal 2012, May;6(5):707-28. [CrossRef] [PubMed]
- Segnalini, M.; Bernabucci, U.; Vitali, A.; et al. Temperature humidity index scenarios in the Mediterranean basin. Int. J Biometeorol. 2013, 57, 451–458. [Google Scholar] [CrossRef] [PubMed]
- Fournel, S.; Ouellet, V.; Charbonneau, É. Practices for Alleviating Heat Stress of Dairy Cows in Humid Continental Climates: A Literature Review. Animals 2017, 7, 37. [Google Scholar] [CrossRef]
- Wankar, A.K.; Rindhe, S.N.; Doijad, N.S. Heat stress in dairy animals and current milk production trends, economics, and future perspectives: The global scenario. Trop. Anim. Health Prod. 2021, 53, s11250–s020. [Google Scholar] [CrossRef]
- Mezzetti, M.; Cattaneo, L.; Passamonti, M.M.; Lopreiato, V.; Minuti, A.; Trevisi, E. The transition period updated: A review of the new insights into the adaptation of dairy cows to the new lactation. Dairy 2021, 2, 617–636. [Google Scholar] [CrossRef]
- Sammad, A; Wang, Y. J.; Umer, S.; Lirong, H.; Khan, I.; Khan, A.; Ahmad, B. and Wang. Y. Nutritional Physiology and Biochemistry of Dairy Cattle under the Influence of Heat Stress: Consequences and Opportunities. Animals 2020, 10, 793. [CrossRef]
- Frigeri, K.D.M.; Kachinski, K.D.; Ghisi, N.d.C.; Deniz, M.; Damasceno, F.A.; Barbari, M.; Herbut, P.; Vieira, F.M.C. Effects of Heat Stress in Dairy Cows Raised in the Confined System: A Scientometric Review. Animals 2023, 13, 350. [Google Scholar] [CrossRef] [PubMed]
- Ivanova, R.; Hristev, H. & Gergovska, Zh. Influence of the level of daily milk yield on some blood biochemical parameters in dairy cows reared under the same temperature and humidity conditions. Bulg. J. Agric. Sci. 2022, 28 (Supplement 1), 55–64.
- Mylostyvyi, R.V.& Sejian, V. Welfare of dairy cattle in conditions of global climate change. Theor. Appl. Vet. Med. 2019, 7, 47–55. [Google Scholar] [CrossRef]
- Ndlovu, T.; Chimonyo, M.; Okoh, A. I.; Muchenje, V.; Dzama, K. & Raats, J. G.. Assessing the nutrititional status of beef cattle: current practices and future prospects. Afr. J. Biotechnol. 2007, 6, 2727–273.
- Thom, E.C. Cooling degree days. Air Conditioning, Heating and Ventilating 1958, 55:65-69.
- Correa-Calderon, A.; Armstrong, D.; Ray, D.; DeNise, S.; Enns, M.; Howison C. Thermoregulatory responses of Holstein and Brown Swiss Heat-Stressed dairy cows to two different cooling systems. Int. J Biometeorol. 2004, 48:142-8. [CrossRef]
- Turner, M. G.; Dale, V. H.; & Gardner, R. H. Predicting across scales: theory development and testing. Landscape ecology 1989, 3, 245-252. [CrossRef]
- Gantner, V.; Mijić, P.; Kuterovac, K.; Solić, D.; Gantner, R. Temperature-humidity index values and their significance on the daily production of dairy cattle. Mljekarstvo 2011, 61:56-63.
- Armstrong, D. V. Heat stress interaction with shade and cooling. J. Dairy Sci. 1994, 77:2044–2050. [CrossRef]
- Ravagnolo, O.; Misztal, I. and Hoogenboom, G. Genetic component of heat stress in dairy cattle, development of heat index function. J. Dairy Sci. 2000, 83:2120–2125. [CrossRef]
- Kadzere, C.T.; Murphy, M.R.; Silanikove, N.; Maltz, E. Heat stress in lactating dairy cows: a review. Livest. Prod. Sci. 2002, 77:59-91. [CrossRef]
- Brügemann, K.; Gernand, E.; König von Borstel, U.; & König, S. Defining and evaluating heat stress thresholds in different dairy cow production systems. Archives Animal Breeding 2012, 55(1), 13-24. [CrossRef]
- Gorniak, T.; Meyer, U.; Südekum, K.H.; Dänicke, S. Impact of mild heat stress on dry matter intake, milk yield and milk composition in mid-lactation Holstein dairy cows in a temperate climate. Arch Anim Nutrit 2014, 68:358-369. [CrossRef]
- Blond, B.; Majkić, M.; Spasojević, J.; Hristov, S.; Radinović, M.; Nikolić, S.; Anđušić, L.; Čukić, A.; Došenović, Marinković, M.; Vujanović, B. D.; et al. Influence of Heat Stress on Body Surface Temperature and Blood Metabolic, Endocrine, and Inflammatory Parameters and Their Correlation in Cows. Metabolites 2024, 14, 104. [CrossRef]
- Zimbelman, R. B.; Rhoads, R. P.; Rhoads, M. L.; Duff, G. C.; Baumgard, L. H. and Collier, R. J. A re-evaluation of the impact of temperature humidity index (THI) and black globe humidity index (BGHI) on milk production in high producing dairy cows. Pages 158–169 in Proceedings of the Southwest Nutrition Conference. Accessed Feb. 2, 2009.
- Berman, A. Estimates of heat stress relief needs for Holstein dairy cows. J. Anim. Sci. 2005, 83: 1377–1384. [CrossRef]
- De Rensis, F.; Garcia-Ispierto, I.; Lopez-Gatius, F. Seasonal heat stress: Clinical implications and hormone treatments for the fertility of dairy cows. Theriogenology 2015, 84:659-666. [CrossRef]
- Avendaño-Reyes L. Heat stress management for milk production in arid zones. In: Narongsak Chaiyabutr editor. Milk production - An up-to-date overview of animal nutrition, management and health. Intech Open, London UK 2012, 165-184.
- Carter, B.H.; Friend, T.H.; Sawyer, J.A.; Garey, S.M.; Alexander, M.B.; Carter, M.J. et al. Effect of feed-bunk sprinklers on attendance at unshaded feed bunks in drylot dairies. Prof. Anim. Sci. 2011, 27:127-132. [CrossRef]
- Fox, D.G.; Tylutki, T.P. Accounting for the Effects of Environment on the Nutrient Requirements of Dairy Cattle. J. Dairy Sci. 1998, 81, 3085–3095. [Google Scholar] [CrossRef]
- Wheelock, J.B.; Rhoads, R.P.; VanBaale, M.J.; Sanders, S.R.; Baumgard, L.H. Effects of heat stress on energetic metabolism in lactating Holstein cows. J. Dairy Sci. 2010, 93, 644–655. [Google Scholar] [CrossRef] [PubMed]
- Baumgard, L.H.; Rhoads, R.P. Effects of Heat Stress on Postabsorptive Metabolism and Energetics. Annu. Rev. Anim. Biosci. 2013, 1, 311–337. [Google Scholar] [CrossRef]
- Shahzad, K.; Akbar, H.; Vailati-Riboni, M.; Basirico, L.; Morera, P.; Rodriguez-Zas, S. L. & Loor, J. J. The effect of calving in the summer on the hepatic transcriptome of Holstein cows during the peripartal period. J. Dairy Sci. 2015, 98(8), 5401-5413. [CrossRef]
- Turk, R.; Rošić, N.; Vince, S.; Perkov, S.; Samardžija, M.; Beer-Ljubić, B.; Belić, M.; Robić, M. The influence of heat stress on energy metabolism in Simmental dairy cows during the periparturient period. Vet. Arh. 2020, 90, 1–10. [Google Scholar] [CrossRef]
- Abbas, Z.; Sammad, A.; Hu, L.; Fang, H.; Xu, Q.; Wang, Y. Glucose Metabolism and Dynamics of Facilitative Glucose Transporters (GLUTs) under the Influence of Heat Stress in Dairy Cattle. Metabolites 2020, 10, 312. [Google Scholar] [CrossRef]
- Hanigan, M.H. Gamma-glutamyl transpeptidase: redox regulation and drug resistance. Adv. Cancer Res. 2014; 122:103-41. [CrossRef] [PubMed]
- Joo, S.S.; Lee, S.J.; Park, D.S.; Kim, D.H.; Gu, B.-H.; Park, Y.J.; Rim, C.Y.; Kim, M.; Kim, E.T. Changes in Blood Metabolites and Immune Cells in Holstein and Jersey Dairy Cows by Heat Stress. Animals 2021, 11, 974. [Google Scholar] [CrossRef]
- Tucker, H. A. Hormones, mammary growth, and lactation: A 41-year perspective. J. Dairy Sci. 2000, 83:874–884. [CrossRef]
- Lacasse, P.; Zhao, X.; Vanacker, N.; and Boutinaud, M. Lacasse, P.; Zhao, X.; Vanacker, N.; and Boutinaud, M. Review: Inhibition of prolactin as a management tool in dairy husbandry. Animal 2019, 13:s35–s41. [CrossRef]
- do Amaral, B. C.; Connor, E. E.; Tao, S.; Hayen, J.; Bubolz, J. and Dahl G. E. Heat stress abatement during the dry period influences prolactin signaling in lymphocytes. Domest. Anim. Endocrinol. 2010, 38:38–45. [CrossRef]
- do Amaral, B. C.; Connor, E. E.; Tao, S.; Hayen, J.; Bubolz, J. and Dahl G. E. Heat stress abatement during the dry period influences metabolic gene expression and improves immune status in the transition period of dairy cows. J. Dairy Sci. 2011, 94:86–96. [CrossRef]
- Marins, N.T.; Gao, J.; Yang, Q.; Binda, R. M.; Pessoa, C. M. B.; Orellana Rivas R. M.; Garrick, M.; Melo, V. H. L. R.; Chen, Y.; Bernard, J. K.; Garcia, M.; Chapman, J. D.; Kirk, D. J. and Tao, S. Impact of heat stress and a feed supplement on hormonal and inflammatory responses of dairy cows. J. Dairy Sci. 2011, 104:8276–8289. [CrossRef]
- Shwartz, G.; Rhoads, M.L.; Vanbaale, M.J.; Rhoads, R.P.; Baumgard, L.H. Effects of a supplemental yeast culture on heat-stressed lactating Holstein cows. J. Dairy Sci. 2009, 92, 935–942. [CrossRef]
- Cowley, F.C.; Barber, D.G.; Houlihan, A.V.; Poppi, D.P. Immediate and residual effects of heat stress and restricted intake on milk protein and casein composition and energy metabolism. J. Dairy Sci. 2015, 98, 2356–2368. [Google Scholar] [CrossRef]
| Indicator | Number of reports | Statistical data | |||
|---|---|---|---|---|---|
| x ± Se | SD | min | max | ||
| Average daily air temperature, ºС | |||||
| Summer | 92 | 24.27 ± 0.25 | 2.40 | 18.0 | 28.6 |
| Autumn | 90 | 14.80 ± 0.52 | 4.95 | 4.70 | 24.9 |
| Winter | 90 | 4.84 ± 0.36 | 3.42 | -4.0 | 12.7 |
| Average daily air humidity, % | |||||
| Summer | 92 | 63.21 ± 1.12 | 10.70 | 45 | 93 |
| Autumn | 90 | 69.16 ± 1.20 | 11.38 | 50 | 96 |
| Winter | 90 | 77.00 ± 1.37 | 12.99 | 46 | 97 |
| Average daily values of THI | |||||
| Summer | 92 | 71.78 ± 0.30 | 2.89 | 64.15 | 76.96 |
| Autumn | 90 | 58.23 ± 0.80 | 7.55 | 41.29 | 72.52 |
| Winter | 90 | 42.91 ± 0.56 | 5.36 | 30.97 | 55.37 |
| THI values | Samples from February | Samples from July | Samples from October | |||
|---|---|---|---|---|---|---|
| January | February | June | July | September | October | |
| Daily | 44.17±0.87 | 44.63±1.39 | 70.09±0.50 | 72.81±0.48 | 58.07±0.65 | 50.95±0.97 |
| Maximum | 52.02±1.30 | 52.01±1.98 | 82.04±0.96 | 85.64±1.04 | 70.18±0.74 | 59.81±1.61 |
| Minimum | 38.22±0.77 | 39.38±0.84 | 60.78±0.49 | 62.33±0.40 | 49.98±0.76 | 44.95±0.81 |
|
Indicator. (n=77) |
Reference values | First lactation | Second lactation | Third lactation | ||
| Sig. (p) | R2 | |||||
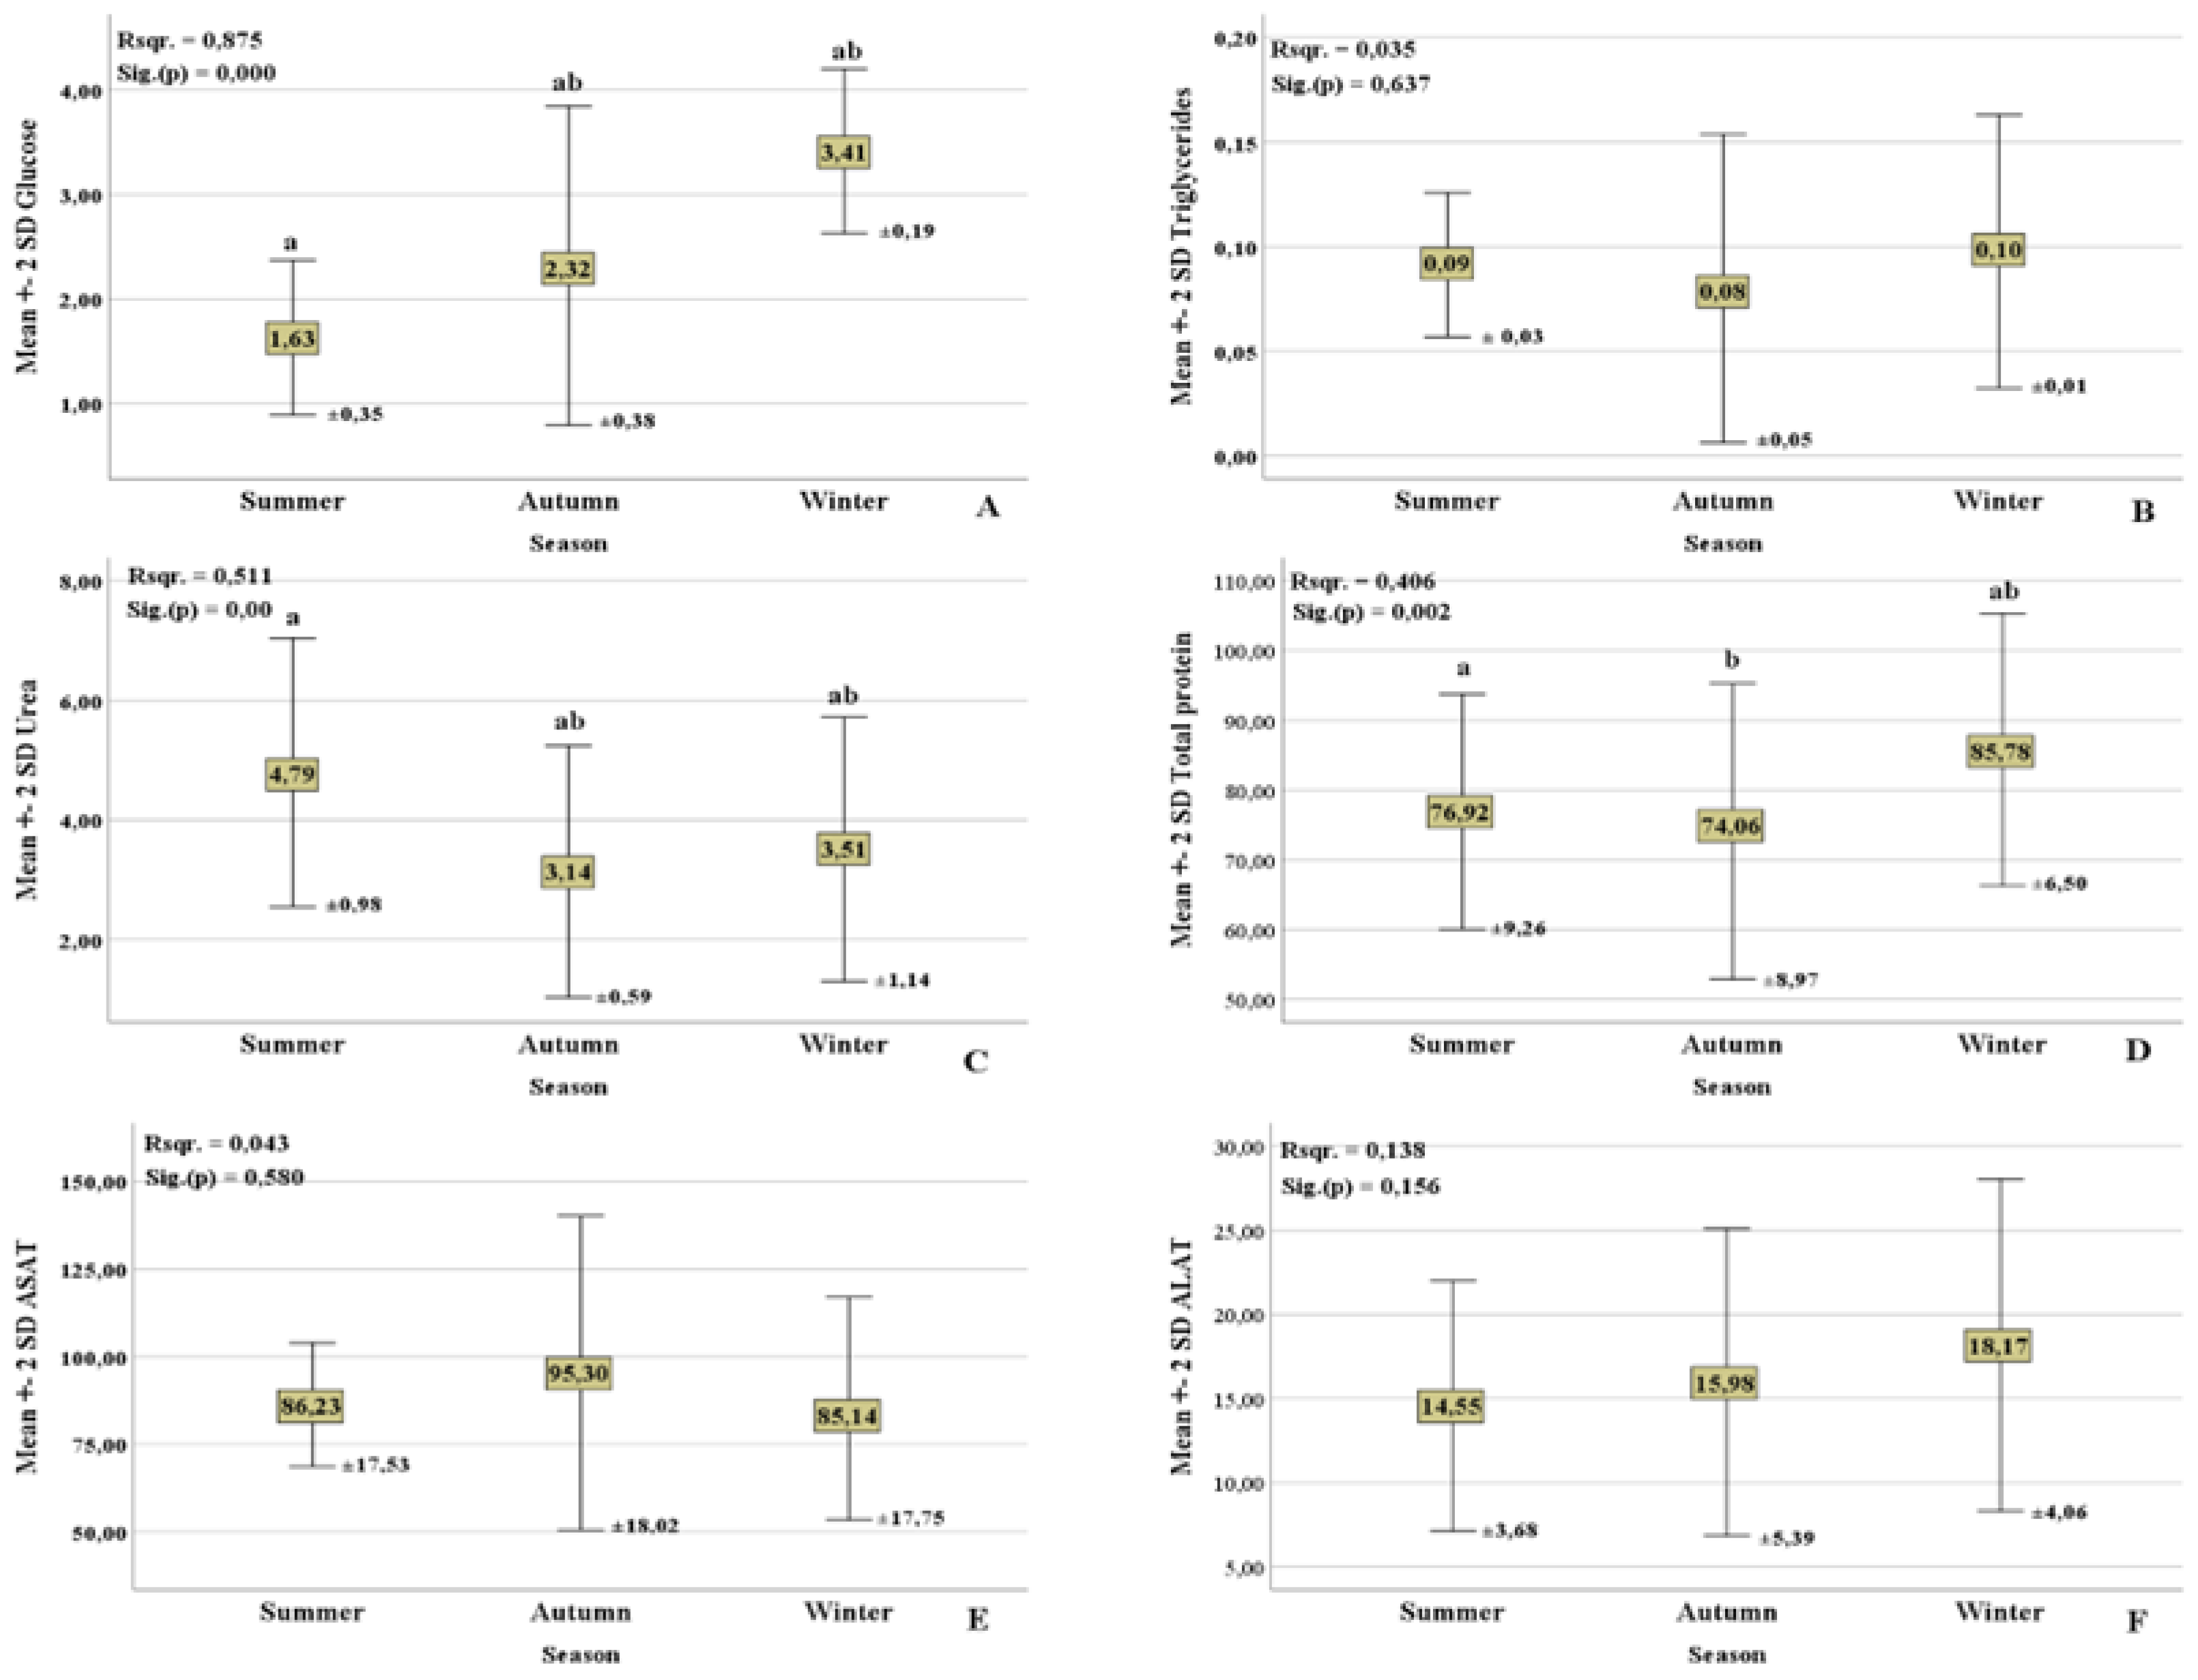
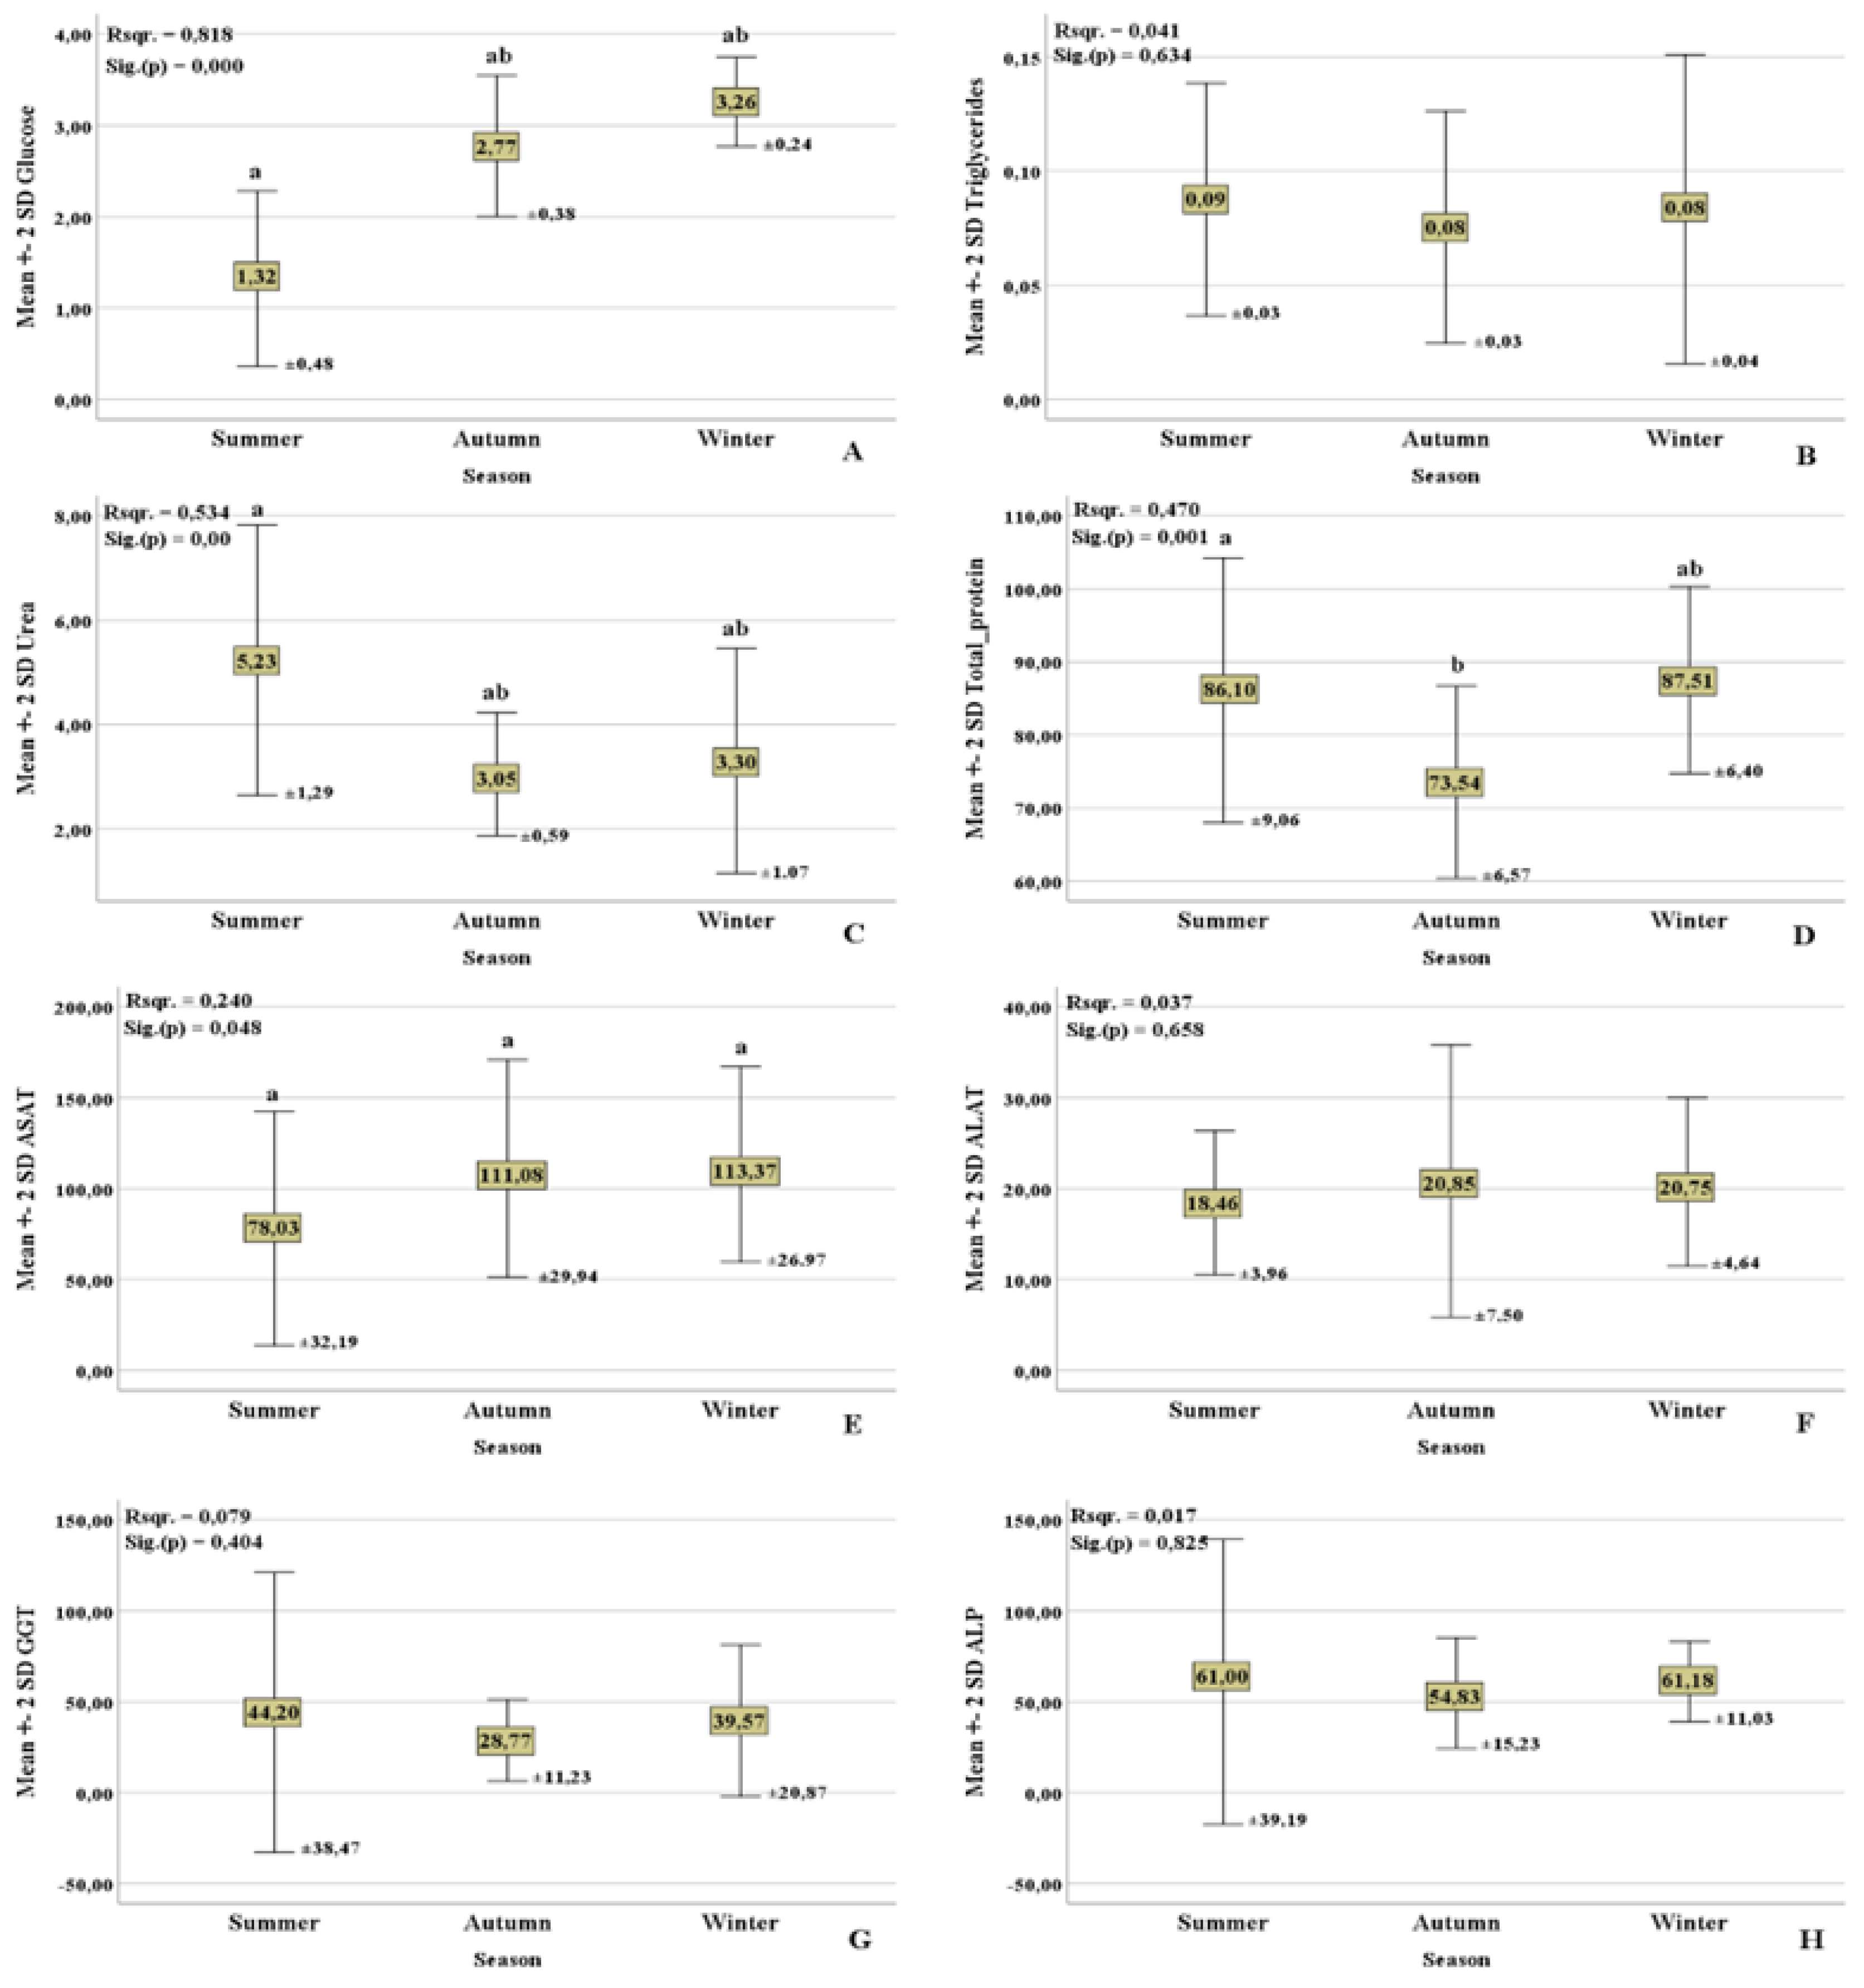
| Glucose | 2-3 (mmol/l) | 2.82±0.37 | 2.63±0.56 | 2.77±0.38 | 0.729 | 0.028 |
| Triglycerides | 0.2-0.5 (mmol/l) | 0.09±0.045 | 0.09±0.023 | 0.07±0.025 | 0.340 | 0.093 |
| Urea | 2.8-8.5 (mmol/l) | 2.57±0.59 a | 3.49±0.54 a | 3.05±0.59 | 0.029 | 0.276 |
| Total protein | 65-80 (g/l) | 72.41±8.97 | 75.82±2.49 | 73.53±6.57 | 0.692 | 0.033 |
| ASAT | 45-110 (U/I) | 94.45±18.01 | 123.98±34.91 | 111.07±29.94 | 0.156 | 0.156 |
| ALAT | 7-35 (U/I) | 16.28±5.39 | 23.22±5.88 | 20.85±7.49 | 0.141 | 0.163 |
| GGT | 4.9-26 (U/I) | 22.23±6.23 a | 42.82±15.75 ab | 28.77±11.23 ab | 0.009 | 0.348 |
| ALP | 18-153 (U/I) | 69.98±17.60 | 53.60±16.89 | 54.83±15.22 | 0.098 | 0.190 |
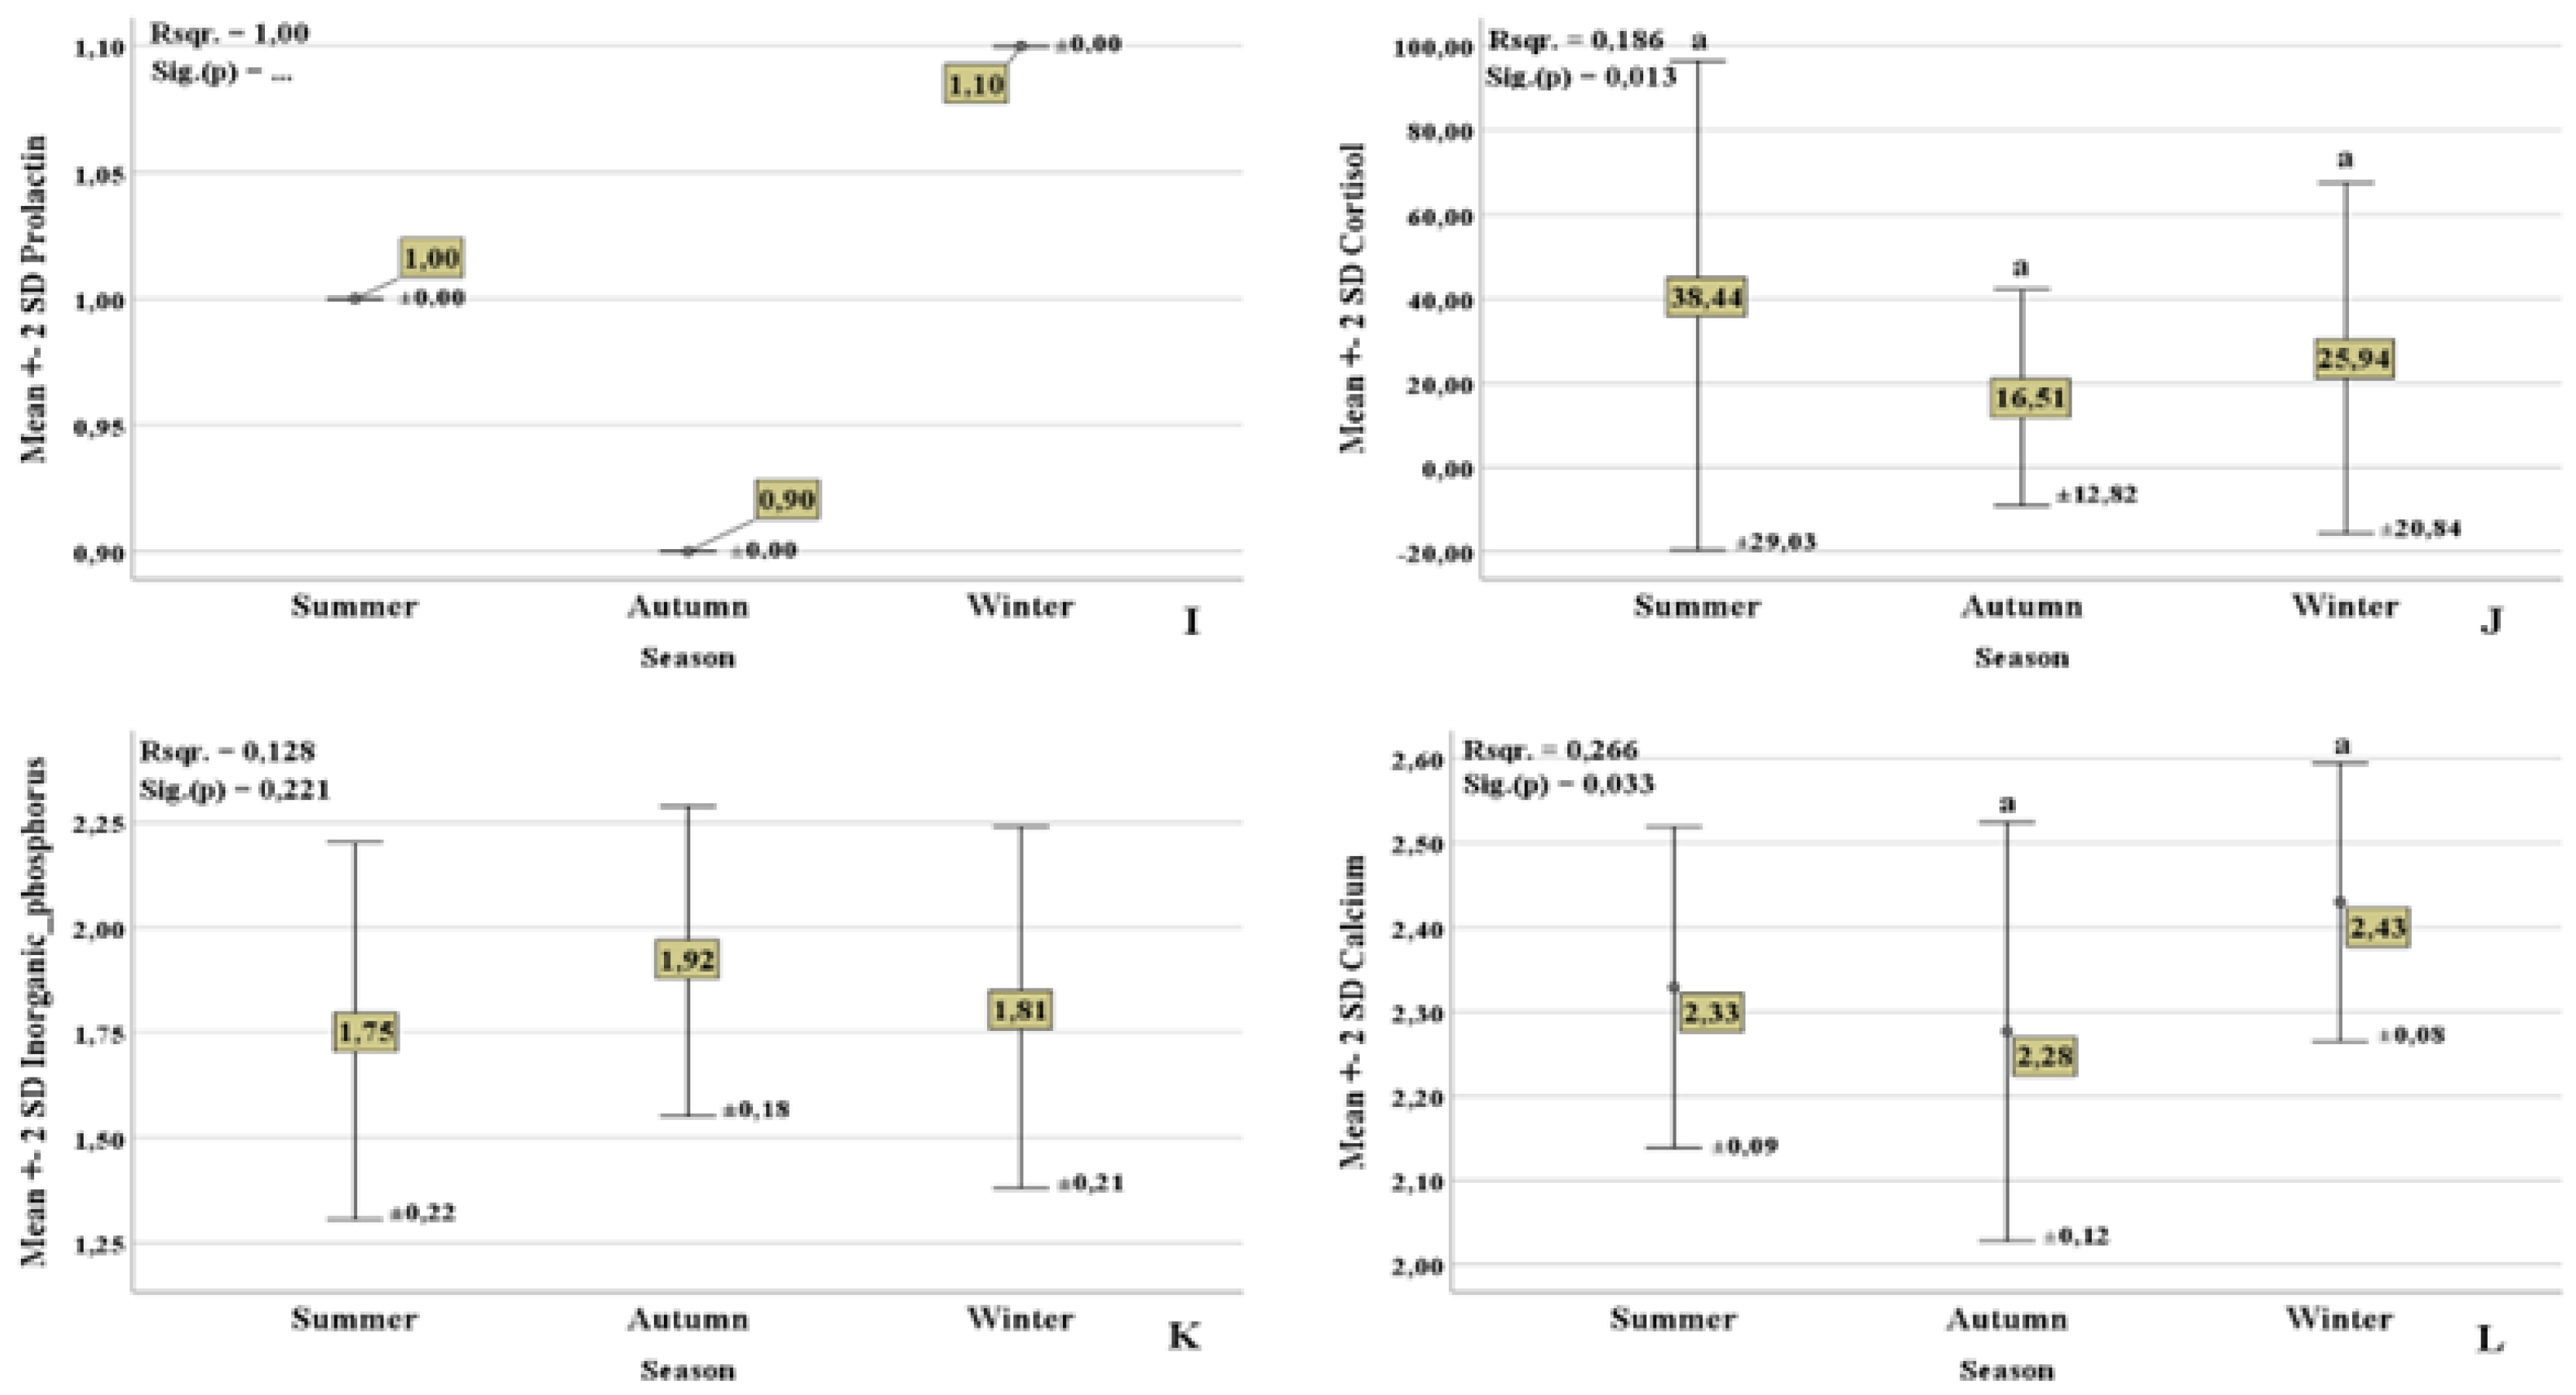
| Prolactin | - | 0.90±0.00 | 0.90±0.00 | 0.90±0.00 | -- | -- |
| Cortisol | 40-50 (nmol/l) | 14.95±8.40 | 10.56±9.38 | 16.50±12.82 | 0.599 | 0.046 |
| Inorganic phosphorus | 1.52-2.25 (mmol/l) | 1.85±0.25 | 1.93±0.23 | 1.92±0.18 | 0.737 | 0.029 |
| Calcium | 2.3-3.2 (mmol/l) | 2.31±0.10 | 2.39±0.08 | 2.27±0.12 | 0.157 | 0.155 |
|
Indicator (n=77) |
Reference values | First lactation | Second lactation | Third lactation | ||
| Sig. (p) | R2 | |||||
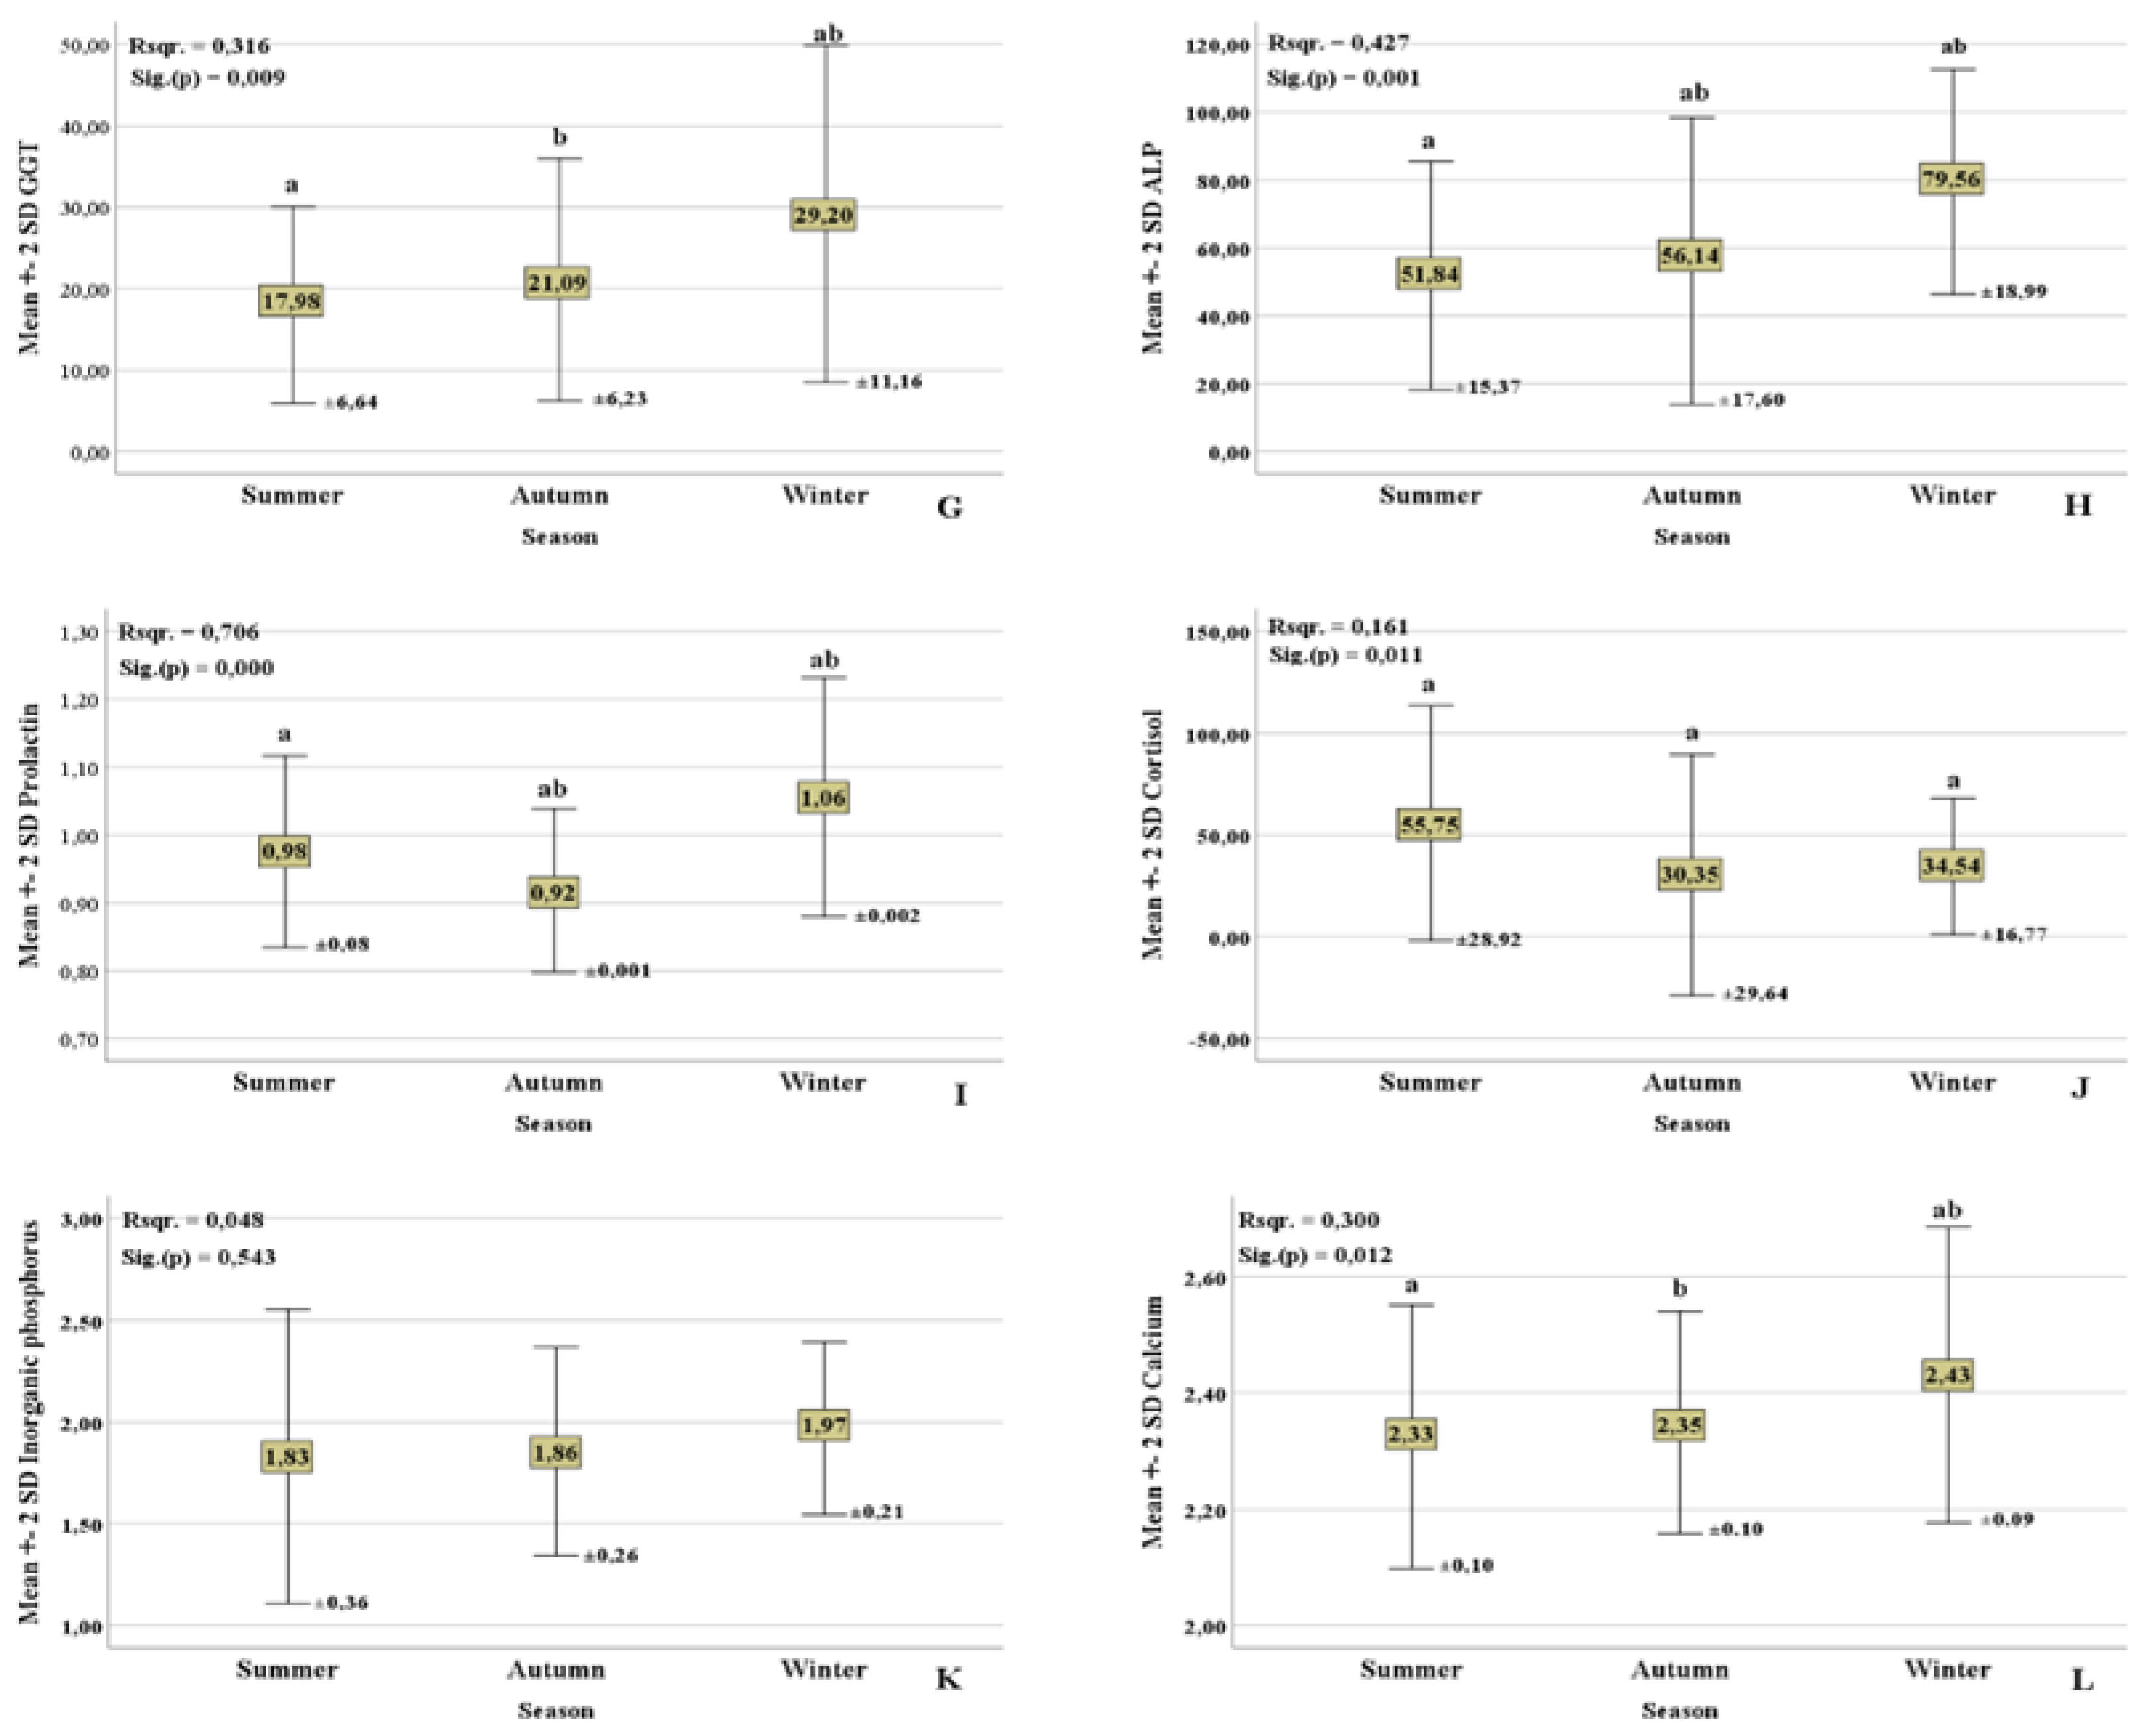
| Glucose | 2-3 (mmol/l) | 1.58±0.35 | 1.61±0.62 | 1.32±0.48 | 0.41 | 0.065 |
| Triglycerides | 0.2-0.5 (mmol/l) | 0.08±0.026 | 0.09±0.036 | 0.08±0.025 | 0.54 | 0.046 |
| Urea | 2.8-8.5 (mmol/l) | 4.63±0.97 | 5.0±1.09 | 5.23±1.29 | 0.49 | 0.053 |
| Total protein | 65-80 (g/l) | 76.82±9.26 a | 83.76±7.86 | 86.10±9.06 a | 0.063 | 0.192 |
| ASAT | 45-110 (U/I) | 87.79±17.53 | 108.57±41.00 a | 78.02±32.18 a | 0.121 | 0.150 |
| ALAT | 7-35 (U/I) | 14.74±3.68 a | 19.27±5.73 a | 18.45±3.96 | 0.062 | 0.192 |
| GGT | 4.9-26 (U/I) | 18.41±6.64 a | 23.90±3.79 | 44.20±38.47 a | 0.032 | 0.233 |
| ALP | 18-153 (U/I) | 46.92±15.36 | 79.31±52.48 | 61.00±39.18 | 0.158 | 0.132 |
| Prolactin | - | 0.97±0.07 | 0.95±0.08 | 1.00±0.00 | 0.414 | 0.066 |
| Cortisol | 40-50 (nmol/l) | 56.87±29.05 | 59.09±35.85 | 38.43±29.03 | 0.340 | 0.080 |
| Inorganic phosphorus | 1.52-2.25 (mmol/l) | 1.86±0.31 | 1.81±0.26 | 1.75±0.22 | 0.685 | 0.029 |
| Calcium | 2.3-3.2 (mmol/l) | 2.35±0.10 | 2.35±0.10 | 2.32±0.09 | 0.868 | 0.011 |
|
Indicator (n=77) |
Reference values | First lactation | Second lactation | Third lactation | ||
| Sig. (p) | R2 | |||||
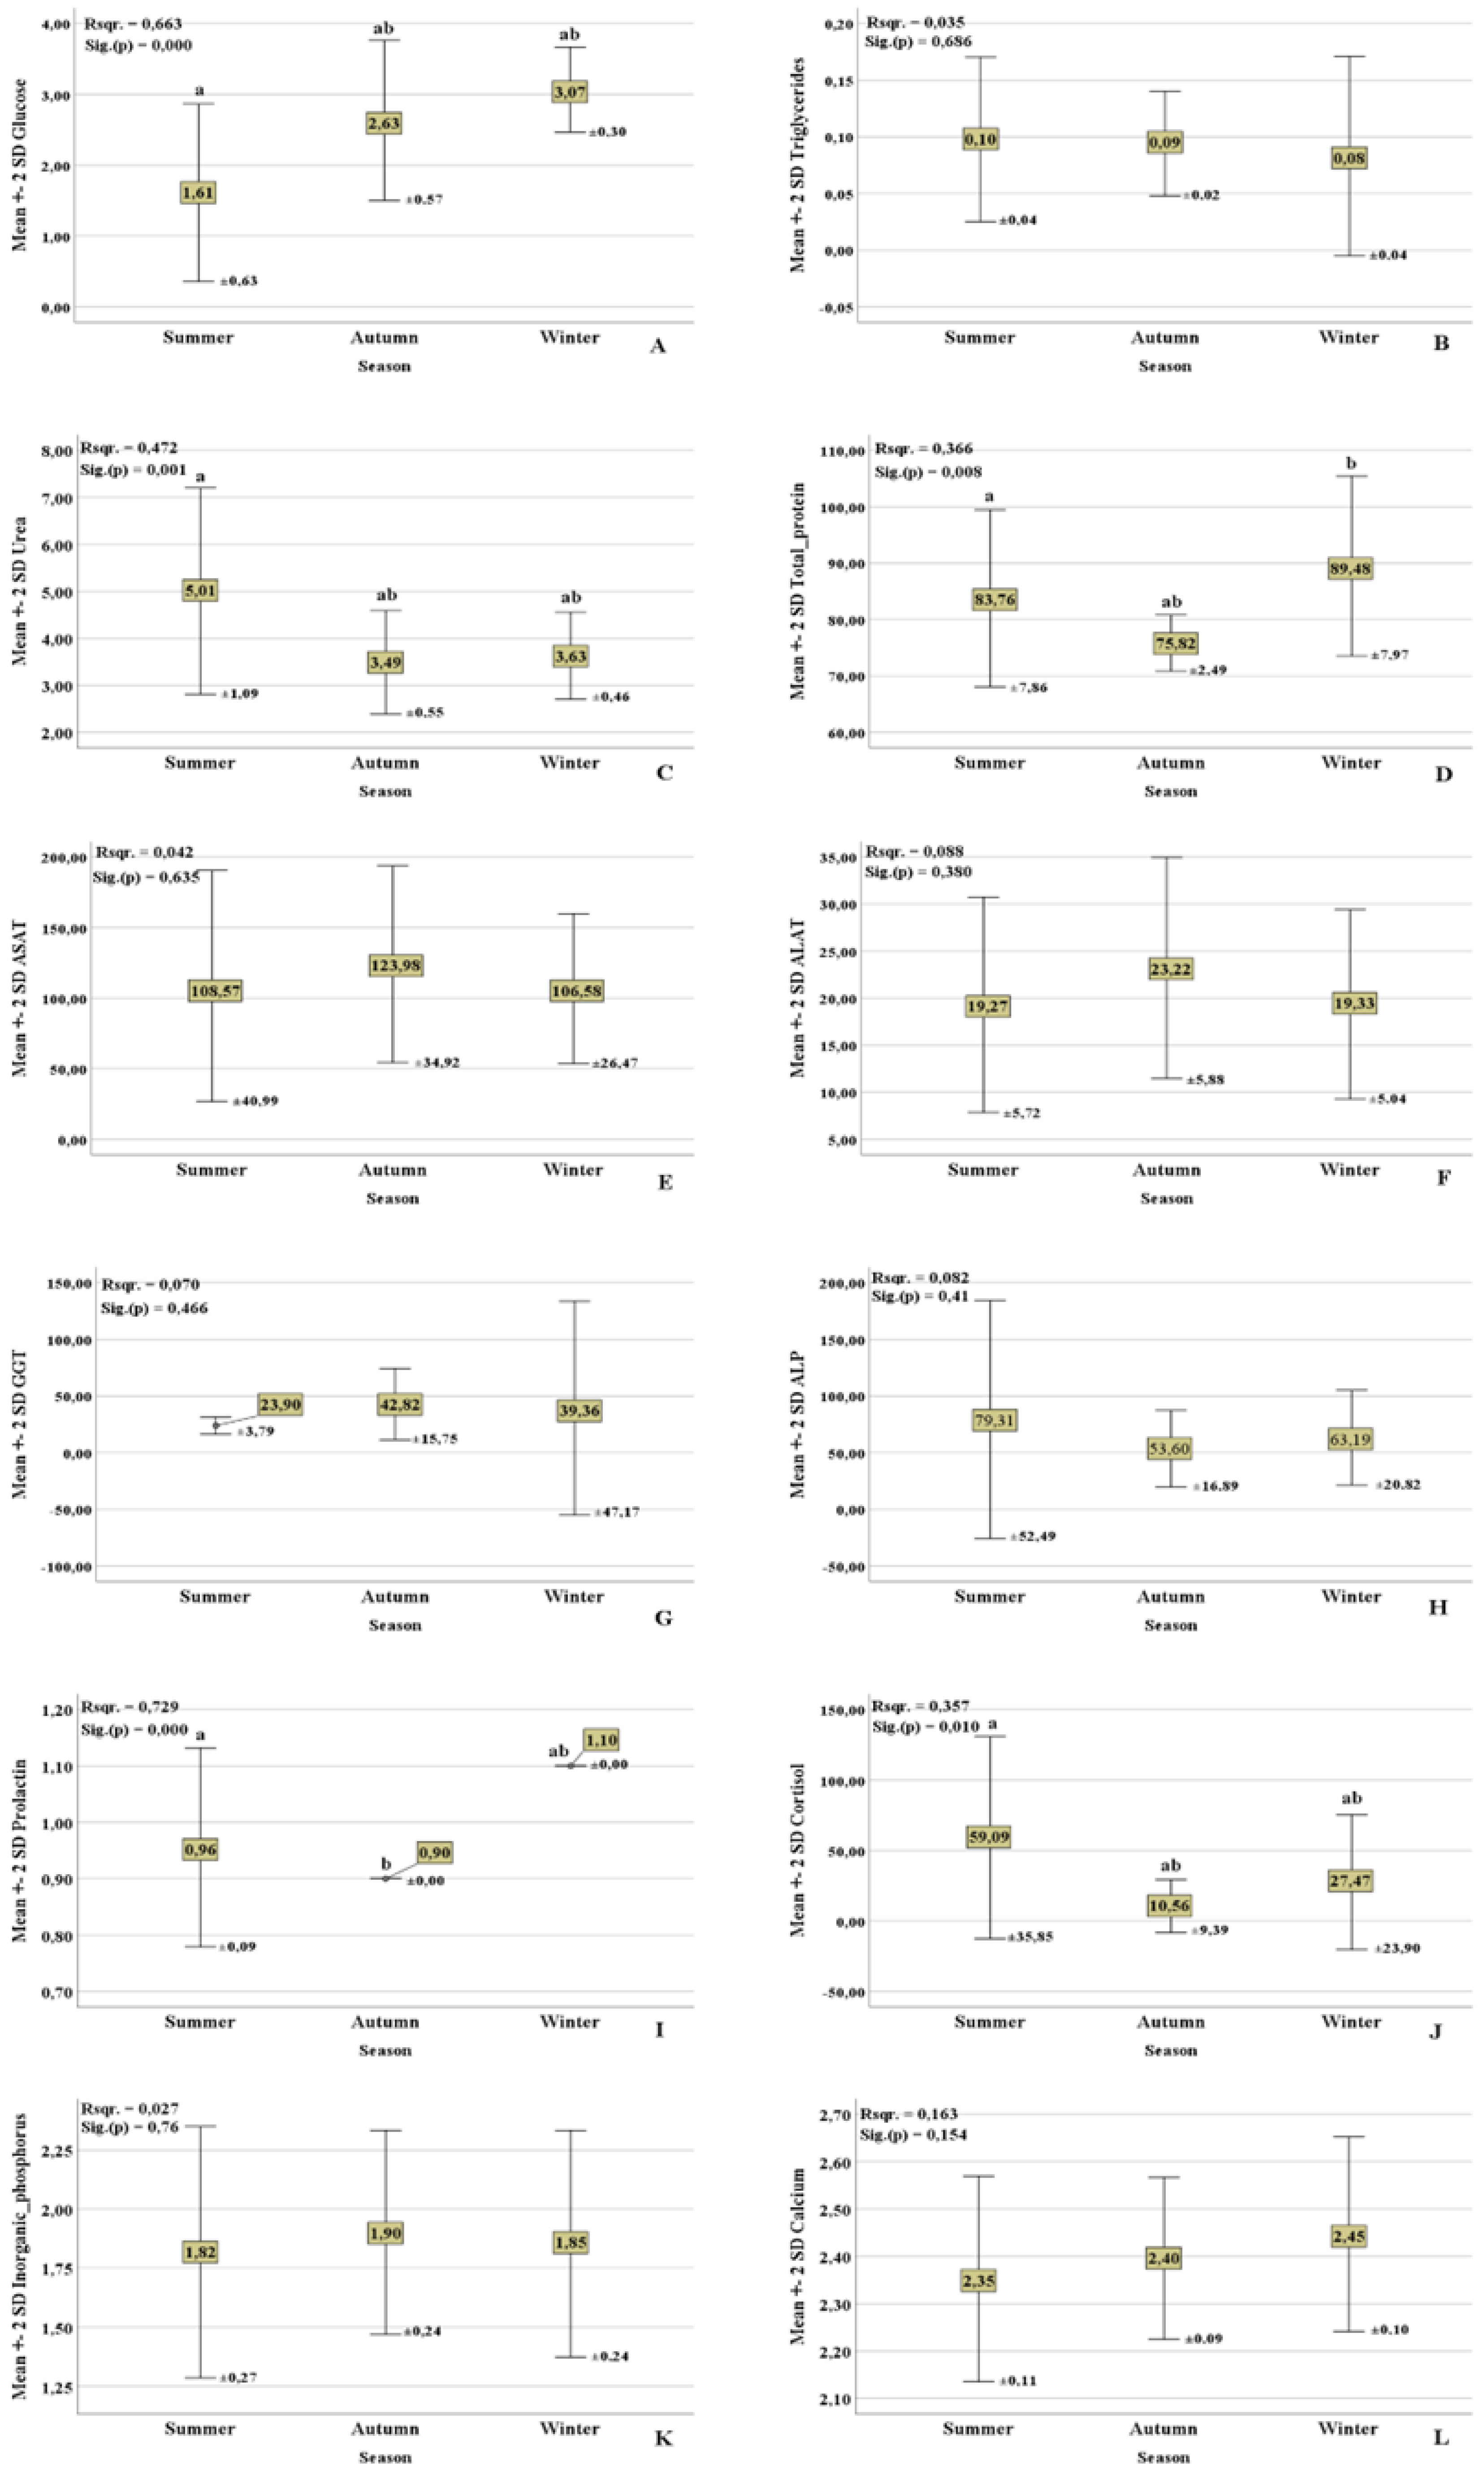
| Glucose | 2-3 (mmol/l) | 3.57±0.18 a | 3.06±0.30 ab | 3.26±0.24 a | 0.003 | 0.444 |
| Triglycerides | 0.2-0.5 (mmol/l) | 0.09±0.012 | 0.08±0.043 | 0.08±0.033 | 0.942 | 0.006 |
| Urea | 2.8-8.5 (mmol/l) | 3.66±1.14 | 3.63±0.46 | 3.30±1.07 | 0.724 | 0.032 |
| Total protein | 65-80 (g/l) | 89.77±6.49 | 89.47±7.93 | 87.51±6.39 | 0.828 | 0.019 |
| ASAT | 45-110 (U/I) | 85.84±17.74 | 106.58±26.57 | 113.36±26.87 | 0.119 | 0.192 |
| ALAT | 7-35 (U/I) | 18.91±4.06 | 19.33±5.03 | 20.75±4.64 | 0.763 | 0.027 |
| GGT | 4.9-26 (U/I) | 31.07±11.16 | 39.36±47.17 | 39.56±20.87 | 0.863 | 0.015 |
| ALP | 18-153 (U/I) | 79.32±18.98 | 63.19±20.88 | 61.18±11.03 | 0.149 | 0.173 |
| Prolactin | - | 1.10±0.00 | 1.10±0.00 | 1.10±0.00 | -- | -- |
| Cortisol | 40-50 (nmol/l) | 39.09±14.41 | 27.46±23.90 | 25.94±20.84 | 0.439 | 0.079 |
| Inorganic phosphorus | 1.52-2.25 (mmol/l) | 1.97±0.24 | 1.85±0.23 | 1.81±0.21 | 0.444 | 0.078 |
| Calcium | 2.3-3.2 (mmol/l) | 2.47±0.09 | 2.44±0.10 | 2.43±0.08 | 0.722 | 0.032 |
Disclaimer/Publisher’s Note: The statements, opinions and data contained in all publications are solely those of the individual author(s) and contributor(s) and not of MDPI and/or the editor(s). MDPI and/or the editor(s) disclaim responsibility for any injury to people or property resulting from any ideas, methods, instructions or products referred to in the content. |
© 2024 by the authors. Licensee MDPI, Basel, Switzerland. This article is an open access article distributed under the terms and conditions of the Creative Commons Attribution (CC BY) license (http://creativecommons.org/licenses/by/4.0/).


