Preprint
Article

An Experimental Study for Automatic Detection of COVID-19 from Chest CT Scans. A Comparison through Deep Learning and Support Vector Machine

Altmetrics

Downloads

91

Views

33

Comments

0

Submitted:

22 June 2024

Posted:

24 June 2024

You are already at the latest version

Alerts
Abstract
COVID-19 was a terrible worldwide pandemic that caused a global public health crisis, with numerous deaths and a severe economic depression. To suppress the spread of COVID-19 and initiate patient isolation and contact tracing to reduce its effect, early diagnosis was required, with real-time reverse transcriptase polymerase chain reaction (RT-PCR) swab test being the most widely used. However, the RT-PCR test was sometimes found to be lengthy and inaccurate and; for that reason, in many cases of severe complications of COVID-19 pneumonia, chest screening with radiography imaging was preferred. In this paper, we carried out a study for COVID-19 detection from computed tomography images, and compared the obtained results using deep learning (DL) and support vector machine (SVM). The findings showed that, despite the excellent results shown by deep learning, the accuracy in predicting COVID-19 using SVM, in the presence of small databases, was slightly higher than DL. The execution time using SVM was also shorter
Keywords: 
Subject: Computer Science and Mathematics  -   Artificial Intelligence and Machine Learning

Introduction

The novel SARS-CoV-2 coronavirus was the cause of COVID-19, a pandemic that spread worldwide as an acute respiratory syndrome, killing millions of people, causing severe damage to the economies of all countries and putting the entire healthcare system under tremendous pressure. To suppress the spread of COVID-19 and initiate patient isolation and contact tracing to reduce its effect, early diagnosis was required, with real-time reverse transcriptase polymerase chain reaction (RT-PCR) swab test being the most widely used [1]. However, RT-PCR diagnostic results take several hours to process, and studies have shown that many of the tests suffer from a high false-negative rate, often requiring retesting [2]. For that reason, in many cases of severe complications of COVID-19 pneumonia, chest screening with radiography imaging or computed tomography (CT) proved to be an alternative method to visualize thoracic lesions. However, some specialists have reasoned that CT is more suitable for the detection of COVID-19 than chest radiography, but this is more time-consuming, expensive and not always available, especially in economically underdeveloped countries.
The fight against COVID-19 motivated many scientific institutions and researchers of all specialties around the world to search for effective methods and techniques that would help put an end to this pandemic. In that direction, the computer vision community did not lag behind and many papers were published to address this disease, using mainly X-ray and CT images [3,4,5]. In this sense, many researches have proven that chest computed tomography was more effective and sensitive in detecting COVID-19 than RT-PCR tests [6]. Then, based on radiographic changes of COVID-19 in CT images, these studies evidenced that machine learning methods might be able to extract specific features of COVID-19 and provide a clinical diagnosis prior to RT-PCR testing, saving significant time for disease control [7]. On the other hand, COVID-19 remains a global public health challenge due to new immune-evasive SARS-CoV-2 variants continue to emerge. For that reason, any automated system to detect COVID-19 from CT images will always be welcome in the medical field, as automated analysis of biomedical images has been proven to reduce the workload of radiologists and pathologists; in addition to offering accurate and faster diagnoses.
Many methods using machine learning have been proposed for bio-medical image analysis [8,9], and among them, deep learning has occupied a prominent position [10,11], as these algorithms extract image features automatically, making them more suitable for automated biomedical image analysis, as well as providing accurate diagnoses. Furthermore, deep learning is known to be classified into supervised and unsupervised learning, with supervised learning giving exceptional results in bio-medical image processing, with performance comparable to that of humans, and sometimes superior [12]. Supervised learning requires a set of real data (ground truth) and prior knowledge about the result to be obtained with that dataset. To work with a prediction and classification algorithm based on deep learning, a sufficient amount of training samples is required. To work with a prediction and classification algorithm based on deep learning, a sufficient amount of training samples is required. In many cases, as is in medical data analysis, specialists lack a suitable large dataset. When a sufficiently large database is not available to carry out a good training on the convolutional neural network, the obtained result may be far from the expected one. For this reason, traditional machine learning methods should not always be discarded, especially those that have proven to be efficient.
In this paper, we carried out an experimental study for automatic detection of COVID-19 from chest CT scans, and compared the obtained results using deep learning (DL) and support vector machine (SVM). The findings showed that, despite the excellent results shown by deep learning, the accuracy in predicting COVID-19 using SVM, in the presence of small databases, was slightly higher than DL. The execution time using SVM was also shorter.
The rest of the paper is organized as follows: In section 2, the materials and methods are given, and we slightly outlines some theoretical and algorithmic aspects. Here, we will specify on the database used. Section 3 contains the obtained results and discussion. We will describe our conclusions in section 4.

2. Materials and Methods

2.1. Medical Methodology

We have collected chest CT scan image dataset containing two classes: COVID and Non-COVID from a Hospital in Cuba selected to admit patients with disease symptom, which was used to train and evaluate the performance of our models. An example of some of these images is shown in Figure 1.
In our dataset, each class contains 442 COVID-19 positive individuals and 498 negative individuals (Non-COVID-19). We could have used some method to augment the database (e.g., using horizontal flipping and gamma correction [4]), but the goal of this research was to test and compare, on a small database, the performance of deep learning against an efficient machine learning technique such as the support vector machine. In this paper, we quantitatively compared the obtained results by using CNNs with those attained employing the support vector machine (SVM).
We subsequently resized the entire database to a dimension of 100x100 pixels. Finally, as part of the data preprocessing, each image was normalized by dividing the value of each pixel by the maximum possible value. In this case, only for the convolutional neural network.

2.2. Proposed Convolutional Neural Network Architecture

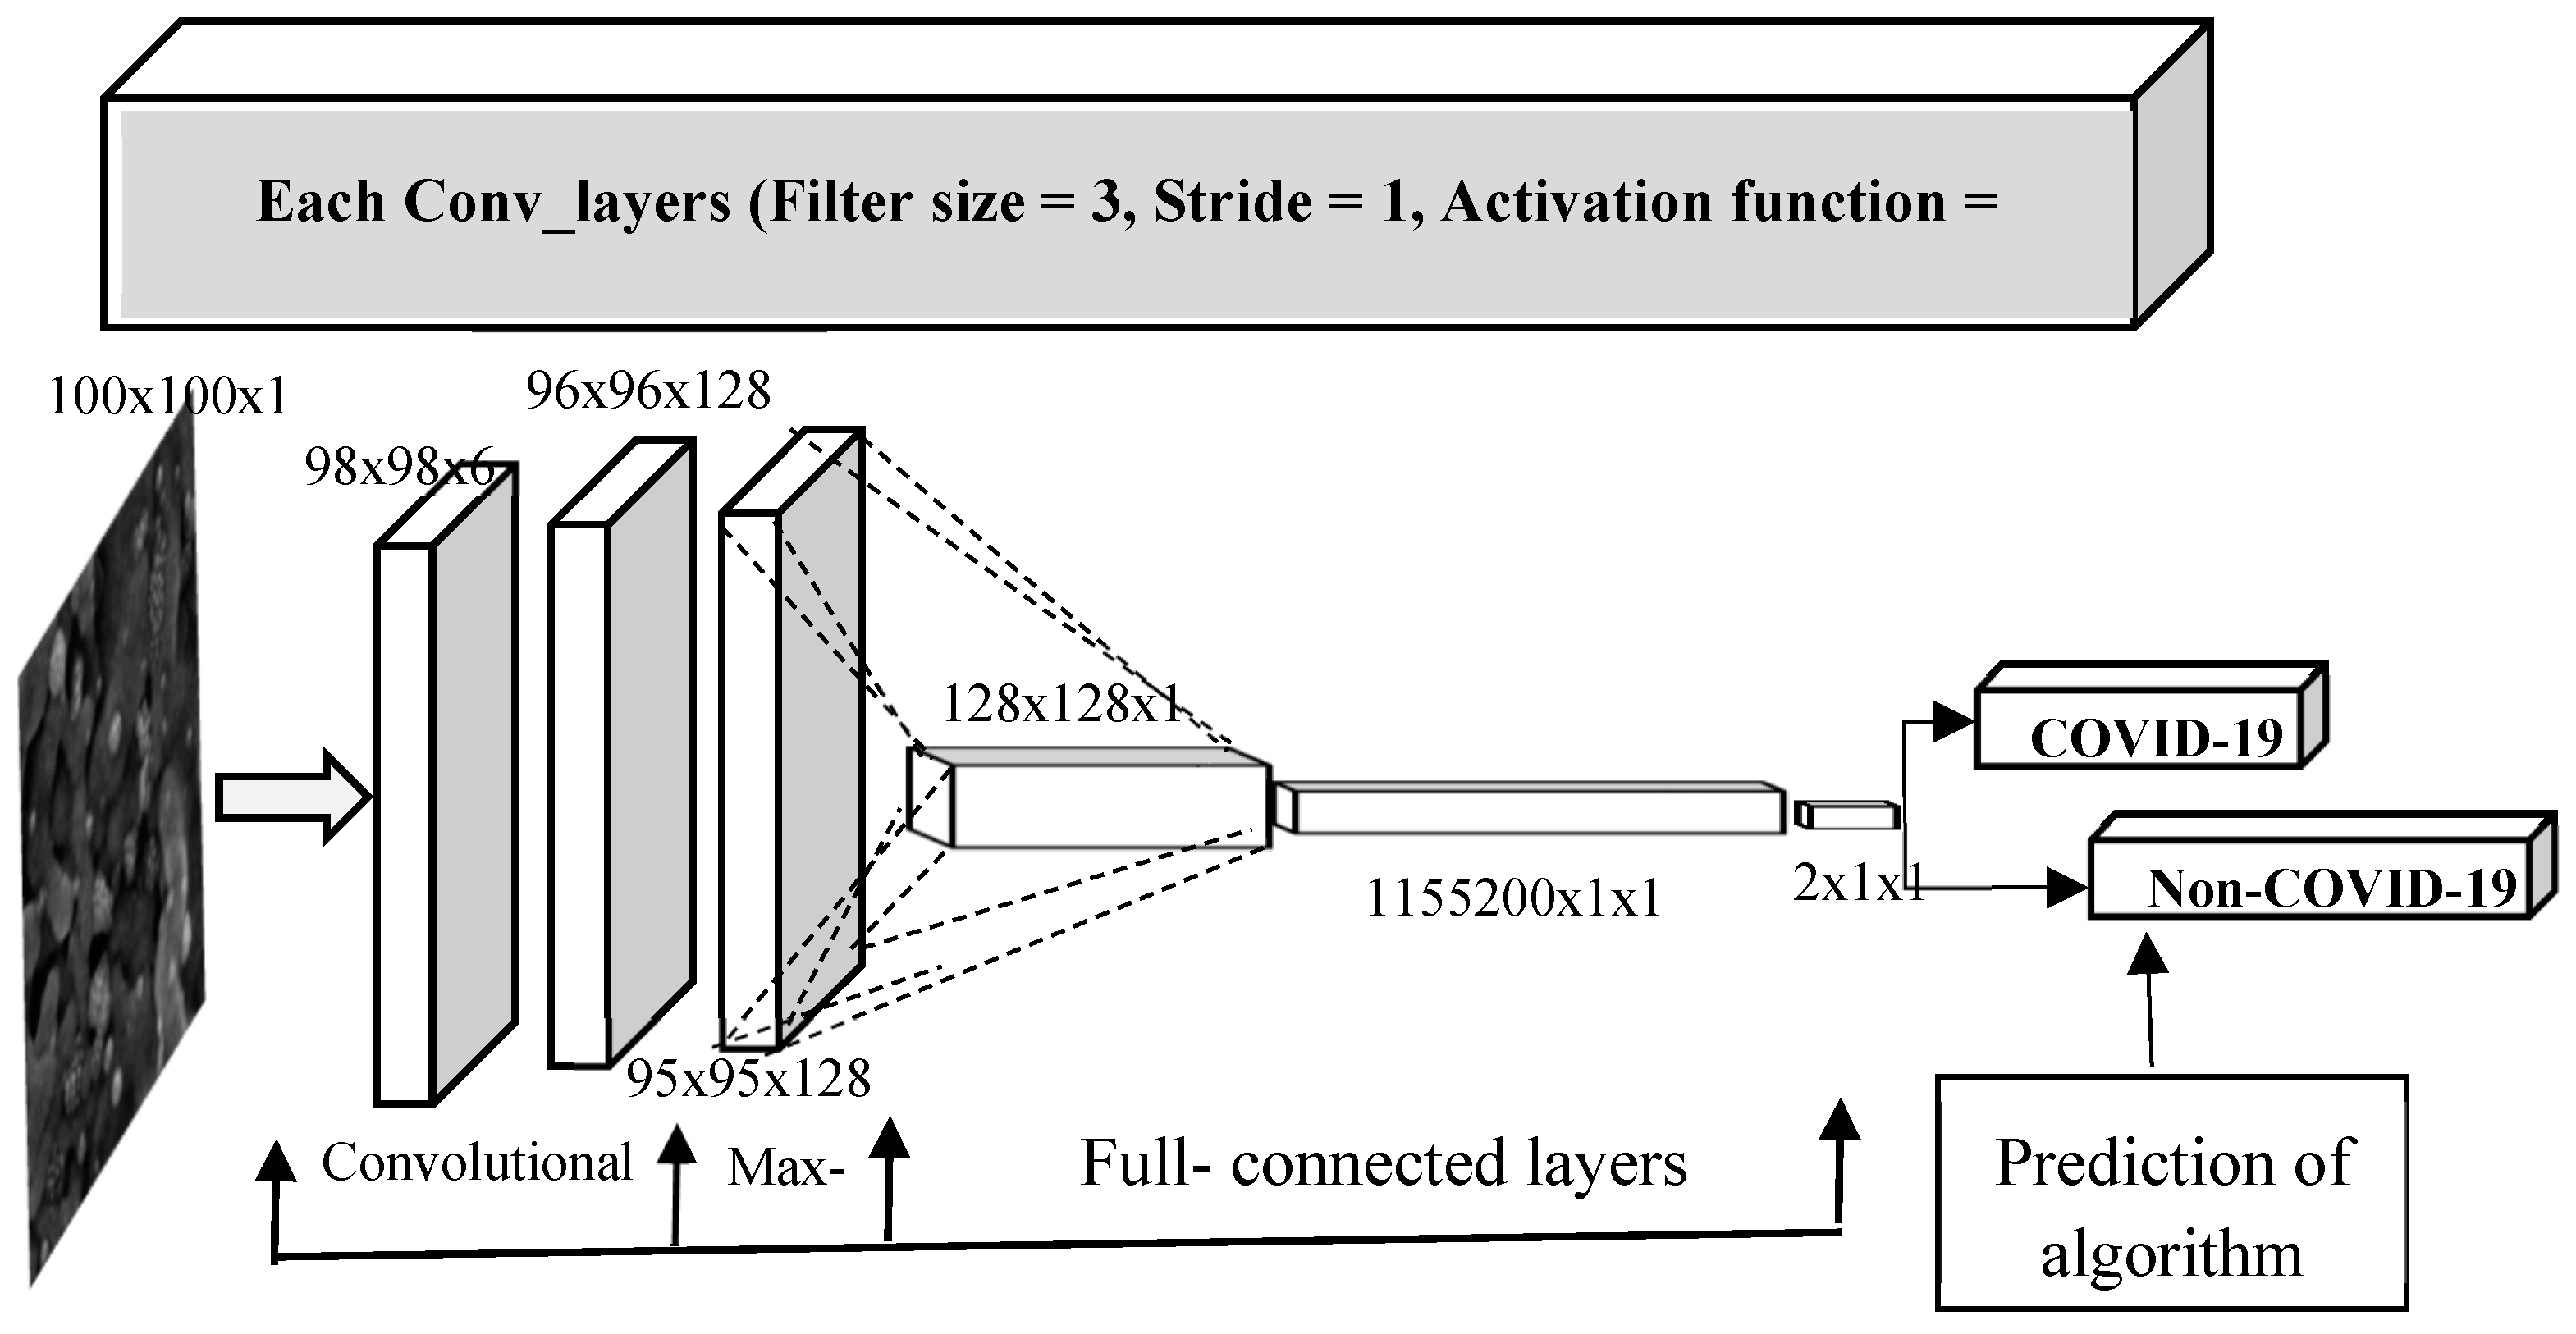
The workflow of our proposed CNN model is shown in Figure 2. With this deep convolutional neural network architecture, we focused on detecting COVID or non-COVID features from chest radiographic images (CT scans). A convolutional neural network contains multiple blocks, such as convolution layer, pooling layer, activation function and fully connected layers that can extract trainable spatial features adaptively using back-propagation algorithms [13].
In this architecture, we do not represent the Dropout layers as they do not contain parameters to be trained, nor the Max-Pooling layer, although it is displayed. After the Max-Pooling layer and after the first fully connected layer there is a Dropout layer. The pooling layer reduces the number of trainable parameters and filters out only useful features; while a fully connected layer creates a combination of one or more layers in a CNN to convert the features into a one-dimensional matrix or vector.

2.3. Transfer Learning and Tuning of Previously Trained Models

Today, very few researchers spend time designing a convolutional neural network architecture. In practice, what is done is to use a previously trained architecture and apply it to the solution of our problem by using transfer learning. Transfer learning is a procedure that creates a model using knowledge from any previous classification task to implement a new one. The transfer learning procedure initializes the previously trained weights to ensure better learning of the previously trained models over the new dataset [14]. At this point, it becomes necessary to change the output of the last layer of the previously trained model by the number of classes of the new classification task. The interesting issue about this procedure is that the model that was previously trained can be retrained on all layers (convolutional layers, pooling layers and fully connected layers) [4].
In practice, the performance of a previously trained deep learning model can be quantitatively measured. Thus, we implemented different metrics to evaluate the performance of the learning process and the predictive power of the models. These were the following: accuracy, recall, F1 score, confusion matrix and precision [15].

2.4. Learning Mode

A frequent problem in training machine learning models is overfitting, which manifests itself in good behavior in its training set (high performance) and poor performance in practice. In this work to mitigate this effect we used mini-batch training, which offers the advantage of guaranteeing faster convergence in terms of computational requirements [16]. In our case, we used a mini-batch size equal to 10.
The network weights were randomly initialized to break the network symmetry. In this case, the samples were drawn from a uniform distribution in the interval [-l, l], where l is defined as [17],
l = 6 f i n + f o u t ,
where, fin is the number of input units in the weights matrix and fout is the number of output units. The idea is that the weights start with small values to avoid saturation and slowdown in network training.
We applied an L2 regularization or weight decay with coefficient 0.001 on the convolutional layers, which strongly limits the obtaining of large weights. This helps the network to take advantage of all its weights without giving too much importance to particular weights, unless the latter have a significant influence on the error reduction [18].
We used as optimization algorithm the Stochastic Gradient Descent (SGD), which is a standard procedure widely used to solve optimization problems in neural networks, offering very good results. This procedure tends to converge to local optima that have desirable properties at the time of generalization [19].
One of the very important hyper-parameters in the training of a neural network is the learning rate, which is a key parameter whose proper adjustment can help to obtain the desired performance, since it determines how much the weights are adjusted in each iteration of the algorithm, as well as serving as a regularization mechanism. In this work, we use an adaptive technique for CNN training, which is called Adaptive Moment Estimation (Adam). This method is a variant of the combination of two other techniques: RMSprop and AdaDelta [20]. It is based on maintaining two moving averages of the gradients,
m t = β 1 m t 1 + 1 β 1 g t ,
v t = β 2 v t 1 + 1 β 2 g 2 t ,
where, m(t) is an estimate of the mean of the gradient (its first moment) and v(t) is an estimate of its variance (its second moment). The bias of the above estimates can be corrected by the following expressions,
m ^ t = m ( t ) 1 β 1 t ,
v ^ t = v ( t ) 1 β 2 t ,
and from (4) and (5), we obtain the expression for updating the weight values,
Δ x = η v ^ t + ϵ m ^ t ,
where, η is an initial learning rate which in this case was set to 0.001, ϵ is used to avoid divisions by zero which was assigned the value 10 8   ,   and β1=0.9, β2=0.99 are other constants. These values were taken for these parameters according to the criteria raised in [20]. Also in this publication ([20]) it is stated that this method is computationally efficient, requires little memory, is invariant to the diagonal scale change of the gradient and is suitable for problems that are large in terms of data/parameters.
Another regularization mechanism we use is known as dropout. This technique is relatively simple and effective, especially when stable regularization is desired, and does not act on the modification of the cost function, but on the structure of the network. The idea behind this procedure is the following: by switching off some neurons of the network during its training, it is ensured that different neurons do not co-adapt too much [21]. We added dropout layer parameters that made the training process efficient, creating a good relationship between training and model validation accuracy. In our case, two dropout layers were used with the parameter p=0.25, this value being the probability that a selected neuron remains active.

3. Experimental Results. Analysis and Discussion

3.1. Implementation

We implemented this work on Python and used cross-validation to split the database into training, testing and validation set. The Keras library was mainly used, which provides high-level access through an API to the functionalities of the Tensorflow library. On the other hand, we also implemented in Python an algorithm to obtain a Support Vector Machine model, and compare the obtained results with those achieved with the proposed convolutional neural network model. For the case of SVM, we used the Sklearn library which is based on other libraries for scientific work such as NumPy, SciPy and Matplotlib. In addition, the used Kernel was based on the Radial Basis Functions (RBF) and the parameter γ=0.00000001. The computational medium used in the implementation of both models was an Intel® Quad Core™ i7-4720HQ 2.6GHz (6M Cache, Turbo max. ...) and 16 GB of RAM.
We have used a learning rate with a value of 0.001. In all cases, 100x 100 size input images and batch size of 50 were used. These parameters made the training process efficient, creating a good relation between training and model validation precision [22]. In this work, we followed a procedure very similar to the one shown in [12].
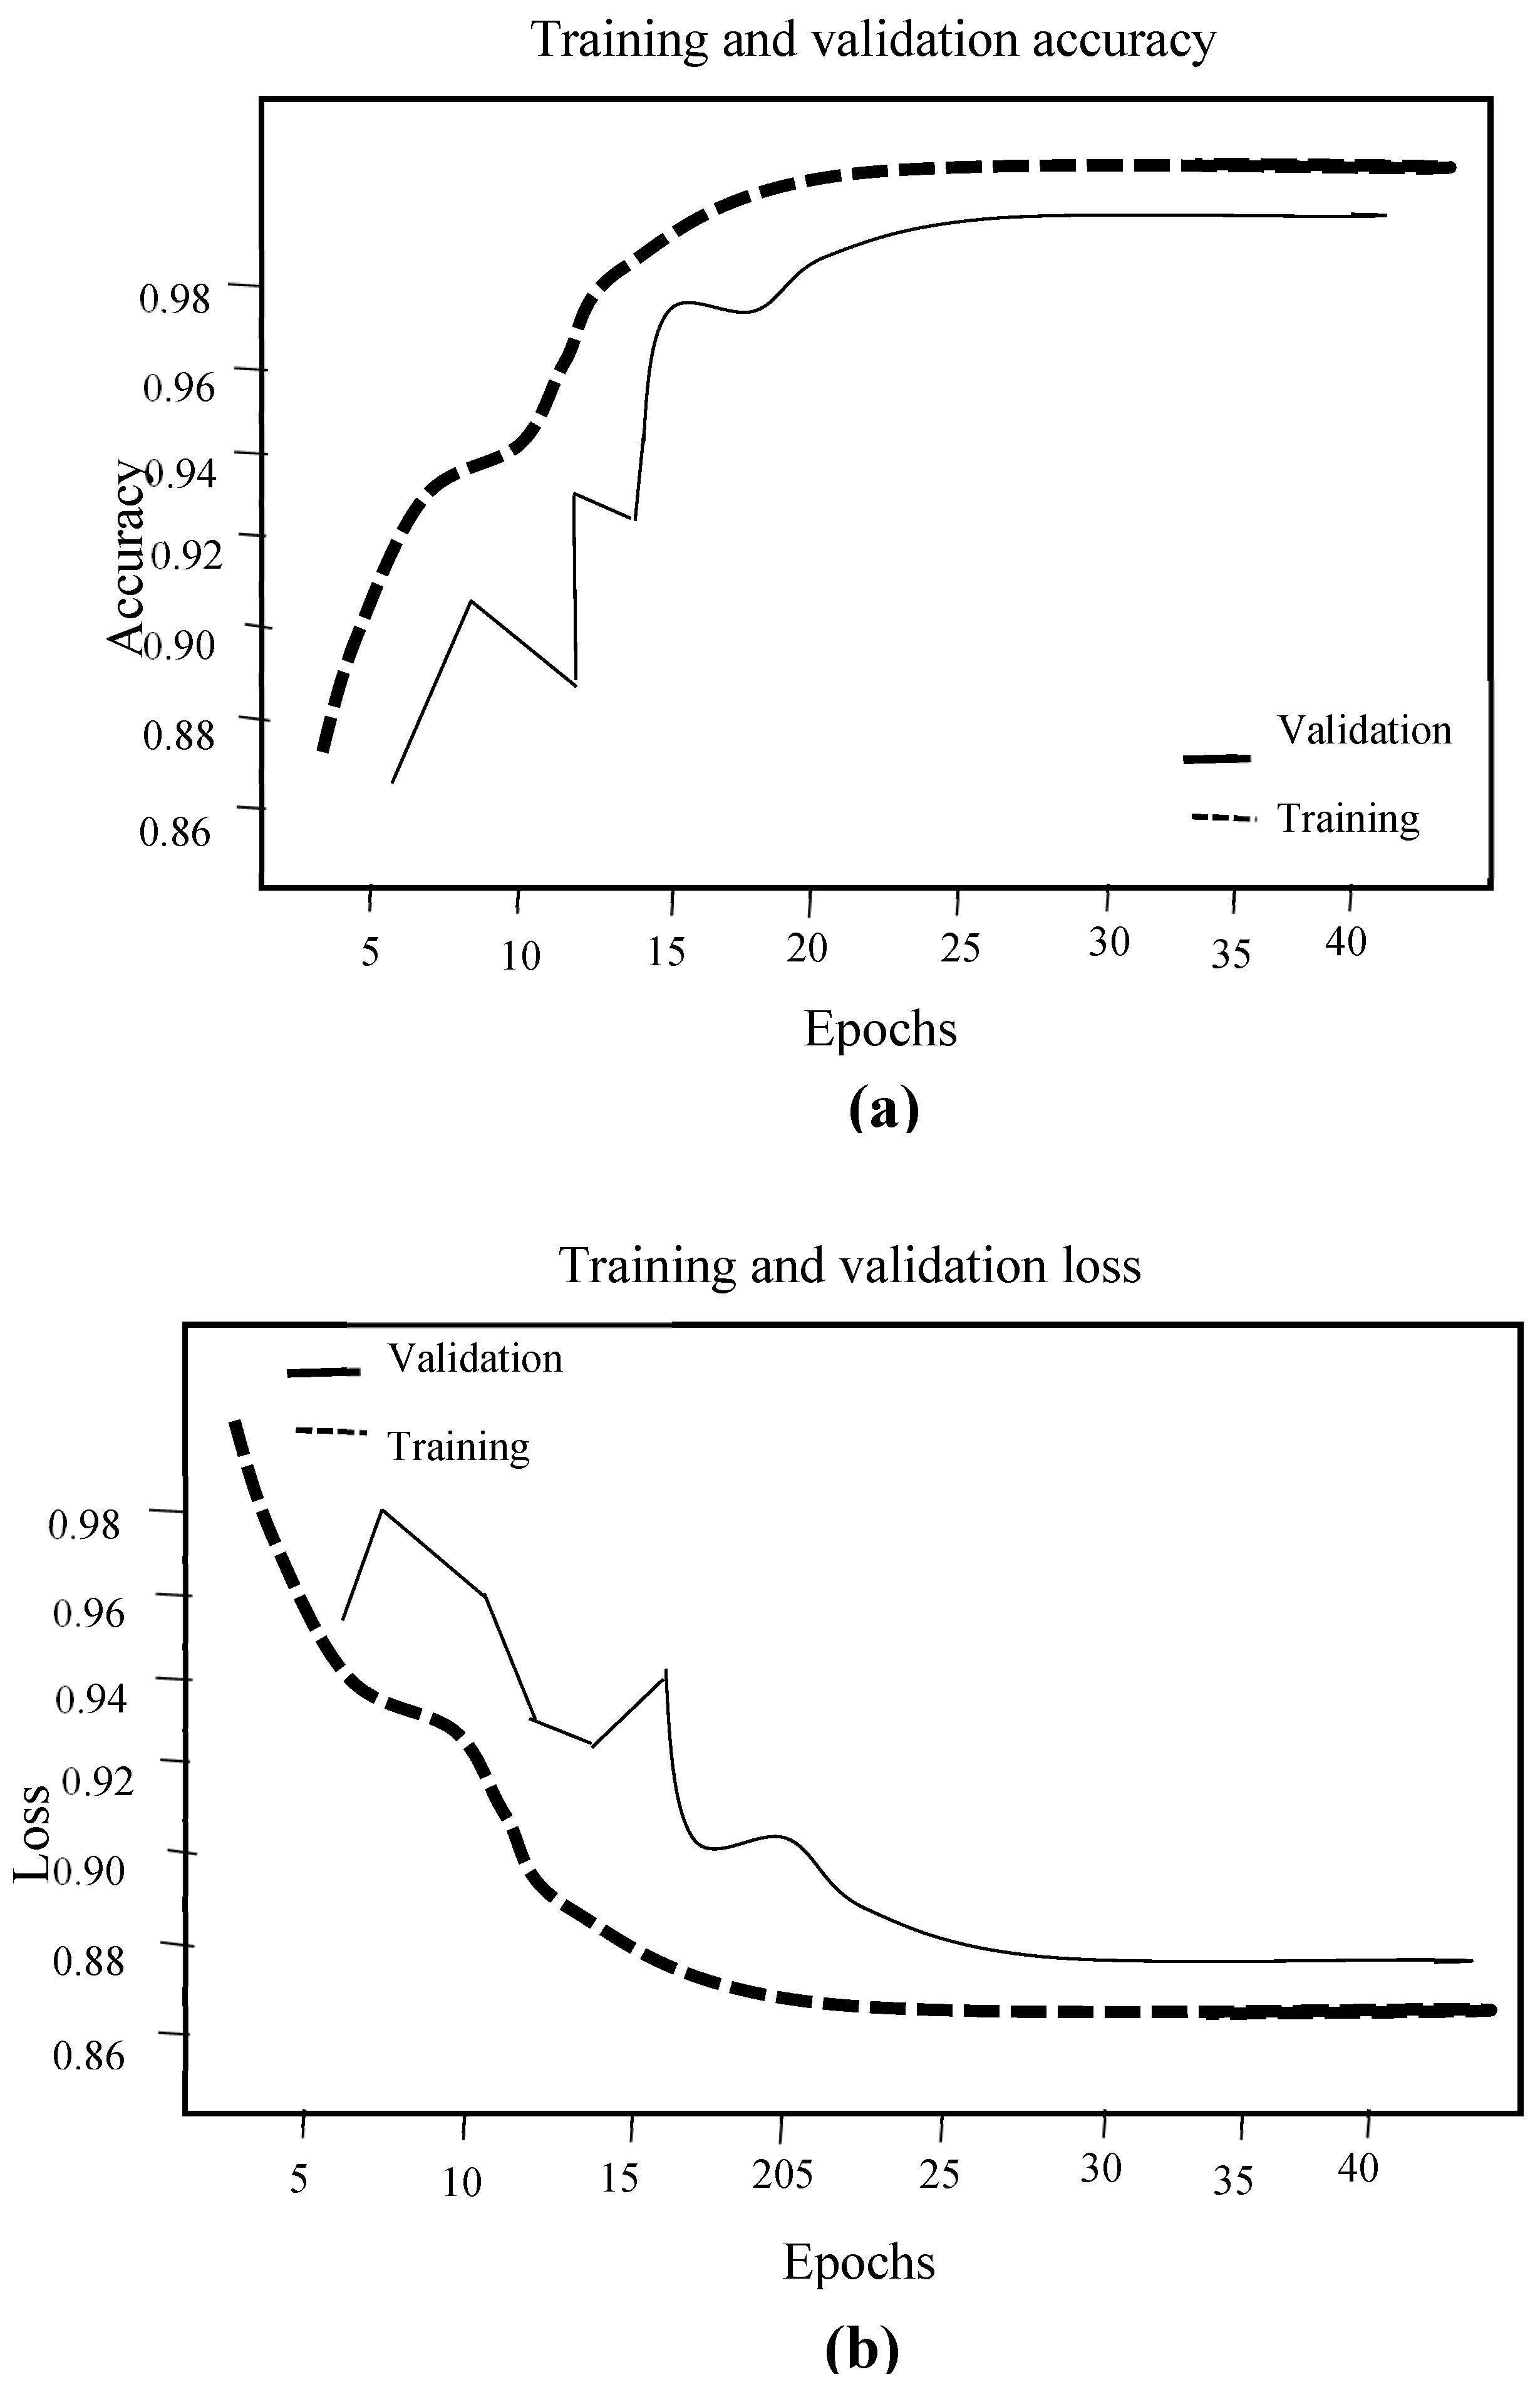
Figure 3 shows the training and validation accuracy, where some fluctuations (random spikes) can be observed in the validation accuracy as the epochs advance with training accuracy. This is indicative of some over-fitting and that the neuron weights were not uniformly adjusted in the validation process.
However, despite the lack of uniformity in learning (occurrence of some peaks at certain epochs), these peaks decreased in magnitude as the epochs progressed, indicating an adequate learning process.
In many cases, the performance of a model can be evaluated by graphical analysis, which often does not provide accurate evidence by taking a single metric. For this reason, it is necessary to use other evaluation metrics (accuracy, recall, F1 score, etc.) to perform a more in-depth comparison of models.

3.2. Comparison of the Obtained Results with CNNs and Support Vector Machine
In this paper, our goal is not to give an exhaustive explanation about SVM, which is a well-known machine learning technique. In this case our database was not very unbalanced as in [12], but we proceeded in the same way. We selected the SVM method to carry out the comparison because it has proven its effectiveness and it was necessary to compare the obtained results with CNN with a classical machine learning method.
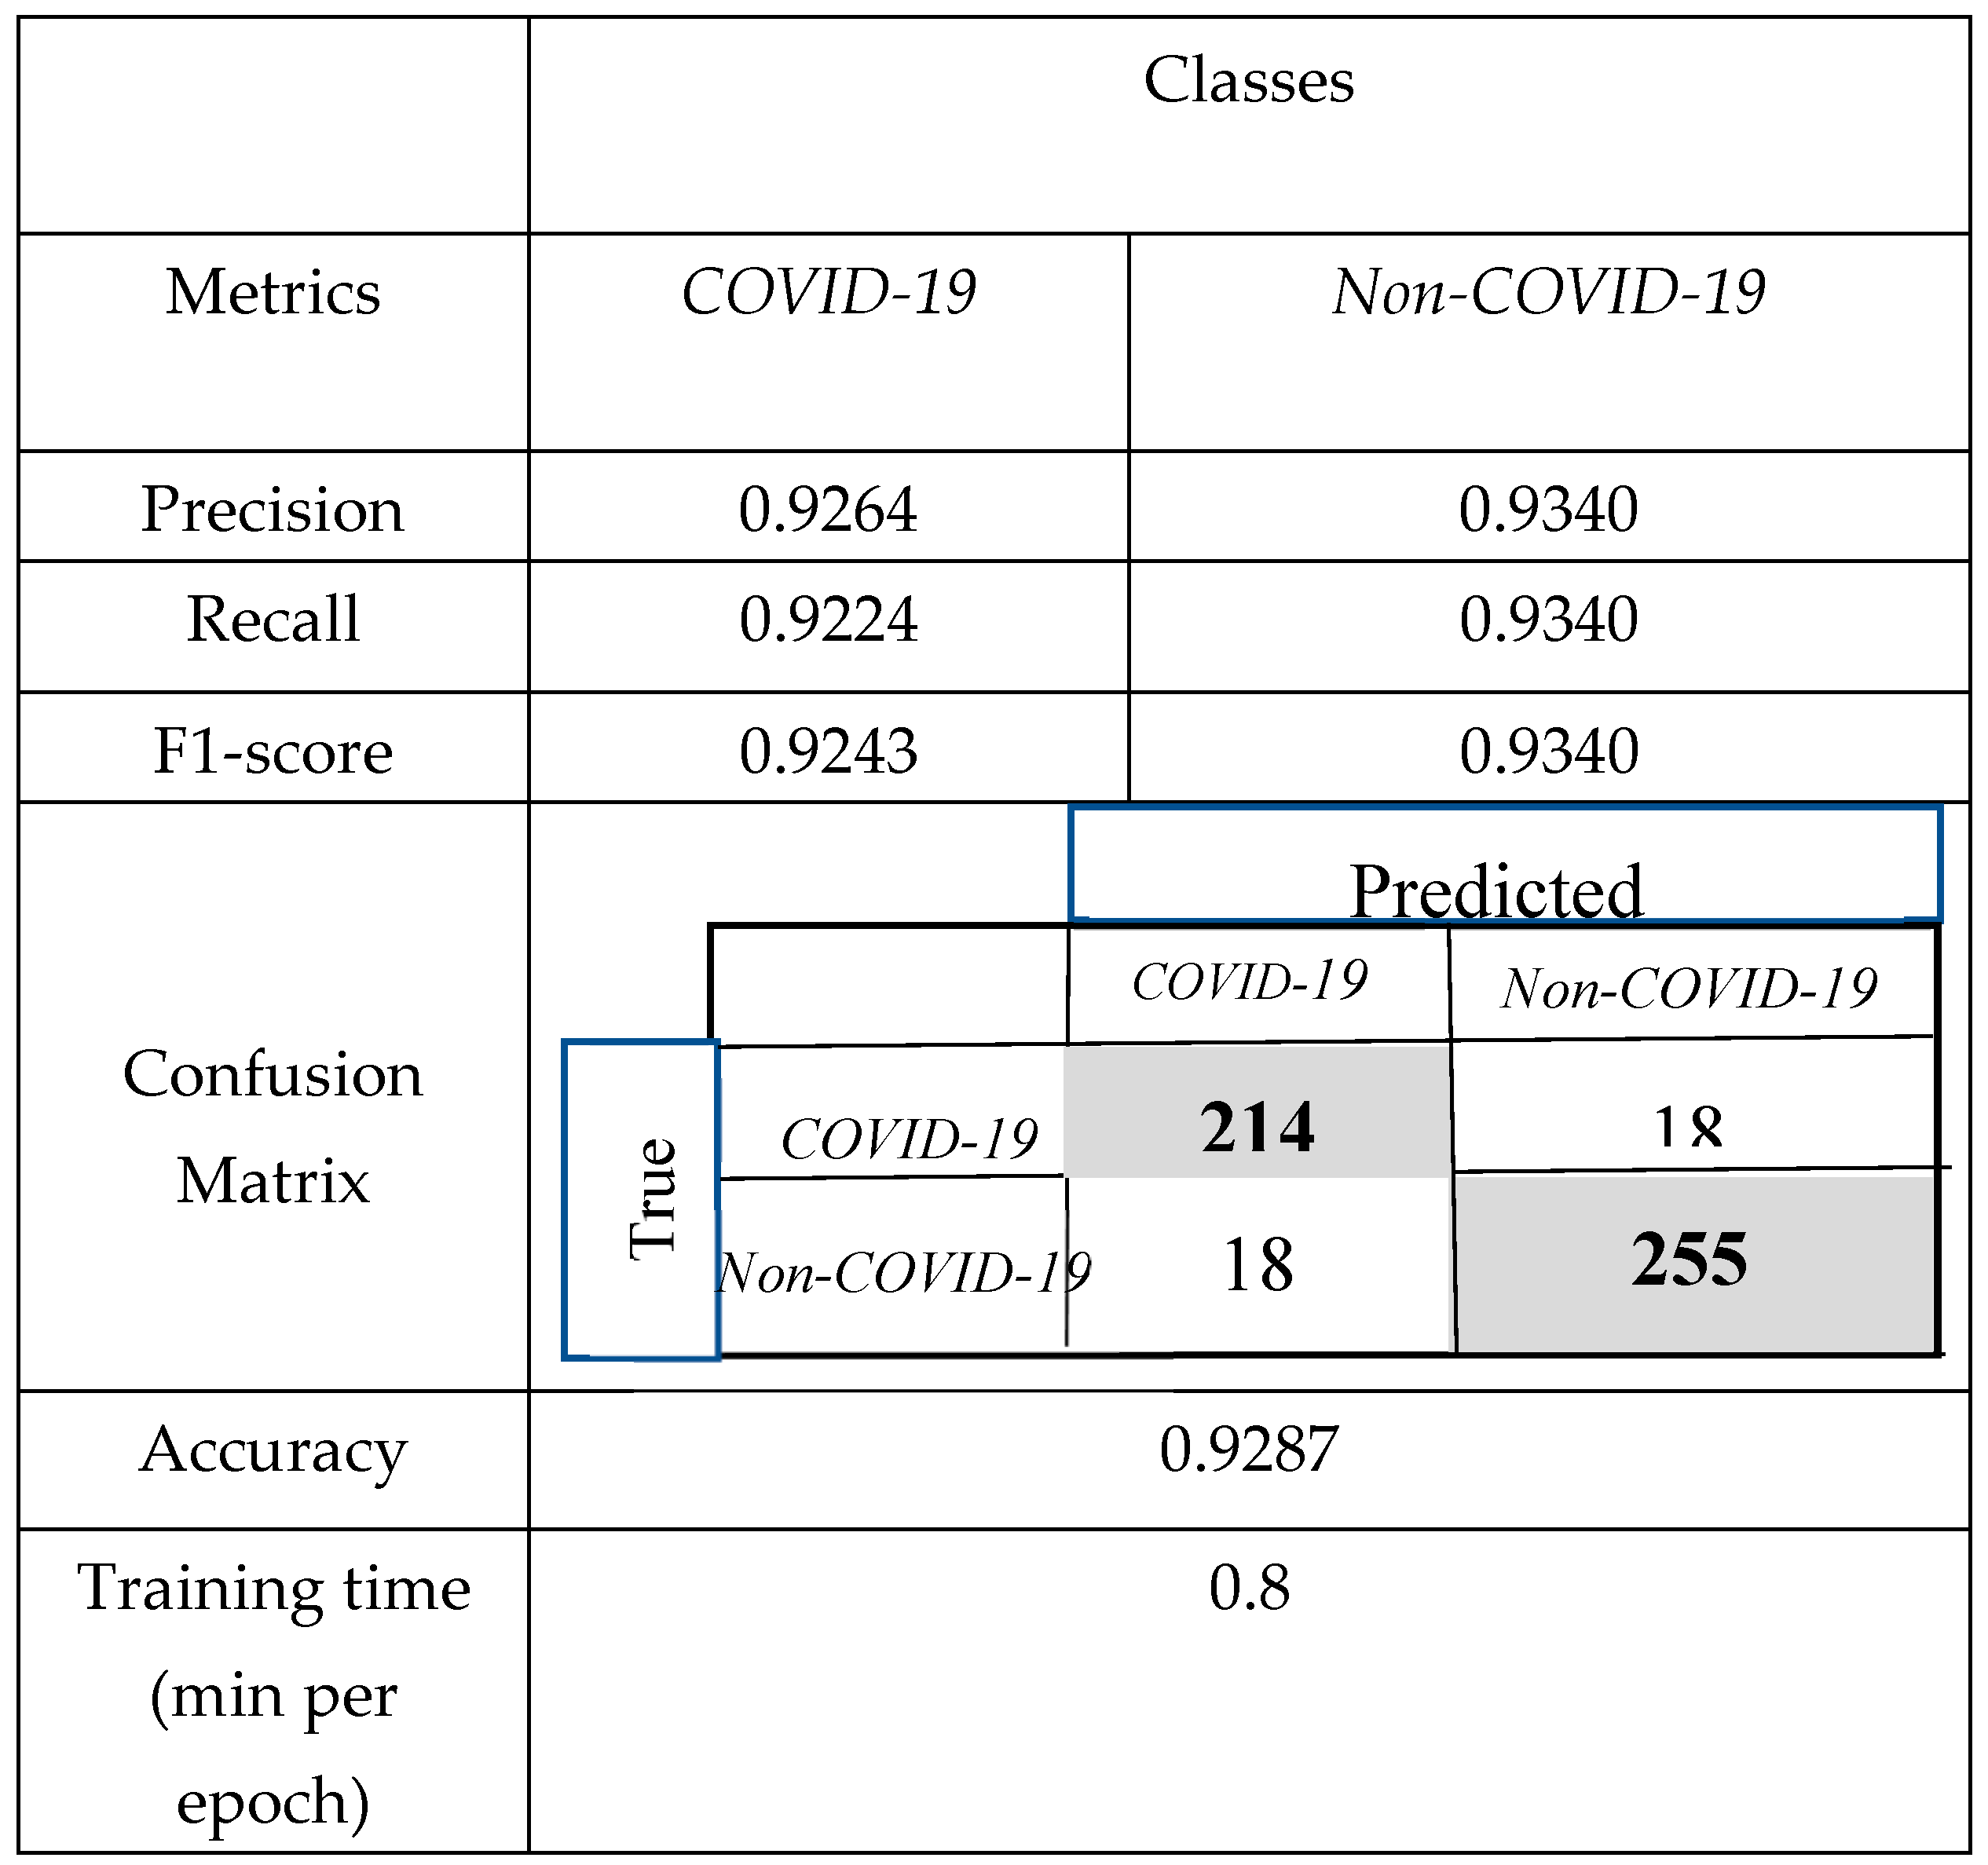
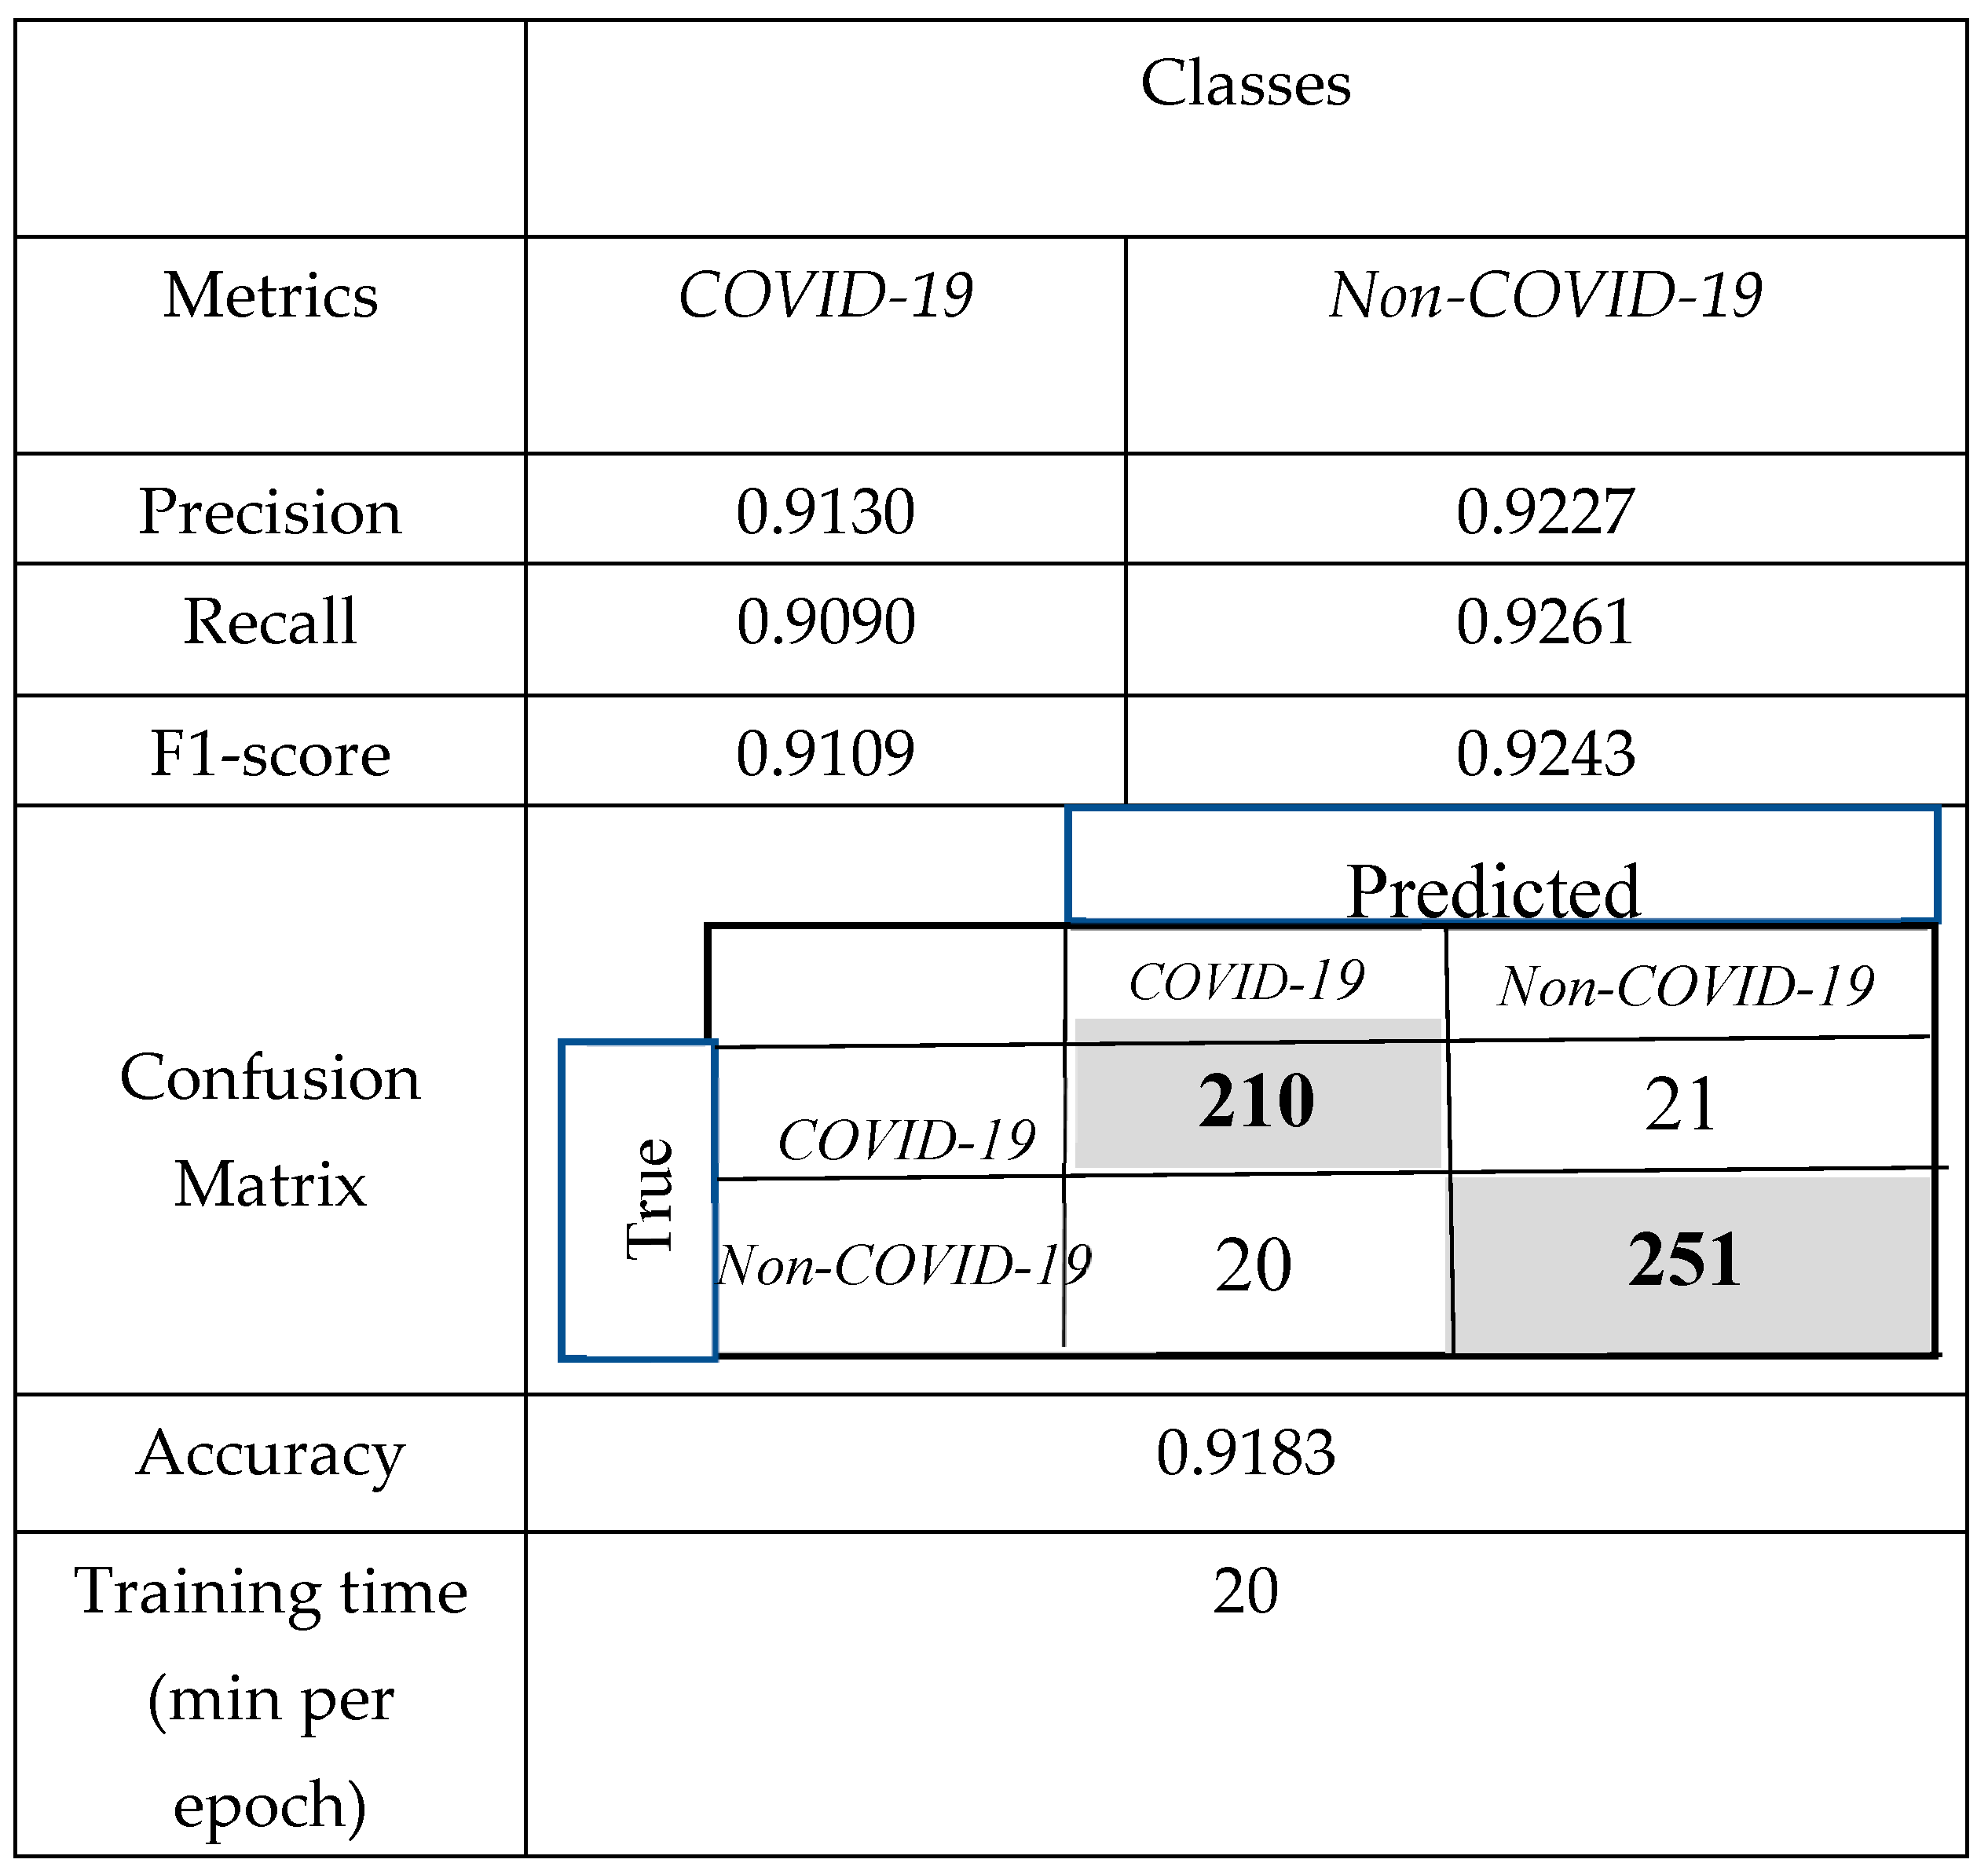
In Table I, we show the results of the evaluation metrics for the proposed CNN model. Table II shows the results of the evaluation metrics using the SVM model.
Table I. Results of the evaluation metrics for the proposed CNN model.
Preprints 110077 i001
Table II. Results of the evaluation metrics for the SVM model.
Preprints 110077 i002
From Tables I and II, we can perform a more in-depth analysis of the obtained results taking into consideration the size of the database for patients with COVID-19 and without COVID-19. For example, it is evident (something that has been pointed out in the literature) that when the database is small the machine learning models do not learn well, which is in correspondence by the amount of false positives and negatives that are classified by the models (see the confusion matrix). It should be kept in mind that the correctly classified samples are those that appear on the diagonal.
The interesting issue about these results is that when the database is small or very unbalanced, the DL model learns less than the SVM model. We had already obtained similar results in another paper published in [12]. Note that the false positives (FP) and false negatives (FN) classified by the DL model were slightly higher. It is important to note that our objective here is not to criticize DL models, since they have shown that, when adequate databases are available, the results obtained in many applications are unquestionable. Our interest is to point out that many times one wants to apply the most current state-of-the-art technique without first carrying out an analysis of the data, and not infrequently the established machine learning models (as is the case of SVM) are underestimated. The larger the database, the more the network learns, but more time for training too.
On the other hand, accuracy tends to hide classification errors for classes with fewer elements, since these classes have little weight compared to other larger classes. For this reason, the analysis should be directed towards other metrics, in order to carry out a more accurate study in validating the performance of a model. For example, when taking the F1 score, which is the harmonic mean between precision and recall, it can be observed, in Tables I and II, that the trend of a higher value in the SVM model than in the DL model is maintained.
In Figure 5 and Figure 6, we represent two graphical examples of the classification of FP and FN.
Figure 4. The three images represent chest CT scans of COVID-19 positive individuals. The classification of the DL model is for (a) negative, for (b) negative and for (c) positive. The classification by the SVM model is for (a) positive, for (b) positive and for (c) negative.
Preprints 110077 g004
This experimental study is not intended to reach definitive conclusions, as it is only the beginning of a deeper research that needs us to keep growing the database, so that we can verify if both models follow the same trend in terms of the result in the evaluation metrics; or if there is an inflection point from which the growth of the database makes the DL models start to outperform the SVM models. However, it is a reality that established machine learning methods cannot be completely discarded. For example, when observing the training time, it is evident as it was expressed, that when using the SVM model it was much lower, besides having slightly higher evaluation metrics.
The important issue in this analysis is to keep in mind the cost/benefit principle. It is true that in any research process or in a given application, the time to obtain the expected result is very important. In the case of COVID-19 disease, the response time of testing a patient was of utmost importance because of the subsequent implications that this wait could entail. For this reason, the need to refine the effectiveness in the predictions of machine learning models, and the importance and contribution of this experimental study.
In recent years it has become evident that in machine learning models, and primarily in deep learning, it is very important to have real and large databases. It is true that there are many numerical methods and transformations that can be used to augment the database [4], which for the purposes of any work can be effective, but in real medical imaging problems it is best to try to have large real databases.

4. Conclusions

In this work, we used a convolutional neural network (CNN) model and a support vector machine model, both trained in a supervised manner on chest CT images that included samples from COVID-19 infected patients and samples from healthy individuals (non-COVID-19), in order to classify and diagnose COVID-19 disease. We quantitatively compared the obtained results using both models, and the evaluation metrics, in the classification and diagnosis of COVID-19 disease, for the SVM model were slightly superior to those of the CNN model. The training time for the SVM model was also much shorter.
This experimental study is not intended to reach definitive conclusions, as it is only the beginning of a deeper research that needs us to keep growing the database, so that we can verify if both models follow the same trend in terms of the result in the evaluation metrics; or if there is an inflection point from which the growth of the database makes the DL models start to outperform the SVM models. However, it is a reality that established machine learning methods cannot be completely discarded.
In future work, we will deepen these experiments, increasing the database, analyzing the trend of both models and trying to find an inflection point that determines when the CNN model outperforms the SVM model.

References

  1. Brian Mondeja, Odalys Valdes, Sonia Resik, Ananayla Vizcaino, Emilio Acosta, Adelmo Montalván, Amira Paez, Mayra Mune, Roberto Rodríguez, Juan Valdés, Guelsys Gonzalez, Daisy Sanchez, Viviana Falcón, Yorexis González, Vivian Kourí, The IPK Virology Research Group, Angelina Díaz and María Guzmán: SARS-CoV-2: preliminary study of infectedhuman nasopharyngeal tissue by high resolution microscopy, Virology Journal, 18:149, 2021. [CrossRef]
  2. Fang, Z., Zhao, H., Ren, J., Maclellan, C., Xia, Y., Sun, M. and Ren, K.: SC2Net: A Novel Segmentation-based Classification Network for Detection of COVID-19 in Chest X-ray Images, IEEE journal of biomedical and health informatics, [online], 2022. [CrossRef]
  3. Pedro Silvaa, Eduardo Luza, Guilherme Silvab, Gladston Moreiraa, Rodrigo Silvaa, Diego Lucioc and David Menottic: COVID-19 detection in CT images with deep learning: A voting-based scheme and cross-datasets analysis, Informatics in Medicine Unlocked, Vol. 20, 100427, 2020. [CrossRef]
  4. Md. K. Islama, Sultana U. Habibaa, Tahsin A. Khana and Farzana Tasnimb: COV-RadNet: A Deep Convolutional Neural Network for Automatic Detection of COVID-19 from Chest X-Rays and CT Scans, Computer Methods and Programs in Biomedicine Update, Vol. 2, 100064, 2022. [CrossRef]
  5. H. M. Shyni and E. Chitra: A comparative study of X-ray and CT images in COVID-19 detection using image processing and deep learning techniques, Computer Methods and Programs in Biomedicine Update, Vol. 2, 1000054, 2022. [CrossRef]
  6. C. Long, H. Xu, Q. Shen, X. Zhang, B. Fan, C. Wang, H. Li, Diagnosis of the Coronavirus disease (COVID-19): rRT-PCR or CT?, European journal of radiology, Vol. 126, 108961, 2020.
  7. Shuai Wang, Bo Kang, Jinlu Ma, Xianjun Zeng, Mingming Xiao, Jia Guo, Mengjiao Cai, Jingyi Yang, Yaodong Li, Xiangfei Meng and Bo Xu: A deep learning algorithm using CT images to screen for Corona virus disease (COVID-19), European Radiology, Vol. 31: 6096–6104, 2021. [CrossRef]
  8. Abeer Aljuaid and· Mohd Anwar: Survey of Supervised Learning for Medical Image Processing, SN Computer Science, Vol. 3:292, 2022. [CrossRef]
  9. Eyad Elyan, Pattaramon Vuttipittayamong, Pamela Johnston, Kyle Martin, Kyle McPherson, Carlos F. M. García, Chrisina Jayne and Md. M. K. Sarker: Computer vision and machine learning for medical image analysis: recent advances, challenges, and way forward, Artificial Intelligence Surgery, Vol. 2:2445, 2022. [CrossRef]
  10. Geert Litjens, Thijs Kooi, Babak E. Bejnordi, Arnaud A. A. Setio, Francesco Ciompi, Mohsen Ghafoorian, Jeroen A.W.M. van der Laak, Bram van Ginneken and Clara I. Sánchez: A Survey on Deep Learning in Medical Image Analysis, arXiv:1702.05747v1 [cs.CV], 2017.
  11. Kenji Suzuki: Survey on Deep Learning Applications to Medical Image Analysis: Medical Imaging Technology, Vol. 35: 4, 2017.
  12. Laura Brito and Roberto Rodríguez: Classification of some epidemics through microscopic images by using deep learning. Comparison, Imaging and Radiation Research, Vol. 6:1, 2023. [CrossRef]
  13. A. Jeddi, M. J. Shafiee and A. Wong, A: Simple Fine-tuning Is All You Need: Towards Robust Deep Learning Via Adversarial Fine-tuning, arXiv preprint (2020) arXiv: 2012.13628, 2020.
  14. R. Yamashita, M. Nishio, R. Do and K. Togashi: Convolutional neural networks: an overview and application in radiology, Insights Imaging, Vol. 9: 4, 2018. [CrossRef]
  15. Borja-Robalino R, Monleón-Getino A, Rodellar J. Standardization of performance metrics for classifiers (Spanish). Revista Ibérica de Sistemas e Tecnologias de Informação, E30: 184-196, 2020.
  16. Fernando Berzal: Redes neuronales & Deep Learning, 2018. https://deep-learning.ikor.org.
  17. Xavier Glorot, and Yoshua Bengio: Understanding the difficulty of training deep feedforward neural networks, Proceedings of the Thirteenth International Conference on Artificial Intelligence and Statistics, PMLR 9:249-256, 2010.
  18. Andreas Weigend, David E. Rumelhart and Bernardo A. Huberman: Generalization by Weight-Elimination with Application to Forecasting, IPS’1990 Advances in Neural Information Processing Systems, Vol. 3; 875-882, 1990. https://www.researchgate.net/publication/221620459.
  19. Stephan Mandt, Matthew D. Hoffman and David M. Blei: Stochastic gradient descent as approximate Bayesian inference, Journal of Machine Learning Research, Vol. 18: 1-35, 2017. https://arxiv.org/abs/1704.04289.
  20. Diederik P. Kingma and Jimmy Ba: Adam: A Method for Stochastic Optimization, Third International Conference for Learning Representations, San Diego, 2015. https://arxiv.org/abs/1412.6980.
  21. Geoffrey E. Hinton, Nitish Srivastava, Alex Krizhevsky, Ilya Sutskever and Ruslan R. Salakhutdinov: Improving neural networks by preventing co-adaptation of feature detectors, 2012. https://arxiv.org/abs/1207.0580.
  22. T. Mahmud, M. A. Rahman and S. A. Fattah: CovXNet: A multi-dilation convolutional neural network for automatic COVID-19 and other pneumonia detection from chest X-ray images with transferable multi-receptive feature optimization, Computers in biology and medicine Vol.122:103869, 2020.
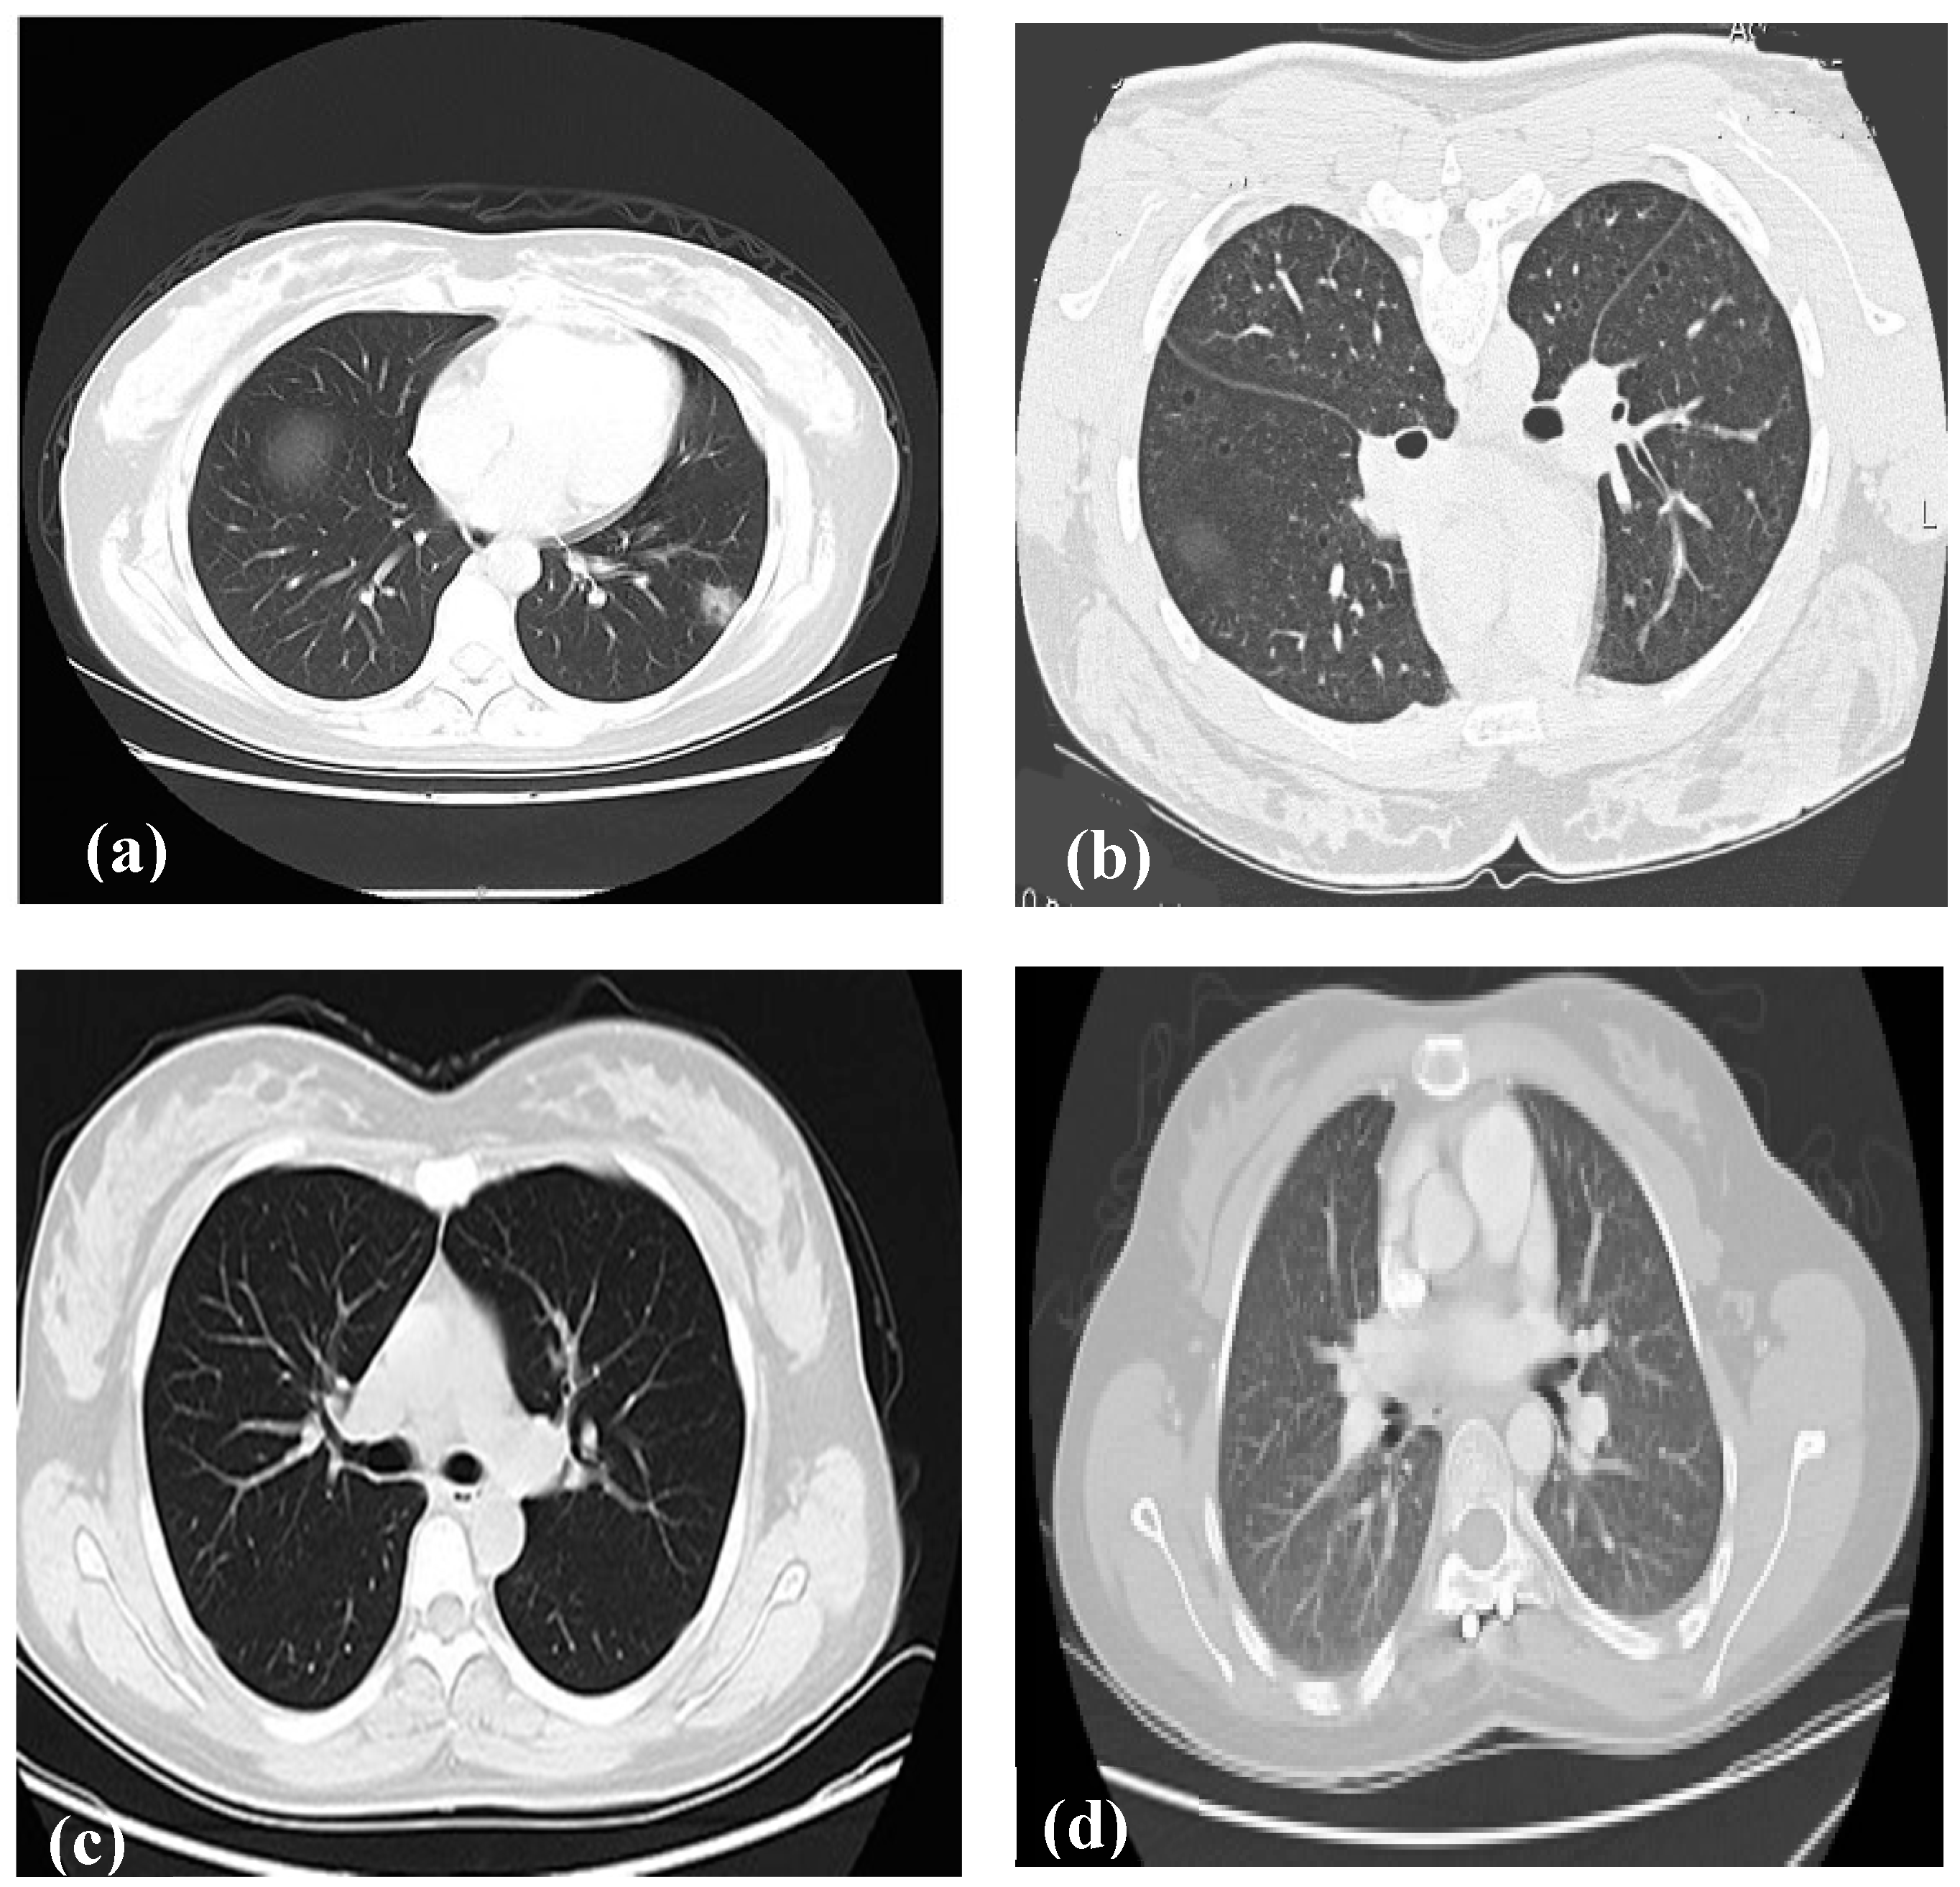
Figure 1. Sample images from CT dataset. Patients with COVID, (a) and (c). Non-COVID, (b) and (d).
Preprints 110077 g001
Figure 2. Architecture of the proposed CNN model.
Preprints 110077 g002
Figure 3. Learning curves of proposed model. (a) Accuracy, (b) Loss function.
Preprints 110077 g003
Figure 5. The three images represent chest CT scans of COVID-19 negative individuals. The classification of the DL model is for (a) negative, for (b) negative and for (c) positive. The classification by the SVM model is for (a) positive, for (b) positive and for (c) positive.
Preprints 110077 g005
Disclaimer/Publisher’s Note: The statements, opinions and data contained in all publications are solely those of the individual author(s) and contributor(s) and not of MDPI and/or the editor(s). MDPI and/or the editor(s) disclaim responsibility for any injury to people or property resulting from any ideas, methods, instructions or products referred to in the content.
Copyright: This open access article is published under a Creative Commons CC BY 4.0 license, which permit the free download, distribution, and reuse, provided that the author and preprint are cited in any reuse.
Prerpints.org logo

Preprints.org is a free preprint server supported by MDPI in Basel, Switzerland.

Subscribe

© 2024 MDPI (Basel, Switzerland) unless otherwise stated