3. Results for the Hybrid EOS
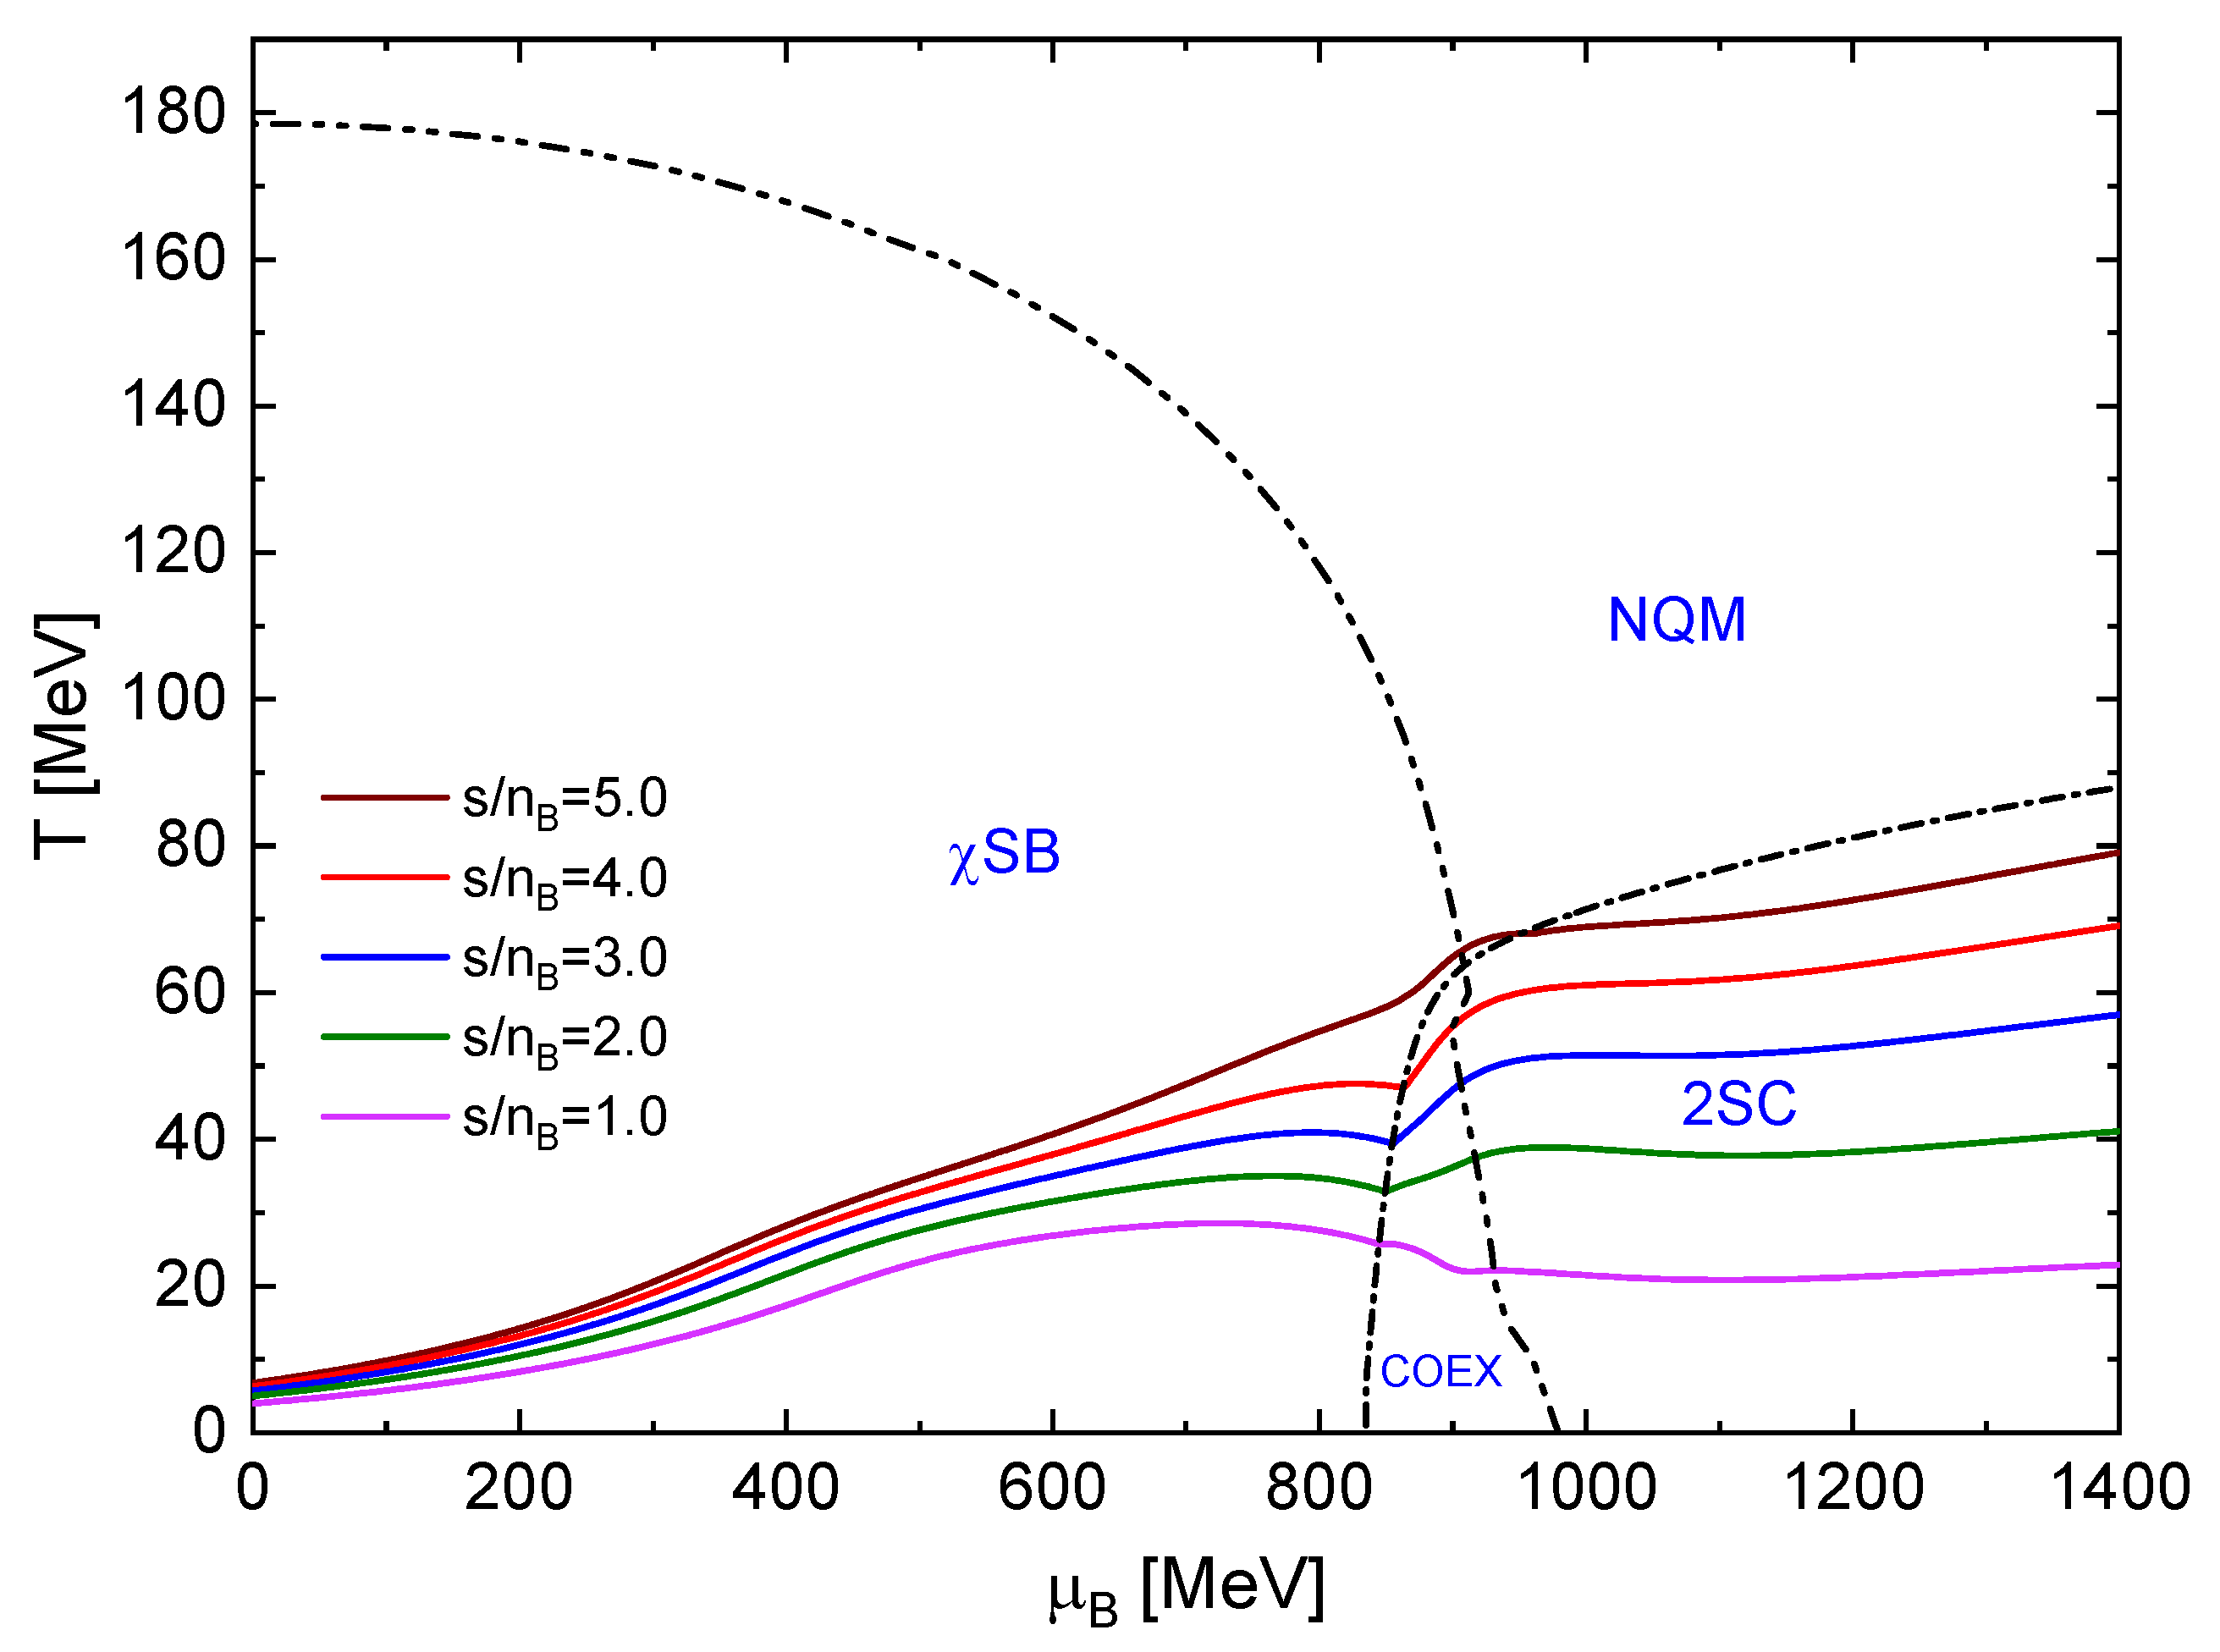
Before presenting our results for the hybrid EOS, we show in
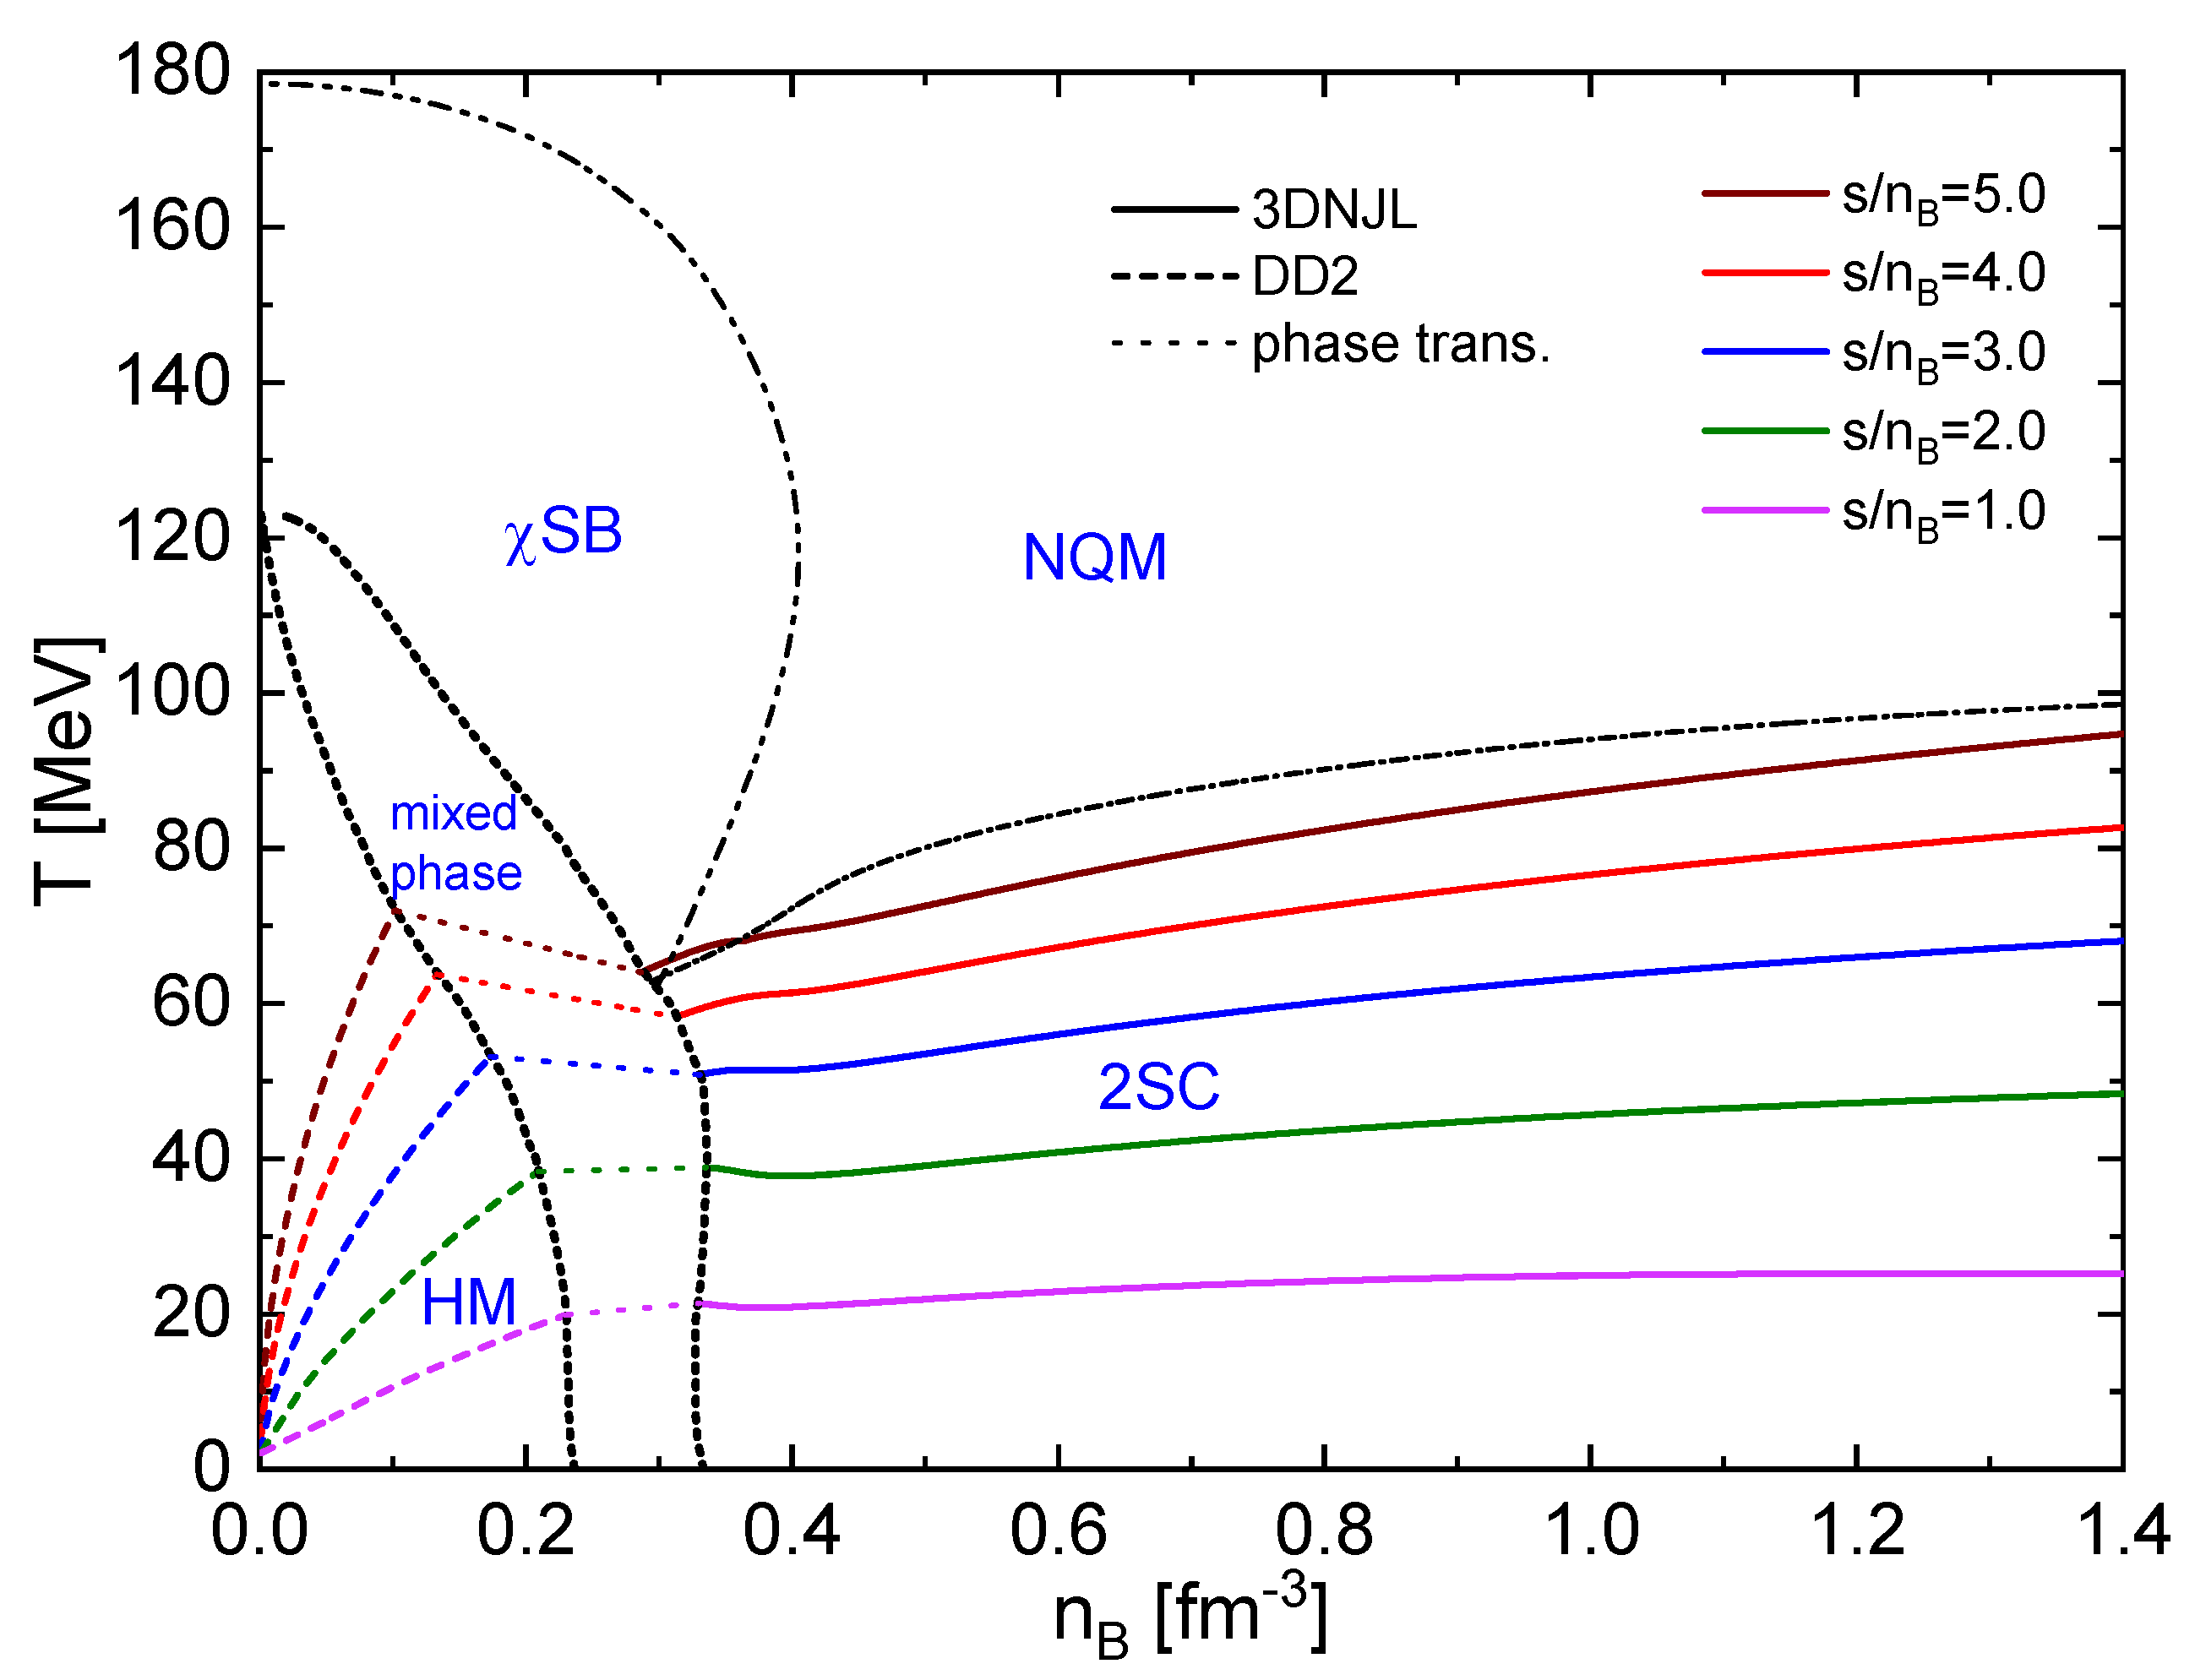
Figure 1 the phase diagram of the nonlocal chiral quark model in the plane of temperature
T and baryon chemical potential
. Four regions are shown which correspond to the chiral symmetry breaking (
SB), normal quark matter (NQM), and two-flavor color superconducting (2SC) phases as well as a coexistence (COEX) region of 2SC and
SB phases. We have considered the same set of parameters as in [
5] for the QM EOS. The dash-double dotted line corresponds to the chiral crossover transition, corresponding to the peak of the chiral susceptibility (as defined in Ref.[
5]), and the dash-dotted line corresponds to a second-order phase transition to the 2SC phase, where the color symmetry is broken. In the normal quark matter phase (NQM), chiral symmetry is restored (partially restored if current quark masses are finite). We displayed as well different solid lines with fixed entropy per baryon number density (
).
From now on, we will begin the description of the hybrid EOS. In
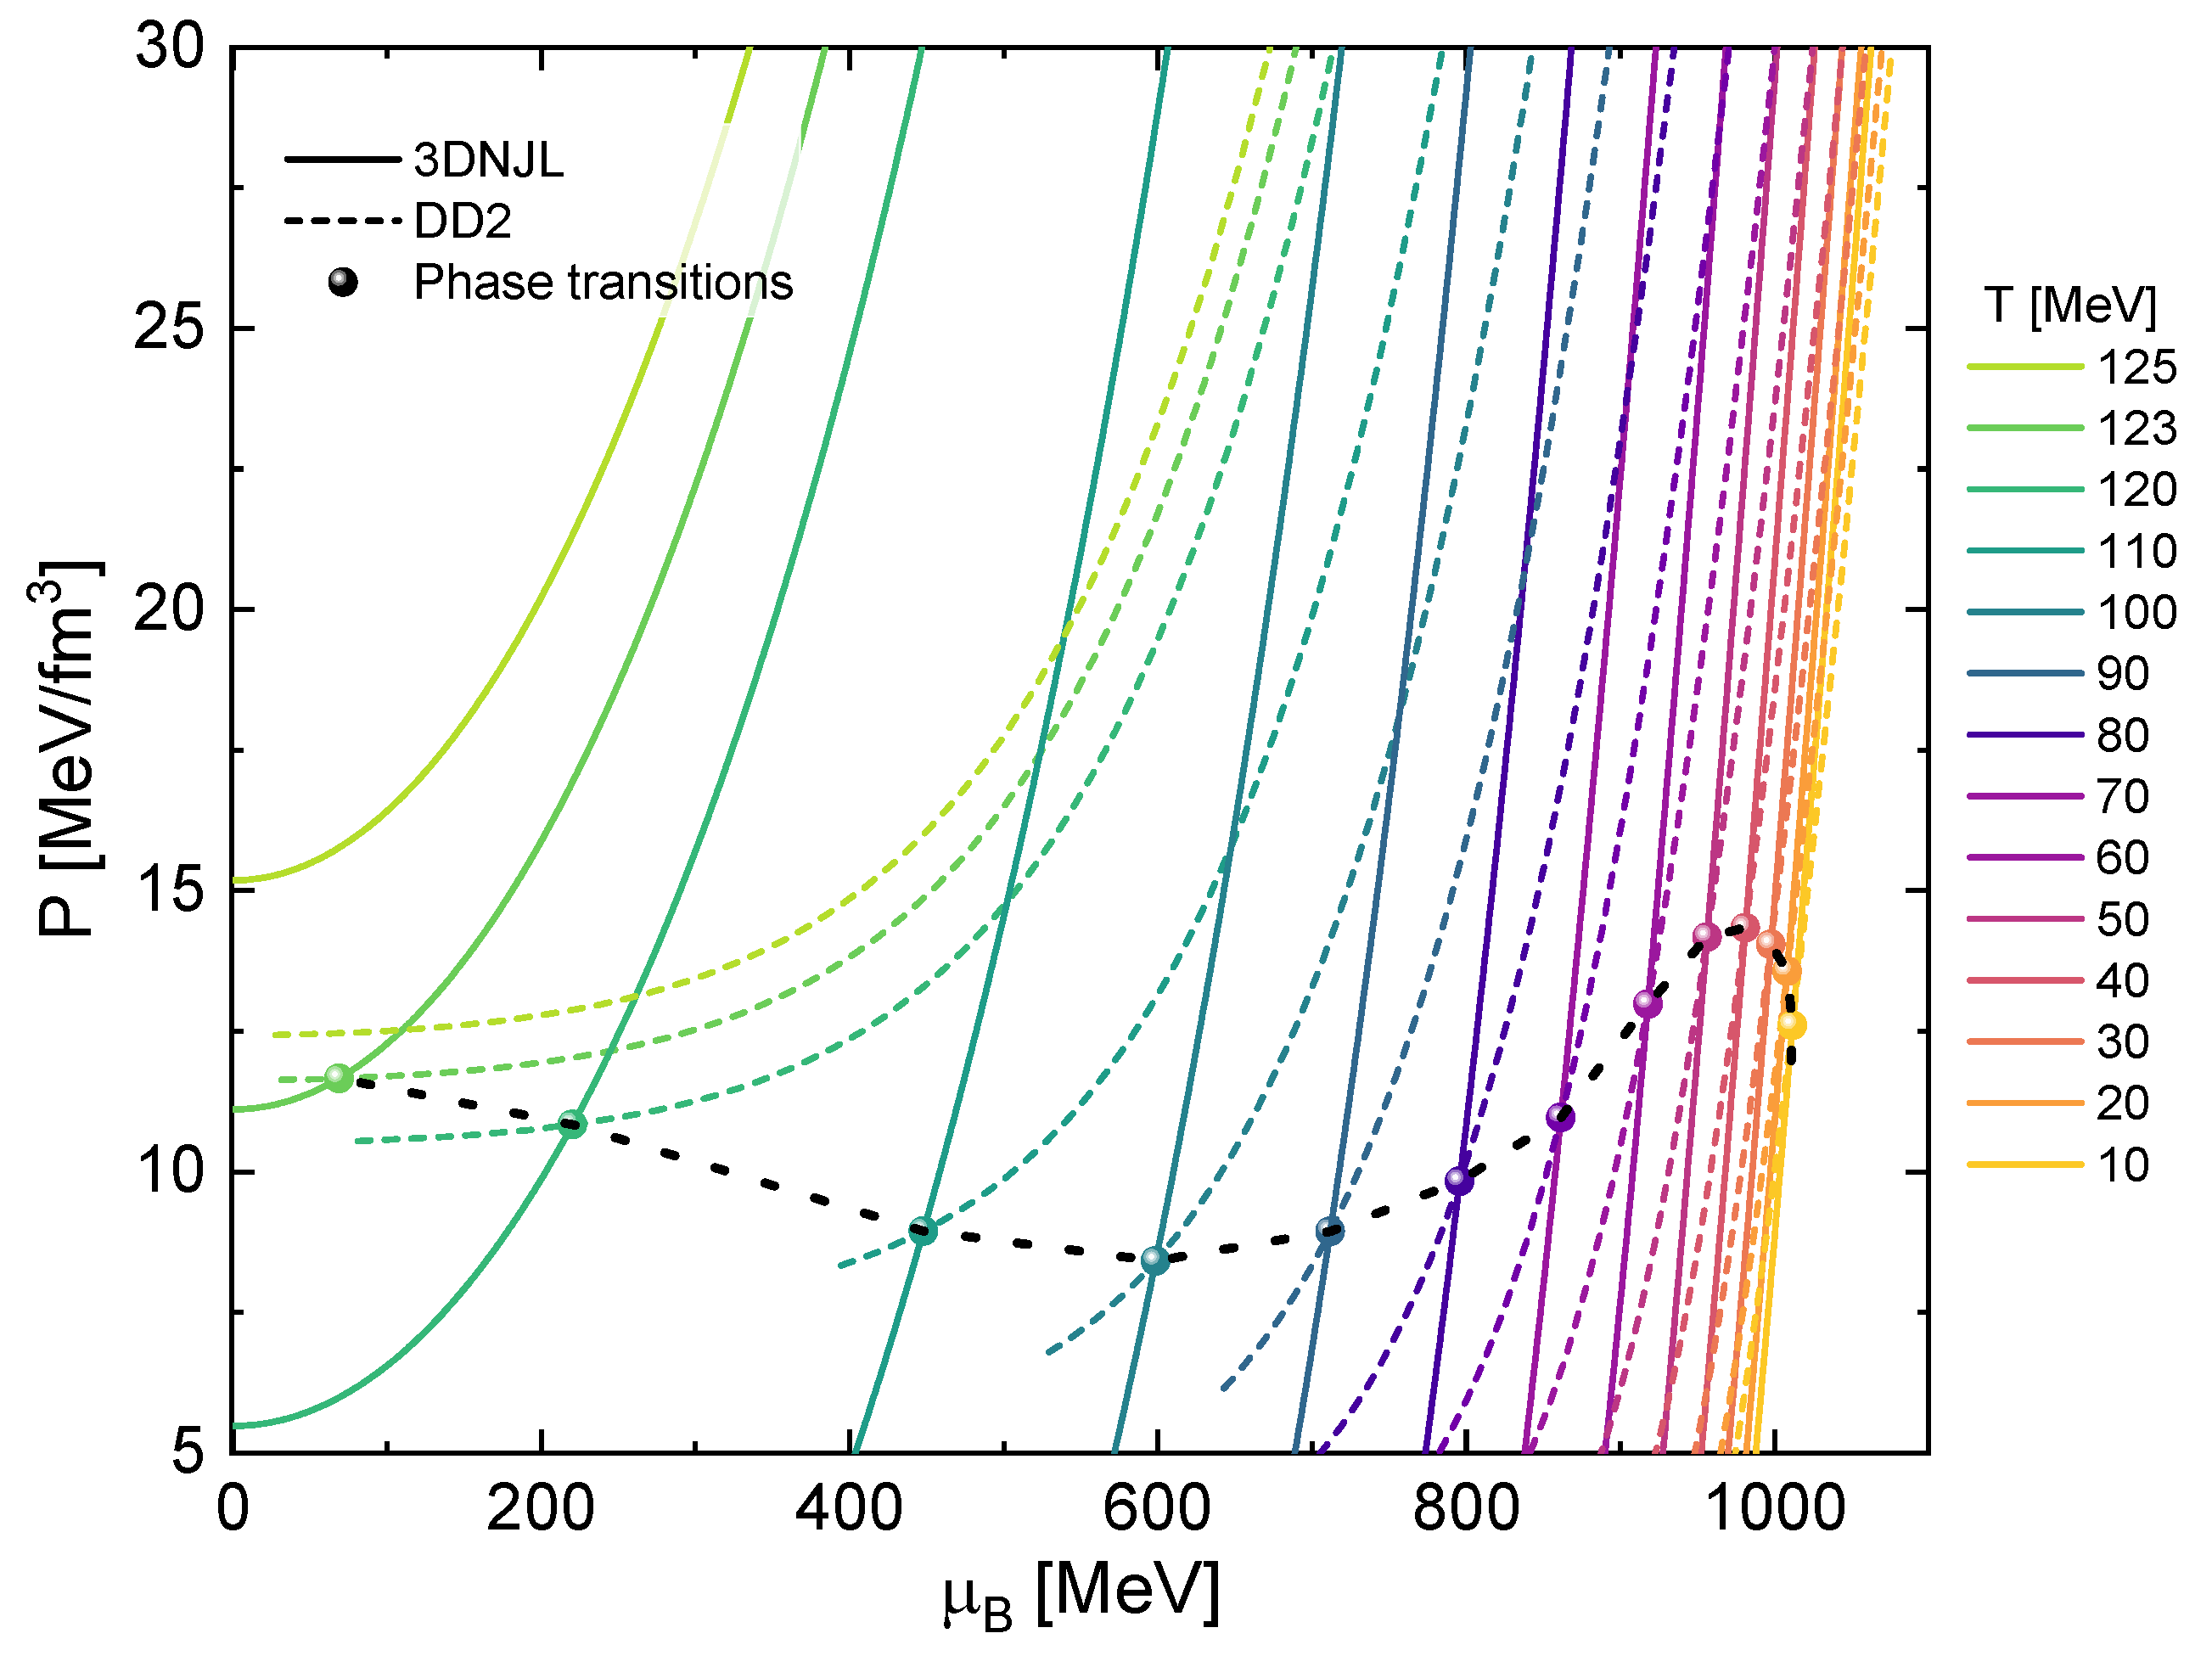
Figure 2, we display the pressure as a function of the baryon chemical potential for both the QM and the HM EOS, across various temperatures. The intersections are highlighted with dots and correspond to the Maxwell construction of first-order phase transitions for different isotherms. We observe that as the temperature increases, the crossing shifts to lower baryon chemical potentials. In
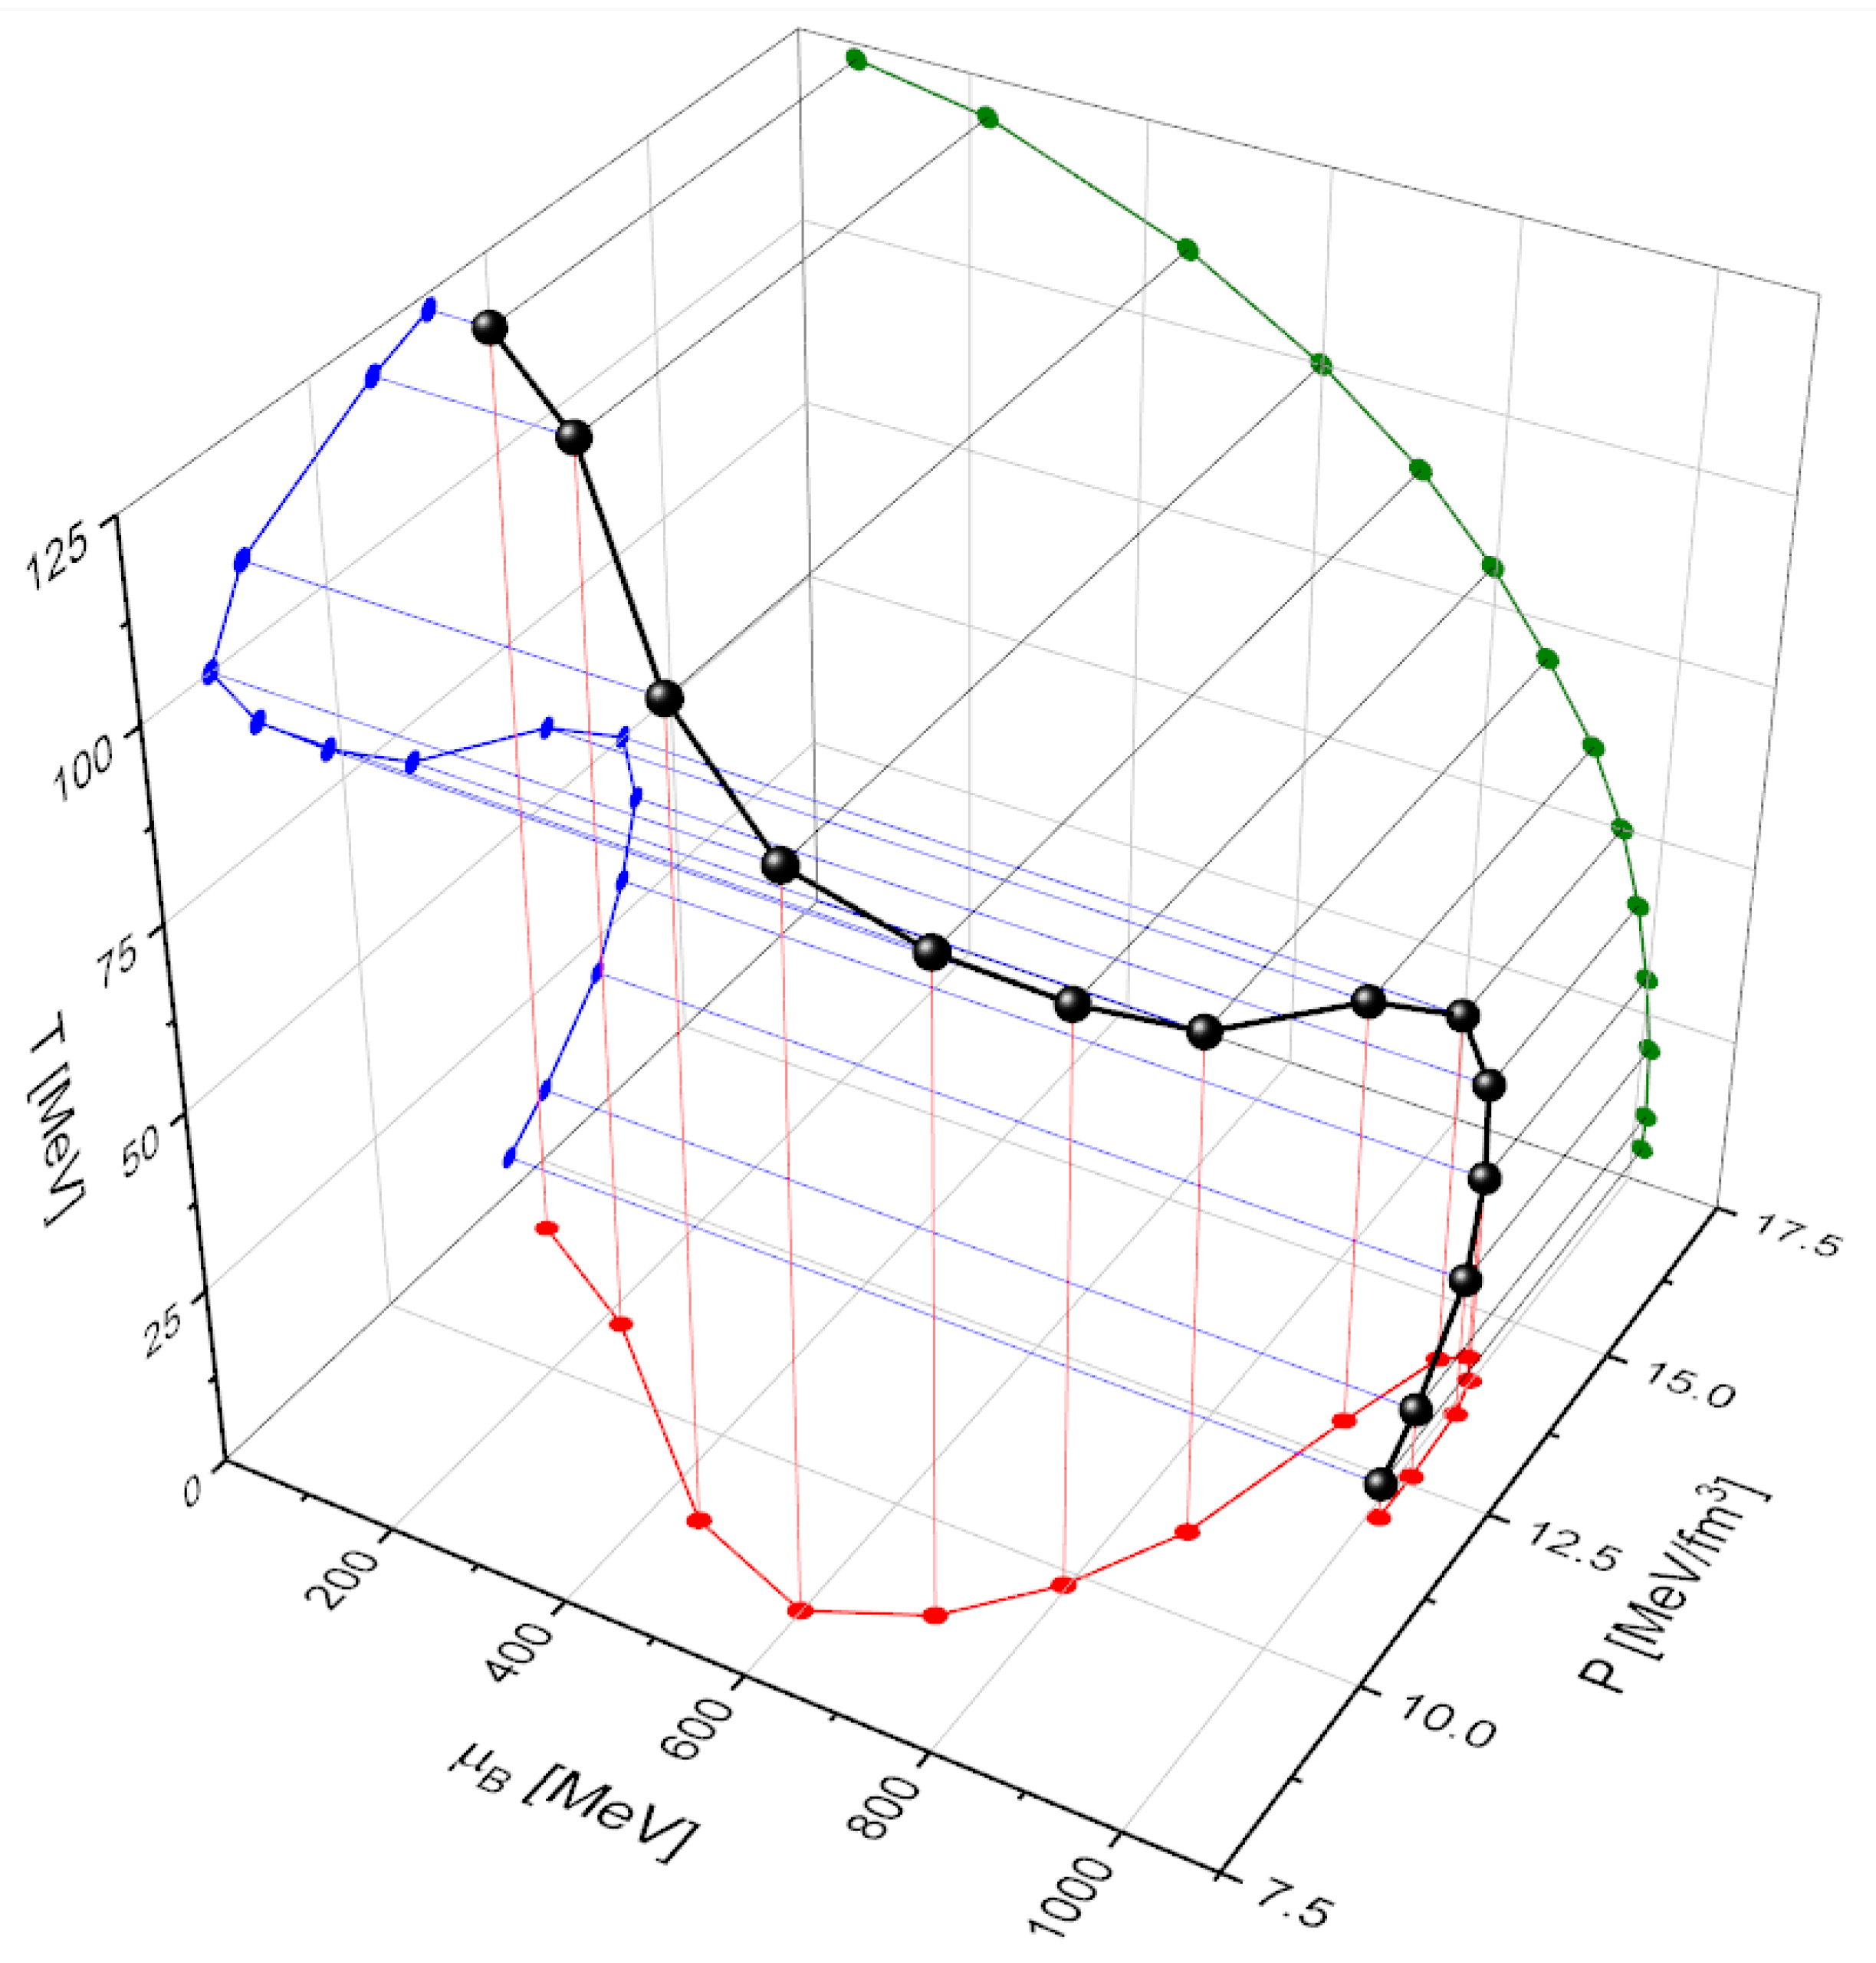
Figure 3, we present the
transition points that result from these Maxwell constructions, along with their corresponding two-dimensional projections. The
projection corresponds to the one presented in
Figure 2, while the
projection will be discussed further in
Figure 4.
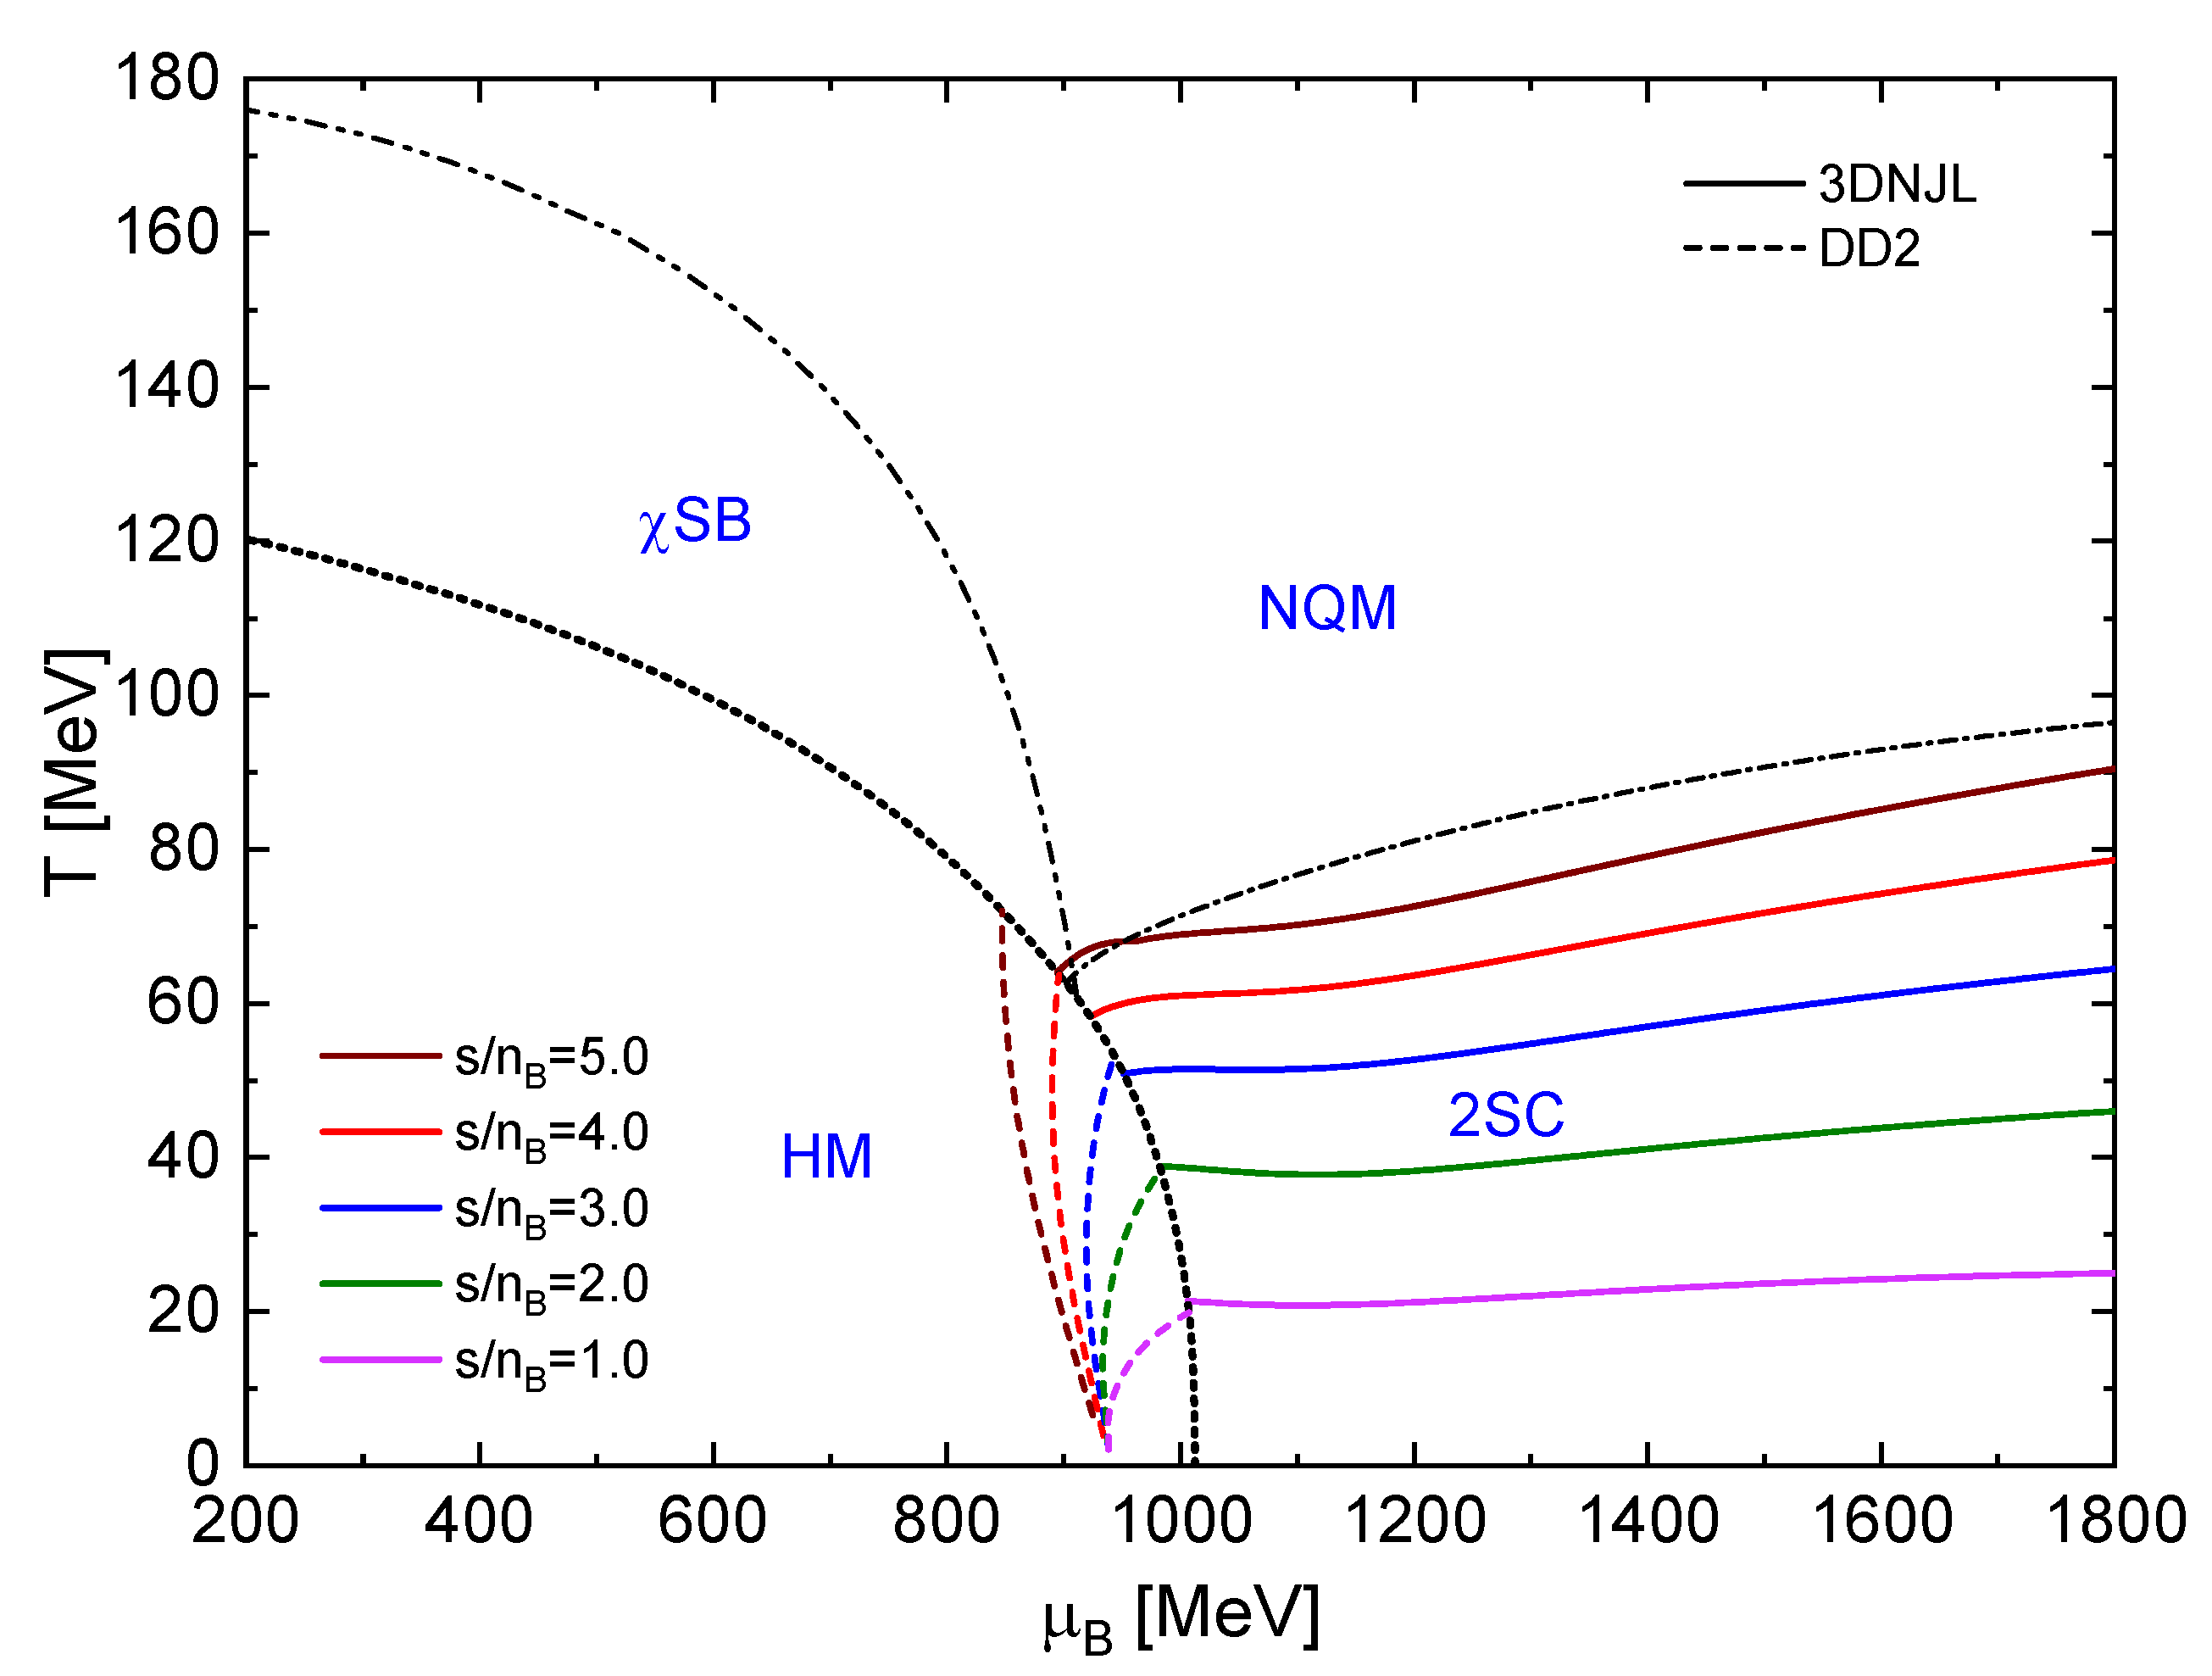
In
Figure 4, we present the
phase diagram. The isothermal hadron-to-quark-matter phase transition is shown as a black dotted line, and the colored curves correspond to different fixed values of
. The dash-double dotted black line represents the chiral crossover transition calculated at constant T. The dash-dotted black curve represents the second-order transition from the 2SC phase to the NQM phase. The solid-colored lines correspond to the QM phase, while the dashed lines represent the HM phase. Note that the lines of constant
exhibit a small jump between the HM and QM phases. The difference between the HM and QM entropy per baryon is denoted by
. Up to
, the curve of the HM phase remains below its corresponding QM curve. This corresponds to an enthalpic transition [
7], supporting the conjecture that the appearance of thermal twins is linked to this transition (see Ref. [
8] for details). For
, the jump is reversed. Note that for
, when the corresponding QM curve begins, it does so in the NQM phase and not in the 2SC phase (this is the peak that will be seen later in the squared speed of sound
).
In
Figure 5, we depict the
phase diagram. We observe a jump in the baryon density during the transition from HM to QM. In this Maxwell-like construction, for a given
, the phases have different temperatures at the transition. For the phase transition intermediate values, we propose a mixed-phase construction similar to the Glendenning scenario [
9]. Once the isothermal phase transition (dotted line in
Figure 4) is established, the values of
T,
,
s,
,
P and
for each phase are the corresponding values for the
and
at the intersection between the isothermal transition line and each line with constant
, while the intermediate values along the phase transition are proposed according to the following relation
where
Y stands for
T,
,
s,
,
P and
.
In
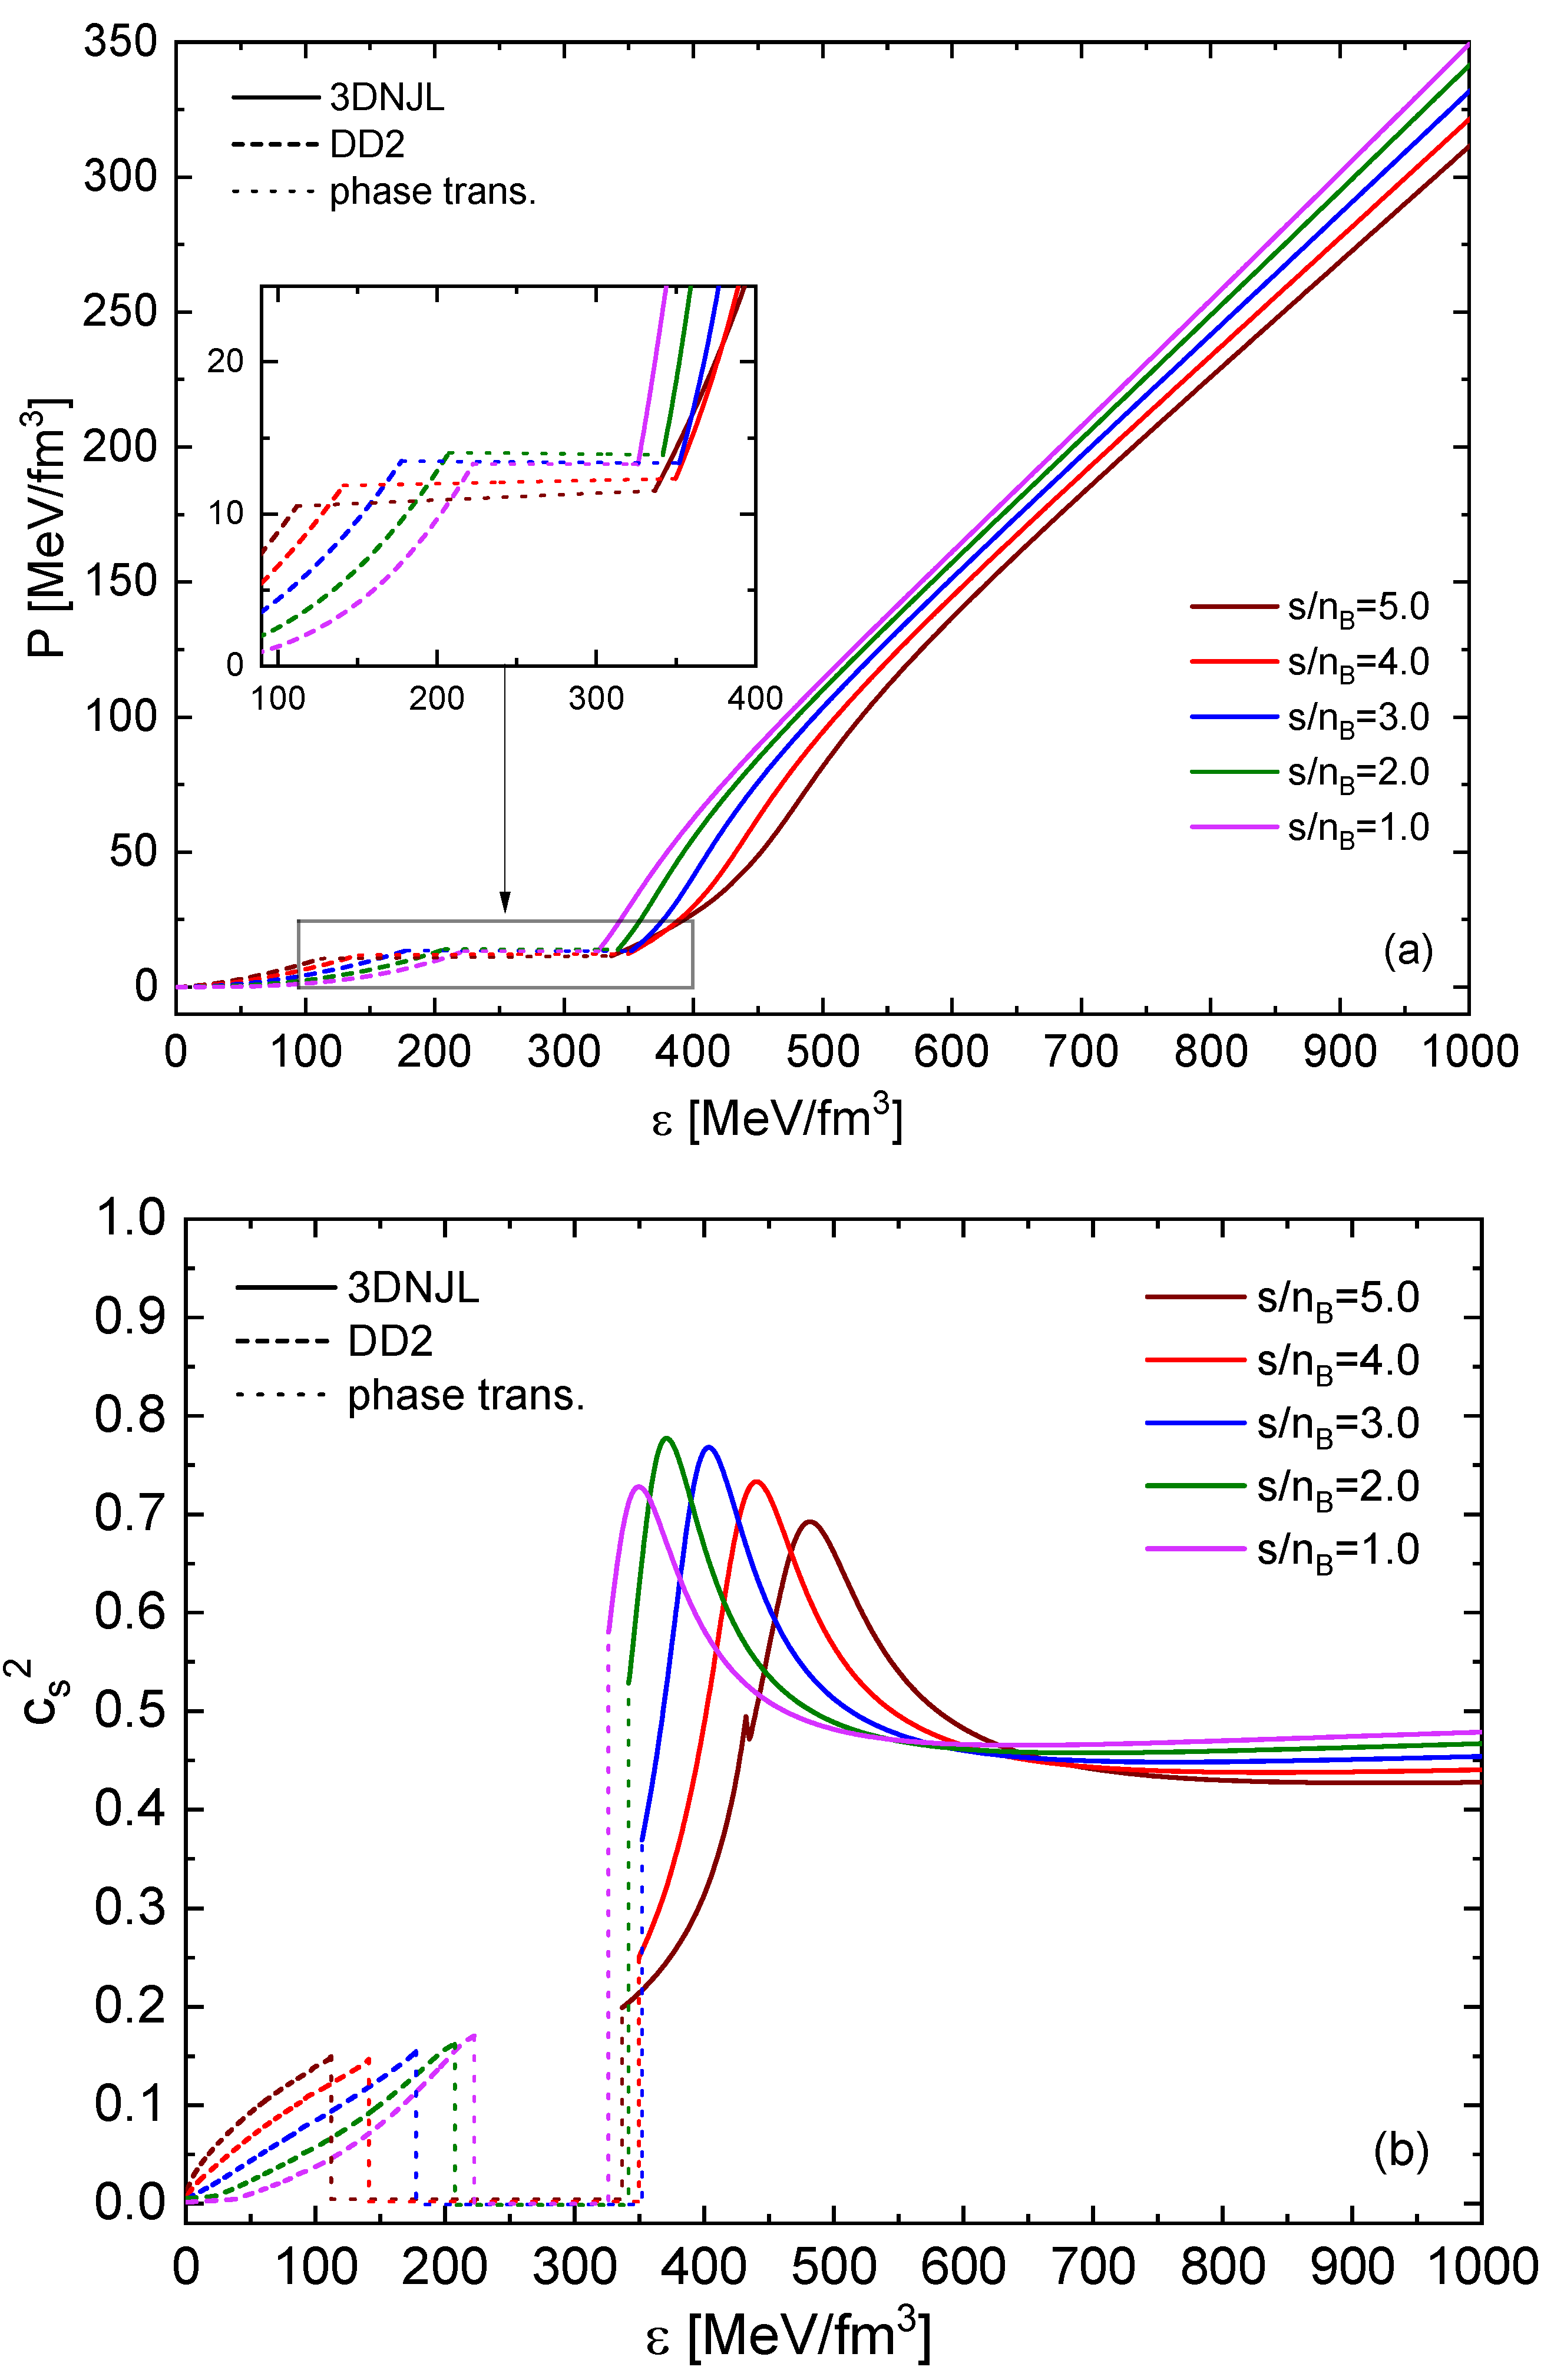
Figure 6 (a), we present
P vs
for the isentropic curves. It is observed that during the transition from HM to QM phases, there is a plateau where we assume a linear transition. The phase transition is constructed as described before, observing that the isentropic energy densities are different on each side of the transition while the isentropic pressures are almost the same. Also it can be noted that the gap in energy density increases with increasing
as expected. In
Figure 6 (b), we show the isentropic squared speed of sound, corresponding to the slope of
Figure 6 (a). It can be observed that where
P vs
has a plateau,
. At large energy densities, the curves do not tend to the conformal limit of
but instead, the high-density asymptote falls in the range of
. The peak seen in the brown curve corresponds to what was observed earlier, where the transition to QM occurs within the NQM phase. We want to comment that the peak in the squared speed of sound occurs not in the nuclear matter phase but in the color superconducting quark matter phase, just after the first-order deconfinement transition.
In
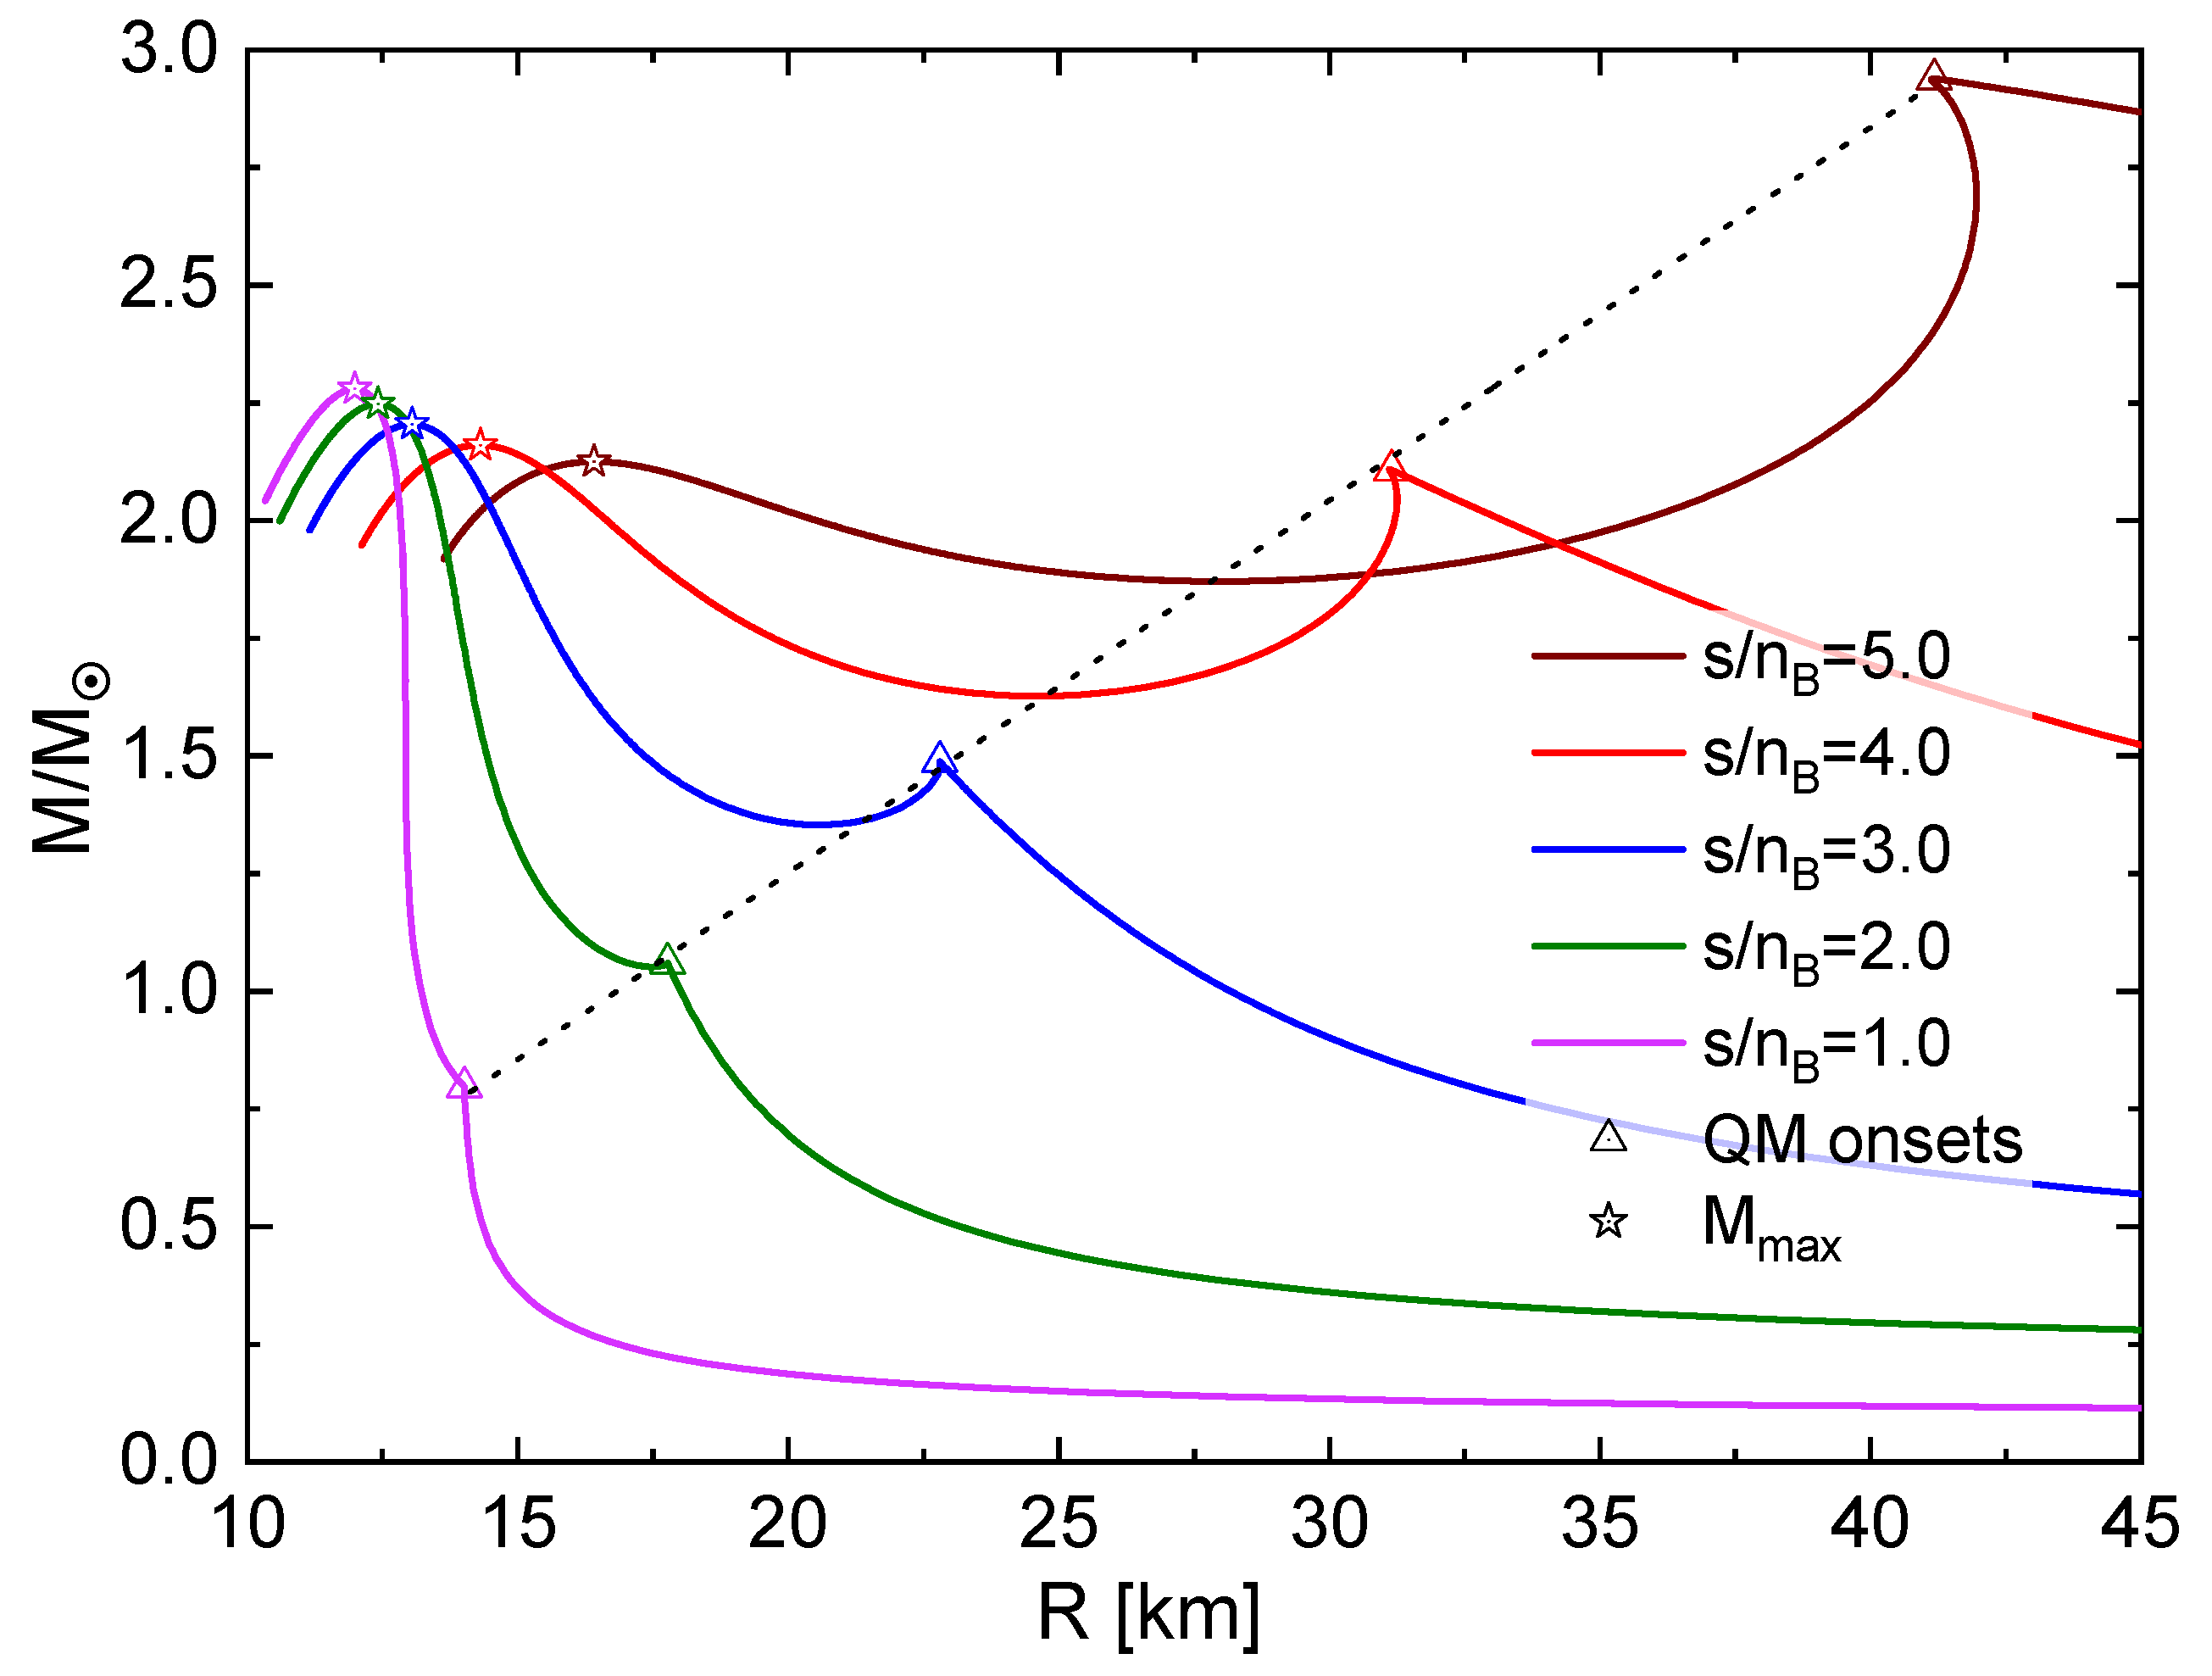
Figure 7, the isentropic hybrid stellar configurations are shown. The maximum masses of the hybrid stars decrease as
increase, while the corresponding radii increase. Twin configurations are observed for
, where one of the components is hybrid and its counterpart is composed of HM. It is noteworthy that the observed peaks corresponding to the HM-hybrid transitions occur along a straight line (see the dotted line in
Figure 7). This line is described by the fit
where
km is the radius offset and
/km is the critical compactness of the star for which the deconfinement transition sets in, which for
is accompanied by an instability that entails the formation of a disconnected thermal third family branch with "thermal twin" stars. In a dynamic setting, such instability is accompanied by a star quake and burst phenomena.
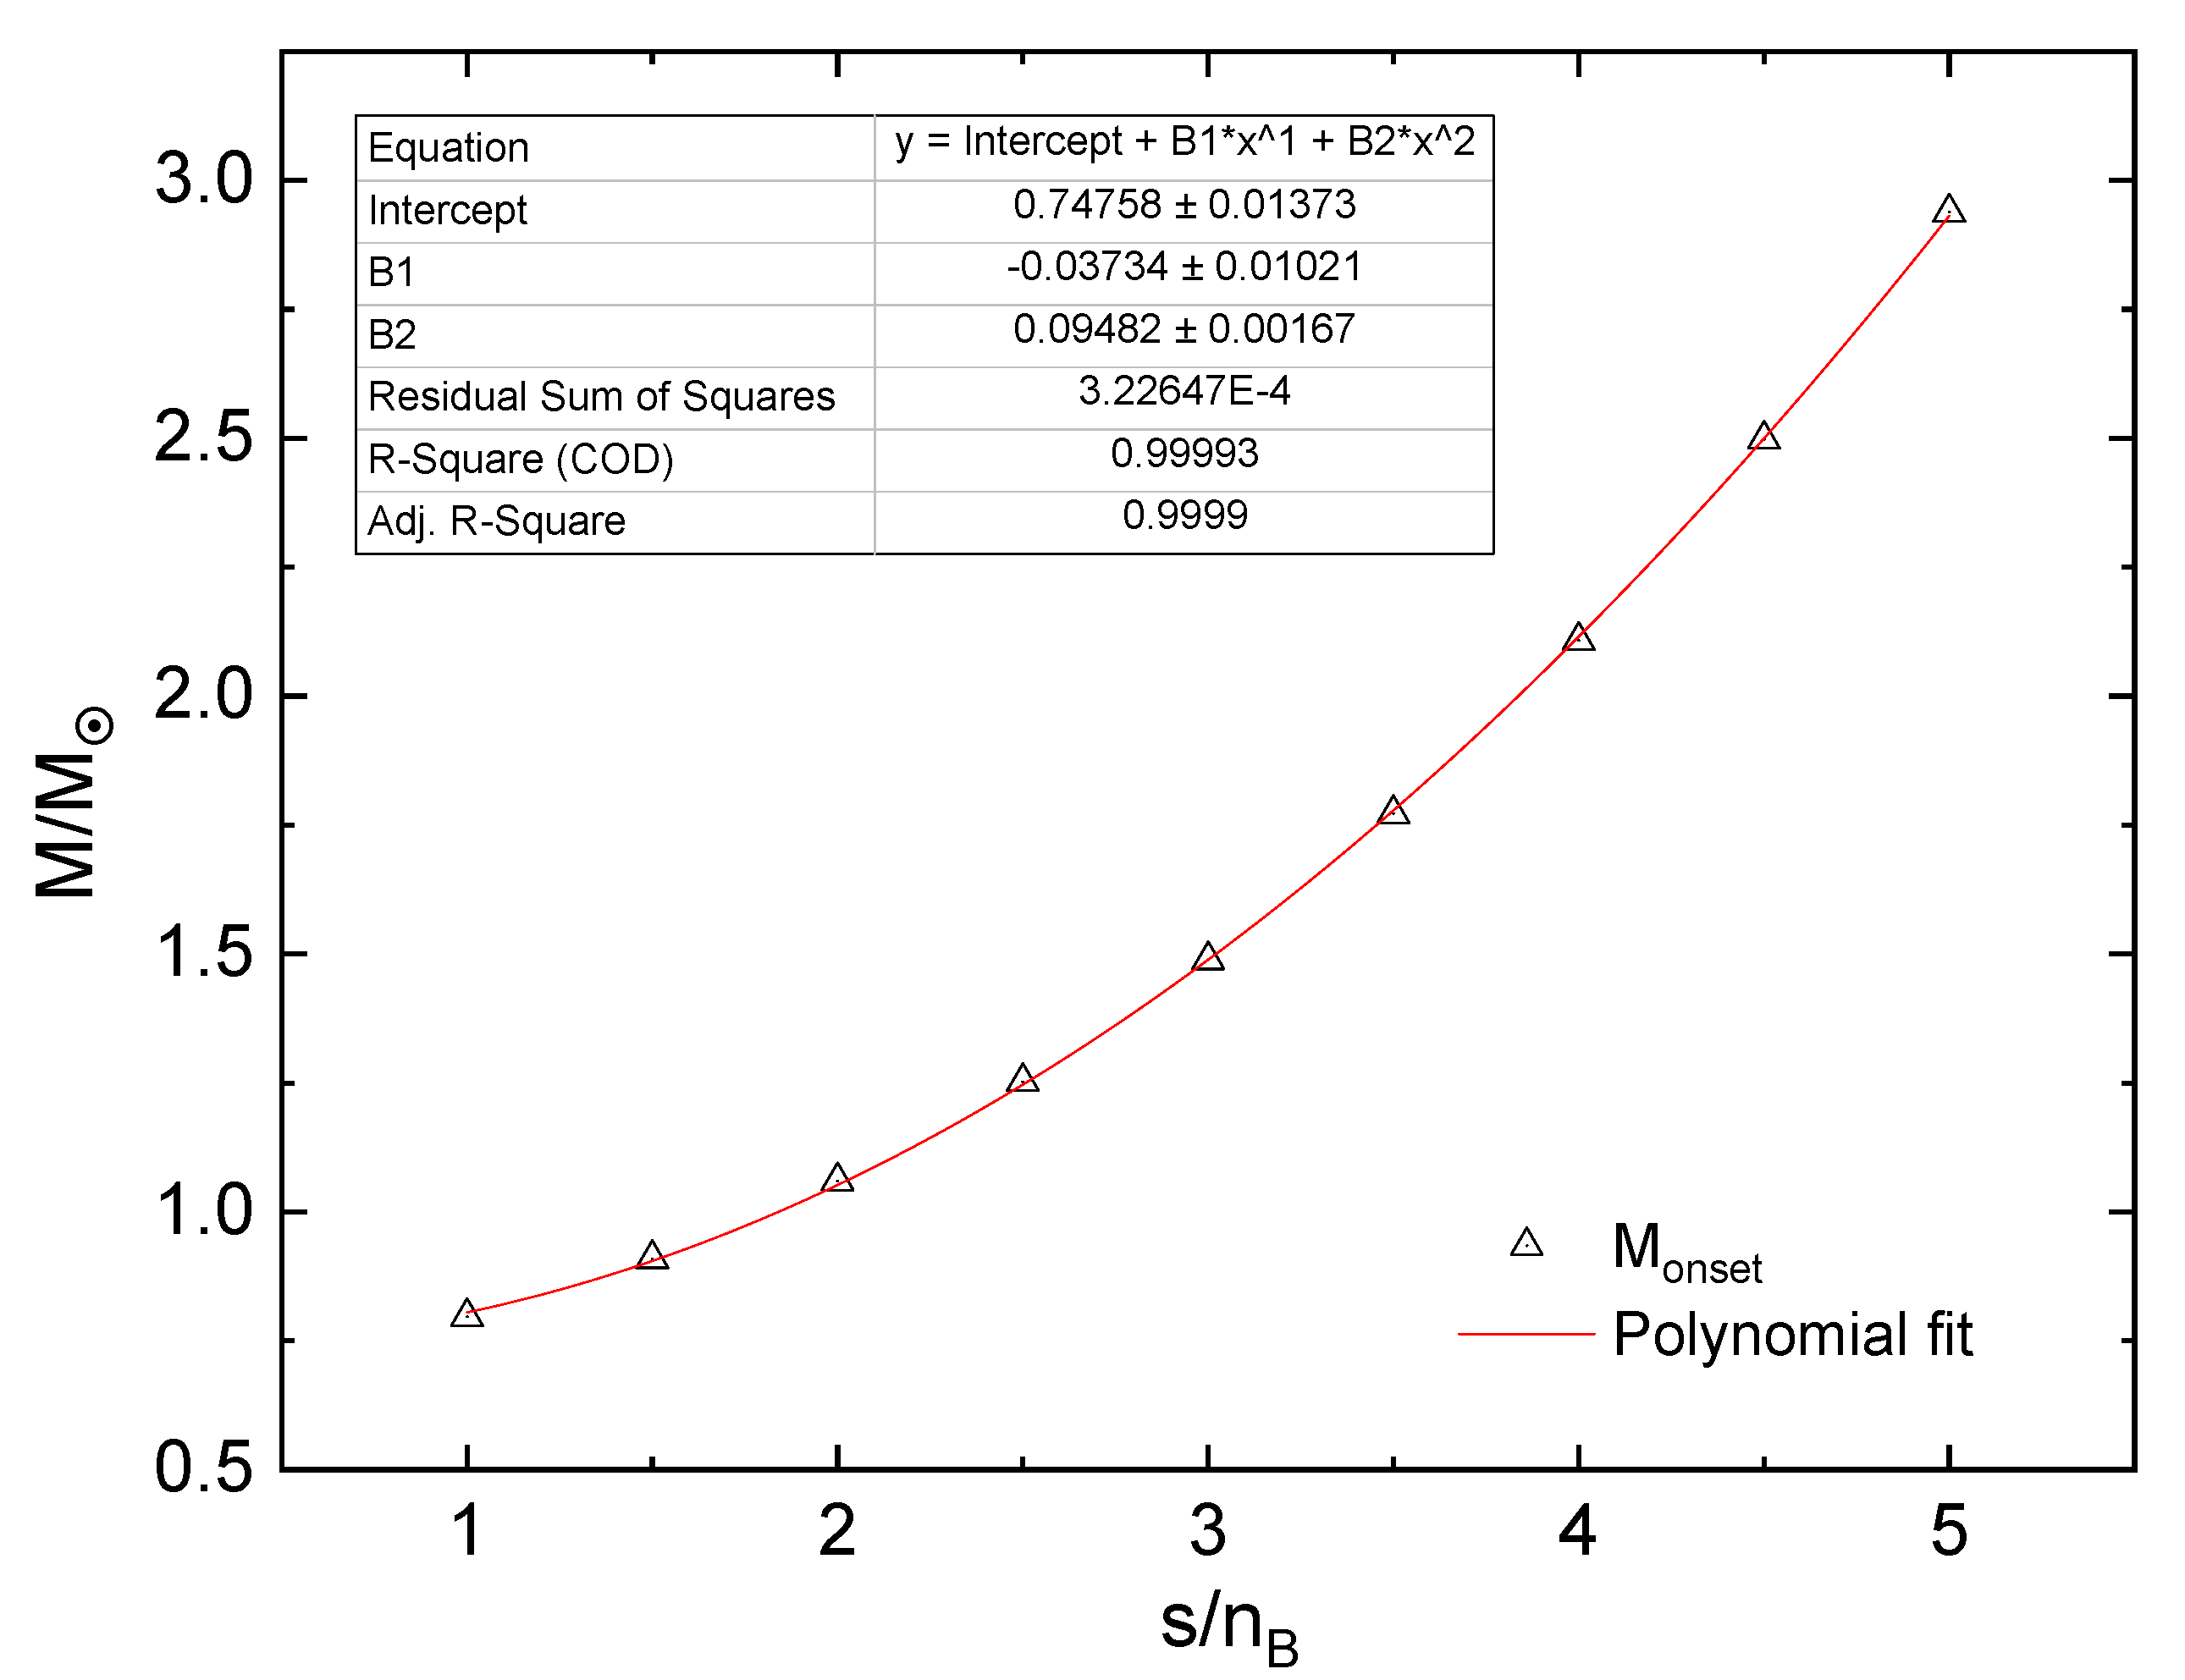
The onset mass of the deconfinement transition in hot protoneutron star configurations increases systematically with the entropy per baryon, see
Figure 8. This behavior can be fitted by a polynomial form
From
Figure 7 it can be observed that the phenomenon of thermal twin star configurations occurs for
. At
, however, the onset mass of the transition starts exceeding the maximum mass of the hybrid star mass, so that no stable star configuration shall emerge but a collapse to a black hole can be expected. One can read from
Figure 8, that the mass range of stable twin stars that can be reached in the accretion-induced transition from a hot protoneutron star lies in the range from 1.0 to 2.2
for the corresponding range of entropy per baryon of
.
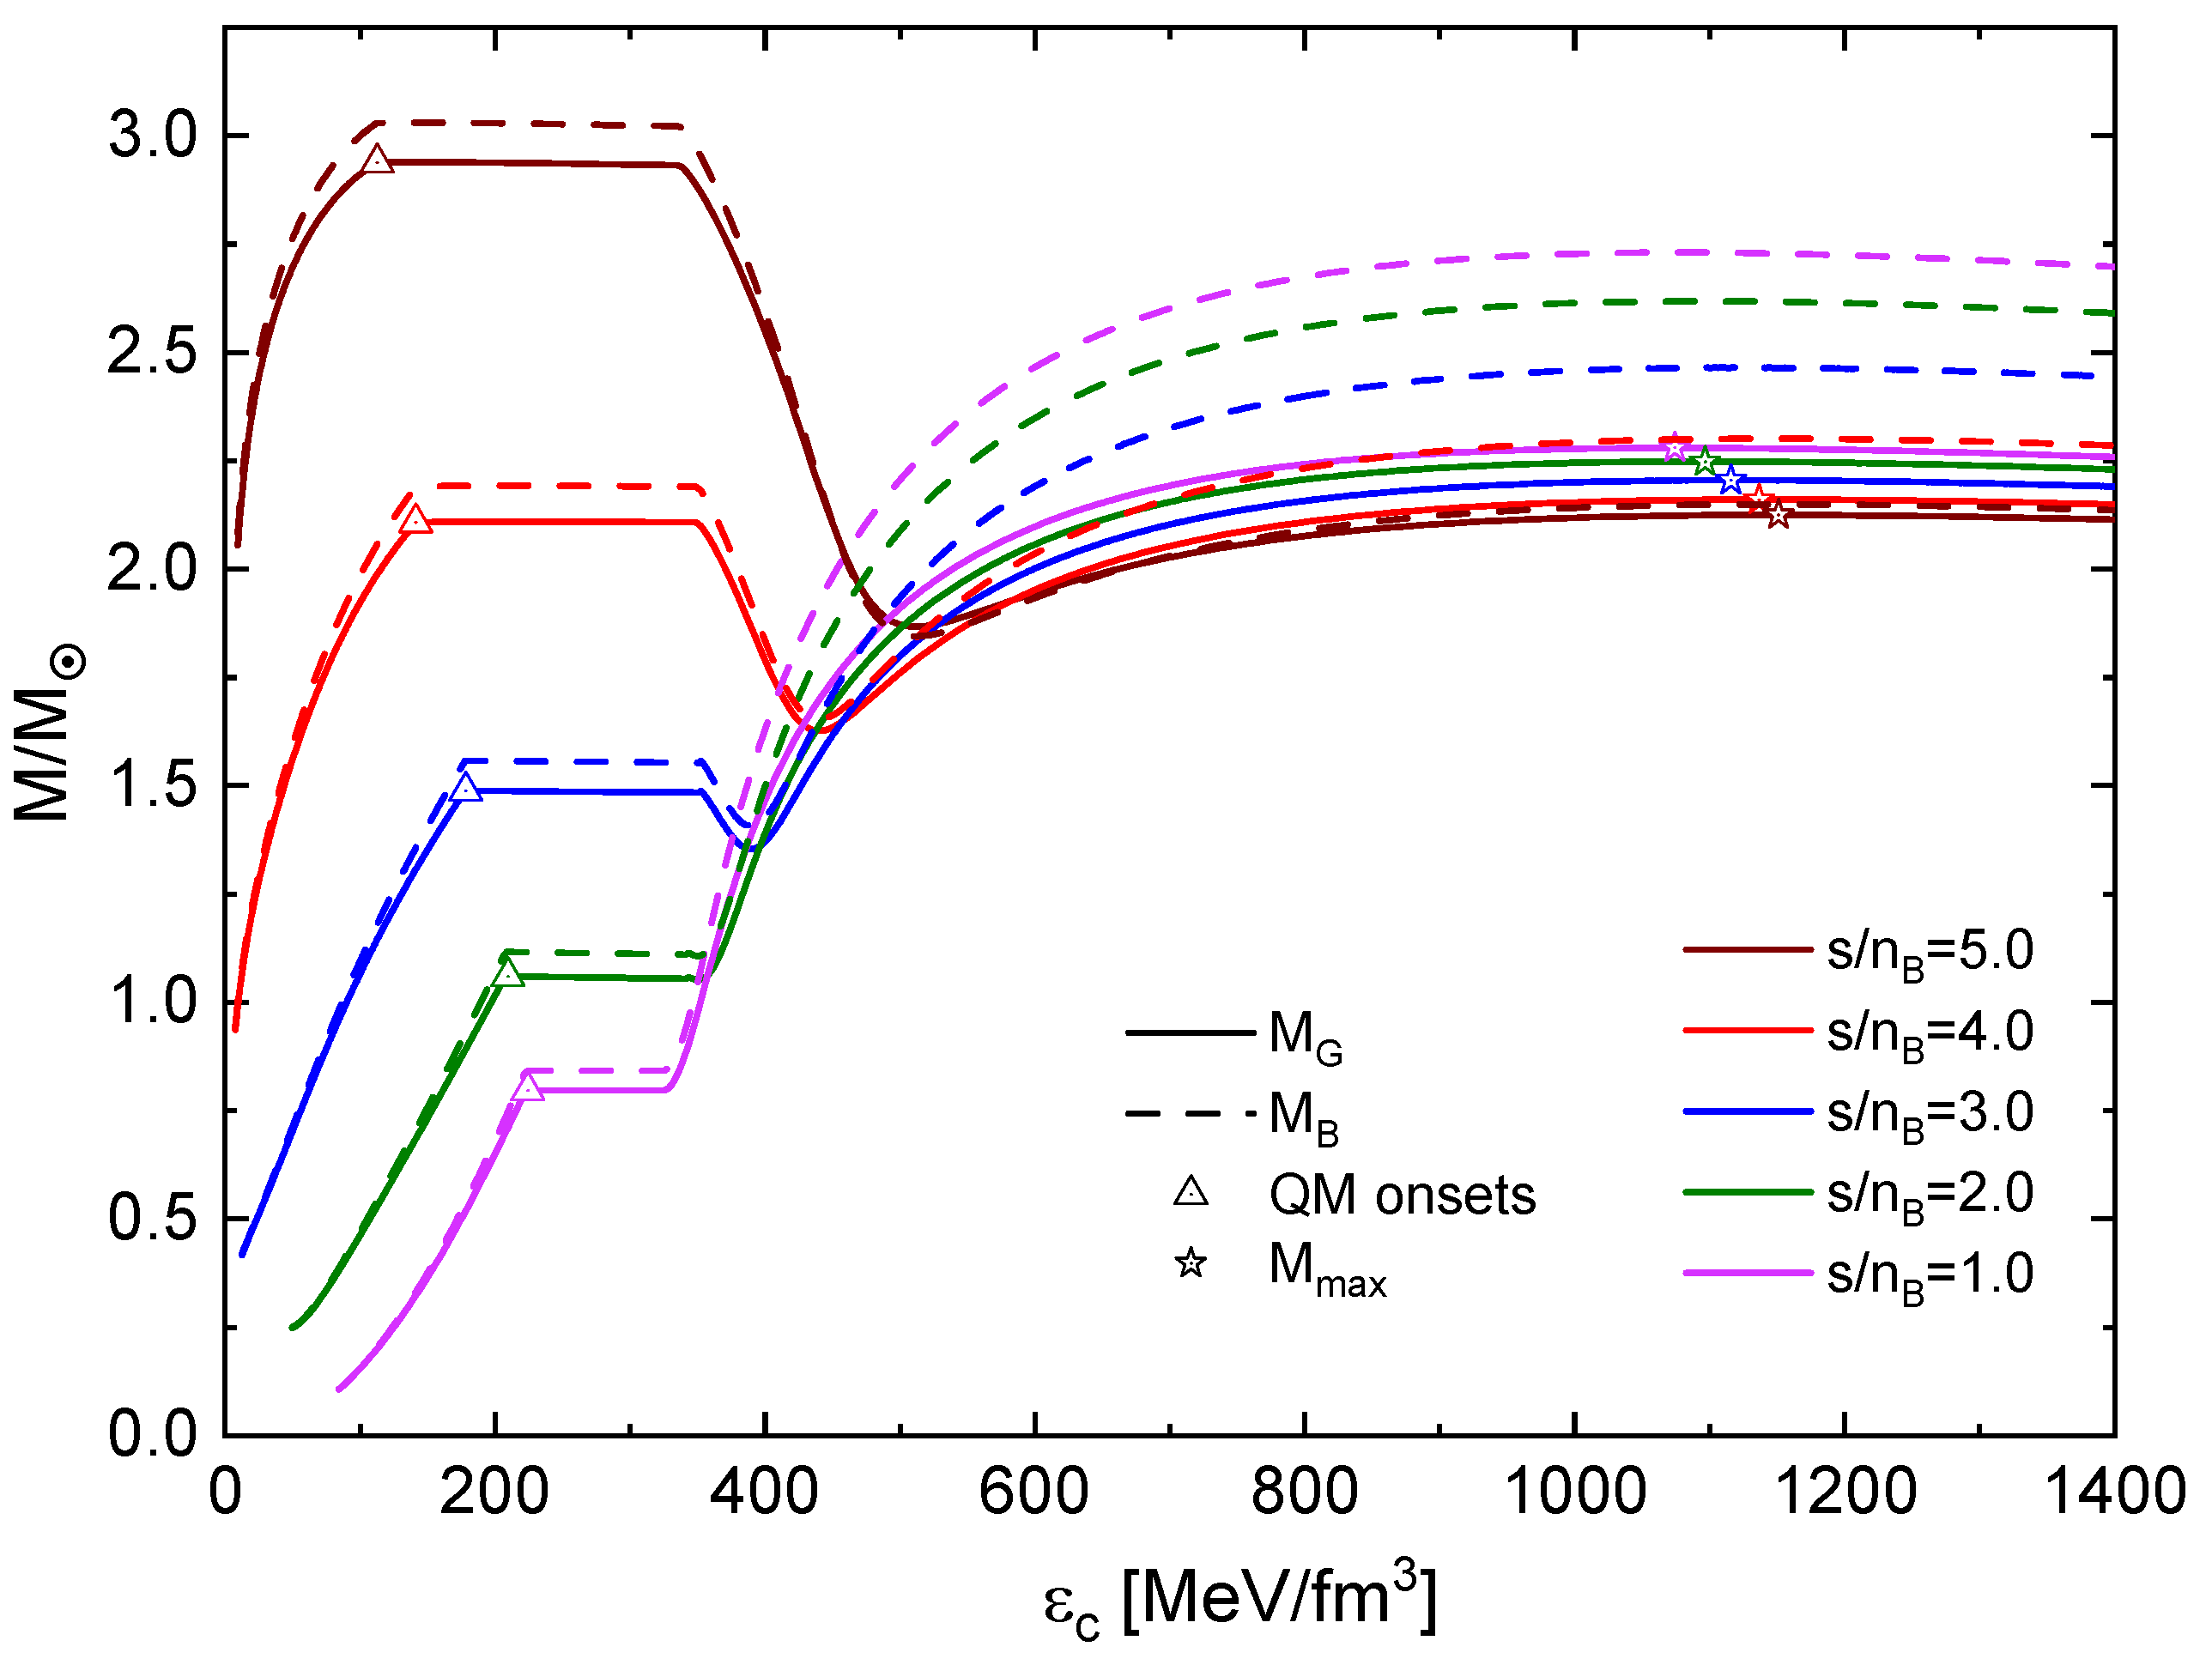
For neutron star phenomenology it is of interest to estimate the mass defect that corresponds to such a mass twin transition. In order to estimate this quantity for a transition that occurs under the conservation of the baryon number, we calculate both the gravitational mass and the baryon mass as a function of the central energy density by solving the corresponding Tolman-Oppenheimer-Volkoff equations. The result is shown in
Figure 9 for selected values of constant entropy per baryon.
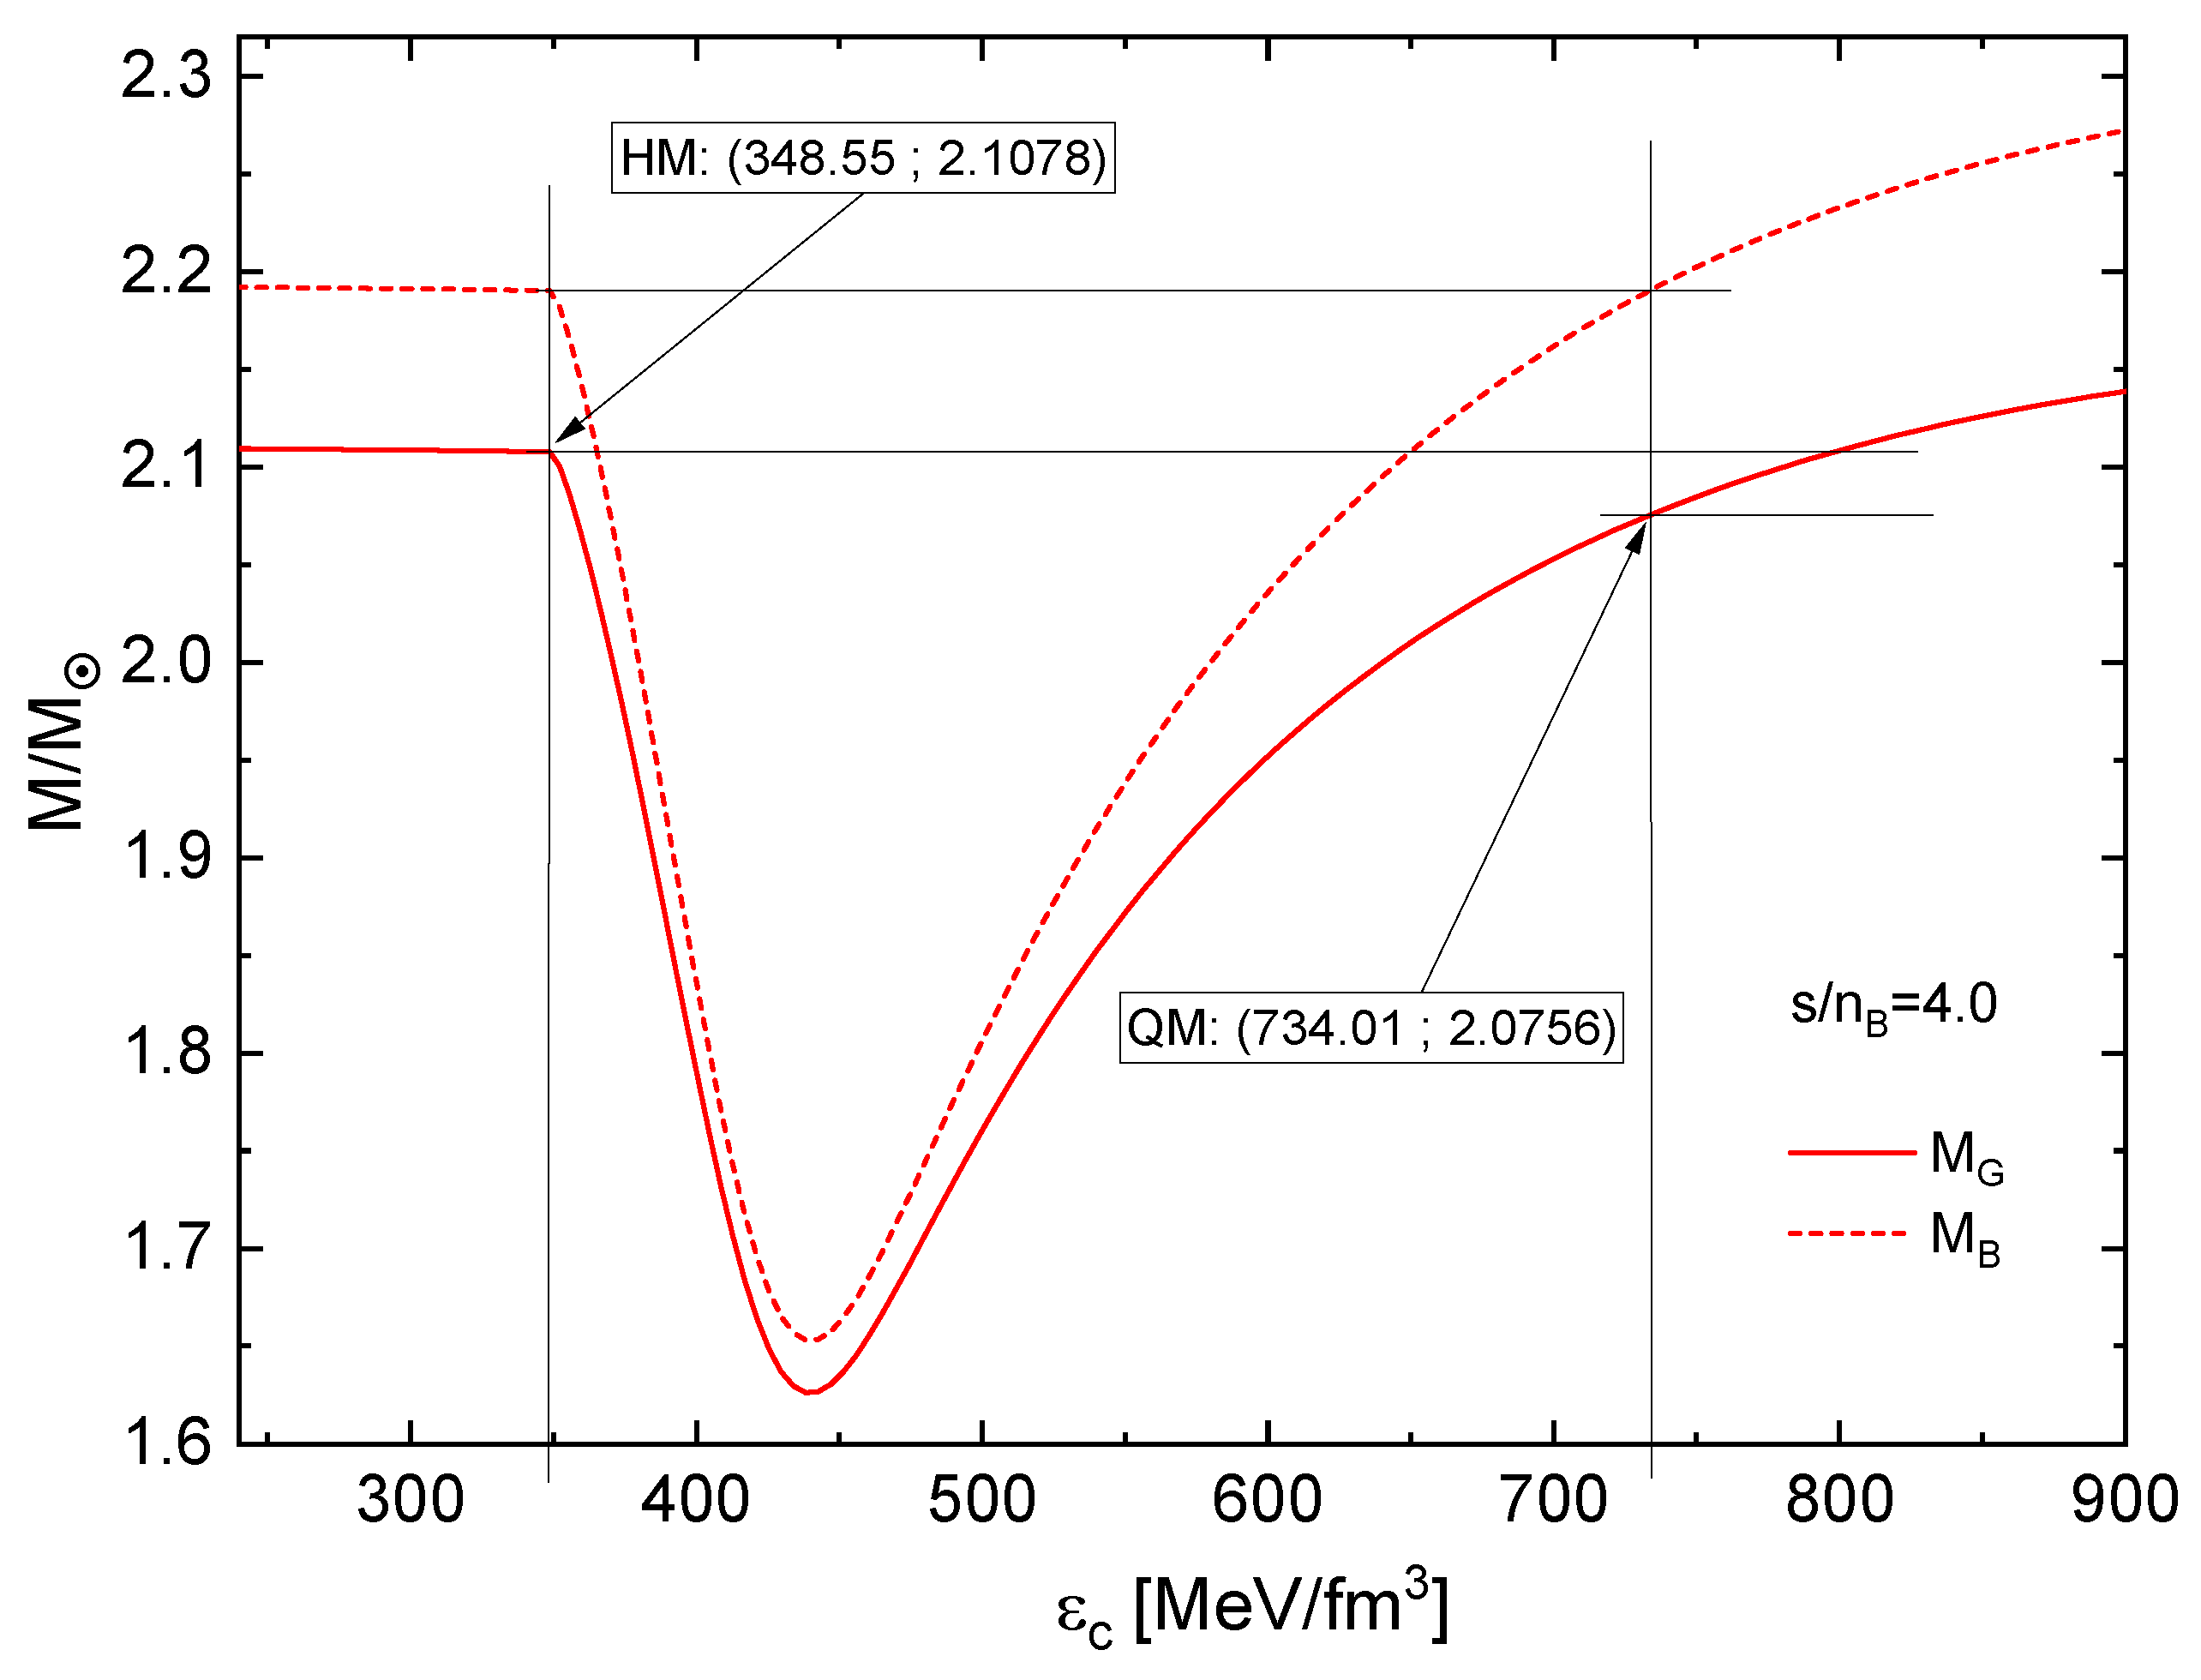
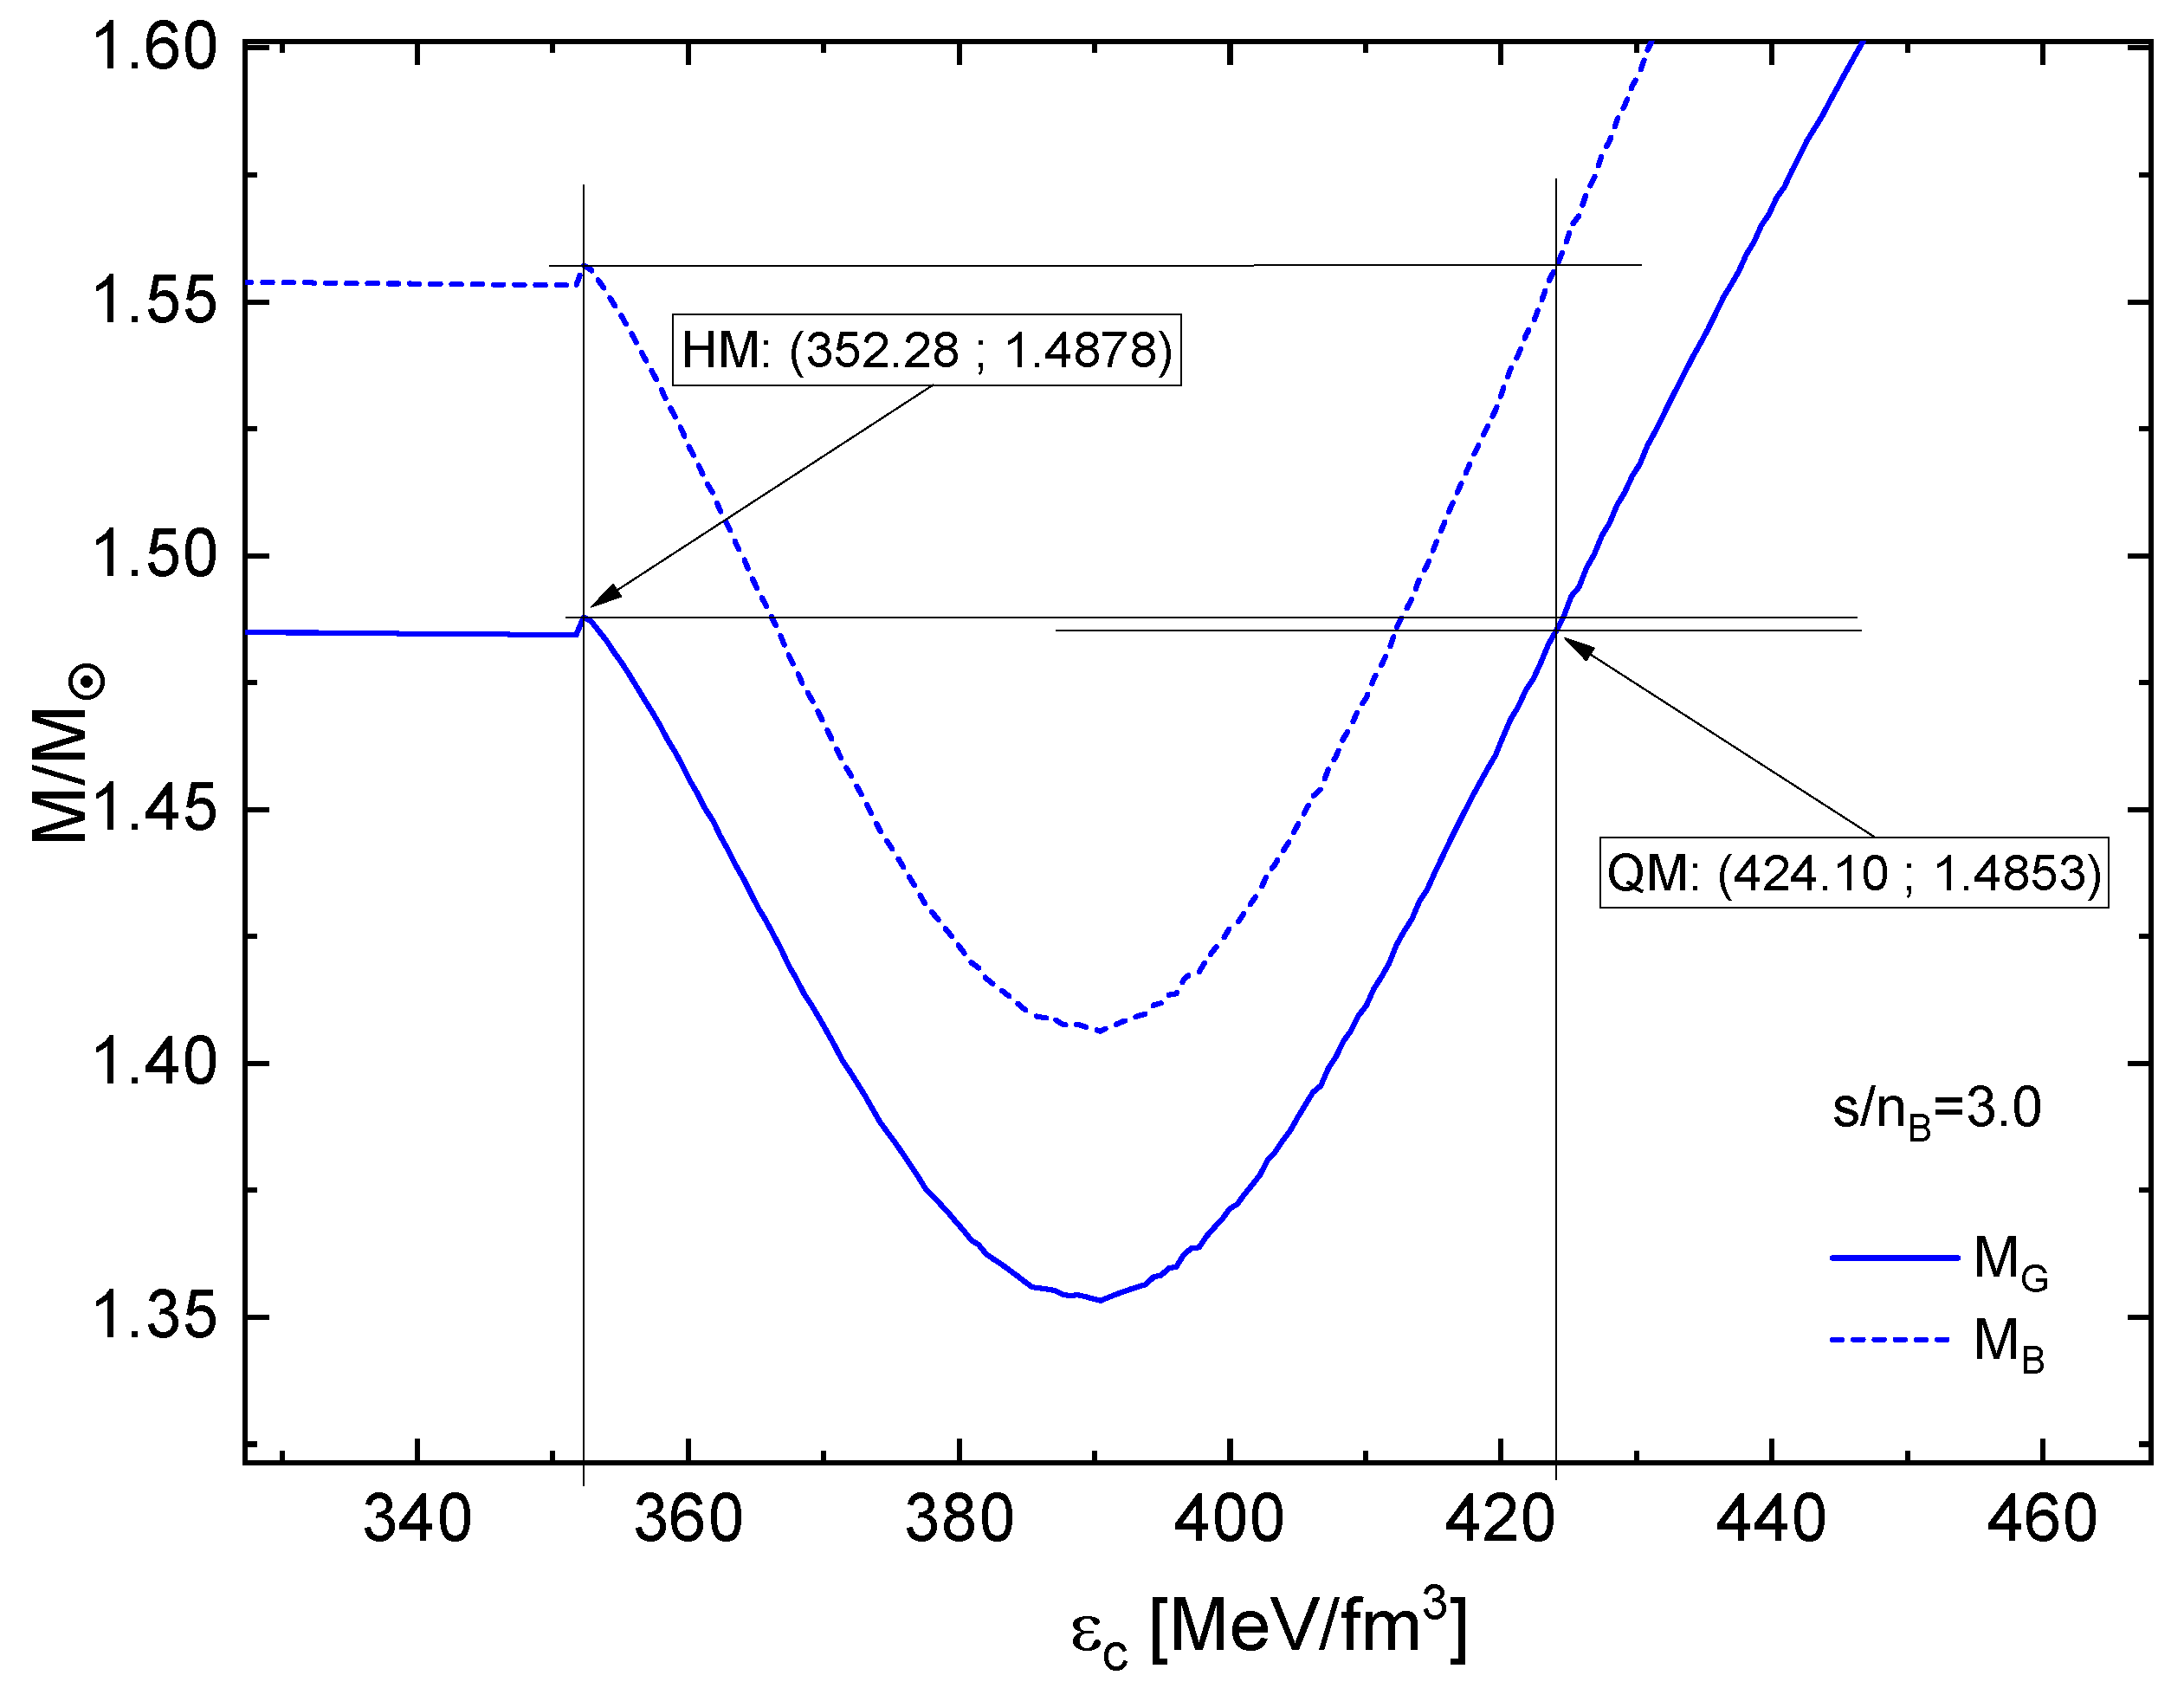
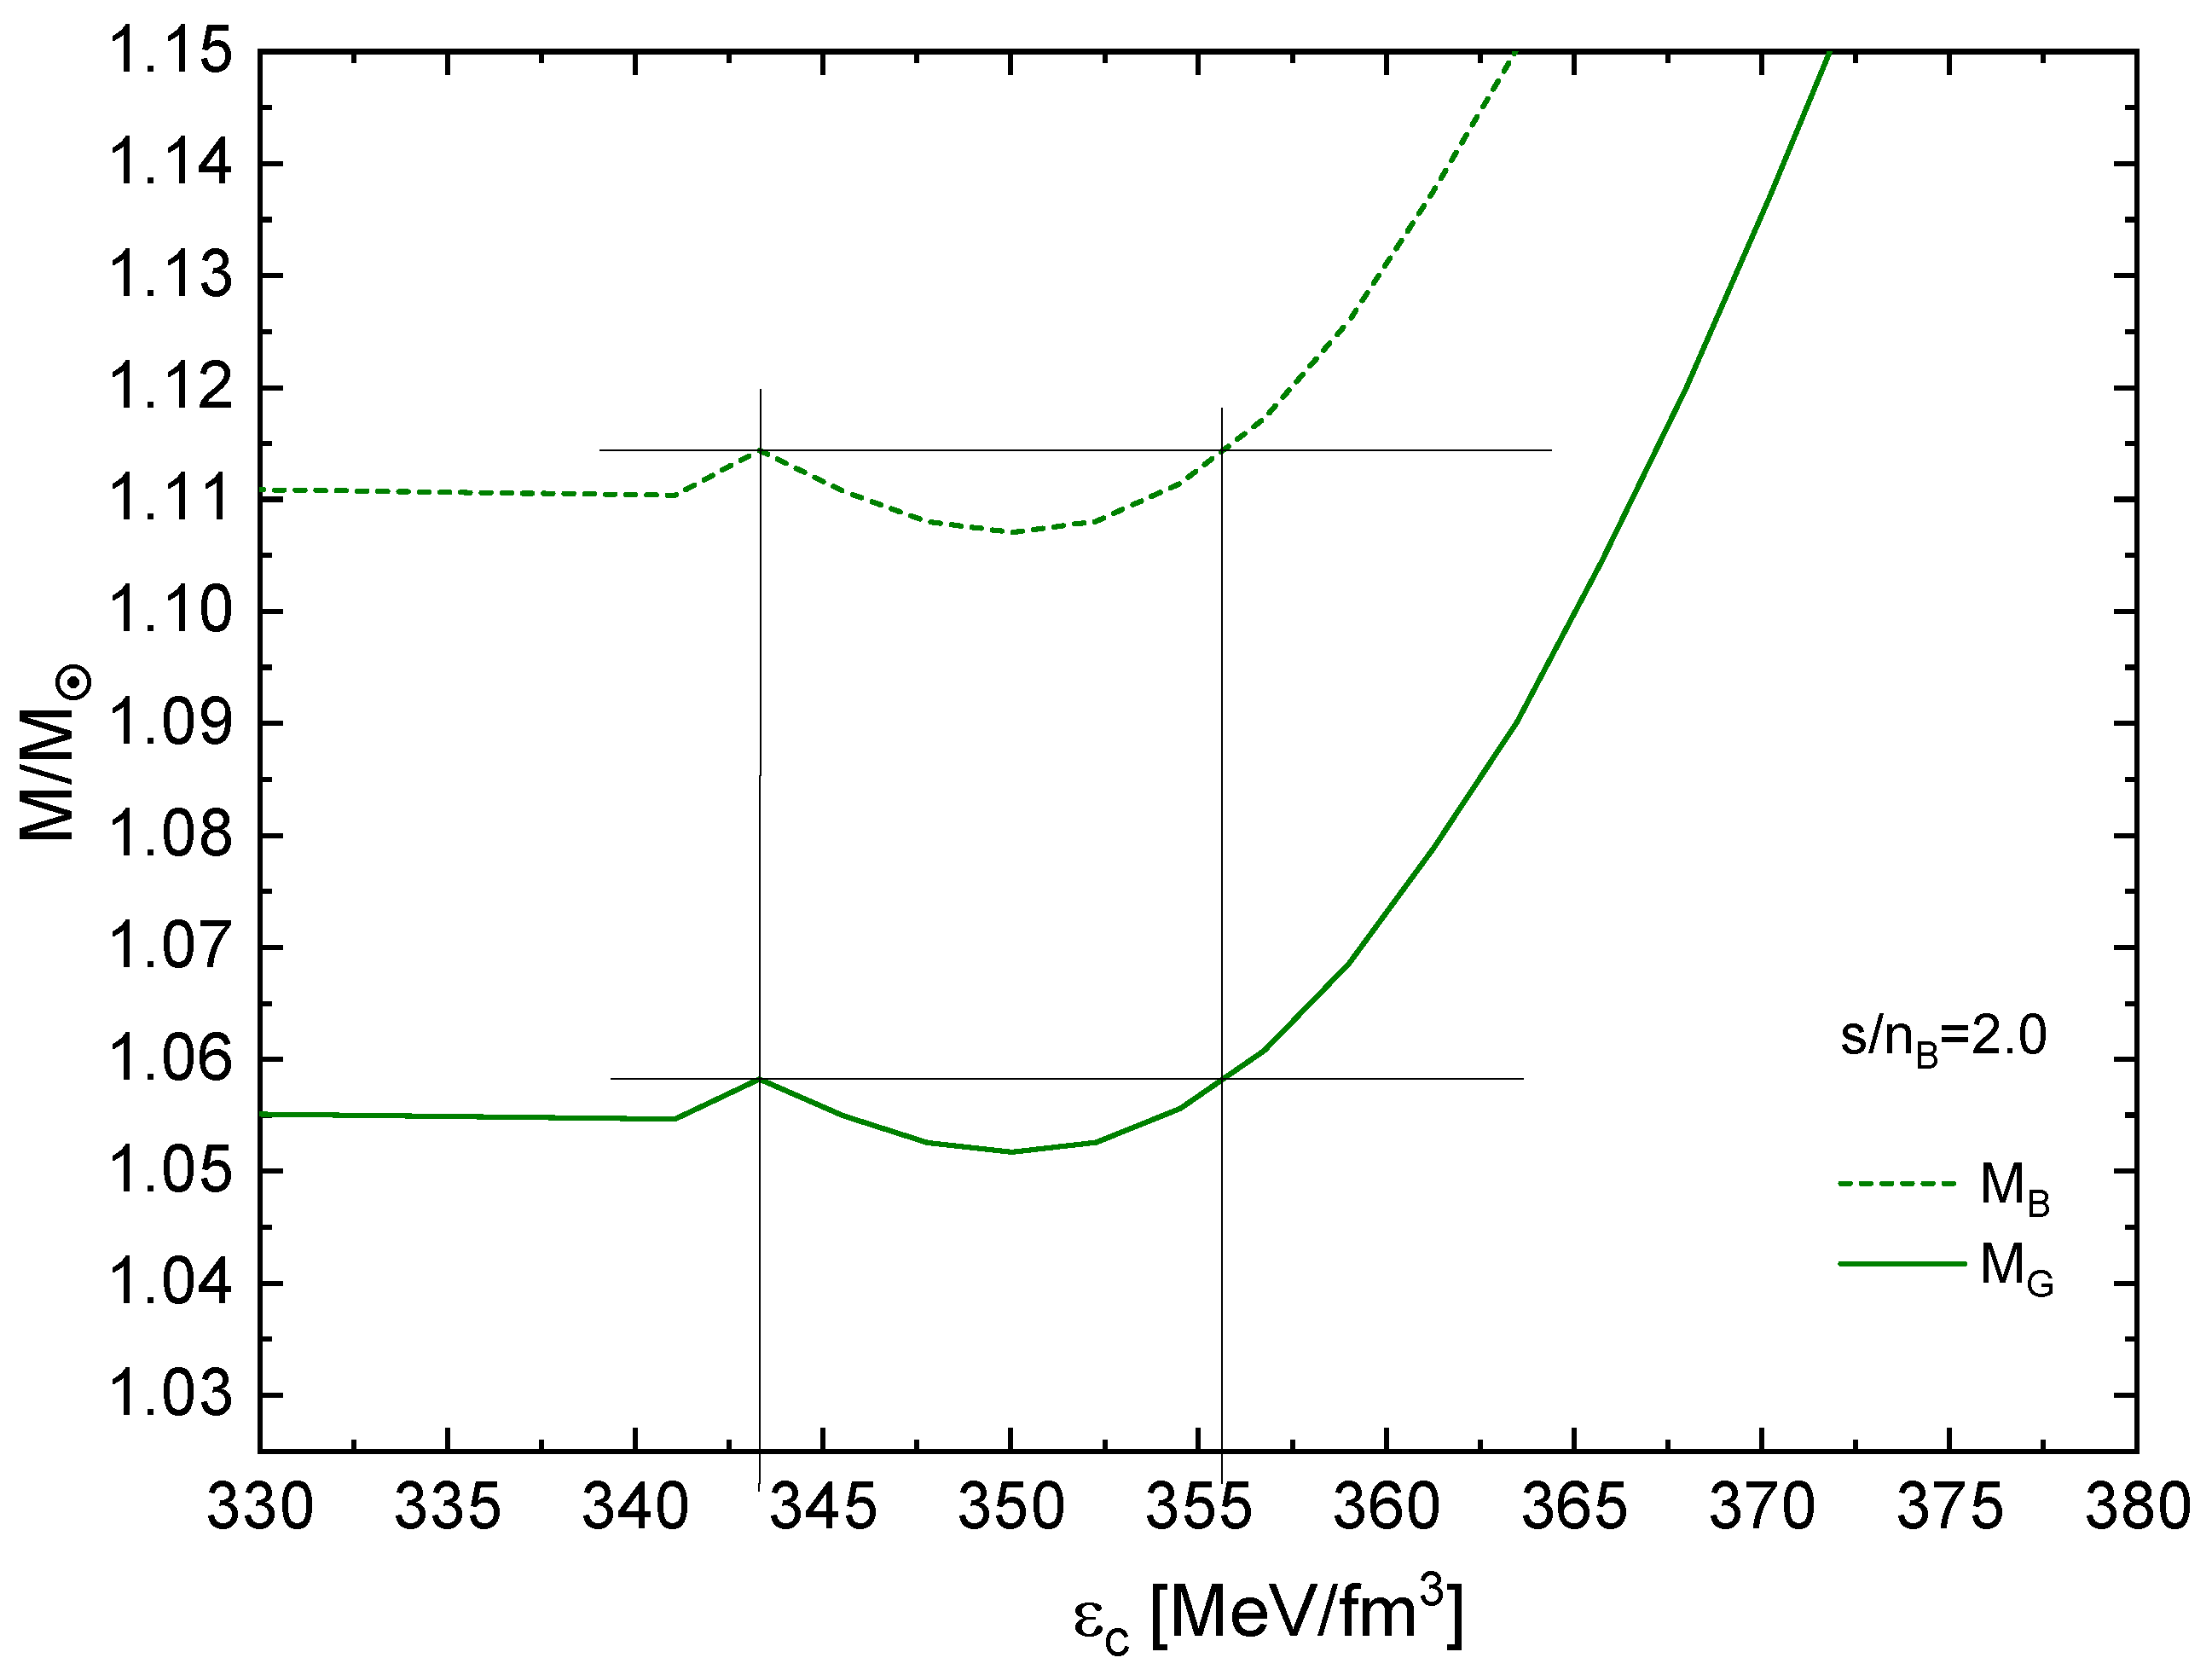
In order to construct the mass defect from these solutions, one zooms into the twin transition mass range and finds the corresponding central energy densities with the identical (critical) baryon mass. Then one reads off the gravitational masses of these twin configurations and finds the mass defect. See
Figure 10,
Figure 11 and
Figure 12 for the illustration of this construction in the cases
, respectively.
This construction has been performed for further representative values of entropy per baryon and the results are summarized in
Table 1. Since the transition is considered as an isentropic process, the temperature in the star generally has to change. We also display the change in the central temperature in
Table 1 and conclude for the character of the deconfinement transition as an entropic process (when the temperature gets lowered) or an enthalpic process (when the temperature increases), see Refs. [
3,
7,
8] for further details.
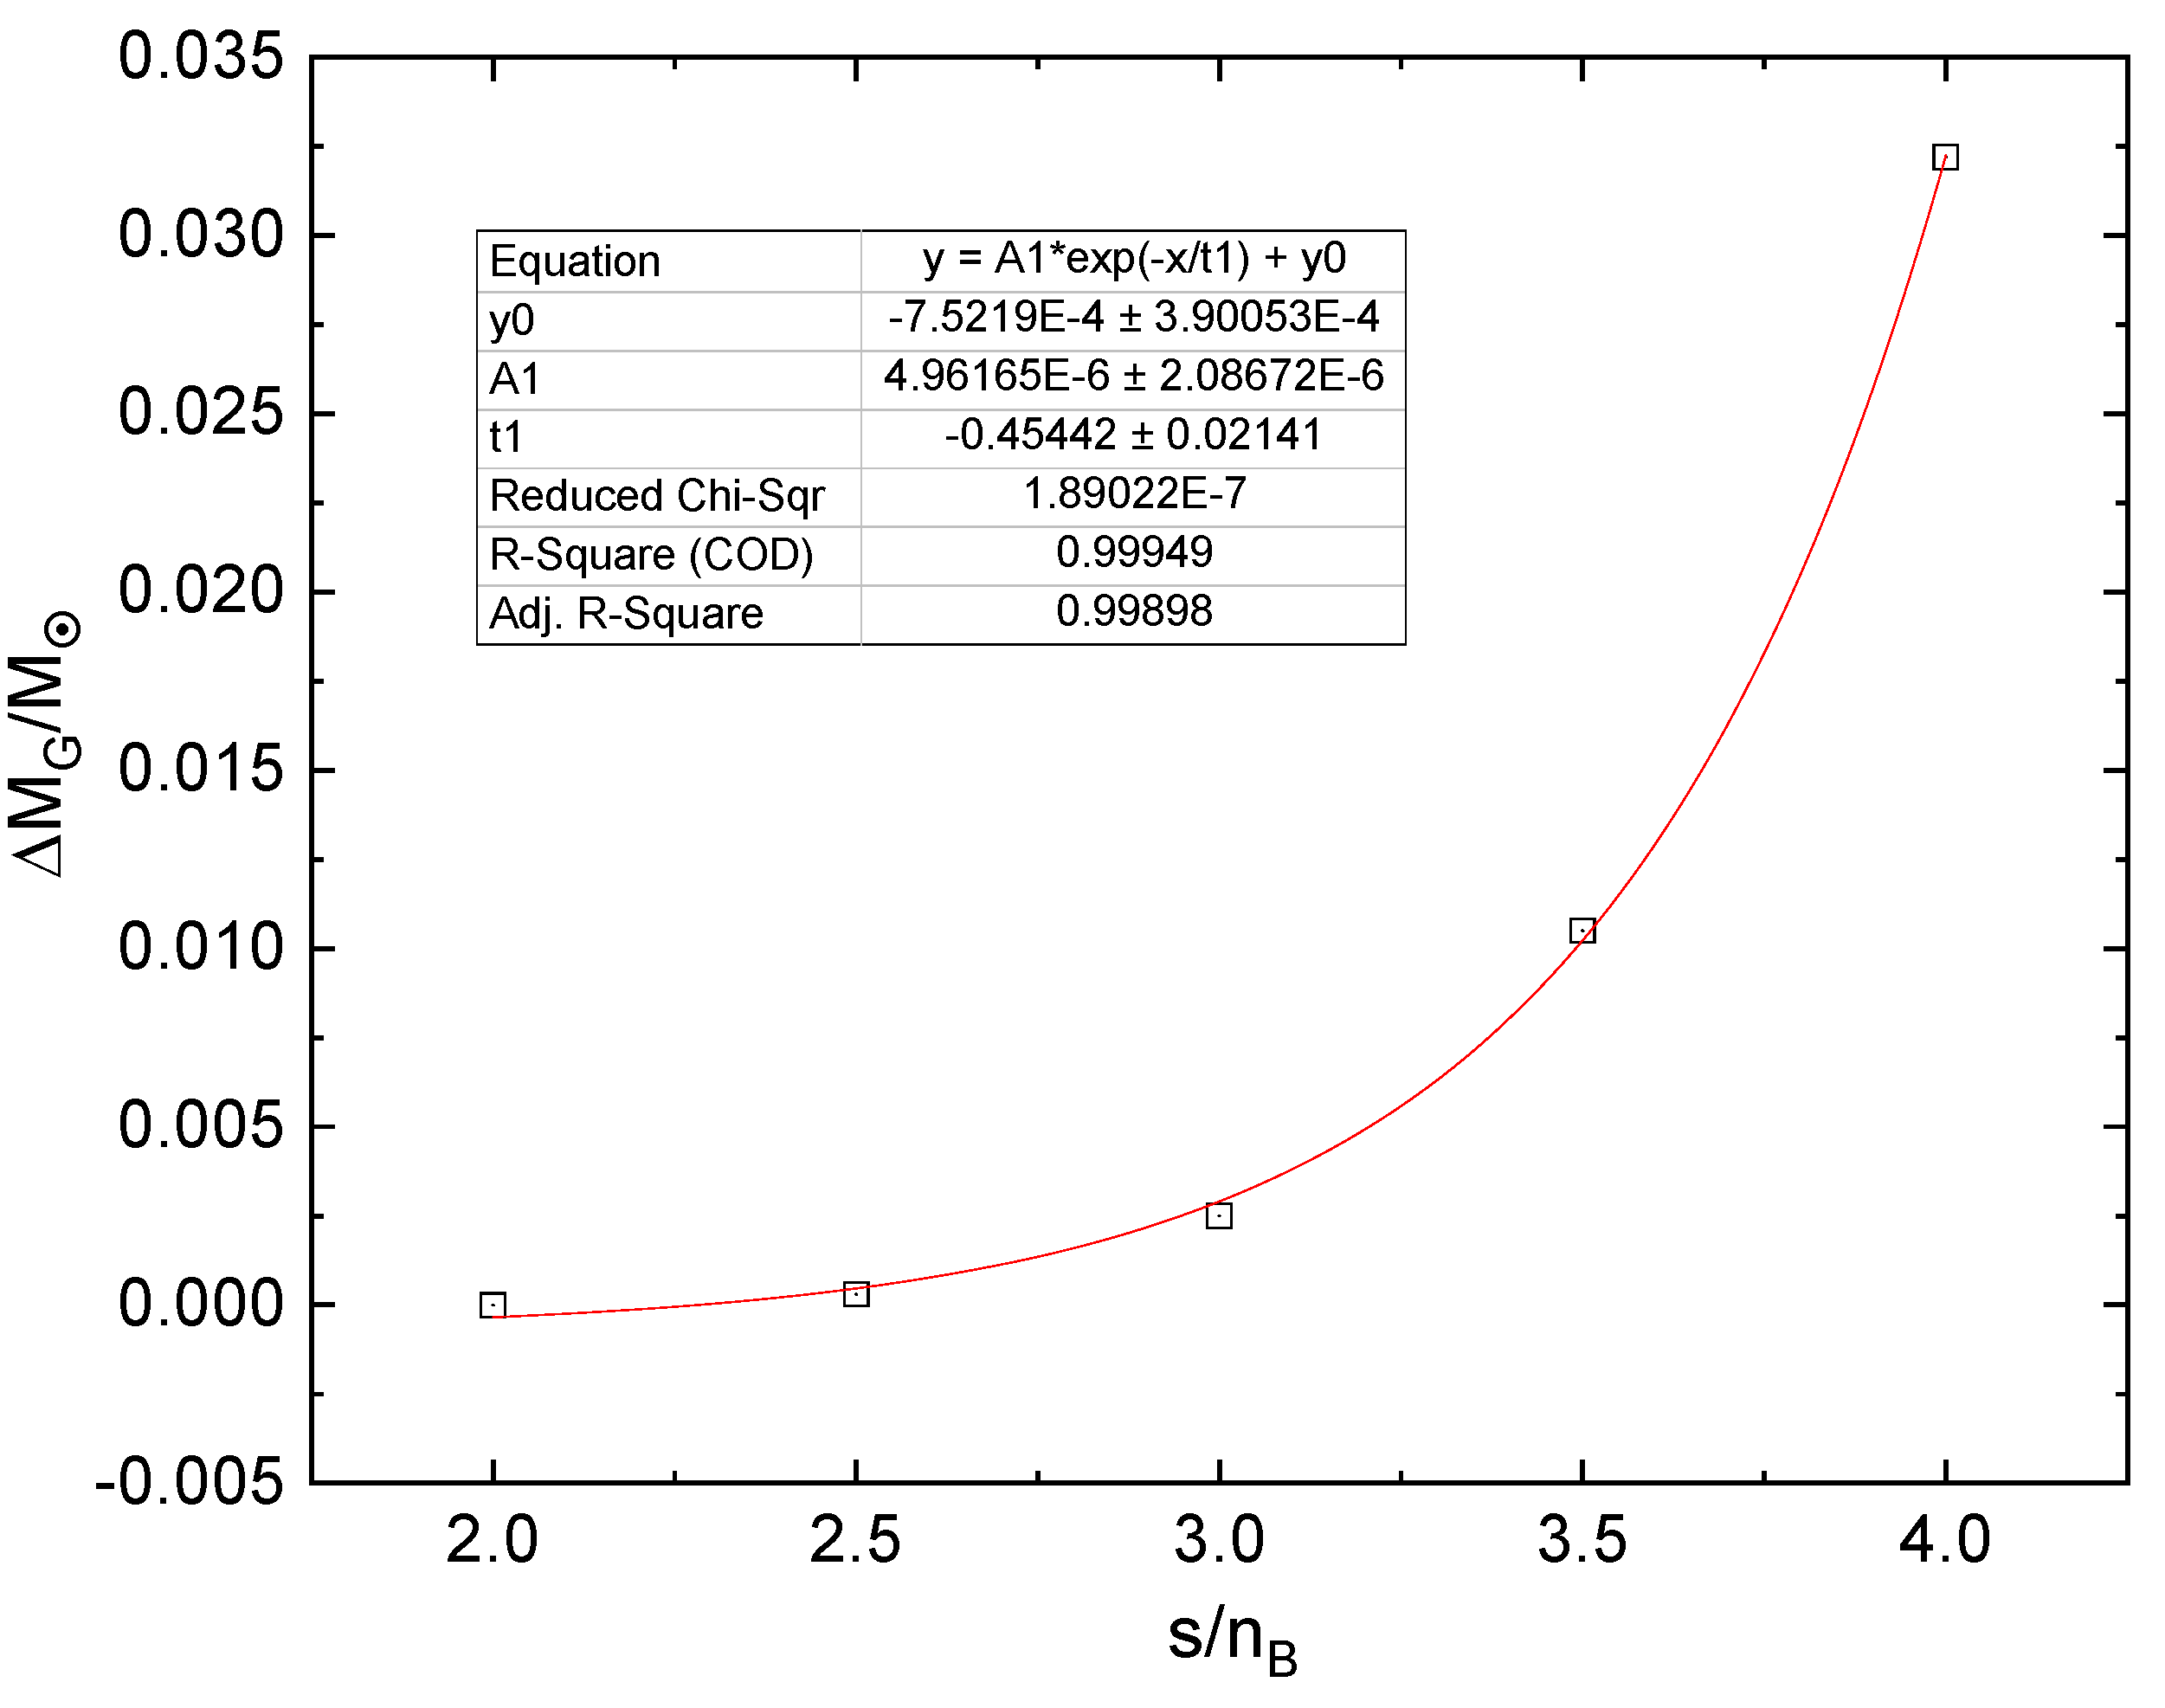
Coming back to the gravitational mass defect, we display this quantity in
Figure 13 as a function of the entropy per baryon. While for
the mass defect is negligibly small, below one per mille of a solar mass, it amounts to 1-3 percent for
. This nonlinear behavior can be fitted by the functional form of an exponential
Such values of mass defect in a dynamical accretion-induced deconfinement transition scenario have been found recently to be sufficient to explain the origin of a measurable eccentricity of the orbit in millisecond binaries [
10,
11,
12,
13,
14].
We note that in
Figure 12 it can clearly be seen that before the onset of the instability for
, there is a small stable branch of hybrid stars, with central densities already exceeding the critical energy densities on the quark matter side of the phase transition. This is not a numerical artifact, but a real physical effect. As it has been found already in Refs. [
15,
16,
17], and discussed more in detail in the framework of the classification of mass-radius curves for hybrid stars by Alford et al. [
18], there is a small sequence of stable hybrid stars with a tiny quark matter core that is connected to the hadronic neutron star branch, provided the jump in energy density at the transition is small enough not to fulfill the Seidov criterion [
15] for a gravitational instability
The Seidov criterion (
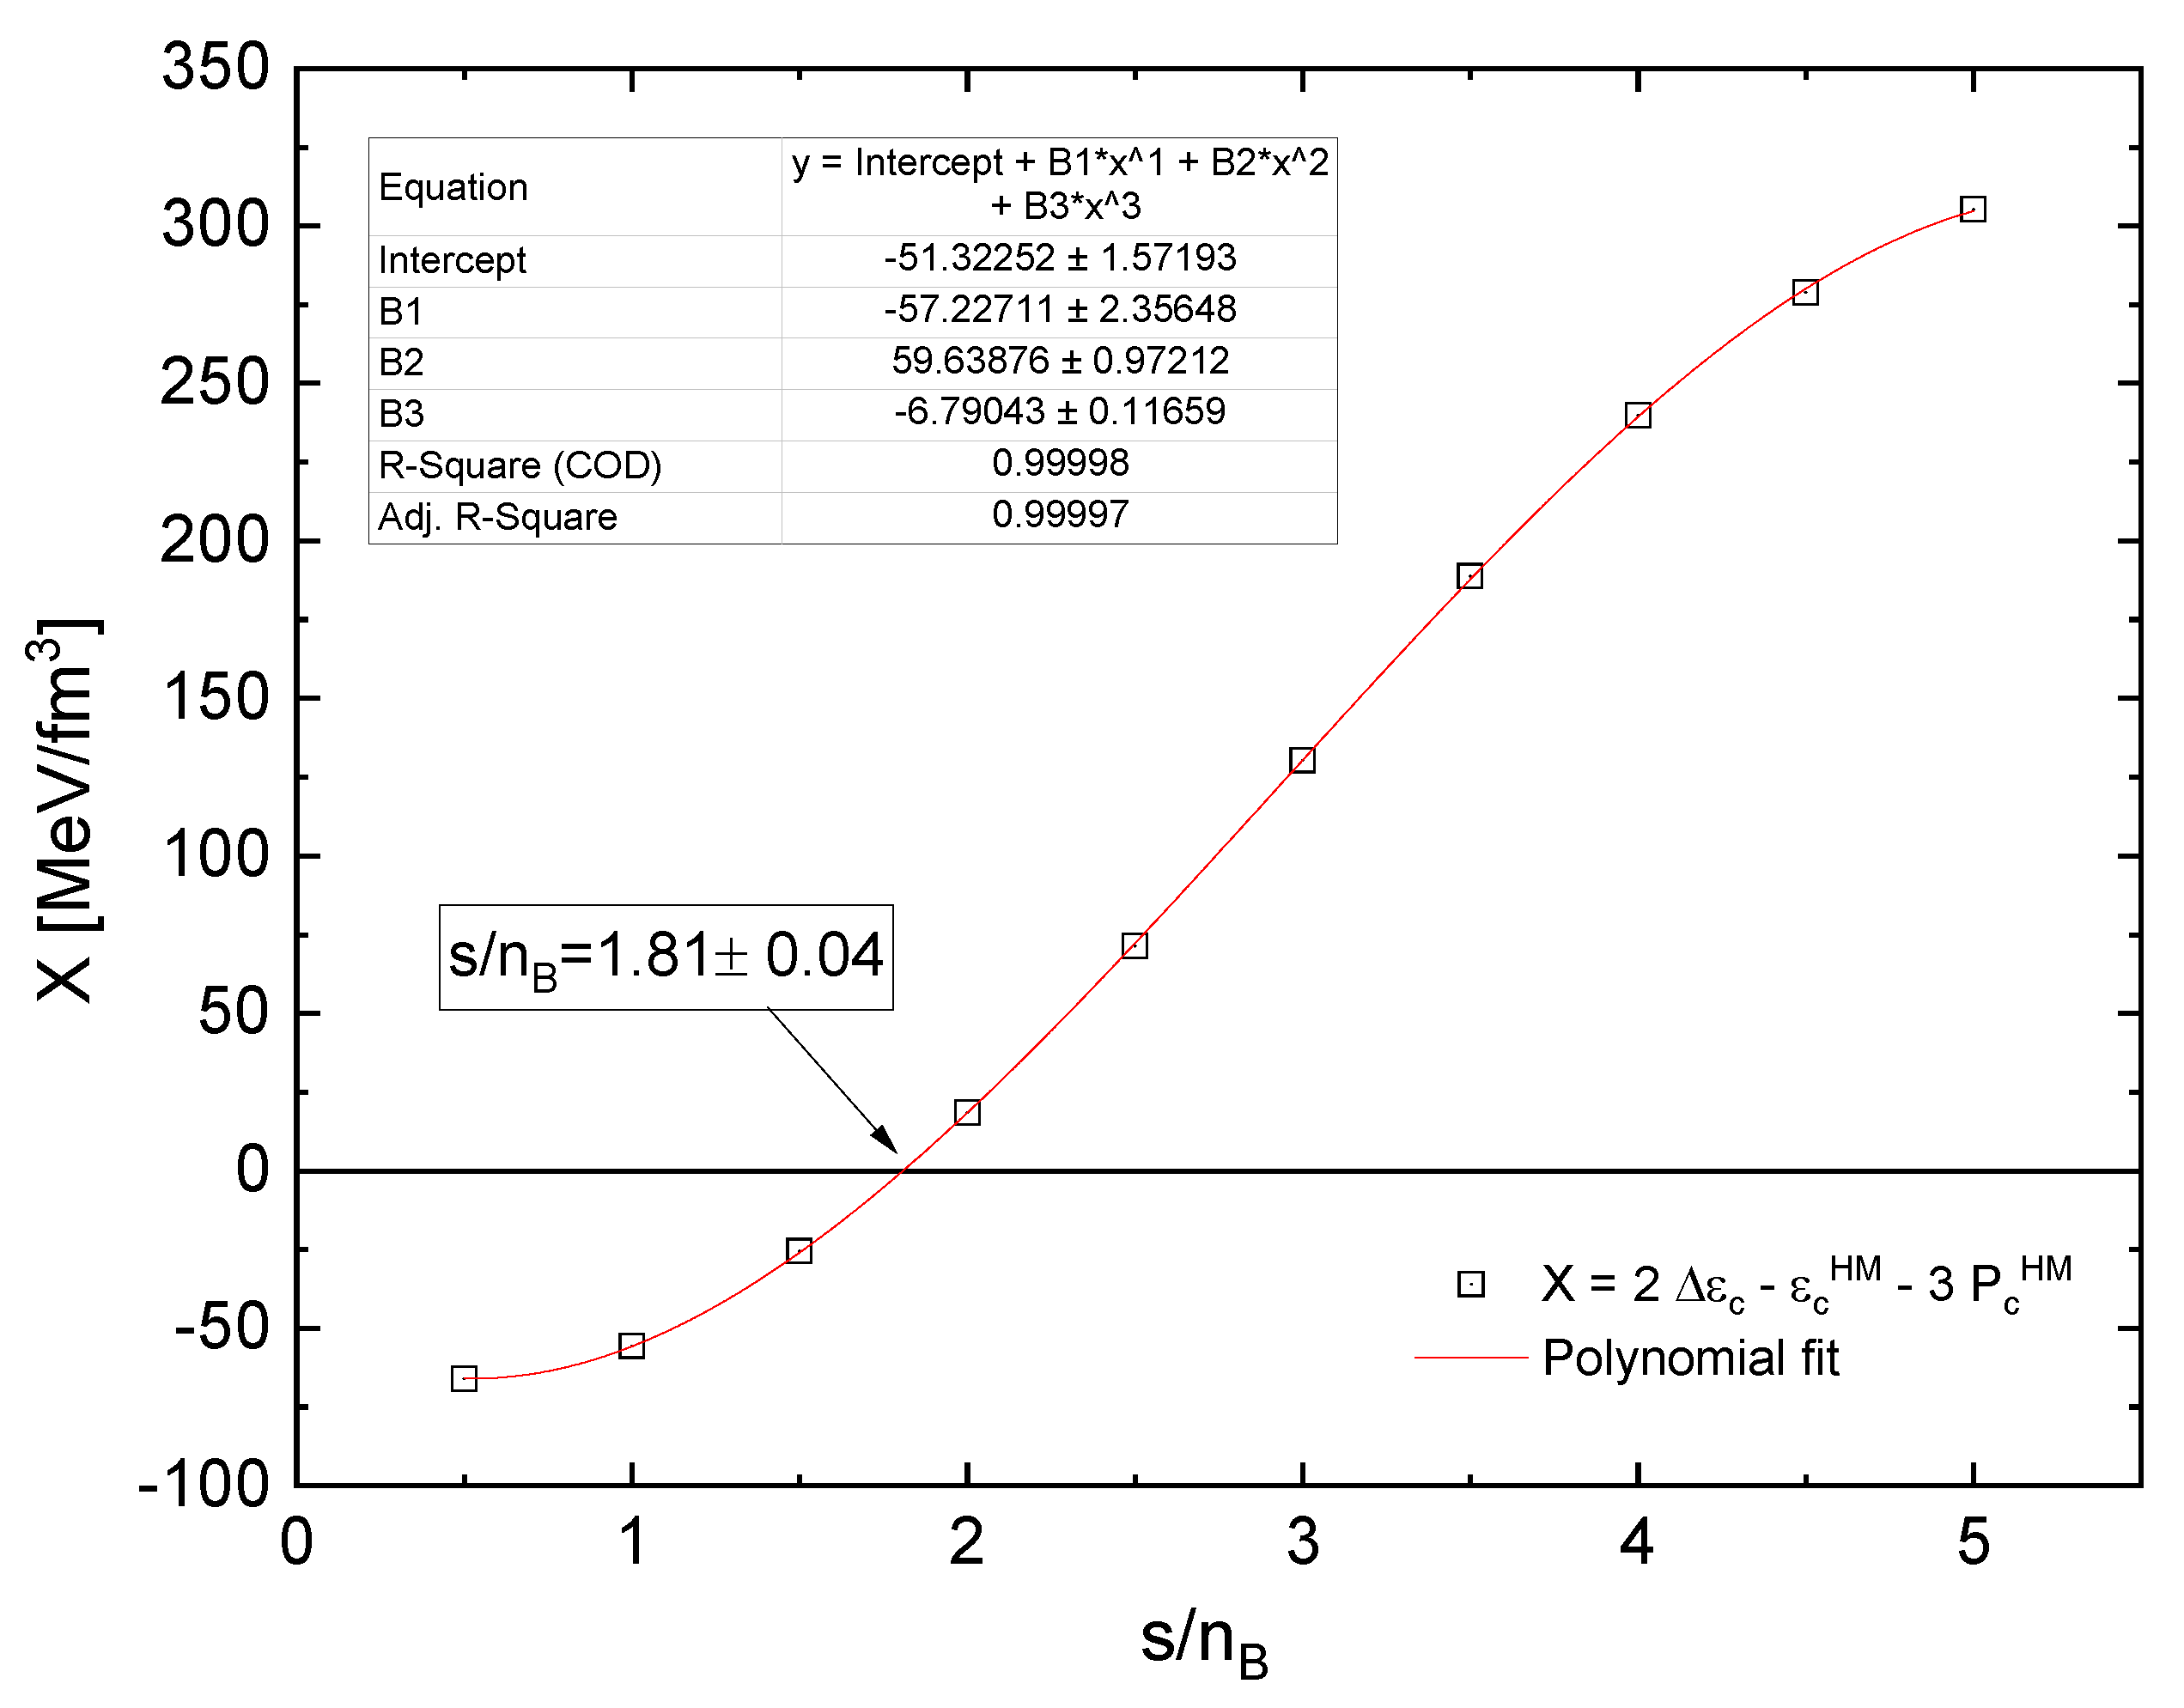
13) for instability of compact star solutions is a necessary condition for the occurrence of the third family branch of hybrid stars. We will apply it here (to the best of our knowledge for the first time) also for hot hybrid star configurations as an indicator for the minimal value of the entropy per baryon that is required as a condition for the appearance of the thermal twin star branch
In
Figure 14 we show the dependence of
X on the entropy per baryon and fit this dependence with a cubic function. This allows us to find the zero of this function at
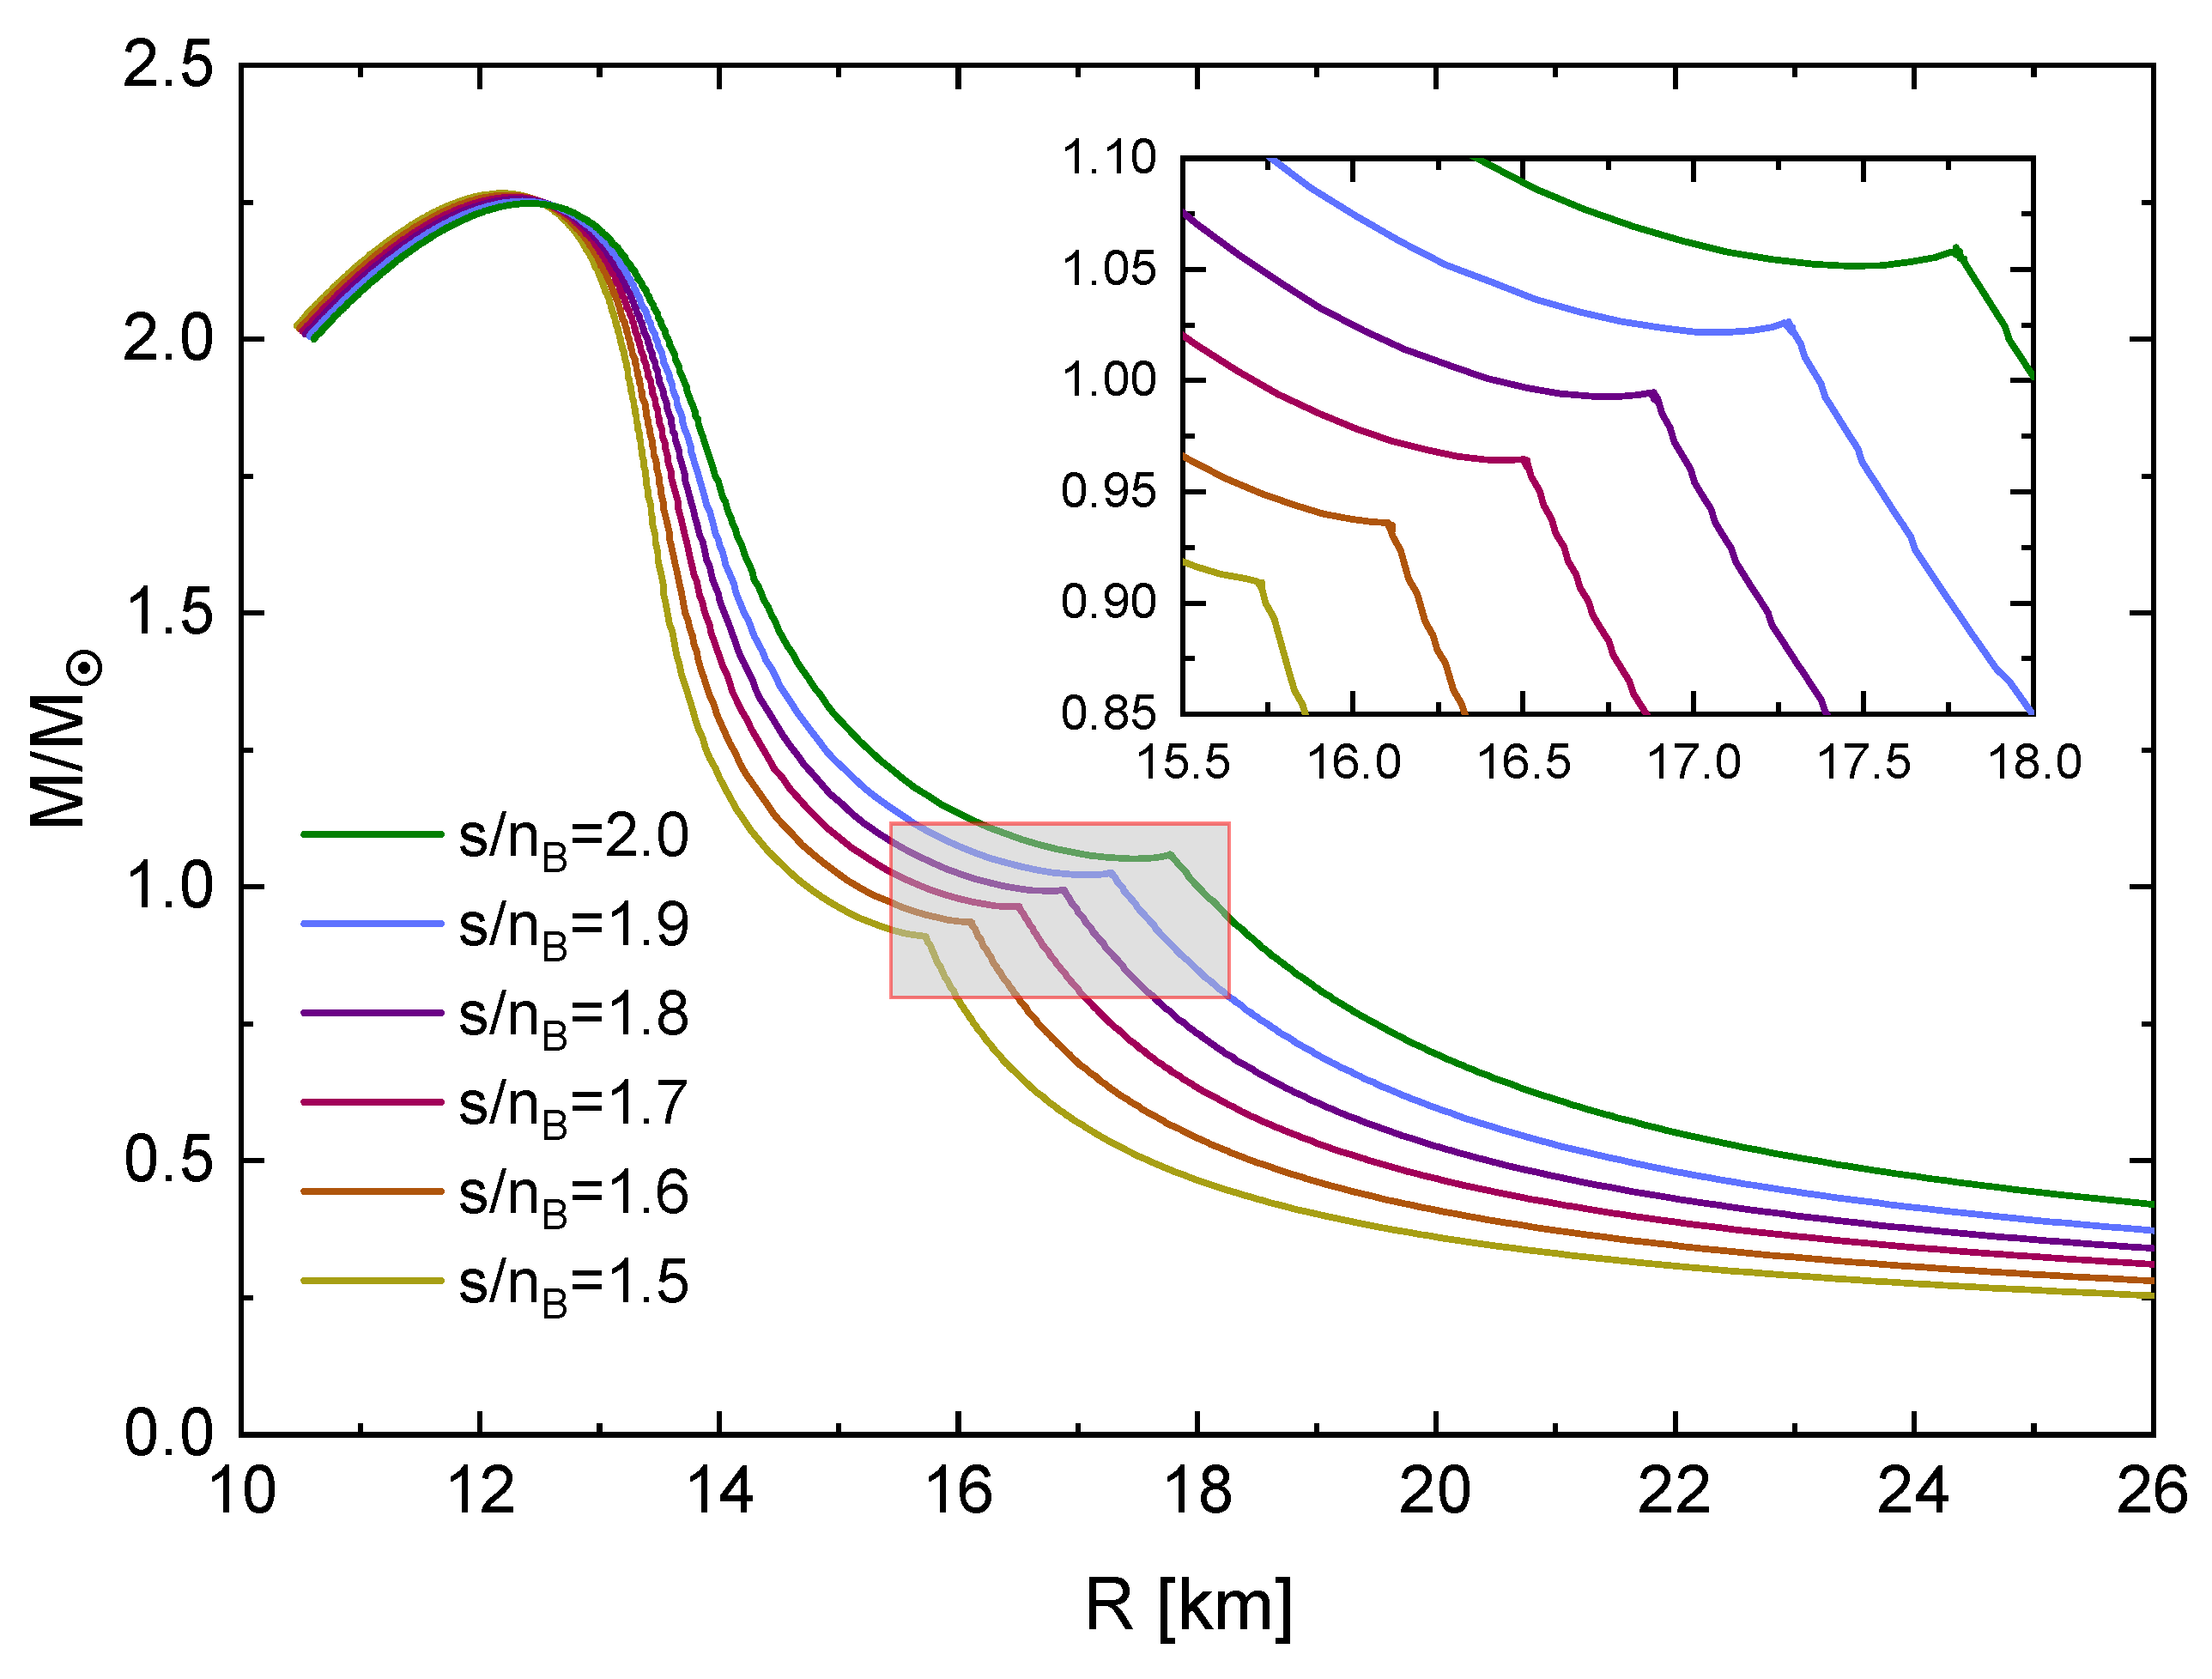
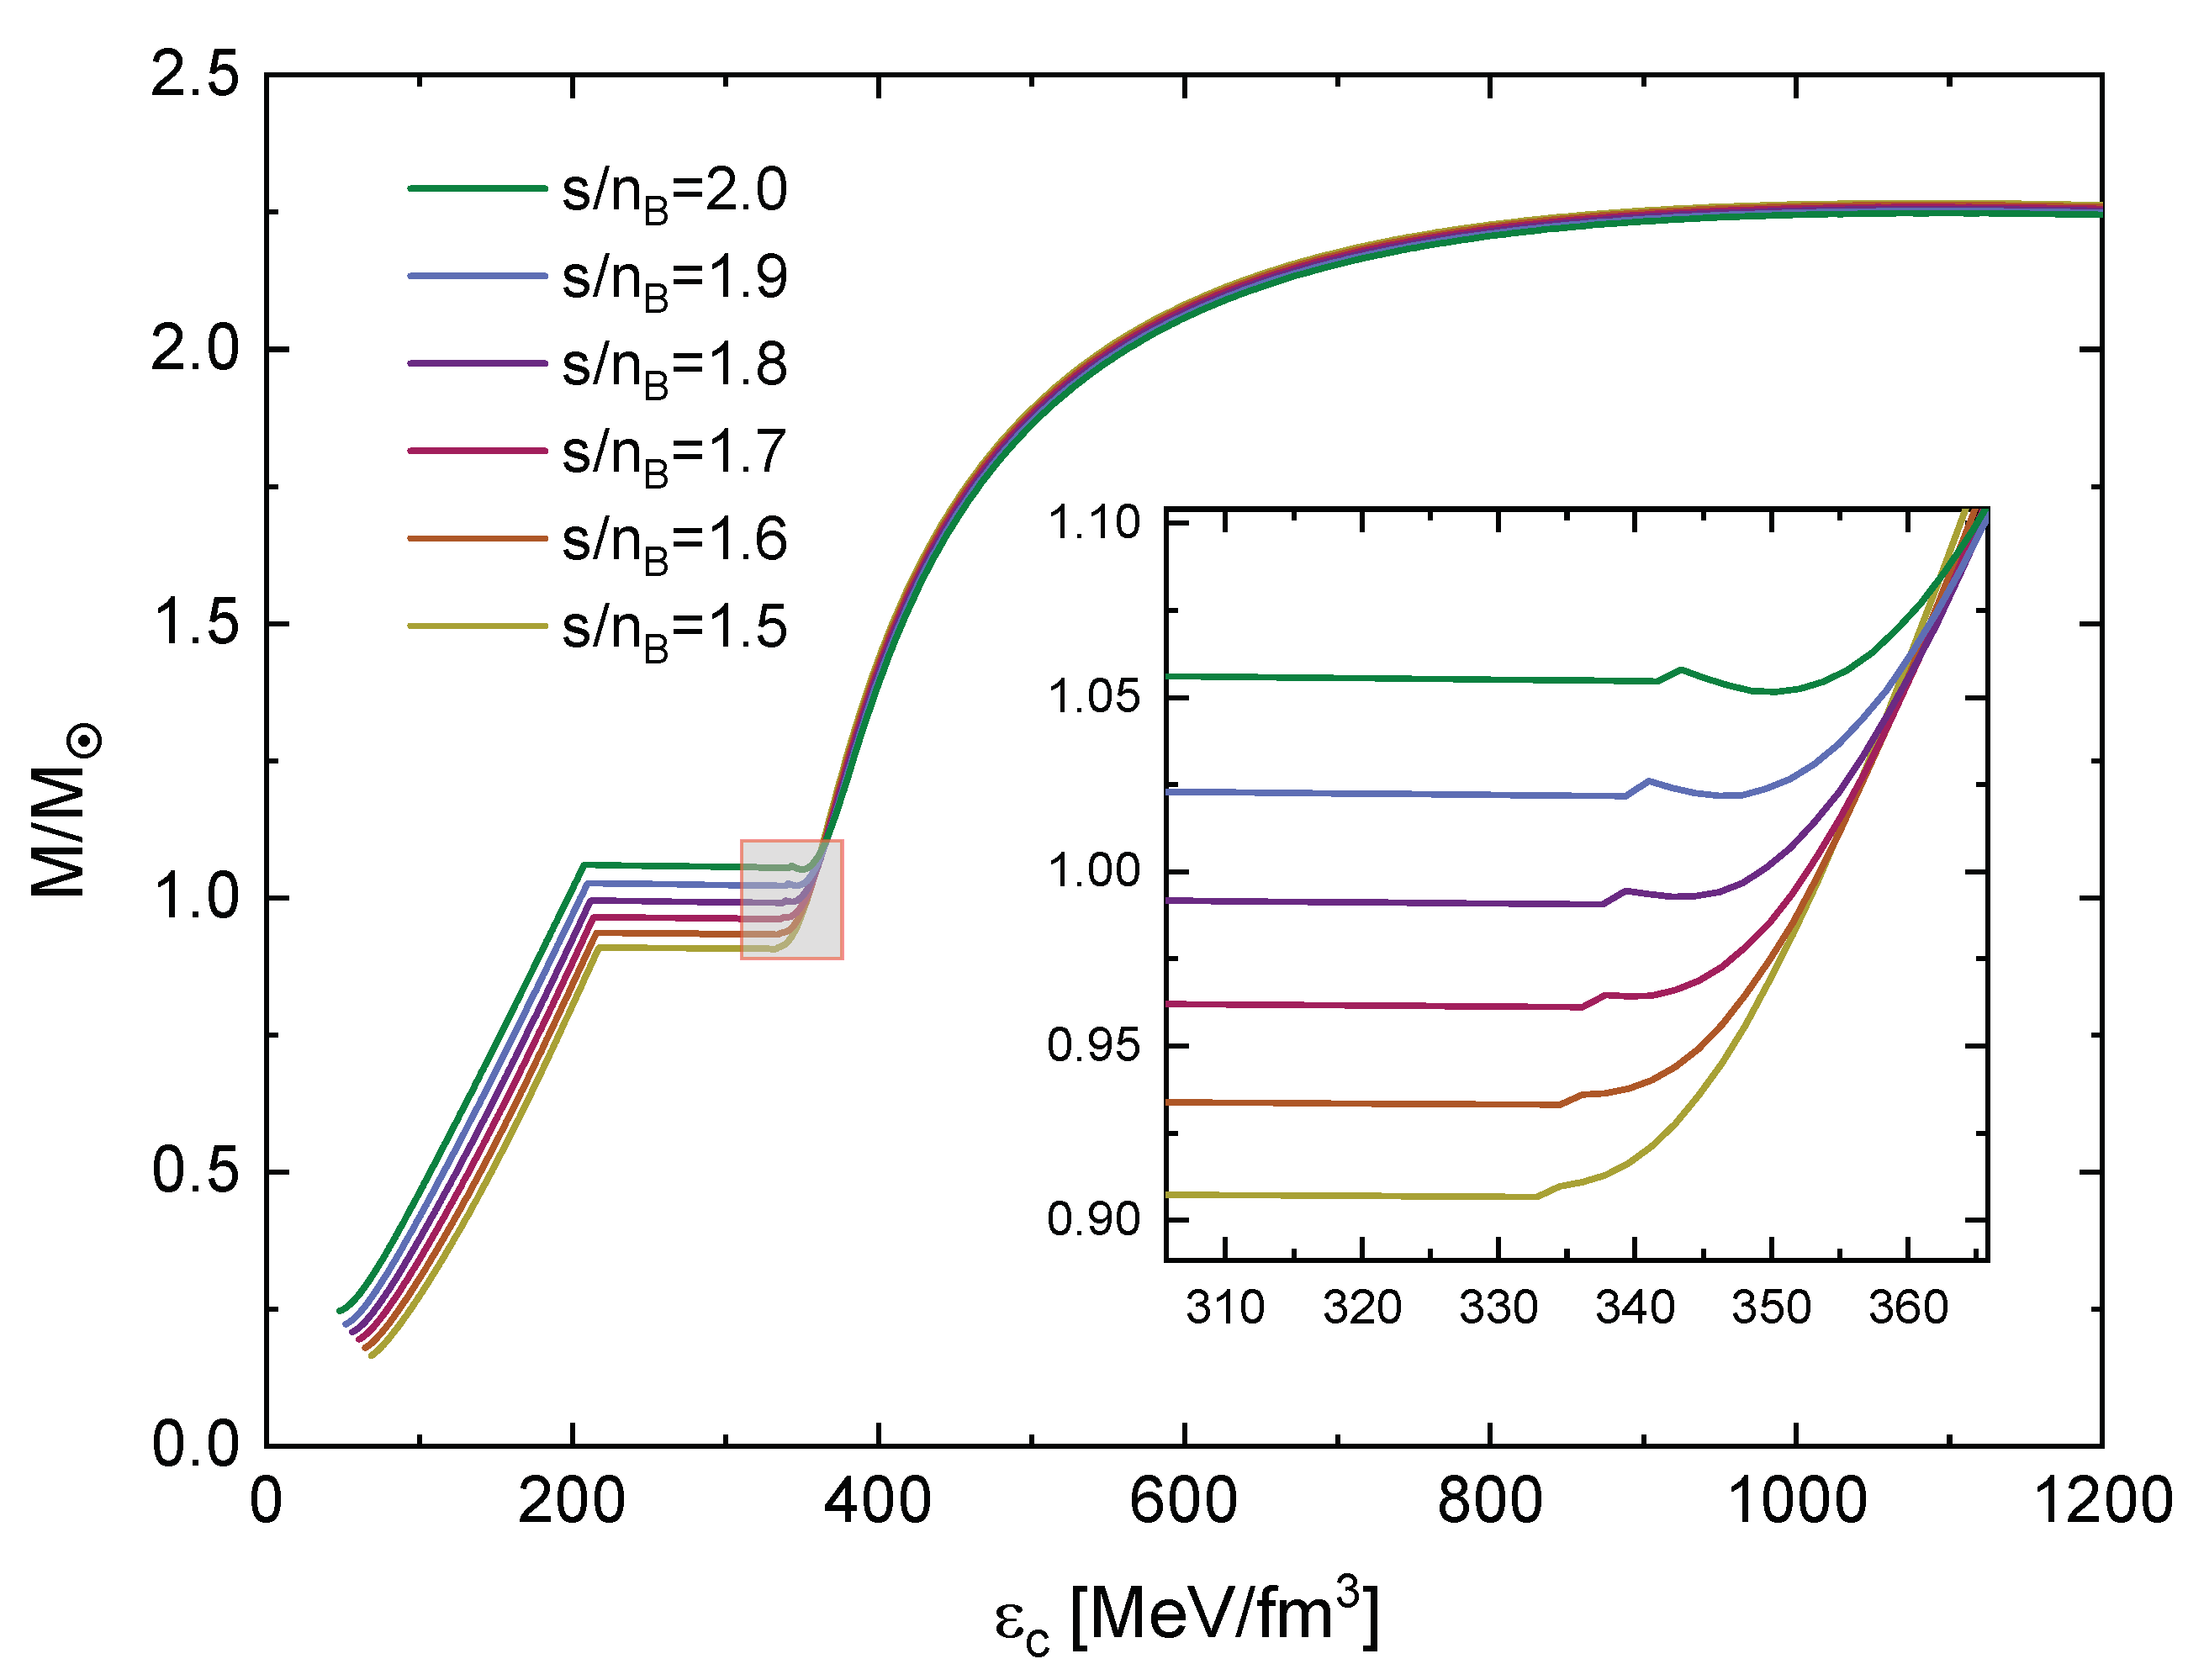
. In order to test this prediction for the critical entropy per baryon where to expect the onset of the thermal twin behavior, we show in
Figure 15 and
Figure 16 the mass-radius and mass-central energy density diagrams for the finer interval of
, respectively. From the magnified close-ups in the insets, one can confirm that the Seidov criterion (
13) works remarkably well in predicting the onset of the thermal mass twin instability. This is not trivial because the Seidov criterion was derived for the zero temperature case. We conjecture that the successful application of the Seidov criterion is justified in the special case we consider here because the instability occurs in the vicinity of the value
, where the deconfinement phase transition is approximately isothermal.
In a subsequent systematic investigation of other hybrid EOS at finite temperature, the conjecture for the applicability of the Seidov criterion as an indicator for the onset of the thermal twin instability shall be tested. If the conjecture can be confirmed, this would have significant implications for the phenomenology of protoneutron star evolution during a supernova explosion, as well as for accreting neutron stars in binaries. It would enable statements about dynamical stability based solely on the static properties of the EOS.
