Submitted:
23 June 2024
Posted:
25 June 2024
You are already at the latest version
Abstract
Keywords:
1. Introduction

1.1. Gamification
1.2. Serious Games
- Educational Games: These games are created with the purpose of teaching specific skills or knowledge. They can cover areas such as mathematics, science, history, languages, and many other subjects. For instance, Annetta [26] presents a theoretical framework for the design of serious educational games, analyzing the importance of games as teaching tools and proposing a learner-centered approach. Annetta emphasizes how educational games can be effectively designed to teach specific skills and knowledge in areas like mathematics, science, history, and languages. The framework also addresses the importance of feedback, challenge, and motivation in the successful design of educational games.
- Training Games: These games are used to train individuals in technical or professional skills. They can simulate work situations or practical scenarios to enhance learning and decision-making. Sitzmann [27] has studied the instructional effectiveness of computer-based simulation games, including those used for professional training. The research focuses on how these games can improve learning and the acquisition of technical skills, reviewing a wide range of studies and empirical evidence to evaluate the effectiveness of simulation games compared to other training approaches. The study addresses aspects such as skill transfer, motivation, and learning satisfaction.
- Simulation Games: These games are used to recreate real-life situations and allow users to practice skills in a safe environment. Examples include flight simulators, medical simulators, or business management simulators. Aldrich [28] discusses how simulation games can recreate real-life scenarios, providing users with practical experience to safely practice skills. The analysis includes the benefits and challenges associated with using simulation games in learning environments [29].
- Health Games: These games focus on promoting health and well-being. They may address topics such as nutrition, physical exercise, stress management, or disease prevention. Primack et al. [30] conducted a systematic review of the literature to explore the role of video games in improving health-related outcomes. The study examines health games that address issues like nutrition, physical exercise, stress management, and disease prevention. The review analyzes various research studies and empirical evidence to evaluate the benefits of health games in promoting healthy behaviors and improving health outcomes, discussing aspects such as motivation, engagement, and effectiveness.
- Social Awareness Games: These games aim to raise awareness and understanding of social issues such as poverty, discrimination, climate change, or human rights. Arnab et al. [31] investigated the relationship between learning elements and game mechanics in serious games, focusing on social awareness games. The study examined how learning elements such as social awareness and understanding of social issues can be mapped through game mechanics in this type of game. The authors present a theoretical and analytical framework for analyzing serious games, specifically those addressing social issues. Examples and case studies are discussed to illustrate how games can raise awareness and foster understanding of relevant social issues.
- Safety Games: These games focus on teaching safety measures and procedures in various environments such as workplaces, industries, homes, or transportation [32].
- Problem-Solving Games: These games encourage critical thinking and problem-solving skills. They may present logical challenges, puzzles, or scenarios where players must find effective solutions. Pellegrini [33] examines research and evidence on the use of computer games for learning, including problem-solving games. The study addresses topics such as critical thinking, problem-solving, and skill transfer in the context of learning games.
1.3. UrbanGame as Serious Games
2. Materials and Methods
2.1. Design and Preparation of the Simulation
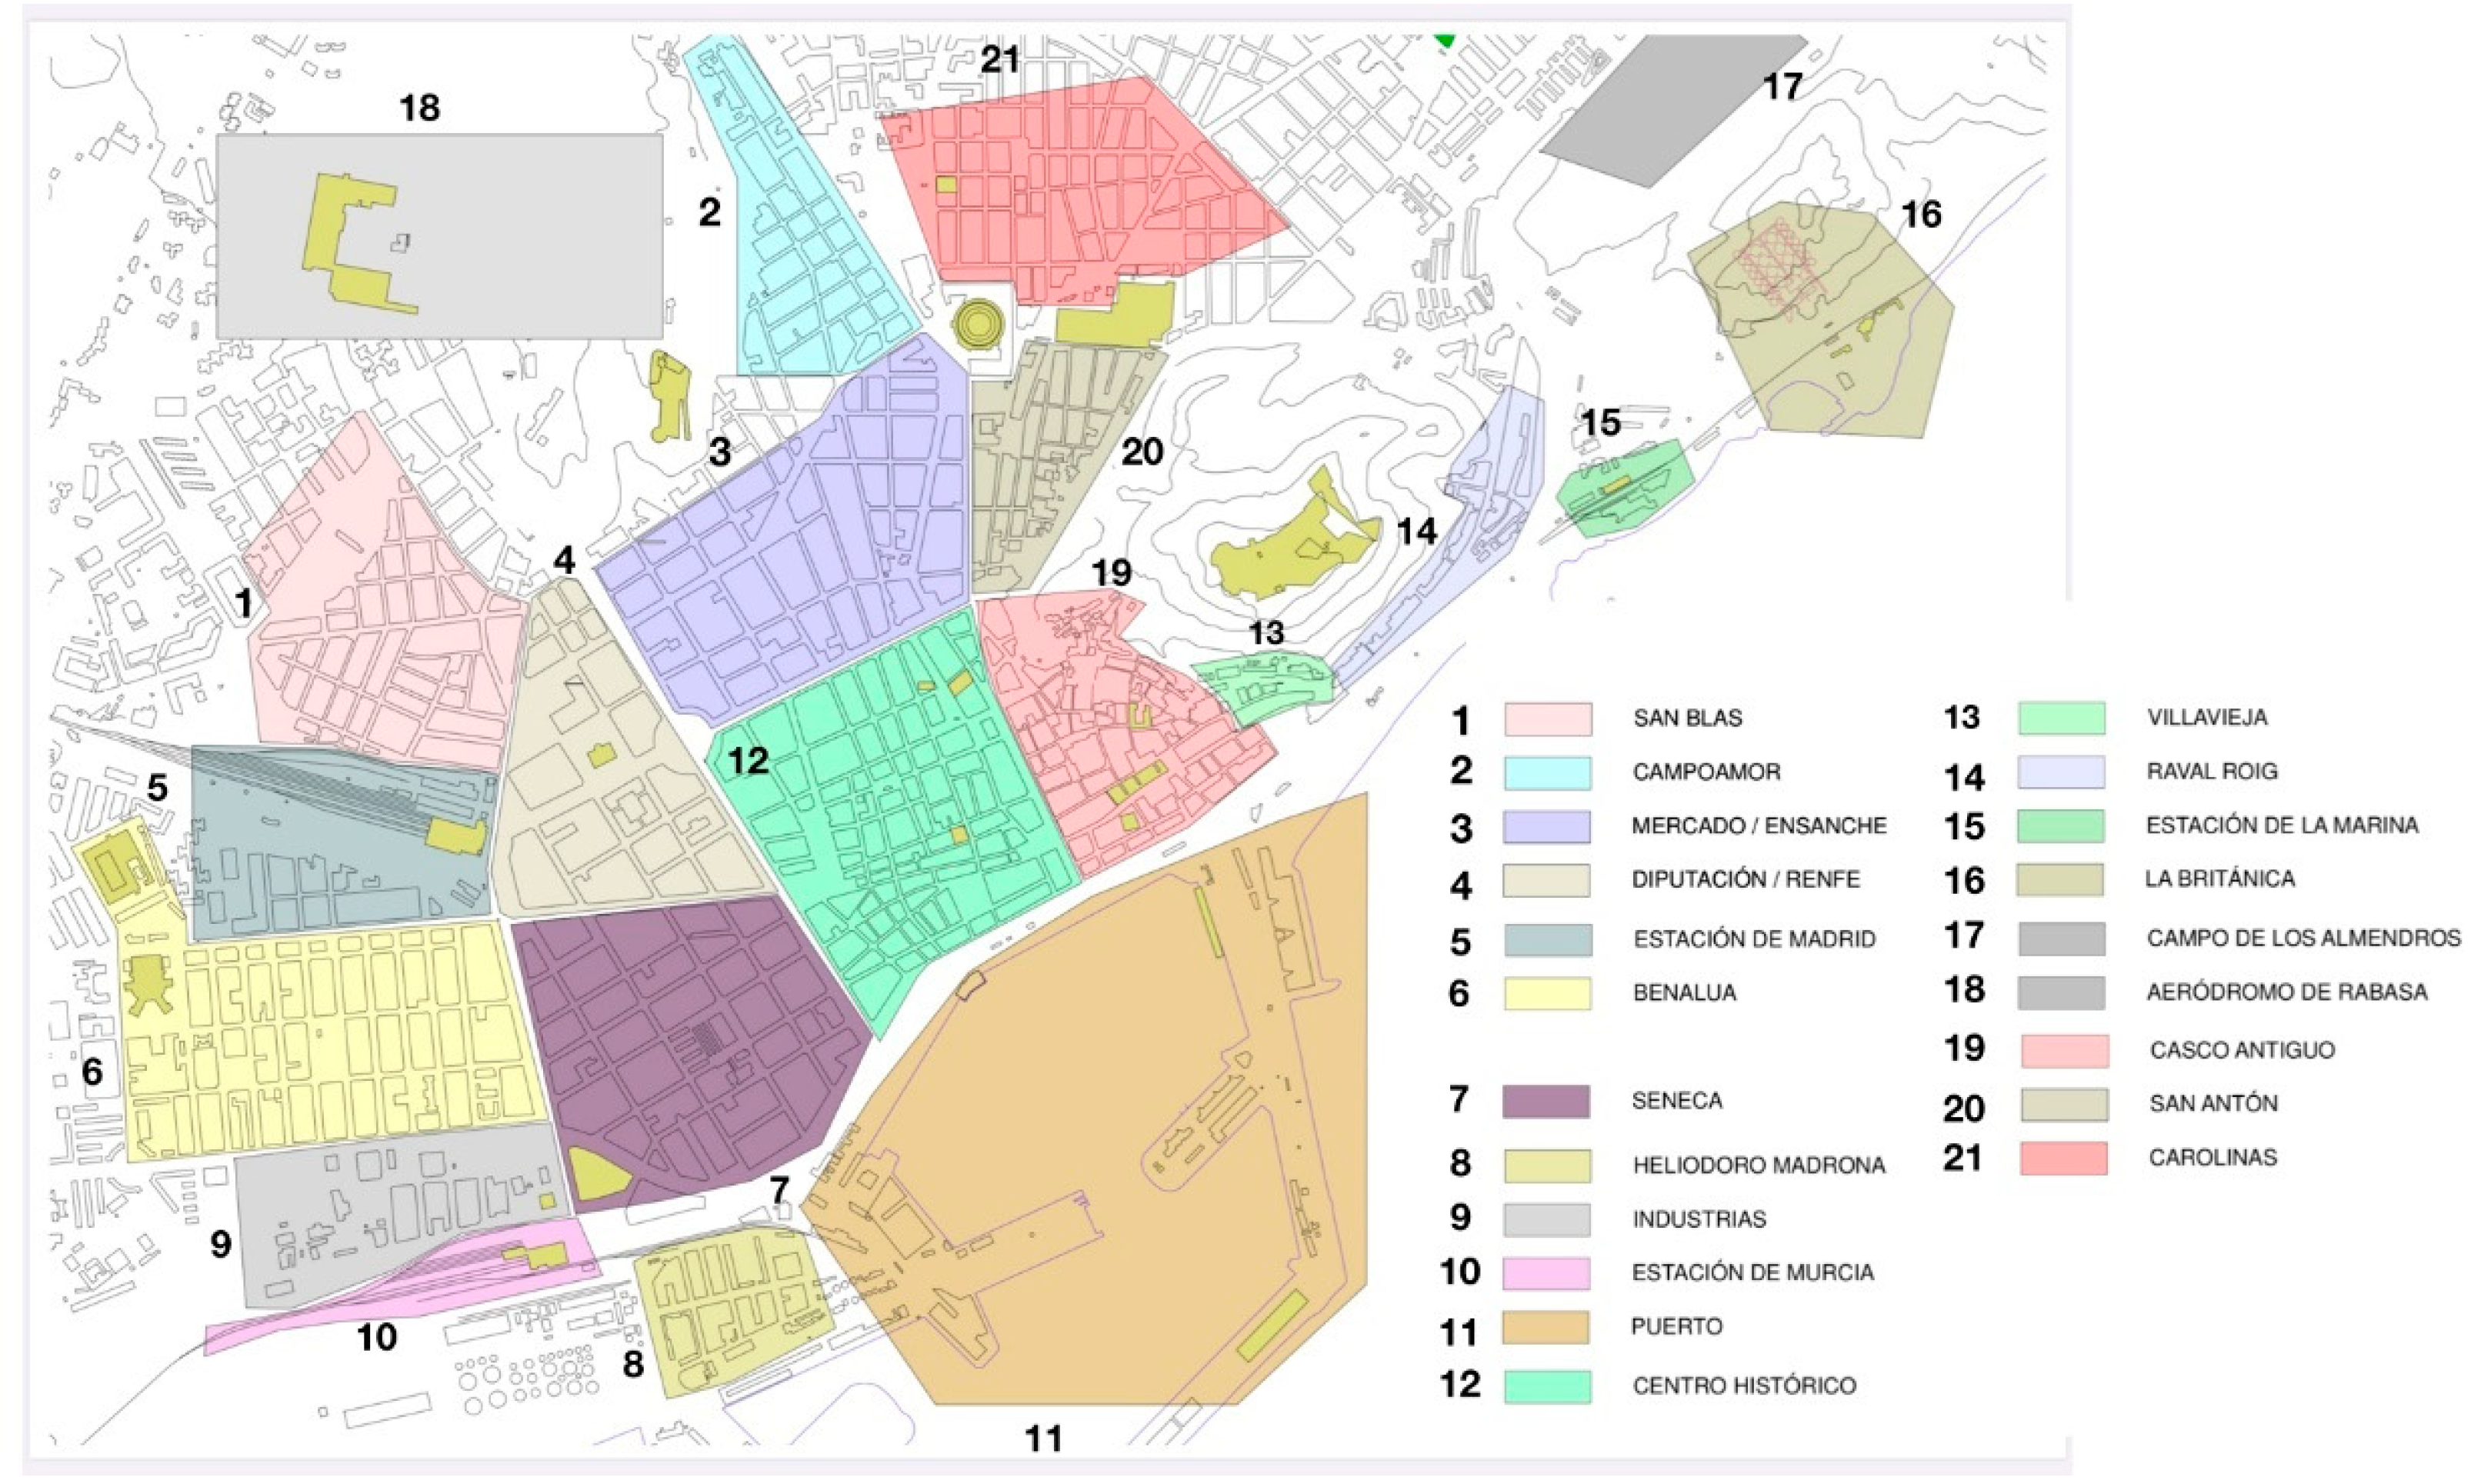
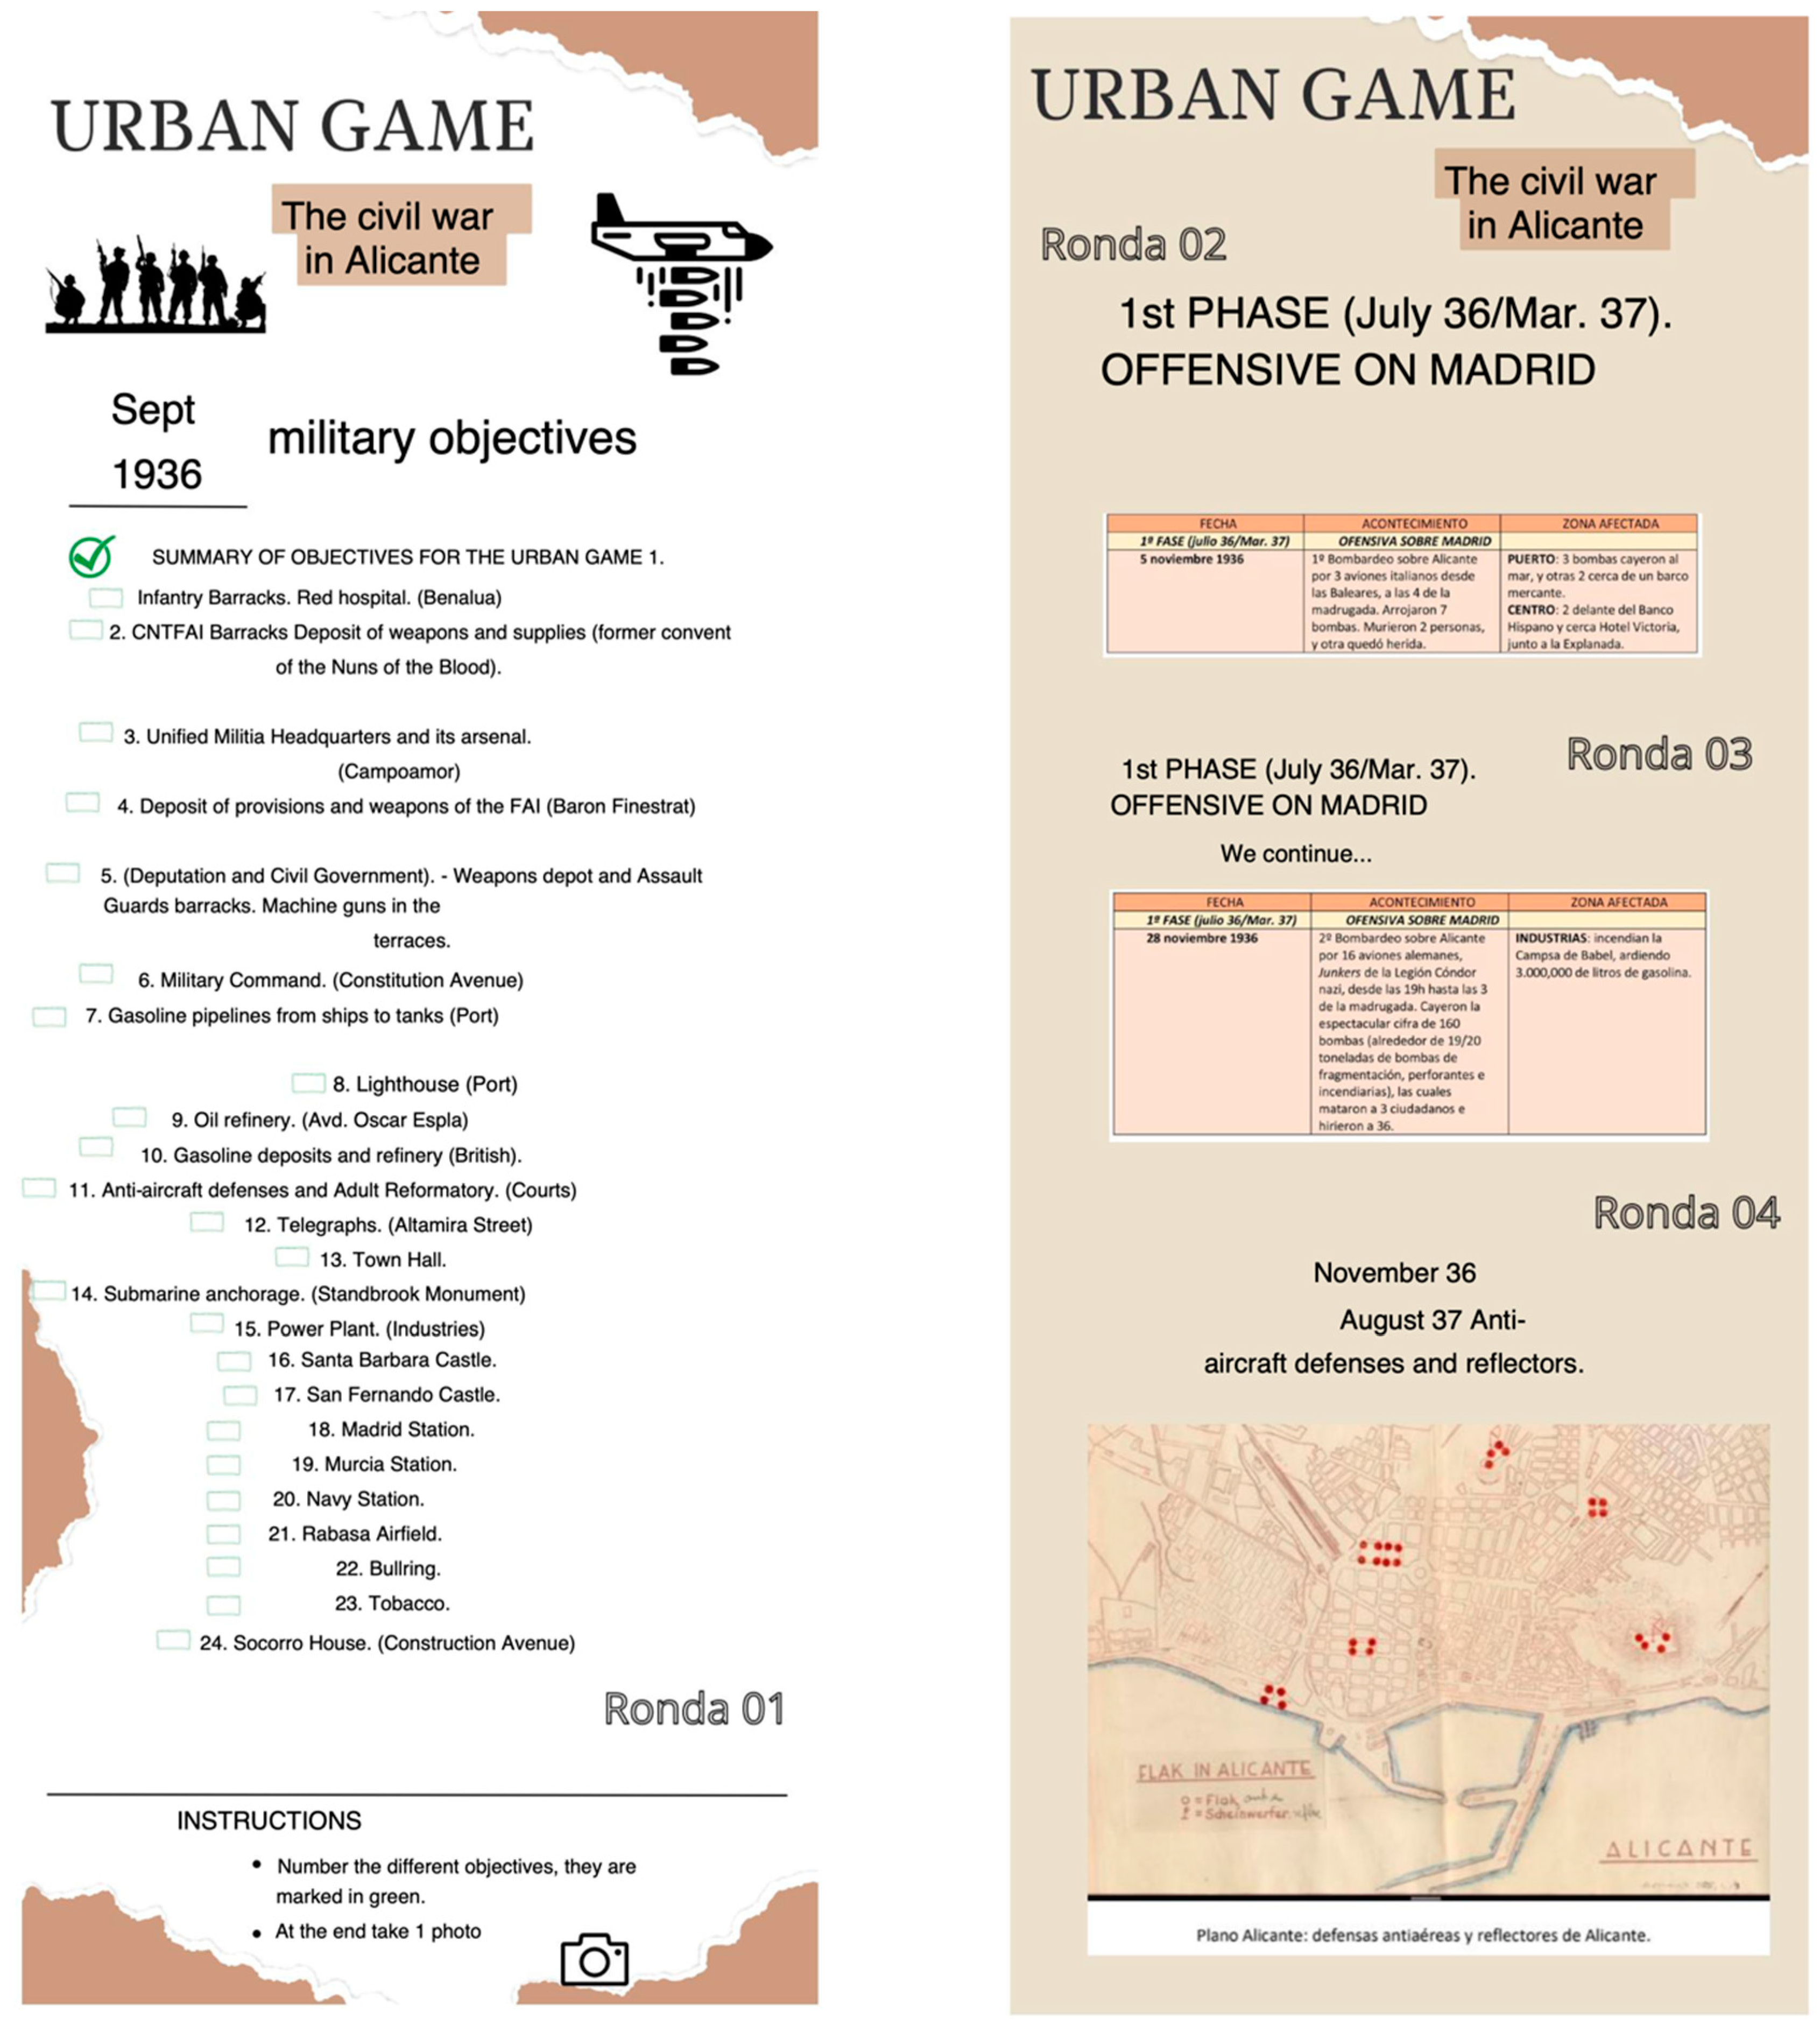


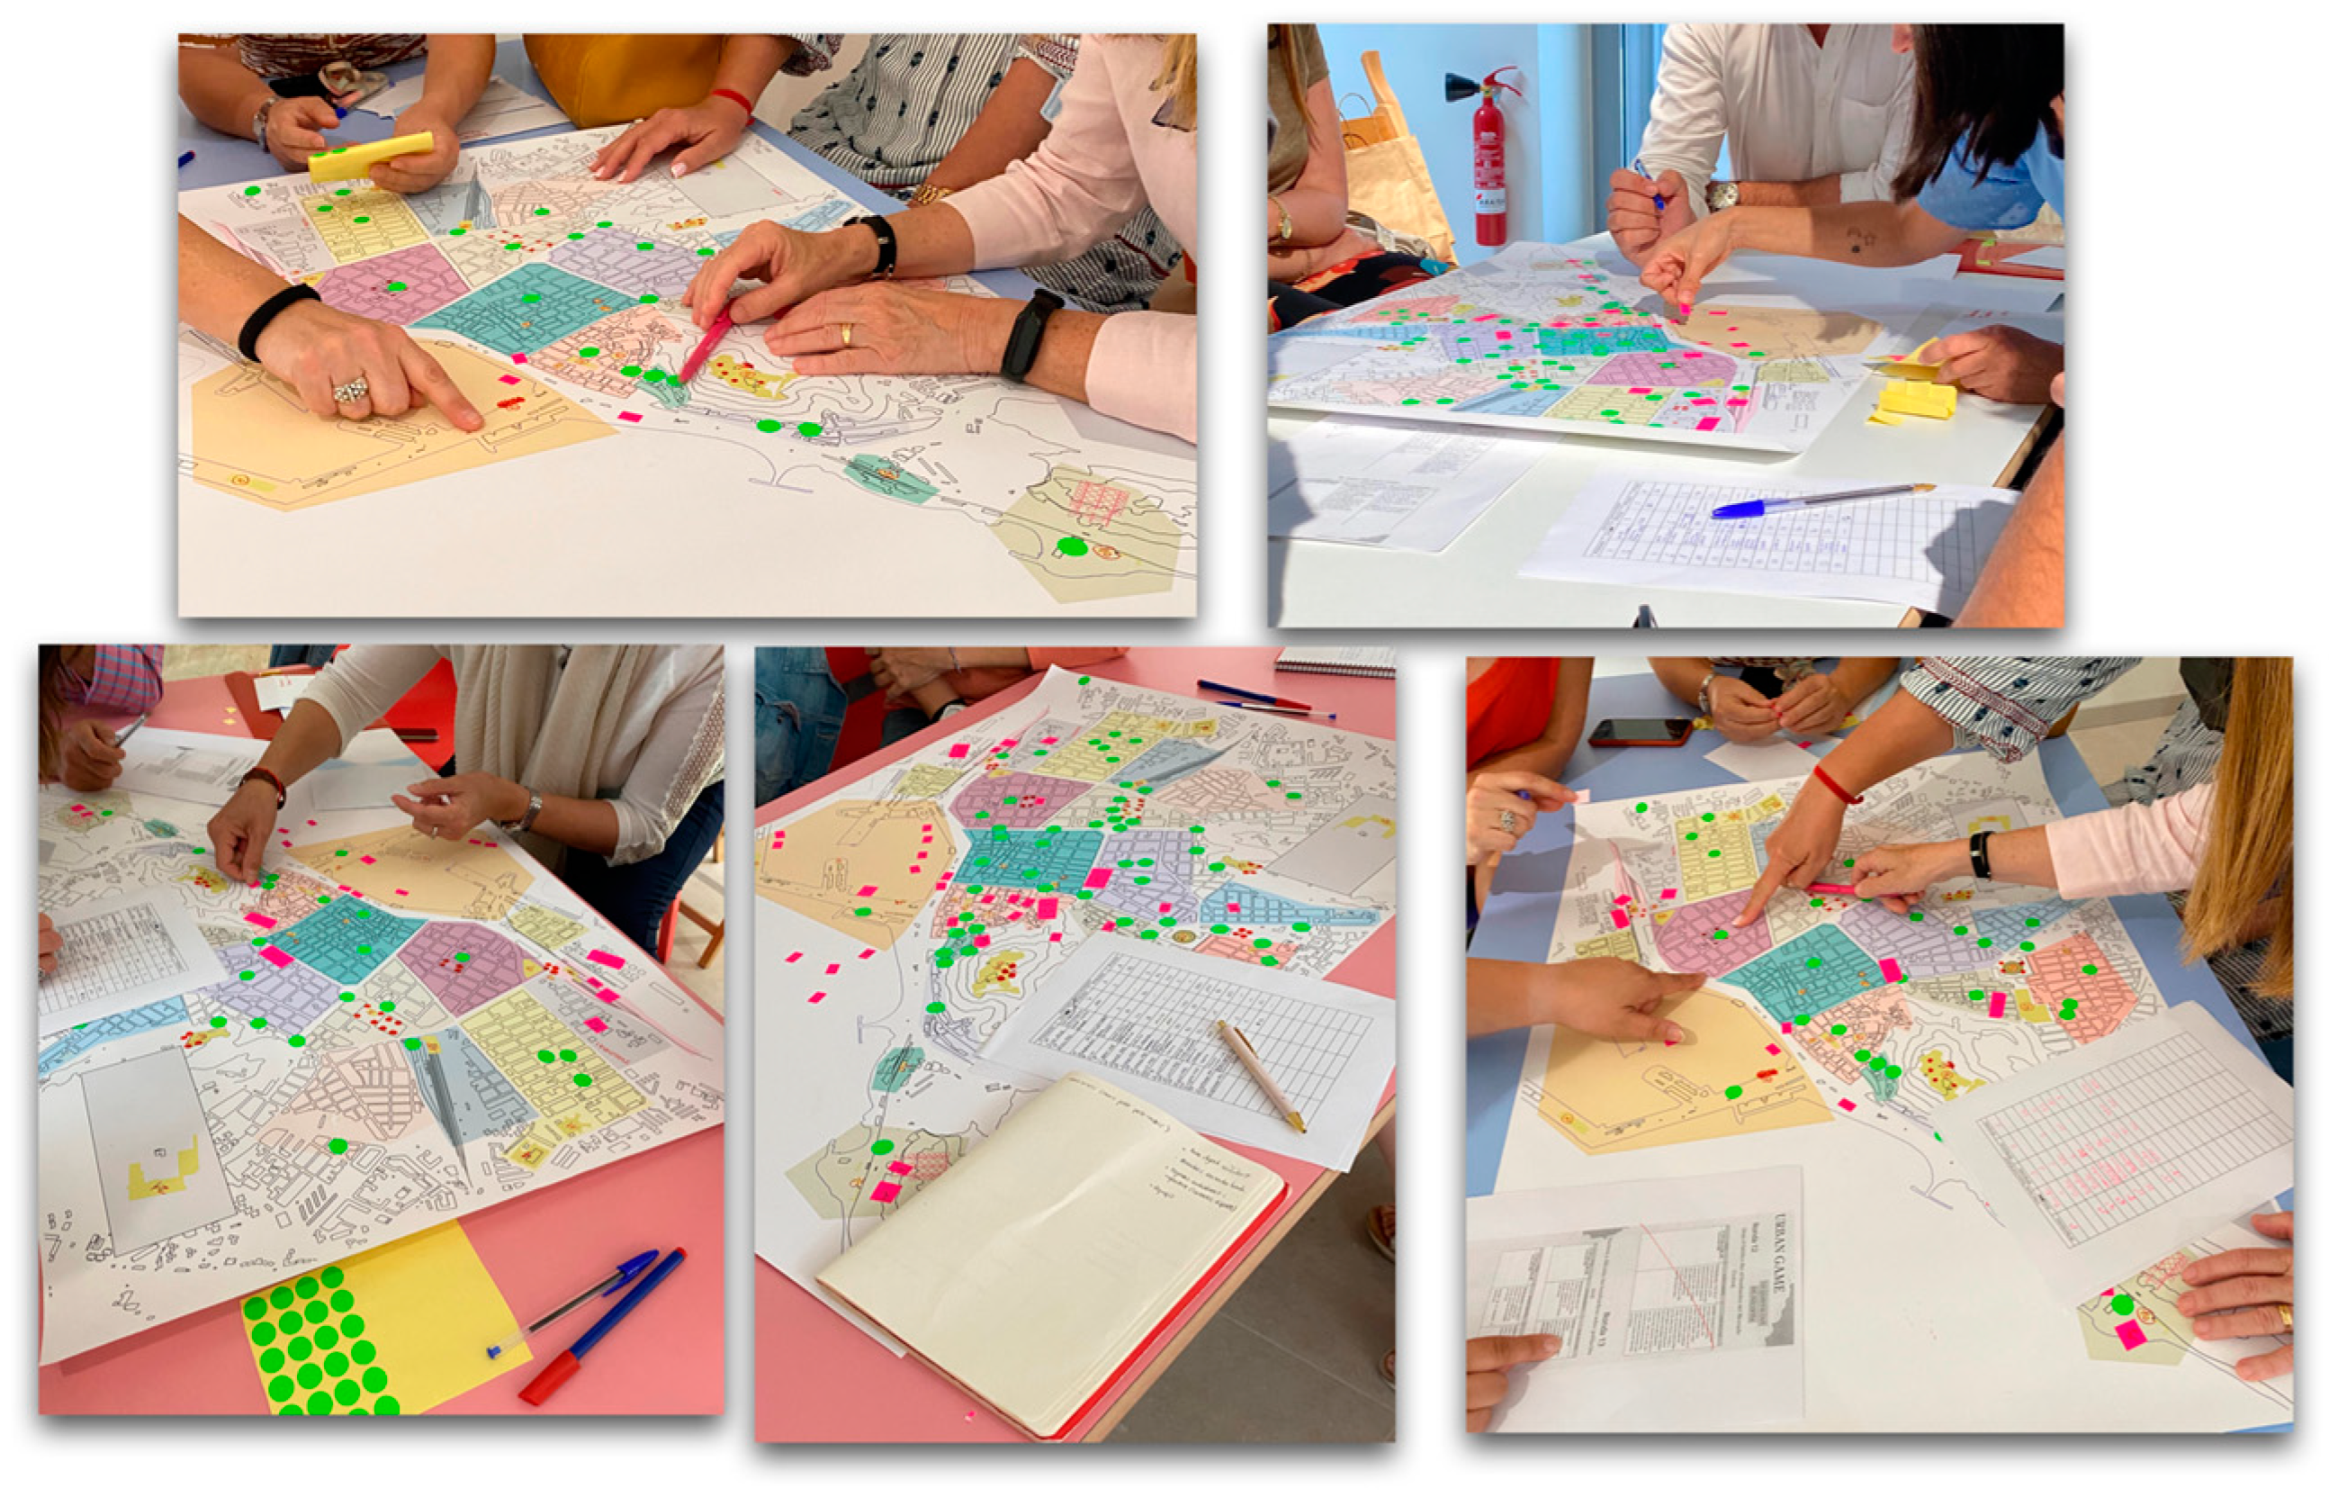
2.2. Validation with Faculty and Activity Design for Students
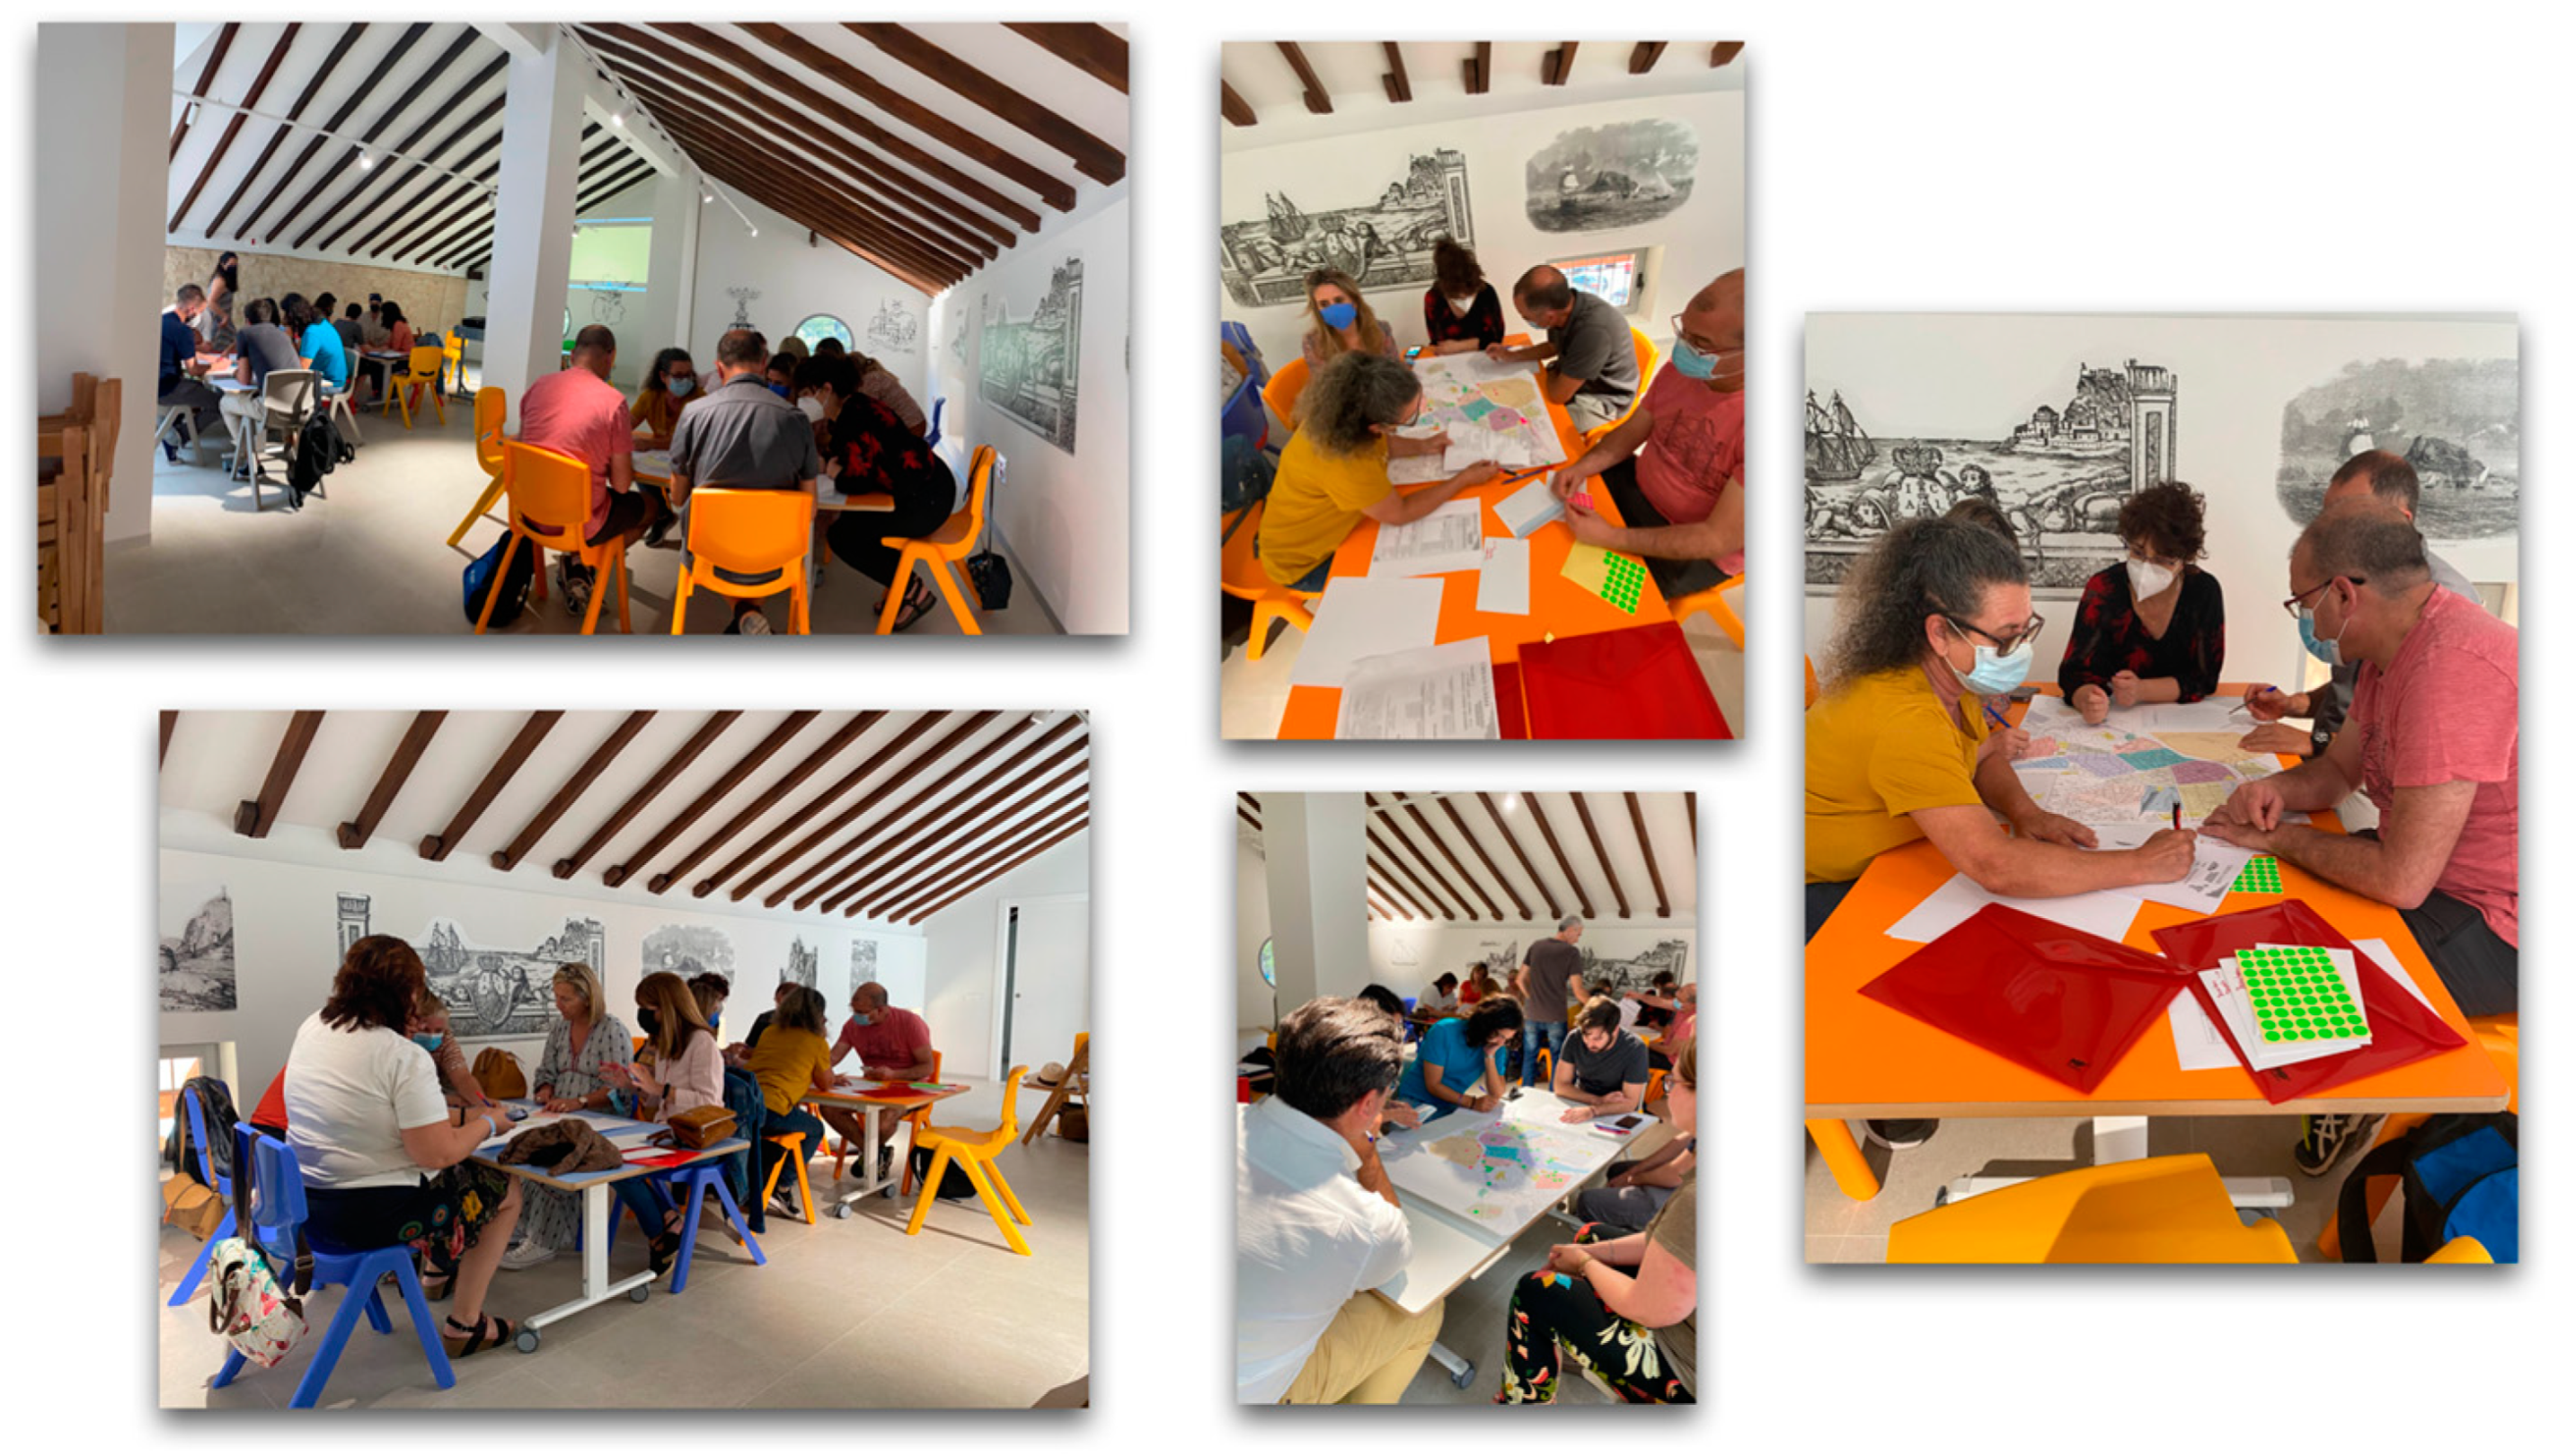
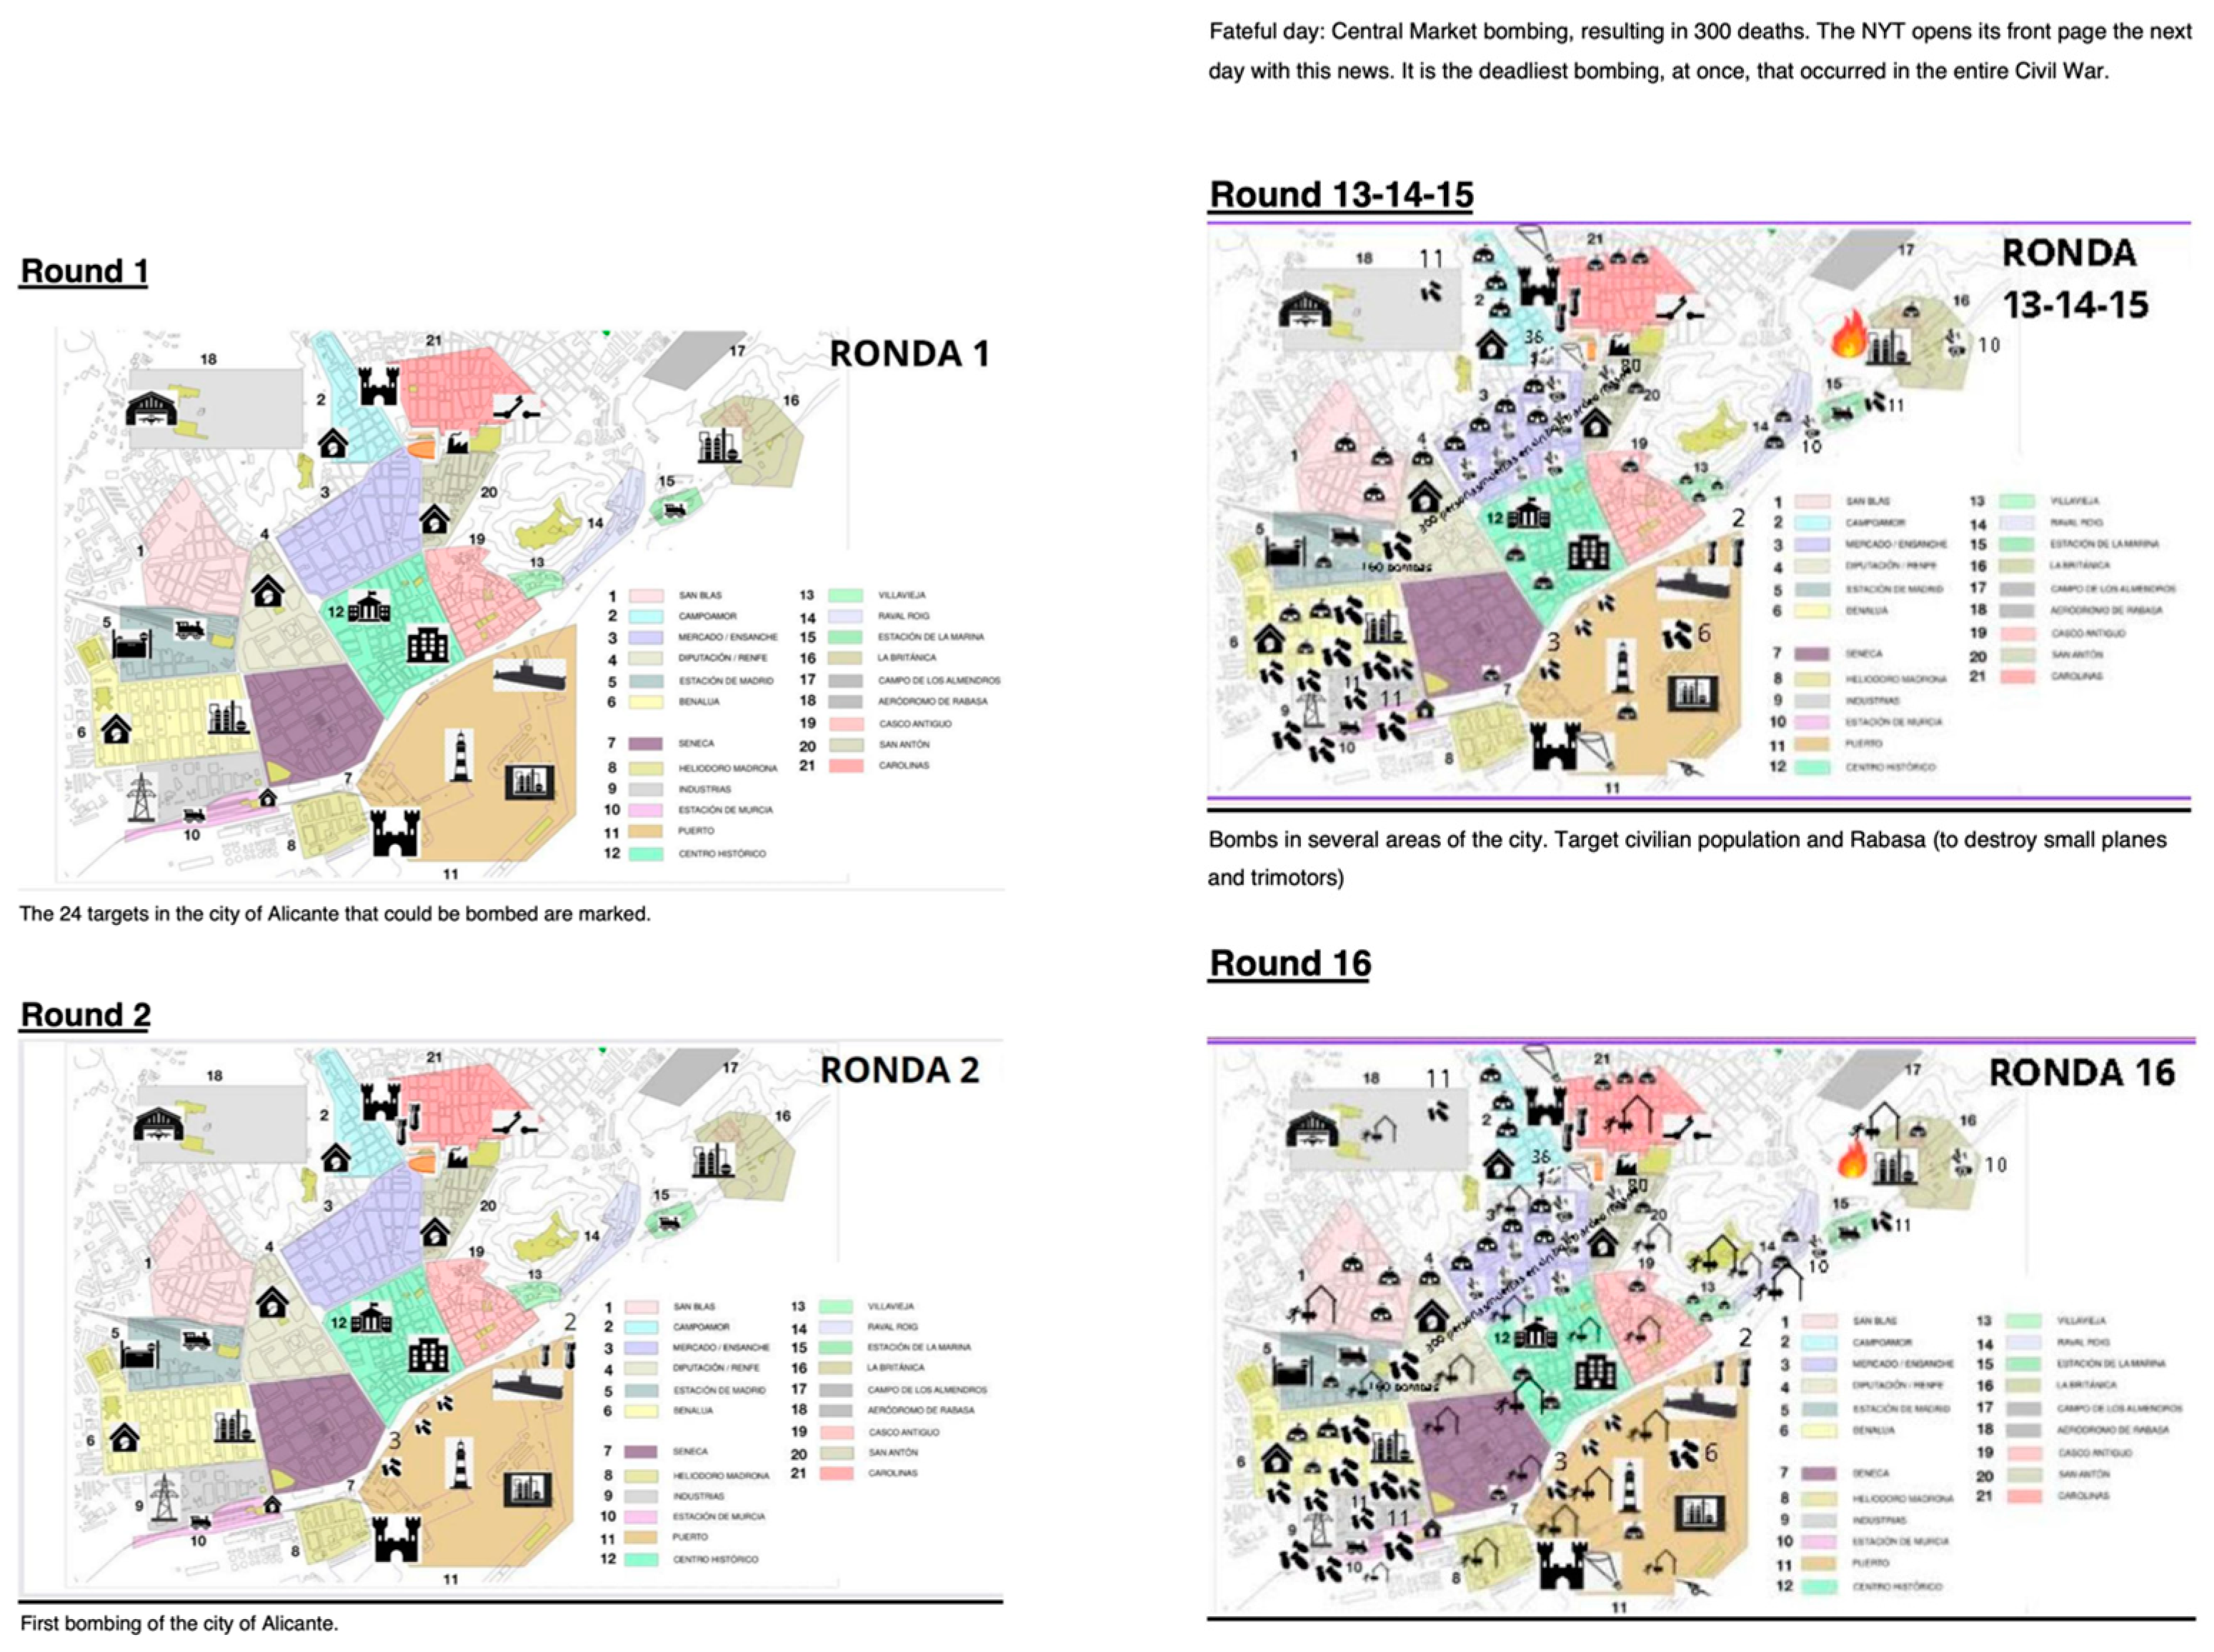
- Students will be asked to express their emotions, which may vary from empathy, anxiety, anguish, or calm during different moments of the activity, such as bombings, passive defense, construction or absence of shelters, and the threat of espionage.
- The dynamics and roles that have emerged will be evaluated, such as the emergence of a natural leader, the adoption of different roles, the prevalence of certain actions over others, reading documents, moments of dialogue and confrontation of ideas, competitiveness, or passivity.
- The activity also helps students better understand the reality around them, including situations involving women, children, the elderly, or refugees. It will be evaluated whether students empathize more from everyday or institutional perspectives and how they apply what they have learned to real life by learning more about the neighborhoods and urban layout of their city.
- During the simulation, students should identify several learning elements, such as the phases of the war, the massive arrival of refugees, escape by boats, food shortages, and bombings of civilian buildings.
- Students will speculate about different hypothetical scenarios to consolidate historical causality processes. For example, they might be asked what would have happened if the sirens had sounded during the bombing of Alicante's central market or if the ship Stambrook had not arrived at Alicante's port to save the last citizens of the Spanish Republic.
- It is crucial that students understand that situations similar to those simulated can recur in real life. This is the moment to empathize and reflect on behaviors in comparable real-life situations, allowing them to make informed decisions in the future.
2.3. Participants
2.4. Data Collection Instruments
2.5. Procedure
2.6. Data Analysis
2.7. Ethical Considerations
2.8. Data Collection Procedure
3. Results
3.1. Student Opinions on the Relationship Between Learning Strategies and the UrbanGame Activity
| Strategy | Mean | Std. Deviation |
|---|---|---|
| Collaborative Work | 4.1042 | 2.61940 |
| Meaningful Learning | 4.7083 | 2.46644 |
| Problem-Based Learning | 4.1875 | 2.25649 |
| Discovery Learning | 4.3958 | 2.40336 |
| Oral Expression | 3.0625 | 2.83148 |
| Motivation | 5.0625 | 2.55498 |
| Concentration | 5.5833 | 1.91115 |
| Strategy | Median | Std. Deviation | Variance |
|---|---|---|---|
| Collaborative Work | 4.0000 | 2.61940 | 6.861 |
| Meaningful Learning | 4.5000 | 2.46644 | 6.083 |
| Problem-Based Learning | 4.0000 | 2.25649 | 5.092 |
| Discovery Learning | 4.0000 | 2.40336 | 5.776 |
| Motivation | 7.0000 | 2.55498 | 6.528 |
| Concentration | 7.0000 | 1.91115 | 3.652 |
| Learning Strategy | Percentage |
|---|---|
| Collaborative Work | 22.9% |
| Meaningful Learning | 22.9% |
| Problem-Based Learning | 20.8% |
| Discovery Learning | 10.4% |
| Motivation | 6.3% |
| Concentration | 27.1% |
3.2. Non-Parametric Correlations in Strategies and Their Relationship to Learning Objectives
3.2.1. Analysis of Content Comprehension
| Strategy | H | p-value | Significance |
|---|---|---|---|
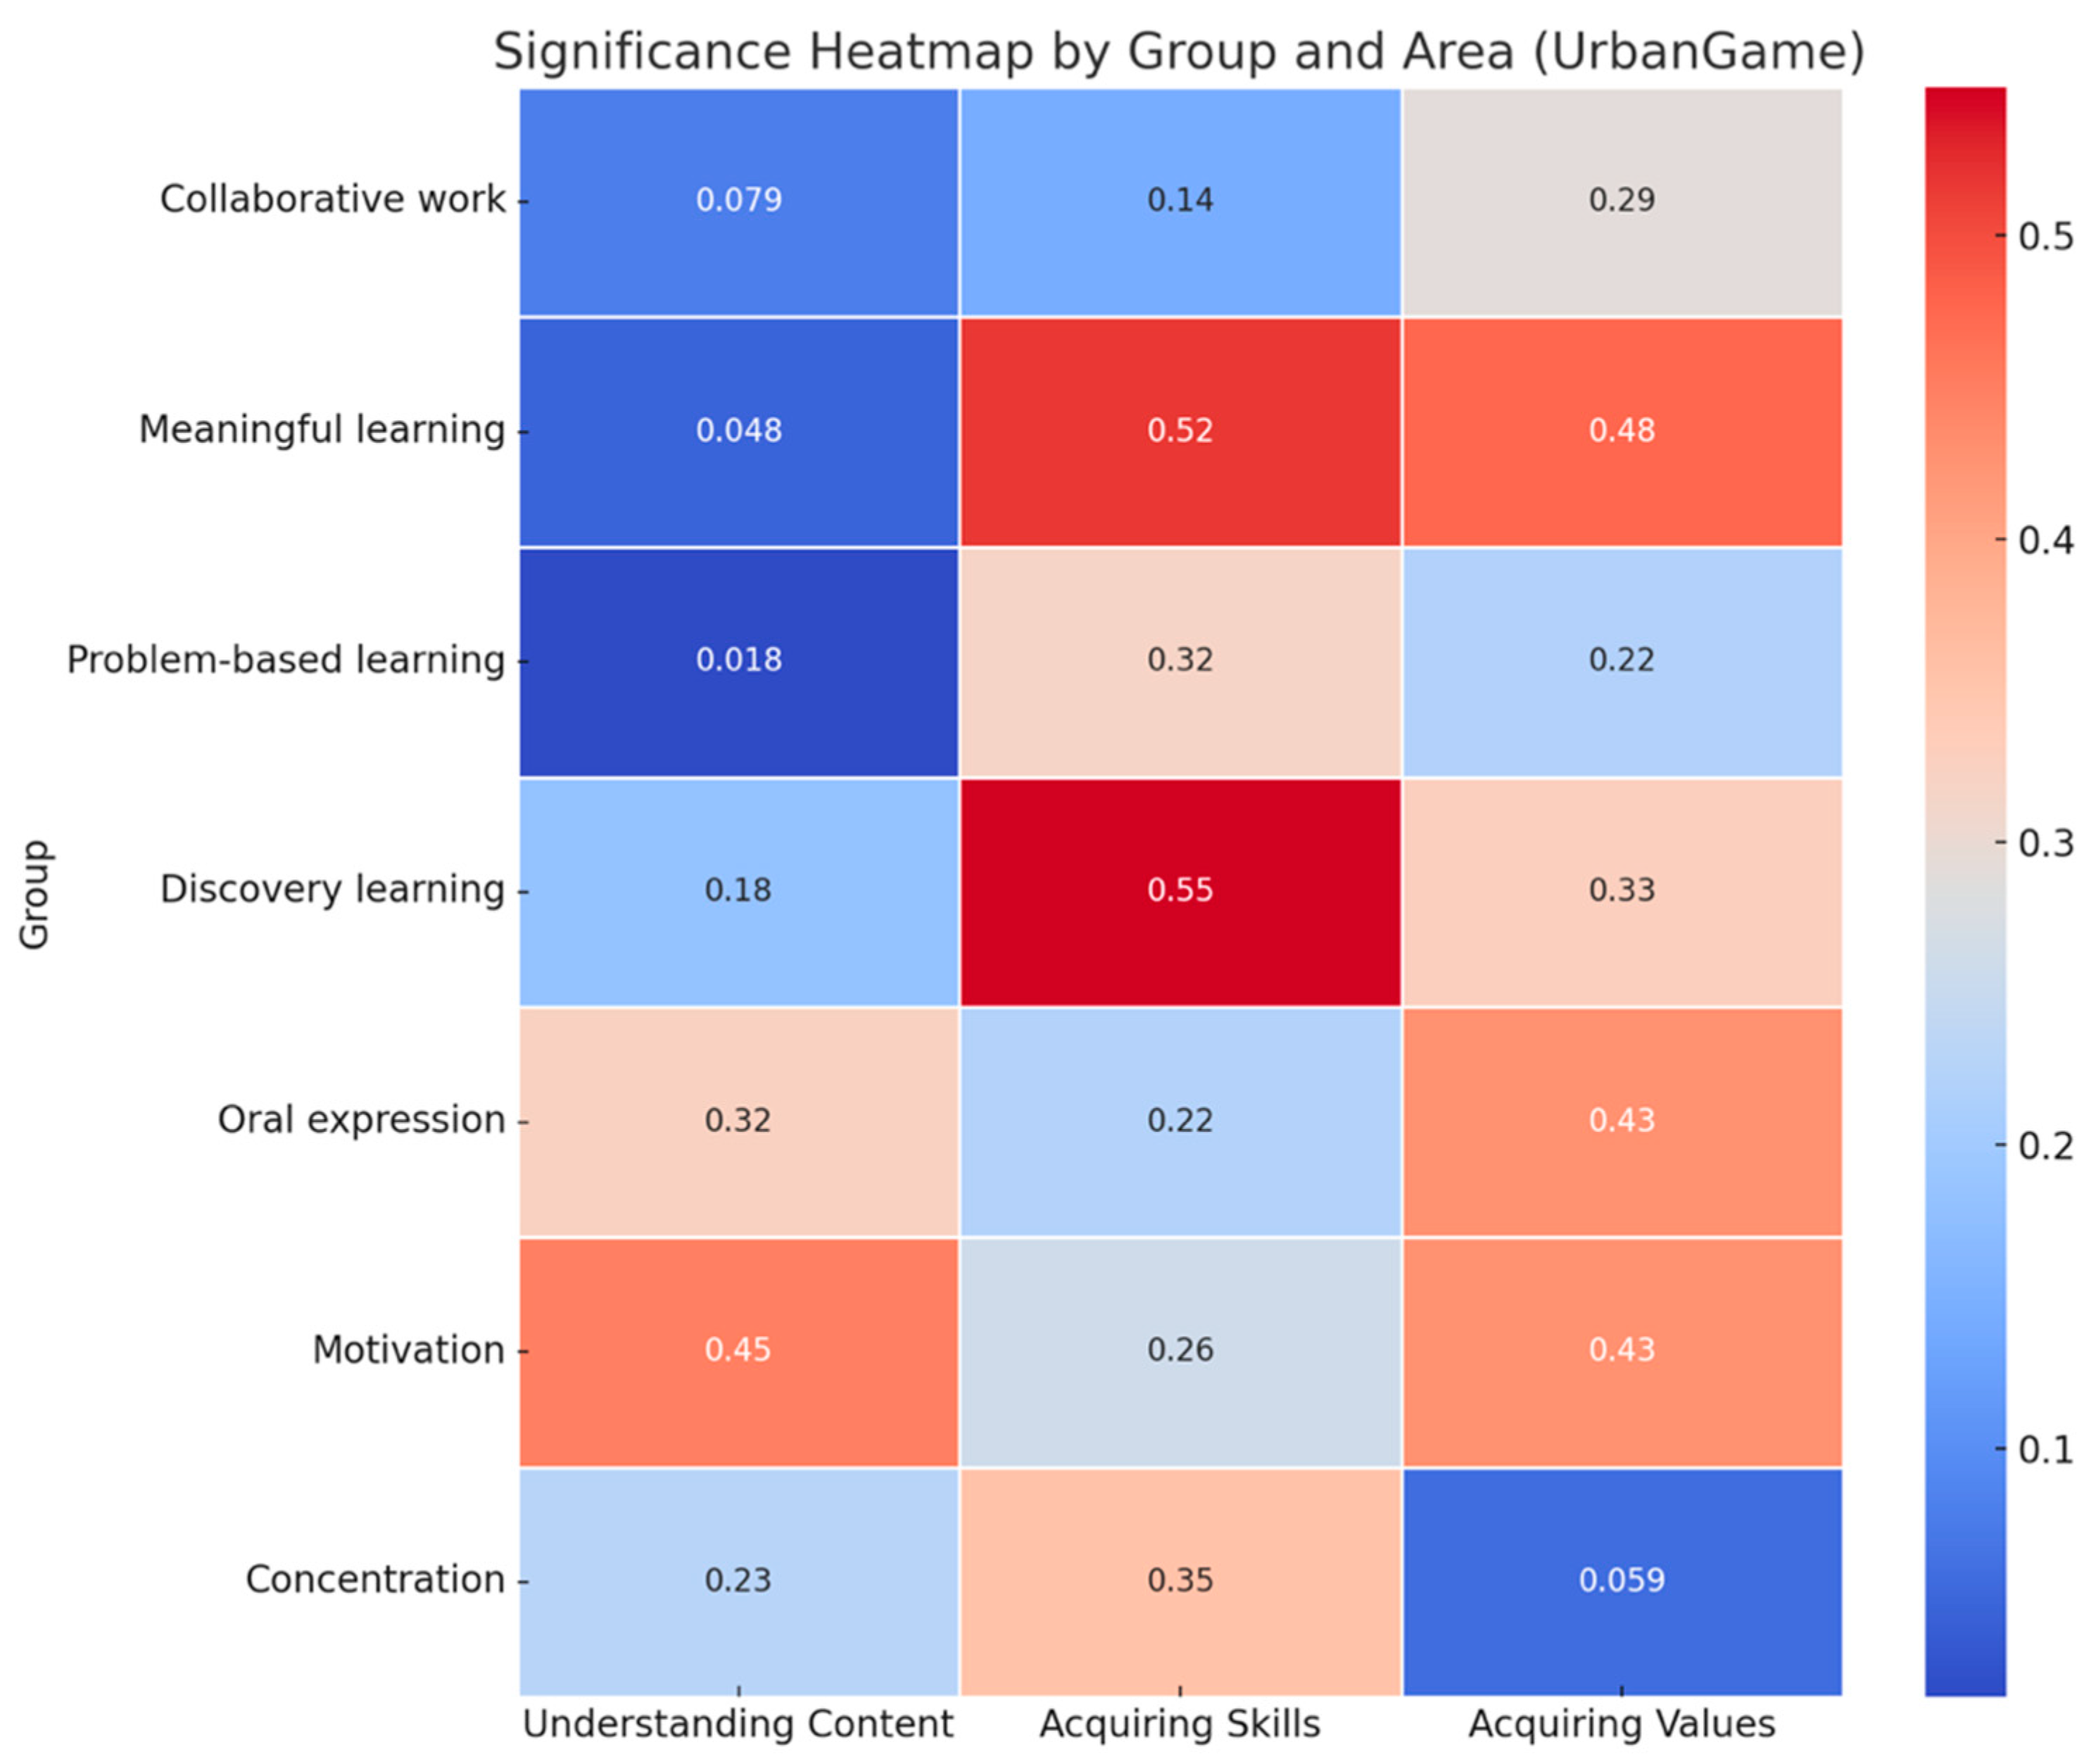
| Collaborative Work | 3.076 | 0.079 | No significant differences |
| Meaningful Learning | 3.893 | 0.048 | Significant difference, favors level 5 |
| Problem-Based Learning | 5.574 | 0.018 | Significant difference, favors level 5 |
| Discovery Learning | 1.778 | 0.182 | No significant differences |
| Oral Expression | 0.976 | 0.323 | No significant differences |
| Motivation | 0.575 | 0.448 | No significant differences |
| Concentration | 1.451 | 0.228 | No significant differences |

3.2.2. Other Key Areas
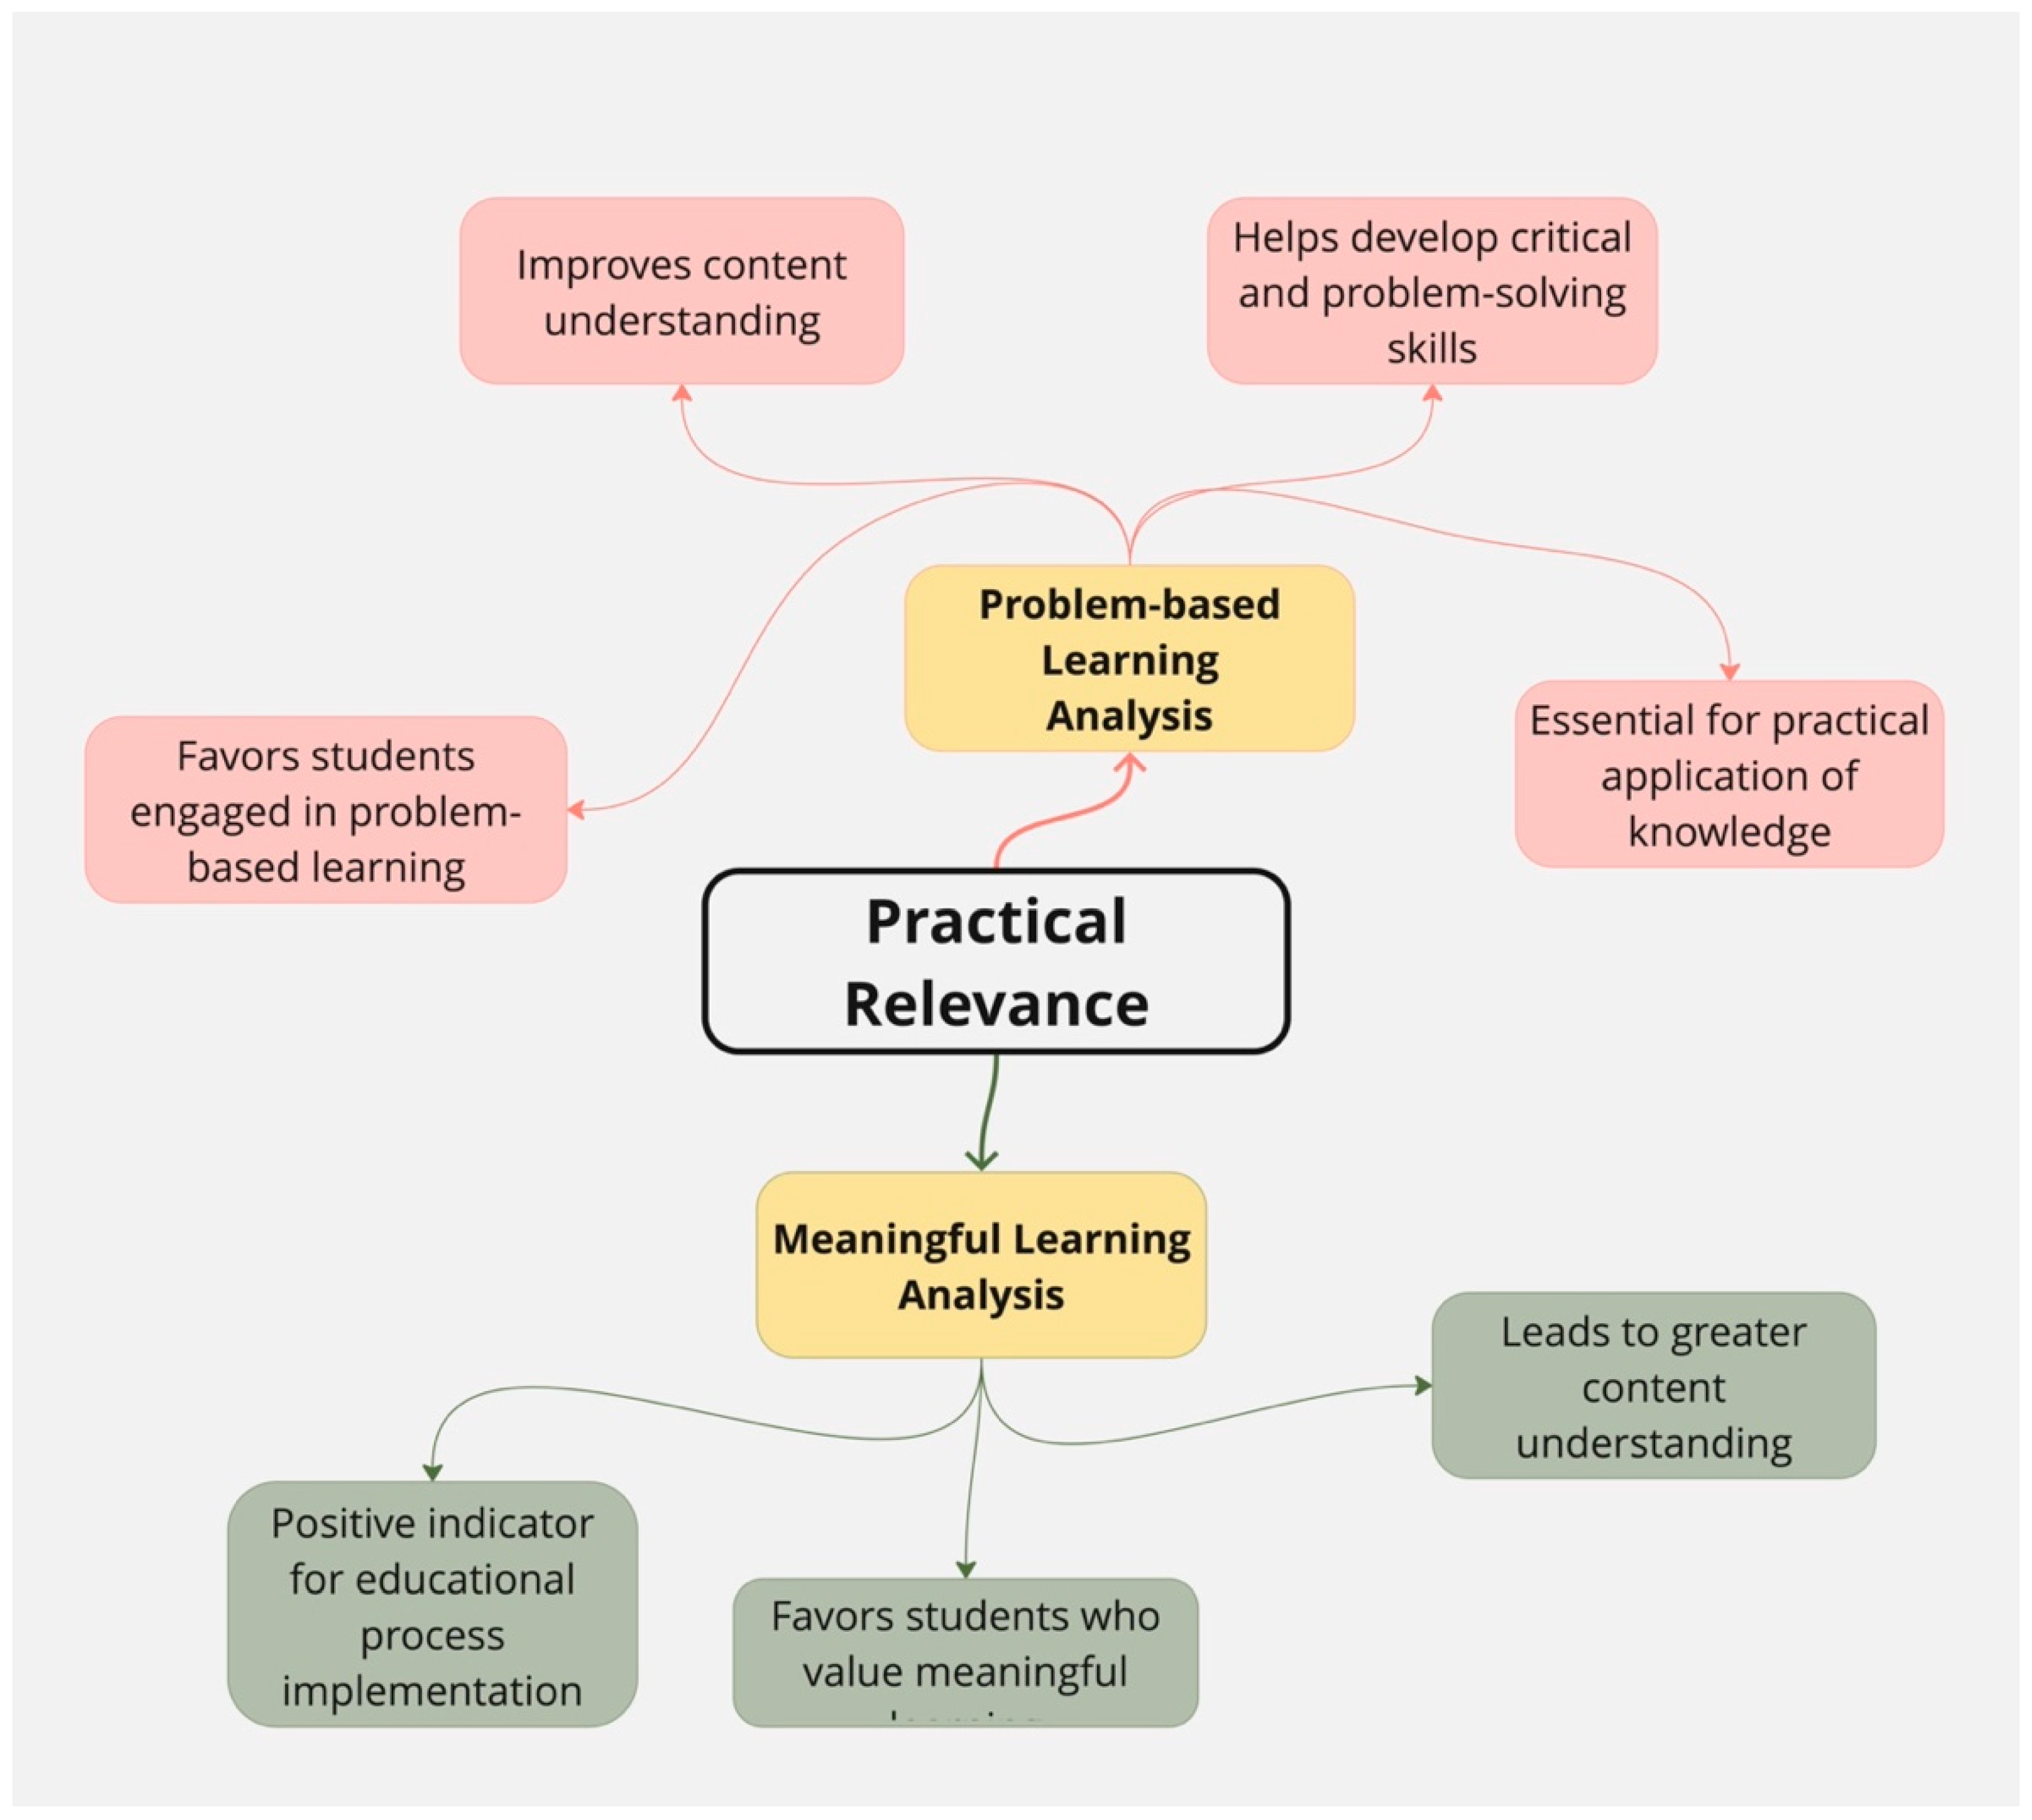
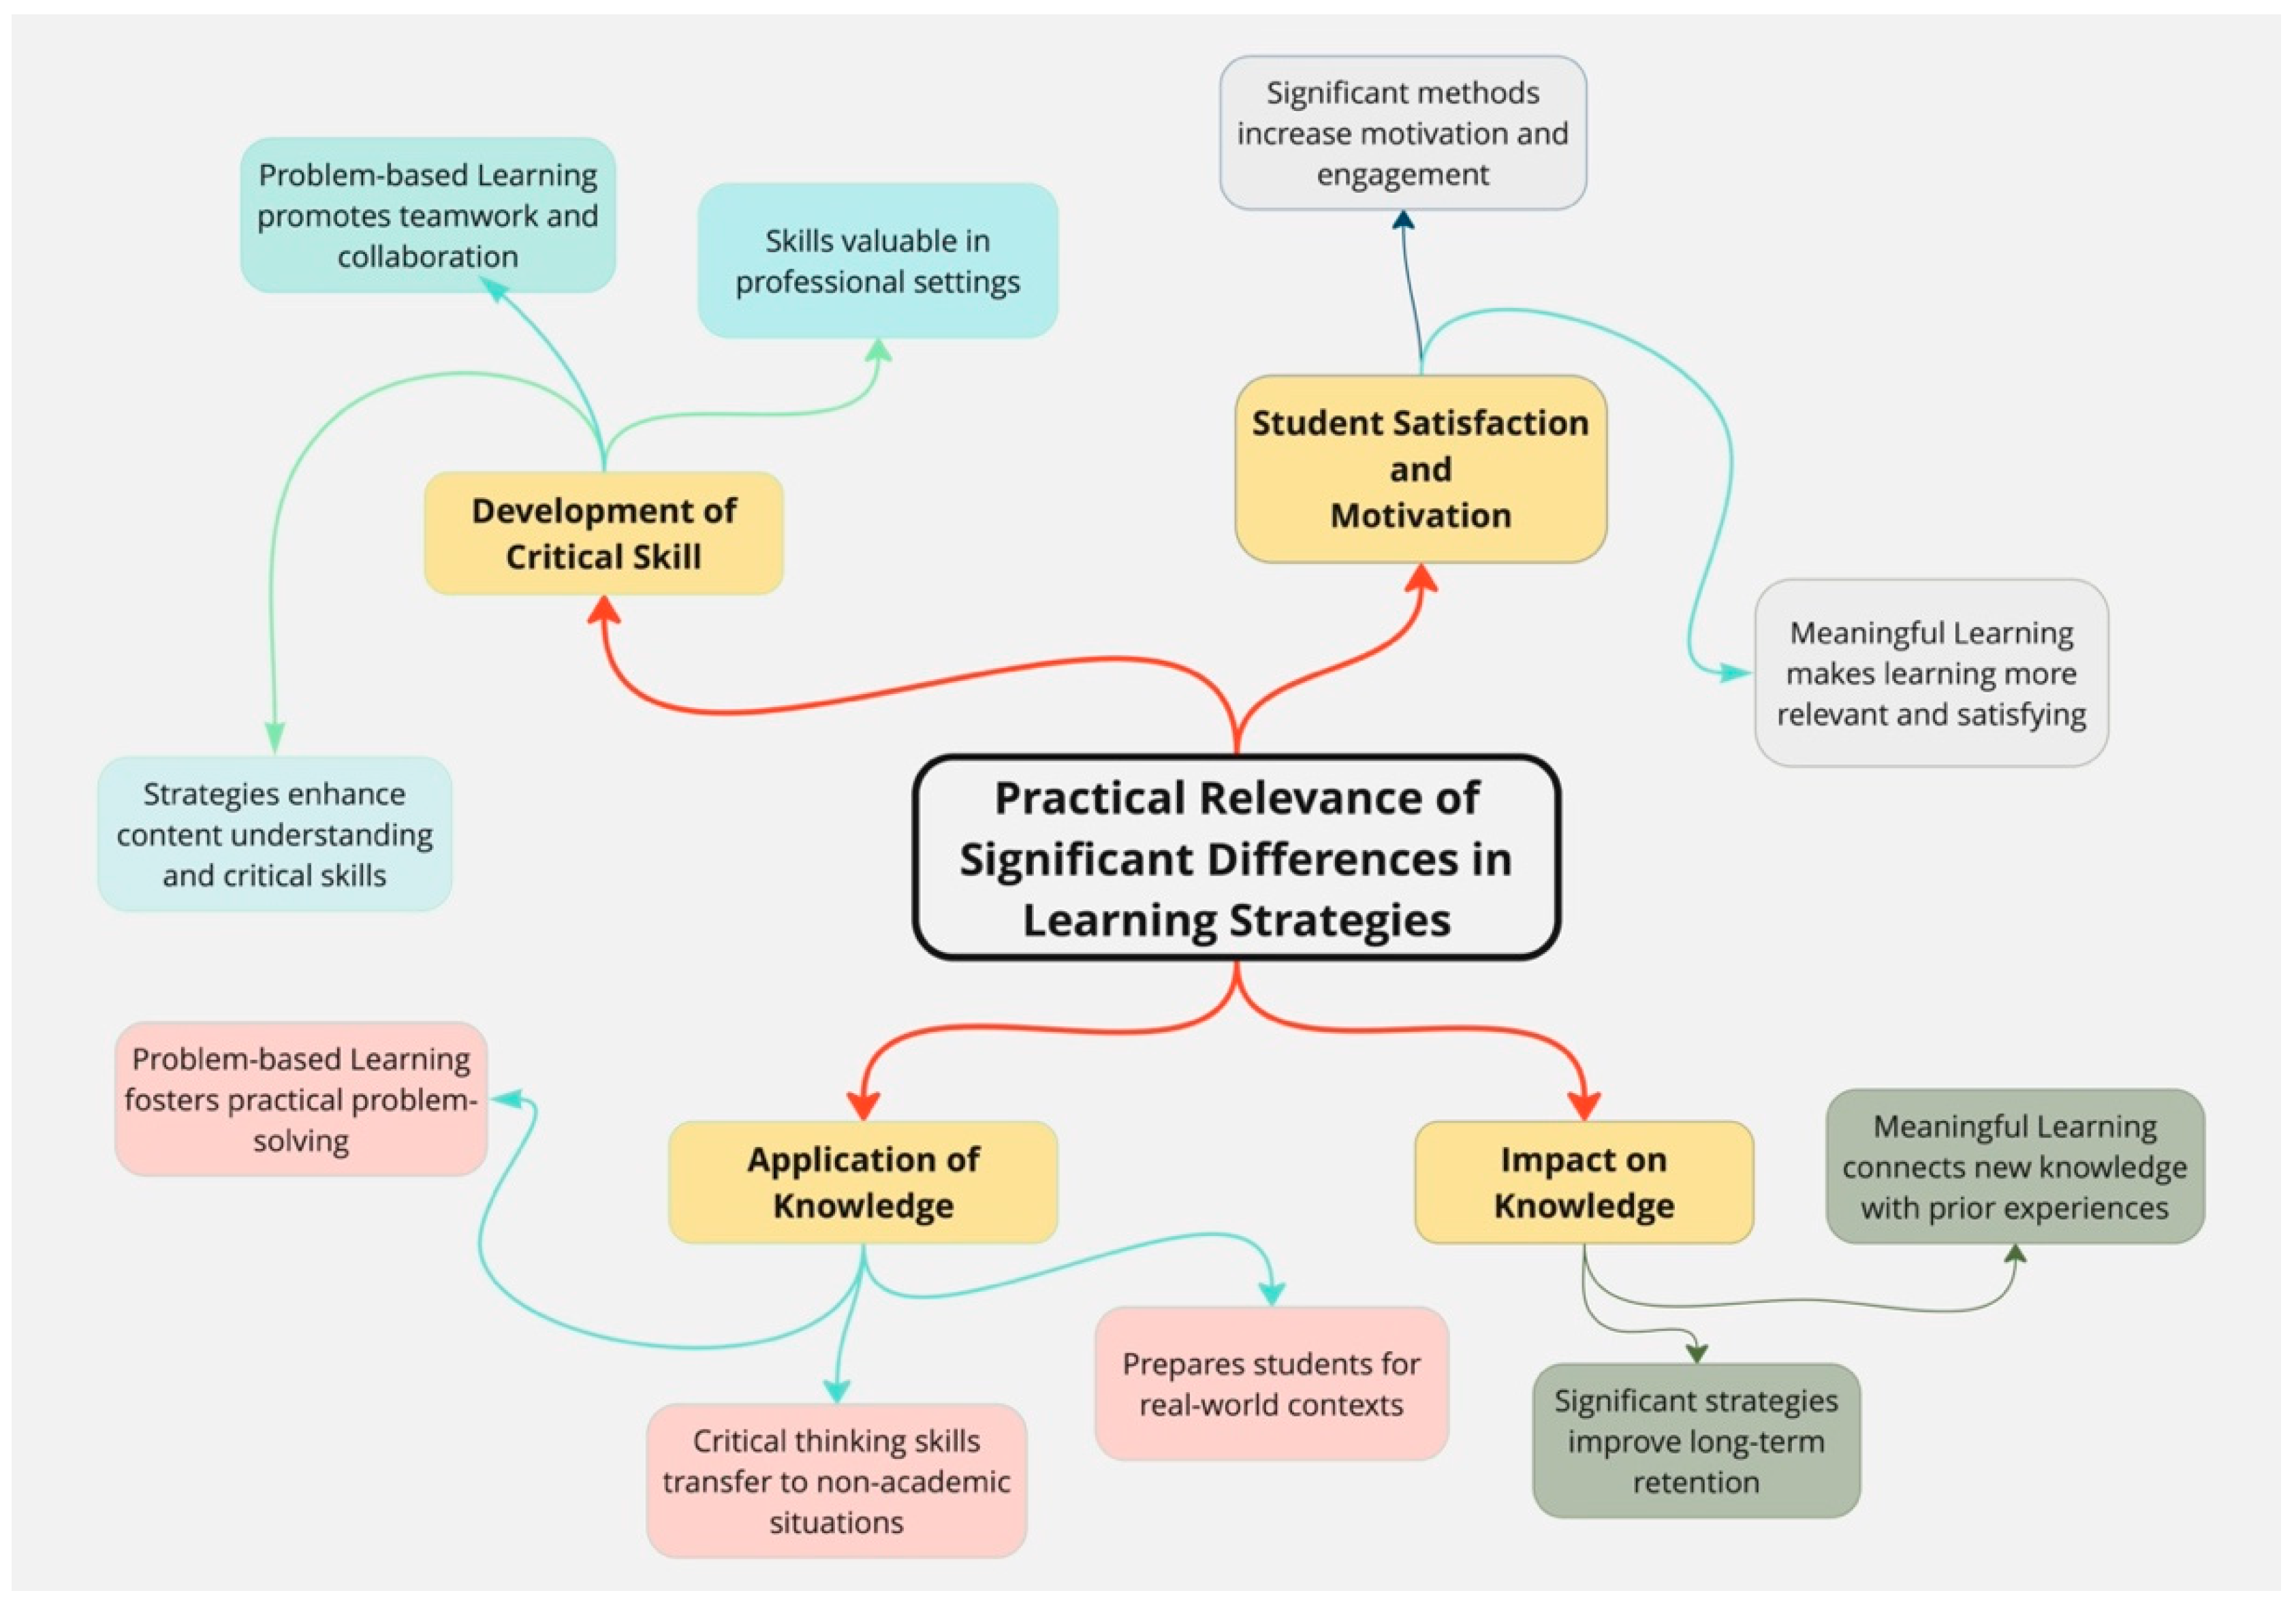
3.2.3. Practical Relevance of Significant Differences in Content Comprehension
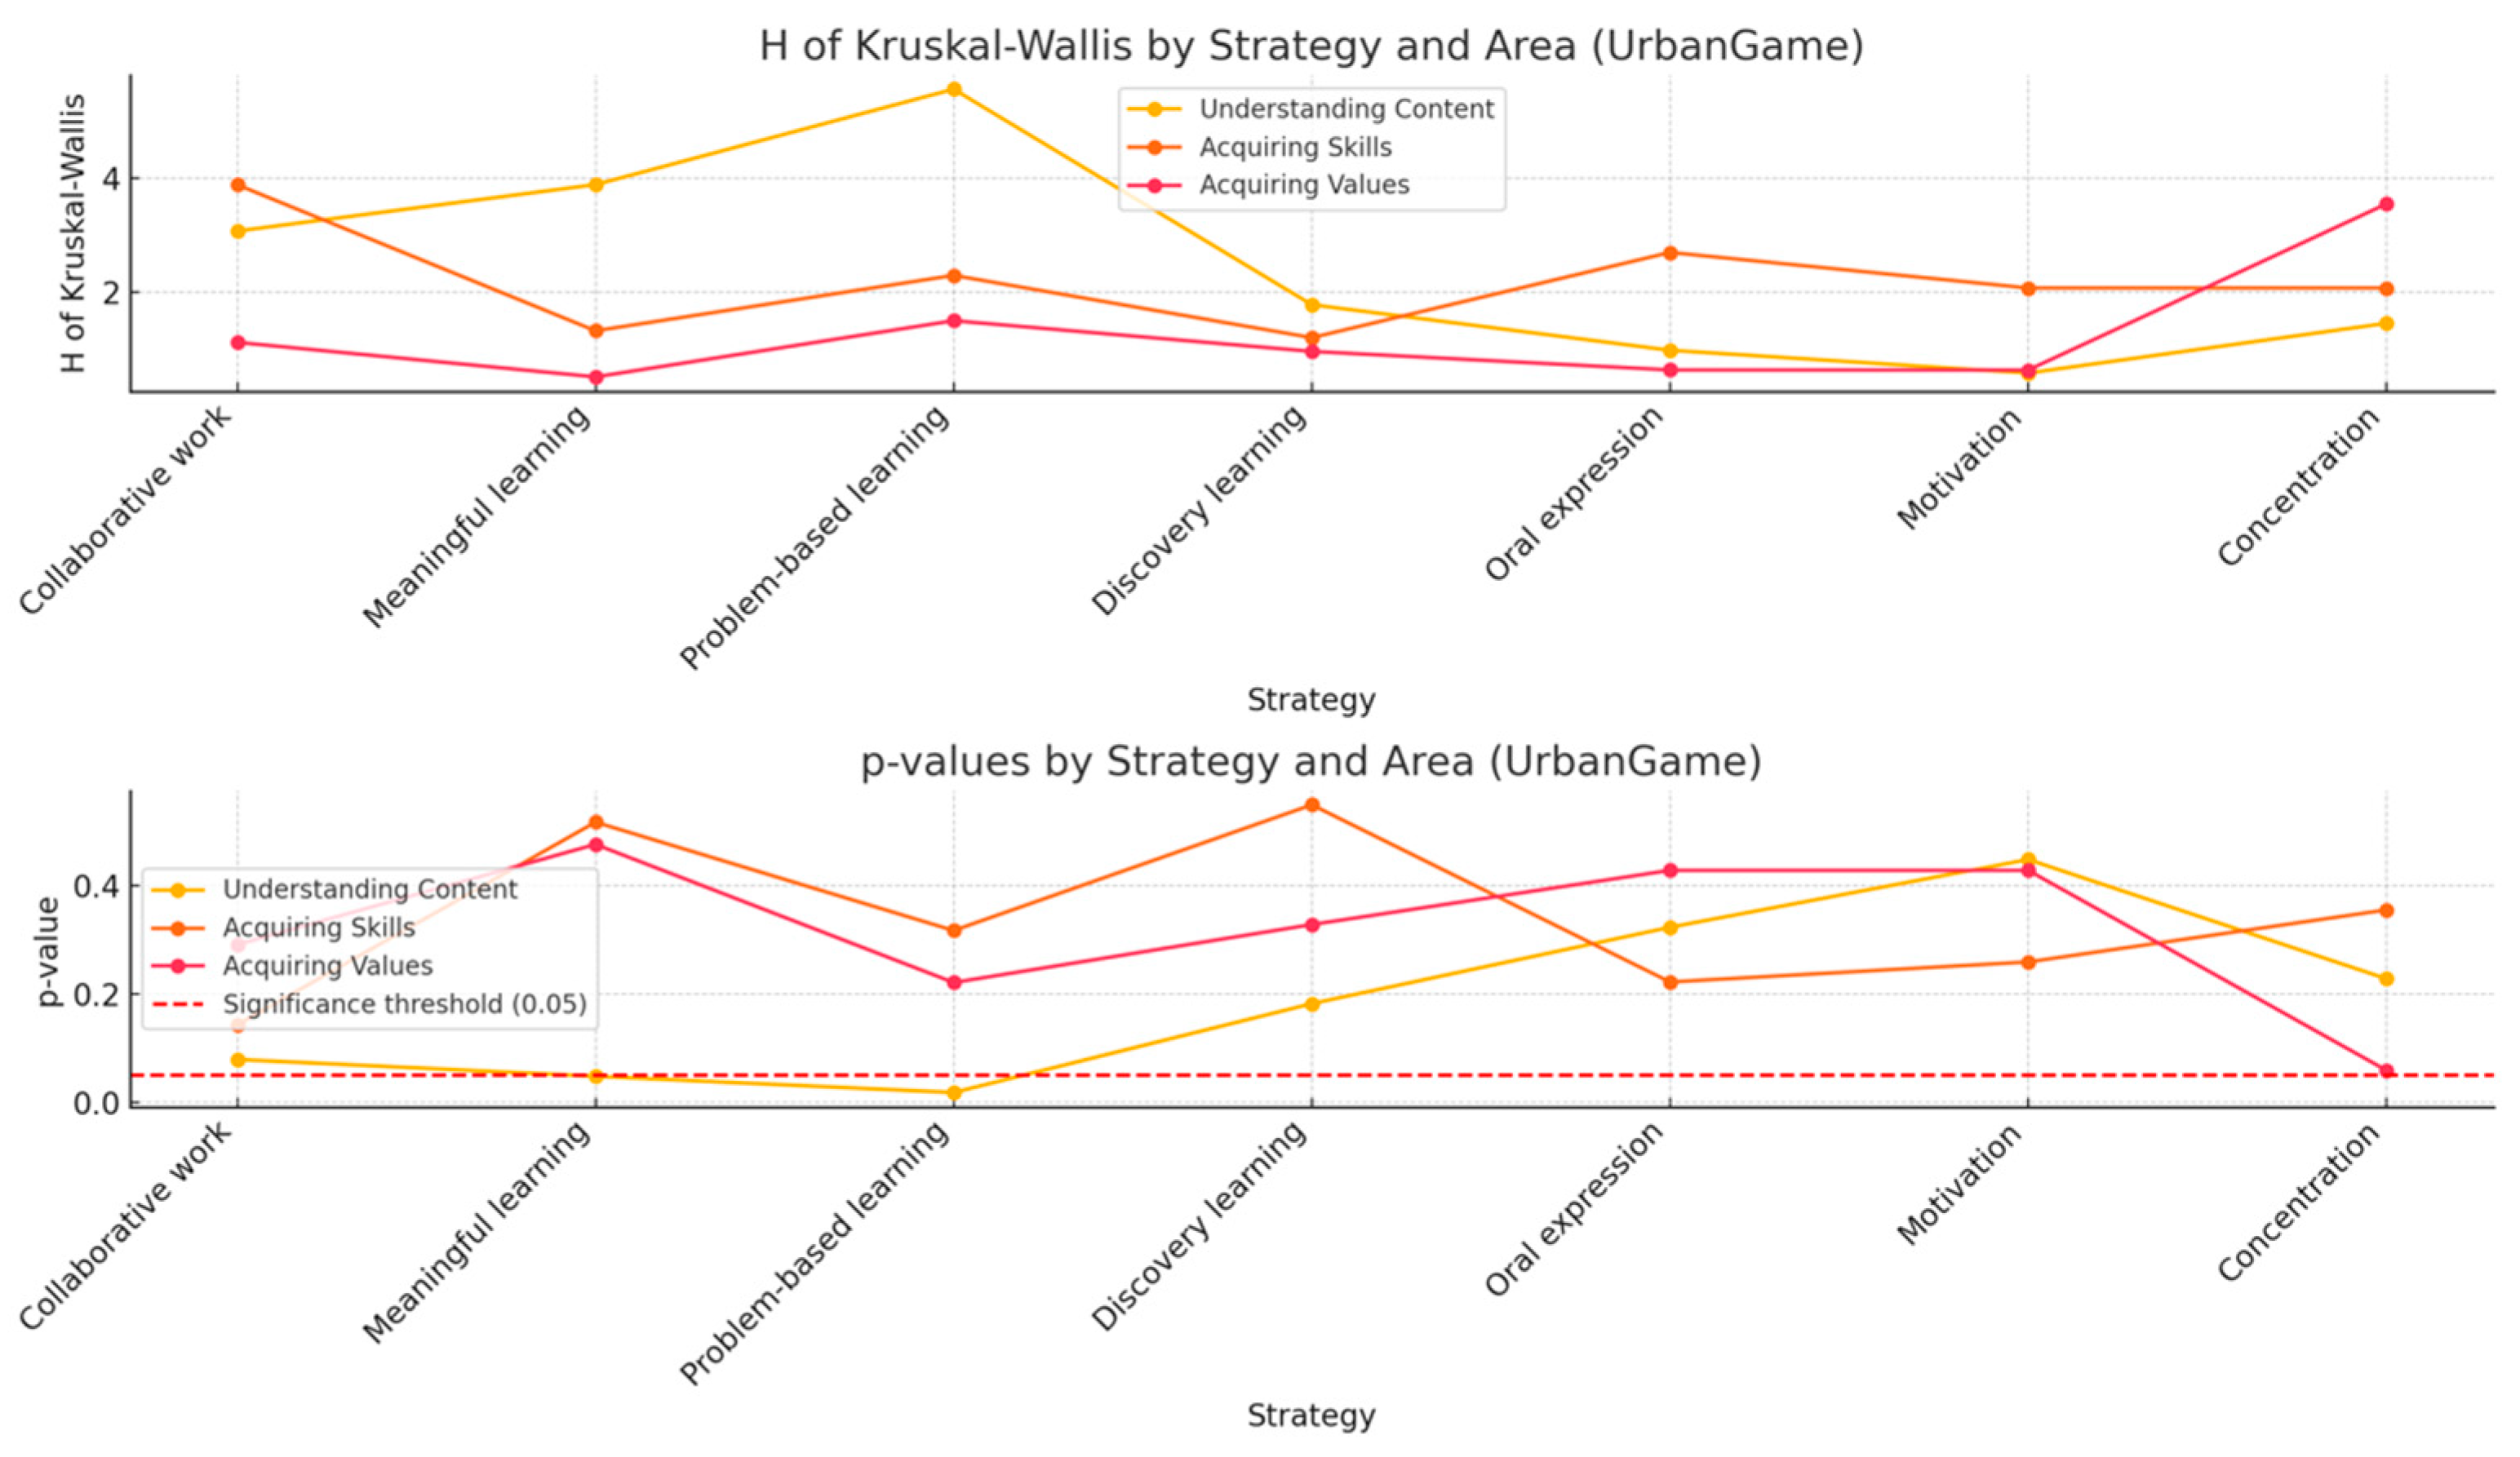
3.3. Qualitative Analysis of Preferences for Learning Strategies
3.3.1. Students of the Innovation and Research in Economics Course, Master's in Secondary Education
- Code 1: Enhancing Collaborative Work
- Code 2: Enhancing Meaningful Learning
- Code 3: Enhancing Problem-Based Learning
- Code 4: Enhancing Discovery Learning
- Code 5: Enhancing Oral Expression
- Code 6: Enhancing Motivation
- Code 7: Enhancing Concentration
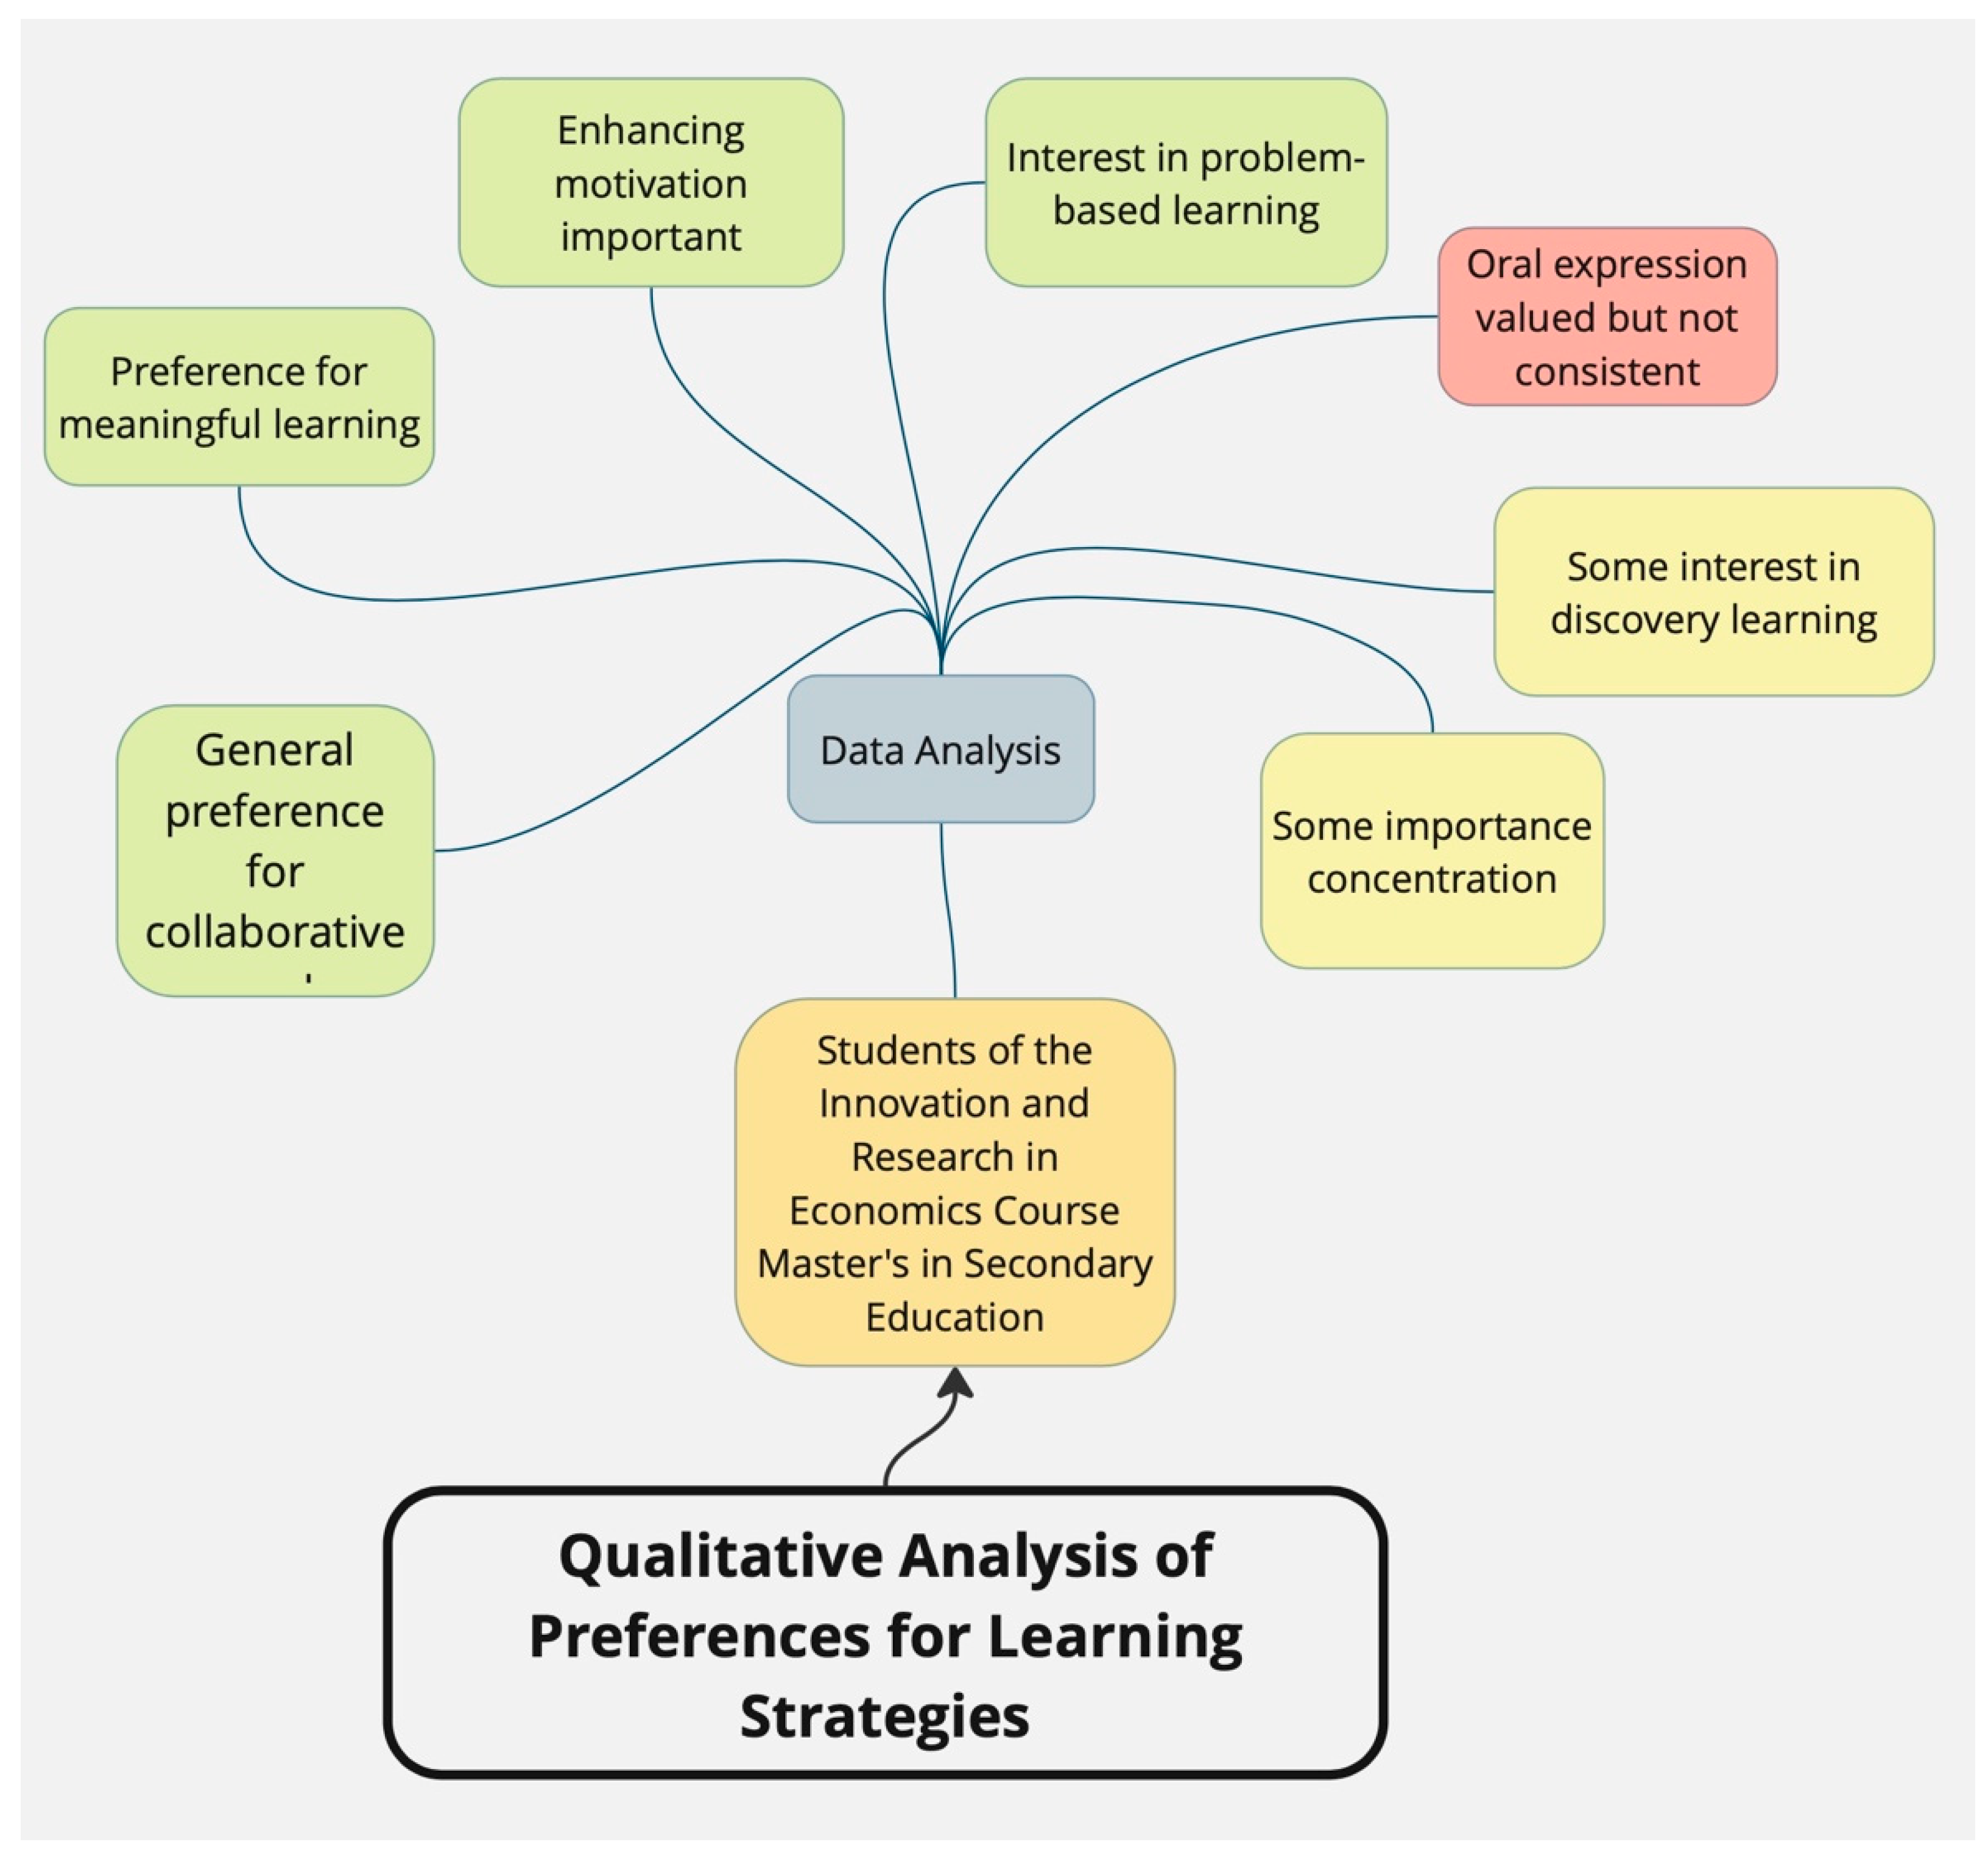
3.3.2. Students of the Didactics of History Course, Bachelor's in Primary Education

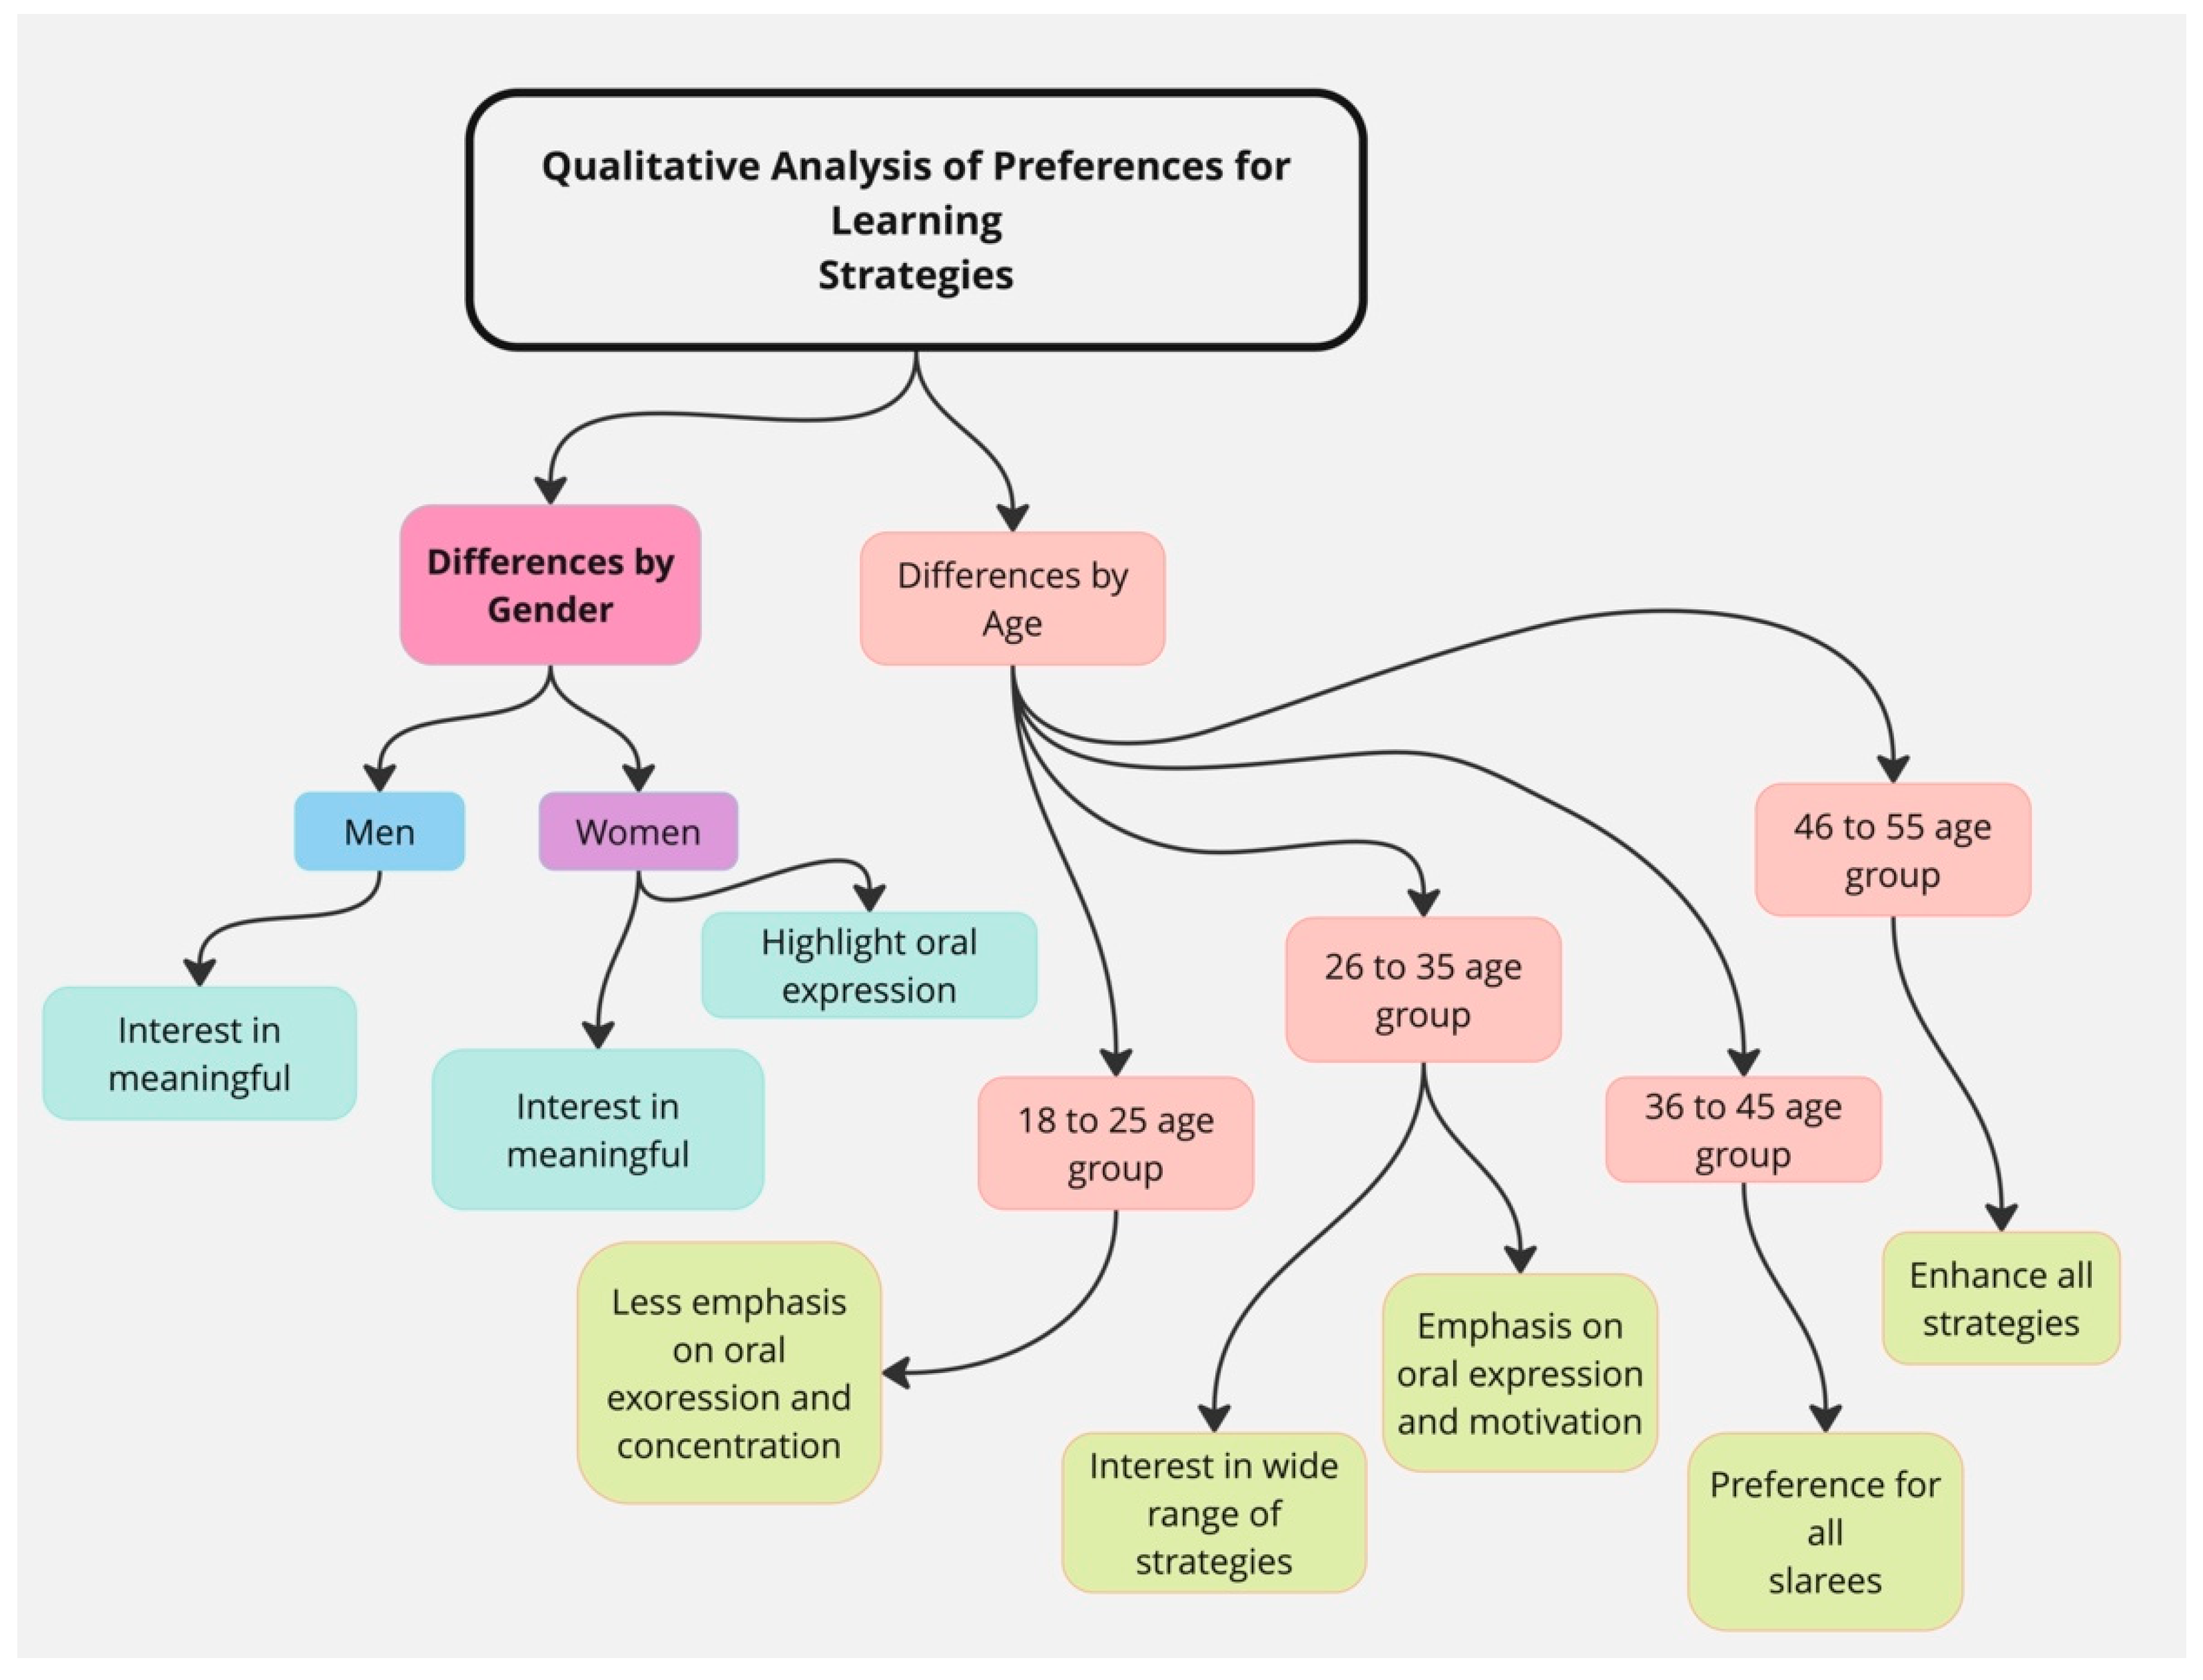
3.3.3. General Analysis for the Student Body
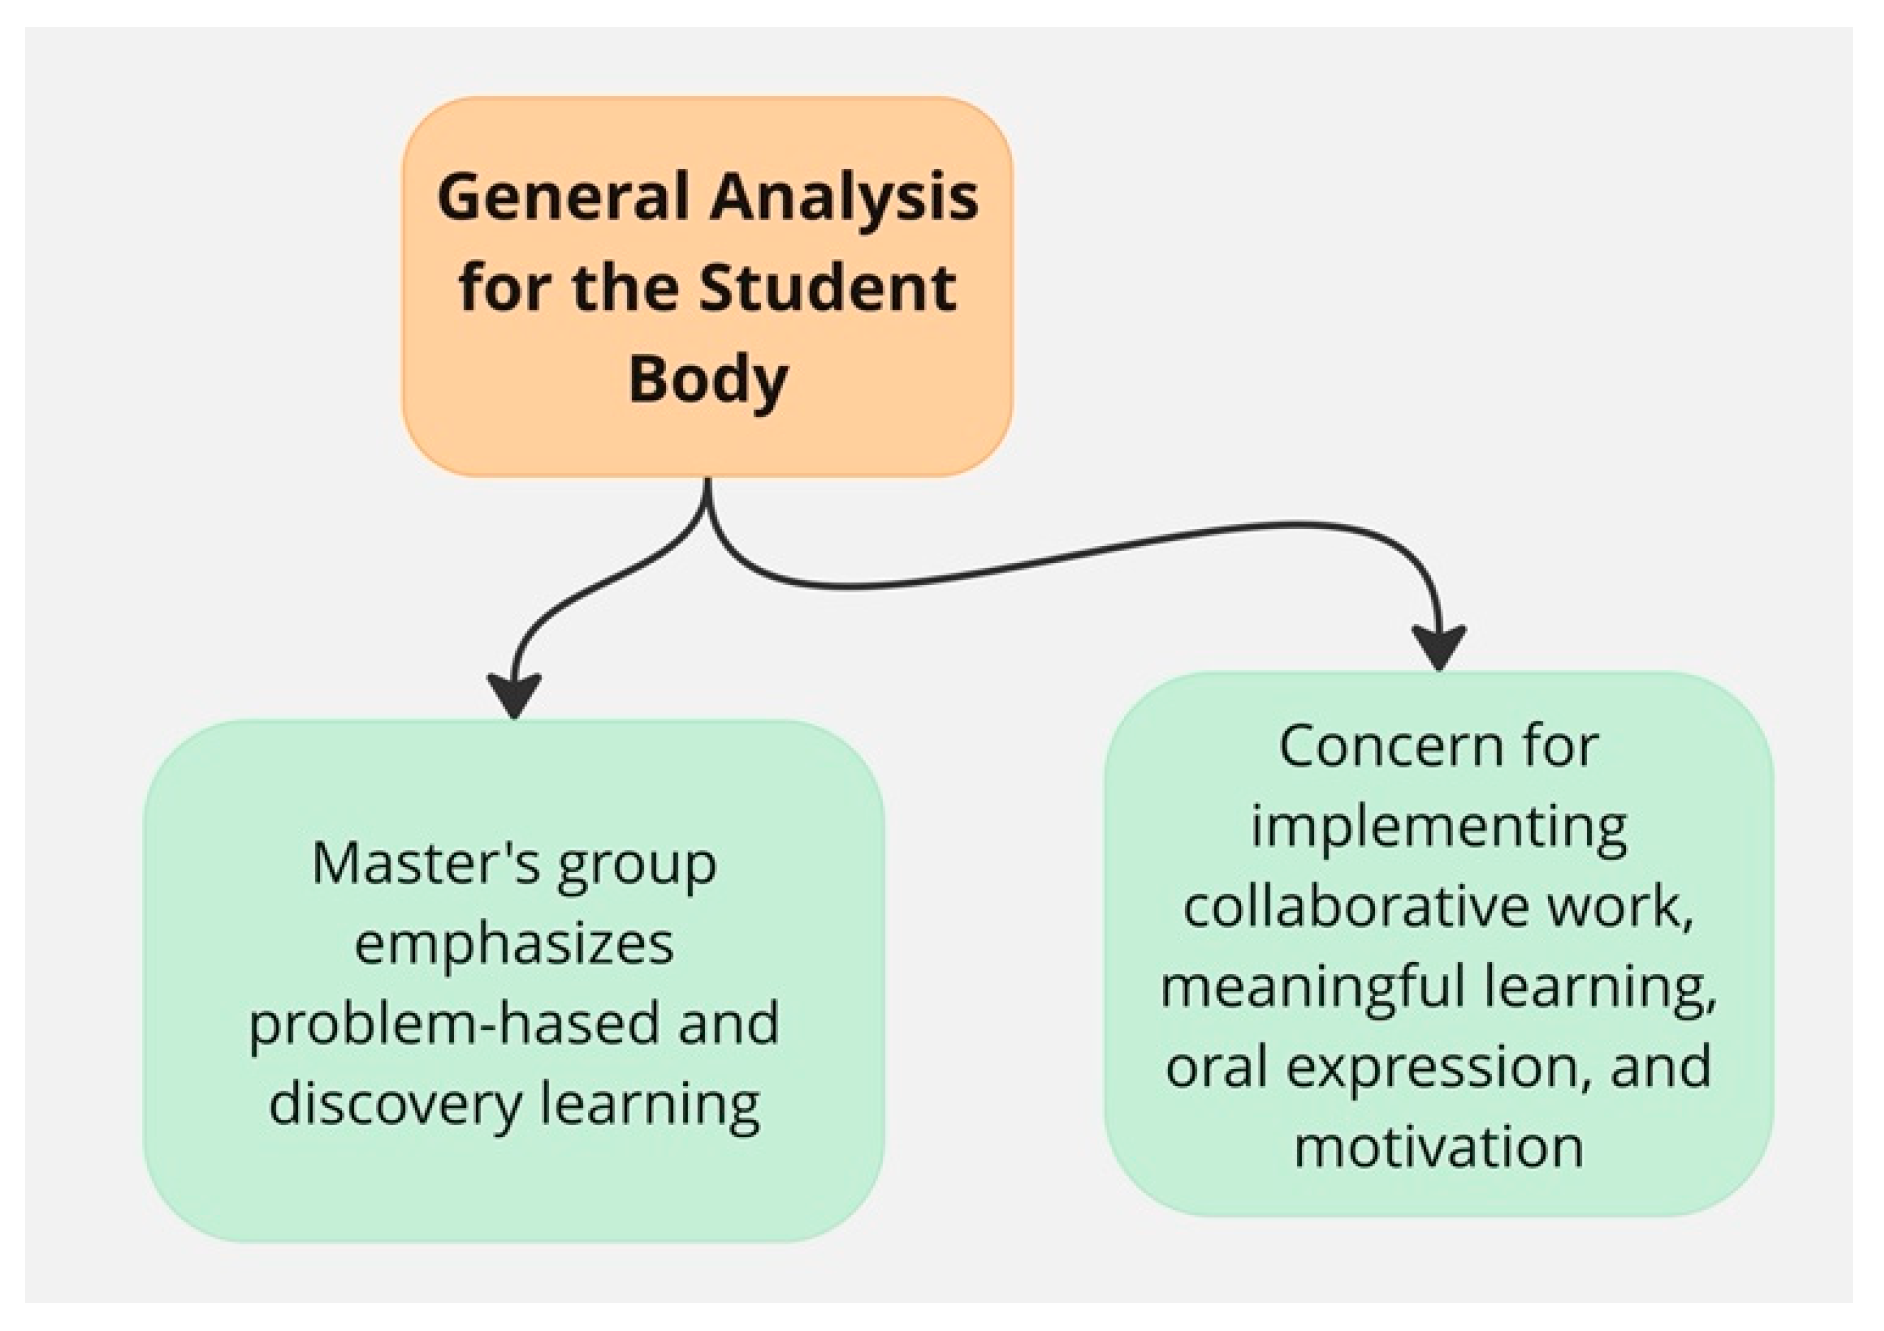
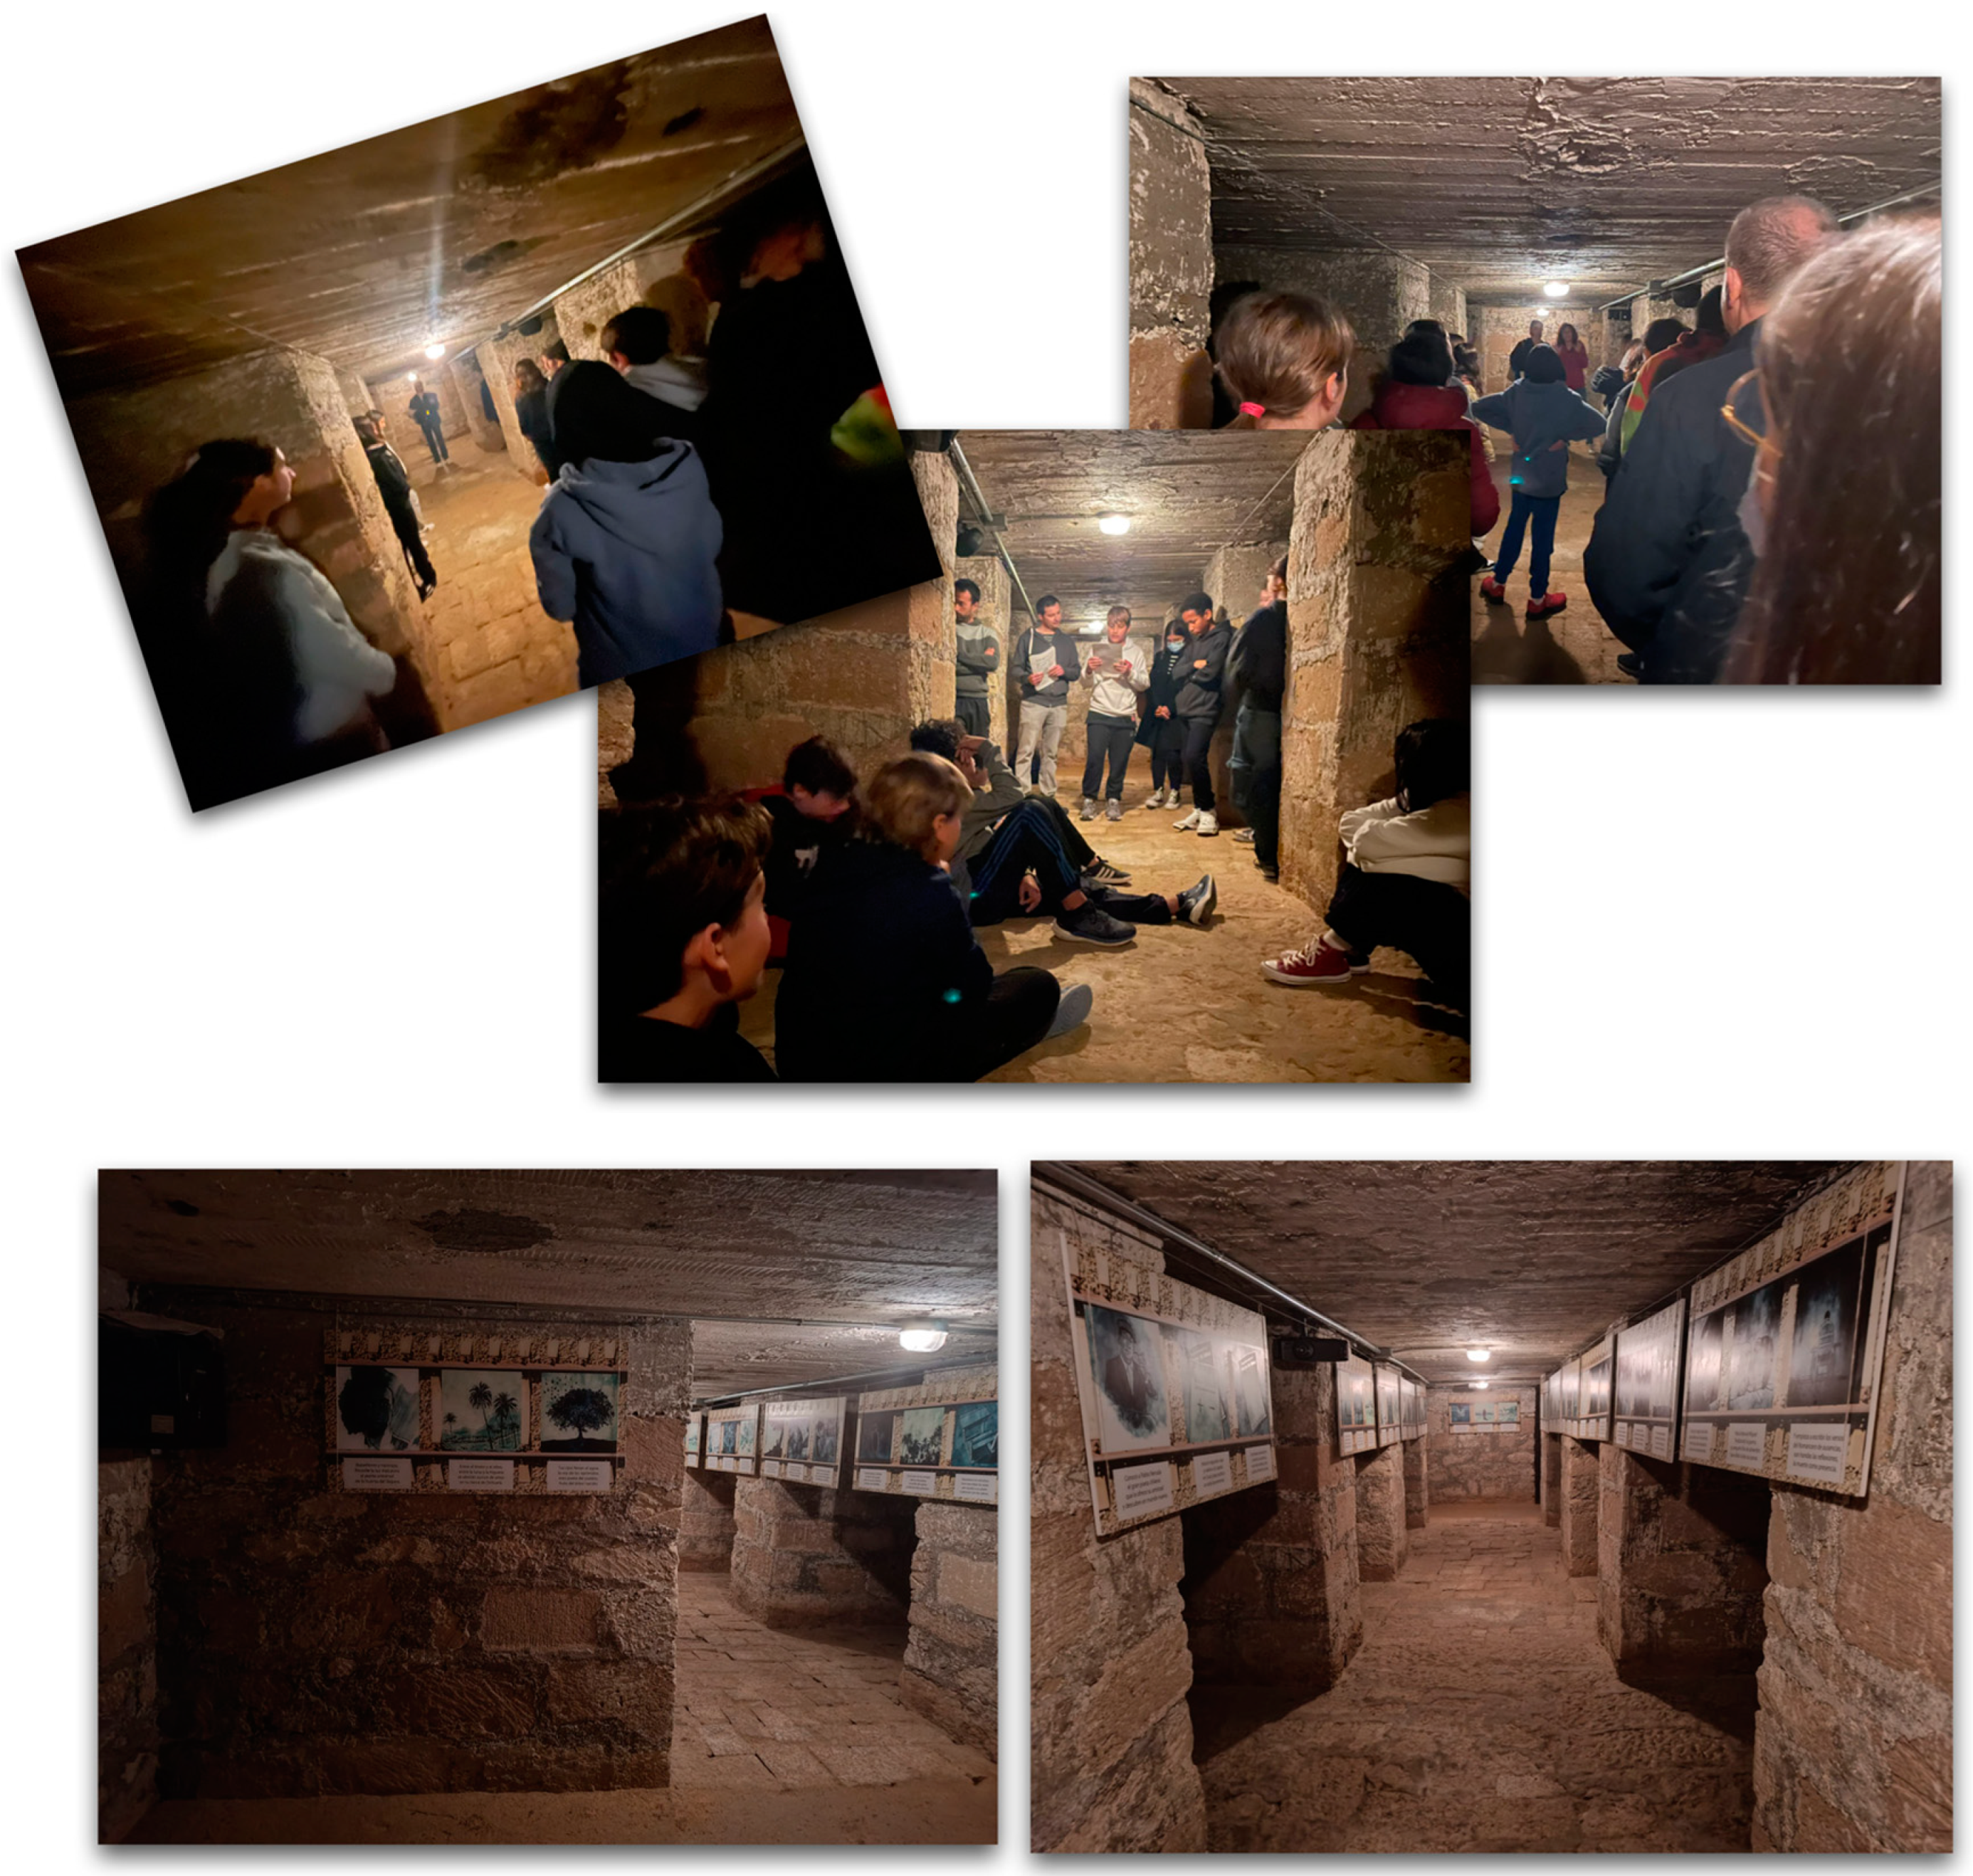
3.4. Cultural Promotion of Memory Heritage Following the UrbanGame Activity


4. Discussion
Author Contributions
Funding
Conflicts of Interest
References
- Deterding, S.; Dixon, D.; Khaled, R.; Nacke, L. From Game Design Elements to Gamefulness: Defining" Gamification". In Proceedings of the 15th international academic MindTrek conference: Envisioning future media environments; Lugmayr, A., Franssila, H., Safran, C., Hammouda, I., Eds.; ACM: Brighton, England, 2011; pp. 9–15.
- Zichermann, G., & Cunningham, C. (). " ". Gamification by Design: Implementing Game Mechanics in Web and Mobile Apps; O’Reilly Media: Sebastopol, CA, 2011.
- Doney, I. Research into Effective Gamification Features to Inform E-Learning Design. Research in Learning Technology 2019, 27. [CrossRef]
- Shannon, R.E. Systems Simulation : The Art and Science; Prentice-Hall: Englewood Cliffs, N.J., 1975.
- Wright-Maley, C. Beyond the “Babel Problem”: Defining Simulations for the Social Studies. The Journal of Social Studies Research, 2015, 39, 63–77. [CrossRef]
- Abt, C. Serious Games; Viking Press: New York, NY, 1970.
- Klopfer, E.; Osterweil, S.; Salen, K. Moving Learning Games Forward; MA: The Education Arcade: Cambridge, 2009.
- Salen, K.; Zimmerman, E. Regras Do Jogo: Fundamentos Do Design de Jogos; Blucher: São Paulo, 2012; ISBN 9788521206279.
- Steinkuehler, C.; Squire, K.; Barab, S. Games, Learning, and Society: Learning and Meaning in the Digital Age; Cambridge University Press, 2012; ISBN 9780521196239.
- Gee, J.P.; Hayes, E. Nurturing Affinity Spaces and Game-Based Learning. Games, learning, and society: Learning and meaning in the digital age 2012, 123, 1–40.
- McGonigal, J. Reality Is Broken; Penguin Press: New York, 2011.
- Squire, K. Video Games and Learning Teaching and Participatory Culture in the Digital Age; Teachers’ College Press: New York, NY, 2011.
- Lin, H.; Sun, C.-T. Problems in Simulating Social Reality: Observations on a MUD Construction. Simul. Gaming 2003, 34, 69–88. [CrossRef]
- Williams, R., Dickinson, A., & Hulme, R. (). . London. New Technology in the Classroom. New History and New Technology Present into Future. The Historical Association/Council for Educational Technology 1986, 8–27.
- Martín-Antón, J.; Valdés-Gonzaléz, A.; Rodríguez, D.J. Elección, análisis y uso de herramientas didácticas para la enseñanza de las Ciencias Sociales. La importancia de la detección de anacronismos y falta de rigor histórico en un videojuego. RIAICES 2021, 3, 17–26. [CrossRef]
- Romero, J. ¿Herramientas o Cacharros?. Los Ordenadores y La Enseñanza de La Historia En La ESO; Servicio de Publicaciones de la Universidad de Cantabria, 1997.
- Valverde, J. Aprendizaje de La Historia y Simulación Educativa. Tejuelo 2010, 9, 83–99.
- Garris, R.; Ahlers, R.; Driskell, J.E. Games, Motivation, and Learning: A Research and Practice Model. Simul. Gaming 2002, 33, 441–467. [CrossRef]
- Huizenga, J.; Admiraal, W.; Akkerman, S.; ten Dam, G. Mobile Game-Based Learning in Secondary Education: Engagement, Motivation and Learning in a Mobile City Game. Journal of Computer Assisted Learning 2009, 25, 332–344.
- Educating the Net Generation; Oblinger, D.G., Oblinger, J.L., Eds.; EDUCAUSE, 2005.
- Qian, M.; Clark, K.R. Game-Based Learning and 21st Century Skills: A Review of Recent Research. Comput. Human Behav. 2016, 63, 50–58. [CrossRef]
- Kilgour, P.; Reynaud, D.; Northcote, M.; Shields, M. Role-Playing as a Tool to Facilitate Learning, Self Reflection and Social Awareness in Teacher Education. 2015.
- Zevin, J. Social Studies for the Twenty-First Century: Methods and Materials for Teaching in Middle and Secondary Schools; 5th ed.; Routledge, 2023; ISBN 9780367459567.
- Castro, S.S.; Sevillano, M.Á.P. Personalización del proceso de adquisición de la competencia en comunicación lingüística mediante el empleo de los serious games. Diferencias en función del género. Edutec 2022, 149–165. [CrossRef]
- Michael, D.R.; Chen, S. Serious Games: Games That Educate, Train and Inform; Thomson Course Technology, 2006; ISBN 9781592006229.
- Annetta, L.A. The “I’s” Have It: A Framework for Serious Educational Game Design. Rev. Gen. Psychol. 2010, 14, 105–113. [CrossRef]
- Sitzmann, T. A Meta-Analytic Examination of the Instructional Effectiveness of Computer-Based Simulation Games. Pers. Psychol. 2011, 64, 489–528. [CrossRef]
- Aldrich, C. Simulations and the Future of Learning: An Innovative (and Perhaps Revolutionary) Approach to e-Learning; John Wiley & Sons: Milton, QLD, Australia, 2003.
- Nafukho, F.M. Simulations and the Future of Learning: An Innovative and Perhaps Revolutionary Approach to E-Learning. Human Resource Development Quarterly 2004, 15, 253–257.
- Primack, B.A.; Carroll, M.V.; McNamara, M.; Klem, M.L.; King, B.; Rich, M.; Chan, C.W.; Nayak, S. Role of Video Games in Improving Health-Related Outcomes: A Systematic Review. Am. J. Prev. Med. 2012, 42, 630–638. [CrossRef]
- Arnab, S.; Lim, T.; Carvalho, M.B.; Bellotti, F.; de Freitas, S.; Louchart, S.; Suttie, N.; Berta, R.; De Gloria, A. Mapping Learning and Game Mechanics for Serious Games Analysis. Br. J. Educ. Technol. 2015, 46, 391–411. [CrossRef]
- Martínez, C.; Montero, R.; Arias, G.; Salcedo, M.A. Los Juegos Serios, Su Aplicación En La Seguridad y Salud de Los Trabajadores. Med. Segur. Trab. 2019, 65, 87–100. [CrossRef]
- Pellegrini, M. Richard E. Mayer, Computer Games for Learning. An Evidence-Based Approach. Cambridge & London: The MIT Press (2014). Form@re 2014, 14, 96–97. [CrossRef]
- Belkin, J. Urban Dynamics: Applications as a Teaching Tool and as an Urban Game. IEEE Transactions on Systems, Man, and Cybernetics 1972, 2, 166–169. [CrossRef]
- Flanagan, M. Critical Play: Radical Game Design; The MIT Press, 2009; ISBN 9780262258760.
- Innocent, T.; Leorke, D. (De)Coding the City Analyzing Urban Play through Wayfinder Live. American Journal of Play 2020, 12, 270–304.
- Pramaputri, N.I.; Gamal, A. Urban Planning Simulation Game and the Development of Spatial Competence. IOP Conference Series. Earth and Environmental Science 2019, 396, 12016-. [CrossRef]
- Larissa, H.; Adriana, de S. e.; Klare, L. The Routledge Companion to Mobile Media Art; 1st ed.; Routledge, 2022; ISBN 9781032399959.
- Olmo, M.; Rosser, P.; Soler, S.; Poveda, C.; Oña, J.J.; Candela, V.F. Guerra Civil y Memoria Histórica En Alicante; Archivo Histórico Provincial de Alicante., 2016.
- Rosser, P. Bombas Sobre Alicante. Los Diarios de La Guerra y Las Comisiones Internacionales de No Intervención e Inspección de Bombardeos; Universidad de Alicante, 2023; ISBN 9788413022215.
- Rosser, P.; Soriano, R. Alicante En Guerra; Ayuntamiento de Alicante: Alicante, 2018; Vol. 1 y 2;.
- Moreno, R.M.; Viñas, Á.; López, P.P.; Rosser, P. La Aviación Fascista y El Bombardeo Del 25 de Mayo de Alicante; Colección Alacant, ciutat de la memòria; Universidad de Alicante-Ajuntament d’Alacant, 2018.
- Soler, S.; Rosser, P. Empatizar Con Los Conflictos Bélicos Para Trabajar El ODS 16. Creación de Una Situación de Aprendizaje a Partir de La Simulación Urbana. In Hacia una Educación con basada en las evidencias de la investigación y el desarrollo sostenible; DYKINSON, 2023 ISBN 9788411704274.
- Franciosi, S.J.; Mehring, J. What Do Students Learn by Playing an Online Simulation Game? In Critical CALL–Proceedings of the 2015 EUROCALL Conference, Padova, Italy; Research-publishing.net, 2015; pp. 170–176.
- Thiagarajan, S. How to Maximize Transfer from Simulation Games through Systematic Debriefing. In The Simulation and Gaming Yearbook; Percival, F., Lodge, F., Saunders, D., Eds.; Kogan Page Science: London, England, 1993; pp. 45–52.
- Kriz, W.C.; Nöbauer, B. Teamkompetenz. Konzepte, Trainingsmethoden, Praxis; Vandenhoeck & Ruprecht: Göttingen, Germany, 2002; Vol. 2.
- Wijnia, L.; Smeets, G.; Kroeze, M.J.; Van der Molen, H.T. Is Problem-Based Learning Associated with Students’ Motivation? A Quantitative and Qualitative Study. Learning Environments Research 2018, 21, 173–193. [CrossRef]
- Alexander, E. S., White, A. A., Varol, A., Appel, K., & Lieneck, C. Team- and Problem-Based Learning in Health Services Education. Literature Review of Recent Initiatives in the United States. Education Sciences 2024, 14, 515.
- Albadi, A.; David, S.A. The Impact of Activity Based Learning on Students’ Motivation and Academic Achievement: A Study among 12th Grade Science and Environment Students in a Public School in Oman. Specialty Journal of Knowledge Management 2019, 4, 44–53.
- Rossi, I.V.; de Lima, J.D.; Sabatke, B.; Nunes, M.A.F.; Ramirez, G.E.; Ramirez, M.I. Active Learning Tools Improve the Learning Outcomes, Scientific Attitude, and Critical Thinking in Higher Education: Experiences in an Online Course during the COVID-19 Pandemic. Biochemistry and Molecular Biology Education 2021, 49, 888–903.
- Papadopoulou, A.; Mystakidis, S.; Tsinakos, A. Immersive Storytelling in Social Virtual Reality for Human-Centered Learning about Sensitive Historical Events. Information 2024, 15, 244. [CrossRef]
- The Role of Game Design in Cultural Preservation: Promoting Heritage through Gaming 2024.
- Kang, S.J. Emotional Exhibition, Visitors’ Empathy, and History Education and Heritage Education in the Museum. The Korean History Education Review 2022, 161, 181–214. [CrossRef]
- Wu, P.; Fan, K.; Chiang, H.; Ye, A. Exploring the Relationship of User ’ s Emotions and Immersive Experience in a Virtual Environment of Local Culture. 2016.
- Archeu gamification euprojects erasmusplus activity Available online: https://www.linkedin.com/posts/archeu_gamification-euprojects-erasmusplus-activity-7170712183977316354-dLd2/ (accessed on 23 June 2024).
- Exploring the Benefits of an Immersive Curriculum Available online: https://www.talespin.com/reading/exploring-the-benefits-of-an-immersive-curriculum (accessed on 23 June 2024).
- Alam, A.; Mohanty, A. Educational Technology: Exploring the Convergence of Technology and Pedagogy through Mobility, Interactivity, AI, and Learning Tools. Cogent Engineering 2023, 10, 2283282. [CrossRef]
- Announcing the OpenExO Experience Available online: https://fox40.com/business/press-releases/ein-presswire/651735212/announcing-the-openexo-experience-nurturing-exponential-mindsets-through-engagement/ (accessed on 23 June 2024).
- Nofal, E.; Panagiotidou, G.; Reffat, R.M.; Hameeuw, H.; Boschloos, V.; Vande Moere, A. Situated Tangible Gamification of Heritage for Supporting Collaborative Learning of Young Museum Visitors. J. Comput. Cult. Herit. 2020, 13, 1–24. [CrossRef]
- Youth Cultural Heritage Grant Program - Alaska State Council on the Arts Available online: https://arts.alaska.gov/Youth-Cultural-Heritage-Grant-Program (accessed on 23 June 2024).
- Anonymous Heritage Education Programme Toolkit. For Heritage Clubs in Uganda’s Secondary Schools and Other Young Ugandans; CCFU (The Cross-Cultural Foundation of Uganda), 2019.
- UNESCO World Heritage Centre Activities Available online: https://whc.unesco.org/en/activities/id_keywords=484&action=list (accessed on 23 June 2024).
- Celebrating African World Heritage Day Available online: https://awhf.net/2371-2/ (accessed on 23 June 2024).
- Cultural Heritage and Education Available online: https://culture.ec.europa.eu/cultural-heritage/cultural-heritage-in-eu-policies/cultural-heritage-and-education (accessed on 23 June 2024).
- MacDowell, M.; Kozma, L.G. Folkpatterns: A Place-Based Youth Cultural Heritage Education Program. The Journal of Museum Education 2007, 32, 263–273. [CrossRef]
- Youth on the Trail of World Heritage Available online: https://www.ovpm.org/program/youth-on-the-trail-of-world-heritage/ (accessed on 23 June 2024).
| Subject | Total Frequency | Men | Women | Age Range 18-25 | Age Range 26-35 | Age Range 36-45 | Age Range 46-55 |
|---|---|---|---|---|---|---|---|
| Master Secondary-Innovation in Economy | 24 | 6 | 18 | 8 | 11 | 4 | 1 |
| Didactics of Social Sciences-History | 48 | 7 | 41 | 47 | 1 | 0 | 0 |
| Didactics of Social Sciences-Geography | 50 | 11 | 39 | 49 | 0 | 1 | 0 |
| Totals | 122 | 24 | 98 | 104 | 12 | 5 | 1 |
Disclaimer/Publisher’s Note: The statements, opinions and data contained in all publications are solely those of the individual author(s) and contributor(s) and not of MDPI and/or the editor(s). MDPI and/or the editor(s) disclaim responsibility for any injury to people or property resulting from any ideas, methods, instructions or products referred to in the content. |
© 2024 by the authors. Licensee MDPI, Basel, Switzerland. This article is an open access article distributed under the terms and conditions of the Creative Commons Attribution (CC BY) license (http://creativecommons.org/licenses/by/4.0/).


