Preprint
Article

Is It Time to Build an Ark? The Reality of Climate Change in One of the Worst Climate Tragedies in Brazil

Altmetrics

Downloads

241

Views

244

Comments

0

Submitted:

21 June 2024

Posted:

24 June 2024

You are already at the latest version

Alerts
Abstract
The article addresses the complex climatic situation faced by the state of Rio Grande do Sul, Brazil, which began on April 27, 2024, and extended for weeks. This unprecedented extreme weather event is yet another chapter in the global climate crisis. Initially, this rainfall seemed typical for the season. However, it quickly escalated into one of the worst climatic catastrophes in Brazil's history. In recent years, there has been a global increase in extreme weather events, including heavy precipitation, flooding, landslides, cyclones, and heatwaves, highlighting the ongoing climate crisis as one of the most serious threats we face today. In light of this, our study aims to elucidate the impact of climate change by examining one of Brazil's most severe climate disasters. We investigate the complex situation in Rio Grande do Sul, analyzing the ongoing climate crisis and projecting what can be expected in the near future.
Keywords: 
Subject: Environmental and Earth Sciences  -   Environmental Science

1. Introduction

On April 27, 2024 rain droplets began to fall in the central-western region of the state of Rio Grande do Sul, the southernmost state in Brazil. Initially, these droplets seemed typical for this time of year. However, what began as a normal rainfall soon turned into a nightmare. As the days passed by, the rain did not cease; instead, it often intensified. In some areas, rainfall accumulated between 300 to 700 millimeters, far exceeding the monthly average. Rivers overflowed, floods formed, and everything in their path was swept away, leaving behind a trail of destruction. The main lake in the metropolitan region reached unprecedented heights of up to 5.35 meters, 2.35 meters above the flood threshold for the area. This tragedy has now been recorded as one of the worst climatic catastrophes in Brazil's history, resulting in the deaths of 177 people, 37 missing, over 600,000 displaced from their homes, and affecting more than 2.4 million people across 478 municipalities, approximately 96.1% of all cities in the state (Rio Grande do Sul 2024a).
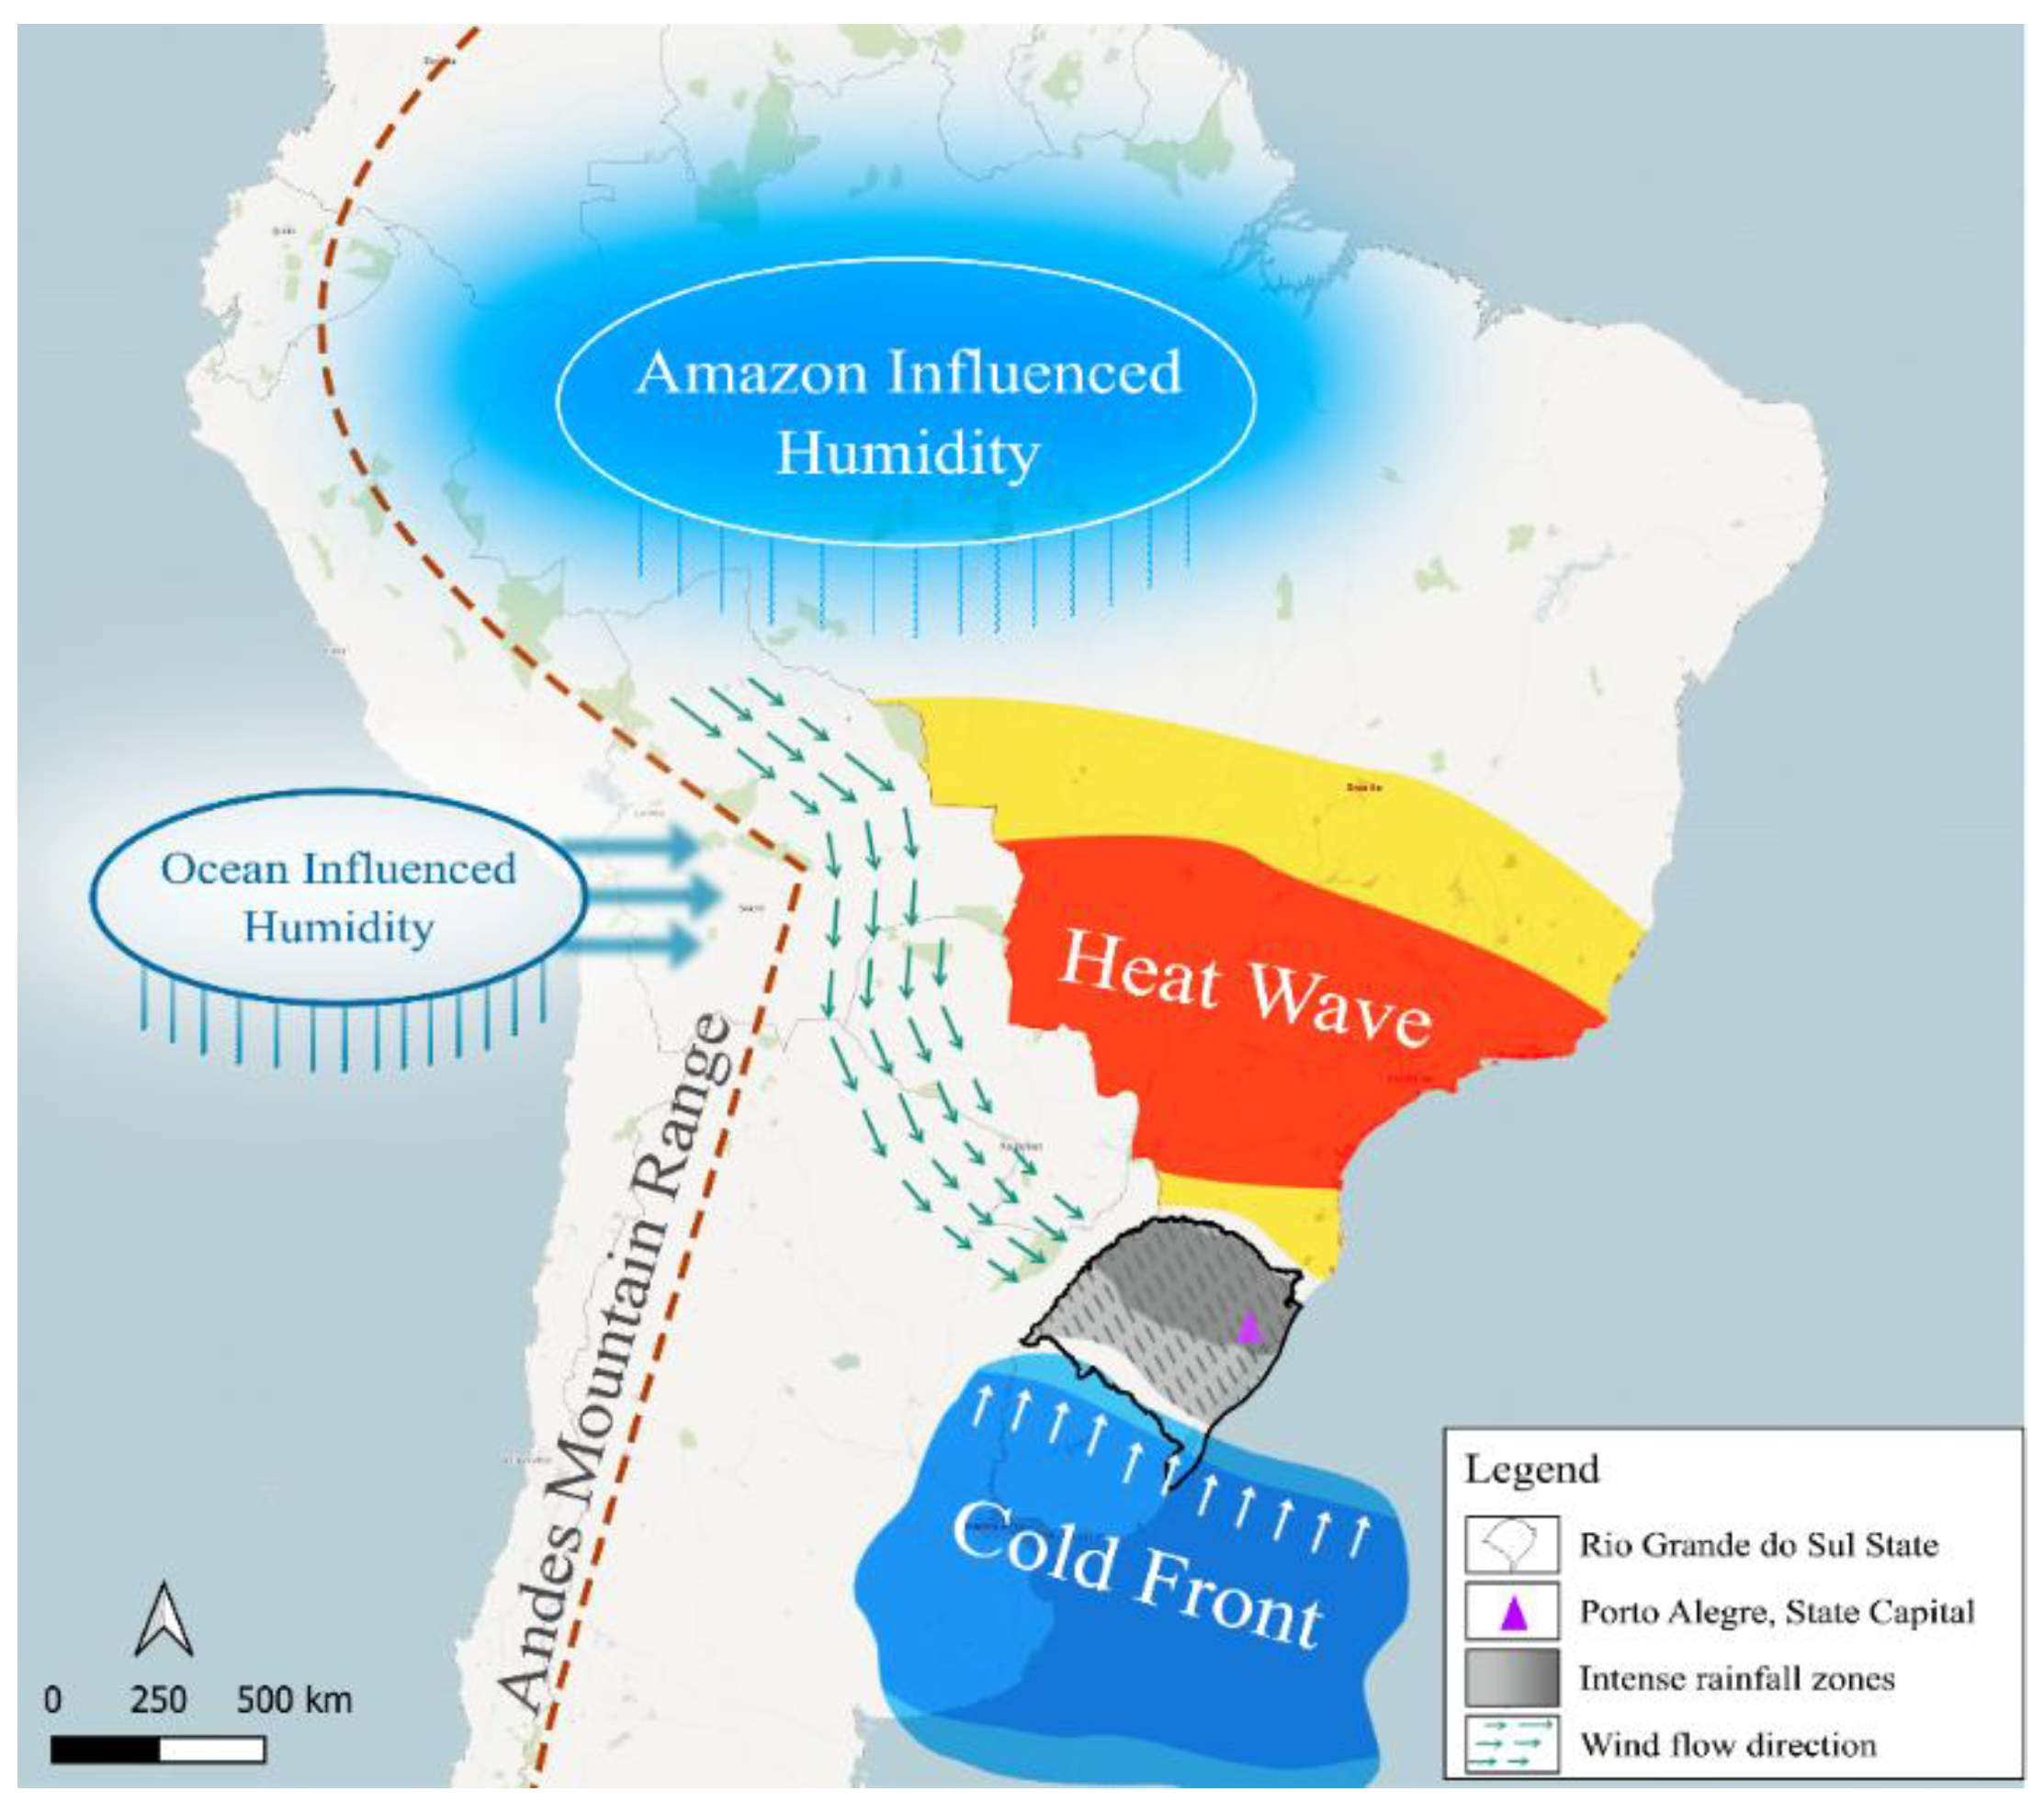
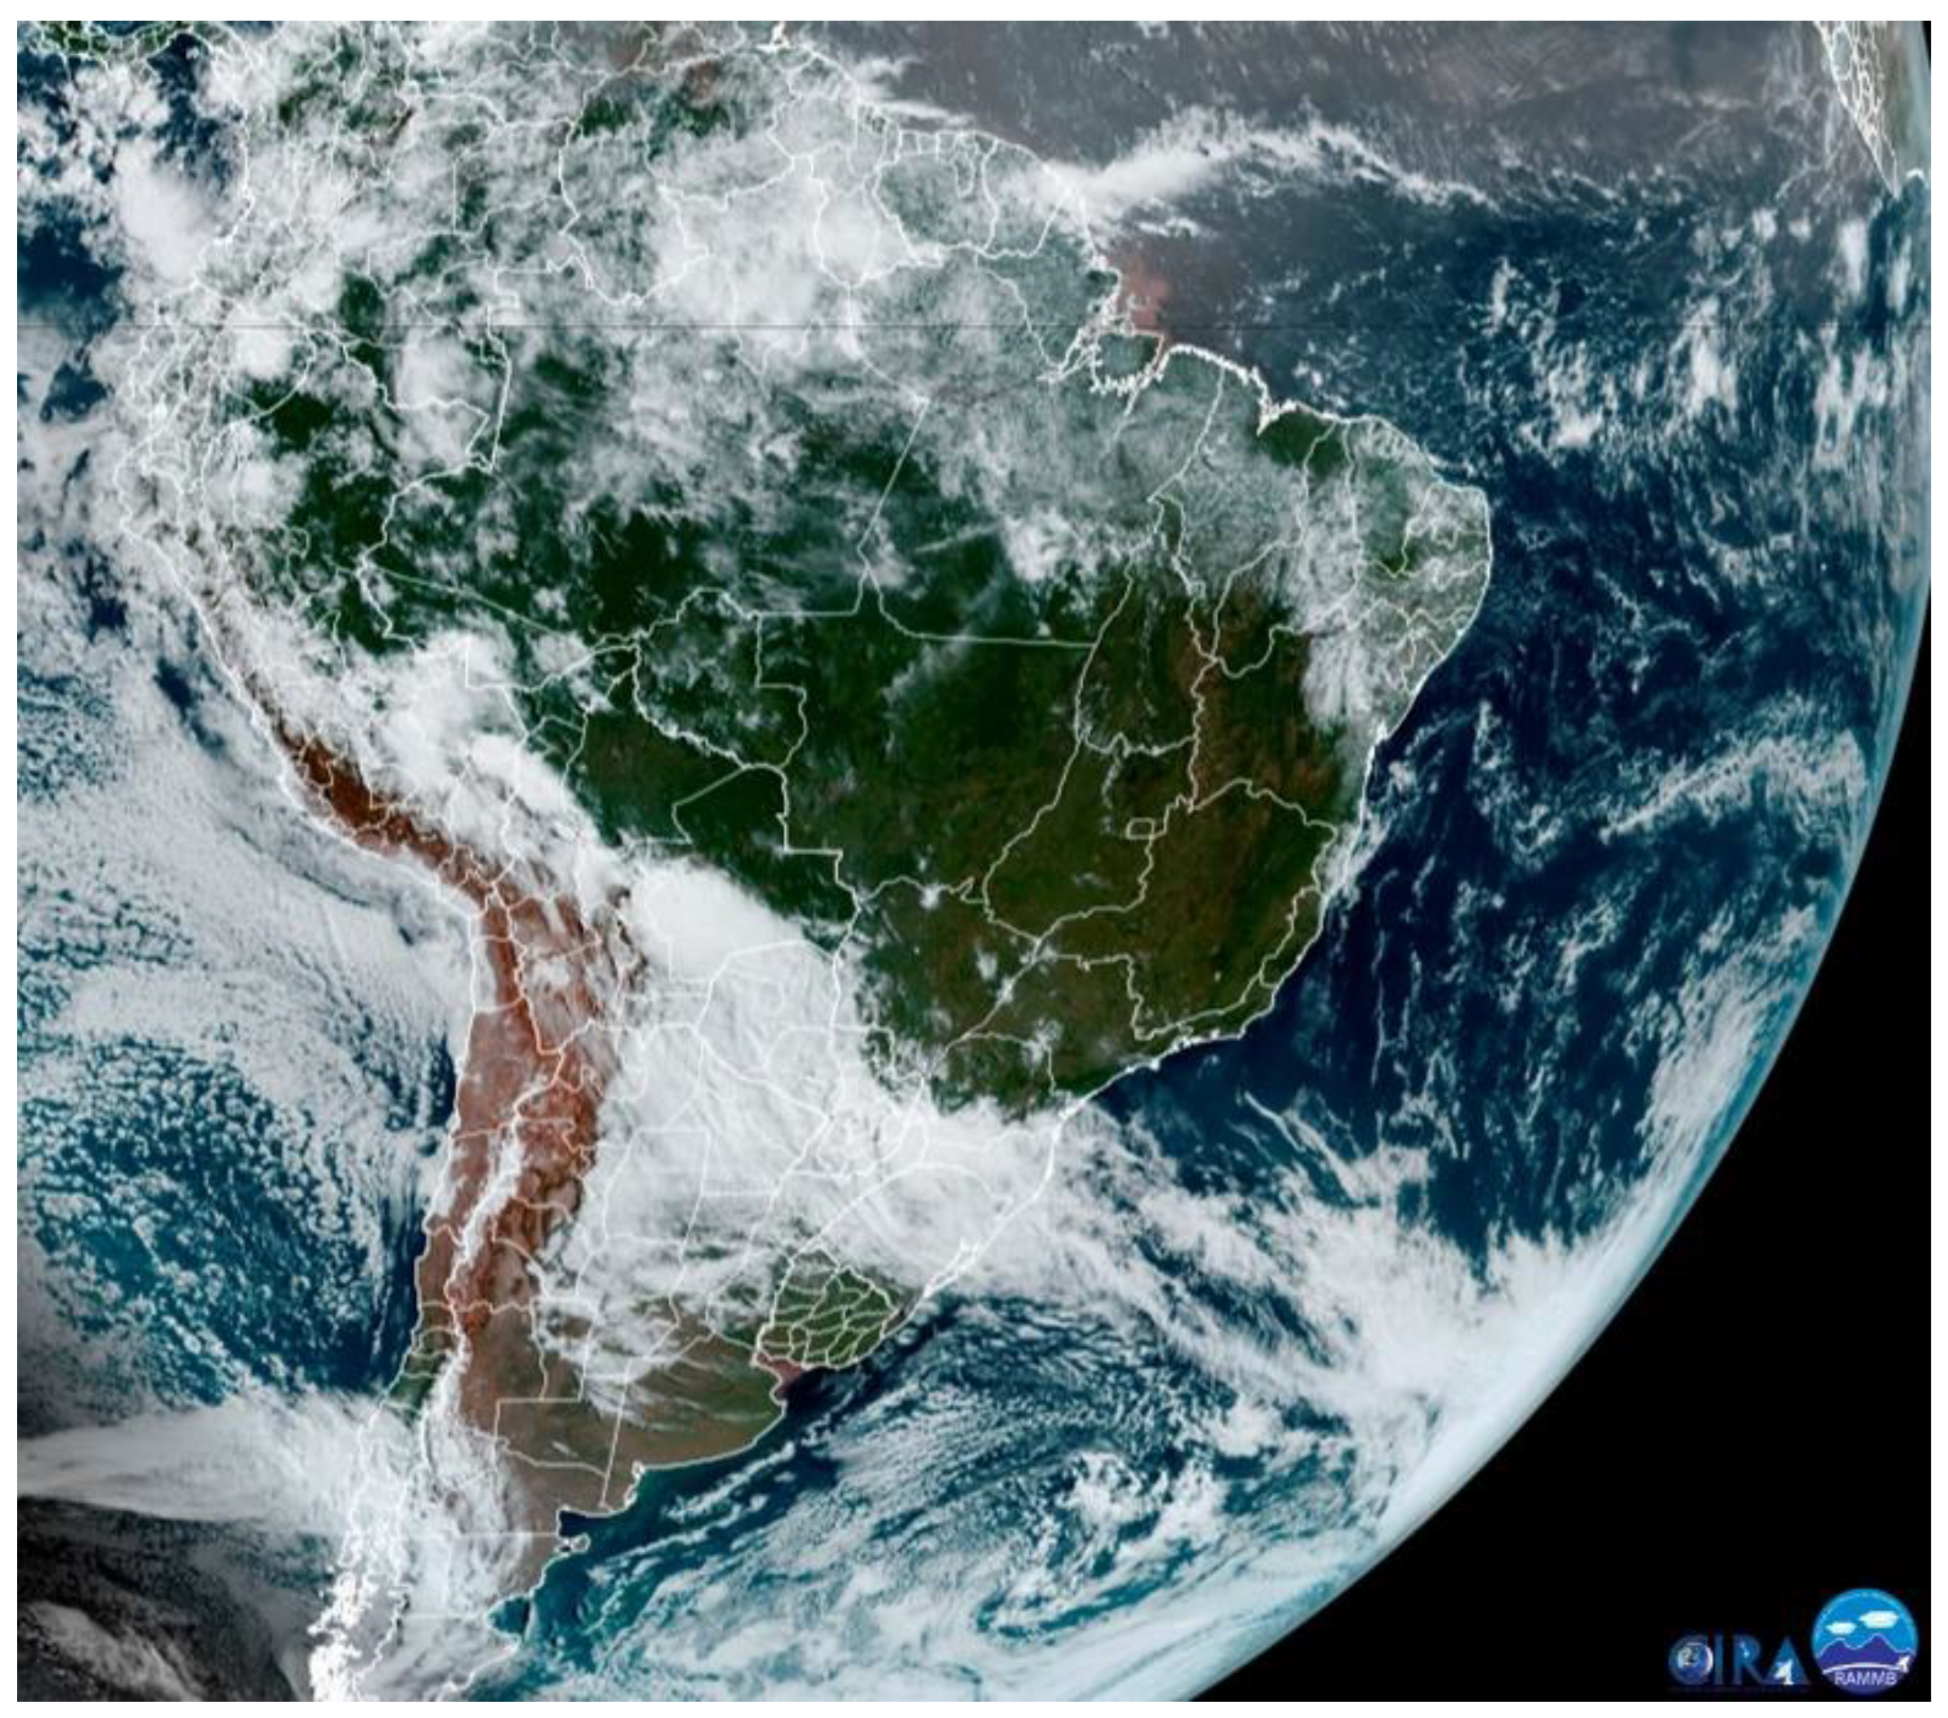
Almost like a theatrical play, and according to the Brazilian National Institute of Meteorology (INMET), the meteorological context that led to this tragedy can be explained in four acts (INMET 2024). (1) Since mid-April, the central region of Brazil has been under the influence of a warm air mass, extending from the northern part of the southern region to the northern areas of the central-west and southeast of Brazil. Concurrently, (2) ocean temperatures are elevated due to the influence of El Niño, leading to increased humidity in the atmosphere. Amid this, (3) a cold front arrived from the southern part of the South American continent. Typically, it would push the warmth of the warm air mass and dissipate as it advanced across the continent. However, this high-pressure warm air mass in the central part of the country generates winds that strike the Andes Mountain Range, where they are deflect and accelerate, passing between this heat bubble and the cold front. (4) These winds, while creating a corridor between the warm air mass and the approaching cold front, interacted with the humidity originated from the Amazon near the Andes, recharging and intensifying the storms. This set of factors is better illustrated in Figure 1, which displays them schematically. Figure 2 provides a satellite image showing the actual conditions in play, obtained from the Cooperative Institute for Research in the Atmosphere (CIRA) and the STAR Regional and Mesoscale Meteorology Branch (RAMMB) Geocolor product, which utilizes images from the GOES-East satellite of the National Oceanic and Atmospheric Administration (NOAA) (NOAA 2024).
The events described above were not isolated incidents but rather interconnected phenomena, each exacerbating the other. The coexistence of intense heatwaves, prolonged droughts, severe storms, and devastating floods is a direct consequence of climate change (Stott 2016; Seneviratne et al. 2021). According to the Intergovernmental Panel on Climate Change (IPCC) report, the warming of the Earth's atmosphere and oceans amplifies the intensity and frequency of extreme weather events, creating a domino effect of environmental catastrophes (IPCC 2021).
Satellite images show that this convergence of forces was forming a series of storms, one after another. A video from multiple satellite image composition, obtained from CIRA and RAMMB Slider, and developed by the authors, depicting the sequence of events from April 27 to May 16 is available in the supplementary material (CIRA 2024). A significant portion of this rainfall occurred in the central and mountainous region of the state of Rio Grande do Sul. The water flowed down the streams and rivers, finding its way downhill. Almost all of these rivers —the Pardo River, the Antas River, the Caí River, the Jacuí River, the Sinos River, and the Gravataí River—affected by the majority of the rainfall, flow into Lake Guaíba, located next to the state capital, Porto Alegre. Thus, this tragedy, which was already of terrifying proportions in the interior of the state, reached its heart—the metropolitan region—exponentially increasing the number of affected individuals and completely paralyzing the fourth largest state in Brazil (Rio Grande do Sul 2024a; Rio Grande do Sul 2024b). In face of this scenario, our study sought to present a discussion to elucidate the reality of climate change in Brazil's one of the worst climate tragedies. Investigating the complex context of the state of Rio Grande do Sul in the face of constant climate changes and what can be expected in the near future.
Figure 1. The meteorological context of the key factors related to the 2024 climate tragedy in Rio Grande do Sul, created using QGIS software version 3.10.13.
Preprints 110060 g001
Figure 2. Satellite image showing the real occurrence of the factors presented in Figure 1 (NASA, 2024).
Preprints 110060 g002

2. Climate Crisis: Are We Really Ready to Face This Challenge?

The ongoing climate crisis represents one of the most serious global threats ever faced. As global temperatures rise, driven by greenhouse gas emissions from electricity, heat, transportation, deforestation, and other anthropogenic actions, the impacts on our environment, economies, and societies are becoming increasingly severe (Bakhtsiyarava et al. 2023; Sultana, 2022; Deng et al. 2020).
In recent years, it has been observed worldwide an exacerbated frequency of precipitation, flooding, landslides, cyclones, and heatwaves events. Currently, it is estimated that the global temperature has risen by an average of 1.1°C compared to pre-industrial levels. This increase may be more pronounced in regions with high rates of urbanization (IPCC 2023; Masson-Delmotte et al. 2022; Geirinhas et al. 2021).
There is ample evidence indicating the urgent need to address the current global climate crisis. Mitigation efforts are essential to reduce greenhouse gas emissions and to break the paradigm of dependence on fossil fuels, accomplished through accelerating the economic decarbonization, transitioning to renewable energy sources, and adopting sustainable land use and agricultural practices. Simultaneously, adaptation strategies are crucial to helping communities deal with the impacts caused by extreme weather events, fulfilled by building smart urban infrastructure, developing climate-resilient and inclusive cities, and implementing early warning systems (Aboagye and Sharifi 2024)
Unfortunately, significant barriers still persist strongly, both globally, nationally and locally. Economic interests intrinsic to fossil fuels, reduced climate financing, insufficient government commitments, and social inequalities exacerbate the path forward. Addressing these challenges requires disrupting the business-as-usual mindset in how we perceive and respond to the climate crisis, a journey that can begin with a simple, significant step: promoting climate education, literacy, and awareness.
As long as the barrier remains unbroken, the population bears the burden. According to estimates from the well-known 2006 Stern Review, the benefits of rigorous and early climate action outweigh the economic costs of inaction, as the annual cost of unmitigated climate change would amount to at least 5% of global GDP, potentially reaching 20%. In contrast, it is estimated that the costs of measures aimed at reducing greenhouse gas emissions would cost around 1% of global GDP. Furthermore, more recent estimates show that inaction on climate change could cost the world’s economy US$178 trillion by 2070 (Stern et al. 2006).
According to Table 1, which presents data from the Digital Atlas of Disasters in Brazil (Brasil, 2024), the impacts of climate disasters varied significantly among Brazilian states from 2012 to 2023. In terms of occurrences, the most affected states were Minas Gerais (4759 occurrences), Santa Catarina (4628 occurrences), and Rio Grande do Sul (4398 occurrences). The states with the highest number of deaths were Rio de Janeiro (494 deaths), Minas Gerais (312 deaths), and São Paulo (293 deaths). When it came to economic losses, Rio Grande do Sul led with $18.8491 billion, followed by Minas Gerais with $8.0693 billion, and Santa Catarina with $7.238 billion.
In the period, Rio Grande do Sul stands out significantly with its data, both in terms of human and economic impact. The state recorded 4398 occurrences of disasters, resulting in 96 deaths and displacing 550.5 thousand people. In total, 18.6 million people affected, with economic losses of 18.8 billion dollars, representing a notable contribution to the national totals (23.4%).
In light of the latest climate tragedy that sadly affected the cities of Rio Grande do Sul, the pressing question arises: "Are we really ready to face this challenge?". This questioning is not merely timely but also critical, demanding a meticulous reflection of our readiness and commitment to combatting this existential threat head-on.

3. Rio Grande do Sul – The State of the Tragedy

3.1. Geographical and Climatical Settings

To better understand the context of this climate tragedy, it is important to comprehend the setting of the state of Rio Grande do Sul. This state is located in the southern region of Brazil (Figure 1), between the longitudes -49º and -58º and latitudes -27º and -34º. It covers an area of approximately 282,000 km², subdivided into 497 municipalities, with an estimated population of about 11 million inhabitants in 2022, more than 85% of whom live in urban areas (IBGE, 2022a). According to the Köppen-Geiger climate classification, the state's climates are of the Cfa (humid subtropical) and Cfb (temperate oceanic) types, with the Cfa climate being predominant, and the Cfb climate occurring in the higher parts of the Plateau and the Northeast and Southeast Sierras (Beck et al., 2018).
Rio Grande do Sul is situated in a latitudinal region favorable to various meteorological phenomena that affect its weather and climate (Cera and Ferraz 2015). These include synoptic scale phenomena such as cold fronts, which regularly pass through the state, ensuring a good spatial and temporal distribution of rainfall; intraseasonal scale phenomena like the Madden-Julian Oscillation and the South Atlantic Convergence Zone; and global scale phenomena such as El Niño and La Niña (Cera and Ferraz, 2015). Additionally, the state is influenced by the passage of Frontal Systems and Low-Level Jets, which transport heat and moisture from the Amazon to southern Brazil (Campos and Eichholz, 2011).
In addition, the region where Rio Grande do Sul is located possesses ideal characteristics for the development of convective precipitation activity and the formation and maintenance of Mesoscale Convective Systems (MCS). There is a possible correlation between the occurrence of MCS origins and the topography, which may be related to thermal and orographic effects that generate these types of systems (Campos and Eichholz, 2011).
Generally, the subtropical position makes Rio Grande do Sul an area of confrontation between opposing forces, caused by the advance of polar-origin atmospheric systems towards tropicalized polar or tropical-origin systems, resulting from successive passages of frontal masses (Guedes et al. 2019). Moreover, the state experiences rainfall with good spatial and temporal distribution throughout the year, with annual precipitation of approximately 1900mm in the northern half of the state and about 1400mm in the southern half (Rodrigues et al. 2023). For a broader perspective, we can draw an analogy between Rio Grande do Sul and the southeastern United States, particularly the region encompassing the states of Georgia, Alabama, and South Carolina. Similar to Rio Grande do Sul, this region experiences a humid subtropical climate with significant rainfall throughout the year, also influenced by cold fronts and global phenomena like El Niño and La Niña. The southeastern United States also faces similar challenges with convective precipitation and the formation of MCS, which often lead to severe weather events (Mitra and Srivastava, 2017; Mukherjee and Mishra 2021).
Given the confluence of various natural forces, Rio Grande do Sul is located in a region where climate projections from the IPCC indicate an increase in both precipitation and average local temperature (IPCC, 2021). Supporting these projections, multiple studies conducted in the state have shown that this increase in rainfall volume has already been occurring in recent years, along with a rise in average temperature (Melo et al. 2015; Berlato and Cordeiro 2018; Guedes et al. 2019; Teixeira and Prietto, 2020; Rodrigues et al. 2023). This rise is primarily associated with higher minimum temperatures during autumn and winter, and lower average temperatures in summer due to increased cloud cover. Additionally, during El Niño Southern Oscillation (ENSO) years, precipitation increases across the state, elevating the likelihood of extreme weather events (Matzenauer et al., 2017; Teixeira and Prietto, 2020).
In the face of precipitation-related disasters, the northern half of the state is typically the most affected (Sausen et al., 2018). During periods of heavy rainfall, the river basins that originate in the escarpments of the Serra Geral Plateau experience the most significant instances of flash floods in areas with rugged terrain and limited drainage area, and flooding, particularly near the river mouths. Notable regions include the Taquari-Antas River Basin, the Jacuí River Basin, and the Pardo River Basin (de Oliveira, 2010).

3.2. Legal and Administrative Measures for Climate Change Mitigation in Rio Grande do Sul

To address the increasing impacts of climate change, the state of Rio Grande do Sul has implemented several legal and administrative measures. The first main framework was the "Política Gaúcha sobre Mudanças Climáticas" (PGMC), established by Law No. 13,594 in 2010. This policy outlines objectives, principles, and guidelines for mitigating and adapting to climate change within the state. The PGMC emphasizes the importance of integrating climate considerations into public policies and fostering sustainable development practices (Rio Grande do Sul 2010). More recently, in 2021, the state has made efforts to align with the United Nations Sustainable Development Goals (SDGs), particularly Goal 13, which focuses on climate action. A comprehensive report by the state’s Department of Economy and Statistic evaluates the progress of Rio Grande do Sul in meeting the targets of SDG 13. The report highlights ongoing efforts and identifies areas needing improvement to enhance the state's capacity to combat climate change (Rio Grande do Sul, 2021).
In 2023, the state initiated its primary plan to address the effects of climate change, the "ProClima 2050" program (Rio Grande do Sul 2023). This is a set of government strategies aimed at reducing the impact of climate change on the population of Rio Grande do Sul, as well as promoting the mitigation of greenhouse gas emissions and adaptation for net-zero emissions by 2050. This initiative focuses on four pillars: (1) Climate Resilience, which concentrates on strengthening the state's resilience to climate change; (2) Just Energy Transition, which recognizes the importance of transitioning to clean and sustainable energy sources through initiatives to promote renewable energy production, energy efficiency, and green job creation; (3) Greenhouse Gas Emissions Reduction, which establishes commitments to significantly reduce the state's greenhouse gas emissions; (4) Environmental Education and Awareness, which emphasizes the importance of environmental education as a fundamental tool to inform and engage the population about climate change, environmental impacts, and the actions that individuals and communities can take to contribute to mitigation and adaptation (Rio Grande do Sul 2023).
However, the investment projected by the government for ProClima 2050 in 2023 was approximately US$10 million, an amount that can be considered extremely low given the necessary climate adaptation measures for the state. Additionally, this amount seems inadequate when compared to the costs that will be incurred to rebuild the state following the current extreme climate event. Moreover, this program did not include actions for urban infrastructure adjustments in cities located in high-risk zones, nor did it include an urban zoning project with the consequent relocation of populations in risk areas. Despite these initiatives, significant challenges remain in effectively implementing and enforcing these policies. Furthermore, there is an urgent need for substantial investments to implement appropriate measures aligning the state with the first pillar of its strategic program: enhancing the climate resilience of cities in Rio Grande do Sul.

3.3. The Extreme Rainfall Event

It is within this climatic, meteorological, and hydrological context that the one of the worst climate tragedies in Brazil's history unfolded. High levels of precipitation, caused by persistent heavy rains in the central-western, northwestern, and northeastern regions of the state, led the rivers in these areas, particularly those within the three previously mentioned river basins, to overflow, reaching historic levels (Rio Grande do Sul 2024a). According to the meteorological agency MetSul, a private meteorology company in Brazil that serves the state, between April 27 and May 2, rainfall amounts ranged from 500 to 700 mm, equivalent to one-third of the annual historical average precipitation within these 6 days, with many other areas receiving between 300 and 400 mm (MetSul, 2024). This resulted in flash floods and subsequent inundations in cities near these rivers, leaving entire cities isolated due to the roads and highways destruction either by the waters or by landslides on the region's slopes. However, the tragedy, already of terrifying proportions, worsened as the days passed. The waters flowed downstream, all converging at Lake Guaíba, located in the metropolitan region of the state and home to the capital, Porto Alegre (Rio Grande do Sul 2024a).
The capital city of Porto Alegre is home to 1.33 million inhabitants within the municipal limits and about 4.3 million inhabitants in the metropolitan region, making it the fifth most populous metropolitan area in Brazil (IBGE, 2022b). Founded in 1772, Porto Alegre owes much of its prominence to its advantageous location at the confluence of various rivers that drain a total area of over 80,000 km² and connect into Lake Guaíba. During an era when navigation was responsible for most of the trade and transportation, this location represented a strategic advantage for the city’s port, which allowed access to products coming from inland areas and to the Atlantic Ocean through the Patos Lagoon. As a result, Porto Alegre emerged as the main commercial center in the extreme south of Brazil (Possa et al. 2022).
If, on the one hand, the strategic location at the confluence of several rivers represented a significant economic advantage, on the other hand, this location also implied the possibility of severe losses during flood events. Throughout its history, this region has experienced several near-flood events (when water levels did not exceed the 3-meter flood threshold at the city's port) and a few actual flood events (when water levels did exceed this threshold). These flood events were typically spaced by periods of more than 15 to 20 years, with maximum overflow levels only slightly exceeding the threshold but becoming increasingly frequent in recent years (Azevedo-Santos et al. 2023; Porto Alegre 2024). Until 2024, only the flood of 1941, a historic milestone for this capital, surpassed the 4-meter mark, reaching 4.76 meters (Possa et al. 2022).
It was primarily motivated by the 1941 episode that the city, in 1971, started the construction of a flood protection system composed of 68 kilometers of levees (6 internal and 5 external), 19 pump houses, and various pressurized conduits. Among the external levees is a concrete wall 3 meters high above the ground, located in the central area of Porto Alegre, popularly called “Muro da Mauá.” This wall has 14 entrances that can be closed with floodgates and extends for more than 2500 meters along the historic center of the city (Allasia et al., 2015).
Since the completion of the flood protection system, no other event had occurred to put this system to the test. However, that day arrived. On May 3, 2024, Lake Guaíba surpassed its historical mark, and like an untested lifeboat with a hole, the flood protection system, never having been truly challenged, failed (Rio Grande do Sul 2024b). As a result, the waters from the lake flooded the streets of Porto Alegre and numerous cities in the metropolitan region. This time, not with the destructive potential of a flash flood but with an unprecedented volume of water, the floods invaded homes and forced the population to flee to higher ground and seek community shelters (Rio Grande do Sul 2024c). This occurred so rapidly and chaotically in the metropolitan region that most people could only grab a few personal documents and light belongings, with very few managing to save appliances or furniture.
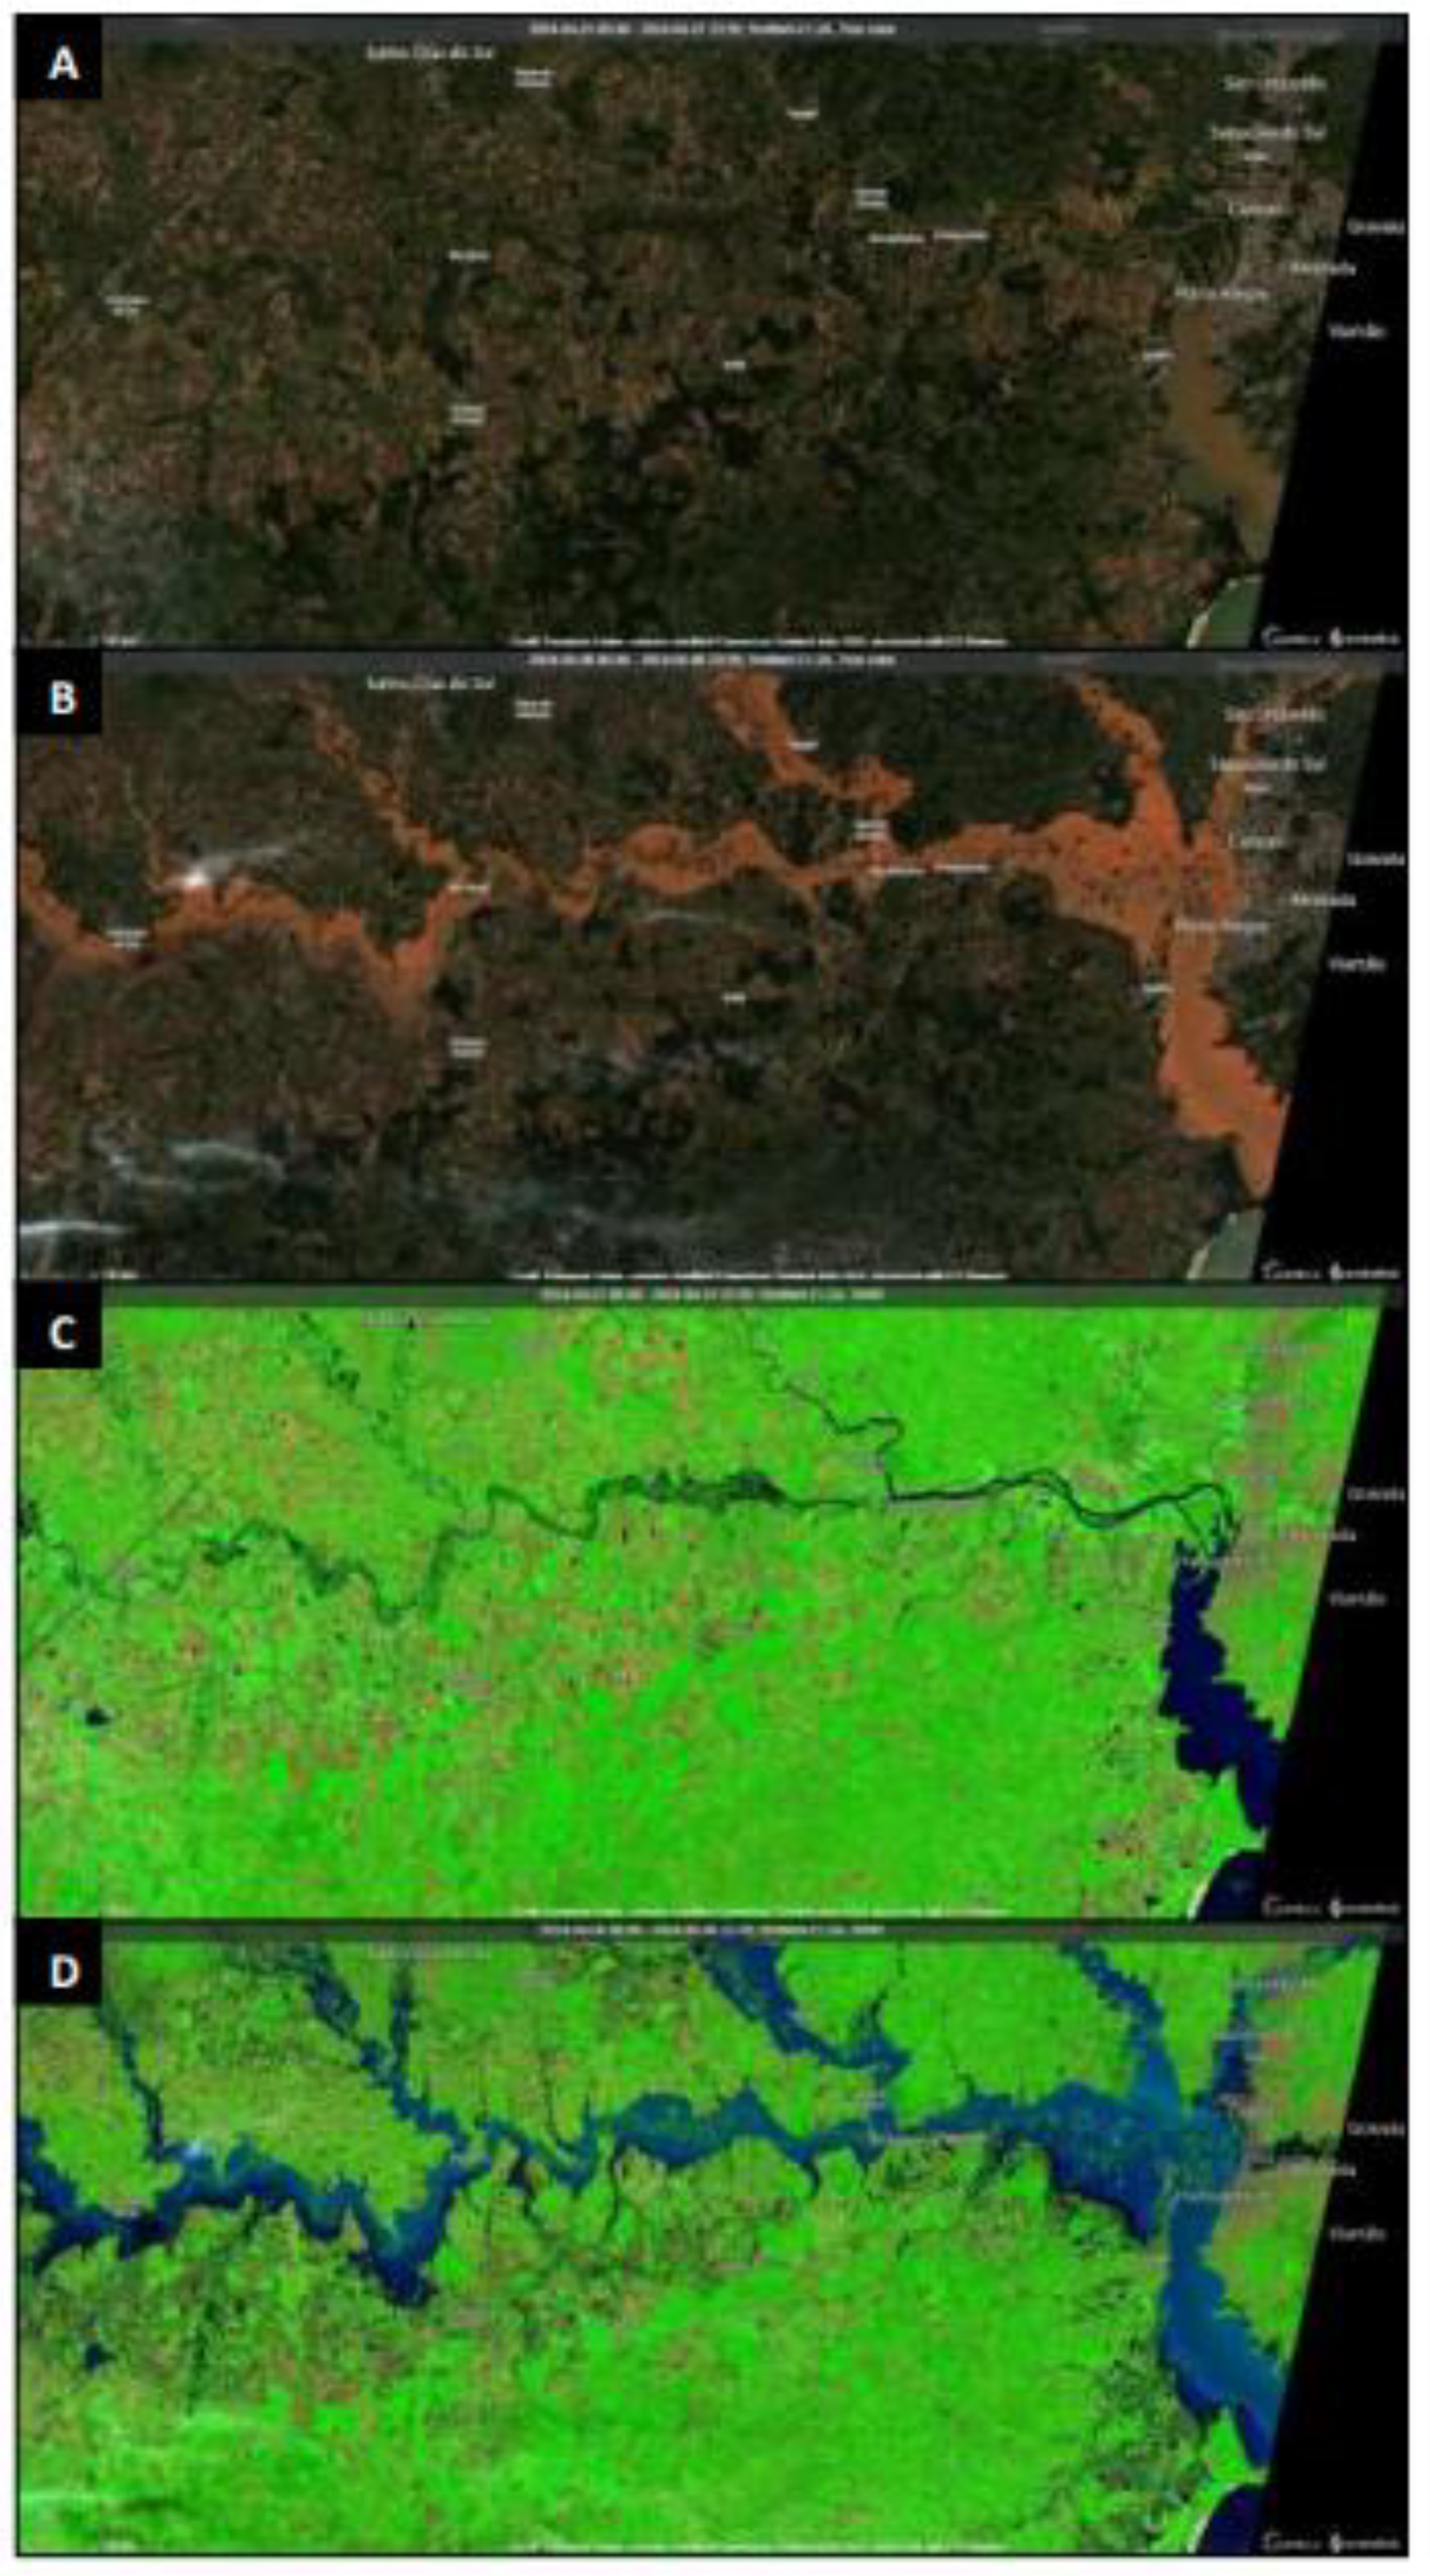
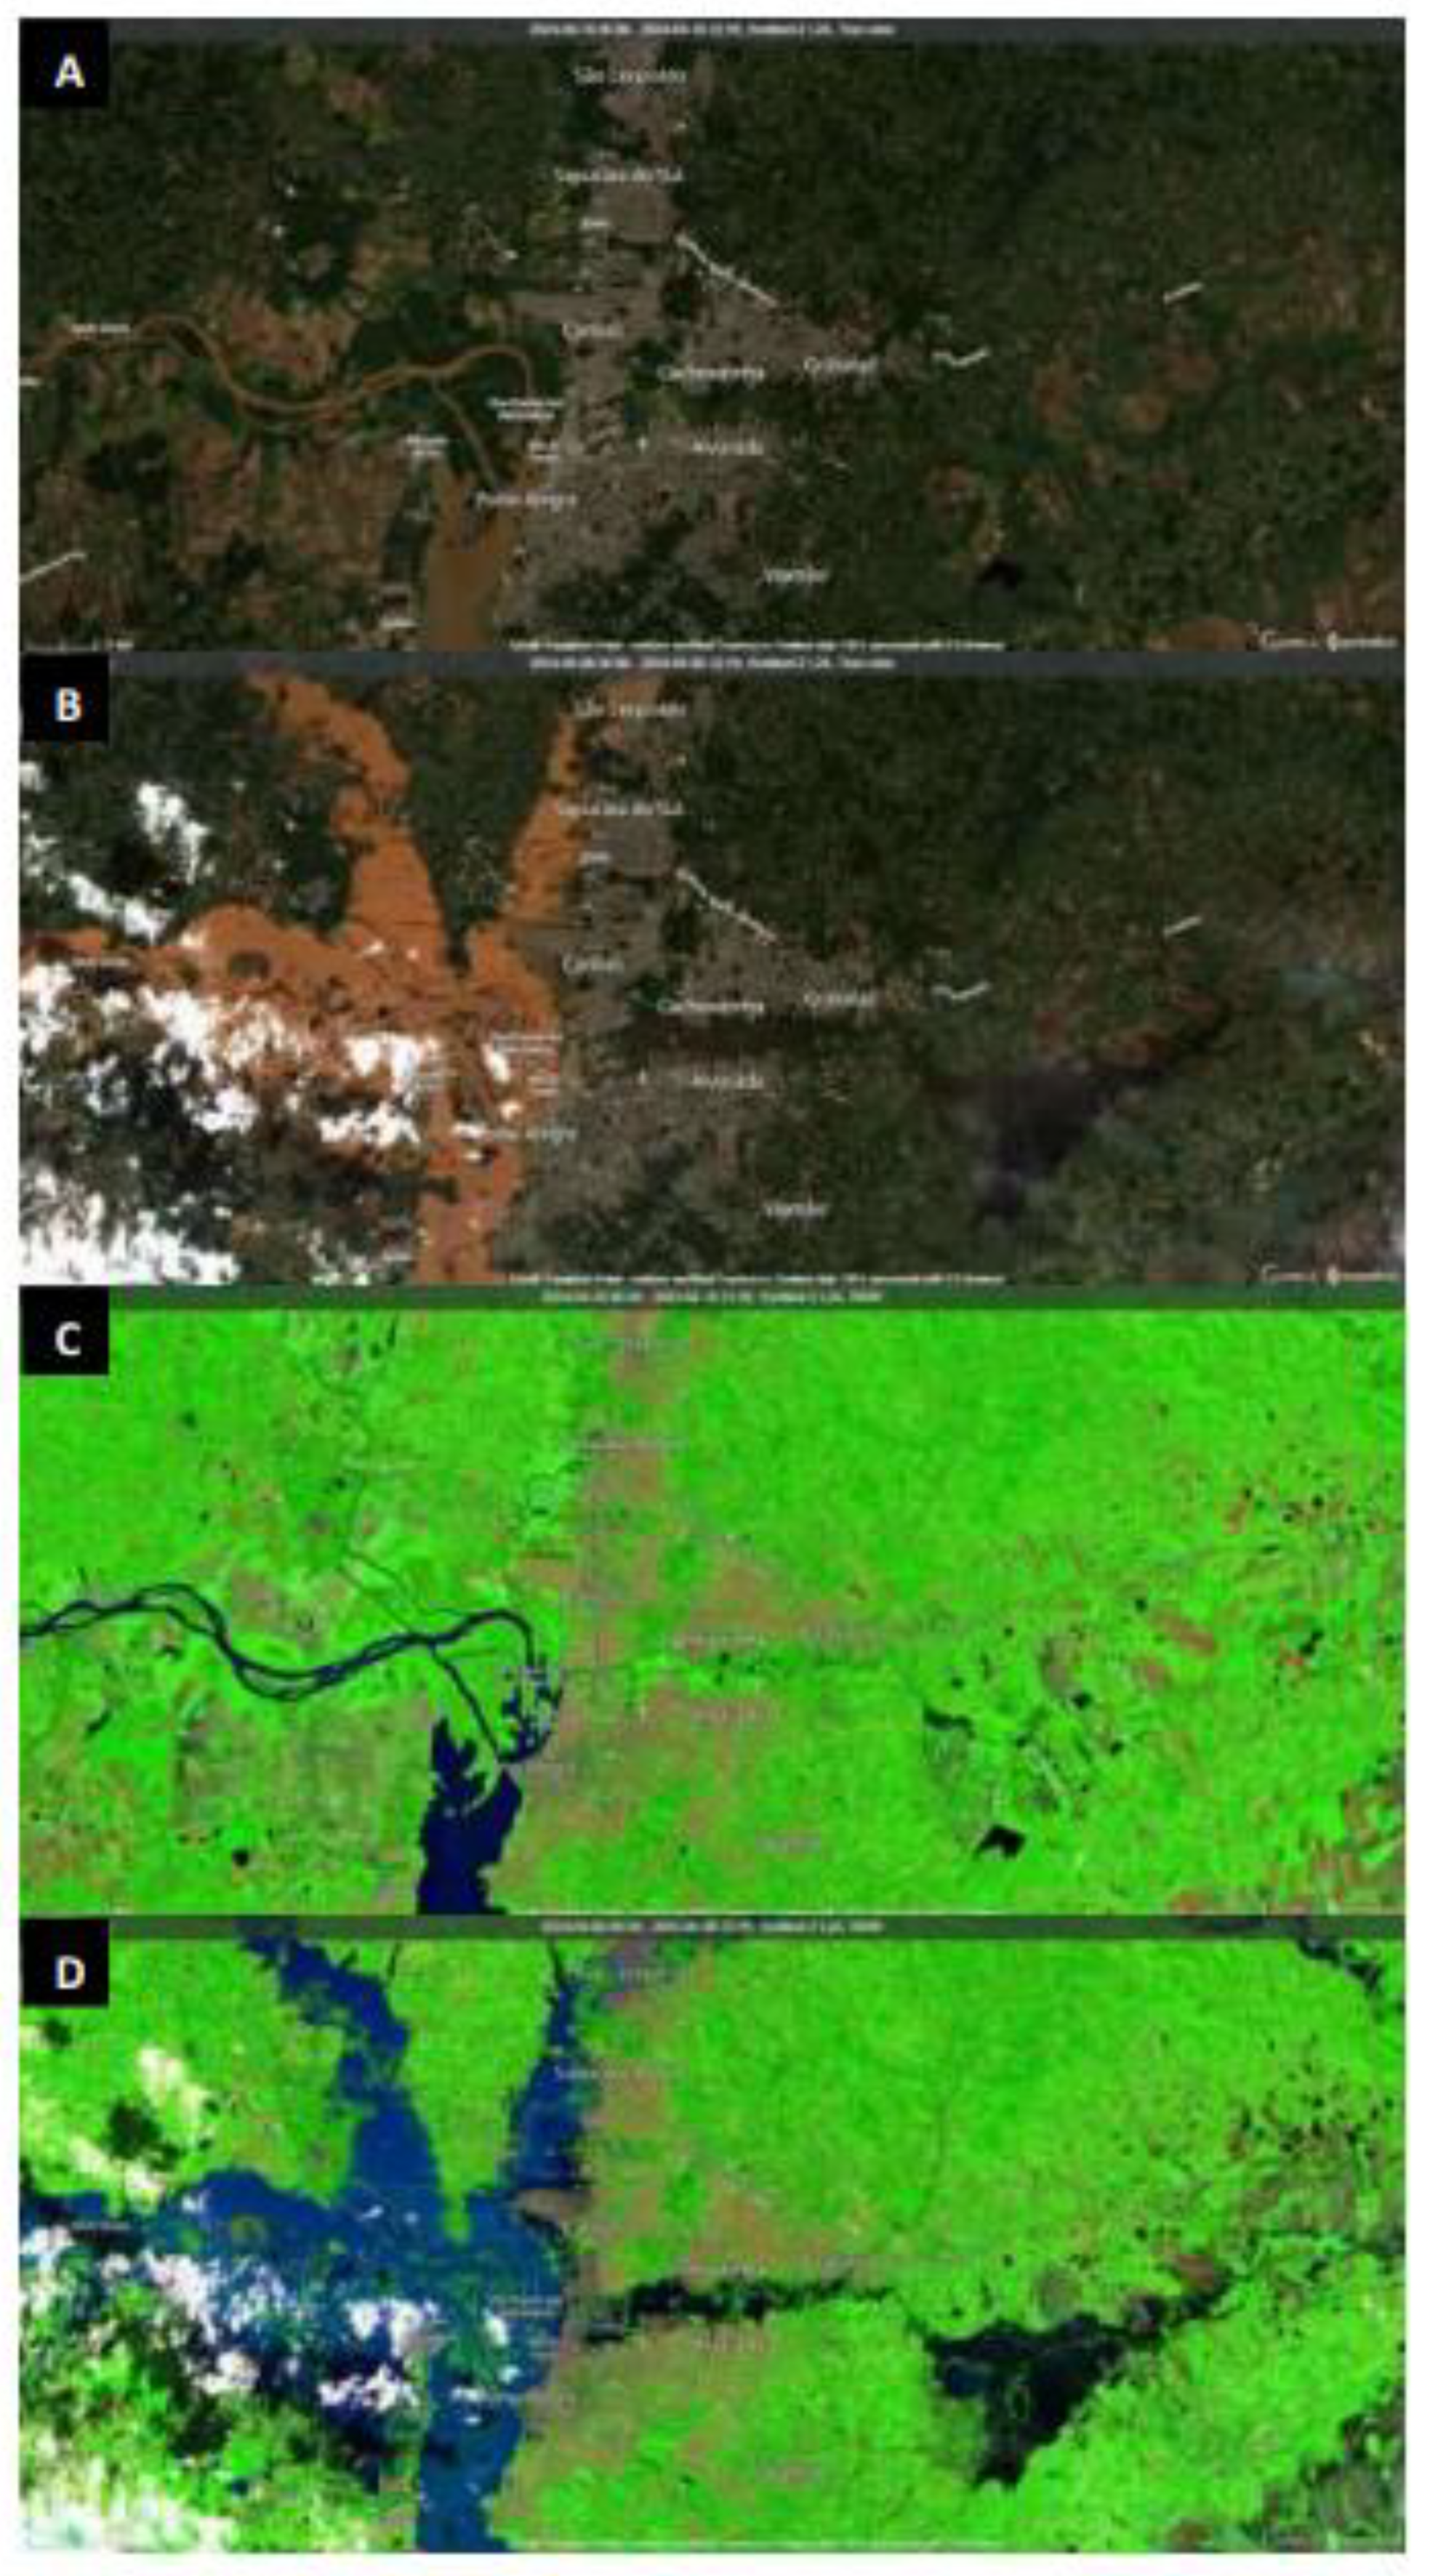
As the days passed, the water continued to rise, and at the most dramatic moment of this tragedy, Lake Guaíba reached 5.35 meters (Rio Grande do Sul 2024b), transforming the Porto Alegre metropolitan region into a vast extension of the lake in a scenario never seen before, as can be seen in Figure 3 and Figure 4. At this point, chaos reigned throughout the state. Although the primary devastating impact was in the areas near the rivers of the Taquari-Antas River Basin, the Jacuí River Basin, and the Pardo River Basin, precipitation events continued, albeit more mildly, over the following days, causing other regions to also suffer from flooding. Additionally, Lake Guaíba is classified as both a lake and a river, and it connects directly to the Patos Lagoon, the fourth largest coastal lagoon in the world. Consequently, this lagoon also began to fill up. Thus, the southernmost part of the state, as well as the cities along the entire coastal portion of Patos Lagoon, started to suffer from floods as well (Rio Grande do Sul 2024a). The Patos Lagoon filled up to such an extent that on May 16, satellite images showed that its body of water merged with that of another large lagoon in the state of Rio Grande do Sul, the Mirim Lagoon. At this moment, the combination of these two lagoons' areas caused Patos Lagoon to move from fourth place to become the third largest coastal lagoon in the world.
Figure 3. Comparison of the expanded area of the Pardo River extension affected by flooding by flooding in Rio Grande do Sul state, captured by Sentinel-2 L2A satellite. (A - before): The region prior to the flooding, showing normal water levels; and (B - after): The same region after the flooding, illustrating elevated water levels and inundated area, using the Natural Color composite (combination of red (B4), green (B3), and blue (B2) bands). (C - before) and (D - after): Highlighting the extensive damage to the area affected by the flooding, captured by Infrared band composite (combination of short-wave infrared (SWIR - B12), visible and near infrared (VNIR - B8a), and red (B4) bands).
Preprints 110060 g003
Figure 4. Comparison of the Porto Alegre Metropolitan Region area affected by flooding by flooding in Rio Grande do Sul state, captured by Sentinel-2 L2A satellite. (A - before): The region prior to the flooding, showing normal water levels; and (B - after): The same region after the flooding, illustrating elevated water levels and inundated area, using the Natural Color composite (combination of red (B4), green (B3), and blue (B2) bands). (C - before) and (D - after): Highlighting the extensive damage to the area affected by the flooding, captured by Infrared band composite (combination of short-wave infrared (SWIR - B12), visible and near infrared (VNIR - B8a), and red (B4) bands).
Preprints 110060 g004
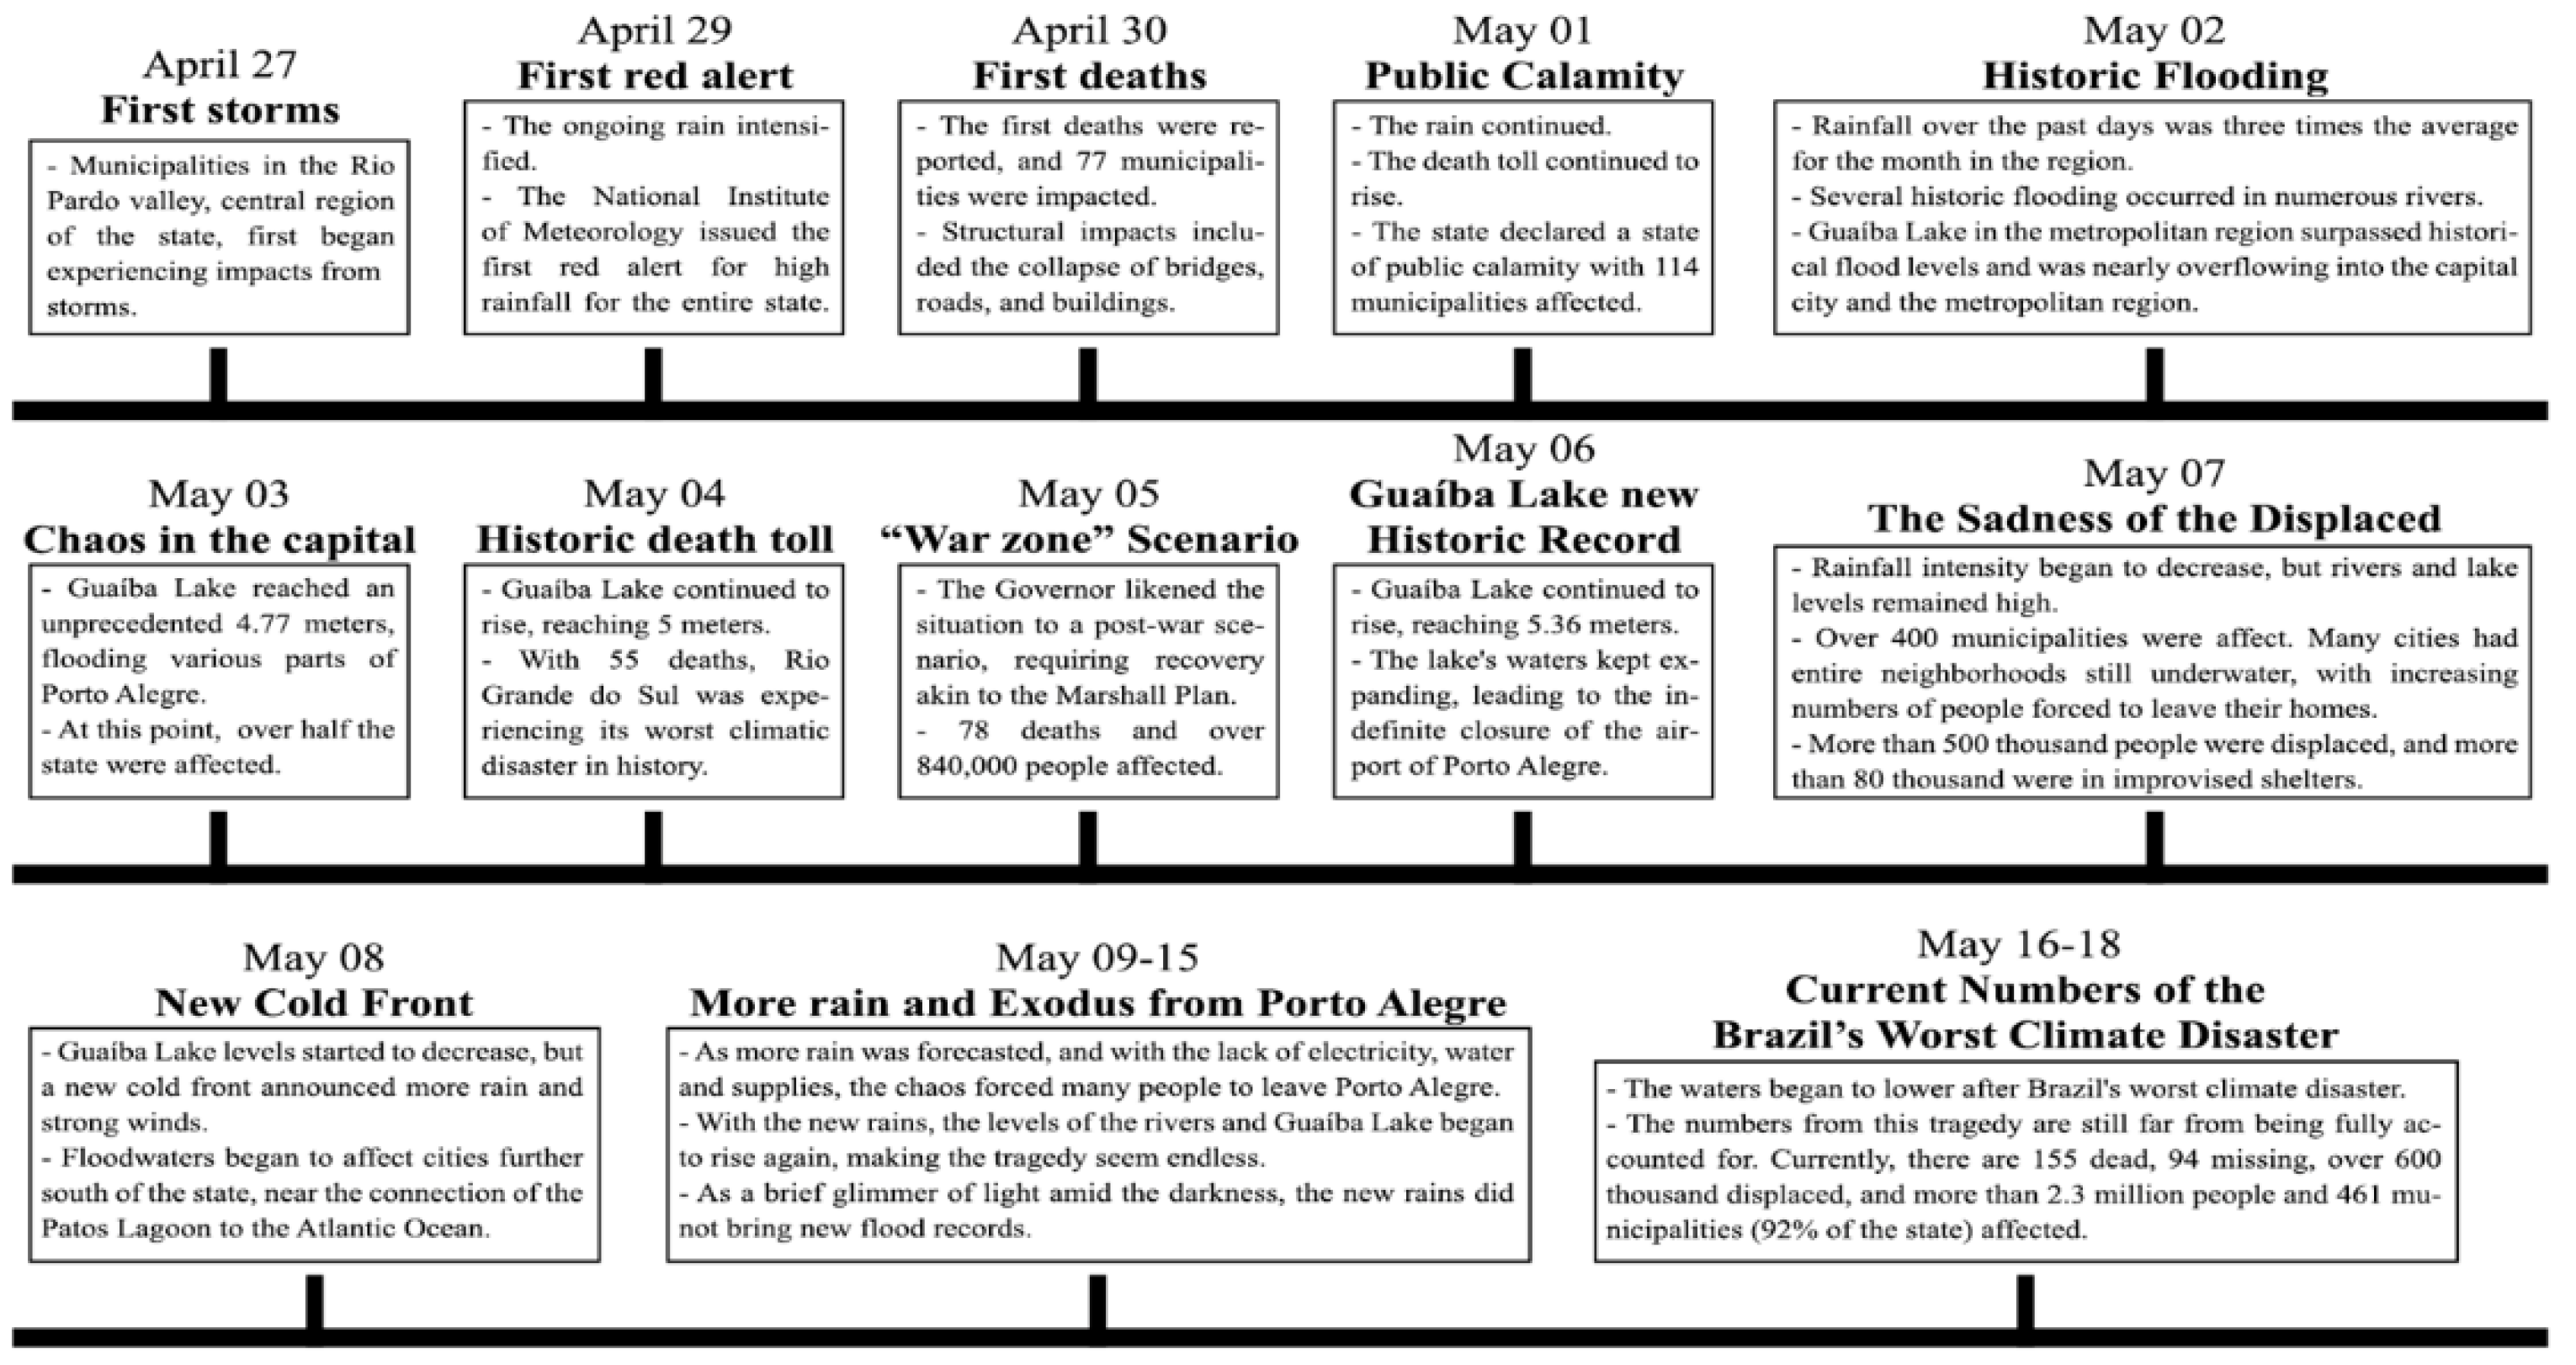
At the peak of this tragedy, approximately 660,000 people were displaced from their homes, and 478 municipalities, approximately 96.1% of all cities in the state, were directly affected by the consequences of this extreme precipitation event. As of now, late June 2024, the Civil Defense of Rio Grande do Sul reported 177 deaths and 37 missing persons, impacting almost 2.4 million people. The timeline of events of this climate tragedy that struck Rio Grande do Sul is illustrated in Figure 5, outlined according to the flood information bulletins provided by the state (Rio Grande do Sul 2024a).
Although not the climatic event with the highest number of deaths ever recorded in the country, trailing behind the 2011 event in the mountainous region of Rio de Janeiro with 947 deaths, primarily caused by landslides (Ardaya et al. 2017), the climate tragedy in Rio Grande do Sul becomes one of the worst due to the magnitude of the statistics. For comparison, the Rio de Janeiro disaster displaced about 35,000 people, compared to nearly 660,000 in Rio Grande do Sul. Moreover, this tragedy in Rio Grande do Sul takes on even larger proportions because the flood is not a one-day event. It takes days for the water to recede, and in the case of Rio Grande do Sul, specifically the metropolitan region, it took more than 20 days for people to finally set foot in their homes again (Rio Grande do Sul 2024a). Thus, the drama of the unfolding tragedy seems endless to those affected, as some victims of the tragedy attest, "It feels like we're continually on day 1".
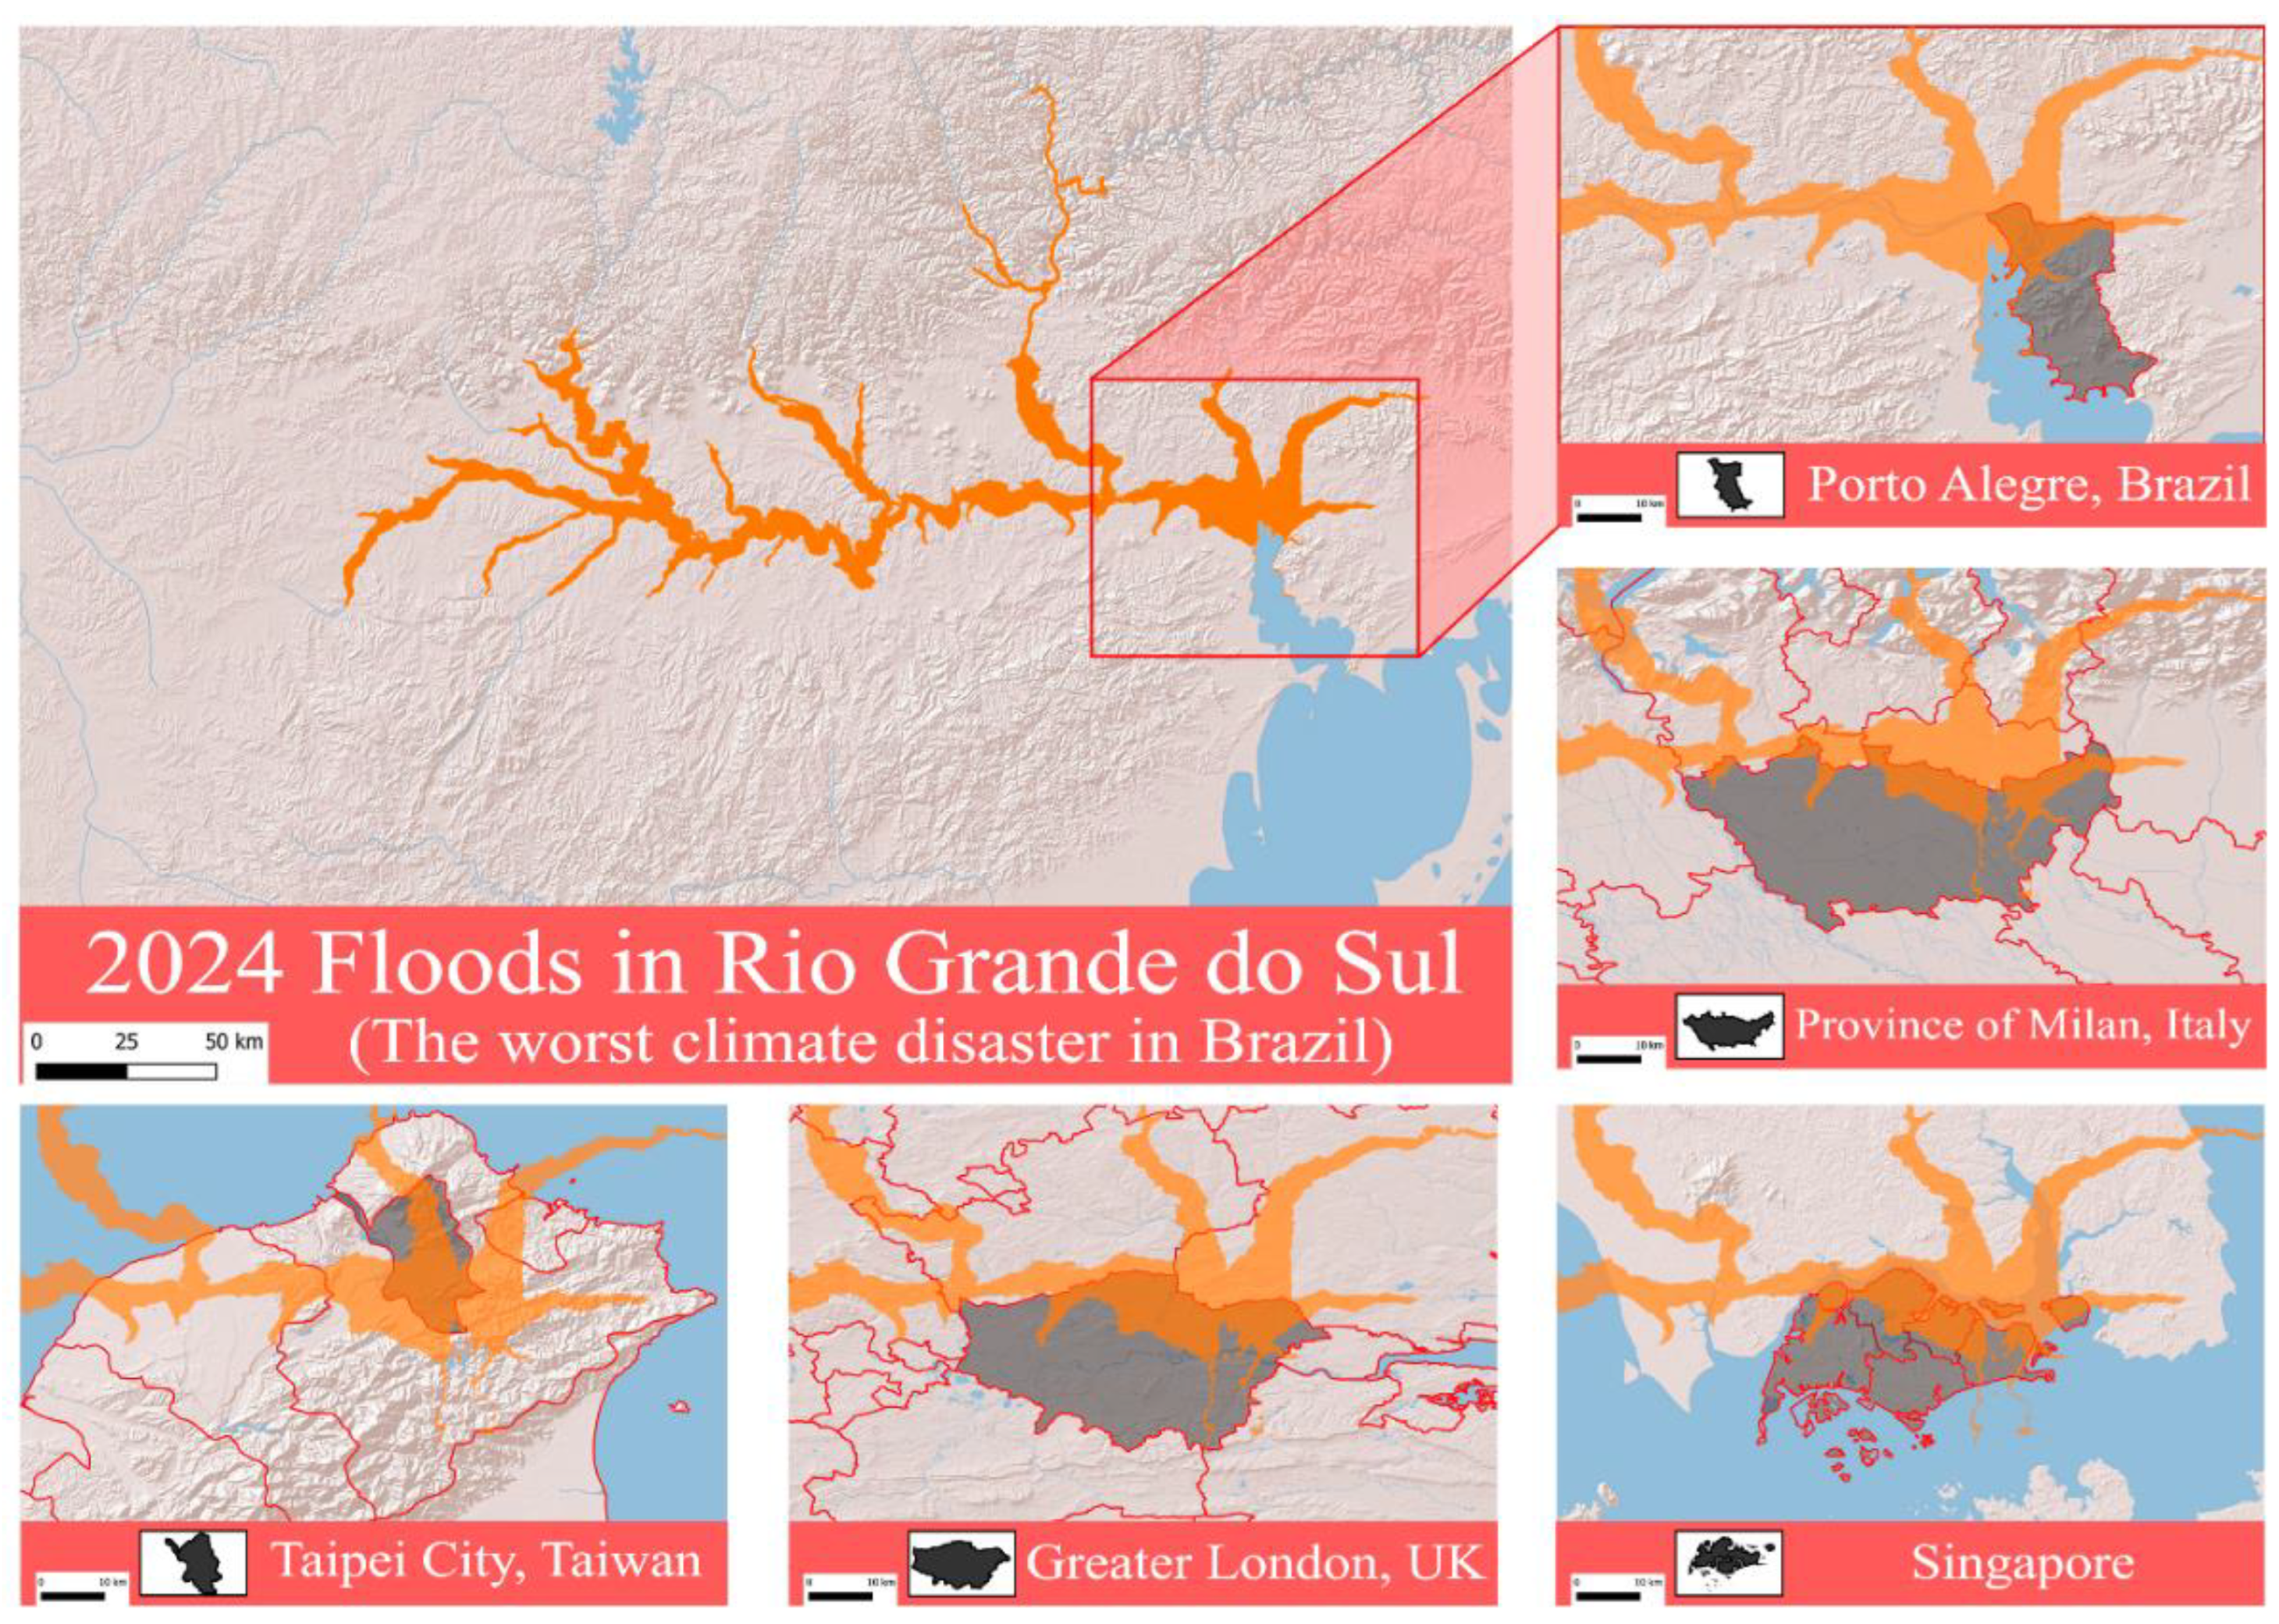
Furthermore, this is only considering the number of affected individuals, without accounting for direct economic expenses – directly related to water damage – and indirect expenses – related to production loss – due to the tragedy. These are values that the Brazilian government still needs to tally, but expectations are for astronomical costs. According to Malabarba et al. (2024), the estimated cost of the clean-up alone is approximately US$3.7 billion. Regarding the overall economic effect, the impact on economic activity due to flood damage is more significant than the affected area alone. Floods can disrupt various economic sectors, influencing overall GDP growth and contributing to inflation increases. The widespread negative economic impact of floods can persist in the long term, leading to severe social consequences across the population. This tragedy has completely disrupted the state's economy and significantly impacted the entire Brazilian economy. The Figure 6 illustrates the flood impact areas in Rio Grande do Sul superimposed onto various international territories. This comparative visualization provides a global perspective on the magnitude of the catastrophe, highlighting the extensive reach and severity of the flooding beyond a local context.
Figure 5. The timeline of events during the 2024 climate tragedy in Rio Grande do Sul (Rio Grande do Sul 2024a).
Preprints 110060 g005
Figure 6. Georeferenced comparative schematic illustration of the flood spot superimposed in different regions of the world, created using QGIS software version 3.10.13.
Preprints 110060 g006

4. The Post Tragedy

4.1. Assessing Short- and Long-Term Tragedy Effects

It is challenging to assess the consequences of the climate tragedy experienced by the state of Rio Grande do Sul, given its short- and long-term negative impacts, which significantly affect various sectors including the economy, urban infrastructure, the local environment, and public health. Nonetheless, some specific examples can be readily cited.
The public health implications are profound, with the loss of lives being a paramount concern. As of June 21, 2024, 177 deaths had been recorded, and over 2.4 million people had been affected by the flood. Additionally, the emergence of various diseases poses a pressing issue. These diseases may manifest in distinct phases or waves, starting with those that can be rapidly diagnosed, followed by those with longer incubation periods, and finally, psychosomatic conditions may emerge (Kouadio et al. 2014; Vardoulakis et al. 2022).
In the first instance, contaminated water poses a persistent risk of various infectious diseases, including severe gastroenteritis and diarrhea, skin infections, hepatitis A, and cholera. Diarrheal diseases are a significant cause of mortality and morbidity following water-related disasters, with young children and the elderly being the most vulnerable to these intestinal infections (Kouadio et al. 2014; Vardoulakis et al. 2022).
As we are in the respiratory disease season, infections such as flu, COVID-19 and pneumonia are threats to health, especially for those in shelters, where crowding facilitates the transmission of these pathogens. Additionally, these makeshift housing conditions, characterized by poor hygiene and limited access to clean, potable water, create an environment conducive to the spread of parasites, such as those causing scabies and pediculosis.
Subsequently, diseases such as leptospirosis and arboviruses become primary concerns. According to the local health authority's report as of June 21, 2024, 20 deaths related to leptospirosis have been confirmed. Out of 5,501 suspected cases of leptospirosis, 363 have been confirmed. Arboviruses, particularly dengue fever, remain under close surveillance by local health authorities (Secretaria de Saúde 2024).
The Mariana dam disaster that occurred in 2015 in another Brazilian state, which affected 36 municipalities with residual sludge over a distance of 663 km, serves as an interesting reference, even though it impacted a much smaller number of people compared to the Rio Grande do Sul flood disaster. Investigations conducted in Barra Longa, a neighboring municipality to Mariana that was almost entirely affected, revealed the multiplicity of health effects on the impacted population, including the emergence of different diseases and the worsening of preexisting health conditions. Between the date of the disaster and up to eight months afterward, the local health system reported an 8 to 48-fold increase in cases of dermatitis, parasitic diseases, diarrhea and gastroenteritis, systemic arterial hypertension, upper respiratory tract infections, and dengue (de Freitas et al. 2019).
A spatiotemporal analysis from Santa Catarina, a neighboring state of Rio Grande do Sul, showed a significant increase in leptospirosis incidence following flooding and landslide events in different municipalities. In last years, Santa Catarina's history has also been marked by the increasingly frequent need to confront extreme weather events (Silva et al. 2020).
Encantado, a municipality located in Rio Grande do Sul, exposes an important local example of the relationship between flooded areas and waterborne diseases. In 2013, 44 cases of Hepatitis A were recorded in the three months following a flooding event. Representing an increase of almost 300% in total cases, the authors also observed that the cases coincide with the urban areas prone to flooding in the municipality (Silveira et al. 2021). Given the historical context provided, it is plausible to predict that cases of hepatitis A related to the current floods may still arise.
It is also important to highlight that the emergency scenario caused by this climate tragedy, combined with a lack of qualified professionals to face the health crisis and the overload of the local health system can significantly increase the misuse of medications. Floods often disrupt access to healthcare, leading individuals to self-medicate with available antibiotics, which may not be appropriate for their conditions. The increased incidence of infections due to water contamination and exposure to sewage and debris can also drive excessive antibiotic use. This often occurs even when antibiotics are unnecessary or ineffective, such as for viral infections, due to widespread and inappropriate prescription practices. Additionally, overwhelmed healthcare systems and disrupted public health services may struggle to enforce rational and organized distribution of medication. Together, these factors can thereby contribute to the future rise of antimicrobial resistance.
Transcending the challenges of disease emergence, post-traumatic stress disorder, anxiety, and depression are among the long-term psychosomatic consequences caused by extreme climate catastrophes. The diminished well-being and reduced mental health resulting from prolonged stress and trauma further exacerbate the toll of the tragedy on affected population and posing yet another significant obstacle for the local health system to address (Chen et al. 2020).
Economically, the repercussions are dire, affecting key indicators such as gross domestic product (GDP), inflation, unemployment rate, and public finances. Infrastructure damage and agricultural losses not only impact livelihoods but also strain government resources for recovery efforts.
Rio Grande do Sul is the largest producer of rice and corn in the country and the 4º largest producer of soybeans. Between the years 2020 and 2022, the state recorded an average production of 7.9, 3.3, and 13.7 million tons of these grains, respectively. According to the report published by the Secretariat of Rural Development in May 2024, following the tragedy occurrence, 4,548 communities faced problems with the distribution of production, and constructions and facilities (households, sheds, warehouses, greenhouses, and others) of 19,190 rural producers were affected. Regarding soybeans, it is estimated that the area affected by the catastrophe is 1,490,505 hectares and production losses amount to 2,714,151 tons. As for rice, 90% had already been harvested, but it is still estimated that 22,952 hectares are completely lost, mainly in the central region of the state, and that 43 thousand tons of rice have been affected. For corn, production losses are estimated at 354 thousand tons. Furthermore, substantial soil losses resulting from landslides and floods, as well as leaching and erosion, have compromised the chemical, physical, and biological structure of the soil. This could have negative implications for future harvests (Secretaria de Desenvolvimento Rural 2024).
It can be considered that the losses resulting from this climate catastrophe, mainly with regard to the agricultural sector, have not yet been fully measured. Nonetheless, due to the state's significance in the Brazilian economy, a potential impact on the Brazilian GDP of around 0.2 to 0.3 percentage points is expected (Bradesco 2024).
For comparative purposes, we can recall the historic flooding event that struck the state of Santa Catarina in 2008, a neighboring state to Rio Grande do Sul. Lima and Barbosa (2018), using a difference-in-differences model, estimated that municipalities directly affected by the flood suffered a 7.6% decrease in GDP per capita in the year of the disaster, taking three years for the recovery to pre-disaster levels. The authors also demonstrated that the agricultural sector experienced a decrease of about 19.2% in the first year after the shock and a statistically significant decrease of about 9.5% three years after the flood.
The long-term effects on GDP growth, coupled with rising inflation and unemployment rates, pose significant challenges to the region's economic stability. Moreover, the strain on public finances further complicates the recovery process, underscoring the need for comprehensive strategies to address the multifaceted economic impact of the tragedy. For comparison purposes, considering data from 2006 Stern Review, that estimate of the annual cost of unmitigated climate change as 5% of GDP, one could conservatively estimate an annual cost for Rio Grande do Sul of US$ 6.40 billion, considering the annual GDP value of 2023 (Stern et al. 2006).
Finally, the loss of biodiversity can reverberate for decades, due to extensive disruption of the local ecosystem, since the altered landscape, scarred by soil erosion, landslides, and flooding, serves as a lasting reminder of nature's fury, reshaping the region's geography and limiting land use possibilities. Therefore, post-tragedy urban planning must be intelligent and cannot follow past models. It should include essential focal points such as ecological restoration actions for affected watersheds and efficient flood control measures with containment and drainage structures, prioritizing urban resilience and climate adaptation.

4.2. Rethinking Flood Control Measures in the Face of Climate Change

In recent decades, floods have emerged as a predominant threat in regions experiencing extreme rainfall events. Since 1990, a staggering 4,713 flood disasters have been documented across 168 countries, impacting approximately 3.2 billion people and resulting in damages valued at an astounding US$ 1.3 trillion (Liu et al. 2024). The evolution of cities, coupled with the expansion of impermeable land cover, has overwhelmed the capacity of urban water infrastructure systems, such as stormwater management and control. These systems, designed to accommodate specific levels of service, often struggle to cope with the frequency and intensity of extreme precipitation events. Different flood management approaches should be employed to ensure both life safety and economic stability.
According to climate projections, if human emissions are not controlled, the southern region of Brazil is expected to experience an increase in average temperatures ranging from approximately 3˚C to 4˚C. Moreover, the majority of models outlined in the IPCC sixth Special Report anticipate a rise in precipitation levels under these warmer conditions (IPCC, 2021). Generally, it is likely that there will be an increase in the occurrence and intensity of these precipitation events—a rise that has already begun to be observed in recent studies for Rio Grande do Sul (Sausen 2011; Caldeira et al. 2015; Cera and Ferraz 2015; Teixeira and Prietto 2020; Silva et al. 2023).
In this context, few studies have specifically evaluated future extreme precipitation patterns for Brazil. The study by Cortez et al. (2022) indicated that daily extreme precipitation is expected to increase in at least 90% of the Brazilian territory. Chou et al. (2014) reported an increase in total precipitation based on the increase in heavy precipitation for the southern region of Brazil. Moreover, a recent study by Silva et al. (2023) investigated this scenario for Porto Alegre, suggesting that climate change effects (in the form of the RCPs) have great potential for altering the patterns of intense precipitation in this city. The assessments have revealed a shifting trend in extreme precipitation events, with significant implications for urban infrastructure and flood risk management. Projections for Porto Alegre indicate a worsening of extreme precipitation events, particularly concerning short-duration rainfall events. For instance, projections show that rainfall intensity could vary from 175 mm/h in 2020 to about 325 mm/h in 2099, representing an increase of 86% over 80 years.
This increase in extreme rainfall events poses significant challenges to urban drainage systems, particularly in areas with limited capacity for rapid water runoff. The findings of Silva et al. (2023) extend beyond the immediate threat to infrastructure, revealing a troubling future for flood management. Return periods for extreme events are projected to decrease dramatically by the end of the century, raising concerns about the adequacy of current urban drainage systems. Specifically, the reduction in return periods from 100 to 46 years for 100-year events and a five-fold decrease for 10-year events indicates a heightened vulnerability to flooding in Porto Alegre, and consequently the entire metropolitan region. Furthermore, as previously noted, the episodes of floods and near-floods in the metropolitan region of Porto Alegre have intensified in recent years. In 2023 alone, there were two instances where the waters of Lake Guaíba surpassed the flood threshold (Azevedo-Santos et al. 2023). Although these events did not cause significant damage to the region, they served as a warning for the catastrophic flooding that occurred in 2024 and may be a significant indicator of future risks.
Given the lack of detailed projections for other regions in Rio Grande do Sul, if these climate projections hold true for Porto Alegre, it is reasonable to infer that similar impacts may be expected in other parts of the state. These regions, which were also affected by the recent climate tragedy, are likely to face similar challenges. Therefore, it is crucial to extend the understanding that the failure rate of urban drainage systems is expected to increase significantly over time in these cities as well, necessitating proactive measures to mitigate future risks.
In general, and without subtlety, it is necessary for all cities impacted by this climate tragedy to rethink their flood control measures. While the population of cities near the rivers in the affected basins remains vigilant due to existing flood warning systems, additional measures should be implemented to relocate current residents and prevent new urban settlements near these rivers. Meanwhile, cities affected by the rising levels of Lake Guaíba or the Lagoa dos Patos will need to adopt mitigation measures, such as constructing additional levees, improving urban drainage systems, and creating temporary water retention areas.
Furthermore, the metropolitan region of Porto Alegre is particularly concerning in this scenario, both because it is the most densely populated area of the state and due to its high-risk hydrographic location (Miranda 2016; Rezende et al. 2019; Altafini et al. 2023). It is notable that almost all the land reclaimed in Porto Alegre through human actions during the 18th, 19th, and 20th centuries was flooded (Altafini et al. 2023), effectively allowing Lake Guaíba to reclaim its original territory. This demonstrates the power of nature and highlights high-risk flood areas in this region.
Given the escalating frequency and intensity of precipitation events, alternative measures are imperative to enhance resilience and mitigate the impact of future floods. It is crucial to expand and improve the Urban Drainage Master Plan for Porto Alegre to include the most affected cities in the metropolitan region, ensuring the proper maintenance of these systems. In the coming years, based on current scenarios, these systems will be continuously tested. Measures such as implementing green infrastructure, creating retention basins, and modernizing warning and evacuation systems are essential to prepare the region for increasingly intense future climatic events.

5. Authors Considerations

The time to act is now! With the increasing intensity and frequency of extreme events, the truth is clear: we are living in extreme times. Multiple factors have contributed to the humanitarian and environmental crisis in Rio Grande do Sul, Brazil. All are relevant and deserve careful consideration due to their complexity and interconnectedness. However, a major factor is the failure of the government to prioritize and implement risk mitigation projects and disaster prevention measures. These initiatives have been neglected for years across all levels of government, resulting in inadequate management of prevention systems, leading to their failure when they were most needed. In recent years, environmental legislation has been dismantled, reducing Brazil’s resilience to extreme climatic events. This lack of prioritization is evident across all political ideologies, highlighting a systemic issue in Brazil’s national political thinking. Additionally, there are still politicians and public administrators who doubt climate change and adopt a denialist stance in their decision-making processes. Ultimately, this combination of actions plays a pivotal role in shaping the final consequences of these events.
However, this is not a disaster of Brazil’s own making. The whole planet is experiencing increasingly rapid climate changes due largely to the greenhouse gases produced by a handful of wealthy nations. In just the recent weeks of 2024, several countries across different continents have faced disastrous consequences. Almost simultaneously, with this extreme rainfall event devastating southern Brazil, Africa has dealt with heavy rains and dam breaches in Kenya, a highway slid down a mountainside in southern China and airport runways were submerged in the Dubai desert (World Meteorological Organization 2024). Meanwhile, Italy and Germany in Europe are suffering from similar episodes of extreme precipitation and floods (The New York Times 2024). Unfortunately, the time for warnings has passed; today, the world is already living with the consequences of climate change and the terrible impacts caused by these extreme weather events. More than ever, the time to act is now, and the urgency for immediate changes is undeniable.
In this context, it is important to highlight that the impacts of climate change disproportionately affect the most vulnerable populations. Vulnerable communities often lack the resources, infrastructure, and social safety nets necessary to effectively respond to and recover from extreme weather events. The disproportionate burden on this populations is evident in several ways. Firstly, these communities often live in high-risk areas and poorly constructed housing that are more susceptible to damage from extreme weather events. Secondly, they have limited access to early warning systems, emergency services, and financial resources required for evacuation, recovery, and rebuilding. Consequently, they endure greater losses in terms of property and even lives. This suffering population, who often struggles their entire lives for what little they have achieved, ends up seeing their accomplishments, efforts, and dreams washed away. It's of paramount importance that all of this compels us to urgently seek adaptation solutions.
The implementation of circular economy so that to tackle greenhouse gas emissions reduction should be a drive in Brazilian’s policies towards on floods prevention as well as other climate change impacts. Government incentives aiming this measure such as taxes reduction, subsidies and tradeable emission rights could be employed, also representing an opportunity to develop science applied to green industry and cleaner energy production. Furthermore, Brazil can draw inspiration from successful climate adaptation measures employed in cities like Amsterdam and Rotterdam. Amsterdam has developed a rainproof city model that absorbs and captures rainwater, significantly reducing the risk of flooding and associated damages (Willems et al. 2023). Rotterdam has created multifunctional water plazas that double as recreational areas and flood control basins, and has invested in robust infrastructure to manage excess water effectively (Hölscher et al. 2020). These examples demonstrate how innovative water management can enhance resilience to climate change.
While rivers cut across bureaucratic borders, Brazil similarly requires integrated responses now. Science has long warned that Brazil faces high risks of extreme precipitation and droughts. Government authorities are also well aware of the solutions. Action is needed to demonstrate that we have learned from our mistakes and are not doomed to repeat our past. While it may be disheartening to only implement changes after enduring immeasurable tragedies, it is far more disheartening to ignore impending issues and refuse to change. If the extreme precipitation events continue to intensify, it may no longer seem like 40 days and 40 nights of rain is a biblical passage but rather a possible future reality. If nothing is done to mitigate the impacts of climate change, and we continue to see the global climate situation deteriorate, the question remains: is it time to build an ark?

Funding

This research was funded by Grant Numbers 2023/04466-6, 2024/02476-7, and 2024/02579-0 from the Fundação de Amparo à Pesquisa do Estado de São Paulo (FAPESP).

Ethics approval and consent to participate

Not applicable.

Data availability

Not applicable.

Competing interests

The authors declare no competing interests.

References

  1. Aboagye, P. D., & Sharifi, A. (2024). Urban climate adaptation and mitigation action plans: A critical review. Renewable and Sustainable Energy Reviews, 189, 113886. [CrossRef]
  2. Allasia, D. G., Tassi, R., Bemfica, D., & Goldenfum, J. A. (2015). Decreasing flood risk perception in Porto Alegre–Brazil and its influence on water resource management decisions. Proceedings of the International Association of Hydrological Sciences, 370(370), 189-192. [CrossRef]
  3. Altafini, D., da Costa Braga, A., & Ugalde, C. (2023). Mapping Urban Flood-Prone Areas’ Spatial Structure and Their Tendencies of Change: A Network Study for Brazil’s Porto Alegre Metropolitan Region. Cartographica: The International Journal for Geographic Information and Geovisualization, 58(4), 205-226. [CrossRef]
  4. Ardaya, A. B., Evers, M., & Ribbe, L. (2017). What influences disaster risk perception? Intervention measures, flood and landslide risk perception of the population living in flood risk areas in Rio de Janeiro state, Brazil. International journal of disaster risk reduction, 25, 227-237.
  5. Azevedo-Santos, V. M., Daga, V. S., Tonella, L. H., Ruaro, R., Arcifa, M. S., Fearnside, P. M., & Giarrizzo, T. (2023). Brazil undermines flood resilience. Science, 382(6669), 383-383. [CrossRef]
  6. Bradesco. Destaque Depec-Bradesco (2024). Desastre Climático no Rio Grande do Sul: Uma avaliação preliminar dos impactos econômicos. Destaque Depec-Bradesco. Departamento de Pesquisas e Estudos Econômicos https://www.economiaemdia.com.br/economiaemdia/html/publicacoes/destaque-depec.html Accessed 28 May 2024.
  7. CIRA. Cooperative Institute for Research in the Atmosphere (2024) RAMMB Slider. CIRA website. https://rammb-slider.cira.colostate.edu. Accessed 28 May 2024.
  8. Bakhtsiyarava, M., Schinasi, L. H., Sánchez, B. N., Dronova, I., Kephart, J. L., Ju, Y.,... & Rodríguez, D. A. (2023). Modification of temperature-related human mortality by area-level socioeconomic and demographic characteristics in Latin American cities. Social Science & Medicine, 317, 115526. [CrossRef]
  9. Beck HE, Zimmermann NE, McVicar TR, Vergopolan N, Berg A, Wood EF (2018) Present and future Köppen-Geiger climate classification maps at 1-km resolution. Scientific data, 5(1), 1-12. [CrossRef]
  10. Berlato, M. A., & Cordeiro, A. P. A. (2018). Sinais de mudanças climáticas globais e regionais, projeções para o século XXI e as tendências observadas no Rio Grande do Sul: uma revisão. Agrometeoros, 25(2). http://doi.org/10.31062/agrom.v25i2.25884.
  11. Brasil (2024). Atlas Digital de Desastres no Brasil. Ministério da Integração e do Desenvolvimento Regional, Governo Federal do Brasil. https://atlasdigital.mdr.gov.br/ Accessed 07 June 2024.
  12. Caldeira, T. L., Beskow, S., Mello, C. R. D., Faria, L. C., Souza, M. R. D., & Guedes, H. A. (2015). Modelagem probabilística de eventos de precipitação extrema no estado do Rio Grande do Sul. Revista Brasileira de Engenharia Agrícola e Ambiental, 19, 197-203. [CrossRef]
  13. Campos, C. R. J. D., & Eichholz, C. W. (2011). Características físicas dos Sistemas Convectivos de Mesoescala que afetaram o Rio Grande do Sul no período de 2004 a 2008. Revista Brasileira de Geofísica, 29, 331-345. [CrossRef]
  14. Cera, J. C., & Ferraz, S. E. T. (2015). Variações climáticas na precipitação no sul do Brasil no clima presente e futuro. Revista Brasileira de Meteorologia, 30, 81-88. [CrossRef]
  15. Chen, S., Bagrodia, R., Pfeffer, C. C., Meli, L., & Bonanno, G. A. (2020). Anxiety and resilience in the face of natural disasters associated with climate change: A review and methodological critique. Journal of Anxiety Disorders, 76, 102297. [CrossRef]
  16. Chou, S. C., Lyra, A., Mourão, C., Dereczynski, C., Pilotto, I., Gomes, J.,... & Marengo, J. (2014). Assessment of climate change over South America under RCP 4.5 and 8.5 downscaling scenarios. American Journal of Climate Change, 3(05), 512. [CrossRef]
  17. Cortez, B. N., Pires, G. F., Avila-Diaz, A., Fonseca, H. P., & Oliveira, L. R. (2022). Nonstationary extreme precipitation in Brazil. Hydrological Sciences Journal, 67(9), 1372-1383. [CrossRef]
  18. Deng, S. Z., Jalaludin, B. B., Antó, J. M., Hess, J. J., & Huang, C. R. (2020). Climate change, air pollution, and allergic respiratory diseases: a call to action for health professionals. Chinese medical journal, 133(13), 1552-1560. DOI: 10.1097/CM9.0000000000000861.
  19. de Andrade Lima, R. C., & Barbosa, A. V. B. (2019). Natural disasters, economic growth and spatial spillovers: Evidence from a flash flood in Brazil. Papers in Regional Science, 98(2), 905-925. [CrossRef]
  20. de Oliveira, L. F., Fioreze, A. P., Medeiros, A. M., & Silva, M. A. (2010). Comparação de metodologias de preenchimento de falhas de séries históricas de precipitação pluvial anual. Revista Brasileira de Engenharia Agrícola e Ambiental, 14, 1186-1192. [CrossRef]
  21. Freitas, C. M. D., Barcellos, C., Asmus, C. I. R. F., Silva, M. A. D., & Xavier, D. R. (2019). Da Samarco em Mariana à Vale em Brumadinho: desastres em barragens de mineração e Saúde Coletiva. Cadernos de Saúde Pública, 35, e00052519. [CrossRef]
  22. Geirinhas, J. L., Russo, A., Libonati, R., Sousa, P. M., Miralles, D. G., & Trigo, R. M. (2021). Recent increasing frequency of compound summer drought and heatwaves in Southeast Brazil. Environmental Research Letters, 16(3), 034036. DOI: 10.1088/1748-9326/abe0eb.
  23. Guedes, H. A. S., Priebe, P. D. S., & Manke, E. B. (2019). Tendências em séries temporais de precipitação no Norte do Estado do Rio Grande do Sul, Brasil. Revista Brasileira de Meteorologia, 34, 283-291. [CrossRef]
  24. Hölscher, K., Frantzeskaki, N., & Loorbach, D. (2020). Transforming Urban Water Governance in Rotterdam, the Netherlands. Transformative Climate Governance: A Capacities Perspective to Systematise, Evaluate and Guide Climate Action, 163-204. [CrossRef]
  25. IBGE. Instituto Brasileiro de Geografia e Estatística (2022a) Cidades e Estados. https://www.ibge.gov.br/cidades-e-estados/rs.html. Accessed 28 May 2024.
  26. IBGE. Instituto Brasileiro de Geografia e Estatística (2022a) Cidades e Estados. https://www.ibge.gov.br/cidades-e-estados/rs/porto-alegre.html. Accessed 28 May 2024.
  27. IPCC. Intergovernmental Panel on Climate Change. (2021) Climate Change 2021: The Physical Science Basis. Contribution of Working Group I to the Sixth Assessment Report of the Intergovernmental Panel on Climate Change [Masson-Delmotte, V., P. Zhai, A. Pirani, S.L. Connors, C. Péan, S. Berger, N. Caud, Y. Chen, L. Goldfarb, M.I. Gomis, M. Huang, K. Leitzell, E. Lonnoy, J.B.R. Matthews, T.K. Maycock, T. Waterfield, O. Yelekçi, R. Yu, and B. Zhou (eds.)]. Cambridge University Press, Cambridge, United Kingdom and New York, NY, USA. [CrossRef]
  28. IPCC. Intergovernmental Panel on Climate Change (2023). IPCC SYNTHESIS REPORT OF THE IPCC SIXTH ASSESSMENT REPORT (AR6). LONGER REPORT. Intergovernmental Panel on Climate Change. https://www.ipcc.ch/report/sixth-assessment-report-cycle/.
  29. Kouadio, I. K., Aljunid, S., Kamigaki, T., Hammad, K., & Oshitani, H. (2012). Infectious diseases following natural disasters: prevention and control measures. Expert review of anti-infective therapy, 10(1), 95-104. [CrossRef]
  30. Liu, Q., Du, M., Wang, Y., Deng, J., Yan, W., Qin, C.,... & Liu, J. (2024). Global, regional and national trends and impacts of natural floods, 1990-2022. Bulletin of the World Health Organization, 102(6), 410-420. [CrossRef]
  31. Malabarba, L. R., Becker, F. G., Pereira, M. J. R., & Borges-Martins, M. (2024). Mega engineering projects won't stop a repeat of the devastating southern Brazil floods. Nature, 630(8015), 35. https://doi-org.ez40.periodicos.capes.gov.br/10.1038/d41586-024-01665-6.
  32. Masson-Delmotte, V., Zhai, P., Pörtner, H. O., Roberts, D., Skea, J., & Shukla, P. R. (2022). Global Warming of 1.5 C: IPCC special report on impacts of global warming of 1.5 C above pre-industrial levels in context of strengthening response to climate change, sustainable development, and efforts to eradicate poverty. Cambridge University Press. [CrossRef]
  33. Matzenauer, R., Radin, B., & Maluf, J. R. T. (2018). O fenômeno ENOS e o regime de chuvas no Rio Grande do Sul. Agrometeoros, 25(2). http://dx.doi.org/10.31062/agrom.v25i2.25510.
  34. Melo, T. M. D., Louzada, J. A. S., & Pedrollo, O. C. (2015). Trends in extreme indices and seasonal analysis of precipitation and temperature in the northwest region of Rio Grande do Sul, Brazil. American Journal of Climate Change. Delaware: Scientific Research Publishing. Vol. 4 (2015), p. 187-202. http://doi.org/10.4236/ajcc.2015.43015.
  35. MetSul (2024) Meteorologista Estael Sias E A Chuva: “A Hora Mais Dramática”. MetSul Meteorological Agency. https://metsul.com/meteorologista-estael-sias-e-a-chuva-a-hora-mais-dramatica/. Accessed 28 May 2024.
  36. Mitra, S., & Srivastava, P. (2017). Spatiotemporal variability of meteorological droughts in southeastern USA. Natural Hazards, 86, 1007-1038. [CrossRef]
  37. Miranda, A. (2016). Floods and Extension Plans: discourse and projects in Southern Brazil. International Planning History Society Proceedings, 17(2). [CrossRef]
  38. Mukherjee, S., & Mishra, A. K. (2021). Cascading effect of meteorological forcing on extreme precipitation events: Role of atmospheric rivers in southeastern US. Journal of Hydrology, 601, 126641. [CrossRef]
  39. NOAA. National Oceanic and Atmospheric Administration (2024) GOES Image Viewer. National Ocean Service website. https://www.star.nesdis.noaa.gov/goes/sector.php. Accessed 28 May 2024.
  40. Possa, T. M., Collischonn, W., Jardim, P. F., & Fan, F. M. (2022). Hydrological-hydrodynamic simulation and analysis of the possible influence of the wind in the extraordinary flood of 1941 in Porto Alegre. RBRH, 27, e29. [CrossRef]
  41. Porto Alegre (2024) Características topográficas e cheias na Cidade. Departamento de Esgotos Pluviais. Prefeitura de Porto Alegre, Rio Grande do Sul. https://www2.portoalegre.rs.gov.br/dep/default.php?reg=1&p_secao=65# Accessed 28 May 2024.
  42. Rezende, O. M., Miranda, F. M., Haddad, A. N., & Miguez, M. G. (2019). A framework to evaluate urban flood resilience of design alternatives for flood defence considering future adverse scenarios. Water, 11(7), 1485. [CrossRef]
  43. Rio Grande do Sul (2024a) Boletins sobre o Impacto das Chuvas no RS. Governo do Estado do Rio Grande do Sul, Brasil. https://www.estado.rs.gov.br/boletins-sobre-o-impacto-das-chuvas-no-rs. Accessed 28 May 2024.
  44. Rio Grande do Sul (2024b) Dados Hidrológicos dos Rios Gravataí, Sinos, Caí, Taquari, Jacuí e Uruguai e do Lago Guaíba e da Lagoa dos Patos. Departamento de Recursos Hídricos e Saneamento da Secretaria Estadual de Meio Ambiente e Infraestrutura do Rio Grande do Sul (DRHS/SEMA). Governo do Estado do Rio Grande do Sul, Brasil. https://linktr.ee/niveisguaiba2024. Accessed 28 May 2024.
  45. Rio Grande do Sul (2024c) Governador decreta estado de calamidade pública por conta das cheias no RS. Governo do Estado do Rio Grande do Sul, Brasil. https://www.estado.rs.gov.br/governador-decreta-estado-de-calamidade-publica-por-conta-das-cheias-no-rs. Accessed 28 May 2024.
  46. Rodrigues, A. A., Siqueira, T. M., Beskow, T. L. C., Beskow, S., & Nunes, A. B. (2023). Tendência e variabilidade da chuva no Rio Grande do Sul, Brasil. Revista Brasileira de Climatologia, 32, 177-207. [CrossRef]
  47. Sausen, T. M., da Costa Marchiori, L. L. A., Batista, M. H., & Faccin, A. (2018). Mapeamento de desastres naturais no Rio Grande do Sul para o período de 1985-2016. Revista Gestão & Sustentabilidade Ambiental, 7, 268-302. [CrossRef]
  48. Secretaria de Desenvolvimento Rural (2024). Boletim Evento Adverso nº01. IMPACTOS DAS CHUVAS E CHEIAS EXTREMAS NO RIO GRANDE DO SUL EM MAIO DE 2024. Governo Do Estado do Rio Grande do Sul. Secretaria de Desenvolvimento Rural (SDR). https://www.sdr.rs.gov.br/publicacoes Accessed 28 May 2024.
  49. Secretaria de Saúde (2024). Secretaria de Saúde Secretaria de Saúde. Governo do Rio Grande do Sul https://sosenchentes.rs.gov.br/inicial Accessed 28 May 2024.
  50. Seneviratne, S.I., X. Zhang, M. Adnan, W. Badi, C. Dereczynski, A. Di Luca, S. Ghosh, I. Iskandar, J. Kossin, S. Lewis, F. Otto, I. Pinto, M. Satoh, S.M. Vicente-Serrano, M. Wehner, and B. Zhou, 2021: Weather and Climate Extreme Events in a Changing Climate. In Climate Change 2021: The Physical Science Basis. Contribution of Working Group I to the Sixth Assessment Report of the Intergovernmental Panel on Climate Change [Masson-Delmotte, V., P. Zhai, A. Pirani, S.L. Connors, C. Péan, S. Berger, N. Caud, Y. Chen, L. Goldfarb, M.I. Gomis, M. Huang, K. Leitzell, E. Lonnoy, J.B.R. Matthews, T.K. Maycock, T. Waterfield, O. Yelekçi, R. Yu, and B. Zhou (eds.)]. Cambridge University Press, Cambridge, United Kingdom and New York, NY, USA, pp. 1513–1766. [CrossRef]
  51. Silva, A. E. P., Neto, F. C., & de Souza Conceição, G. M. (2020). Leptospirosis and its spatial and temporal relations with natural disasters in six municipalities of Santa Catarina, Brazil, from 2000 to 2016. Geospatial Health, 15(2). [CrossRef]
  52. Silveira, P. O., Guasselli, L. A., Oliveira, G. G. D., & Nascimento, V. F. (2021). Relação entre casos de hepatite A e áreas de inundação, município de Encantado, Rio Grande do Sul, Brasil. Ciência & Saúde Coletiva, 26, 721-728. DOI: 10.1590/1413-81232020261.30592018.
  53. Stern, N. (2006). Stern Review: The economics of climate change. [CrossRef]
  54. Stott P (2016) How climate change affects extreme weather events. Science, 352(6293), 1517-1518. [CrossRef]
  55. Sultana, F. (2022). Critical climate justice. The Geographical Journal, 188(1), 118-124. [CrossRef]
  56. Teixeira, M. D. S., & Prieto, R. B. (2020). Eventos extremos de chuva no Estado do Rio Grande do Sul, Brasil, entre 2004 e 2013. Parte 1: Definição dos eventos e estatísticas. Revista Brasileira de Meteorologia, 35, 45-52. [CrossRef]
  57. The New York Times (2024) Floods Break Dams and Submerge Highways in Southern Germany. https://www.nytimes.com/2024/06/03/world/europe/germany-floods.html Accessed 03 June 2024.
  58. Vardoulakis, S., Matthews, V., Bailie, R. S., Hu, W., Salvador-Carulla, L., Barratt, A. L., & Chu, C. (2022). Building resilience to Australian flood disasters in the face of climate change. The Medical Journal of Australia, 217(7), 342. [CrossRef]
  59. Willems, J. J., van Popering-Verkerk, J., & van Eck, L. (2023). How boundary objects facilitate local climate adaptation networks: the cases of Amsterdam Rainproof and Water Sensitive Rotterdam. Journal of Environmental Planning and Management, 66(7), 1513-1532. [CrossRef]
  60. WMO. World Meteorological Organization (2024) Widespread parts of Asia and Africa reel under extreme weather. https://wmo.int/media/news/widespread-parts-of-asia-and-africa-reel-under-extreme-weather Accessed 28 May 2024.
Table 1. Brazilian states most affected by disasters (2012-2023), ranked by financial losses, according to data from the Digital Atlas of Disasters in Brazil (Brasil, 2024).
State - Abbreviation Occurrences Deaths Displaced (Thousands) Total affected (Thousands) Total damages (US$ - Millions) Losses (US$ - Millions)
Rio Grande do Sul – RS 4398 96 550.5 18602.9 1280.8 18849.1
Minas Gerais – MG 4759 312 454.9 18268.0 1561.2 8069.3
Santa Catarina – SC 4628 116 465.8 13323.6 1308.7 7238.0
Paraná – PR 1266 34 133.3 3193.8 663.4 6199.4
Bahia – BA 3265 138 409.9 31386.2 721.8 5923.0
Pernambuco – PE 1861 159 286.7 17623.9 534.1 4783.5
Ceará – CE 1582 11 14.7 14986.3 88.0 4213.3
Paraíba – PB 2293 0 36.8 10859.5 125.2 3779.4
Espírito Santo – ES 1142 51 127.4 6151.3 358.6 3363.8
São Paulo – SP 930 293 171.0 5404.1 922.1 3279.0
Mato Grosso – MT 1399 14 11.6 5011.7 286.5 3187.9
Matro Grosso do Sul – MS 1605 40 14.7 1900.8 136.1 2661.7
Alagoas – AL 713 17 242.9 6191.5 2378.5 2015.5
Sergipe – SE 406 4 15.5 1872.3 16.6 1352.4
Rio Grande do Norte – RN 1755 11 17.8 6939.7 4.3 1320.6
Piauí – PI 1460 9 48.8 3595.0 36.5 1257.5
Amazonas – AM 746 121 1010.1 5052.8 596.4 865.0
Rio de Janeiro – RJ 981 494 260.9 5178.2 763.0 700.6
Pará – PA 1267 79 460.7 4533.3 666.0 646.6
Maranhão – MA 462 33 146.7 1927.4 296.5 384.4
Tocantins – TO 264 1 11.7 103.8 15.3 192.7
Acre – AC 150 8 128.8 2002.5 180.7 94.6
Goiás – GO 302 9 8.6 3493.0 95.5 73.6
Roraima – RR 76 4 2.1 192.0 6.0 58.5
Rondônia – RO 144 3 32.5 508.2 115.2 27.7
Distrito Federal – DF 12 24 0.042 2130.2 0.5 7.6
Amapá – AP 99 15 9.1 511.9 15.6 4.8
Total 37965 2096 5073.3 190943.9 13173.1 80549.8
Disclaimer/Publisher’s Note: The statements, opinions and data contained in all publications are solely those of the individual author(s) and contributor(s) and not of MDPI and/or the editor(s). MDPI and/or the editor(s) disclaim responsibility for any injury to people or property resulting from any ideas, methods, instructions or products referred to in the content.
Copyright: This open access article is published under a Creative Commons CC BY 4.0 license, which permit the free download, distribution, and reuse, provided that the author and preprint are cited in any reuse.
Prerpints.org logo

Preprints.org is a free preprint server supported by MDPI in Basel, Switzerland.

Subscribe

© 2024 MDPI (Basel, Switzerland) unless otherwise stated