Preprint
Article

Ionosonde Measurements Comparison during an ICME- and a SIR/CIR-Driven Geomagnetic Storm over Europe

Altmetrics

Downloads

157

Views

76

Comments

0

A peer-reviewed article of this preprint also exists.

Submitted:

24 June 2024

Posted:

25 June 2024

You are already at the latest version

Alerts
Abstract
The comparison of three types of ionosonde data from Europe during an Interplanetary Coronal Mass Ejection (ICME) and a Stream Interaction Regions (SIRs) / Corotating Interaction Regions (CIRs) -driven geomagnetic storm event is detailed in this study. The selected events are 16-20 March 2015 for the ICME-driven and 30 May to 04 June 2013 for the SIR/CIR-driven one. Ionospheric data from three European ionosonde stations, namely Pruhonice (PQ), Sopron (SO) and Rome (RO), are investigated. The ionospheric F2-layer responses to these geomagnetic events are analyzed with the ionospheric foF2 and h’F2 parameter, the calculated deltafoF2 and deltahF2 values, ratio of Total Electron Content (rTEC) and Thermosphere, Ionosphere, Mesosphere, Energetics and Dynamics (TIMED) satellite Global Ultraviolet Imager (GUVI) thermospheric [O]/[N2] measurement data. The storm-time and the quiet day mean values are also compared, and it can be concluded that the quiet day curves are similar at all stations while the storm-time ones showed the latitudinal dependence during the development of the storm. As a result of the electron density comparison, during the two events it can be concluded that SSC that characterized the ICME induced a Travelling Atmospheric Disturbance (TAD) seen in the European stations, while this is not in the SIR/CIR-driven ionospheric storm, which showed a stronger and more prolonged negative effect in all stations probably due to the season.
Keywords: 
Subject: Environmental and Earth Sciences  -   Space and Planetary Science

1. Introduction

Within the Earth’s plasma environment (ionosphere, plasmasphere, magnetosphere), all regions are closely connected. Due to external forcing, perturbations can be observed in the individual plasma layers. All physical effects that cause measurable changes in the solar wind (SW), the outer and inner magnetosphere, the ionosphere, and the thermosphere around the Earth are called space weather processes. The space weather events, like the Interplanetary Coronal Mass Ejections (ICME-induced events) and the Stream Interaction Regions (SIRs) / Corotating Interaction Regions (CIRs) that arrive at our Earth cause a so-called geomagnetic storm in the plasma environment of the planet. There were many studies, which dealt with the identification and geoeffectiveness of these two types of geomagnetic storms (see e.g. [1,2,3,4,5,6]).
The SIR/CIR-driven geomagnetic storms usually do not have a sudden storm commencement (SSC) phase, but the magnitude of the generated effects sometimes can be larger than the ICME caused ones (see [5,7]). This is the result of the fact that a SIR/CIR-storm has a longer duration, therefore can deposit roughly the same amount or even more energy into the upper atmosphere than most of the moderate ICME-storms do over the entire period of their course [8,9]. About these storm types, see the articles [4,6,10,11,12,13,14,15]. The intensity of these geomagnetic storms is typically only weak to moderate, which is connected to the highly oscillatory nature of the GSM magnetic field z component within CIRs [7].
The perturbations caused in the ionosphere during geomagnetic storms are called ionospheric storms, and their effects can be observed for 1-10 days. In terms of the variation with respect to a quiet day, we can define a positive (electron density increase) and a negative (electron density decrease) ionospheric storm. The general course of the midlatitude ionospheric F2-layer response to geomagnetic storms was described by Rishbeth et al. [16] and recently summarized by Prölss [17] (see also reviews and case studies of [18,19,20,21,22,23,24,25]). The ICME and SIR/CIR-induced geomagnetic storms have different time courses and result in different magnitudes of ionospheric perturbations. There are several processes that have to be considered during the examination of the mid- and low-latitude ionosphere, namely: photo-production, chemical loss and transport by thermal expansion, neutral winds, waves, tides and electric fields of internal and external origin [12]. The Earth’s plasma environment is a very complex, tightly coupled system, and the effects cannot be studied and explained in their entirety if we do not consider them as part of the system. In addition, several other influencing factors must be taken into consideration, such as: geomagnetic storm intensity, local time (LT) of the SSC and of the storm evolution, season, geomagnetic latitude and longitude, past history of geomagnetic activity, and the state of the Ionosphere-Thermosphere system ([12,13,26]).
The main aim of this study is to compare the ionospheric responses observed at the three European ionospheric stations considered and the different ionosonde instruments during the two geomagnetic storms associated with the two different solar sources: ICME and SIR/CIR event. Using also thermospheric [O]/[N2] and ratio of Total Electron Content (rTEC) difference data we describe the underlying mechanism during the course of the events.
Since the exact effect mechanisms are not yet known, case studies like this can provide new results. Deepening our knowledge in this research area is of high importance if we want to predict the impact of space weather events.
In Section 2, we describe the data used during the study. Then, in Section 3 (Results), we present the different measurement plots. After that, in Section 4 (Discussion), we compare the results with previous studies to provide a clear picture of the events.

2. Materials and Methods

2.1. Materials

To perform the study, we have selected an intense SIR/CIR- and ICME-induced event, where Dstmin < -100 nT. Three ionosonde station from Europe, namely Pruhonice (PQ), Sopron (SO) and Rome (RO) were used to examine also latitudinal differences during the course of the storms (Table 1). The ionosonde stations had different type of instruments during the examined events: PQ operates a DPS-4D type, SO had a polish (VISRC-2) type and RO operates both a DPS-4 and an Advanced Ionospheric Sounder (AIS-INGV) type of ionosonde. The AIS-INGV ionosonde was developed in the Laboratorio di Geofisica Ambientale at the Istituto Nazionale di Geofisica e Vulcanologia (INGV) and designed both for research and for routine monitoring ([27,28,29]). Both RO ionosondes provide real-time digital ionograms, along with automatically scaled parameters [30]. Manually scaled data, curated by an experienced operator, are also available for retrospective studies [31].
From the ionosonde measurements we used the foF2 (which describes the maximum electron density in the F2 layer), the h’F2 (virtual height of the F2 layer), the Maximum Usable Frequency (MUF) and isodensity data with 15/30 minute time resolution. The ionosonde data used in this study was fully manually scaled by the authors. The Digisonde instruments (DPS-4 and -4D type) use a built-in ARTIST-5 autoscaling tool, and with SAO Explorer interactive software we can produce from the measured ionogram parameters several products, like it can calculate MUF, hmF2, profilogram, contours etc. Isodensity data show the height variation of a given measured frequency. Note that for the data of AIS-INGV and of the VISRC-2 type of ionosonde we could not produce MUF and isodensity plots due to the fact, that the Artist software only for the data of DPS type of ionosondes.
The TIMED satellite’s GUVI instrument data used for this study give at the altitude range of 60-180 km the dayside [O]/[N2] and temperature profile as well as auroral energy input. The global map of measurements can be derived from 14.9 daily orbits (see more in [25,32,33])
To gain clearer insight into the evolution of the storms, we also utilized global maps of the ratio of Total Electron Content (rTEC). On these maps the difference between the observed TEC and the monthly averaged quiet TEC (normalized by the average TEC) are displayed. These maps are constructed by the National Institute of Information and Technology (NICT) using RINEX files.

2.2. Methods

Beside the above detailed data, we have computed the deltafoF2 = foF2 and the deltahF2 = ∆h’F2 values (in percentage). For this we used Equation 1 (given for deltafoF2), which is accepted and generally used also by other authors (e.g. [4,34,35]):
f o F 2 = f o F 2 s t o r m f o F 2 q u i e t f o F 2 q u i e t * 100 %
This equation for deltafoF2/deltahF2 gives the relative foF2/h’F2 parameter deviation from the mean value of three quiet day (the three quietest days of each month, see Table 2).

3. Results

3.1. Interplanetary and Geomagnetic Conditions

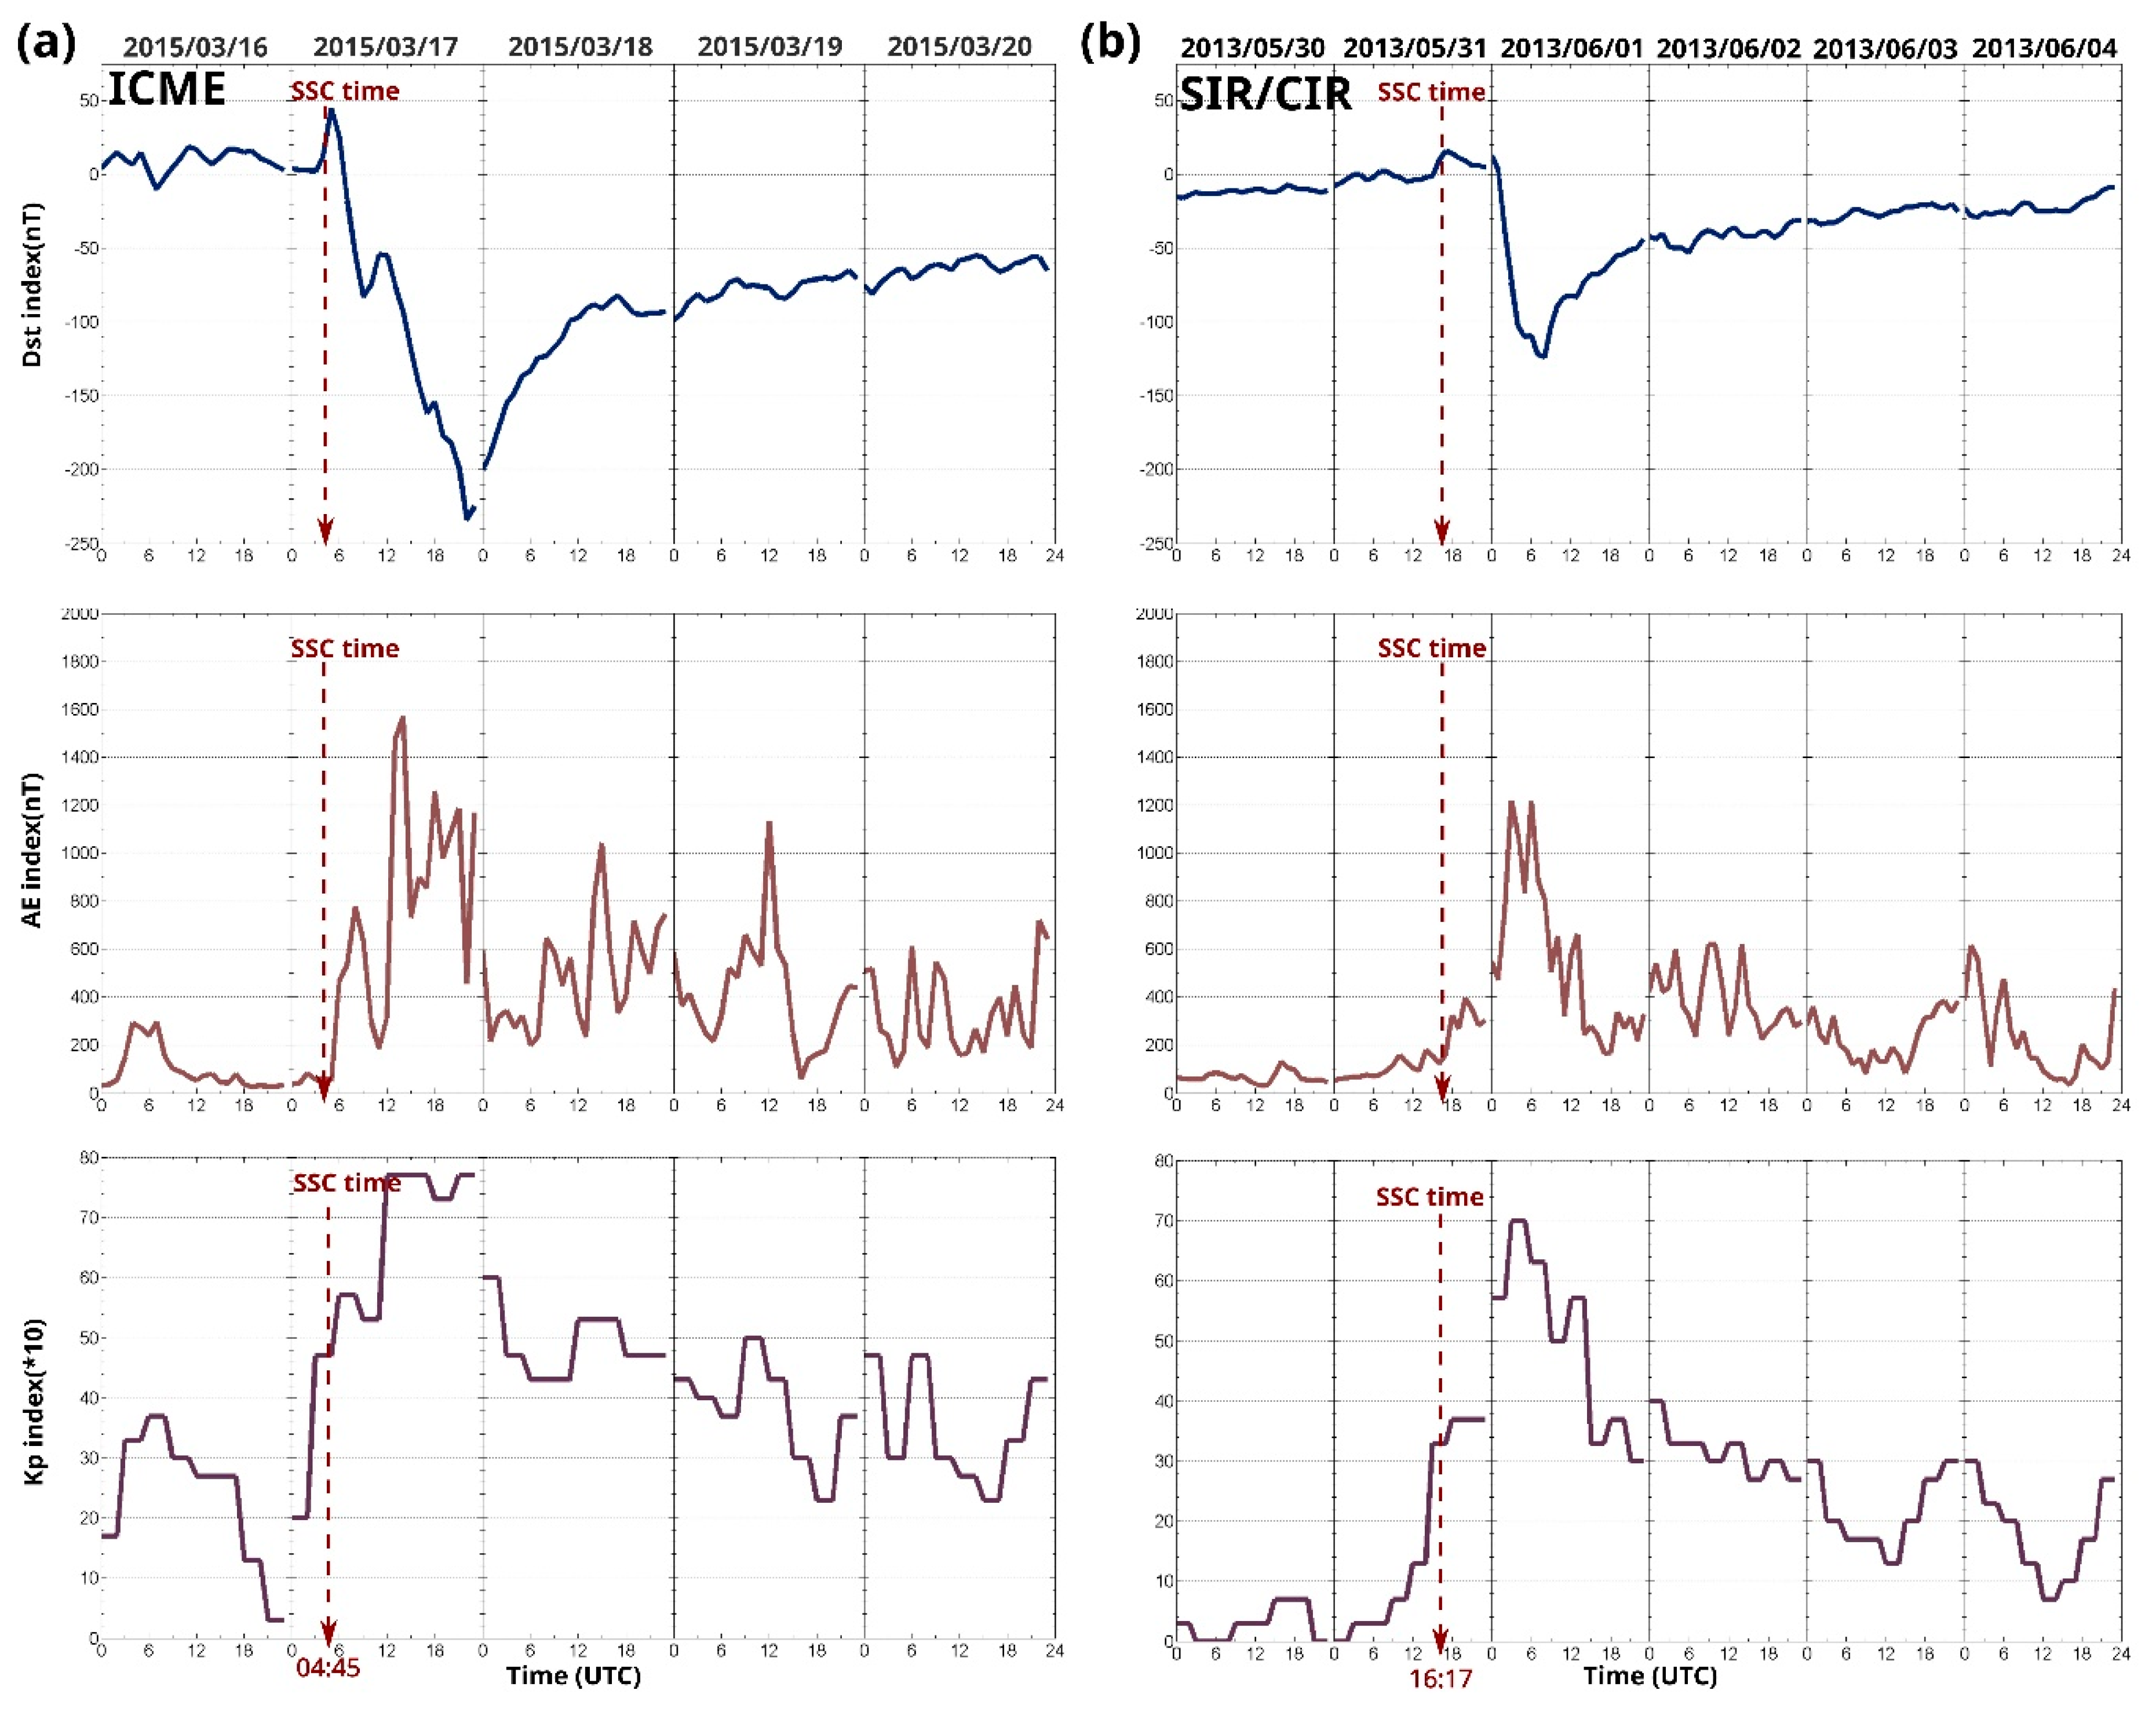
The main background information about the selected ICME and SIR/CIR-driven events are listed in Table 2. In this case, both storms have SSC date, and the Dstmin < -100 nT, representing intense strength level. By SIR/CIRs this is a rare scenario, it is hard to find such a good example for a comparison. On Figure 1 the condition of the interplanetary medium, represented by the Interplanetary Magnetic Field (IMF) Bz component and the SW speed parameter, is displayed during both storms. To see the detailed picture, on Figure 2 we also plotted the evolution of the geomagnetic Dst, AE and Kp indices. The 2015 ICME-driven storm event is the so-called St. Patrick’s Day event, which caused the biggest geomagnetic storm in the solar cycle 24. Several studies were published about this event, and its generated processes in the thermosphere-ionosphere-plasmasphere: [25,34,36,37,38,39,40,41,42,43,44,45,46]
As for the geomagnetic storm phases: the pre-storm phase was on 16th March 2015 and on 31st May 2013 until the SSC time. The main phase lasted until 23:00 UT on 17th March 2015 and 09:00 UT on 01st June 2013. Then the recovery phase started.
The time interval of the ionospheric storm phases can be different. Right after the SSC, the main phase of the ionospheric storm starts, then followed by the recovery phase. A detailed analysis of an interesting exception is reported in [25]. However, in these current cases the geomagnetic and ionospheric storm phases went together, no delay was observed.

3.2. Comparison of the Ionosonde Instruments

One of the aims of this study is to examine the differences and similarities between the three different types of ionosonde instrument: the AIS-INGV, the DPS-4, the DPS-4D and the VISRC-2. For this we analyzed the calculated reference values for all stations and both months. Besides we compared the two different ionosonde instrument of Rome (RO) station
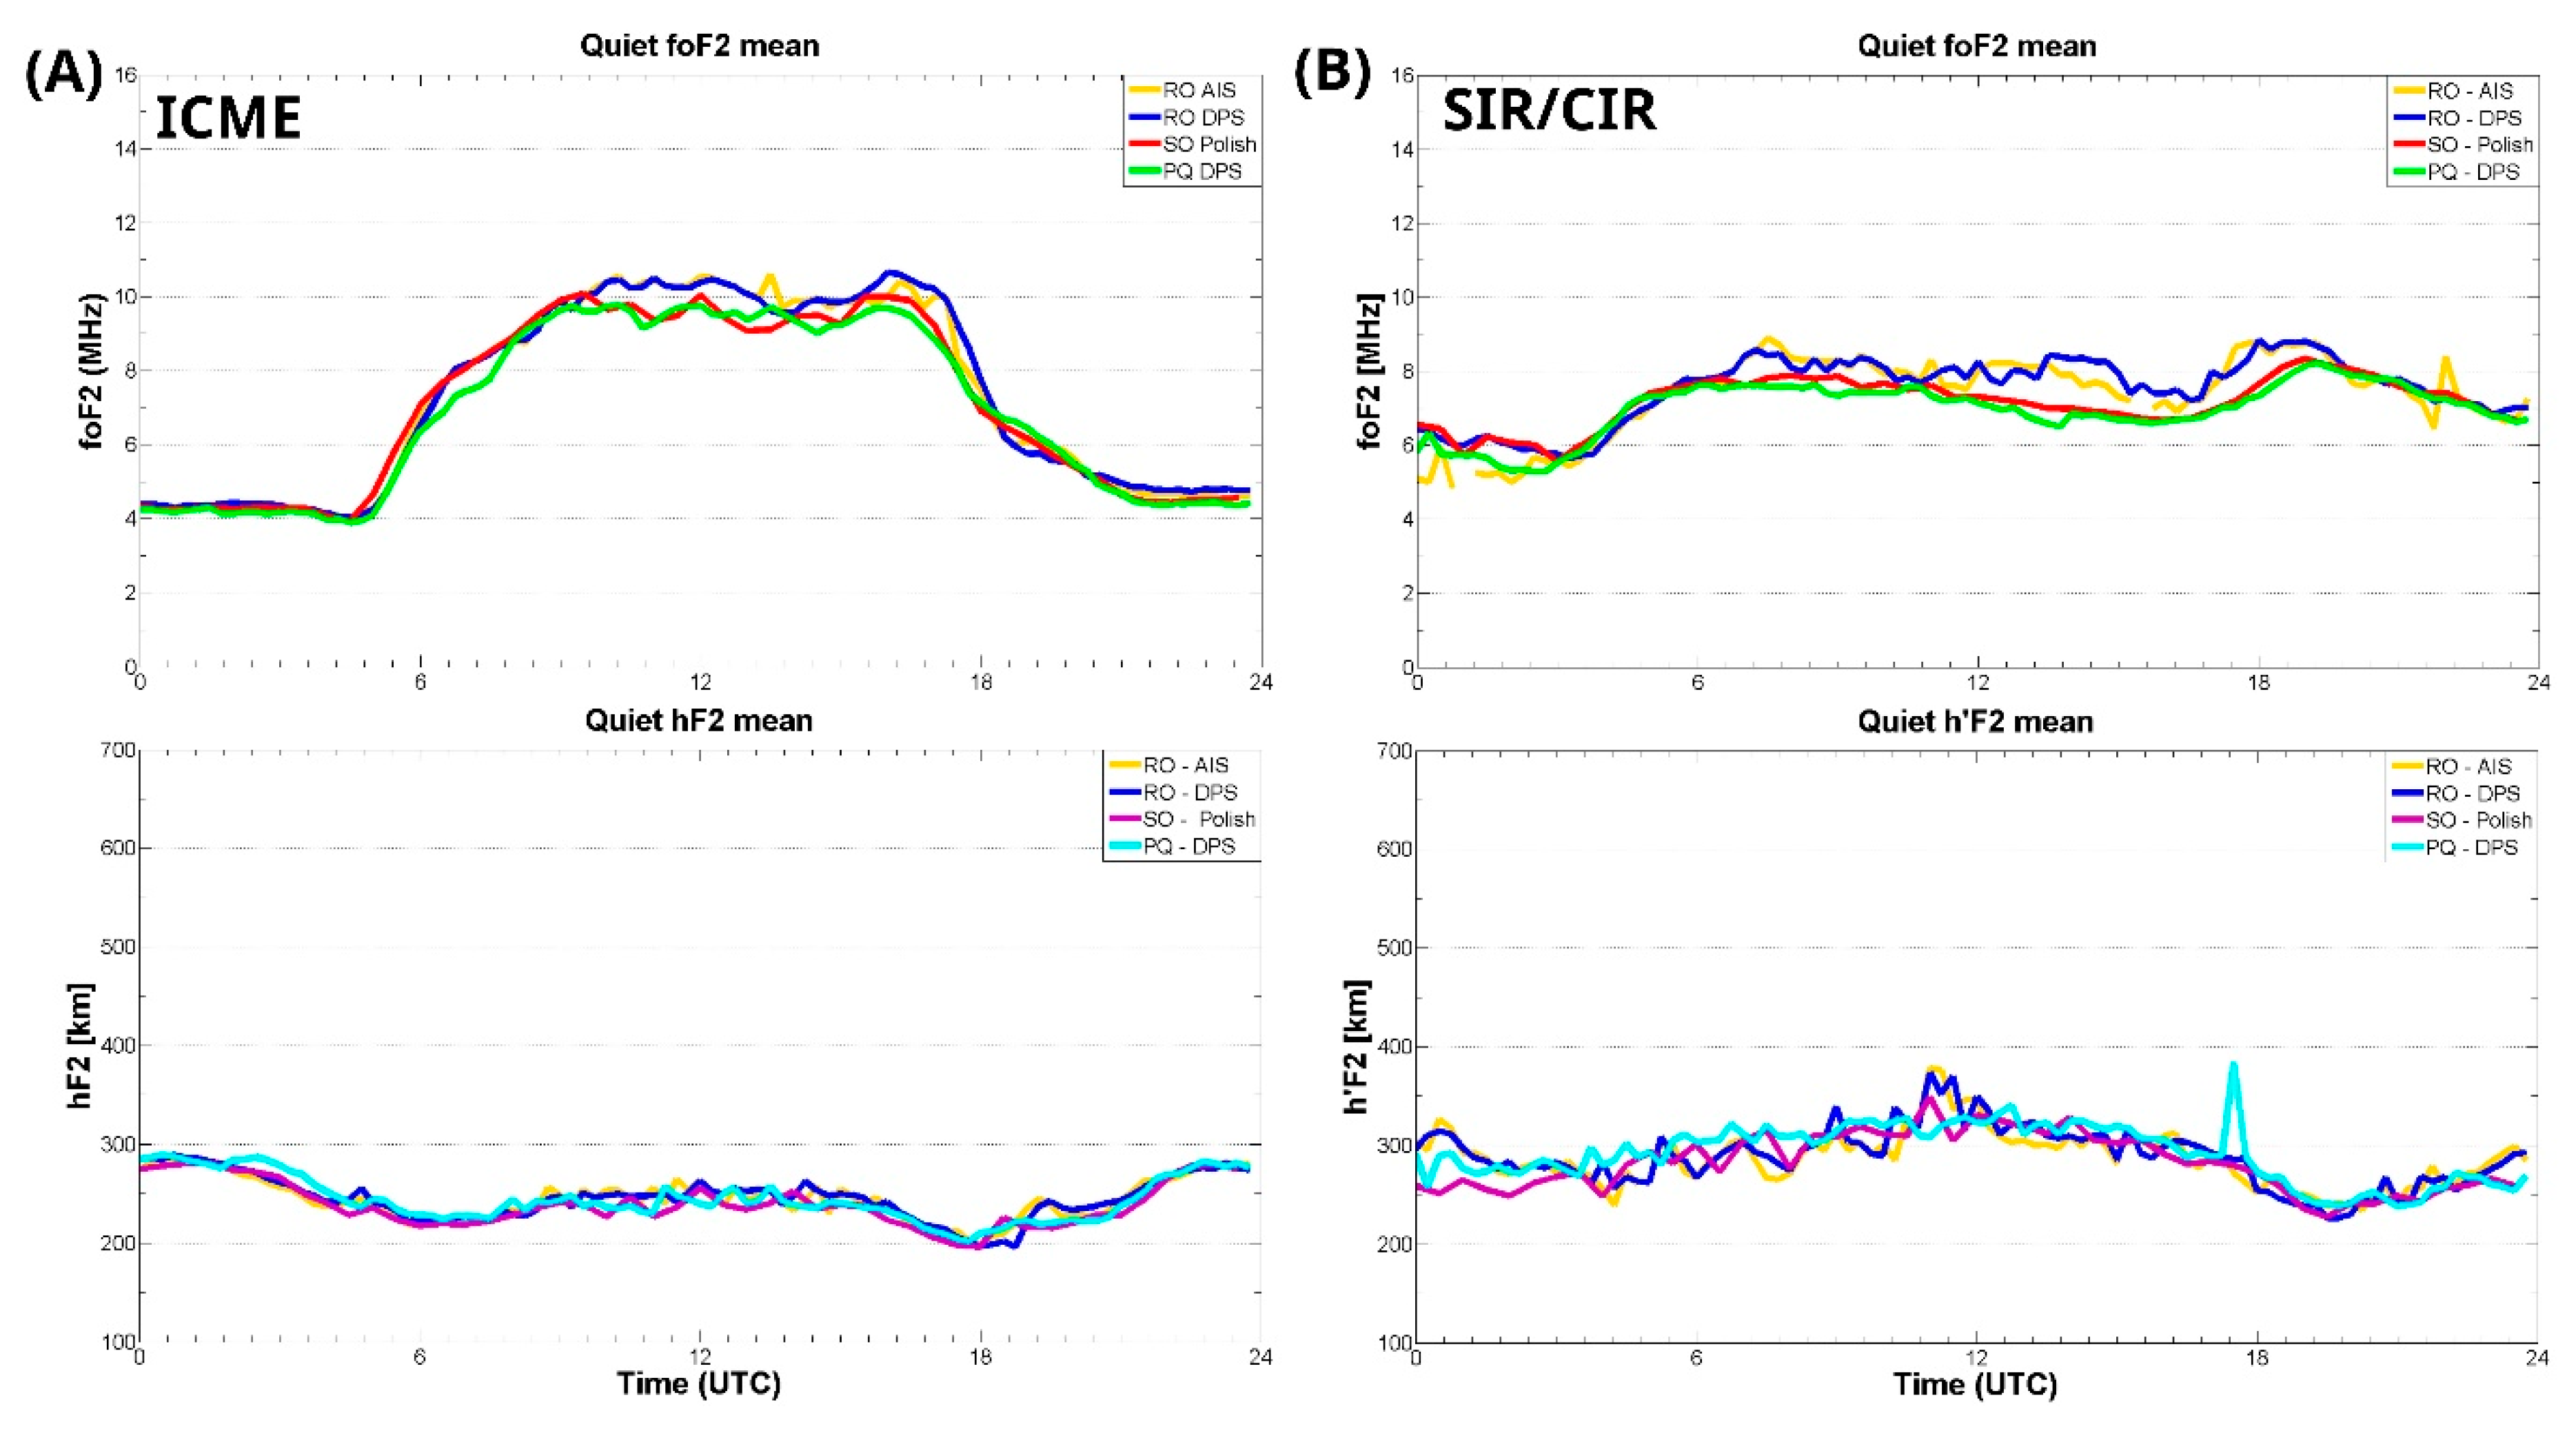
On Figure 3 the comparison of the calculated three quiet day means of foF2 and hF2 parameters can be seen for all three stations, by both storms, where (a) is for the 2015 and (b) is for the 2013 event. No significant deviation can be seen on these plots when we are comparing the data of the different stations. The foF2 quiet mean curve used for the ICME storm shows the typical diurnal behavior and oscillates between 4-10,5 MHz values around noon, on the other hand the other foF2 mean curve flatter and oscillates between 5-9 MHz range.
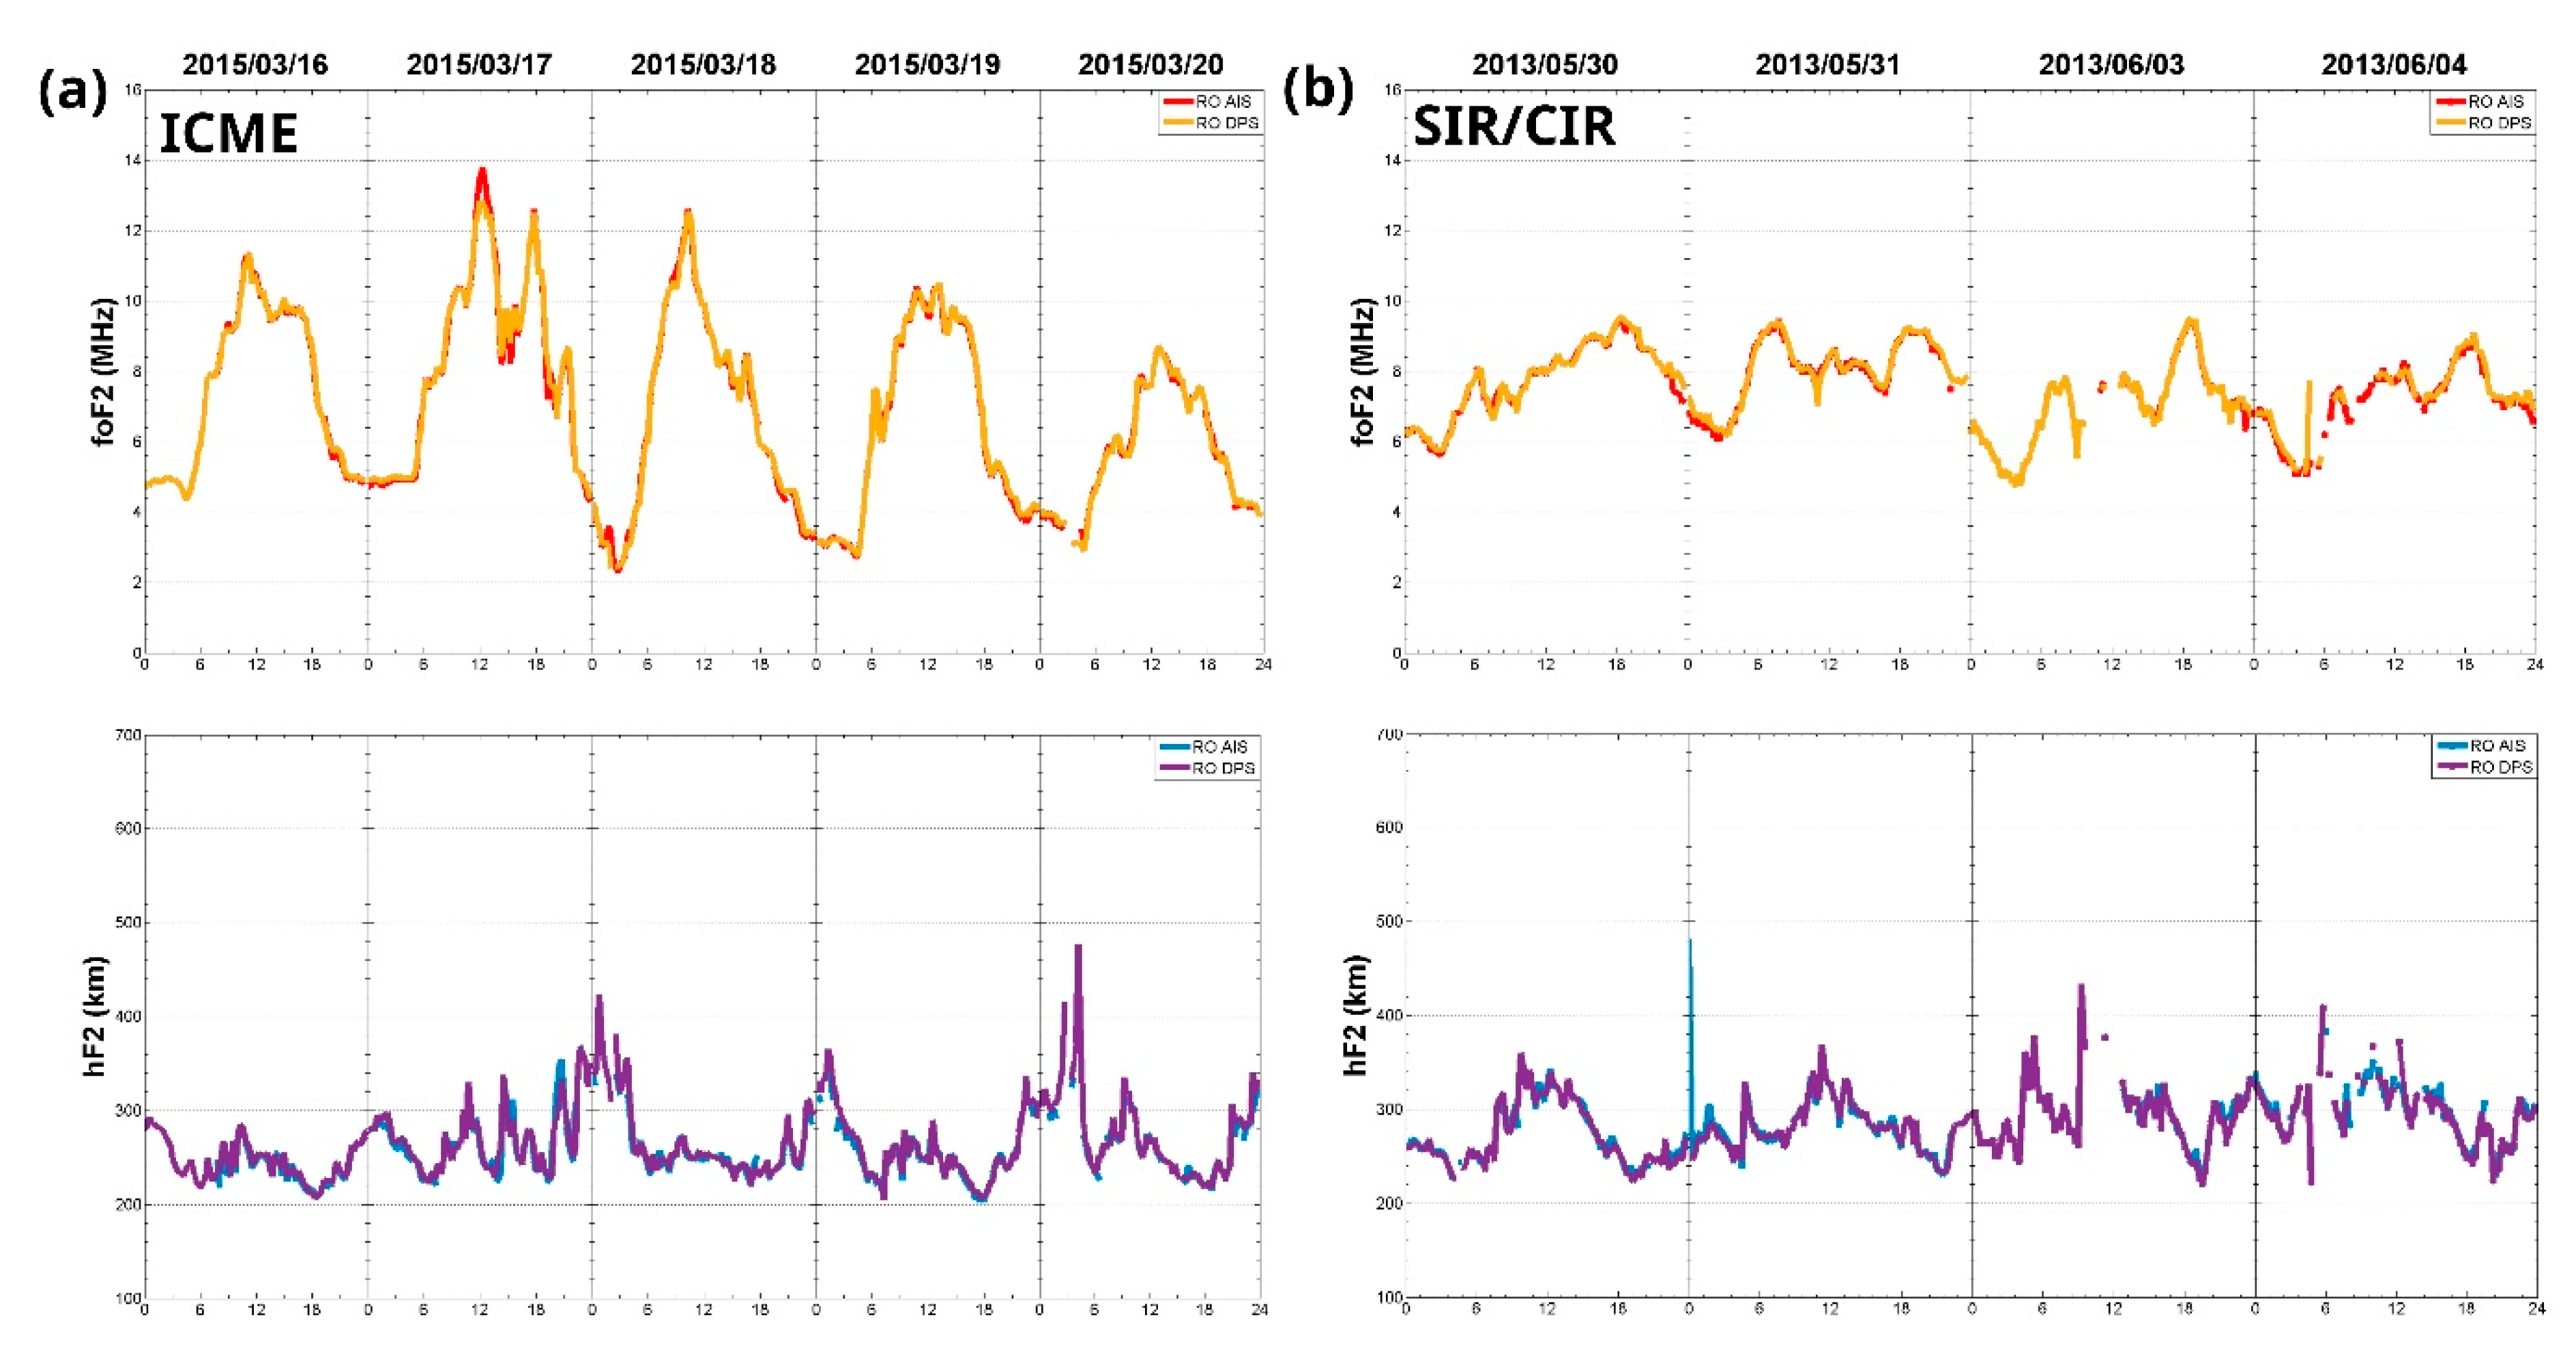
On Figure 4, the measured foF2 and h’F2 parameter data from the DPS and AIS types of ionosondes are plotted for comparison: (a) plots are for the ICME-driven and (b) plots are for the SIR/CIR-driven events. The instruments are co-located at the INGV headquarters in Rome and no significant deviation can be seen in the data.
It can be concluded that there is no significant difference between the RO AIS and DPS type of ionosonde instrument, therefore in the following plots of the next section we are only showing the DPS data.

3.3. Comparison of the ICME- and the SIR/CIR-Driven Ionospheric Storm Cases
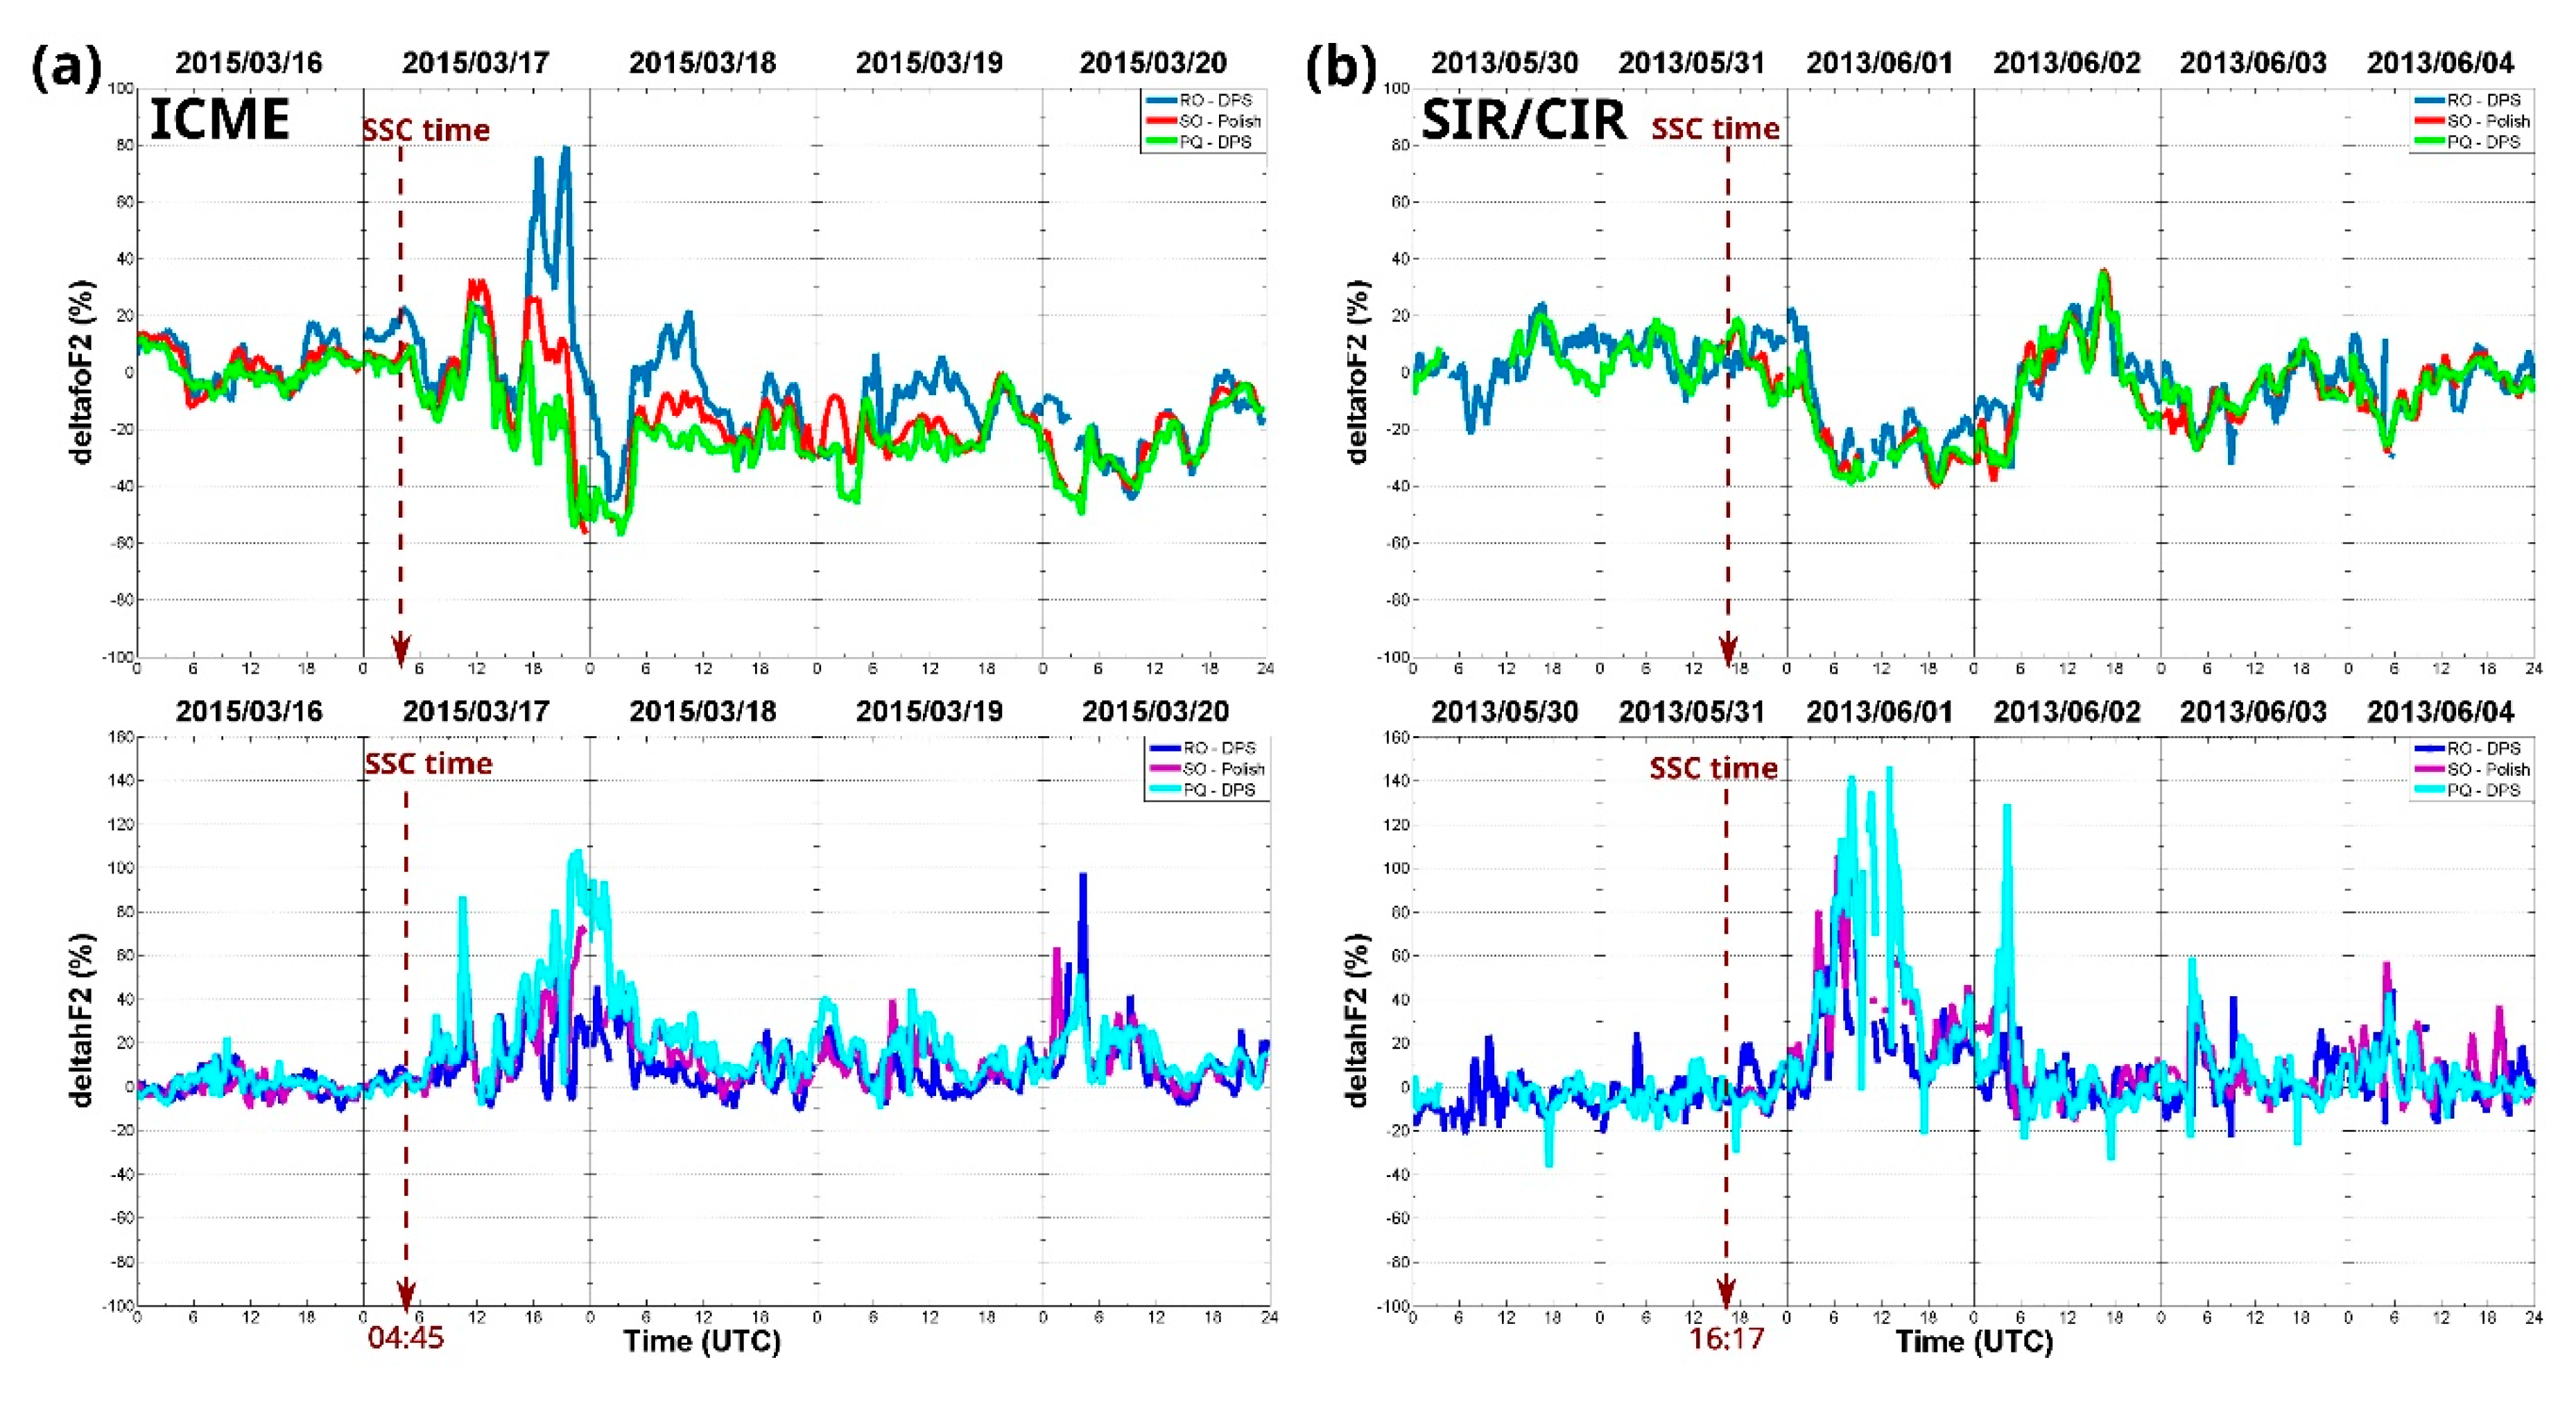
The other aim of this study is to compare the ionospheric evolution of two types of geomagnetic storms (ICME and SIR/CIR) with ionosonde, TIMED/GUVI [O]/[N2] and rTEC data. For this we calculated deltafoF2 and deltahF2, in percentage according to Equation 1, which display the deviations from the quiet day reference values. When the value in Figure 6 is 0%, the storm time value is equal to the median quiet day value at the respective half hour [34,47].
Figure 5. DeltafoF2 (top) and the deltahF2 (bottom) parameter comparison during the (a) ICME- and the (b) SIR/CIR-driven geomagnetic storms. The UT of the SSC was at 16:17 for the 2013 storm and at 04:45 for the 2015 storm, marked with red dotted lines.
Preprints 110214 g005
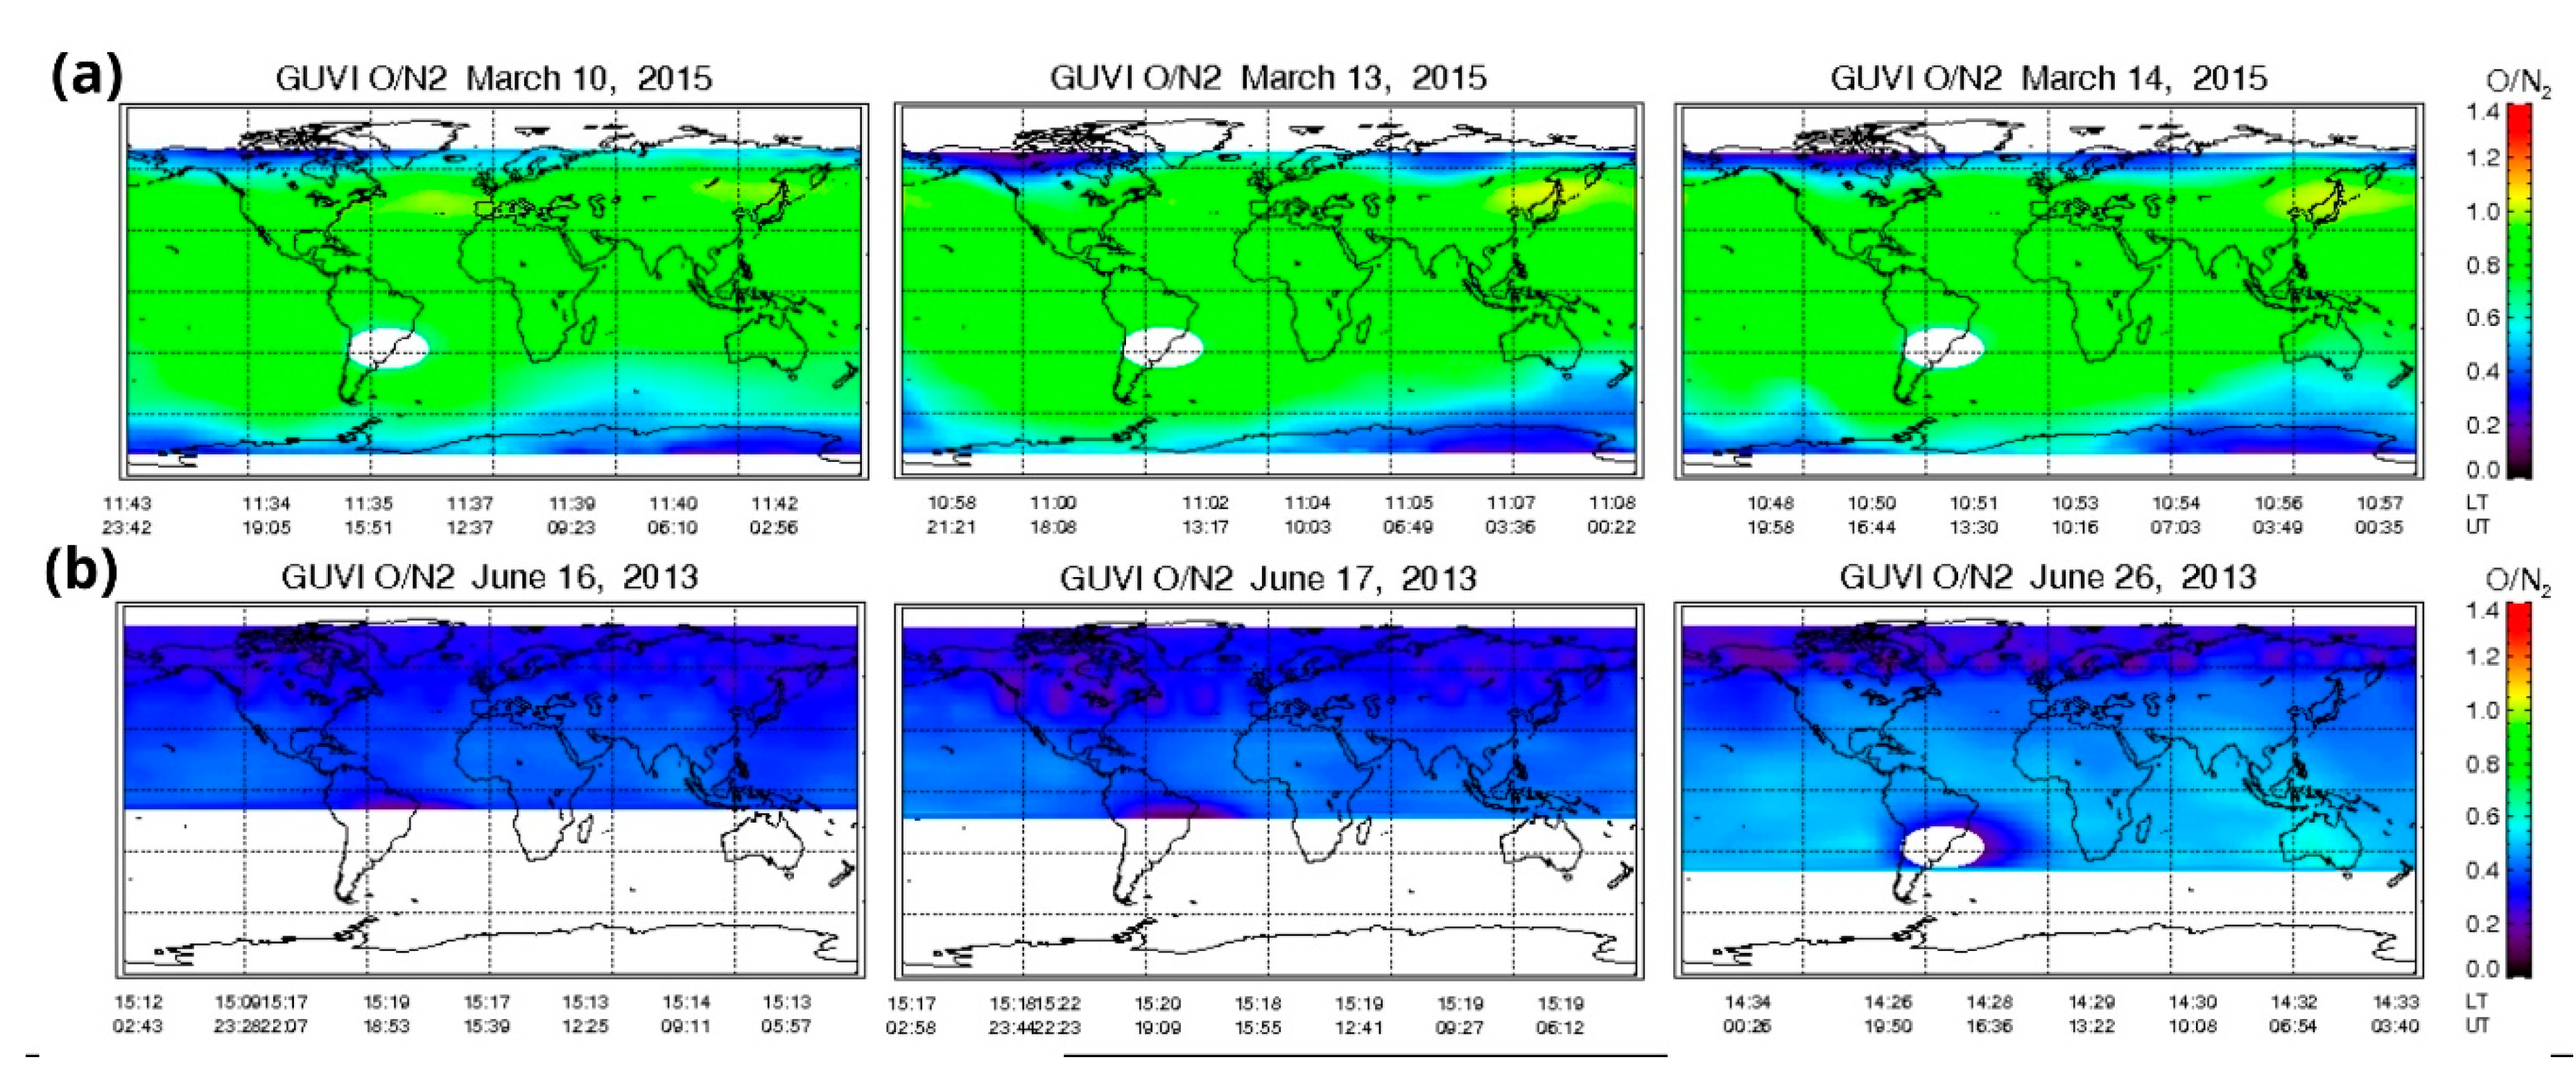
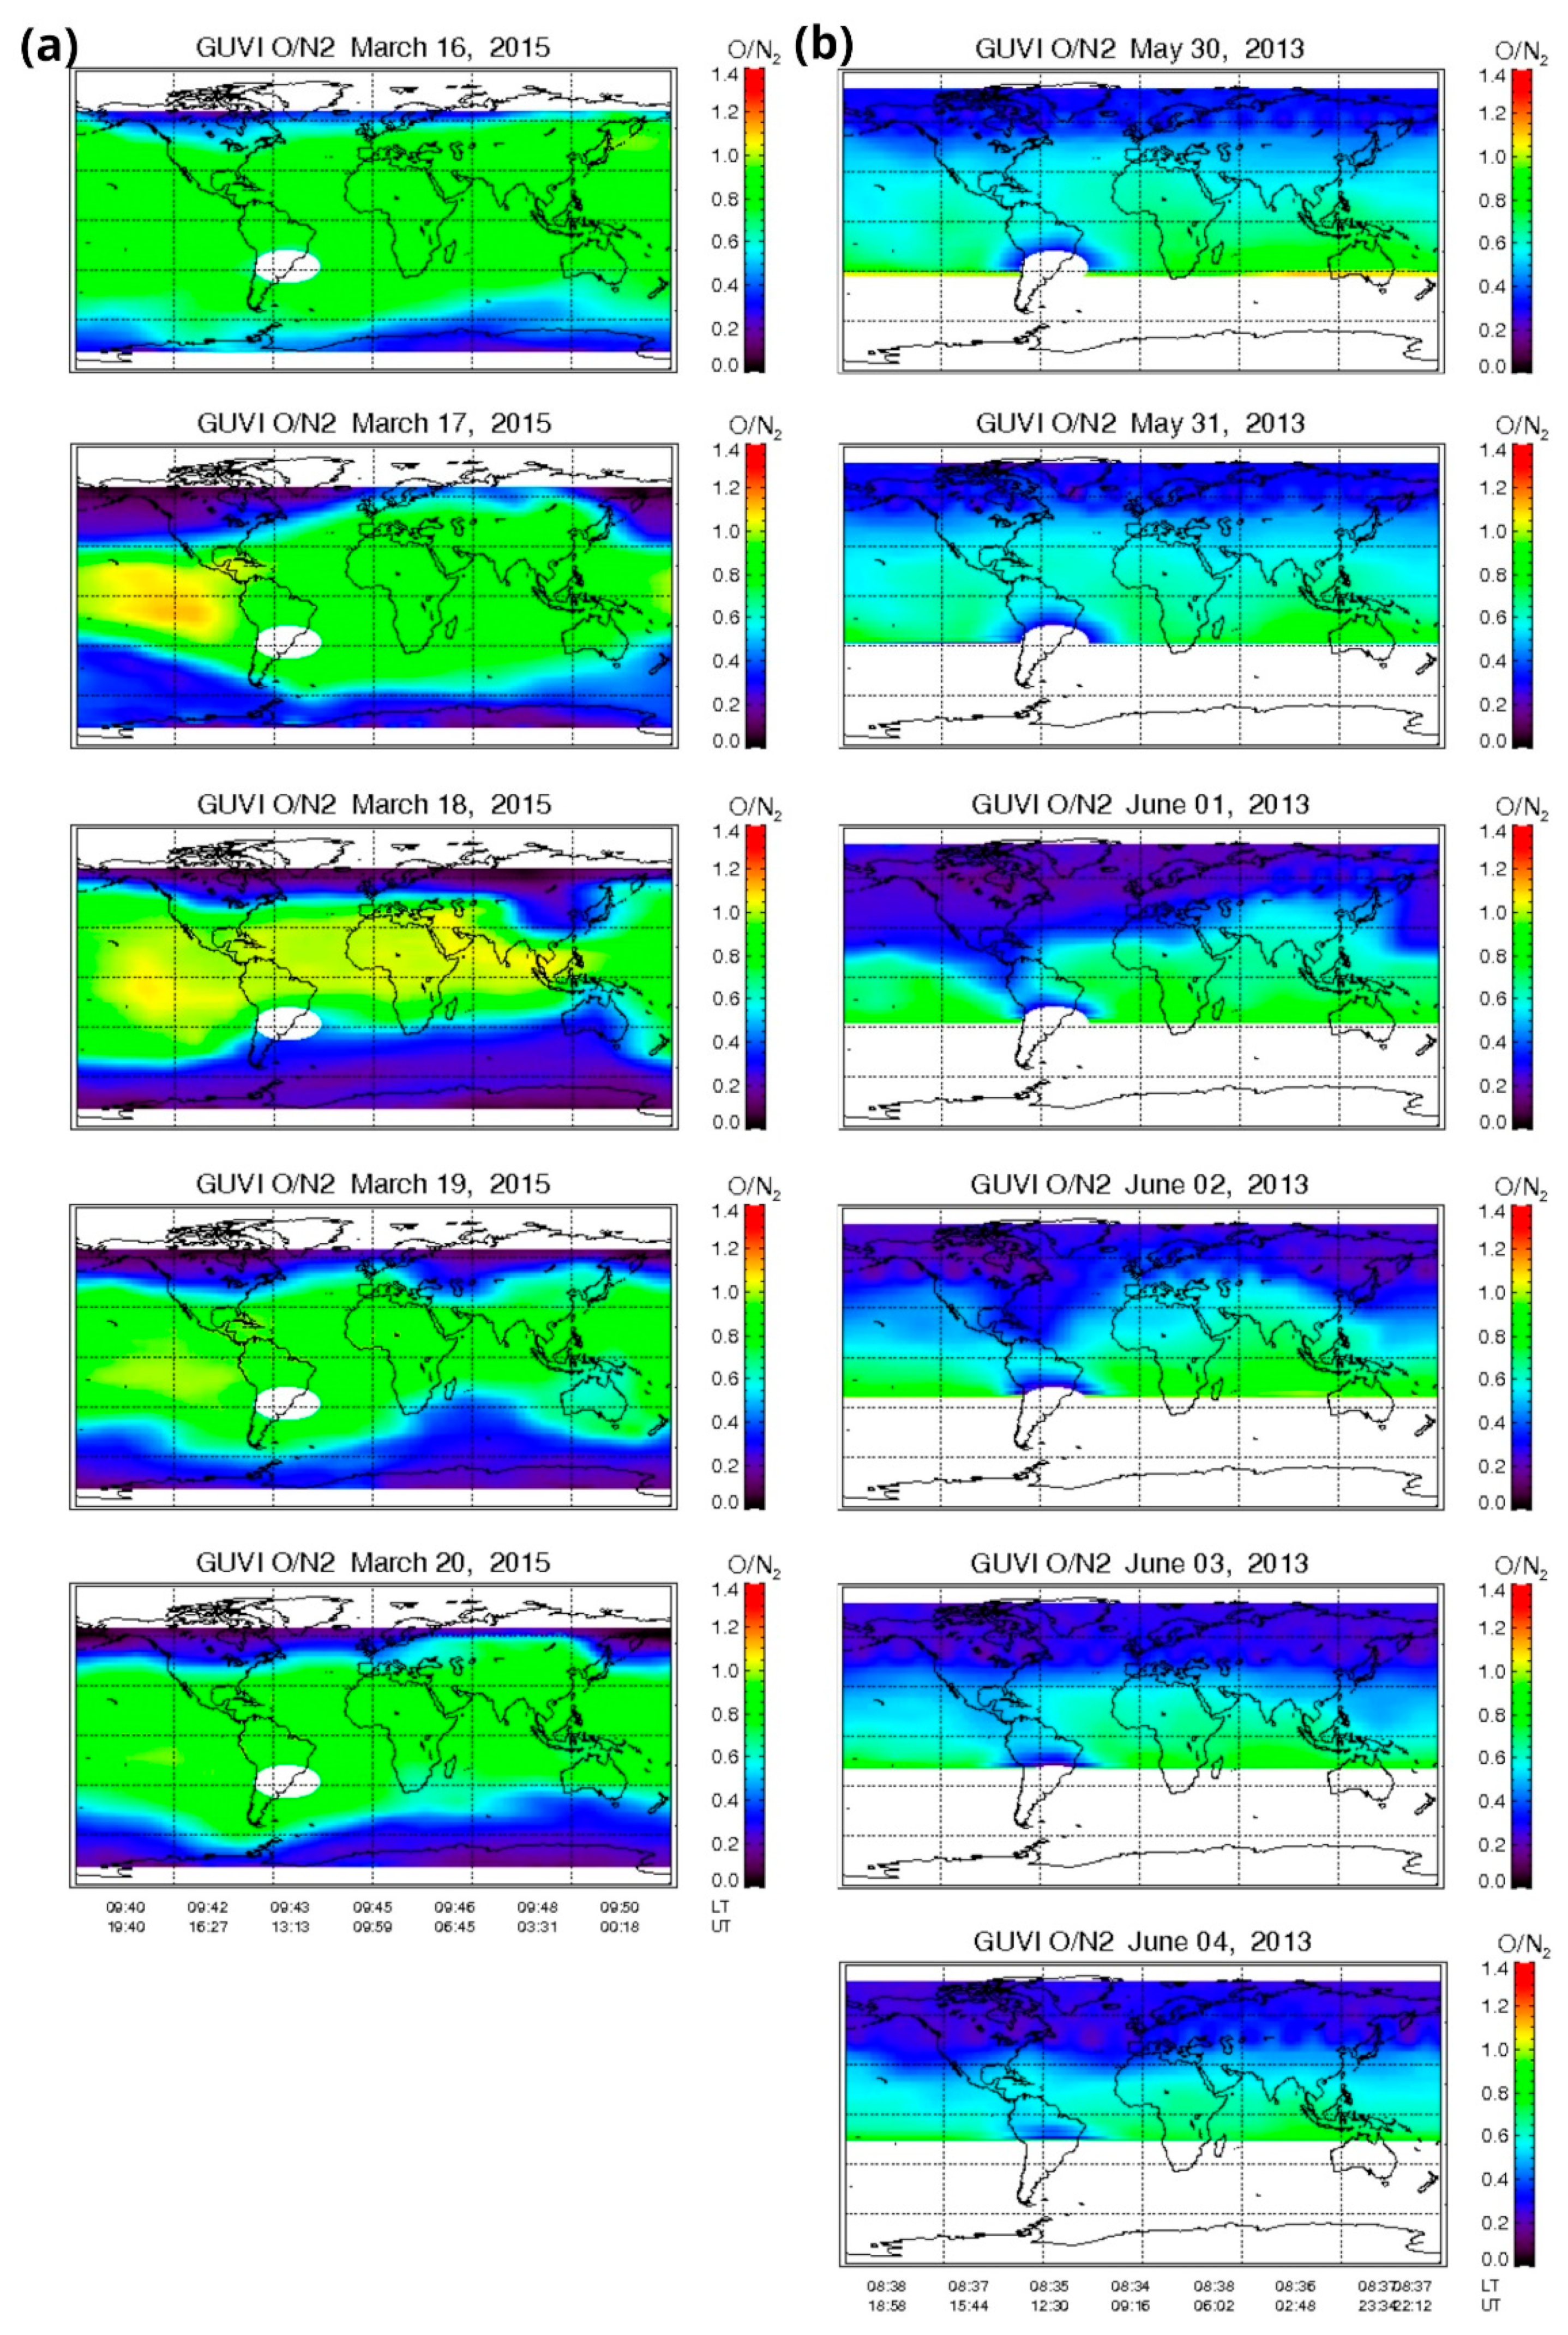
Figure 6. TIMED/GUVI [O]/[N2] data on the reference days for the (a) 2013 and the (b) 2015 storm cases.
Preprints 110214 g006
In Figure 5 the calculated deltafoF2 and deltahF2 values are displayed for (a) the ICME- and (b) SIR/CIR-driven events. After the SSC by the ICME-driven event, the deltafoF2 parameter increased up to 25% at RO and PQ, 35% at SO around noon and went up to 80% at RO, 30% at SO and 10 % from 16-21 UT on 17th March, followed by a sharp decrease with - 45-55% during the night until 06 UT on 18th March. At the same time the deltahF2 parameter is significantly increased, reaching the 110% at PQ around 21 UT on 17th March. From 18 UT on 17th March until 15 UT on 18th March these data show significant latitude dependence. On the other hand, by the SIR/CIR-driven event the deltafoF2 parameter is significantly decreased up to -40% for a whole day from about 03 UT on 01st June until 06 UT on 02nd June with no latitude dependence. At the same time the deltahF2 parameter is significantly increased with visible latitude dependence, PQ station deltahF2 data reaches the 150% indicating significant F2 layer uplifting.
On Figure 6 the reference [O]/[N2] data is displayed. The background condition and the seasonal differences can be clearly seen on these plots. During summer in the Northern Hemisphere the background solar EUV-driven thermospheric meridional circulation causing depleted [O]/[N2] ratio (indicated with blue on the figures), while at equinox the background condition shows slight increase (yellow color) in [O]/[N2] in the Northern Hemisphere (see for more [48]).
On Figure 7 the storm-time [O]/[N2] data can be seen. Figure 7a plots are showing the ICME-driven case, where on 17th and 18th March, during the main and early recovery phase of the geomagnetic storm the depletion in the [O]/[N2] ratio during the night can be observed over Europe. On the other hand, a depletion in the [O]/[N2] ratio is also observed in the GUVI data during the daytime hours on 18th -20th March. The Figure 7b plots are showing the SIR/CIR-driven case. On 30th and 31st May also a quite intensively depleted [O]/[N2] ratio is present during the day in the Northern Hemisphere. However, on 01st June, during the main phase of the storm, extreme depletion in [O]/[N2] is observed with the GUVI instrument reaching almost the Equator. During the following days in the early recovery phase of the storm, the depletion in [O]/[N2] ratio is moving poleward.
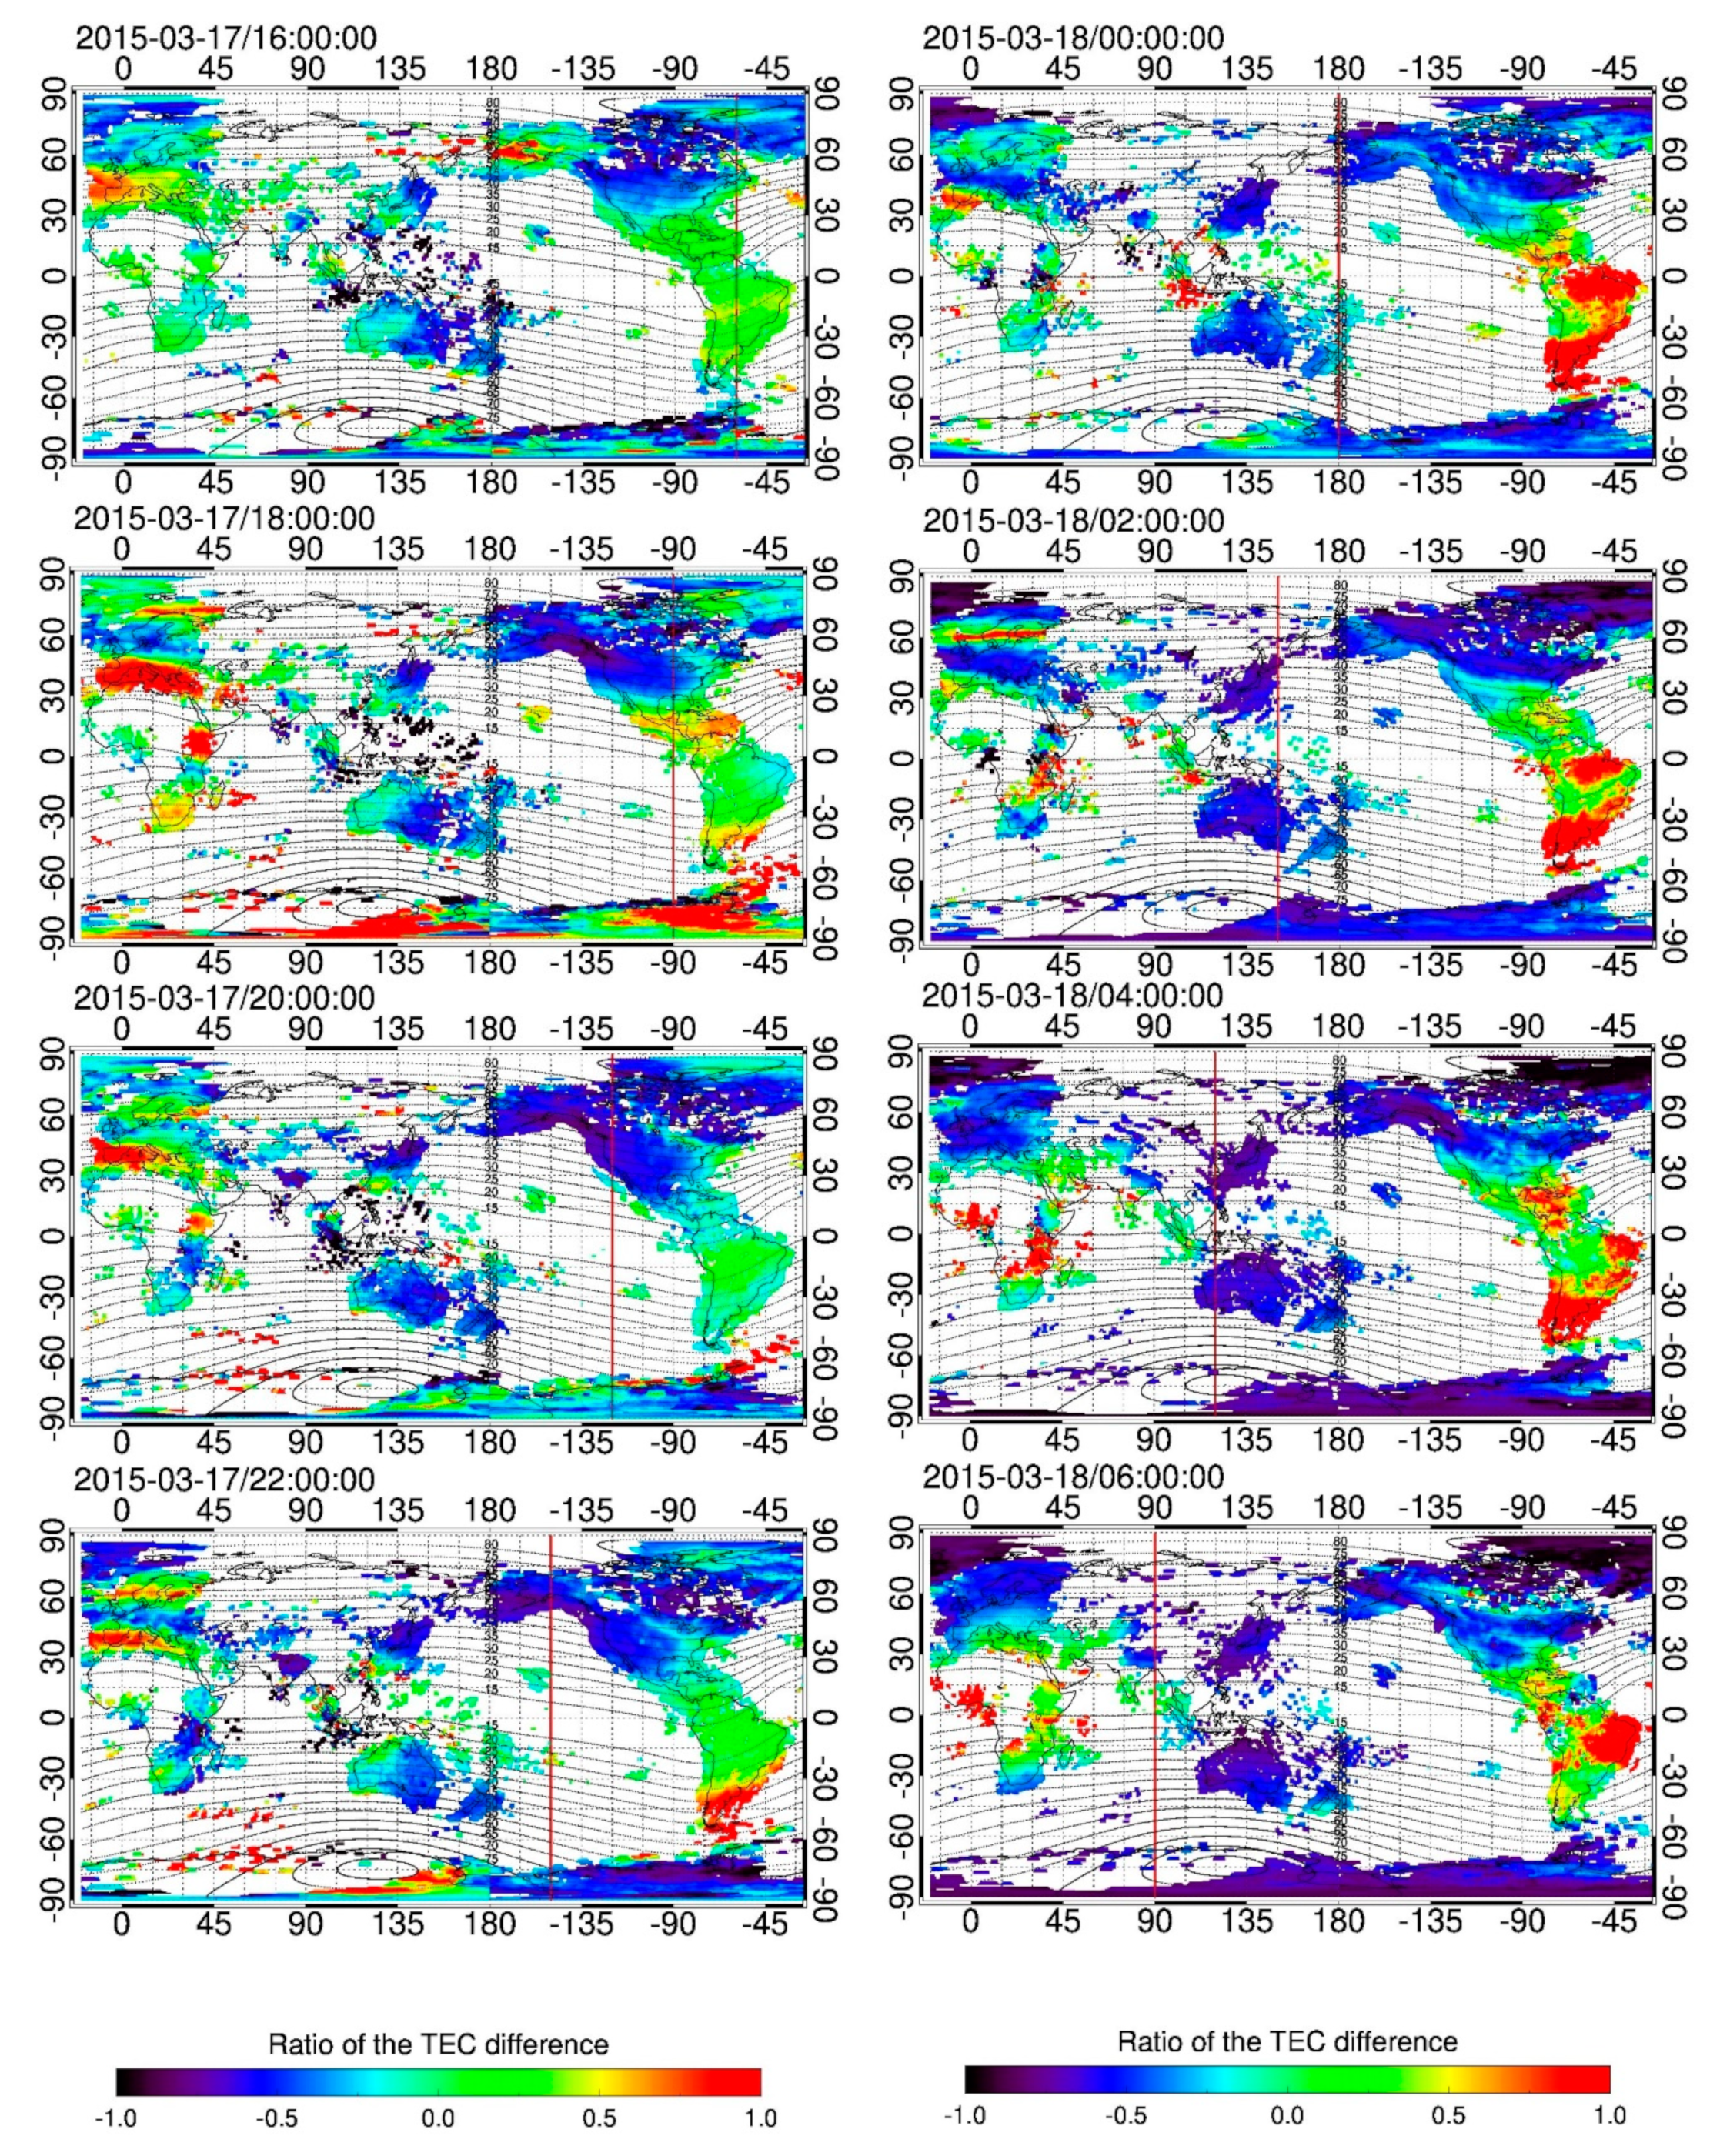
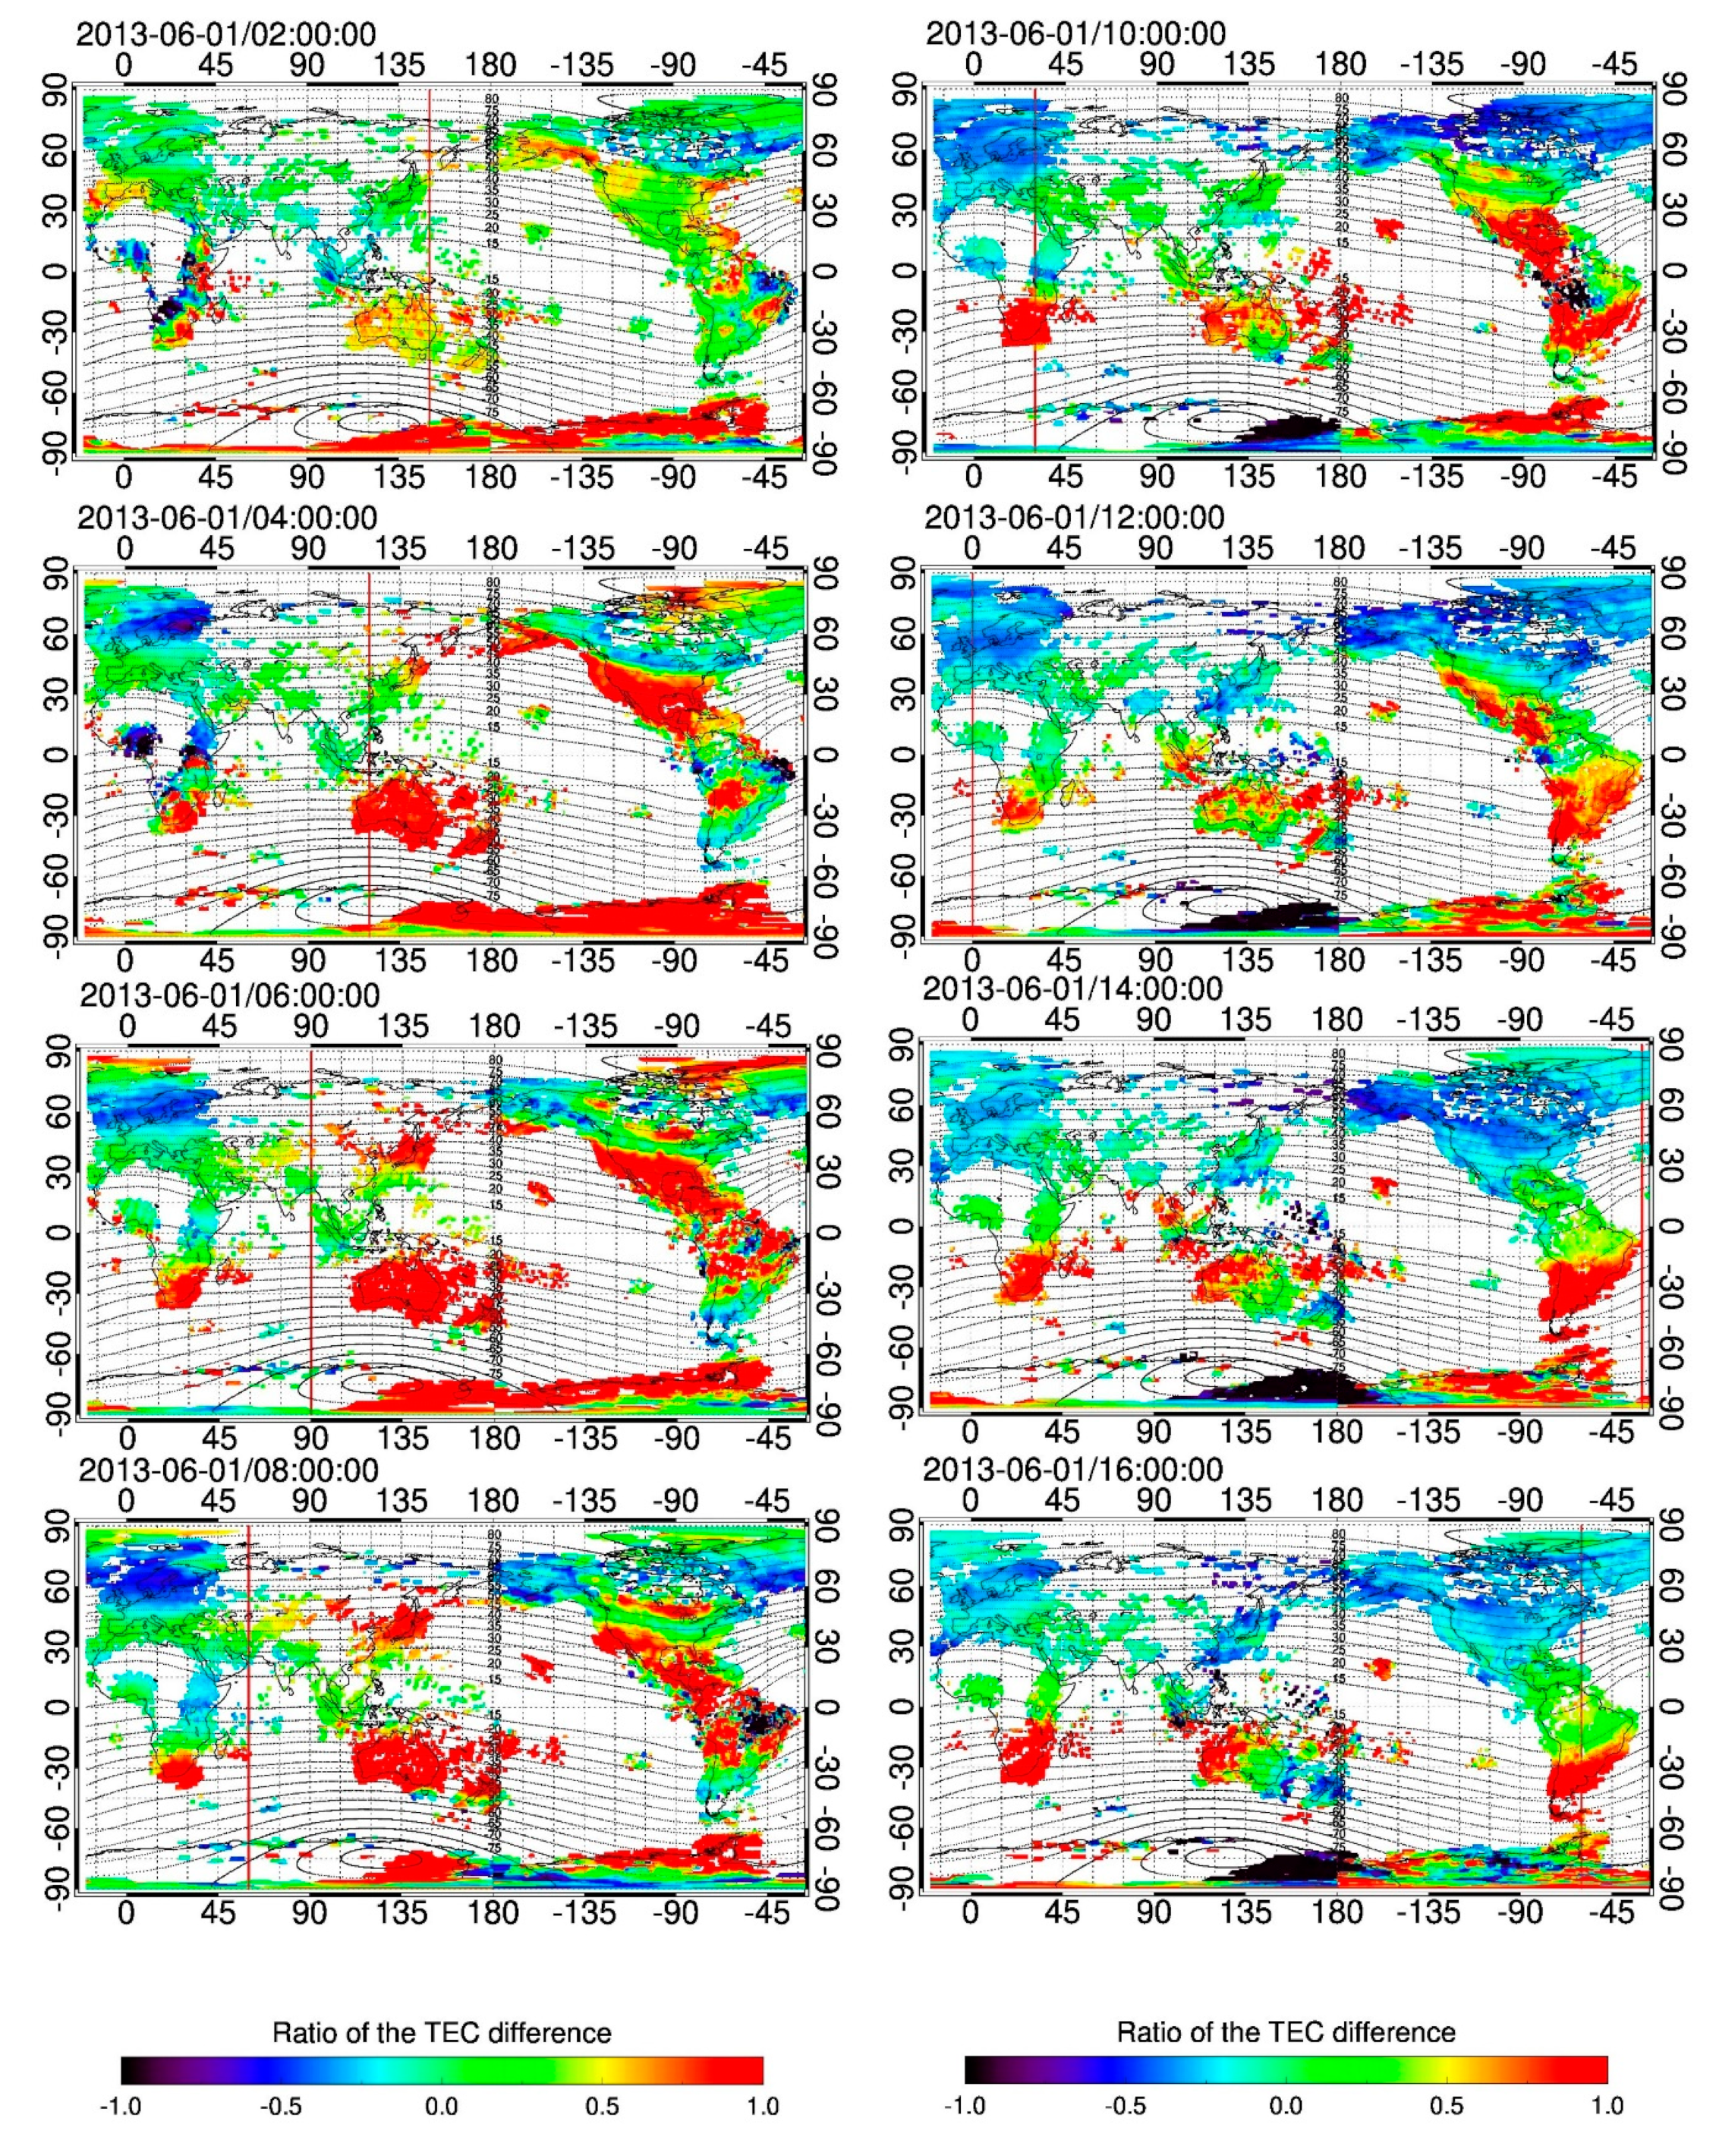
On Figure 8 and Figure 9 the rTEC data are portrayed for the selected period of the two geomagnetic storms. These data show the differences from the quiet day values: red indicates an increase in electron density, blue indicates an decrease in electron density and green indicates no difference from the reference value.
In Figure 8 the rTEC data for the ICME-driven event from 2015 is portrayed a selected time interval, in the main phase of the storm between 16 UT on 17th and 06 UT on 18th March. We show only the afternoon/night period, when on Figure 5 we have seen extremely depleted plasma in the F2-layer. The positive phase during the day over Europe is moving equatorward with time and from the auroral region a negative phase follows it. From our previous multi instrumental study [25] we proved that the equatorward movement of this negative phase region is linked to the midlatitude ionospheric trough (MIT), which is the ionospheric footprint of the plasmapause (PP).
In Figure 9 the rTEC data for the SIR/CIR-driven event from 2013 is shown focusing on a selected time interval during the main phase of the storm between 02-16 UT on 01st June. From 04 UT the negative phase started to move equatorward from the Scandinavian region and reached Africa around noon. The ionospheric plasma was depleted over the whole European region until 23:00 UT. The negative phase region started to move westward during the dawn hours of 2nd June and by 08 UT reached the quiet level (see these plot in the Supplementary material).
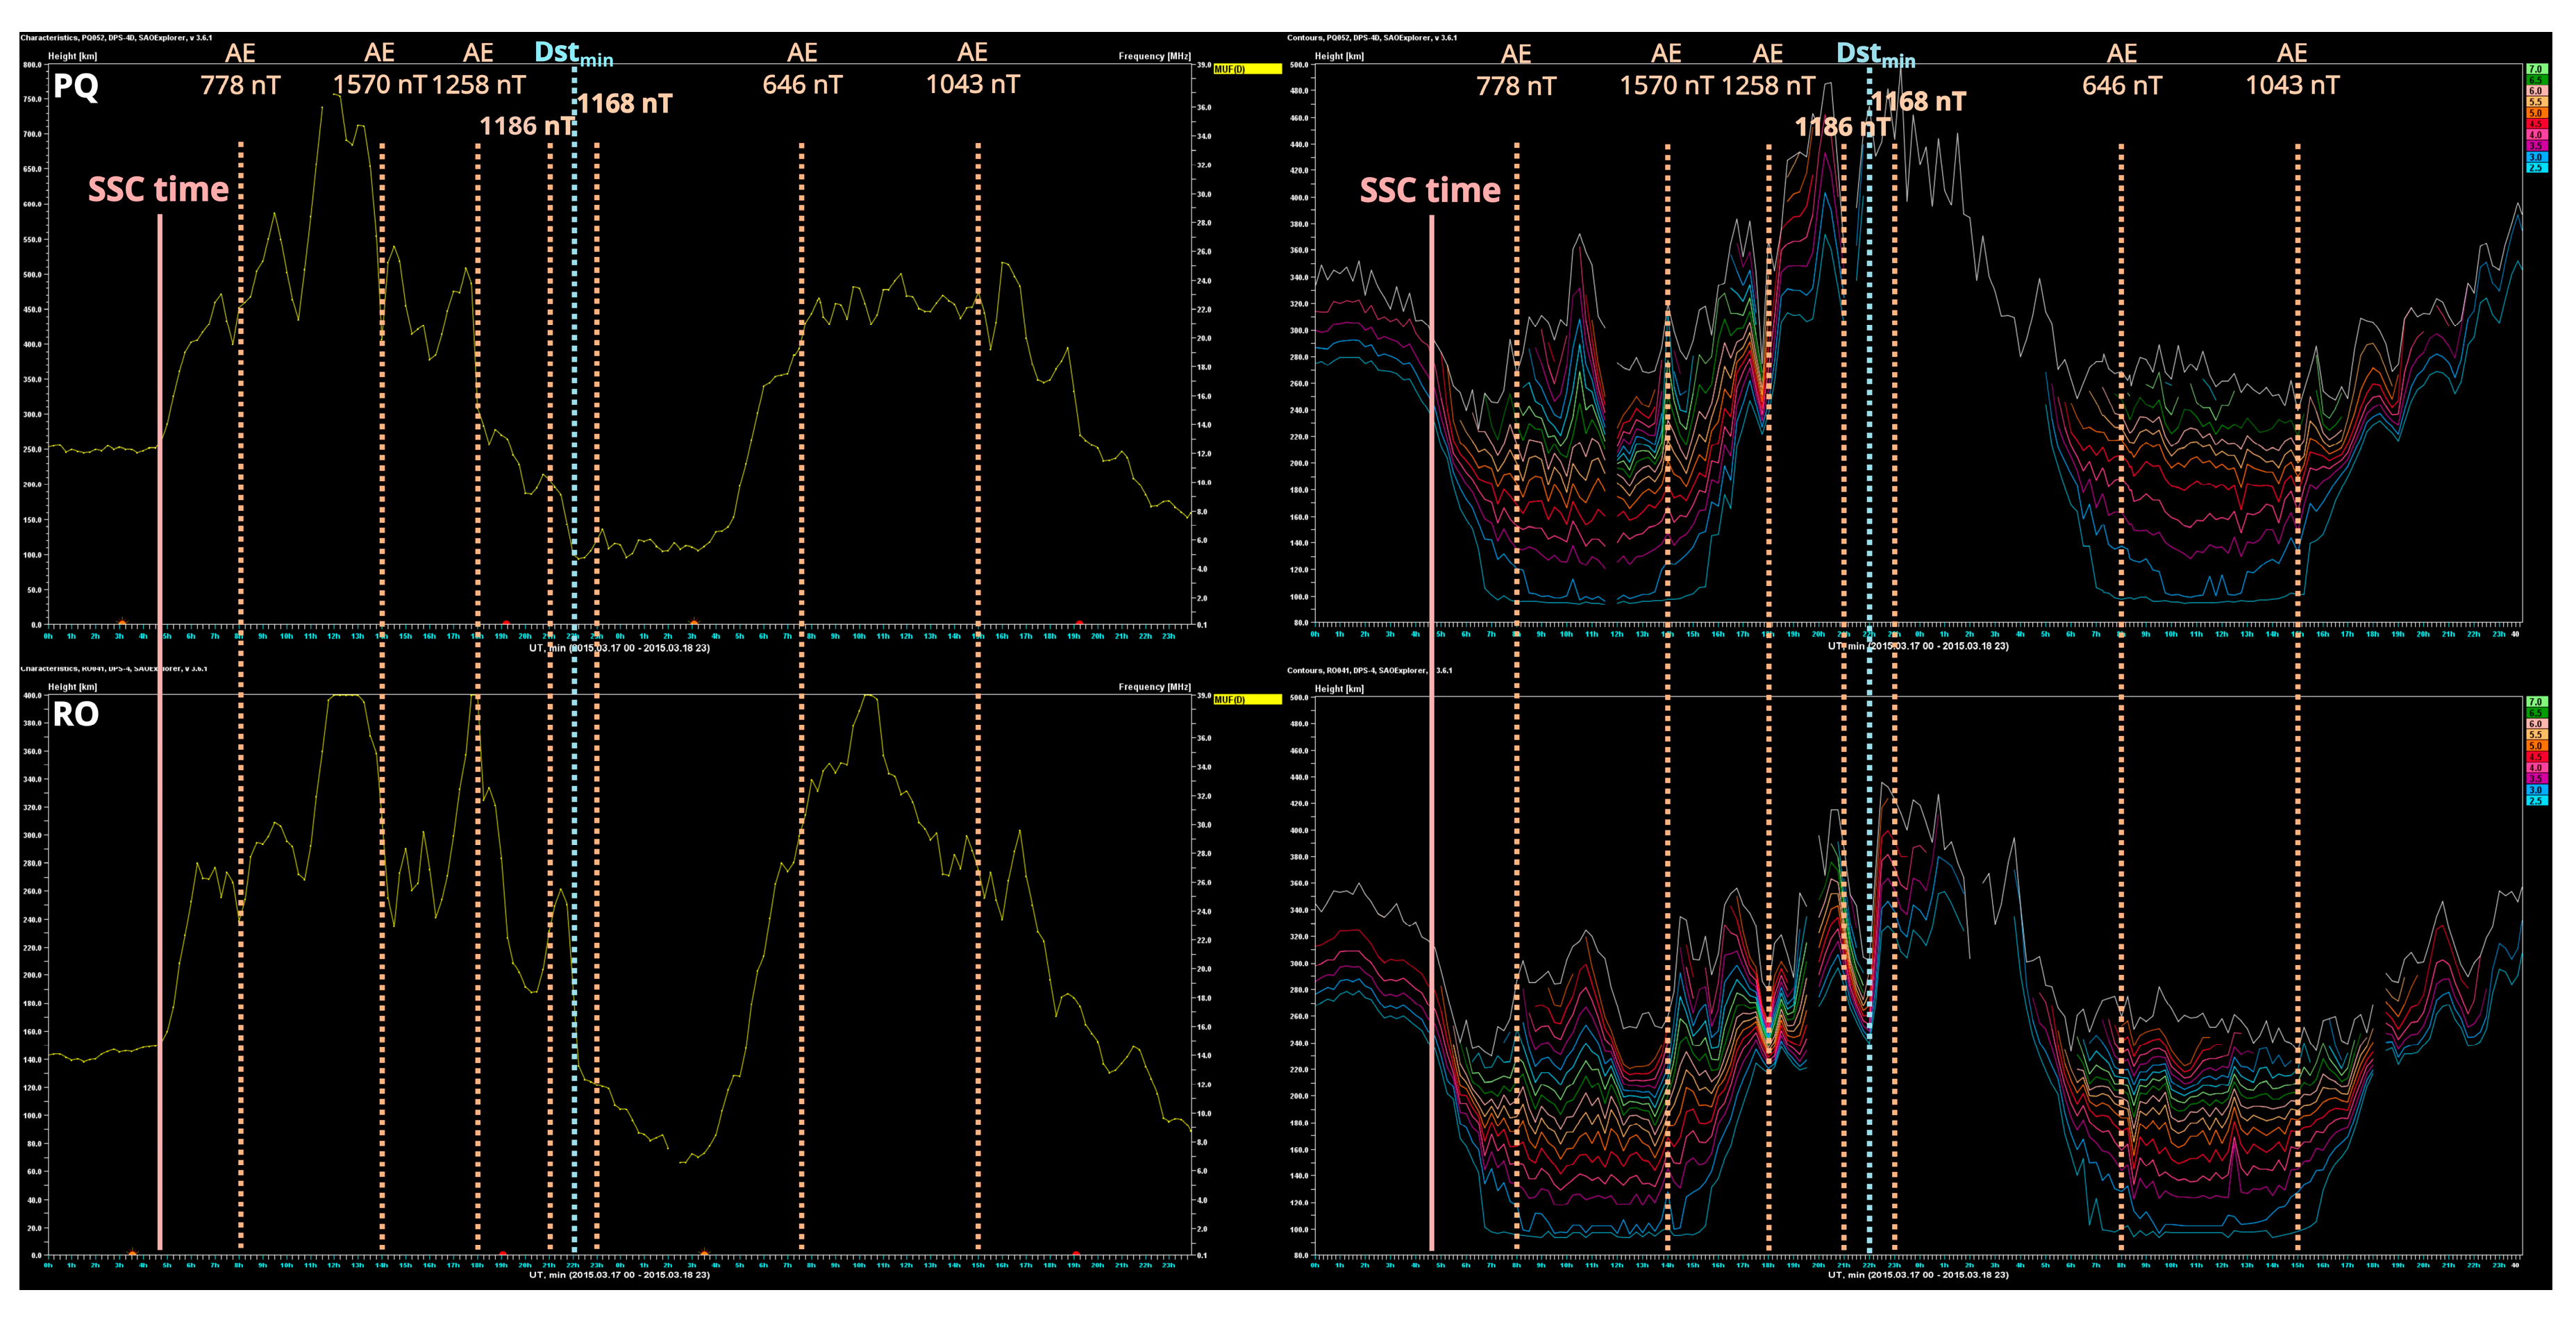
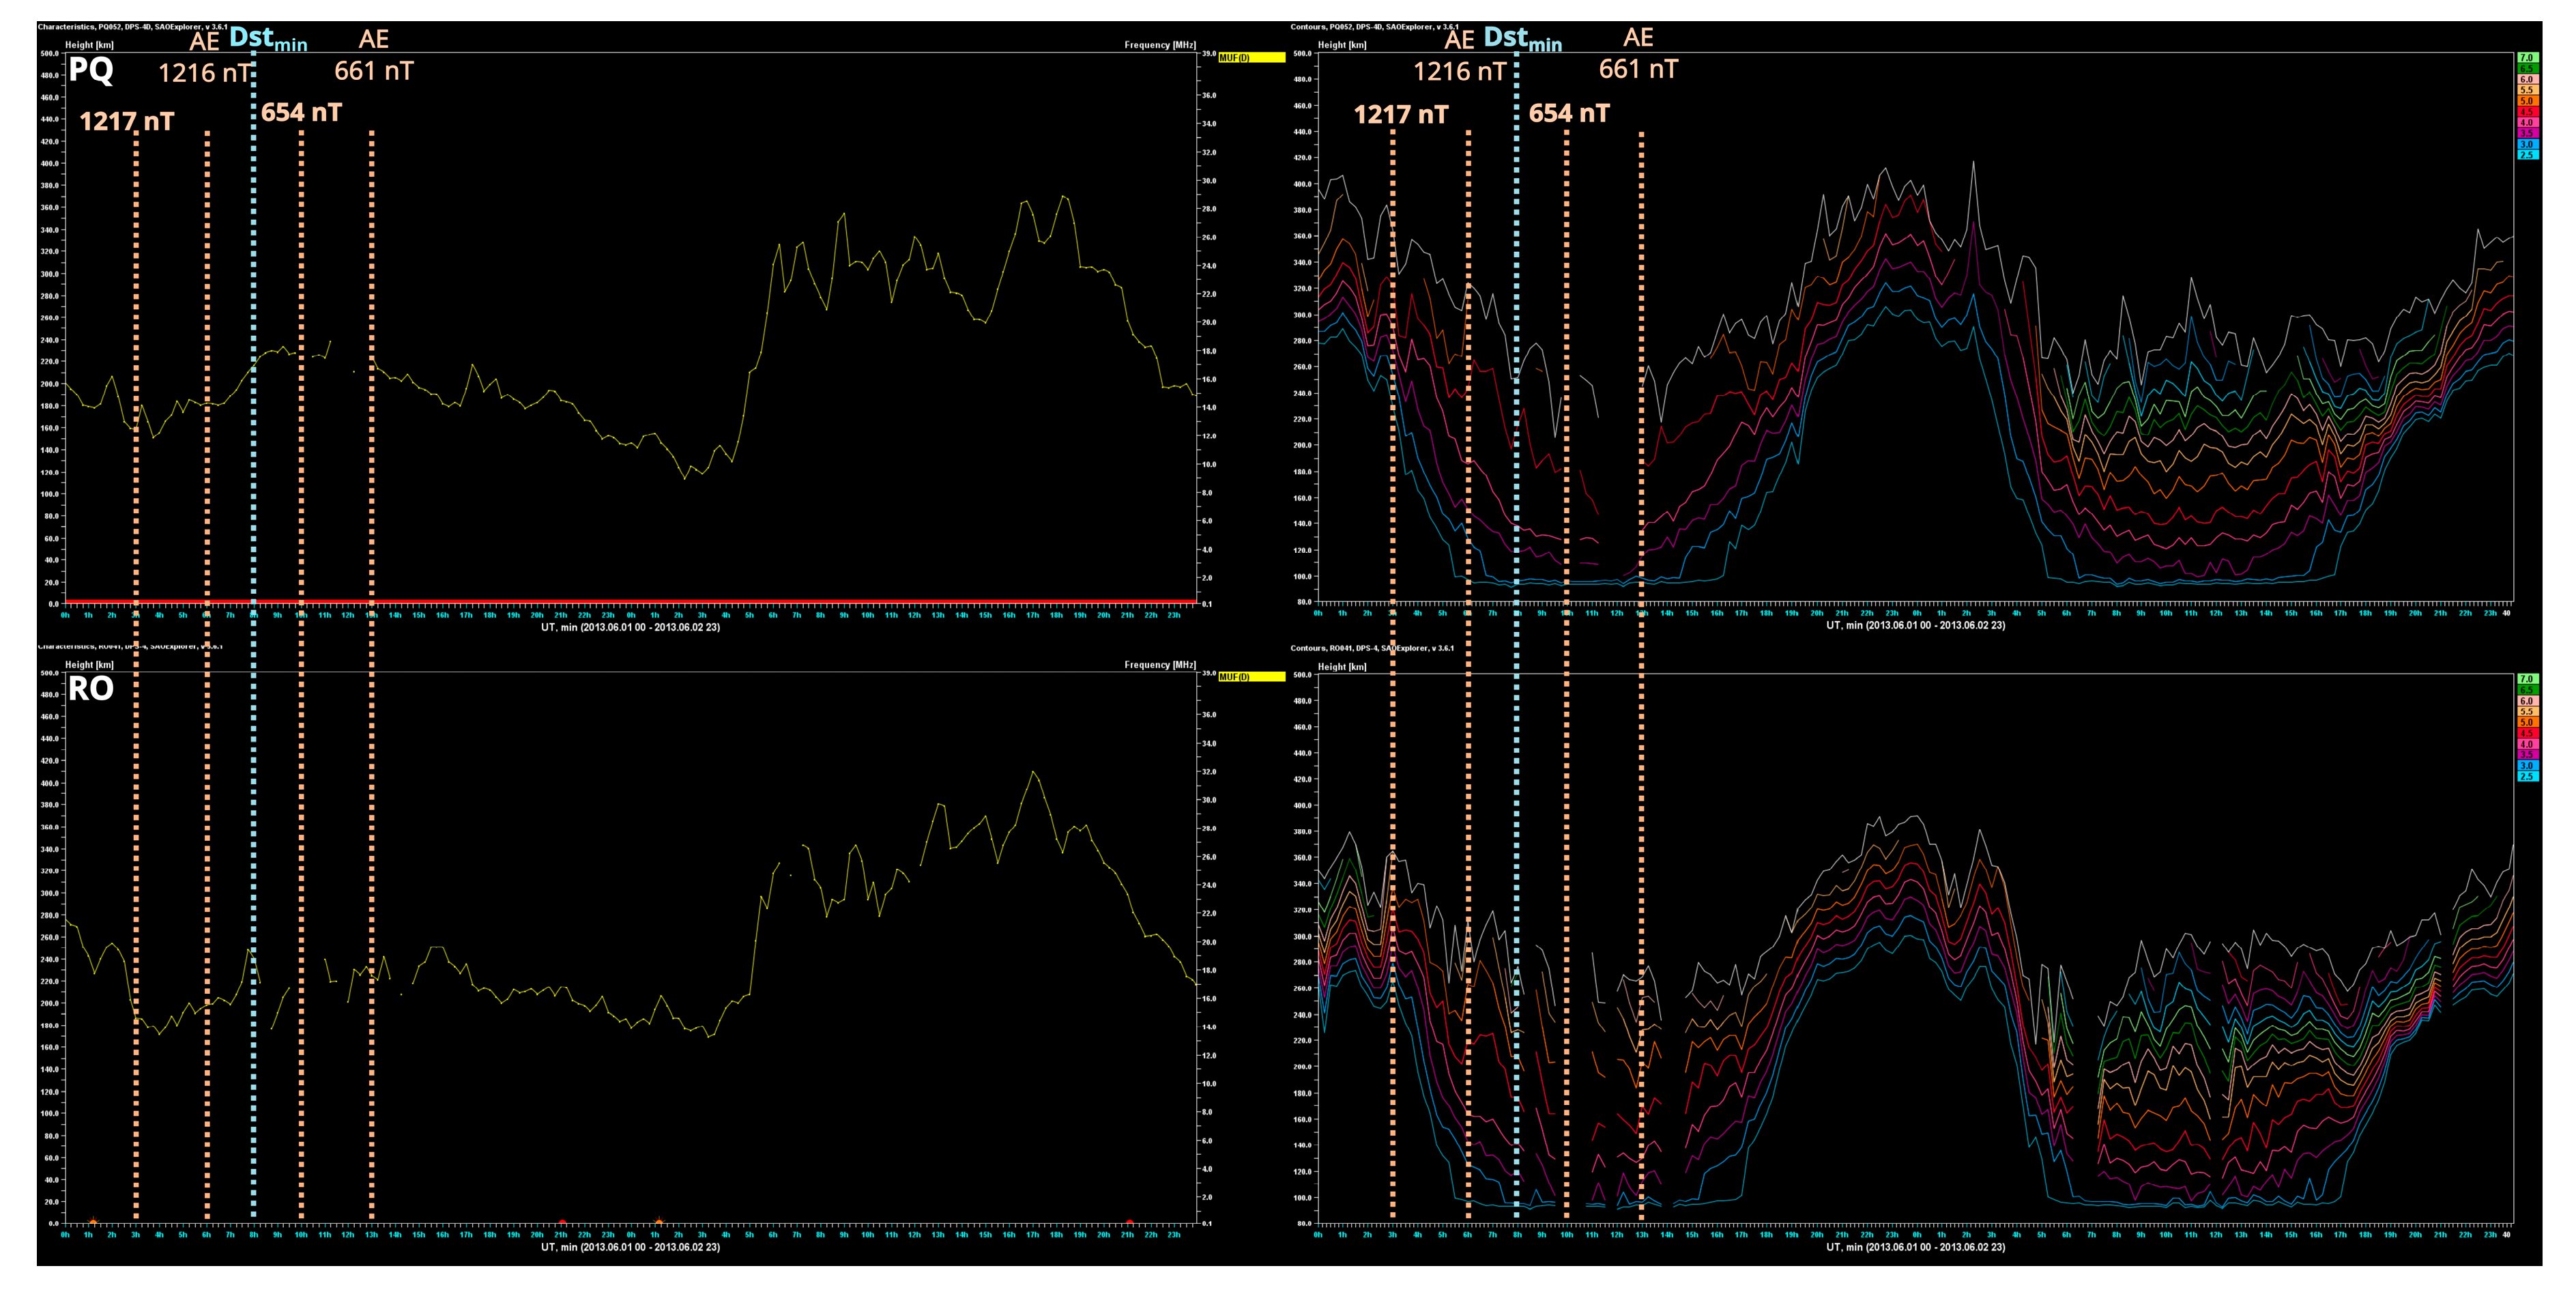
On Figure 10 and Figure 11 we plotted the MUF(D) parameter and the isodensity data from the main and early recovery phase of the storms. In the foF2 parameter on Figure 5 we found signatures of wavelike features (TADs) therefore to prove their presence, we analyze also the MUF and isodensity data. In these data these wavelike features are nicely can be seen. The main source of them is the auroral heating during the geomagnetic storm, therefore we indicate the peaks in the AE index on these figures.
The direct distance between Pruhonice and Rome is 923,1 km. The maximal peek in Rome at 12:00 in foF2 (with 12.475 MHz) happened 30 min after the peak at 11:30 (with 12.12 MHz), the calculated speed for the observed TAD on Figure 5, Figure 10 and Figure 11 is ~512.8 m/s.

4. Discussion

Despite the basic physics of the F2 mid-latitude ionosphere is known [17], the impact of the single geomagnetic storm is currently not predictable due to the dependence of different factors: geomagnetic storm intensity, SSC time, LT, geomagnetic latitude, the past state of the Thermosphere-Ionosphere system and the past history of the geomagnetic activity.
Here we have analyzed and discussed the possible mechanisms which are leading the processes in the ionospheric F2-layer in the European sector during different types of geomagnetic storms.
From the comparison of the observations from the two ionosondes located in Rome we can conclude that the RO AIS and DPS ionosondes measure the same values, therefore in the following figures we have plotted only the data of DPS Digisonde.
As another main objective of this study, we have analyzed three station data from Europe during two geomagnetic storm events, one ICME-driven and one SIR/CIR-driven event. For this purpose we have calculated the deltafoF2 and deltahF2, which represent the storm-time value in percentage. Besides, for this purpose we checked also the TIMED/GUVI measured [O]/[N2] ratio, and the rTEC data. For the ICME-driven storm case we have examined the background condition: IMF Bz turned southward two times after the SSC, from 06 to 09 UT and between 12 to 06 UT of 18th March (for ca. 18 hours), the SW speed oscillated between 550-650 km/s, the AE index maximum was almost 1600 nT at 13 UT with maximum Kp of 7.67 on 17th March in the main phase of the storm. The condition during the SIR/CIR-driven storm: the IMF Bz had one long southward turning between 00-07 UT (7 hours) on 01st June, the SW speed started to increase from 400 up to 680 km/s the same day from 06 to 12 UT and reached its maximum with 770 km/s on 2nd June. The maximal Kp value was 7.00 at 06 UT, while in the AE index the maximum was at 03 and 06 UT with 1200 nT in the main phase of the geomagnetic storm (which lasted until 08 UT on 1st June).
In both cases, during the longer Bz southward turning period the maximal AE, Kp and Dst index values are reached and in the ionosphere during these intervals the ICME-driven storm cause significant latitude dependent positive ionospheric storm phase, which around the end of this Bz period, turned into extremely negative during the night hours.
For the St. Patrick’s Day storm after the first increase of AE index at 06-09 UT on 17th March an foF2 positive phase in the three stations is observed more closely in time in Pruhonice and Sopron and with some delay in Rome indicating the passage of a Travelling Atmospheric Disturbance (TAD). A nighttime negative phase is seen in all the stations that is prolonged during daytime of 18th March for Pruhonice, the higher geomagnetic latitude station. Looking at TIMED/GUVI observations a decrease of [O]/[N2] is seen at high latitude of the Northern hemisphere that can explain the daytime negative storm in Pruhonice. A decreased [O]/[N2] ratio is kept on 18th -20th March (see Figure 7a) and this is presumably due to the transfer of the disturbed neutral composition from the auroral zone during nighttime hours when the thermospheric wind is equatorward. Therefore that was a classic two-phase storm effect normally taking place when a severe ICME induced geomagnetic storm [50].
During the SIR/CIR-driven event a slight negative phase is seen in Pruhonice and Sopron while in Rome (lower latitude) a positive ionospheric storm phase is recorded from 19 UT on 01st June to 03 UT on 02nd June. A sharp decrease was registered in the deltafoF2 data in all stations, at the Bz southward turning period, reaching its most negative value with -40% at the exact time when the Bz turned back northward around 08 UT on 01st June. It should be stressed that during summer months, the thermospheric circulation is pre-eminently equatorward, and the disturbed thermospheric composition is able to reach the Rome latitude [51].
Additionally, when we look at the rTEC data we can see the equatorward movement of the negative phase region, in accordance with what we observed with the ionosondes. In the study of Berényi et al. [25] we determined for the 2015 March case that this equatorward propagating negative region is related to the midlatitude/main ionospheric trough (MIT), which is the ionospheric footprint of the plasmapause (PP) (see for more [52]). Therefore, during that case on these data, we observed the shrinking of the plasmasphere because of the generally known process of a geomagnetic disturbance ([53]). For the SIR/CIR-driven 2013 June storm we propose, that in the deltafoF2 and rTEC data we see the equatorward propagation of a daytime MIT in the early recovery storm phase, which was seen as the equatorward movement of a latitudinally elongated negative phase. This negative phase was deepened by the depleted thermospheric [O]/[N2] ratio. In future study, to validate our assumption digisonde drift, zonal wind data, satellite electron and neutral density observations and temperature or Horizontal Wind Model 2007 (HWM07, [39]) data is required, which would show westward plasma drift with ~400 m/s if this feature is linked to an MIT ([25,52]).
The negative phases observed in deltafoF2 (Figure 5, upper plots) during both storms show the uplifting of the F2 layer (Figure 5, lower plots) and the daytime [O]/[N2] ratio decrease (Figure 7), in agreement with the storm mechanism mid-latitude daytime F2 layer. The main cause of a negative ionospheric storm is indeed related to the decreased [O]/[N2] ratio, which is generated by the storm-time Joule-heating leading to the formation of a composition disturbance zone (with decreased [O]/[N2] rate) this zone is transported by the enhanced equatorward thermospheric meridional winds ([18,45,54,55,56]). This process and the equatorward motion of the MIT have different time courses, but they can interact with each other leading to a more pronounced F2 layer electron density decrease.
To highlight the main difference between the ionospheric effect of the two types of geomagnetic storms it can be stated that the ICME-driven storms tend to trigger the formation of TADs (see Figure 10) due to the presence of SSC, while this aspect is absent in the case of SIR/CIR-driven storms (see Figure 11). We noticed also that for what concerns ICME, as expected latitude dependent ionospheric effects are seen, while during the SIR/CIR-driven case we do not see any significant latitude dependence over the analyzed European ionosonde stations. However, this could be due to the different seasons that in the latter case allow the disturbed composition to reach the Rome latitude.

5. Conclusions

As part of this study, we have compared three types of ionosonde instruments in Europe, namely the PQ DPS-4D, the SO VISRC-2 and the RO AIS-INGV. For this purpose we have compared the foF2 and h’F2 values during quiet days and the deltafoF2 and the deltahF2 parameters during storm-time. Another main objective was to determine the similarities and differences in the ionospheric deltafoF2 and deltahF2 parameters during an ICME- and a SIR/CIR-driven event. The main conclusions of our study are as follows::
  • From the comparison of the data provided by the ionosondes we can conclude that the RO AIS and DPS type of ionosonde measure the same values.
  • The quiet mean foF2 and h’F2 curves from each ionosonde indicate that the instrument type does not result in any noticeable differences in the data.
  • Due to the SSC that characterized the ICME-driven storms a TAD is launched on 17th March, as seen in the ionospheric parameters across all analyzed stations, this phenomenon is not observed during the SIR/CIR related other geomagnetic storm.
  • The electron density variations show significant latitude dependence during the main and early recovery phase of the St. Patrick’s Day storm, while there is no latitude dependence in data in the June 2013 storm. This difference may be attributed to the different seasons rather than the different drivers. During summer the background thermospheric circulation is equatorward and brings disturbed composition up to the Rome latitude, while during the St. Patrick’s Day storm the disturbed composition with a decreased [O]/[N2] ratio is locked at the latitude of Pruhonice and Sopron.
  • The deltahF2 parameter shows latitude dependence only when the F2-layer is uplifting due to the storm-time processes arising from the auroral region. This is observed during the night of 17th /18th March and during the day of 01st June.
  • The TIMED/GUVI decrease [O]/[N2] ratio during daytime confirms that the negative storm observed in the electron density is due to a variation in the thermospheric composition, especially for the SIR/CIR-driven event on 01st June.
  • The equatorward movement of the negative ionospheric storm phase is detected with rTEC in agreement with the observed F2-layer plasma depletion during both cases. This indicates the presence of a nighttime MIT for the ICME-driven event and a daytime MIT for the SIR/CIR-driven event. For the SIR/CIR case this statement requires validation with other data sources, such as digisonde drift and satellite data.

Supplementary Materials

The following supporting information can be downloaded at the website of this paper posted on Preprints.org.

Author Contributions

KAB was the main writer of the article, which contained the preparation of the event, manual scaling of ionosonde data, figure making and discussion of the results. VB helped in the preparation of the manuscript and reviewed the paper. LP, DS, CS, AI provided manually scaled ionosonde data from Rome station and along with ÁK gave ideas and reviewed some parts of the manuscript. Therefore, every author of this manuscript contributed substantially to this study. All authors have read and agreed to the published version of the manuscript.

Funding

The contribution of VB was supported by OTKA, Hungarian Scientific Research Fund (grant no. PD 141967) of the National Research, Development and Innovation Office and by Bolyai Fellowship (GD, no. BO/00461/21). Furthermore, this work was supported by the GINOP-2.3.2-15-2016-00003 project and a hungarian funding no. SA-95/2021.

Data Availability Statement

The data used in this study was mostly publicly available. SC time were from: GFZ Potsdam, Germany: https://www.gfz-potsdam.de/kp-index and ISGI, Spain (International Service of Geo-magnetic Indices): http://isgi.unistra.fr/data_download.php. The ICME source dates were from these sites: https://kauai.ccmc.gsfc.nasa.gov/CMEscoreboard/; http://www.srl.caltech.edu/ACE/ASC/DATA/level3/icmetable2.htm. The CIR, HSS catalogues, which were used for this analysis, available on https://www.helcats-fp7.eu/ and https://helioforecast.space/sircat websites. Solar and geomagnetic indexes are from https://omniweb.gsfc.nasa.gov/form/dx1.html websites and the Dst-, AE- index and Dstmin times are from http://wdc.kugi.kyoto-u.ac.jp/wdc/Sec3.html and OMNIWeb (https://omniweb.gsfc.nasa.gov/form/dx1.html sites. For ionosonde data at Sopron station, see the following websites: http://iono.nck.ggki.hu/ionogif/latest.html and http://reec.hu/iono.php (all accessed on 27/05/2024).

Acknowledgments

We thank the data centers (OMNIWEB and WDC for Geomagnetism, Kyoto) and the Széchenyi István Geophysical Observatory at Nagycenk, Hungary, Rome (RO041; RM041), Pruhonice (PQ052) station for supplying high quality ionosonde and digisonde data for the research. SSC data are partly from Observatori de l’Ebre (OE, Spain). Data of the observatories have been obtained from INTERMAGNET source. We thank the national institutes that support them and INTERMAGNET for promoting high standards of magnetic observatory practice. (www.intermagnet.org). The GUVI instrument was designed and built by The Aerospace Corporation and The Johns Hopkins University. The Principal Investigator is Dr. Andrew B. Christensen and the Chief Scientist and co-PI is Dr. Larry J. Paxton. The GUVI data used here are provided through support from the NASA MO&DA program. GNSS RINEX files for the GNSS-TEC processing are provided from many organizations listed by the webpage (http://stdb2.isee.nagoya-u.ac.jp/GPS/GPS-TEC/gnss_provider_list.html). Also we are grateful to the reviewers for their valuable advice, which improved our article.

Conflicts of Interest

The authors declare no conflict of interest.

References

  1. N. U. Crooker and E. W. Cliver, “Postmodern view of M-regions,” J Geophys Res Space Phys, vol. 99, no. A12, pp. 23383–23390, Dec. 1994. [CrossRef]
  2. G. Burns, S. C. G. Burns, S. C. Solomon, W. Wang, L. Qian, Y. Zhang, and L. J. Paxton, “Daytime climatology of ionospheric NmF2 and hmF2 from COSMIC data,” J Geophys Res Space Phys, vol. 117, no. A9, p. 9315, Sep. 2012. [CrossRef]
  3. Y. Kamide, “Interplanetary and magnetospheric electric fields during geomagnetic storms: what is more important, steady-state fields or fluctuating fields?,” J Atmos Sol Terr Phys, vol. 63, no. 5, pp. 413–420, Mar. 2001. [CrossRef]
  4. D. Buresova, J. Lastovicka, P. Hejda, and J. Bochnicek, “Ionospheric disturbances under low solar activity conditions,” Advances in Space Research, vol. 54, no. 2, pp. 185–196, 2014. [CrossRef]
  5. G. M. Chen, J. Xu, W. Wang, J. Lei, and A. G. Burns, “A comparison of the effects of CIR- and CME-induced geomagnetic activity on thermospheric densities and spacecraft orbits: Case studies,” J Geophys Res Space Phys, vol. 117, no. A8, p. 8315, Aug. 2012. [CrossRef]
  6. M. H. Denton et al., “Geomagnetic storms driven by ICME- and CIR-dominated solar wind,” J Geophys Res Space Phys, vol. 111, no. A7, pp. 7–07, Jul. 2006. [CrossRef]
  7. B. T. Tsurutani et al., “Corotating solar wind streams and recurrent geomagnetic activity: A review,” J Geophys Res Space Phys, vol. 111, no. 7, Jul. 2006. [CrossRef]
  8. N. E. Turner, W. D. Cramer, S. K. Earles, and B. A. Emery, “Geoefficiency and energy partitioning in CIR-driven and CME-driven storms,” J Atmos Sol Terr Phys, vol. 71, no. 10–11, pp. 1023–1031, Jul. 2009. [CrossRef]
  9. B. A. Emery, I. G. Richardson, D. S. Evans, and F. J. Rich, “Solar wind structure sources and periodicities of auroral electron power over three solar cycles,” J Atmos Sol Terr Phys, vol. 71, no. 10–11, pp. 1157–1175, Jul. 2009. [CrossRef]
  10. R. C. Allen, G. C. Ho, L. K. Jian, G. M. Mason, S. K. Vines, and D. Lario, “Predictive Capabilities and Limitations of Stream Interaction Region Observations at Different Solar Longitudes,” Space Weather, vol. 18, no. 4, Apr. 2020. [CrossRef]
  11. S. T. Wadley and R. Bingham, “THE STORM TIME RESPONSE OF THE INNER MAGNETOSPHERE DURING CORONAL MASS EJECTION AND COROTATING INTERACTION REGION DRIVEN STORMS,” 2019.
  12. M. Mendillo and C. Narvaez, “Ionospheric storms at geophysically-equivalent sites – Part 1: Storm-time patterns for sub-auroral ionospheres,” Ann. Geophys, vol. 27, pp. 1679–1694, 2009, Accessed: Jun. 13, 2017. [Online]. Available: www.ann-geophys.net/27/1679/2009/.
  13. M. Mendillo and C. Narvaez, “Ionospheric storms at geophysically-equivalent sites - Part 2: Local time storm patterns for sub-auroral ionospheres,” Ann Geophys, vol. 28, no. 7, pp. 1449–1462, 2010. [CrossRef]
  14. Y. Chi, C. Shen, B. Luo, Y. Wang, and M. Xu, “Geoeffectiveness of Stream Interaction Regions From 1995 to 2016,” Space Weather, vol. 16, no. 12, pp. 1960–1971, Dec. 2018. [CrossRef]
  15. N. Gopalswamy, “Solar connections of geoeffective magnetic structures,” 2008. [CrossRef]
  16. H. Rishbeth and P. R. Field, “Latitude and solar-cycle patterns in the response of the ionosphere F2-layer to geomagnetic activity,” Advances in Space Research, vol. 20, no. 9, pp. 1689–1692, 1997. [CrossRef]
  17. G. W. Prolss, Physics of the Earth’s Space Environment: An Introduction. Springer Berlin Heidelberg, 2004. [CrossRef]
  18. M. J. Buonsanto, “Ionospheric storms – A review,” Space Sci Rev, vol. 88, no. 3–4, pp. 563–601, 1999. [CrossRef]
  19. M. Mendillo, “Storms in the ionosphere: Patterns and processes for total electron content,” Reviews of Geophysics, vol. 44, no. 4, pp. 1–47, 2006. [CrossRef]
  20. E. A. Kumar and S. Kumar, “Geomagnetic Storm Effect on F2-Region Ionosphere during 2012 at Low-and Mid-Latitude-Latitude Stations in the Southern Hemisphere,” Atmosphere (Basel), vol. 13, no. 3, p. 480, Mar. 2022. [CrossRef]
  21. D. Burešová and J. Laštovička, “Pre-storm enhancements of foF2 above Europe,” Advances in Space Research, vol. 39, no. 8, pp. 1298–1303, 2007. [CrossRef]
  22. A. D. Danilov and J. Lastovicka, “Effects of geomagnetic storms on the ionosphere and atmosphere,” International Journal of Geomagnetism and Aeronomy, vol. 2, no. 3, 2001.
  23. C. Zhai, S. Tang, W. Peng, X. Cheng, and D. Zheng, “Driver of the Positive Ionospheric Storm over the South American Sector during 4 November 2021 Geomagnetic Storm,” Remote Sensing 2023, Vol. 15, Page 111, vol. 15, no. 1, p. 111, Dec. 2022. [CrossRef]
  24. R. Bojilova and P. Mukhtarov, “Response of the electron density profiles to geomagnetic disturbances in January 2005,” Studia Geophysica et Geodaetica, vol. 63, no. 3, pp. 436–454, Jul. 2019. [CrossRef]
  25. K. A. Berényi, B. Heilig, J. Urbář, D. Kouba, Kis, and V. Barta, “Comprehensive analysis of the ionospheric response to the largest geomagnetic storms from solar cycle 24 over Europe,” Frontiers in Astronomy and Space Sciences, vol. 10, p. 1092850, Apr. 2023. [CrossRef]
  26. T. J. Immel and A. J. Mannucci, “Ionospheric redistribution during geomagnetic storms,” J Geophys Res Space Phys, vol. 118, no. 12, pp. 7928–7939, 2013. [CrossRef]
  27. E. Zuccheretti, G. Tutone, U. Sciacca, C. Bianchi, and B. James Arokiasamy, “The new AIS-INGV digital ionosonde,” ANNALS OF GEOPHYSICS, vol. 46, no. 4, 2003, Accessed: May 30, 2024. [Online]. Available: https://www.earth-prints.org/handle/2122/986.
  28. V. Romano, J. A. Baskaradas, F. Doumaz, M. Pezzopane, U. Sciacca, and E. Zuccheretti, “The New AIS-INGV Ionosonde at Italian Antarctic Observatory”, Accessed: May 30, 2024. [Online]. Available: https://www.earth-prints.org/handle/2122/4079.
  29. I. Krasheninnikov, M. Pezzopane, and C. Scotto, “Application of Autoscala to ionograms recorded by the AIS-Parus ionosonde,” Comput Geosci, vol. 36, no. 5, pp. 628–635, May 2010. [CrossRef]
  30. Upper atmosphere physics and radiopropagation Working Group et al., “Electronic Space Weather upper atmosphere database (eSWua) - HF data, version 1.0. Istituto Nazionale di Geofisica e Vulcanologia (INGV).
  31. Upper atmosphere physics and radiopropagation Working Group et al., “Electronic Space Weather upper atmosphere database (eSWua) - HF validated data (Version 1.0). Istituto Nazionale di Geofisica e Vulcanologia (INGV).
  32. A. B. Christensen et al., “Initial observations with the Global Ultraviolet Imager (GUVI) in the NASA TIMED satellite mission,” J Geophys Res Space Phys, vol. 108, no. A12, Dec. 2003. [CrossRef]
  33. G. Crowley et al., “Global thermosphere-ionosphere response to onset of 20 November 2003 magnetic storm,” J Geophys Res Space Phys, vol. 111, no. 10, Oct. 2006. [CrossRef]
  34. K. A. Berényi, V. Barta, and Kis, “Midlatitude ionospheric F2-layer response to eruptive solar events-caused geomagnetic disturbances over Hungary during the maximum of the solar cycle 24: A case study,” Advances in Space Research, vol. 61, no. 5, pp. 1230–1243, Mar. 2018. [CrossRef]
  35. V. Barta, R. Natras, V. Srećković, D. Koronczay, M. Schmidt, and D. Šulic, “Multi-instrumental investigation of the solar flares impact on the ionosphere on 05–06 December 2006,” Front Environ Sci, vol. 10, p. 1174, Aug. 2022. [CrossRef]
  36. J. S. R. Zhang, Y. Zhang, W. Wang, and O. P. Verkhoglyadova, “Geospace system responses to the St. Patrick’s Day storms in 2013 and 2015,” J Geophys Res Space Phys, vol. 122, no. 6, pp. 6901–6906, Jun. 2017. [CrossRef]
  37. Liu et al., “Profiles of ionospheric storm-enhanced density during the 17 March 2015 great storm,” J Geophys Res Space Phys, vol. 121, no. 1, pp. 727–744, Jan. 2016. [CrossRef]
  38. S. R. Zhang et al., “Observations of ion-neutral coupling associated with strong electrodynamic disturbances during the 2015 St. Patrick’s Day storm,” J Geophys Res Space Phys, vol. 122, no. 1, pp. 1314–1337, Jan. 2017. [CrossRef]
  39. C. Huang, J. Y. Xu, X. X. Zhang, D. D. Liu, W. Yuan, and G. Y. Jiang, “Mid-latitude thermospheric wind changes during the St. Patrick’s Day storm of 2015 observed by two Fabry-Perot interferometers in China,” Advances in Space Research, vol. 61, no. 7, pp. 1873–1879, Apr. 2018. [CrossRef]
  40. P. Prikryl et al., “GPS phase scintillation at high latitudes during the geomagnetic storm of 17–18 March 2015,” J Geophys Res Space Phys, vol. 121, no. 10, pp. 10,448-10,465, Oct. 2016. [CrossRef]
  41. W. Li et al., “Radiation belt electron acceleration during the 17 March 2015 geomagnetic storm: Observations and simulations,” J Geophys Res Space Phys, vol. 121, no. 6, pp. 5520–5536, Jun. 2016. [CrossRef]
  42. B. Nava et al., “Middle- and low-latitude ionosphere response to 2015 St. Patrick’s Day geomagnetic storm,” J Geophys Res Space Phys, vol. 121, no. 4, pp. 3421–3438, Apr. 2016. [CrossRef]
  43. C. Nayak, L. C. Tsai, S. Y. Su, I. A. Galkin, R. G. Caton, and K. M. Groves, “Suppression of ionospheric scintillation during St. Patrick’s Day geomagnetic super storm as observed over the anomaly crest region station Pingtung, Taiwan: A case study,” Advances in Space Research, vol. 60, no. 2, pp. 396–405, 2017. [CrossRef]
  44. C. Nayak et al., “Peculiar features of the low-latitude and midlatitude ionospheric response to the St. Patrick’s Day geomagnetic storm of 17 March 2015,” J Geophys Res Space Phys, vol. 121, no. 8, pp. 7941–7960, Aug. 2016. [CrossRef]
  45. E. Astafyeva, I. Zakharenkova, and M. Förster, “Ionospheric response to the 2015 St. Patrick’s Day storm: A global multi-instrumental overview,” Journal of Geophysical Research A: Space Physics, vol. 120, no. 10, pp. 9023–9037, Oct. 2015. [CrossRef]
  46. C. C. Wu et al., “The first super geomagnetic storm of solar cycle 24: ‘the St. Patrick’s day event (17 March 2015)’ Global Data Systems for the Study of Solar-Terrestrial Variability 3. Space science,” Earth, Planets and Space, vol. 68, no. 1, pp. 1–12, Dec. 2016. [CrossRef]
  47. A. Berényi, A. Opitz, Zs. Dálya, Á. Kis, and V. Barta, “Impact of ICME- and SIR/CIR-Driven Geomagnetic Storms on the Ionosphere over Hungary,” Atmosphere 2023, Vol. 14, Page 1377, vol. 14, no. 9, p. 1377, Aug. 2023. [CrossRef]
  48. J. M. Forbes, “Dynamics of the Thermosphere,” Journal of the Meteorological Society of Japan. Ser. II, vol. 85B, pp. 193–213, 2007. [CrossRef]
  49. Shinbori, Y. Otsuka, T. Sori, T. Tsugawa, and M. Nishioka, “Temporal and Spatial Variations of Total Electron Content Enhancements During a Geomagnetic Storm on 27 and 28 September 2017,” J Geophys Res Space Phys, vol. 125, no. 7, Jul. 2020. [CrossRef]
  50. V. Mikhailov, L. Perrone, and N. V. Smirnova, “Two types of positive disturbances in the daytime mid-latitude F2-layer: Morphology and formation mechanisms,” J Atmos Sol Terr Phys, vol. 81–82, pp. 59–75, Jun. 2012. [CrossRef]
  51. Ippolito, L. Perrone, C. Plainaki, and C. Cesaroni, “Investigating the foF2 variations at the Ionospheric Observatory of Rome during different solar cycles minimums and levels of geomagnetic activity,” Journal of Space Weather and Space Climate, vol. 10, 2020. [CrossRef]
  52. Heilig et al., “Relation of the Plasmapause to the Midlatitude Ionospheric Trough, the Sub-Auroral Temperature Enhancement and the Distribution of Small-Scale Field Aligned Currents as Observed in the Magnetosphere by THEMIS, RBSP, and Arase, and in the Topside Ionosphere by Swarm,” J Geophys Res Space Phys, vol. 127, no. 3, p. e2021JA029646, Mar. 2022. [CrossRef]
  53. W. Baumjohann and R. A. Treumann, Basic space plasma physics: Revised Edition. 2012. [CrossRef]
  54. G. W. Prölss and U. von Zahn, “Esro 4 Gas Analyzer results 2. Direct measurements of changes in the neutral composition during an ionospheric storm,” J Geophys Res, vol. 79, no. 16, pp. 2535–2539, Jun. 1974. [CrossRef]
  55. Mikhailov, M. Skoblin, and M. Forster, “Daytime F2-layer positive storm effect at middle and lower latitudes,” Ann Geophys, 1995. [CrossRef]
  56. G. W. Prölss, “Ionospheric F-region storms,” Handbook of Atmospheric Electrodynamics, vol. 2, no. chap. 8, pp. 195–248, 1995, Accessed: Nov. 02, 2022. [Online]. Available: https://cir.nii.ac.jp/crid/1570291225295033472.
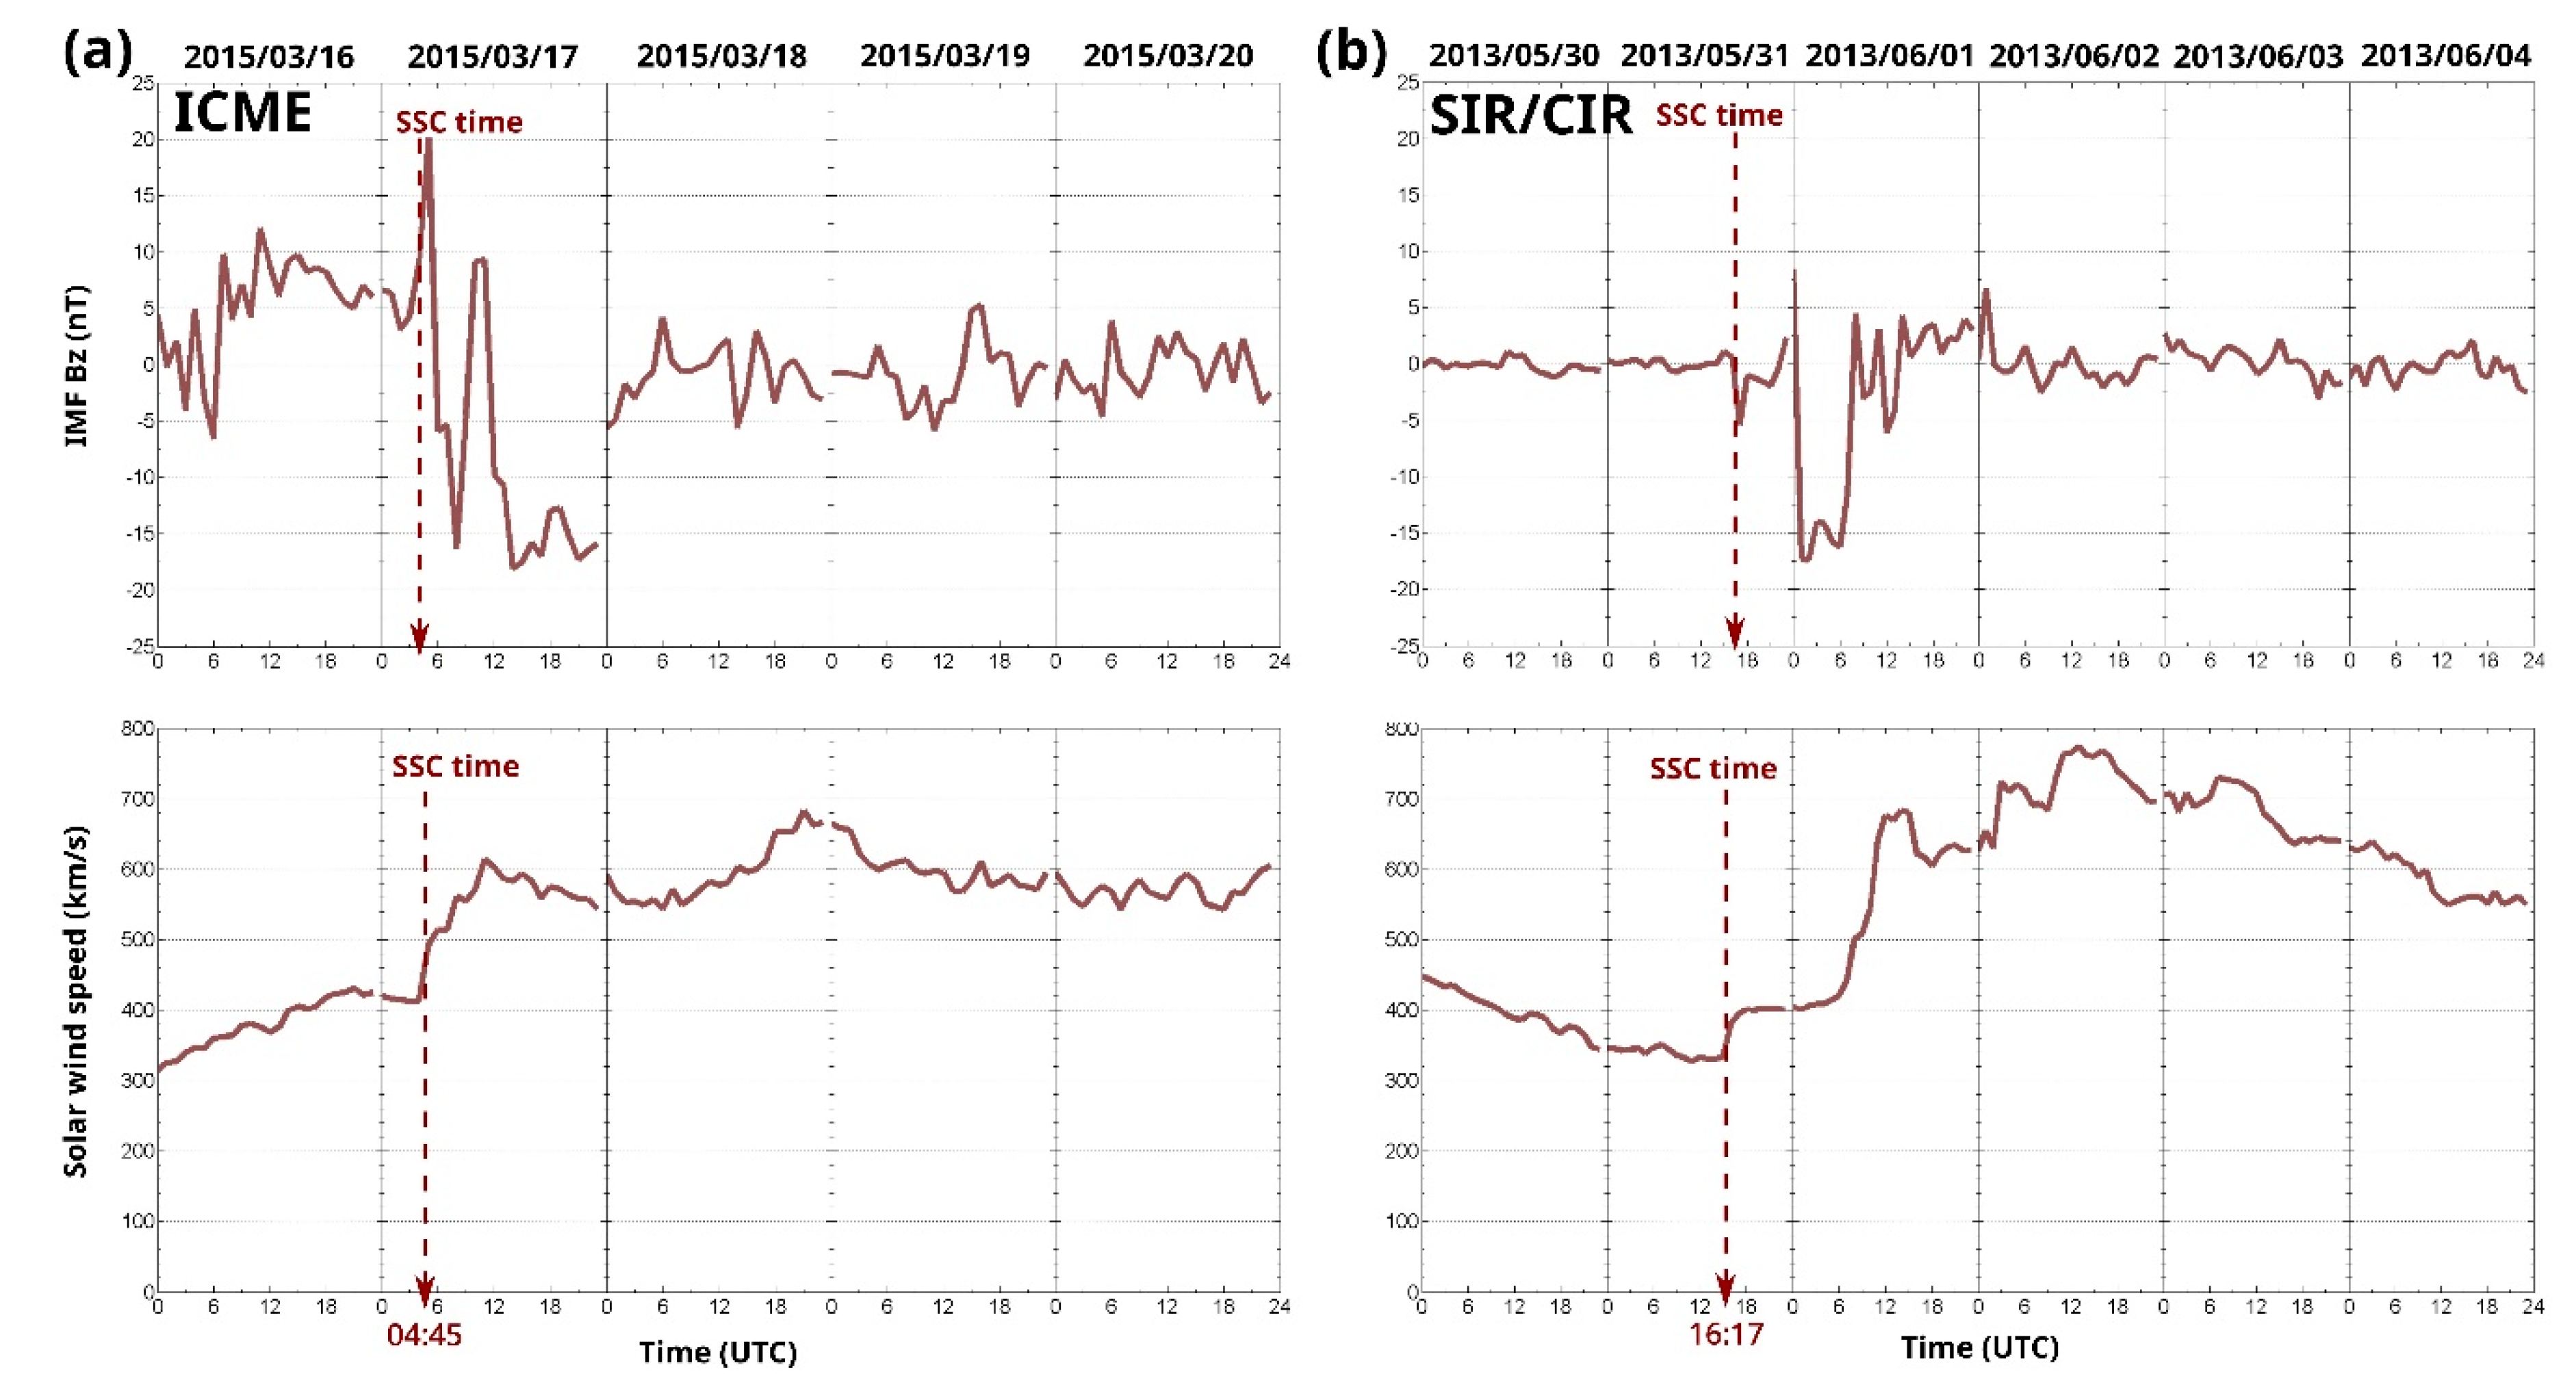
Figure 1. The condition of the interplanetary medium, namely the IMF Bz component on the upper plots and the solar wind speed on the lower plots are portrayed. (a) is for ICME-driven storm from 2015 March, (b) is for SIR/CIR-driven storm from 2013 June. The UT of the SSC was at 16:17 for the 2013 storm and at 04:45 for the 2015 storm, marked with red dotted lines.
Preprints 110214 g001
Figure 2. The geomagnetic Dst, AE and Kp indices (starting from the top) are plotted on this figure. (a) is for ICME-driven storm from 2015 March, (b) is for SIR/CIR-driven storm from 2013 June. The UT of the SSC was at 16:17 for the 2013 storm and at 04:45 for the 2015 storm, marked with red dotted lines.
Preprints 110214 g002
Figure 3. The calculated three quiet day means of foF2 and hF2 parameters for all three stations, by both storms, where (a) show the reference mean values from 2015 March and (b) show the reference mean values from 2013 June.
Preprints 110214 g003
Figure 4. The foF2, h’F2 parameter comparison between the two ionosondes in Rome (Italy) ionospheric observatory: RO041 (DPS type) and RM041 (AIS type) during the (a) ICME- and (b) SIR/CIR-driven storms. Data of 01st and 02nd June 2013 are not shown due a lack of AIS-INGV data during the whole day.
Preprints 110214 g004
Figure 7. TIMED/GUVI [O]/[N2] data for the (a) 2015 and the (b) 2013 storm cases.
Preprints 110214 g007
Figure 8. The rTEC data for the ICME-driven storm case from 2015. We focus on the main phase between 16 UT on 17th and 06 UT on 18th March, when extremely depleted plasma, corresponding to negative deltafoF2, was detected at night at all the ionosonde stations shown in Figure 5. The local noon is indicated by a vertical red line on the plots [49].
Preprints 110214 g008
Figure 9. The rTEC data for the SIR/CIR-driven storm case from 2013. Here we show only the main phase between 02-16 UT on 01st June, when extremely depleted plasma was detected during the day in deltafoF2 at all the ionosonde stations in Figure 5. The local noon is indicated by a vertical red line on the plots [49].
Preprints 110214 g009
Figure 10. The digisonde MUF(D) and isodensity data for the ICME-driven storm case from 2015. Here we show only the main and early recovery phase 17th -18th March, when wavelike anomalies were observed in foF2 data. With orange dotted lines, the AE index peaks are indicated with its values. The light blue dotted line shows the exact time of the Dst minimum value, which show the end of the main phase of the geomagnetic storm.
Preprints 110214 g010
Figure 11. The digisonde MUF and isodensity data for the SIR/CIR-driven storm case from 2013. Here we show only the main and early recovery phase 01st -02nd June, when wavelike anomalies were observed in foF2 data. With orange dotted lines, the AE index peaks are indicated with its values. The light blue dotted line shows the exact time of the Dst minimum value, which shows the end of the main phase of the geomagnetic storm.
Preprints 110214 g011
Table 1. The information about the three ionospheric stations considered in this study. For the geomagnetic coordinates, International Geomagnetic Reference Field (IGRF-13)-model (for the year 2015) based calculator was used.
Name of the station Station ID (ionosonde type) Geomagnetic Latitude (deg) Geomagnetic Longitude (deg) Geographic Latitude (deg) Geographic Longitude (deg)
Middle latitude Pruhonice PQ052 (DPS-4D) 49.32° N 98.61° E 50° N 14.6° E
Sopron SO148 (VISRC-2) 46.67° N 99.75° E 47.63° N 16.72° E
Low mid-latitude Rome RO041 (DPS-4) & RM041 (AIS-INGV) 41.7° N 93.76° E 41.8° N 12.5° E
Table 2. Information about the two examined storms.
ICME-related Reference interval, Q-days (average of these 3 days will be the reference value) SIR/CIR-related Reference interval, Q-days (average of these 3 days will be the reference value)
SSC date Main phase Studied interval SSC date Main phase Studied interval
17.03. 04:45 UT 17.03.2015 (Kpmax=7,67, Dstmin=-223 nT) 16.03-20.03.2015 10, 13, 14 March 2015 05.31. 16:17 UT 01.06.2013 (Kpmax=7.00, Dstmin=-124 nT) 30.05-04.06.2013 16,17, 26 June 2013
Disclaimer/Publisher’s Note: The statements, opinions and data contained in all publications are solely those of the individual author(s) and contributor(s) and not of MDPI and/or the editor(s). MDPI and/or the editor(s) disclaim responsibility for any injury to people or property resulting from any ideas, methods, instructions or products referred to in the content.
Copyright: This open access article is published under a Creative Commons CC BY 4.0 license, which permit the free download, distribution, and reuse, provided that the author and preprint are cited in any reuse.
Prerpints.org logo

Preprints.org is a free preprint server supported by MDPI in Basel, Switzerland.

Subscribe

© 2024 MDPI (Basel, Switzerland) unless otherwise stated