
Submitted:
23 June 2024
Posted:
25 June 2024
Read the latest preprint version here
Abstract
Hydroperoxides (ROOH) are known as damaging agents capable of mediating mutation, while a role as signaling agents through oxidation of protein sulfhydryls that can alter cancer-related pathways has gained traction. Glutathione peroxidase 2 (GPX2) is an antioxidant enzyme that reduces ROOH at the expense of glutathione (GSH). GPX2 is noted for a tendency of large in-creases or decreases in expression levels during tumorigenesis that leads to investigators focusing on its role in cancer. However, GPX2 is only one component of multiple enzyme families that metabolize ROOH and GPX2 levels are often very low in the context of these other ROOH reducing activities. Colorectal cancer (CRC) was selected as a case study for examining GPX2 function as colorectal tissues and cancers are sites where GPX2 is highly expressed. A case can be made for a significant impact of changes in expression levels. There is also a link between GPX2 and NADPH oxidase 1 (NOX1) from earlier studies that is seldom addressed and is discussed, presenting data on a unique association in colon and CRC. Tumor-derived cell lines are quite commonly used for pre-clinical studies involving the role of GPX2 in CRC. Generally, selection for this type of work is limited to identifying cell lines based on high and low GPX2 expression with the standard re-search scheme of overexpression in low expressing lines and suppression in high expressing lines to identify impacted pathways. This overlooks CRC subtypes among cell lines involving a wide range of gene expression profiles and a variety of driver mutation differences along with a large difference in GPX2 expression levels. A trend for low and high GPX2 expressing cell lines to segregate into different CRC subclasses, indicated in this report, suggests that choices based solely on GPX2 levels may provide misleading and conflicting results by disregarding other properties of cell lines and failing to factor in differences in potential protein targets of ROOH. CRC and cell line classification schemes are presented here that were intended to assist workers in performing pre-clinical studies but are largely unnoted in work on GPX2 and CRC. Studies are often initiated on the premise that the transition from normal to CRC is associated with up-regulation of GPX2. This is probably correct. However, the source normal cells for CRC could be almost any colon cell type, some with very high GPX2 levels. These factors are addressed in this study.
Keywords:
selenium-dependent glutathione peroxidase
; peroxiredoxins
; colorectal cancer
; cell lines
; public databases
Seleium-dependent glutathione peroxidase 2 (GPX2) is a member of the GPX family of antioxidant enzymes that reduce peroxides such as H2O2 and fatty acid hydroperoxides (ROOH) at the expense of the tripeptide, glutathione (GSH)[1]. When GPX2 is expressed it is generally in the company of its sister isoenzyme, GPX1, and the peroxiredoxin (PRDX) family of ROOH reducing activites that use thioredoxin as a reducing agent. Since the initial characterization of GPX2 gene expression in the gastrointestinal (GI) tract and other human and rodent tissues, many studies have examined the roles of GPX2 in carcinogenesis in epithelial cells [1,2]. Too often, the full context of antioxidant enzyme families is overlooked leading to claims that GPX2 is having strong effects in cases where its expression is low by comparison [1,2]. There may a basic misconception that the ability to detect the mRNA by RT-PCR, the protein by Western blotting or by immunohistochemistry (IHC) represents significant expression levels by not examining GPX1 or PRDXs [1,2]. In several studies using RT-PCR, GPX2 levels seemed to be at the lower limits of detection (sometimes by comparison to cell lines with established high GPX2 expression levels) and yet the protein was still detectable on Western blots, encouraging the view that GPX2 could be exerting a sigificant impact in this lower range [1,2]. In one instance, GPX2 was shown to be detected in glioblastoma multiform (GBM) by IHC from The Human Protein Atlas (THPA), a cancer that barely expresses GPX2 [1]. The Human Protein Atlas warns that GPX2 antibodies used in that analysis appear to exhibit off target binding (https://www.proteinatlas.org/, as of 5/2024) and declares that, generally, protein was not detected in GBM, while in the detailed comments suggesting that Purkinje cells and not glia show some GPX2 staining in normal samples.
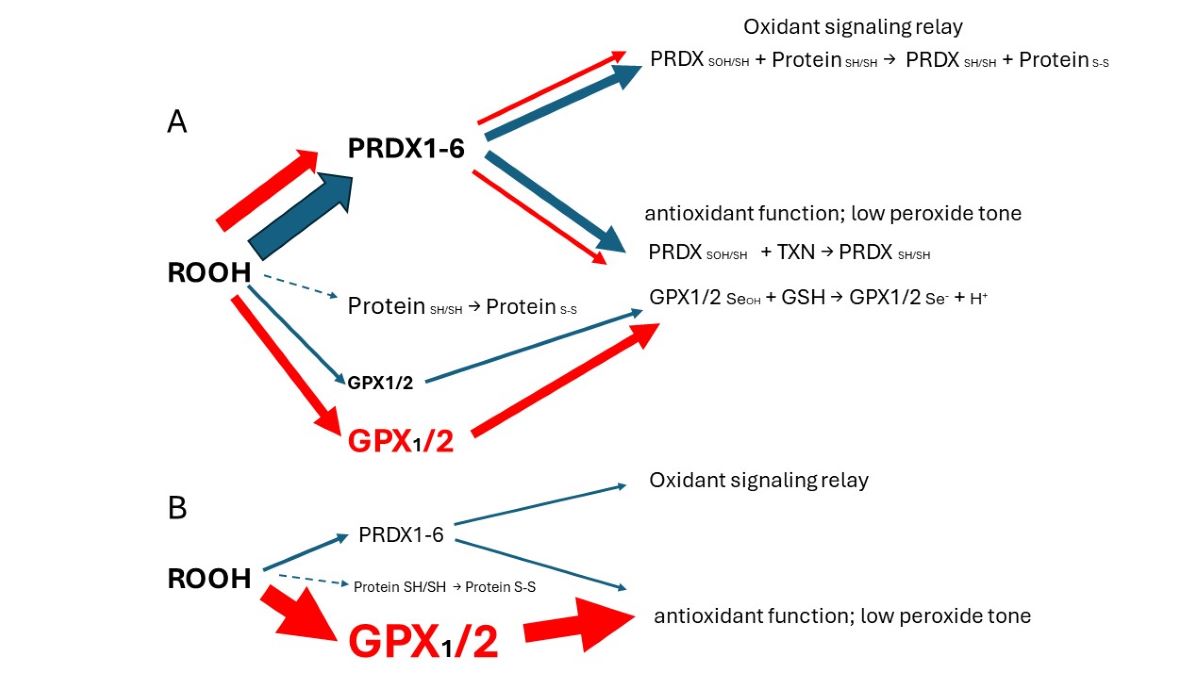
GPX1, with a nearly identical hydroperoxide substrate range, was not included in most of these studies. This is unfortunate because GPX2 expression is often minute compared to GPX1 (GBM) or at best comparable, and the sum of both is often small compared to the ubiquitous peroxiredoxin antioxidant collective (PRDX1-6) [1]. Thus, GPX2 seems to be exerting effects which are not truly explained despite the apparent variation in cellular oxidant levels after manipulation of GPX2 levels [1]. Colon/rectum and colorectal cancer (CRC) are cases where GPX2 levels are high enough to have an impact on ROOH levels. In the overall scheme of ROOH antioxidants, GPX1 and GPX2 seem to act solely as reducing agents, maintaing low peroxide tone. In this context, low peroxide tone means preventing direct oxidation by ROOH and damage to DNA, cell membranes and proteins. PRDXs are postulated to have two general functions. In competition with GPXs, PRDXs would be acting as general antioxidants. Second, PRDXs may act as oxidant relays, eliminating ROOH species as potential damaging agents and safetly registering and conveying the oxidant signal as PRDX-SOH to target proteins (Figure 1) [3,4]. PRDX1 and 2 would tend to dominate ROOH metablism by virtue of high levels of expression and initial ROOH rate constants greater than GPX1 and GPX The mechanism of action of GPX1 and GPX2 at high levels of expression in this model is divertion of ROOH away from the PRDX relay, thereby nonspecifically lowering the impact of ROOH on signaling. This is a real possiblity in CRC, esophageal and stomach cancers as shown in this report. Possible involvement of GPX2 in other cancers was evaluated in ref. [1]. The downstream effects and specifity would be dependant on the general gene expression profile of the cell types. In CRC as many as six general expression profiles are noted. In this investigation cell lines are sorted with the finding that cell lines with low and high GPX2 levels end up in different profile catagories. While this is of interest, the very low expression in some cell lines is at odds with the expression levels of the corresponding CRC types, calling into question their value in studies. A common trope in studies on a GPX2 role in cancer is overexpression in low expressing cell lines and reciprocal knockdown in high expressing cell lines [1,5]. Thus, different downstream effects could arise from the impact of GPX2 in each category based on widely different general gene expression profiles and not a direct specific effect of GPX The goal is to provide some guidance in selecting CRC-derived cell lines to study colorectal cancers in the context of GPX2 expression, specifically selection of certain cell lines to accomplish study of CRC types that tend to relapse and metastasis, avoiding use of cell lines with exceedingly low GPX2 levels. The histological and functional links between superoxide generating NADPH oxidase 1 (NOX1) and GPX2 have been demonstrated in colon/rectum, CRC and, cell lines and are discussed in the context of cell line choices.
Materials and Methods
The primary tool used in this work was internet access to public databases, Cancer Dependency Map consortium (DepMap, https://depmap.org/portal/), The Human Protein Atlas/ The Cancer Genome Atlas (THPA/TCGA, https://www.proteinatlas.org/; https://www.cancer.gov/ccg/research/genome-sequencing/tcga), Gene Expression profile Interactive Analysis (GEPIA2 http://gepia.cancer-pku.cn/), Tumor IMmune Estimation Resource (TIMER2.0, (http://timer.cistrome.org/) and PubMed (https://pubmed.ncbi.nlm.nih.gov/). Analysis spanned the time frame of 1/2024 to 6/2024). The use of data from these sites was previously explored and validated against results from experimental studies with some discrepencies noted [1]. The extrapolation of TPM to protein levels was examined and found to be reasonably consistent [1]. The analysis relied on basic tools accessible to most investigators. Excel was used to collate and process datasets and generate tables and some graphs; GraphPad PRISM 9.3 was used to generate graphs and perform statistical analyses; Microsoft Power Point was used to create figures. The primary analyses involved sorting CRC-derived cell lines, focusing on GPX2 expression levels, into CRC categories based first on marker analyses in Medico et al that provided the biggest set of cell lines (150 with 65 of 77 from DepMap found in common; 5/2024) [6]. While starting with the methods of Sadanandam et al, they sorted additional cell lines with some new markers and weighting [7]. Then, they sorted the 150 lines based on the analyses of Marisa et al, Budinska et al, De Sousa E Melo et al, and Roepman et al [8,9,10,11]. CRC subtype analysis and corresponding cell lines were taken directly from Schlicker et al, Sadanandam et al, Berg et al, and Hu et al (mucinous adenocarcinoma markers) [7,12,13,14]. GPX2, NOX1 and PRDX expression data for cell lines was from DepMap. Because only one value is provided for each cell line, THPA’s somewhat smaller list was consulted to get some sense of the inherent error (56 cell lines in common) for GPX2 and NOX In the text, cell line GPX2 expression levels are presented as the average of DepMap and THPA when both are available. In the figures, only DepMap values are presented, except to correlate with THPA. Marker analysis was performed using a short-hand list from the iCMS system and the combined expression data (average, log2 TPM+1 for markers) [15]. In addition, for HT29, markers associated with differentiation (MUC2 and LYZ), TGFB expression (CCN1, ITGAV, TGFB) and EMT (FN1, CDH2, VIM) were examined [16,17,18]. Statistical analysis was performed for GPX2 expression levels among CRC subtype groupings; Mann-Whitney; log2 transformed data directly from DepMap; PRISM 9.
Results and Discussion
Correlation of GPX2 Levels in Tumors and Cell Lines
To ascribe the importance of antioxidant enzymes that reduce ROOH, it is necessary to demonstrate that the enzyme is present in a significant quantity (Figure 1) [1,2]. The initial characterization of GPX2 to be highly expressed in the gastrointestinal (GI) tract and undetectable in many other tissues by Northern blotting is still valid (Figure 2A) [1,2,19]. Based on results compiled by the TIMER2.0 database, in general agreement with TCGA (ref. [1]), GPX2 is highly expressed at the tissue level in the mid-lower GI (corresponding cancer, TCGA abbr.; colon/rectum, COAD/READ; 457 COAD samples vs. 41 normal and 166 READ samples vs. 10 normal in Figure 1A; 5/2024), bladder (BLCA; 408 vs. 19 normal), esophagus (ESCA; 189 vs. 11 normal), head and neck tissues (HNSC; 520 vs. 44 normal), liver (LIHC; 371 vs. 50 normal), stomach (STAD; 415 vs. 35 normal), in cancerous pancreas (PAAD; 178 vs. 4 normal; median for normal is several logs higher than other database values; ref. [1]) and lung squamous cell carcinoma (LUSC; 501 vs. 51 normal), although at a lower level in lung adenocarcinoma (LUAD; 515 vs. 59 normal) (Figure 2A) [1]. High expression in normal tissues is often confined to a few cell types. The small intestine is a prime example of the limited zone of expression within a high expressing tissue, apparently just the easily recognizable Paneth cells (Figure 3; THPA). This creates one of the problems in analysing GPX2 using tissue level metrics from databases as will be elaborated and is not unique to the GI-tract (Figure 2 and Figure 3) [1].
Cell line GPX2 gene expression levels were compiled on the basis of tissue and cancer of origen (DepMap; 5/2024). As shown in Figure 2B, cell lines derived from COAD/READ as well as from ESCA/STAD have a high median level of GPX2 gene expression, while many cell lines from HNSC and PAAD also have somewhat elevated GPX2 expression, based on median levels. There is some correlation between the respective median tumor levels and median cell lines levels (Figure 2E). The low GPX2 levels in cell lines derived from the high expressing cancer sources, COAD/READ and ESCA/STAD, are somewhat unique among the antioxidant enzyme genes, GPX1 and PRDX1- A few cell lines have lower than expected GPX1 and PRDX levels, but nothing like GPX2 (GPX2, 59/128 low expressing lines (≤64 TPM; ref. [1]); GPX1, 13/128; PRDX1, 0/128; PRDX2, 6/128; PRDX3, 3/128; PRDX4, 6/128; PRDX5, 0/128; PRDX6, 2/128; Figure 4) [1]. The low expression of GPX2 in cell lines could be anticipated for BLCA, HNSC, LICH, and PAAD from the variation observed in tumors and is not explained by variation among COAD/READ and ESCA/STAD samples at the tissue level (Figure 2A).
For a variety of reasons, the relative TPM levels among tissues and cell lines presented represent only a rough guide to thinking about where GPX2 might have a significant role (Figure 2 and Figure 4). One word of caution is made with regards to the GPX TPM data of DepMap and THPA and for work in almost all current papers [1]. The 2 database projects and almost all current published work did not include supplementation of the culture media with selenium (10% FBS/FCS; fetal bovine/calf serum; some rare exceptions in DepMap in combination with low serum for culture) [20]. As a rule, this is suboptimal for GPX1 and GPX2 protein and activity levels in cell lines [1,2,21]. Different batches of serum can have widely different selenium levels, and this will have an impact on the protein and activity levels of both GPX1 and GPX2 and possibly on the mRNA levels of GPX1 [21,22]. GPX1 mRNA levels may be underrepresented in the databases and in studies [1]. Selenium supplementation could conceivably shift up to 8 of the 13 low expressing GPX1 level GI tract-derived cell lines into the high expression range (2-fold increase; see HepG2 in ref. [22]). In studies, the protein and GPX activities will often be up to one-half to one-fourth the optimal levels, the lower activity a feature of cell lines expressing only GPX1 [22]. This could impact the reproducibility of findings and downplay the role of GPX1 in favor of GPX2 [1].
The Choice of CRC-Derived Lines for a Case Study: GPX2 and NOX1
It was reported that the superoxide generating NADPH oxidase, NOX1, is a major source of oxidants to produce ileocolitis in mice deficient in both GPX1 and GPX2 gene expression [23,24]. While mice deficient in both GPX1 and GPX2 (i.e. GPX1/2-DKO; double knockout) have spontaneous ileocolitis (Figure 1B; supporting a lesser role for PRDXs in general antioxidant function), after knocking out NOX1, the triple KO mice no longer have gut pathology. Eliminating the H2O2 generating enzyme, DUOX2 (via a DUOXA KO), relieved crypt/gland base anoikis and inflammation while having no impact on excess crypt/gland base apoptosis observed in the DKO mice. NOX1 mRNA is uniquely, highly expressed in normal and cancerous colorectal tissues (Figure 2C). The same pattern of NOX1 expression is observed in cell lines derived from colorectal cancerous tissues (Figure 2D). It is likely that the indicated colocalization of GPX2 and NOX1 in the crypt/gland epithelium (although not necessarily the same cells) of the intestine allows them to keep balance in the redox status [25,26,27].
Some cells in the colon epithelium have naturally high expression of GPX2 and this seems to carry over into the cancers [28,29,30]. The estimated levels of GPX2 at the mRNA and protein levels in CRC show that they likely exceed that of GPX1 and rival that of PRDX1 and PRDX2, meaning GPX2 could have a major impact on ROOH levels (Figure 4D) [1]. This and the apparent link to NOX1 led to choosing CRC-derived lines as the study case for trying to understand what to consider in selecting lines for cancer studies. The complexity of issues in CRC, the peculiarities of cell line properties and culture methods make this a difficult case study. While this analysis may not completely succeed, the details of the process may be instructive.
Remaining Uncertainties in GPX2 Expression in Normal Colon/Rectum
The reasons for lack of a clear answer to the choice of cell lines include no direct link between the cell types that naturally express GPX2 at high levels and its expression in tumors. Despite decades of characterization, the exact cell expression profile in the colon is unclear [28]. With studies using single-cell profiling of normal colon and CRC available, it should be a simple matter to establish the identity of the normal high GPX2 expressing cells and possibly infer GPX2 expression levels for sources of CRC cells, this based on data from polyps representing an early point in the malignancy continuum [15,31]. Variable co-expression profiles between GPX2 and NOX1 might aid in this process (Figure 2 and Figure 5).
The possible candidates for high GPX2 expression are Paneth cells (Figure 3; mice develop tumors in the small intestine) or the colon equivalent, deep secretory cells (so far, identified in mice and not documented for GPX2 expression) [32]. Refined localization of GPX2 expressing cells in human colon by IHC shows that they represent only a few cells at the base of each gland, paralleling small intestine (Figure 3) [28]. A single-cell analysis did confirm high GPX2 expression in Paneth cells, while being somewhat unclear about other cell types, particularly in colon [33]. Paneth cells are not known to give rise to tumors, although they exhibit plasticity during loss of LGR5+ crypt cells that allows them to gain stem cell properties and repopulate crypts [34,35,36,37]. Whether they retained GPX2 expression in this process was not determined. It is this type of plasticity exhibited across many cell types in the colon during carcinogenesis that lends itself to uncertainty over whether GPX2 is being up regulated and to what extent [35]. Up-regulation would be the default when any cell types outside of the lower crypt/glands are the source of the tumors (Figure 3) [38]. There is some evidence that up regulation of GPX2 mRNA levels on the order of 4-5-fold in stem-like cells occurs during the progress from early lesions to CRC [31]. Similarly, looking at whatever cells are expressing GPX2 protein at high levels in normal colon suggests possible elevation up to 5-fold in protein levels in CRC cells (statistically significant) [28]. However, that determination did not establish any link between the normal cells and the cell types that gave rise to the tumors. If the candidate cells are not the naturally high GPX2 expressing cells, the magnitude of elevation could be tens-hundred-fold, providing a strong rationale for GPX2 impacting tumorigenesis by modulation of ROOH levels. There is ample evidence that an alteration of GPX2 levels from essentially no expression to levels characteristic of most CRC samples (~27% of total antioxidant enzyme TPM; GPXs, PRDXs and catalase) would impact tumor pathways via known redox sensitive proteins, such as PTEN (Figure 1A and Figure 4D) [1,39,40].
The Problems with Databases Combined with the Issues of Normal Cell Expression
Note, the upregulation of GPX2 expression is not being based on data from sites like TCGA/ THPA, TIMER2.0 and GEPIAGEPIA2 data present real problems with exceptionally low GPX2 expression found in many normal samples (Figure 6). This extends to several other genes whose expression is confined to the mucosa as opposed to those expressed in the mucosa and mucularis, like villin vs. β-actin (Figure 6).
TCGA/ THPA and TIMER2.0 tumor databases are consistent in showing CRC tumors as having high GPX2 expression, with only few exceptions (28/597 CRC samples TPM< 256, THPA; TIMER2.0 has ~18/623; Figure 2A). The issue with normal samples in GEPIA2 might stem from the divergent protocols for processing between the 2 sampling sites mentioned in GTEx (https://gtexportal.org/home/), the source of much of the data. For transverse colon, full-thickness samples were analyzed, while for sigmoid colon, only the mucularis was sampled. GPX2 is not expressed outside of the epithelium of the mucosa, except for scattered cancer-associated fibroblasts (CAF) (Figure 3) [28,29,30,41]. It is not clear that this is a complete explanation for the discrepancy between the GEPIA2 data sets and TCGA/THPA and TIMER2. The rectum set does not mention similarly divergent processing protocols and the sample numbers for the alternatively processed colon samples do not add up to the total number of samples listed. TCGA/THPA and TIMER2.0 show much lesser range of increase in GPX2 expression between normal and CRC, on the order of 2-20-fold (see matched sets, ref. 42) with a few matched samples showing a decrease in CRC or no alteration [42].
Part of the issue in comparing normal to CRC using TPM/FPKM or standard IHC presentation (combined intensity and proportion scores), beyond lack of clear identification of the source cells, is the limited numbers of normal high expressing cells and the evident increase in the proportion of expressing tumor cells in CRC samples (tumor purity) (Figure 3 and Figure 7) [28,29,43].
The upper range of the increase in tissue expression of 20-fold could be accounted for by the 4-5-fold increase in cell level expression and a 4-5-fold increase in the relative volume of the expressing cells in tumor samples, although many CRC samples seem to exceed this increase in proportion based on IHC at THPA (Figure 7). None of this might be relevant if the source tumor cells are not represented by the naturally high GPX2 expressing normal cells. The question of source cells is complicated by alterations in the GPX2 protein and mRNA expression pattern observed in mouse colon after dextran sodium sulfate-induced injury. Here, the zone of high expression was expanded to the luminal region showing that many cell types in the colon can produce high GPX2 levels under stress [44]. There may be differences between mice and humans in the range of GPX2 protein expression in ileum and colon. IHC of mice seems to show high levels of protein at the crypt/gland base and moderate levels of protein detected up to the villus tip/lumen, while one IHC study of human samples seems to show expression only in the gland base and in a second the image is in gray-tone and it is unclear by inspection whether any protein was detected outside of the narrow range of high levels at the gland base [28,29,45]. The authors comment that GPX2 was detected in the ileum crypts and colon gland base and don’t mention detection outside of those zones [29]. In a third case, GPX2 was detected at the lumen with decreased levels from the colon gland base, while confined to Paneth cell in the ileum [30]. Enlargement of the image of human small intestine GPX2 IHC in Figure 3 hints at very low expression in patches in the upper crypt and up to the villus tip, however, the call by THPA is that cell types other than the Paneth cells are negative for expression.
Efforts to Assist Investigators in Selection of Cell Lines
The suitable selection of cell lines for CRC studies is made possible by analysis of CRC for driver and passenger mutations (classical analysis) and later efforts to classify tumors by small- or large-scale analysis of mRNA expression profiles and IHC, often combined with mutation profiles and epigenetic modification profiles (CMS, CCS, CRIS, iCMS and others) [7,8,9,10,11,12,13,14,15,46,47,48]. In many cases, cell lines were similarly classified in attempts to match them with CRC types (Figure 8) [6,7,8,9,10,11,12,13,14,15].
All of this was intended to produce precision therapies and inform the process of cell line selection for pre-clinical testing of such therapies, Medico et al concentrating on the choice of cell lines [6]. An anomaly in the CRC nomenclature system of Medico et al (inherited from Sadanandam et al) is that in applying a system based on markers for normal cell types to cancer, some classical stem cell and WNT markers are associated with the transit amplifying-like (TA) class of tumors (ASCL2, RNF43, ZNFR3, AXIN2) (Figure 8A) [49]. Sadanandam et al stated that the main characteristics of the stem-like CRC class were high expression of myoepithelial and mesenchymal genes and lack of differentiation. While they also say this CRC class has high WNT marker expression, this was not found to be a consistent property of the cell lines that were sorted into this category based on the stripped down iCMS marker set (Figure 9) [15].
One notable outcome of the collective efforts was the relatively consistent classification of some cell lines into epithelial to mesenchymal transition (EMT)/TGFB pathway activation/ undifferentiated/low WNT expression class (Figure 8). A characteristic of this set of cell lines in most classification schemes is low GPX2 and NOX1 expression (median levels- 4.35 TPM and 0.1 TPM vs. 588 TPM and 9.4 TPM in other classes, respectively). There is some inconsistency among the classification schemes for placement of cell lines, and low expressing lines are sometimes split among 2 or 3 classes within schemes (Figure 8A-I). Since the main goal was to observe how high and low GPX2 expressing cell lines sorted based on the various CRC typing methods, extensive statistical analyses were not performed. For the Medico et al analysis, enterocyte-like (Ent), goblet-like (Gob) and TA, GPX2 expression levels are not different and inflammatory-like (Inf) and stem-like (Stem) are not different. Inf and Stem are significantly different from Ent, Gob and TA (Figure 8A) (p≤ 0.021; Mann-Whitney; log2 transformed data directly from DepMap; PRISM 9.3). For CMS set, a consensus of several of the sets shown in Figure 8, CMS1 is not different from any other set. CMS2 and 3 are not different, while both are different from CMS4 (Figure 8H) (p≤0.0056). The mucinous adenocarcinoma marker analysis showed the least goblet set to be different from the core goblet and hybrid sets, which were not different (Figure 8I) (p<0.0002). In the case of the cell line origin, primary tumor or metastases, and microsatellite instability (MSI), no significant differences were found (Figure 8J).
Possible evidence of deep secretory-like derived cell lines (colon Paneth cell equivalent; possible candidates for high GPX2 expression) in the Depmap set can be found using the differential markers indicated in Sasaki et al [32]. It is not clear whether such cells would have any tumorigenic capacity or whether any of the original differential markers of the postulated cell type would remain detectable when or if a transition like that of Paneth cells acquiring stem cell properties occurred. Presumably having acquired high WNT marker status while retaining some expression of differentiation markers, CD24, REG4, MMP7, DLL4, EGF, SPDEF, and ATOH1, they could be represented by 20 of 40 cell lines of the Medico et al classification scheme that overlap with DepMap, excluding stem-like and the NF categories, with GPX2 levels >190 TPM and 1 stem-like cell line at 1 TPM (results not shown). This is pure speculation, as mice were studied for evidence of deep secretory cells, and they are not yet documented in human samples.
The Issue of Low GPX2 Expressing CRC-Derived Cell Lines and Circumvention
Where do low expressing lines come from? In cancers of the GI tract GPX2 expression is confined to uniform high levels, more so for COAD and READ (Figure 1A). In other cancers the range of expression is enormous, possibly explaining the establishment of some cell lines with low levels. Some low expressing cell lines from CRC have mutant APC and others with wild-type APC have high expression of at least one WNT ligand (DepMap) (Figure 4). Thus, the WNT dependence of GPX2 expression in demonstrable in some CRC-derived cell lines and mice does not seem to be the reason for low expression [50]. Analysis for KRAS and TP53 mutation did not reveal any association with GPX2 expression levels in CRC-derived cell lines (DepMap; results not shown). GPX2 expression levels are linked to NRF2 activation [2]. There aren’t potent activating agents in standard culture media and this could be one factor in low GPX2 expression. TP63 is one of the major drivers of GPX2 expression in other tissues and cancers and there is sometimes a demonstrable correlation between TP63 and GPX2 levels among cell lines derived from these other cancers (Figure 10) [51]. TP63 expression is notably absent in all but a few CRC-derived cell lines being replaced by WNT (Figure 10) [50].
Based on the consistent EMT expression profile, it might be conjectured that the low GPX2 expressing cell lines derive largely from metastases. This is not the case (Figure 8J). In fact, one study attempting to resolve the roles of GPX2 in tumorigenesis and metastasis showed that while HT29 cells with GPX2 knocked down showed poor growth as xenografts in mice, they could metastasize although demonstrating a lower potential (GPX2 levels in HT29 at 1010 TPM -averaging DepMap and THPA values; about 20-fold knockdown; NOX1 16 TPM) [52]. However, follow up analysis showed that the metastatic tumors were a subset that either didn’t fully respond to the knockdown or re-established higher GPX2 expression in the process (IHC). Since HT29 cells were classified as CCS3 (Figure 8D, EMT set; poor relapse free survival (RFS)), the authors went on to examine RFS in CCS3 cancers stratified by low and high GPX2 expression, with high expression being unfavorable; questionable significance (TCGA/THPA does not confirm any prognostic relationship between GPX2 and overall survival (OS), lumping all classes together) (Figure 11).
They noted that the median level of GPX2 expression in CCS3 CRC subsets was ~512 TPM (correcting for median tumor purity in CRC-820 TPM) much higher than the 5 TPM characteristic of most CCS3-type cell lines (CCS1 vs CCS2 and CCS3, p≤0.0006; Figure 8D) and that the variation in expression levels was only 4-5-fold among the CCS3 tumors [52]. The relevance of a 20-fold knockdown is questionable in the context of probing RFS. It might be reasonable as a therapeutic goal given the general negative impact on tumor growth and metastasis. HT29 is generally not classed into the EMT/TGFB pathway activation/ undifferentiated/low WNT expression set among classification schemes (Figure 8). The cell line is somewhat differentiated (some MUC2, TFF3 expression and high LYZ; ATOH1, HOXB2, KLF5, TFF3; iCMS), has somewhat low TGFB pathway marker expression (CCN1, ITGAV, TGFB) and low EMT marker levels (FN1, CDH2, VIM) while sharing low WNT marker expression (ASCL2, CDX2, LGR5, MYC, TCF7, TEAD; iCMS) characteristic of the EMT sets (Figure 9) [53,54,55]. HT29 can undergo differentiation in culture with the substitution of galactose for glucose in the media, with some cells exhibiting goblet cell-like morphology and mucin production [56]. Slightly lower GPX activity in HT29 was associated with differentiation by 5-Fluorouracil [57]. This work predates wide-spread recognition of GPX isoenzymes so GPX1 and GPX2 were not separately examined. As a side note, galactose increases mitochondrial H2O2 release, hinting at a role for ROS in the differentiation process along with the reported lowering of GPX activity [58].
Nine cell lines with higher GPX2 levels are classified by 2 or more of the schemes referenced in Figure 8 into the EMT/undifferentiated categories; CACO2 (4 schemes), CL40 (2 schemes), LOVO (3 schemes), LS180 (2 schemes), SKCO1 (2 schemes), SNU1040 (3 schemes), SW620 (4 schemes), SNU503 (5 schemes), and SNU1033 (4 schemes) with GPX2 expression levels of 118, 918, 290, 296, 1711, 1020, 648, 2040, and 318 TPM, respectively (average, DepMap and THPA) (Table 1) [7,8,9,10,11,12].
This appraisal might be further limited by the suggestion that MSS tumors of the CMS4 class are most likely to metastasize, leaving CACO2, CL40, SKCO1 (metastasis), SNU503 (metastasis), SNU1033 and SW620 (metastasis) as representative cell lines with potentially high metastatic potential [15]. However, LOVO (MSI; metastasis) and HCT116 (MSI; low GPX2 expression; identified in the EMT/undifferentiated classes in all schemes) were found to have metastatic potential in a mouse xenograft model rivaling that of SW620, a cell line derived from a metastasis with metastatic potential demonstrable in 2 mouse model studies [59,60]. There may be a few seemingly EMT/TGFB pathway activation/undifferentiated/low WNT expression category cell lines with GPX2 expression levels approaching tumor levels, which seems desirable in testing the role of GPX2 in this class of tumors based on the commonly used suppression of GPX2 expression in cells lines as a mode of study.
Intratumor Variation, Plasticity of Cell Components, Stromal Cell Interactions and GPX2
There is a general trend for high GPX2 expression in normal colorectal samples at the tissue level (Figure 2; ?). This appears to be achieved with a limited zone of high expression at the base of the glands [28,29,30]. There is disagreement on whether a low level of GPX2 expression extends to the top of the gland. While one study mentioned above showed individual CRC tumor cells to have elevated GPX2 protein levels relative to expressing normal cells in a somewhat small set, it is not clear that this is universal in CRC samples [28]. THPA GPX2 IHC sets show a few tumors where GPX2 intensity is quite variable in the epithelium, with portions of tumors showing almost no staining adjacent to strongly strained sections and other lesser variation is also observed (Figure 7A and B). The unstained or lightly stained portions are likely the normal epithelial cell component of tumors (not considered as a source of CRC-derived cells lines) that occur at an average 24% of epithelial cells isolated from tumors in the iCMS analysis, presumably having low levels of GPX2 relative to the tumor cells [15]. The sample shown in Figure 7B might represent a tumor with a normal component above this average, while panels C and D seem to be below the average. The reverse staining pattern is unlikely given the low numbers of normal high GPX2 expressing cells, unless alterations in the tumor stromal cellular environment promote aberrant growth of normal cells along the lines of Paneth cells in tissue injury (postulated deep secretory cells in colon) [29,31,32,33,34]. Whether any of this variation relates to the tumor cell component has not been systematically studied so we would have no idea about how prevalent it is as a pattern and whether it relates to CRC subtypes [15]. If this involves the tumor component, a conjecture is the CMS4/CCS3 class may be more represented explaining the propensity for low GPX2 expressing cell lines from this class (Figure 8). This can be readily tested, and if the variation involves the tumor cell component this could justify the use of low expressing cell lines in studies.
GPX2 expression in primary tumors may be dependent on factors secreted by CAFs and other stromal cells and portions of the tumors may lack sufficient contact with these cells to support GPX2 expression. Growth in primary sites seems to be somewhat dependent on stromal support [61,62,63]. Tumor cells seem to be plastic, altering their properties, which might include cellular factors affecting GPX2 expression, separate from stromal factors [37]. Stromal dependency, while possible, is countered by the more general tendency of cell lines to retain GPX2 expression in standard culture conditions and the idea that metastases can be established in the absence of stromal support (DepMap) [37]. It is estimated that only 10-15% of CRCs can supply cells that will establish cultures [64]. A general requirement for stromal support in primary tumors and re-establishment of this after metastases have seeded may explain part of this failure. In standard isolation of CRC-derived and other cell lines, fibroblasts are the main contaminant, and it takes several passages to eliminate them, or they may be employed as feeders until overgrowth is evident as a sign of independence of the CRC epithelial cells [65]. It is possible that a transition from stromal dependency to independent growth occurs by adaptation or selection as the fibroblasts are eliminated [65]. There are no broadly consistent patterns of gene expression among cell lines as evidenced by the stratification into as many as 6 subtypes based on differences in expression, driver mutations and epigenetic modulation patterns (Figure 8). It is possible to find many different combinations of driver and passenger mutations in the list of 77 CRC cell lines in DepMap [46]. Thus, the basis for culturing success is elusive and clearly has nothing to do with GPX2 expression either directly or in the context of cell properties favoring GPX2 expression.
A side project on GPX2 expression could include adding CRC stromal factors back to cultures, or better, using stromal cells as feeders of the low expressing lines looking for induction of GPX2 levels in low expressing lines to the range of 100-2000 TPM [65]. There is evidence that high TGFB expression in tumor cells, somewhat greater in low GPX2 expressing cell lines (DepMap), exerts a paracrine effect on the surrounding stromal cells, which in turn enhances metastasis of fibrotic-type CRC tumors [63]. This would have to be linked to a broader examination of gene expression alterations to avoid overinterpretation for any impact of GPX2 on subsequent cell line properties. Another point raised by the substitution of galactose for glucose in the culture of HT29 and the change in properties is the presence of additional carbon sources for intestinal cells, short-chain fatty acids and glutamate [67,68]. Addition of short-chained fatty acids to culture media seems to evoke changes in cell line properties with a generally negative impact on growth [66]. Retinoic acid was found to increase GPX2 expression in cell lines [2].
NOX1 in CRC and Links to GPX2
Expression of NOX1 among CRC-derived cell lines shows a similar pattern of variable expression with a greater proportion of lines exhibiting nearly zero expression relative to GPX2 (Figure 5). Very high NOX1 levels are a unique property of normal colon/rectum and CRC with a narrow range of variability in expression levels in normal and a very broad range in expression in CRC, so that low expression in cell lines is not discrepant as with GPX2 (Figure 2 and Figure 5). NOXO1, but not NOXA1, shares unique high expression in colon/rectum (TIMER2.0). The only linkage in co-expression might be that high NOX1 levels are associated with high GPX2 levels as observed in cell lines (DepMap) (Figure 5). NOX1 mRNA and NOX1 protein expression occurs at crypt/gland base like GPX2 [70,71,72]. Whether co-expression occurs in the same normal cells is not clear. The absence of NOX1 (NOX1-KO) in mouse colon has some impact on the distribution of differentiated cells (goblet cells) and proliferating cells, favoring differentiation [70]. This suggests that NOX1 might be expressed in the TA compartment, which is the cell line assignment of Medico et al [6]. In the absence of GPX1 and GPX2, NOX1 activity produces pathology in the form of excess crypt/gland apoptosis, which may be dependent on the presence of microbiota and the composition, providing one rationale for very high GPX2 in colon/rectum [23,24,71,72]. The pattern in CRC-derived cell lines shows co-expression of GPX2 and NOX1 is likely in cancer as property of several, but not all, high WNT expressing and differentiated cell lines (Figure 5 and Figure 11). Unlike GPX2, NOX1 expression levels are considered prognostic by TCGA/THPA for OS, as of 6/2024 (Figure 11). NOX1 stratification yields a significant effect on OS with high expression being favorable. The cut-off for the prognosis call is ~262 TPM (420 TPM, correcting for median purity values), which is greater than 2-times more than even the highest expressing cell line (Figure 11). There is the question of whether NOX1 would be active in any cell lines. One paper tried to address this by showing that a handful of CRC-derived cell lines at the top of the expression range might be capable of significant spontaneous and PMA-induced production of superoxide from NOX1 [73]. The knockdown of antioxidant enzyme expression in CRC cell lines might reveal activity as increased levels of apoptosis that should relate to NOX1 levels, if true.
Low GPX2 Expression in Cell Lines, Redux
Returning to the issue of how to select cell lines for pre-clinical studies of the involvement of GPX2 in CRC, a major question is whether to use low expressing lines for studies. The observation of low GPX2 protein levels in portions of tumor samples may be insignificant as a consideration in CRC studies representing normal cells, and low expressing cell lines may be of little interest and utility in CRC studies despite their otherwise interesting properties. Plasticity is noted to occur in cancer stem cells. Single-cell analysis found a low incidence of multiple subtype signatures in individual tumors, probably based on one sample per tumor [15]. Another study showed that multiple sampling within metastatic tumors revealed unrecognized heterogeneity [74]. Plasticity in CRC tumor stem cells, the finding of a few tumors with multiple signatures and the likelihood of regional variation within tumors suggests that the coexistence of low and high expressing cells in tumors could occur with selection for alternate states a possibility [37]. GPX2 expression might not be an essential feature of tumor progress, only a legacy of expression potential. This might thwart efforts to use modulation of GPX2 levels to achieve therapeutic ends. There is possibly only one example of such behavior in established cell lines and there is a trend for consistent increases in GPX2 expression along what is termed the malignancy continuum suggesting a singular upward arc during tumorigenesis for stem- and TA- like cell types [31]. Cell lines, SW480 and SW620 are isogenic, the former isolated from the primary tumor and the latter from a lymph node metastasis [75]. Among the many differences, the GPX2 level in SW480 is ~5.7 TPM and in SW620 is ~648 TPM (averaging results from DepMap and THPA), SW620 has much higher expression of LGR5 and ASCL2, and slightly greater signs of differentiation, while they share very low NOX1 expression (Figure 5 and Figure 9). In two studies of metastatic potential in mice, SW620 demonstrated a much greater ability than SW480 [59,60]. Comparing GPX2 levels (DepMap) to the reported metastatic ability among 6 cell lines used in one of the two studies did not show any trend, suggesting other properties of those lines and possibly SW480 and SW620 were responsible [60]. The paired lines, GP2D and GP5D, retain similar, somewhat low GPX2 levels, 87 TPM (83 TPM averaging DepMap and THPA) and 59 TPM, similar proliferation and differentiation marker status and low NOX1 levels (Figure 5, Figure 9B and Figure 9D). Both were derived from the same primary tumor and exhibit some different properties in culture [76]. Other pairings exist or may exist; however, one member of the pair doesn’t appear in the DepMap or THPA databases or the suggested pairing is based on later supposition and not the original description (DLD1, HCT15; primary; similar low GPX2 and NOX1 expression; multiple sources support pairing) (Figure 5) [6]. CRC organoids might provide a means to explore the plasticity issue [83].
Summary
In general, it appears that cell line selection for studies should account for CRC subtypes, selecting across broad gene expression profiles, different driver mutations and epigenetic modulation. There is sufficient information and enough cell lines typed to account for most of the variation across CRC classes (DepMap, THPA) [6,7,8,9,10,11,12,13,14,15,46]. Medico et al sorted 150 cell lines and investigators could independently measure relative GPX2 expression in the lines not covered by DepMap to include other combinations. Note that RT-PCR results from individual studies are often at variance with DepMap/THPA [1]. An investigation into this suggested that DepMap/THPA values were generally reliable guides for predicting GPX protein and activity levels in cells lines at a gross level, while the differences observed between DepMap and THPA reveal uncertainty for fine distinctions (Figure 4C) [1]. It is recommended to use at least two cell lines, one low and one high expressing, from the Depmap collection to provide reference values when looking at other cell lines [1]. A study might need to use four or more lines to sufficiently account for the major variation among CRC classes, depending on the goals.
Classification systems tend to place high GPX2 expressing and low GPX2 expressing cell lines into different categories, and this may restrict the implementation of the common research scheme of overexpression in low expressing lines and knockdown of high expressing lines (Table 1), although some methods place both high and low expressing lines across classifications (Figure 8). As to using cell lines to model cancer etiology, the top-down model would suggest a likelihood that the source cells lacked GPX2 expression and gained it as a function of progress along the malignancy continuum [31,38]. The bottom-up model does not guarantee that the source cells had high expression, however, this is a possibility and cells in this area might be likely to acquire GPX2 expression in an early hyperplasia phase based on evidence that NOX1 up-regulation and activation is involved in the shift of gland base stem cells from quiescence to active cycling [77,78]. As of this time, there is no clear association between the few high expressing cells found at the gland base and CRC. Until the plasticity and stromal contribution issues are resolved, cell lines with very low GPX2 expression are something of an enigma, particularly with the trend for fully developed CRC to have higher GPX2 expression than its antecedents [31]. Cells shed from primary tumors may lack LGR5 expression and regain it after they seed metastases [37]. Likewise, it seems possible this pattern might occur for GPX2 based on the study of Emmink et al [52]. The example of SW480 and SW620 suggests that primary tumors could have low expressing cells and still produce high expressing metastases [59,60,75]. This might reflect heterogeneity in the primary, plasticity and the malignancy continuum arc as it relates to metastasis or just be an artifact of cell culture. There is no uniform difference in GPX2 expression patterns for cell lines isolated from the primary and metastatic sites (Figure 8J). In lung adenocarcinoma, lower RFS seems to be related to persister cells that maintain higher levels of GPX2 expression, which may be essential for the resilience of this cell type both in the quiescent and cycling states [79,80]. This is consistent with the findings that higher GPX2 expression is associated with worse RFS in CCS3 CRC and inconsistent with the apparent isolation of low expressing cell lines from CCS3 tumors (Figure 8) [52].
Based on the model for GPX1/2 action relative to the postulated PRDX relay (Figure 1), the main factors in CRC are ROOH signaling in which NOX1 may have a major role, the GPX: PRDX ratio that would modulate the ROOH signaling potential and the protein expression pattern of the cell type that would dictate the response to the ROOH signal. Another consideration is that PRDX reduction may be hampered by slow interaction with relay targets and a possible bottleneck with thioredoxin/thioredoxin reductase resulting in temporary inactivation [4,81,82,83]. GPXs may fill in for the loss of antioxidant capasity while PRDXs regenerate.
The relative TPM levels among GPXs and PRDXs are intended only as rough guides to comparative function, a starting point for thinking about where GPX2 might have a significant role and for choosing cell lines. PRDX1 and PRDX2 are estimated to have initial ROOH rate constants 2-5-fold over that of GPXs, while PRDX5 is estimated to be 10-100-fold less efficient [3,4]. This is coupled with the generally greater abundance of PRDXs [1]. The TPM counts can be modified based on these considerations to more realistically model relative antioxidant potency. On the other hand, the estimates of relative normal colon/rectum and COAD/READ tissue levels underrepresent GPX2 (20-27% total TPM) by including expression of PRDX1-6 and GPX1 outside of the epithelial compartments; GPX1 and PRDX1-6, follow the pattern of β-actin in Fig. Attempting to correct for this revises the estimates for GPX2 to 35-50% of total TPM; downplaying the contribution of PRDX5 by 10-fold and allowing the higher rate constants for PRDX1 and PRDX2, suggests GPX2 could be nearly at parity with PRDXs for ROOH consumption. In much of the normal epithelium high GPX2 expression is not found and in portions of some tumors this is seen as well, yielding additional upward revision (Figure 1B, Figure 3 and Figure 7) [1,28,29]. GPX2 levels equal to or greater than 35% of total antioxidant gene TPM are found in 10% of CRC-derived cell lines (up to 45%) (Figure 4). Applying the rate constant corrections to 5 of the top expressing cell lines suggests that GPX2 could account for 20-27% of total ROOH reduction, up to 30% including GPX The fraction of ROOH going through GPX1/2 is significant because it could divert ROOH from signaling via the PRDX relay (Figure 1A). Alteration of GPX2 levels is significant if it actually impacts the fraction of the total ROOH reduction capasity; that is no comensurate changes occur among PRDXs. This is why information on GPX1/2 and PRDX1-6 is required in these studies to assess the actual impact. In the case of NOX1, if the predominant signaling is based on superoxide and H2O2 is only a byproduct, having high levels of GPX1/2 could prevent unintended signaling (Figure 1B) [85].
Factoring in NOX1, possibly no CRC-derived cell lines would qualify for selection in studies (Figure 11). These considerations add more levels of uncertainty in evaluating the possible role of GPX2 in cancer and general antioxidant function, particularly using cell lines, which by and large fail to replicate the high GPX2 and NOX1 levels of COAD/READ. CRC and ESCA/STAD are among the better cases for finding representative cell lines [1]. LIHC-derived cell lines show vastly lower GPX2 levels than the tumors (Figure 2).
Conclusions
Finally, no definitive answer can be provided on how to study GPX2 in CRC. One question is whether forced overexpression or silencing of GPX2 is the same as alterations to cells that result in changes to GPX2 levels, where there might be changes to the potential target proteins as well. The work of Emmink, et al suggests that suppressing GPX2 in cancers with high expression (>820 TPM; based on HT29; the levels in the CRC-derived organoids used were not provided with the default from databases being high expression) might suppress growth and metastatic potential [52]. The work involved both the HT29 cell line and organoids cultures from 2 CRC subjects, giving it some veracity. They did not provide any information on CRC subtypes of the source for the organoids and the in vitro culture conditions of the organoids were not typical, lacking WNT activators, Noggin, and RSPO, etc. [84]. There are several other GPX2 and CRC papers that collectively suggest that GPX2 levels should impact CRC progress. More generally in experimental work high expression seems to favor tumor progress with a range of proposed pathways being impacted [1]. There are some conflicting findings-high expression repressing the prostaglandin and lipoxygenase pathways and subsequent growth, in vitro, while the same condition supported tumor growth in mice and suppressed mutation which might disfavor immune check point therapies; low expression suppressed azoxymethane induced-CRC in mice [86,87]. Prognosis analyses conflict with TCGA/THPA suggesting no impact on OS, collectively, while focusing on the EMT subtype suggests high GPX2 expression in this subtype may yield poor prognosis for RFS (Figure 11) [7,8,9,10,11,12,13,14,15,52]. CRC is complex and the issues of plasticity and stromal involvement further complicate the situation suggesting that multiple pathways could be impacted by GPX2 action and contribute to mixed research results. If it is worth the effort, research must account for the complexity and current uncertainties surrounding CRC and this would involve careful selection criteria for cell lines that would go beyond GPX2 levels and employ the use of multiple lines in any single study. Alternatively, reading this report might convince many that using cell lines is not a good approach to understanding CRC or the role of GPX
Author Contributions
Conceptualization, Methodology, Formal Analysis, Investigation, Writing–Original Draft Preparation, Writing–Review & Editing, Visualization, RSE
Funding
none
Conflicts of interest
none
IRB
not required.
Data availability
All data can be found in the referenced public databases and cited papers; inquiries can be made to RSE; email, sesworthy@coh.org
Acknowledgements
The suggestions of Drs. Sarah P. Short, Anna P. Kipp and Fong-Fong Chu were incorporated into the text and the author thanks them for their valuable input.
References
- Esworthy, R.S.; Chu, F.F. Using Information from Public Databases to Critically Evaluate Studies Linking the Antioxidant Enzyme Selenium-Dependent Glutathione Peroxidase 2 (GPX2) to Cancer. BioMedInformatics. 2023, 3, 985–1014. [Google Scholar] [CrossRef]
- Esworthy, R.S.; Doroshow, J.H.; Chu, F.F. The beginning of GPX2 and 30 years later. Free Radic Biol Med. 2022, 188, 419. [Google Scholar] [CrossRef] [PubMed] [PubMed Central]
- Averill-Bates, D. Reactive oxygen species and cell signaling. Review. Biochim Biophys Acta Mol Cell Res. 2024, 1871. [Google Scholar] [CrossRef] [PubMed]
- Villar, S.F.; Corrales-González, L.; Márquez de Los Santos, B.; Dalla Rizza, J.; Zeida, A.; Denicola, A.; Ferrer-Sueta, G. Kinetic and structural assessment of the reduction of human 2-Cys peroxiredoxins by thioredoxins. FEBS J. 2024, 291, 778. [Google Scholar] [CrossRef] [PubMed]
- Xu, H.; Hu, C.; Wang, Y.; Shi, Y.; Yuan, L.; Xu, J.; Zhang, Y.; Chen, J.; Wei, Q.; Qin, J.; Xu, Z.; Cheng, X. Glutathione peroxidase 2 knockdown suppresses gastric cancer progression and metastasis via regulation of kynurenine metabolism. Oncogene. 2023, 42, 1994. [Google Scholar] [CrossRef] [PubMed] [PubMed Central]
- Medico, E.; Russo, M.; Picco, G.; Cancelliere, C.; Valtorta, E.; Corti, G.; Buscarino, M.; Isella, C.; Lamba, S.; Martinoglio, B.; Veronese, S.; Siena, S.; Sartore-Bianchi, A.; Beccuti, M.; Mottolese, M.; Linnebacher, M.; Cordero, F.; Di Nicolantonio, F.; Bardelli, A. The molecular landscape of colorectal cancer cell lines unveils clinically actionable kinase targets. Nat Commun. 2015, 6. [Google Scholar] [CrossRef] [PubMed]
- Sadanandam, A.; Lyssiotis, C.A.; Homicsko, K.; Collisson, E.A.; Gibb, W.J.; Wullschleger, S.; Ostos, L.C.; Lannon, W.A.; Grotzinger, C.; Del Rio, M.; Lhermitte, B.; Olshen, A.B.; Wiedenmann, B.; Cantley, L.C.; Gray, J.W.; Hanahan, D. A colorectal cancer classification system that associates cellular phenotype and responses to therapy. Nat Med. 2013, 19, 619. [Google Scholar] [CrossRef] [PubMed] [PubMed Central]
- Marisa, L.; de Reyniès, A.; Duval, A.; Selves, J.; Gaub, M.P.; Vescovo, L.; Etienne-Grimaldi, M.C.; Schiappa, R.; Guenot, D.; Ayadi, M.; Kirzin, S.; Chazal, M.; Fléjou, J.F.; Benchimol, D.; Berger, A.; Lagarde, A.; Pencreach, E.; Piard, F.; Elias, D.; Parc, Y.; Olschwang, S.; Milano, G.; Laurent-Puig, P.; Boige, V. Gene expression classification of colon cancer into molecular subtypes: characterization, validation, and prognostic value. PLoS Med. 2013, 10. [Google Scholar] [CrossRef] [PubMed] [PubMed Central]
- Budinska, E.; Popovici, V.; Tejpar, S.; D’Ario, G.; Lapique, N.; Sikora, K.O.; Di Narzo, A.F.; Yan, P.; Hodgson, J.G.; Weinrich, S.; Bosman, F.; Roth, A.; Delorenzi, M. Gene expression patterns unveil a new level of molecular heterogeneity in colorectal cancer. J Pathol. 2013, 231, 63. [Google Scholar] [CrossRef] [PubMed] [PubMed Central]
- De Sousa EMelo, F.; Wang, X.; Jansen, M.; Fessler, E.; Trinh, A.; de Rooij, L.P.; de Jong, J.H.; de Boer, O.J.; van Leersum, R.; Bijlsma, M.F.; Rodermond, H.; van der Heijden, M.; van Noesel, C.J.; Tuynman, J.B.; Dekker, E.; Markowetz, F.; Medema, J.P.; Vermeulen, L. Poor-prognosis colon cancer is defined by a molecularly distinct subtype and develops from serrated precursor lesions. Nat Med. 2013, 19, 614. [Google Scholar] [CrossRef] [PubMed]
- Roepman, P.; Schlicker, A.; Tabernero, J.; Majewski, I.; Tian, S.; Moreno, V.; Snel, M.H.; Chresta, C.M.; Rosenberg, R.; Nitsche, U.; Macarulla, T.; Capella, G.; Salazar, R.; Orphanides, G.; Wessels, L.F.; Bernards, R.; Simon, I.M. Colorectal cancer intrinsic subtypes predict chemotherapy benefit, deficient mismatch repair and epithelial-to-mesenchymal transition. Int J Cancer. 2014, 134, 552. [Google Scholar] [CrossRef] [PubMed] [PubMed Central]
- Schlicker, A.; Beran, G.; Chresta, C.M.; McWalter, G.; Pritchard, A.; Weston, S.; Runswick, S.; Davenport, S.; Heathcote, K.; Castro, D.A.; Orphanides, G.; French, T.; Wessels, L.F. Subtypes of primary colorectal tumors correlate with response to targeted treatment in colorectal cell lines. BMC Med Genomics. 2012, 5. [Google Scholar] [CrossRef] [PubMed] [PubMed Central]
- Berg, K.C.G.; Eide, P.W.; Eilertsen, I.A.; Johannessen, B.; Bruun, J.; Danielsen, S.A.; Bjørnslett, M.; Meza-Zepeda, L.A.; Eknæs, M.; Lind, G.E.; Myklebost, O.; Skotheim, R.I.; Sveen, A.; Lothe, R.A. Multi-omics of 34 colorectal cancer cell lines - a resource for biomedical studies. Mol Cancer. 2017, 16. [Google Scholar] [CrossRef] [PubMed] [PubMed Central]
- Hu, F.J.; Li, Y.J.; Zhang, L.; Ji, D.B.; Liu, X.Z.; Chen, Y.J.; Wang, L.; Wu, A.W. Single-cell profiling reveals differences between human classical adenocarcinoma and mucinous adenocarcinoma. Commun Biol. 2023, 6. [Google Scholar] [CrossRef] [PubMed] [PubMed Central]
- Joanito, I.; Wirapati, P.; Zhao, N.; Nawaz, Z.; Yeo, G.; Lee, F.; Eng, C.L.P.; Macalinao, D.C.; Kahraman, M.; Srinivasan, H.; Lakshmanan, V.; Verbandt, S.; Tsantoulis, P.; Gunn, N.; Venkatesh, P.N.; Poh, Z.W.; Nahar, R.; Oh, H.L.J.; Loo, J.M.; Chia, S.; Cheow, L.F.; Cheruba, E.; Wong, M.T.; Kua, L.; Chua, C.; Nguyen, A.; Golovan, J.; Gan, A.; Lim, W.J.; Guo, Y.A.; Yap, C.K.; Tay, B.; Hong, Y.; Chong, D.Q.; Chok, A.Y.; Park, W.Y.; Han, S.; Chang, M.H.; Seow-En, I.; Fu, C.; Mathew, R.; Toh, E.L.; Hong, L.Z.; Skanderup, A.J.; DasGupta, R.; Ong, C.J.; Lim, K.H.; Tan, E.K.W.; Koo, S.L.; Leow, W.Q.; Tejpar, S.; Prabhakar, S.; Tan, I.B. Single-cell and bulk transcriptome sequencing identifies two epithelial tumor cell states and refines the consensus molecular classification of colorectal cancer. Nat Genet. 2022, 54, 963. [Google Scholar] [CrossRef] [PubMed] [PubMed Central]
- Ranganathan, P.; Agrawal, A.; Bhushan, R.; Chavalmane, A.K.; Kalathur, R.K.; Takahashi, T.; Kondaiah, P. Expression profiling of genes regulated by TGF-beta: differential regulation in normal and tumour cells. BMC Genomics. 2007, 8. [Google Scholar] [CrossRef] [PubMed] [PubMed Central]
- Kurundkar, A.R.; Kurundkar, D.; Rangarajan, S.; Locy, M.L.; Zhou, Y.; Liu, R.M.; Zmijewski, J.; Thannickal, V.J. The matricellular protein CCN1 enhances TGF-β1/SMAD3-dependent profibrotic signaling in fibroblasts and contributes to fibrogenic responses to lung injury. FASEB J. 2016, 30, 2135. [Google Scholar] [CrossRef] [PubMed] [PubMed Central]
- Oshi, M.; Roy, A.M.; Yan, L.; Kinoshita, S.; Tamura, Y.; Kosaka, T.; Akiyama, H.; Kunisaki, C.; Takabe, K.; Endo, I. Enhanced epithelial-mesenchymal transition signatures are linked with adverse tumor microenvironment, angiogenesis and worse survival in gastric cancer. Cancer Gene Ther. 2024, 31, 746. [Google Scholar] [CrossRef] [PubMed]
- Chu, F.F.; Doroshow, J.H.; Esworthy, R.S. Expression, characterization, and tissue distribution of a new cellular selenium-dependent glutathione peroxidase, GSHPx-GI. J Biol Chem. 1993, 268, 2571. [Google Scholar] [CrossRef] [PubMed]
- Cheung, H.W.; Cowley, G.S.; Weir, B.A.; Boehm, J.S.; Rusin, S.; Scott, J.A.; East, A.; Ali, L.D.; Lizotte, P.H.; Wong, T.C.; Jiang, G.; Hsiao, J.; Mermel, C.H.; Getz, G.; Barretina, J.; Gopal, S.; Tamayo, P.; Gould, J.; Tsherniak, A.; Stransky, N.; Luo, B.; Ren, Y.; Drapkin, R.; Bhatia, S.N.; Mesirov, J.P.; Garraway, L.A.; Meyerson, M.; Lander, E.S.; Root, D.E.; Hahn, W.C. Systematic investigation of genetic vulnerabilities across cancer cell lines reveals lineage-specific dependencies in ovarian cancer. Proc Natl Acad Sci U S A. 2011, 108, 12372. [Google Scholar] [CrossRef] [PubMed] [PubMed Central]
- Leist, M.; Raab, B.; Maurer, S.; Rösick, U.; Brigelius-Flohé, R. Conventional cell culture media do not adequately supply cells with antioxidants and thus facilitate peroxide-induced genotoxicity. Free Radic Biol Med. 1996, 21, 297. [Google Scholar] [CrossRef] [PubMed]
- Touat-Hamici, Z.; Bulteau, A.L.; Bianga, J.; Jean-Jacques, H.; Szpunar, J.; Lobinski, R.; Chavatte, L. Selenium-regulated hierarchy of human selenoproteome in cancerous and immortalized cells lines. Biochim Biophys Acta Gen Subj. 2018, 1862, 2493. [Google Scholar] [CrossRef] [PubMed]
- Esworthy, R.S.; Kim, B.W.; Chow, J.; Shen, B.; Doroshow, J.H.; Chu, F.F. Nox1 causes ileocolitis in mice deficient in glutathione peroxidase-1 and -2. Free Radic Biol Med. 2014, 68, 315. [Google Scholar] [CrossRef] [PubMed]
- Chu, F.F.; Esworthy, R.S.; Doroshow, J.H.; Grasberger, H.; Donko, A.; Leto, T.L.; Gao, Q.; Shen, B. Deficiency in Duox2 activity alleviates ileitis in GPx1- and GPx2-knockout mice without affecting apoptosis incidence in the crypt epithelium. Redox Biol. 2017, 11, 144. [Google Scholar] [CrossRef] [PubMed]
- Jones, R.M.; Luo, L.; Ardita, C.S.; Richardson, A.N.; Kwon, Y.M.; Mercante, J.W.; Alam, A.; Gates, C.L.; Wu, H.; Swanson, P.A.; Lambeth, J.D.; Denning, P.W.; Neish, A.S. Symbiotic lactobacilli stimulate gut epithelial proliferation via Nox-mediated generation of reactive oxygen species. EMBO J. 2013, 32, 3017. [Google Scholar] [CrossRef] [PubMed] [PubMed Central]
- Kato, M.; Marumo, M.; Nakayama, J.; Matsumoto, M.; Yabe-Nishimura, C.; Kamata, T. The ROS-generating oxidase Nox1 is required for epithelial restitution following colitis. Exp Anim. 2016, 65, 197. [Google Scholar] [CrossRef] [PubMed] [PubMed Central]
- Matsumoto, M.; Katsuyama, M.; Iwata, K.; Ibi, M.; Zhang, J.; Zhu, K.; Nauseef, W.M.; Yabe-Nishimura, C. Characterization of N-glycosylation sites on the extracellular domain of NOX1/NADPH oxidase. Free Radic Biol Med. 2014, 68, 196. [Google Scholar] [CrossRef] [PubMed]
- Brzozowa-Zasada, M.; Ianaro, A.; Piecuch, A.; Michalski, M.; Matysiak, N.; Stęplewska, K. Immunohistochemical Expression of Glutathione Peroxidase-2 (Gpx-2) and Its Clinical Relevance in Colon Adenocarcinoma Patients. Int J Mol Sci. 2023, 24. [Google Scholar] [CrossRef] [PubMed] [PubMed Central]
- Komatsu, H.; Okayasu, I.; Mitomi, H.; Imai, H.; Nakagawa, Y.; Obata, F. Immunohistochemical detection of human gastrointestinal glutathione peroxidase in normal tissues and cultured cells with novel mouse monoclonal antibodies. J Histochem Cytochem. 2001, 49, 759. [Google Scholar] [CrossRef] [PubMed]
- Florian, S.; Wingler, K.; Schmehl, K.; Jacobasch, G.; Kreuzer, O.J.; Meyerhof, W.; Brigelius-Flohé, R. Cellular and subcellular localization of gastrointestinal glutathione peroxidase in normal and malignant human intestinal tissue. Free Radic Res. 2001, 35, 655. [Google Scholar] [CrossRef] [PubMed]
- Becker, W.R.; Nevins, S.A.; Chen, D.C.; Chiu, R.; Horning, A.M.; Guha, T.K.; Laquindanum, R.; Mills, M.; Chaib, H.; Ladabaum, U.; Longacre, T.; Shen, J.; Esplin, E.D.; Kundaje, A.; Ford, J.M.; Curtis, C.; Snyder, M.P.; Greenleaf, W.J. Single-cell analyses define a continuum of cell state and composition changes in the malignant transformation of polyps to colorectal cancer. Nat Genet. 2022, 54, 985. [Google Scholar] [CrossRef] [PubMed] [PubMed Central]
- Sasaki, N.; Sachs, N.; Wiebrands, K.; Ellenbroek, S.I.; Fumagalli, A.; Lyubimova, A.; Begthel, H.; van den Born, M.; van Es, J.H.; Karthaus, W.R.; Li, V.S.; López-Iglesias, C.; Peters, P.J.; van Rheenen, J.; van Oudenaarden, A.; Clevers, H. Reg4+ deep crypt secretory cells function as epithelial niche for Lgr5+ stem cells in colon. Proc Natl Acad Sci U S A. 2016, 113, E5399. [Google Scholar] [CrossRef] [PubMed] [PubMed Central]
- Pilat, J.M.; Brown, R.E.; Chen, Z.; Berle, N.J.; Othon, A.P.; Washington, M.K.; Anant, S.A.; Kurokawa, S.; Ng, V.H.; Thompson, J.J.; Jacobse, J.; Goettel, J.A.; Lee, E.; Choksi, Y.A.; Lau, K.S.; Short, S.P.; Williams, C.S. SELENOP modifies sporadic colorectal carcinogenesis and WNT signaling activity through LRP5/6 interactions. J Clin Invest. 2023, 133. [Google Scholar] [CrossRef] [PubMed] [PubMed Central]
- Schmitt, M.; Schewe, M.; Sacchetti, A.; Feijtel, D.; van de Geer, W.S.; Teeuwssen, M.; Sleddens, H.F.; Joosten, R.; van Royen, M.E.; van de Werken, H.J.G.; van Es, J.; Clevers, H.; Fodde, R. Paneth Cells Respond to Inflammation and Contribute to Tissue Regeneration by Acquiring Stem-like Features through SCF/c-Kit Signaling. Cell Rep. 2018, 24, 2312–2328. [Google Scholar] [CrossRef] [PubMed]
- Yu, S.; Tong, K.; Zhao, Y.; Balasubramanian, I.; Yap, G.S.; Ferraris, R.P.; Bonder, E.M.; Verzi, M.P.; Gao, N. Paneth Cell Multipotency Induced by Notch Activation following Injury. Cell Stem Cell. 2018, 23, 46–59. [Google Scholar] [CrossRef] [PubMed] [PubMed Central]
- Mei, X.; Gu, M.; Li, M. Plasticity of Paneth cells and their ability to regulate intestinal stem cells. Stem Cell Res Ther. 2020, 11. [Google Scholar] [CrossRef] [PubMed] [PubMed Central]
- Fumagalli, A.; Oost, K.C.; Kester, L.; Morgner, J.; Bornes, L.; Bruens, L.; Spaargaren, L.; Azkanaz, M.; Schelfhorst, T.; Beerling, E.; Heinz, M.C.; Postrach, D.; Seinstra, D.; Sieuwerts, A.M.; Martens, J.W.M.; van der Elst, S.; van Baalen, M.; Bhowmick, D.; Vrisekoop, N.; Ellenbroek, S.I.J.; Suijkerbuijk, S.J.E.; Snippert, H.J.; van Rheenen, J. Plasticity of Lgr5-Negative Cancer Cells Drives Metastasis in Colorectal Cancer. Cell Stem Cell. 2020, 26, 569–578. [Google Scholar] [CrossRef] [PubMed] [PubMed Central]
- Hong, Y.; Liew, S.C.; Thean, L.F.; Tang, C.L.; Cheah, P.Y. Human colorectal cancer initiation is bidirectional, and cell growth, metabolic genes and transporter genes are early drivers of tumorigenesis. Cancer Lett. 2018, 431, 213. [Google Scholar] [CrossRef] [PubMed]
- Yuan, K.; Liu, Y.; Chen, H.N.; Zhang, L.; Lan, J.; Gao, W.; Dou, Q.; Nice, E.C.; Huang, C. Thiol-based redox proteomics in cancer research. Proteomics. 2015, 15, 287. [Google Scholar] [CrossRef] [PubMed]
- Nguyen Huu, T.; Park, J.; Zhang, Y.; Park, I.; Yoon, H.J.; Woo, H.A.; Lee, S.R. Redox Regulation of PTEN by Peroxiredoxins. Antioxidants (Basel). 2021, 10. [Google Scholar] [CrossRef] [PubMed] [PubMed Central]
- Esworthy, R.S.; Swiderek, K.M.; Ho, Y.S.; Chu, F.F. Selenium-dependent glutathione peroxidase-GI is a major glutathione peroxidase activity in the mucosal epithelium of rodent intestine. Biochim Biophys Acta. 1998, 1381, 213. [Google Scholar] [CrossRef] [PubMed]
- Peng, F.; Xu, Q.; Jing, X.; Chi, X.; Zhang, Z.; Meng, X.; Liu, X.; Yan, J.; Liu, X.; Shao, S. GPX2 promotes EMT and metastasis in non-small cell lung cancer by activating PI3K/AKT/mTOR/Snail signaling axis. FASEB Bioadv. 2023, 5, 233. [Google Scholar] [CrossRef] [PubMed] [PubMed Central]
- Haider, S.; Tyekucheva, S.; Prandi, D.; Fox, N.S.; Ahn, J.; Xu, A.W.; Pantazi, A.; Park, P.J.; Laird, P.W.; Sander, C.; Wang, W.; Demichelis, F.; Loda, M.; Boutros, P.C.; Cancer Genome Atlas Research Network. Systematic Assessment of Tumor Purity and Its Clinical Implications. JCO Precis Oncol. 2020, 4, PO20. [Google Scholar] [CrossRef] [PubMed] [PubMed Central]
- Hiller, F.; Besselt, K.; Deubel, S.; Brigelius-Flohé, R.; Kipp, A.P. GPx2 Induction Is Mediated Through STAT Transcription Factors During Acute Colitis. Inflamm Bowel Dis. 2015, 21, 2078. [Google Scholar] [CrossRef] [PubMed]
- Florian, S.; Krehl, S.; Loewinger, M.; Kipp, A.; Banning, A.; Esworthy, S.; Chu, F.F.; Brigelius-Flohé, R. Loss of GPx2 increases apoptosis, mitosis, and GPx1 expression in the intestine of mice. Free Radic Biol Med. 2010, 49, 1694. [Google Scholar] [CrossRef] [PubMed] [PubMed Central]
- Mouradov, D.; Sloggett, C.; Jorissen, R.N.; Love, C.G.; Li, S.; Burgess, A.W.; Arango, D.; Strausberg, R.L.; Buchanan, D.; Wormald, S.; O’Connor, L.; Wilding, J.L.; Bicknell, D.; Tomlinson, I.P.; Bodmer, W.F.; Mariadason, J.M.; Sieber, O.M. Colorectal cancer cell lines are representative models of the main molecular subtypes of primary cancer. Cancer Res. 2014, 74, 3238. [Google Scholar] [CrossRef] [PubMed]
- Isella, C.; Brundu, F.; Bellomo, S.E.; Galimi, F.; Zanella, E.; Porporato, R.; Petti, C.; Fiori, A.; Orzan, F.; Senetta, R.; Boccaccio, C.; Ficarra, E.; Marchionni, L.; Trusolino, L.; Medico, E.; Bertotti, A. Selective analysis of cancer-cell intrinsic transcriptional traits defines novel clinically relevant subtypes of colorectal cancer. Nat Commun. 2017, 8. [Google Scholar] [CrossRef] [PubMed] [PubMed Central]
- Guinney, J.; Dienstmann, R.; Wang, X.; de Reyniès, A.; Schlicker, A.; Soneson, C.; Marisa, L.; Roepman, P.; Nyamundanda, G.; Angelino, P.; Bot, B.M.; Morris, J.S.; Simon, I.M.; Gerster, S.; Fessler, E.; De Sousa EMelo, F.; Missiaglia, E.; Ramay, H.; Barras, D.; Homicsko, K.; Maru, D.; Manyam, G.C.; Broom, B.; Boige, V.; Perez-Villamil, B.; Laderas, T.; Salazar, R.; Gray, J.W.; Hanahan, D.; Tabernero, J.; Bernards, R.; Friend, S.H.; Laurent-Puig, P.; Medema, J.P.; Sadanandam, A.; Wessels, L.; Delorenzi, M.; Kopetz, S.; Vermeulen, L.; Tejpar, S. The consensus molecular subtypes of colorectal cancer. Nat Med. 2015, 21, 1350. [Google Scholar] [CrossRef] [PubMed] [PubMed Central]
- Ziskin, J.L.; Dunlap, D.; Yaylaoglu, M.; Fodor, I.K.; Forrest, W.F.; Patel, R.; Ge, N.; Hutchins, G.G.; Pine, J.K.; Quirke, P.; Koeppen, H.; Jubb, A.M. In situ validation of an intestinal stem cell signature in colorectal cancer. Gut. 2013, 62, 1012. [Google Scholar] [CrossRef] [PubMed]
- Kipp, A.P.; Müller, M.F.; Göken, E.M.; Deubel, S.; Brigelius-Flohé, R. The selenoproteins GPx2, TrxR2 and TrxR3 are regulated by Wnt signalling in the intestinal epithelium. Biochim Biophys Acta. 2012, 1820, 1588. [Google Scholar] [CrossRef] [PubMed]
- Ahmed, K.M.; Veeramachaneni, R.; Deng, D.; Putluri, N.; Putluri, V.; Cardenas, M.F.; Wheeler, D.A.; Decker, W.K.; Frederick, A.I.; Kazi, S.; Sikora, A.G.; Sandulache, V.C.; Frederick, M.J. Glutathione peroxidase 2 is a metabolic driver of the tumor immune microenvironment and immune checkpoint inhibitor response. J Immunother Cancer. 2022, 10. [Google Scholar] [CrossRef] [PubMed] [PubMed Central]
- Emmink, B.L.; Laoukili, J.; Kipp, A.P.; Koster, J.; Govaert, K.M.; Fatrai, S.; Verheem, A.; Steller, E.J.; Brigelius-Flohé, R.; Jimenez, C.R.; Borel Rinkes, I.H.; Kranenburg, O. GPx2 suppression of H2O2 stress links the formation of differentiated tumor mass to metastatic capacity in colorectal cancer. Cancer Res. 2014, 74, 6717. [Google Scholar] [CrossRef] [PubMed]
- Yang, J.; Antin, P.; Berx, G.; Blanpain, C.; Brabletz, T.; Bronner, M.; Campbell, K.; Cano, A.; Casanova, J.; Christofori, G.; Dedhar, S.; Derynck, R.; Ford, H.L.; Fuxe, J.; García de Herreros, A.; Goodall, G.J.; Hadjantonakis, A.K.; Huang, R.Y.J.; Kalcheim, C.; Kalluri, R.; Kang, Y.; Khew-Goodall, Y.; Levine, H.; Liu, J.; Longmore, G.D.; Mani, S.A.; Massagué, J.; Mayor, R.; McClay, D.; Mostov, K.E.; Newgreen, D.F.; Nieto, M.A.; Puisieux, A.; Runyan, R.; Savagner, P.; Stanger, B.; Stemmler, M.P.; Takahashi, Y.; Takeichi, M.; Theveneau, E.; Thiery, J.P.; Thompson, E.W.; Weinberg, R.A.; Williams, E.D.; Xing, J.; Zhou, B.P.; Sheng, G.; EMT International Association (TEMTIA). Guidelines and definitions for research on epithelial-mesenchymal transition. Nat Rev Mol Cell Biol. 2020, 21, 341. [Google Scholar] [CrossRef] [PubMed] [PubMed Central]
- Loeser, H.; Scholz, M.; Fuchs, H.; Essakly, A.; Damanakis, A.I.; Zander, T.; Büttner, R.; Schröder, W.; Bruns, C.; Quaas, A.; Gebauer, F. Integrin alpha V (ITGAV) expression in esophageal adenocarcinoma is associated with shortened overall-survival. Sci Rep. 2020, 10. [Google Scholar] [CrossRef] [PubMed] [PubMed Central]
- Kurundkar, A.R.; Kurundkar, D.; Rangarajan, S.; Locy, M.L.; Zhou, Y.; Liu, R.M.; Zmijewski, J.; Thannickal, V.J. The matricellular protein CCN1 enhances TGF-β1/SMAD3-dependent profibrotic signaling in fibroblasts and contributes to fibrogenic responses to lung injury. FASEB J. 2016, 30, 2135. [Google Scholar] [CrossRef] [PubMed] [PubMed Central]
- Huet, C.; Sahuquillo-Merino, C.; Coudrier, E.; Louvard, D. Absorptive and mucus-secreting subclones isolated from a multipotent intestinal cell line (HT-29) provide new models for cell polarity and terminal differentiation. J Cell Biol. 1987, 105, 345. [Google Scholar] [CrossRef] [PubMed] [PubMed Central]
- Bravard, A.; Beaumatin, J.; Dussaulx, E.; Lesuffleur, T.; Zweibaum, A.; Luccioni, C. Modifications of the antioxidant metabolism during proliferation and differentiation of colon tumor cell lines. Int J Cancer. 1994, 59, 843. [Google Scholar] [CrossRef] [PubMed]
- Godtliebsen, G.; Larsen, K.B.; Bhujabal, Z.; Opstad, I.S.; Nager, M.; Punnakkal, A.R.; Kalstad, T.B.; Olsen, R.; Lund, T.; Prasad, D.K.; Agarwal, K.; Myrmel, T.; Birgisdottir, A.B. High-resolution visualization and assessment of basal and OXPHOS-induced mitophagy in H9c2 cardiomyoblasts. Autophagy. 2023, 19, 2769. [Google Scholar] [CrossRef] [PubMed] [PubMed Central]
- Hewitt, R.E.; McMarlin, A.; Kleiner, D.; Wersto, R.; Martin, P.; Tsokos, M.; Stamp, G.W.; Stetler-Stevenson, W.G. Validation of a model of colon cancer progression. J Pathol. 2000, 192, 446. [Google Scholar] [CrossRef] [PubMed]
- Xu, Y.; Zhang, L.; Wang, Q.; Zheng, M. Comparison of Different Colorectal Cancer With Liver Metastases Models Using Six Colorectal Cancer Cell Lines. Pathol Oncol Res. 2020, 26, 2177. [Google Scholar] [CrossRef] [PubMed]
- Han, L.; Wang, S.; Wei, C.; Fang, Y.; Huang, S.; Yin, T.; Xiong, B.; Yang, C. Tumour microenvironment: a non-negligible driver for epithelial-mesenchymal transition in colorectal cancer. Expert Rev Mol Med. 2021, 23. [Google Scholar] [CrossRef] [PubMed]
- Catalano, V.; Turdo, A.; Di Franco, S.; Dieli, F.; Todaro, M.; Stassi, G. Tumor and its microenvironment: a synergistic interplay. Semin Cancer Biol. 2013, 23 6 Pt B, 522. [Google Scholar] [CrossRef] [PubMed]
- Ernst, M.; Ramsay, R.G. Colorectal cancer mouse models: integrating inflammation and the stroma. J Gastroenterol Hepatol. 2012, 27, 39. [Google Scholar] [CrossRef] [PubMed]
- Hirsch, D.; Seyfried, S.; Staib, T.; Fiedler, D.; Sauer, C.; Ried, T.; Witt, S.; Rueckert, F.; Gaiser, T. Newly established gastrointestinal cancer cell lines retain the genomic and immunophenotypic landscape of their parental cancers. Sci Rep. 2020, 10. [Google Scholar] [CrossRef] [PubMed] [PubMed Central]
- Tompkins, W.A.; Watrach, A.M.; Schmale, J.D.; Schultz, R.M.; Harris, J.A. Cultural and antigenic properties of newly established cell strains derived from adenocarcinomas of the human colon and rectum. J Natl Cancer Inst. 1974, 52, 1101. [Google Scholar] [CrossRef] [PubMed]
- Calon, A.; Espinet, E.; Palomo-Ponce, S.; Tauriello, D.V.; Iglesias, M.; Céspedes, M.V.; Sevillano, M.; Nadal, C.; Jung, P.; Zhang, X.H.; Byrom, D.; Riera, A.; Rossell, D.; Mangues, R.; Massagué, J.; Sancho, E.; Batlle, E. Dependency of colorectal cancer on a TGF-β-driven program in stromal cells for metastasis initiation. Cancer Cell. 2012, 22, 571. [Google Scholar] [CrossRef] [PubMed] [PubMed Central]
- Fagundes, R.R.; Belt, S.C.; Bakker, B.M.; Dijkstra, G.; Harmsen, H.J.M.; Faber, K.N. Beyond butyrate: microbial fiber metabolism supporting colonic epithelial homeostasis. Trends Microbiol. 2024, 32, 178. [Google Scholar] [CrossRef] [PubMed]
- Tomé, D. The Roles of Dietary Glutamate in the Intestine. Ann Nutr Metab. 2018, 73 Suppl 5, 15. [Google Scholar] [CrossRef] [PubMed]
- Gomes, S.; Baltazar, F.; Silva, E.; Preto, A. Microbiota-Derived Short-Chain Fatty Acids: New Road in Colorectal Cancer Therapy. Pharmaceutics. 2022, 14. [Google Scholar] [CrossRef] [PubMed] [PubMed Central]
- Coant, N.; Ben Mkaddem, S.; Pedruzzi, E.; Guichard, C.; Tréton, X.; Ducroc, R.; Freund, J.N.; Cazals-Hatem, D.; Bouhnik, Y.; Woerther, P.L.; Skurnik, D.; Grodet, A.; Fay, M.; Biard, D.; Lesuffleur, T.; Deffert, C.; Moreau, R.; Groyer, A.; Krause, K.H.; Daniel, F.; Ogier-Denis, E. NADPH oxidase 1 modulates WNT and NOTCH1 signaling to control the fate of proliferative progenitor cells in the colon. Mol Cell Biol. 2010, 30, 2636. [Google Scholar] [CrossRef] [PubMed] [PubMed Central]
- Chu, F.F.; Esworthy, R.S.; Shen, B.; Doroshow, J.H. Role of the microbiota in ileitis of a mouse model of inflammatory bowel disease-Glutathione peroxide isoenzymes 1 and 2-double knockout mice on a C57BL background. Microbiologyopen. 2020, 9. [Google Scholar] [CrossRef] [PubMed] [PubMed Central]
- Chu, F.F.; Esworthy, R.S.; Chu, P.G.; Longmate, J.A.; Huycke, M.M.; Wilczynski, S.; Doroshow, J.H. Bacteria-induced intestinal cancer in mice with disrupted Gpx1 and Gpx2 genes. Cancer Res. 2004, 64, 962. [Google Scholar] [CrossRef] [PubMed]
- Lu, J.; Jiang, G.; Wu, Y.; Antony, S.; Meitzler, J.L.; Juhasz, A.; Liu, H.; Roy, K.; Makhlouf, H.; Chuaqui, R.; Butcher, D.; Konaté, M.M.; Doroshow, J.H. NADPH oxidase 1 is highly expressed in human large and small bowel cancers. PLoS One. 2020, 15. [Google Scholar] [CrossRef] [PubMed] [PubMed Central]
- Dunne, P.D.; McArt, D.G.; Bradley, C.A.; O’Reilly, P.G.; Barrett, H.L.; Cummins, R.; O’Grady, T.; Arthur, K.; Loughrey, M.B.; Allen, W.L.; McDade, S.S.; Waugh, D.J.; Hamilton, P.W.; Longley, D.B.; Kay, E.W.; Johnston, P.G.; Lawler, M.; Salto-Tellez, M.; Van Schaeybroeck, S. Challenging the Cancer Molecular Stratification Dogma: Intratumoral Heterogeneity Undermines Consensus Molecular Subtypes and Potential Diagnostic Value in Colorectal Cancer. Clin Cancer Res. 2016, 22, 4095. [Google Scholar] [CrossRef] [PubMed]
- Leibovitz, A.; Stinson, J.C.; McCombs WB 3rd McCoy, C.E.; Mazur, K.C.; Mabry, N.D. Classification of human colorectal adenocarcinoma cell lines. Cancer Res. 1976, 36, 4562 PMID: 1000501. [Google Scholar] [PubMed]
- Solic, N.; Collins, J.E.; Richter, A.; Holt, S.J.; Campbell, I.; Alexander, P.; Davies, D.E. Two newly established cell lines derived from the same colonic adenocarcinoma exhibit differences in EGF-receptor ligand and adhesion molecule expression. Int J Cancer. 1995, 62, 48. [Google Scholar] [CrossRef] [PubMed]
- Ohata, H.; Shiokawa, D.; Obata, Y.; Sato, A.; Sakai, H.; Fukami, M.; Hara, W.; Taniguchi, H.; Ono, M.; Nakagama, H.; Okamoto, K. NOX1-Dependent mTORC1 Activation via S100A9 Oxidation in Cancer Stem-like Cells Leads to Colon Cancer Progression. Cell Rep. 2019, 28, 1282–1295. [Google Scholar] [CrossRef] [PubMed]
- van der Post, S.; Birchenough, G.M.H.; Held, J.M. NOX1-dependent redox signaling potentiates colonic stem cell proliferation to adapt to the intestinal microbiota by linking EGFR and TLR activation. Cell Rep. 2021, 35. [Google Scholar] [CrossRef] [PubMed] [PubMed Central]
- Chen, M.; Mainardi, S.; Lieftink, C.; Velds, A.; de Rink, I.; Yang, C.; Kuiken, H.J.; Morris, B.; Edwards, F.; Jochems, F.; van Tellingen, O.; Boeije, M.; Proost, N.; Jansen, R.A.; Qin, S.; Jin, H.; Koen van der Mijn, J.C.; Schepers, A.; Venkatesan, S.; Qin, W.; Beijersbergen, R.L.; Wang, L.; Bernards, R. Targeting of vulnerabilities of drug-tolerant persisters identified through functional genetics delays tumor relapse. Cell Rep Med. 2024, 5. [Google Scholar] [CrossRef] [PubMed] [PubMed Central]
- Oren, Y.; Tsabar, M.; Cuoco, M.S.; Amir-Zilberstein, L.; Cabanos, H.F.; Hütter, J.C.; Hu, B.; Thakore, P.I.; Tabaka, M.; Fulco, C.P.; Colgan, W.; Cuevas, B.M.; Hurvitz, S.A.; Slamon, D.J.; Deik, A.; Pierce, K.A.; Clish, C.; Hata, A.N.; Zaganjor, E.; Lahav, G.; Politi, K.; Brugge, J.S.; Regev, A. Cycling cancer persister cells arise from lineages with distinct programs. Nature. 2021, 596, 576. [Google Scholar] [CrossRef] [PubMed] [PubMed Central]
- Barry, C.J.; Pillay, C.S.; Rohwer, J.M. Modelling the Decamerisation Cycle of PRDX1 and the Inhibition-like Effect on Its Peroxidase Activity. Antioxidants (Basel). 2023, 12. [Google Scholar] [CrossRef] [PubMed] [PubMed Central]
- Portillo-Ledesma, S.; Randall, L.M.; Parsonage, D.; Dalla Rizza, J.; Karplus, P.A.; Poole, L.B.; Denicola, A.; Ferrer-Sueta, G. Differential Kinetics of Two-Cysteine Peroxiredoxin Disulfide Formation Reveal a Novel Model for Peroxide Sensing. Biochemistry. 2018, 57, 3416. [Google Scholar] [CrossRef] [PubMed] [PubMed Central]
- Low, F.M.; Hampton, M.B.; Peskin, A.V.; Winterbourn, C.C. Peroxiredoxin 2 functions as a noncatalytic scavenger of low-level hydrogen peroxide in the erythrocyte. Blood. 2007, 109, 2611. [Google Scholar] [CrossRef] [PubMed]
- Barbáchano, A.; Fernández-Barral, A.; Bustamante-Madrid, P.; Prieto, I.; Rodríguez-Salas, N.; Larriba, M.J.; Muñoz, A. Organoids and Colorectal Cancer. Cancers (Basel). 2021, 13. [Google Scholar] [CrossRef] [PubMed] [PubMed Central]
- Buetler, T.M.; Krauskopf, A.; Ruegg, U.T. Role of superoxide as a signaling molecule. News Physiol Sci. 2004, 19, 120. [Google Scholar] [CrossRef] [PubMed]
- Müller, M.F.; Florian, S.; Pommer, S.; Osterhoff, M.; Esworthy, R.S.; Chu, F.F.; Brigelius-Flohé, R.; Kipp, A.P. Deletion of glutathione peroxidase-2 inhibits azoxymethane-induced colon cancer development. PLoS One. 2013, 8. [Google Scholar] [CrossRef] [PubMed] [PubMed Central]
- Banning, A.; Kipp, A.; Schmitmeier, S.; Löwinger, M.; Florian, S.; Krehl, S.; Thalmann, S.; Thierbach, R.; Steinberg, P.; Brigelius-Flohé, R. Glutathione Peroxidase 2 Inhibits Cyclooxygenase-2-Mediated Migration and Invasion of HT-29 Adenocarcinoma Cells but Supports Their Growth as Tumors in Nude Mice. Cancer Res. 2008, 68, 9746. [Google Scholar] [CrossRef] [PubMed]
Figure 1.
GPX1 and GPX2 are in competition for ROOH with PRDX. The greater abundance of PRDXs in most cell types and the higher rate constants of PRDX1 and PRDX2 (2-5-fold) would divert a major portion of ROOH into a signaling relay in combination with a general antioxidant function (blue arrows), largely preventing direct oxidation of proteins (dashed arrow) [3]. The reduction of oxidized PRDXs may be slow (interaction with protein targets and bottleneck at thioredoxin reductase; thioredoxin, TXN; glutathione, GSH), so that GPX1 and GPX2 take up the slack while PRDXs regenerate back to the reduced form, maintaining the required low peroxide tone [4]. When GPX2 and/or GPX1 attain higher relative levels (RED), they would siphon ROOH from the PRDX oxidant relay and alter the impact of ROOH signaling. B. In the GI tract, where a few cell types have very high levels of GPX2, there may be a dependance on GPX1/2 over and above that of repressed PRDXs to prevent direct oxidation of cell components by ROOH, demonstrable when GPX1 and GPX2 are knocked out in mice, leading to excess apoptosis and anoikis, the latter responsible for inflammation of the ileum and colon.
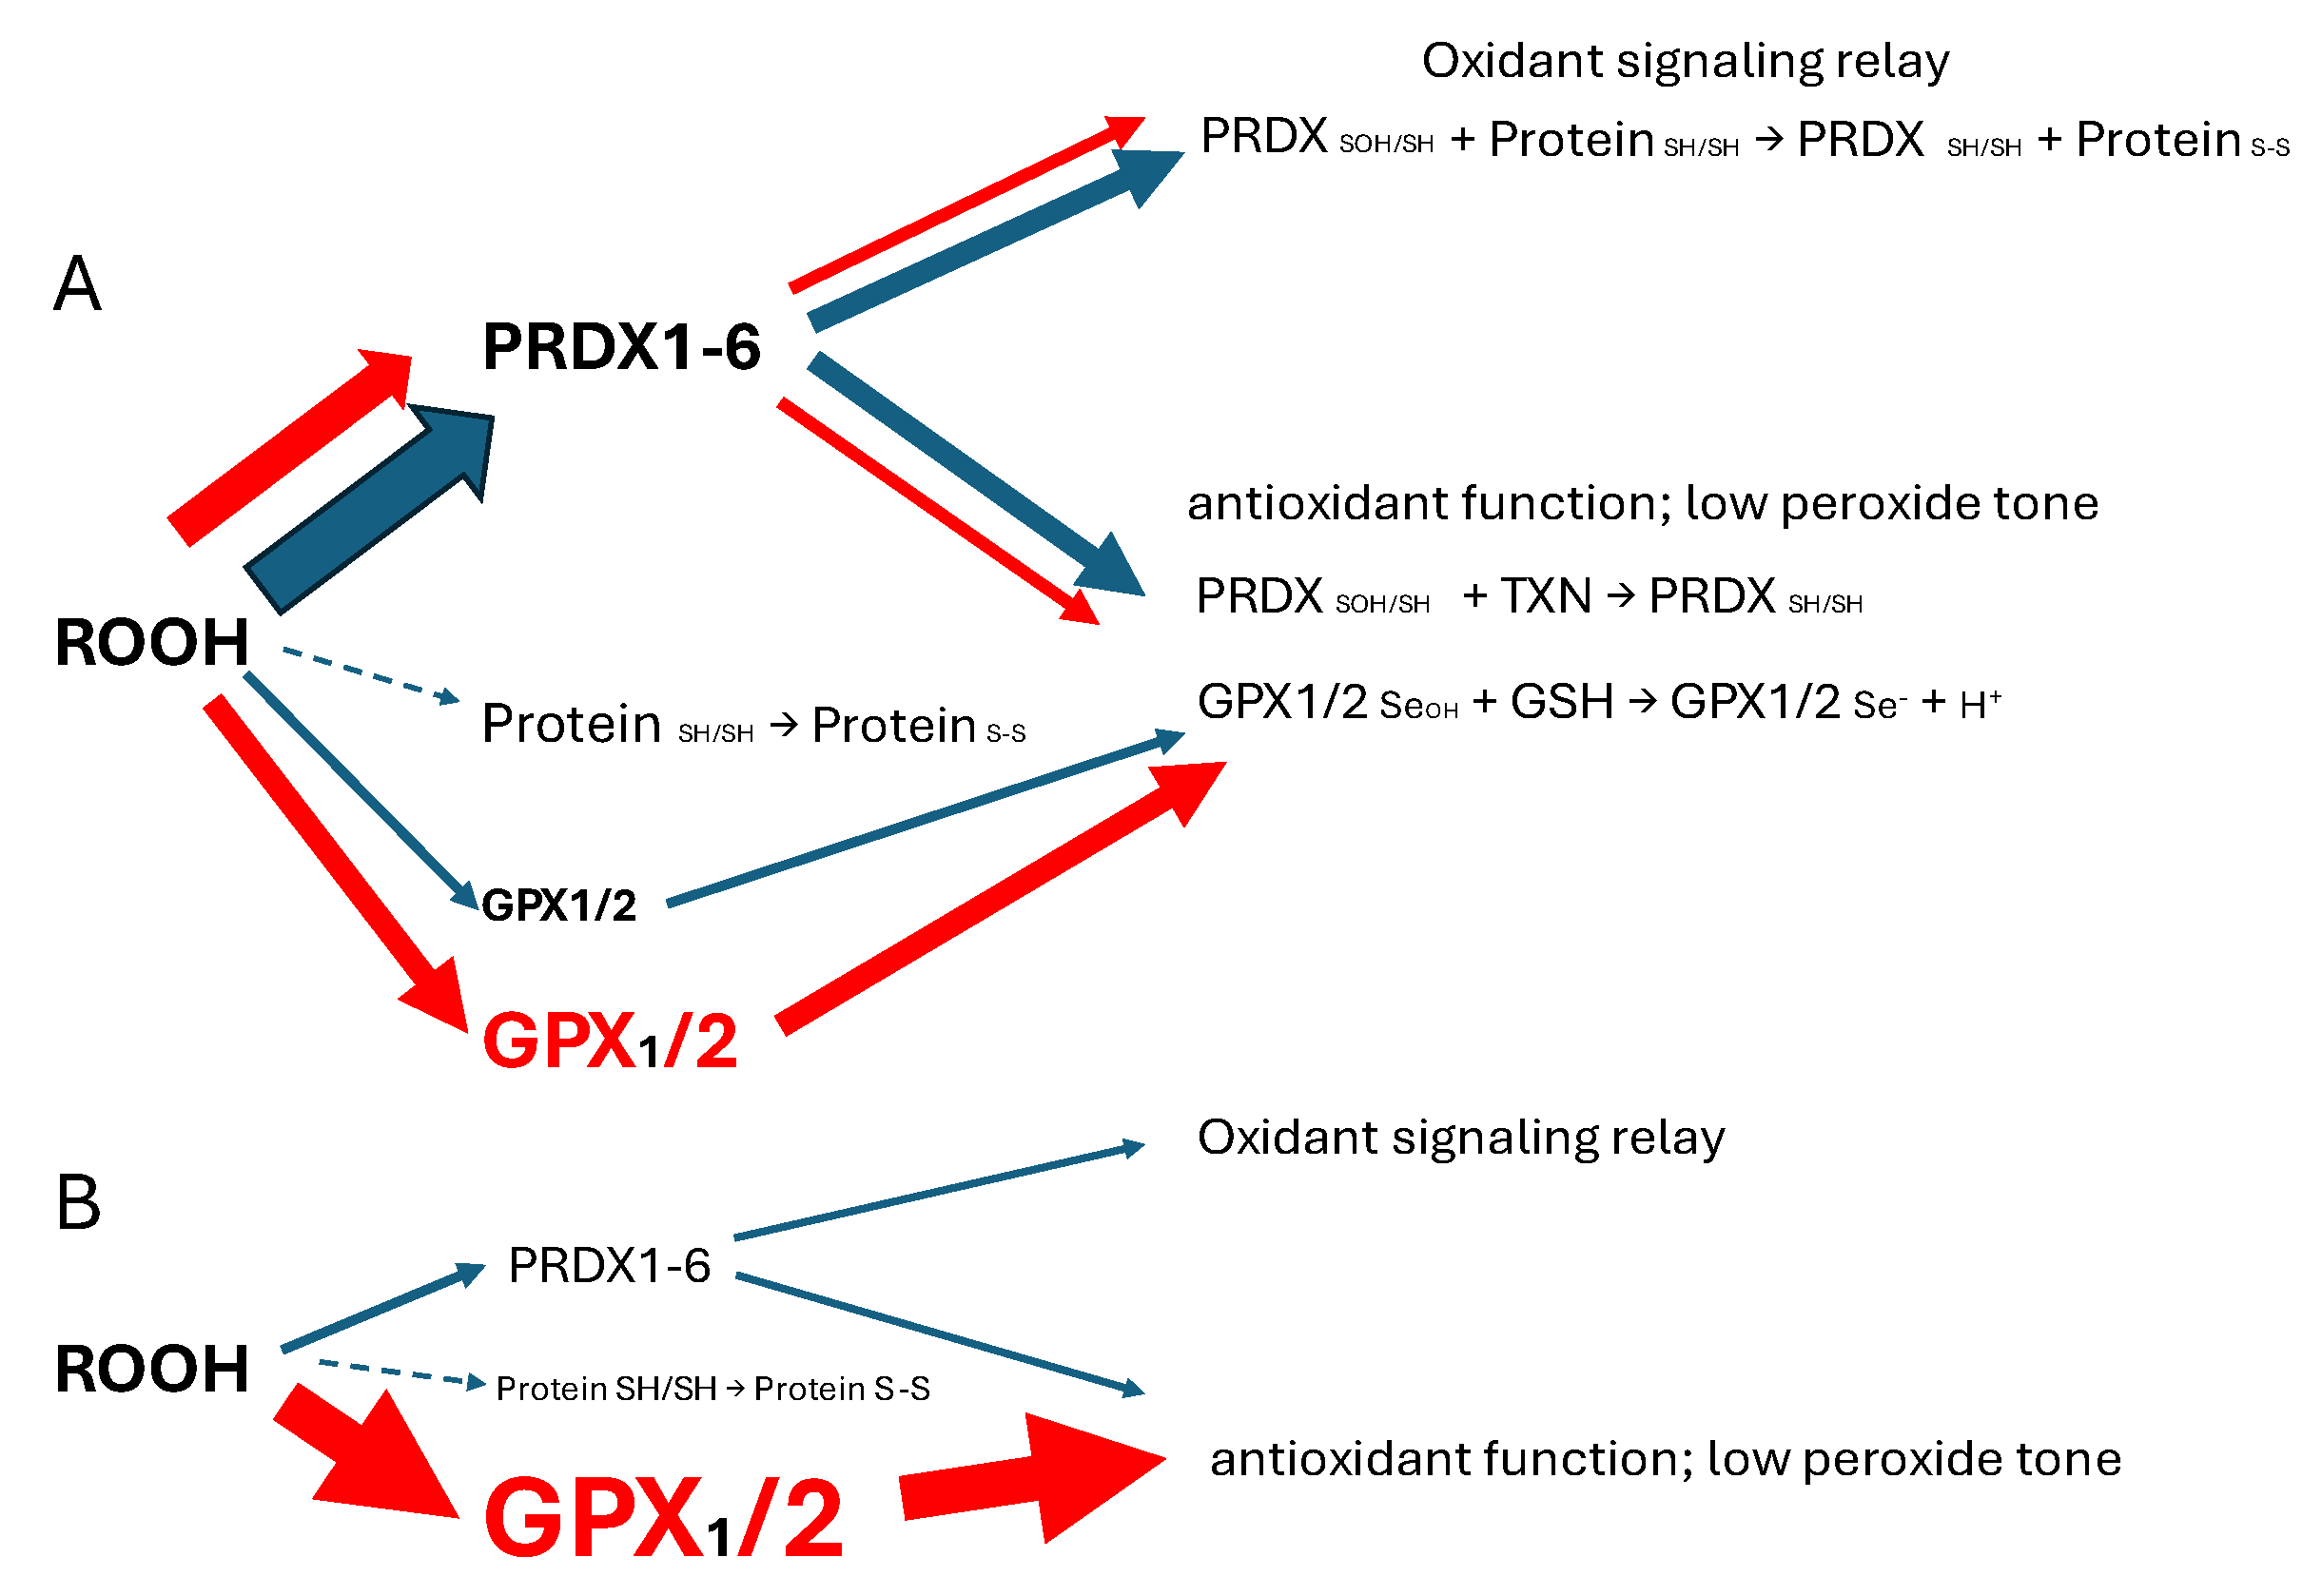
Figure 2.
Comparison of normal tissue and tumor sample GPX2 (panel A) and NOX1 expression levels (panel C) (log 2 TPM) with levels in cancer-derived cell lines (panels B and D; log2 TPM+1) (TIMER2.0 and DepMap-5/11/24). The CRC tumor sample GPX2 IHC insert (THPA) is estimated to have GPX2 expression levels falling inside the upper bracket (COAD tumors). The lower bracket denotes rare samples with very low expression. Low expressing READ tumors are also bracketed. ? denotes high GPX2 expression from a few normal cells in colon. The dashed lines across the cell line GPX2 expression panel denotes 2 thresholds for significant levels, relative to total antioxidant gene expression- GPX1, GPX2, PRDXs 1-6 and catalase- in TPM (2045 total TPM). The median GPX2 expression level for all cell lines is 0.5 TPM. BLCA and H&N tumor samples have broad ranges of GPX2 expression (red and blue rectangles) along with LIHC, suggesting nothing anomalous with isolation of both high and low GPX2 expressing cell lines, unlike COAD/READ. Panel E shows the correlation between the median tumor levels and the median cell lines levels for each tumor type. TCGA tumor abbreviation convention is used (https://gdc.cancer.gov/resources-tcga-users/tcga-code-tables/tcga-study-abbreviations).
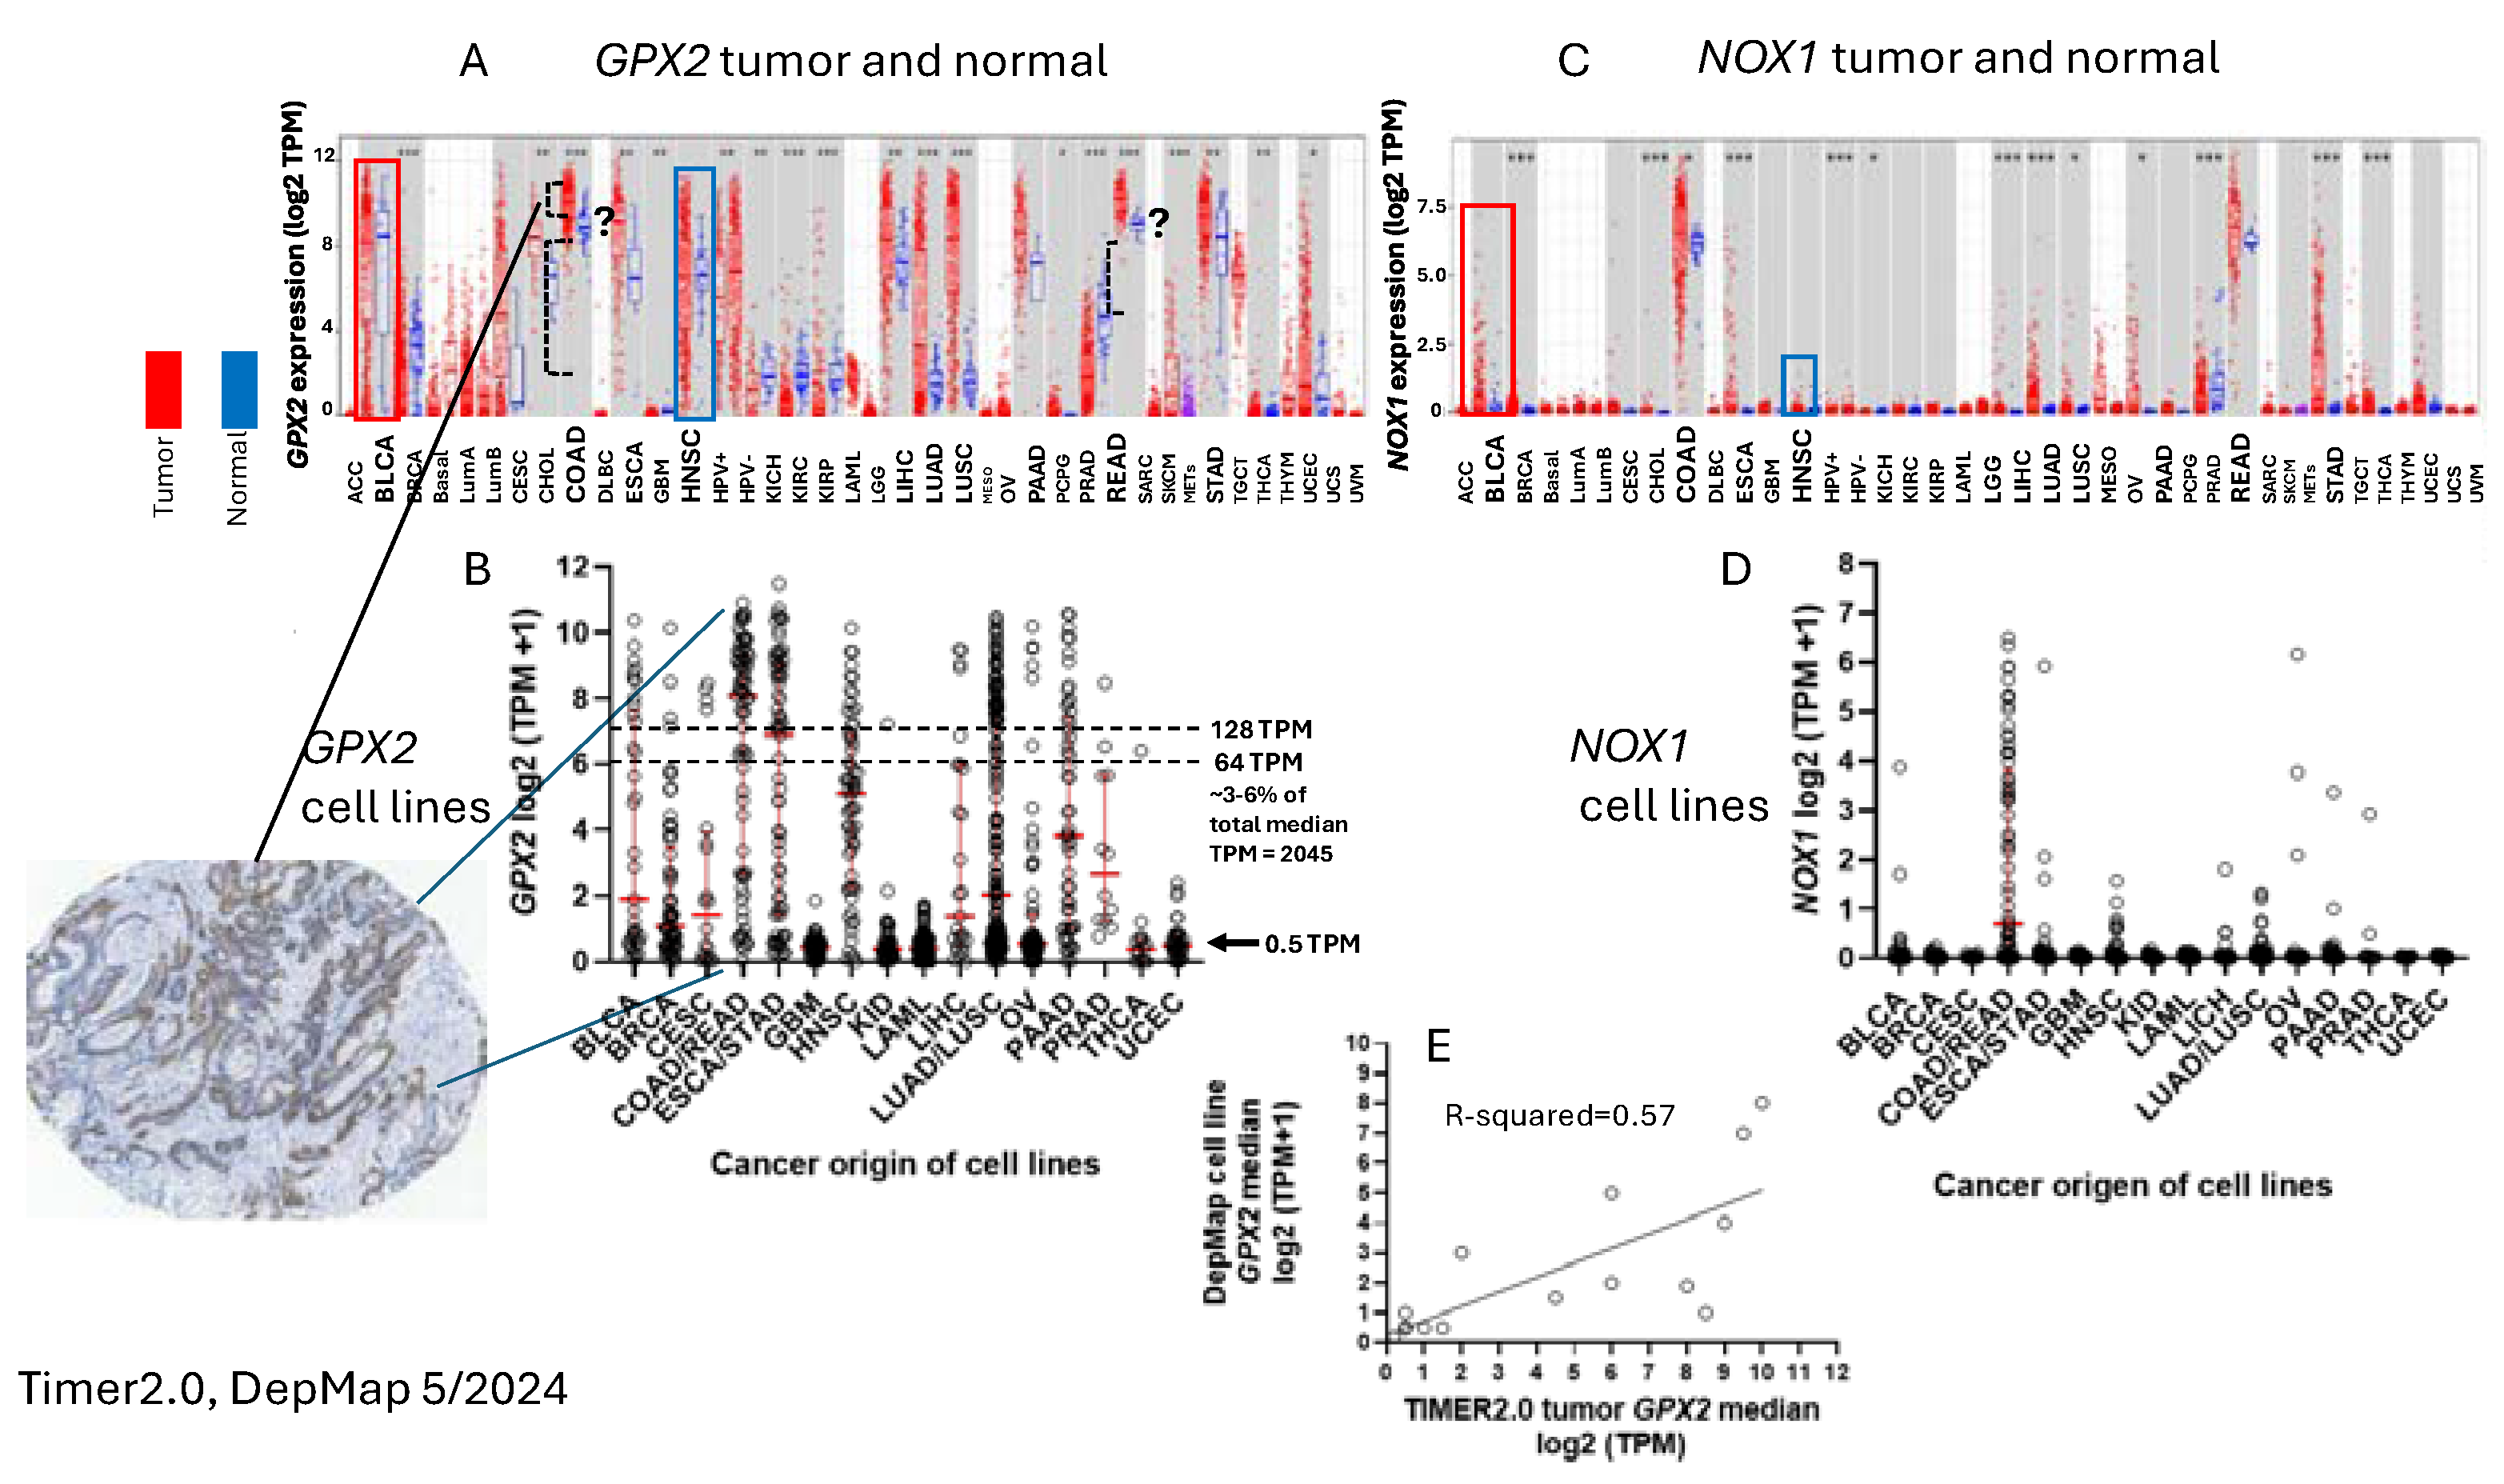
Figure 3.
The few cells with high GPX2 protein levels in small intestine are at the crypt base (lower panel) and appear to be Paneth cells (upper panels). This localized high GPX2 expression may supersede PRDX for overall antioxidant protection (Figure 1B). Some low-level expression may extend to the top of the crypt to include other cell types (THPA: NOS (M-00100) Patient id: 2411; 5/5/2024).
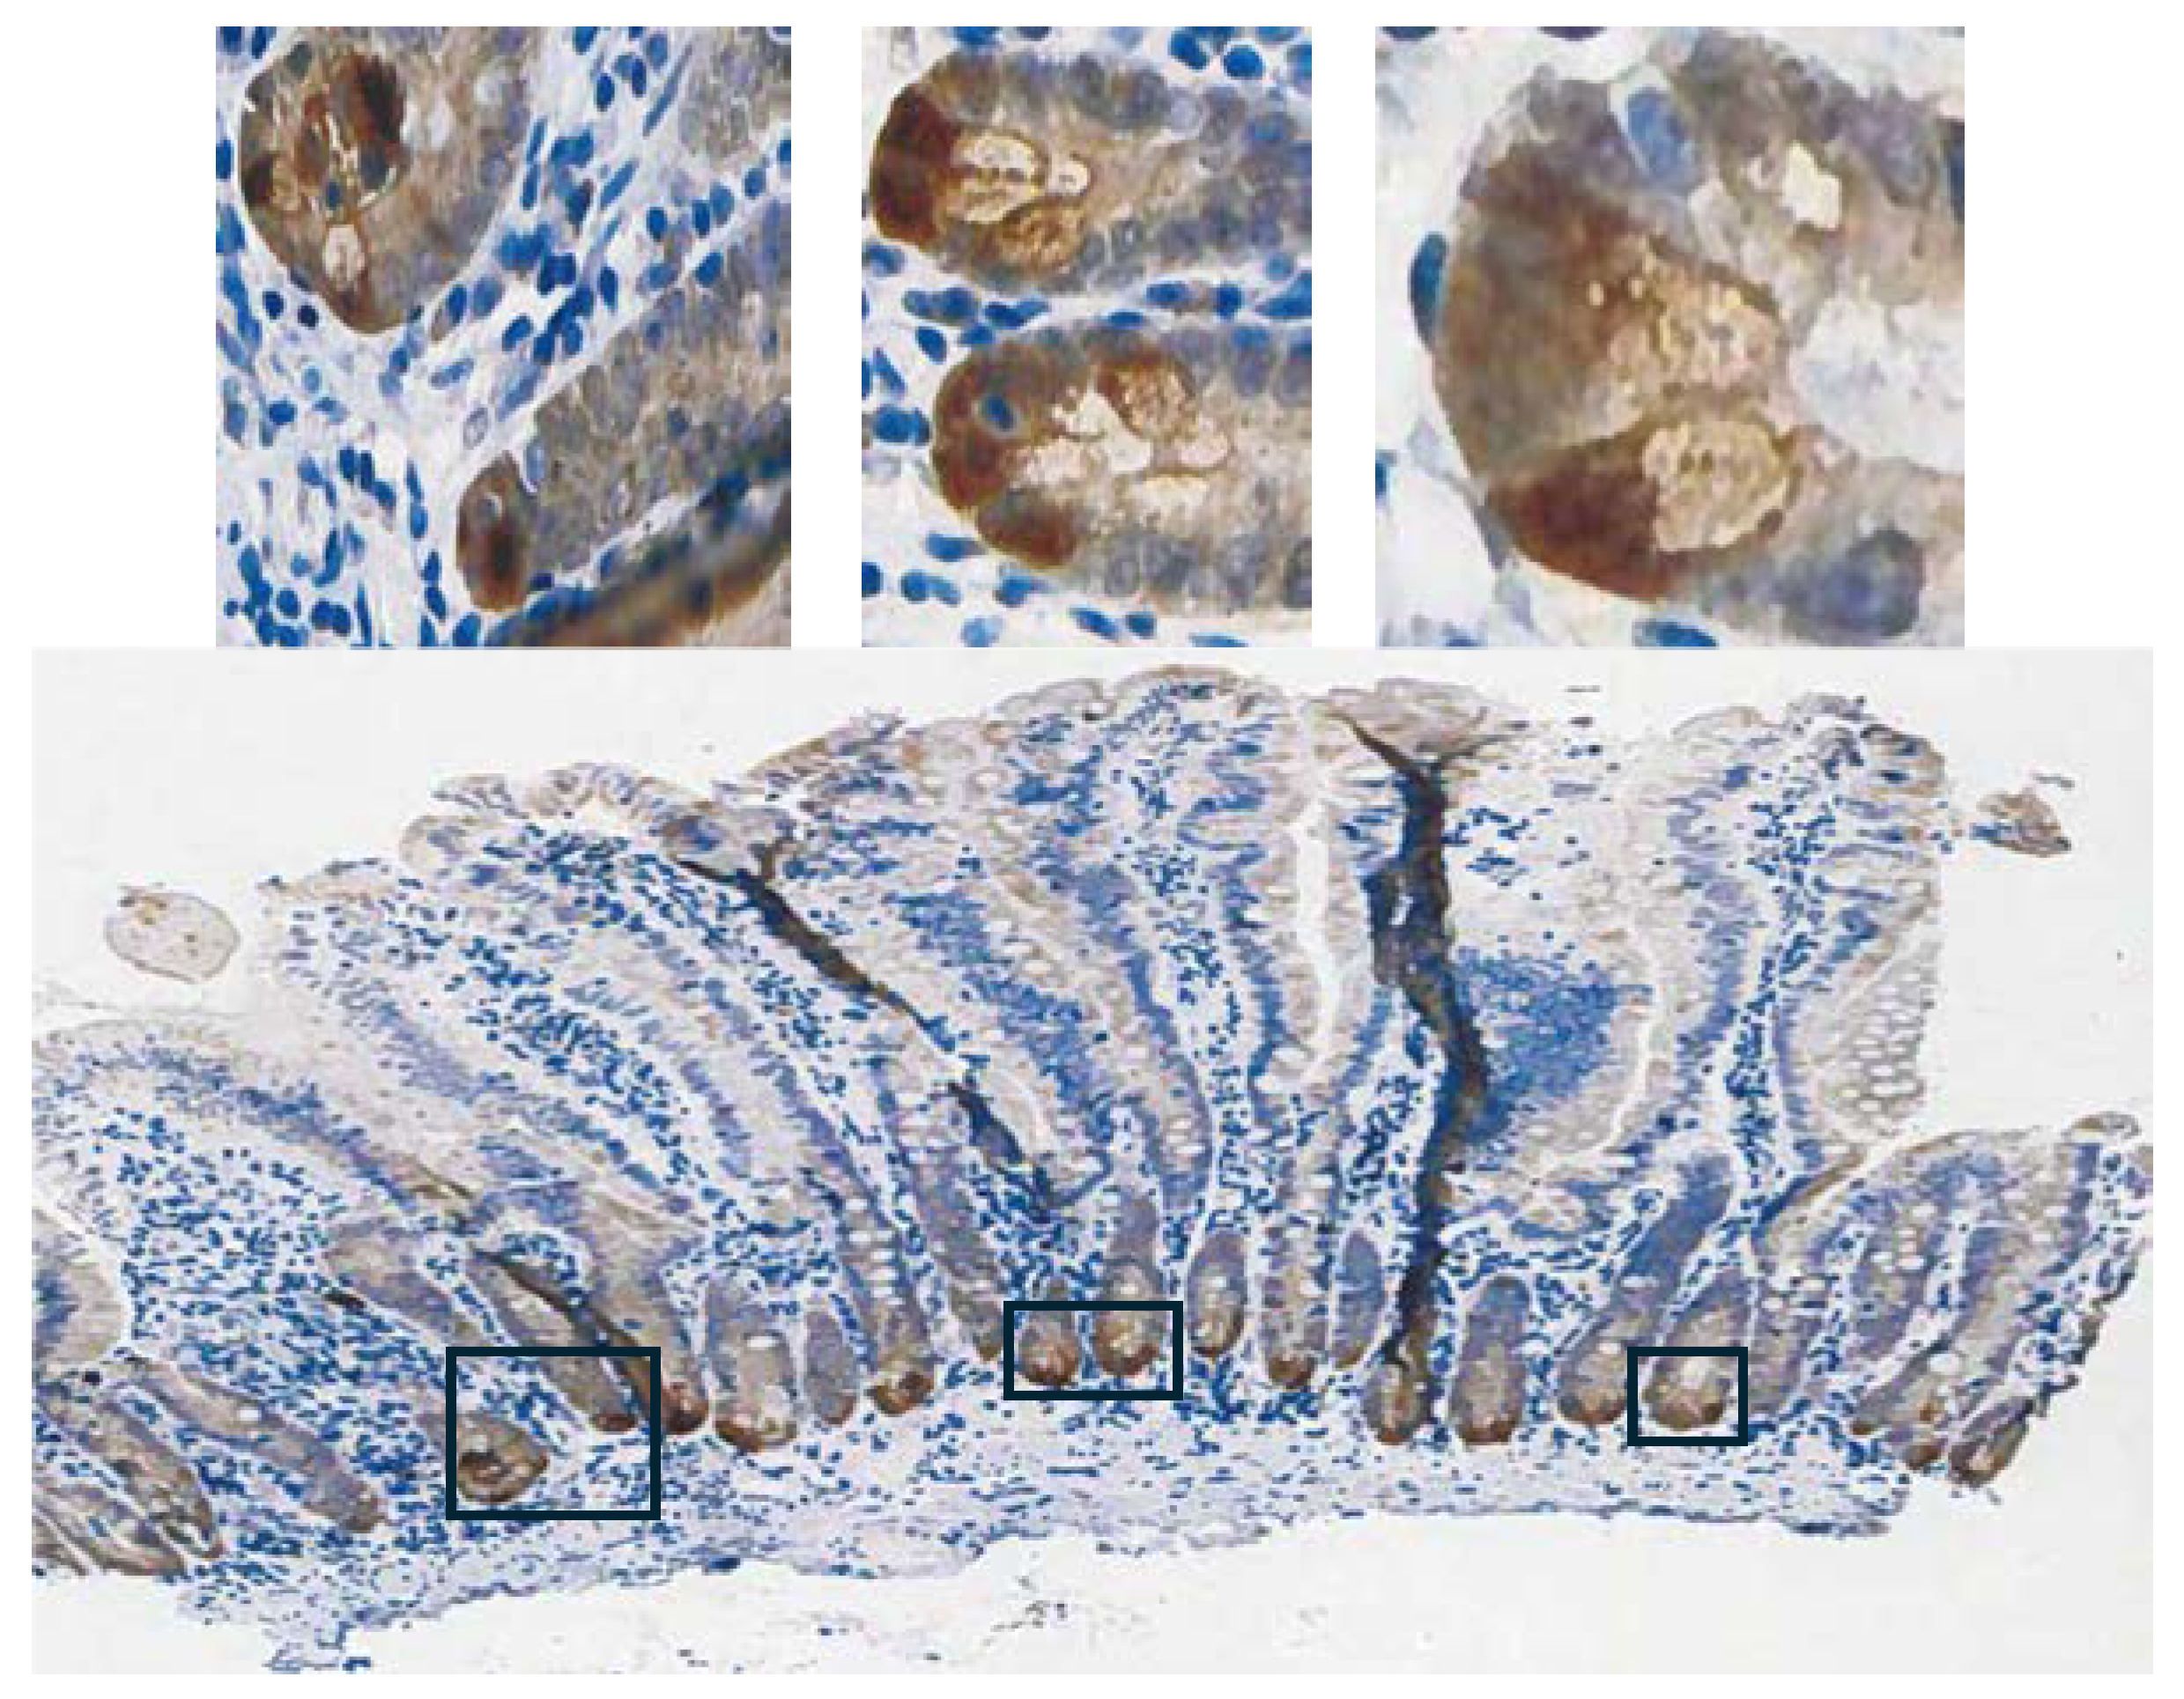
Figure 4.
Antioxidant gene expression levels in CRC-derived cell lines (panel A; DepMap) with the fraction of total antioxidant enzyme TPM levels (panel B). The median total TPM for CRC cell lines is larger than for all cell lines, suggesting that a previous threshold for significant GPX2 levels of 64 TPM is too low and 128 TPM is more appropriate [1]. Error bars are median levels and quartiles. The Xed out PRDX5 set indicates the low ROOH rate constant that basically factors PRDX5 from consideration in apprising impact (panel B). Slow reduction of oxidized PRDXs 1 and 2 may bring the enzymes back down into the overall ROOH rate of metabolism with GPX1 and GPX2, although their initial ROOH rate constants are greater than GPX1 and GPX2 [3,4]. Panel C shows an indication of the relative error in DepMap TPM GPX2 and NOX1 values based on comparison with THPA nTPM as a correlation (56 cell lines overlap; R-squared~ 0.92 for both). The colon tumor panel D shows the relative fraction of GPXs and PRDXs to total antioxidant mRNA expression in COAD and READ. The oversized dots in the cell line panels A, B and C represent 3 cell lines discussed in the main text, HT29 (red), SW480 (dark green), and SW620 (yellow).
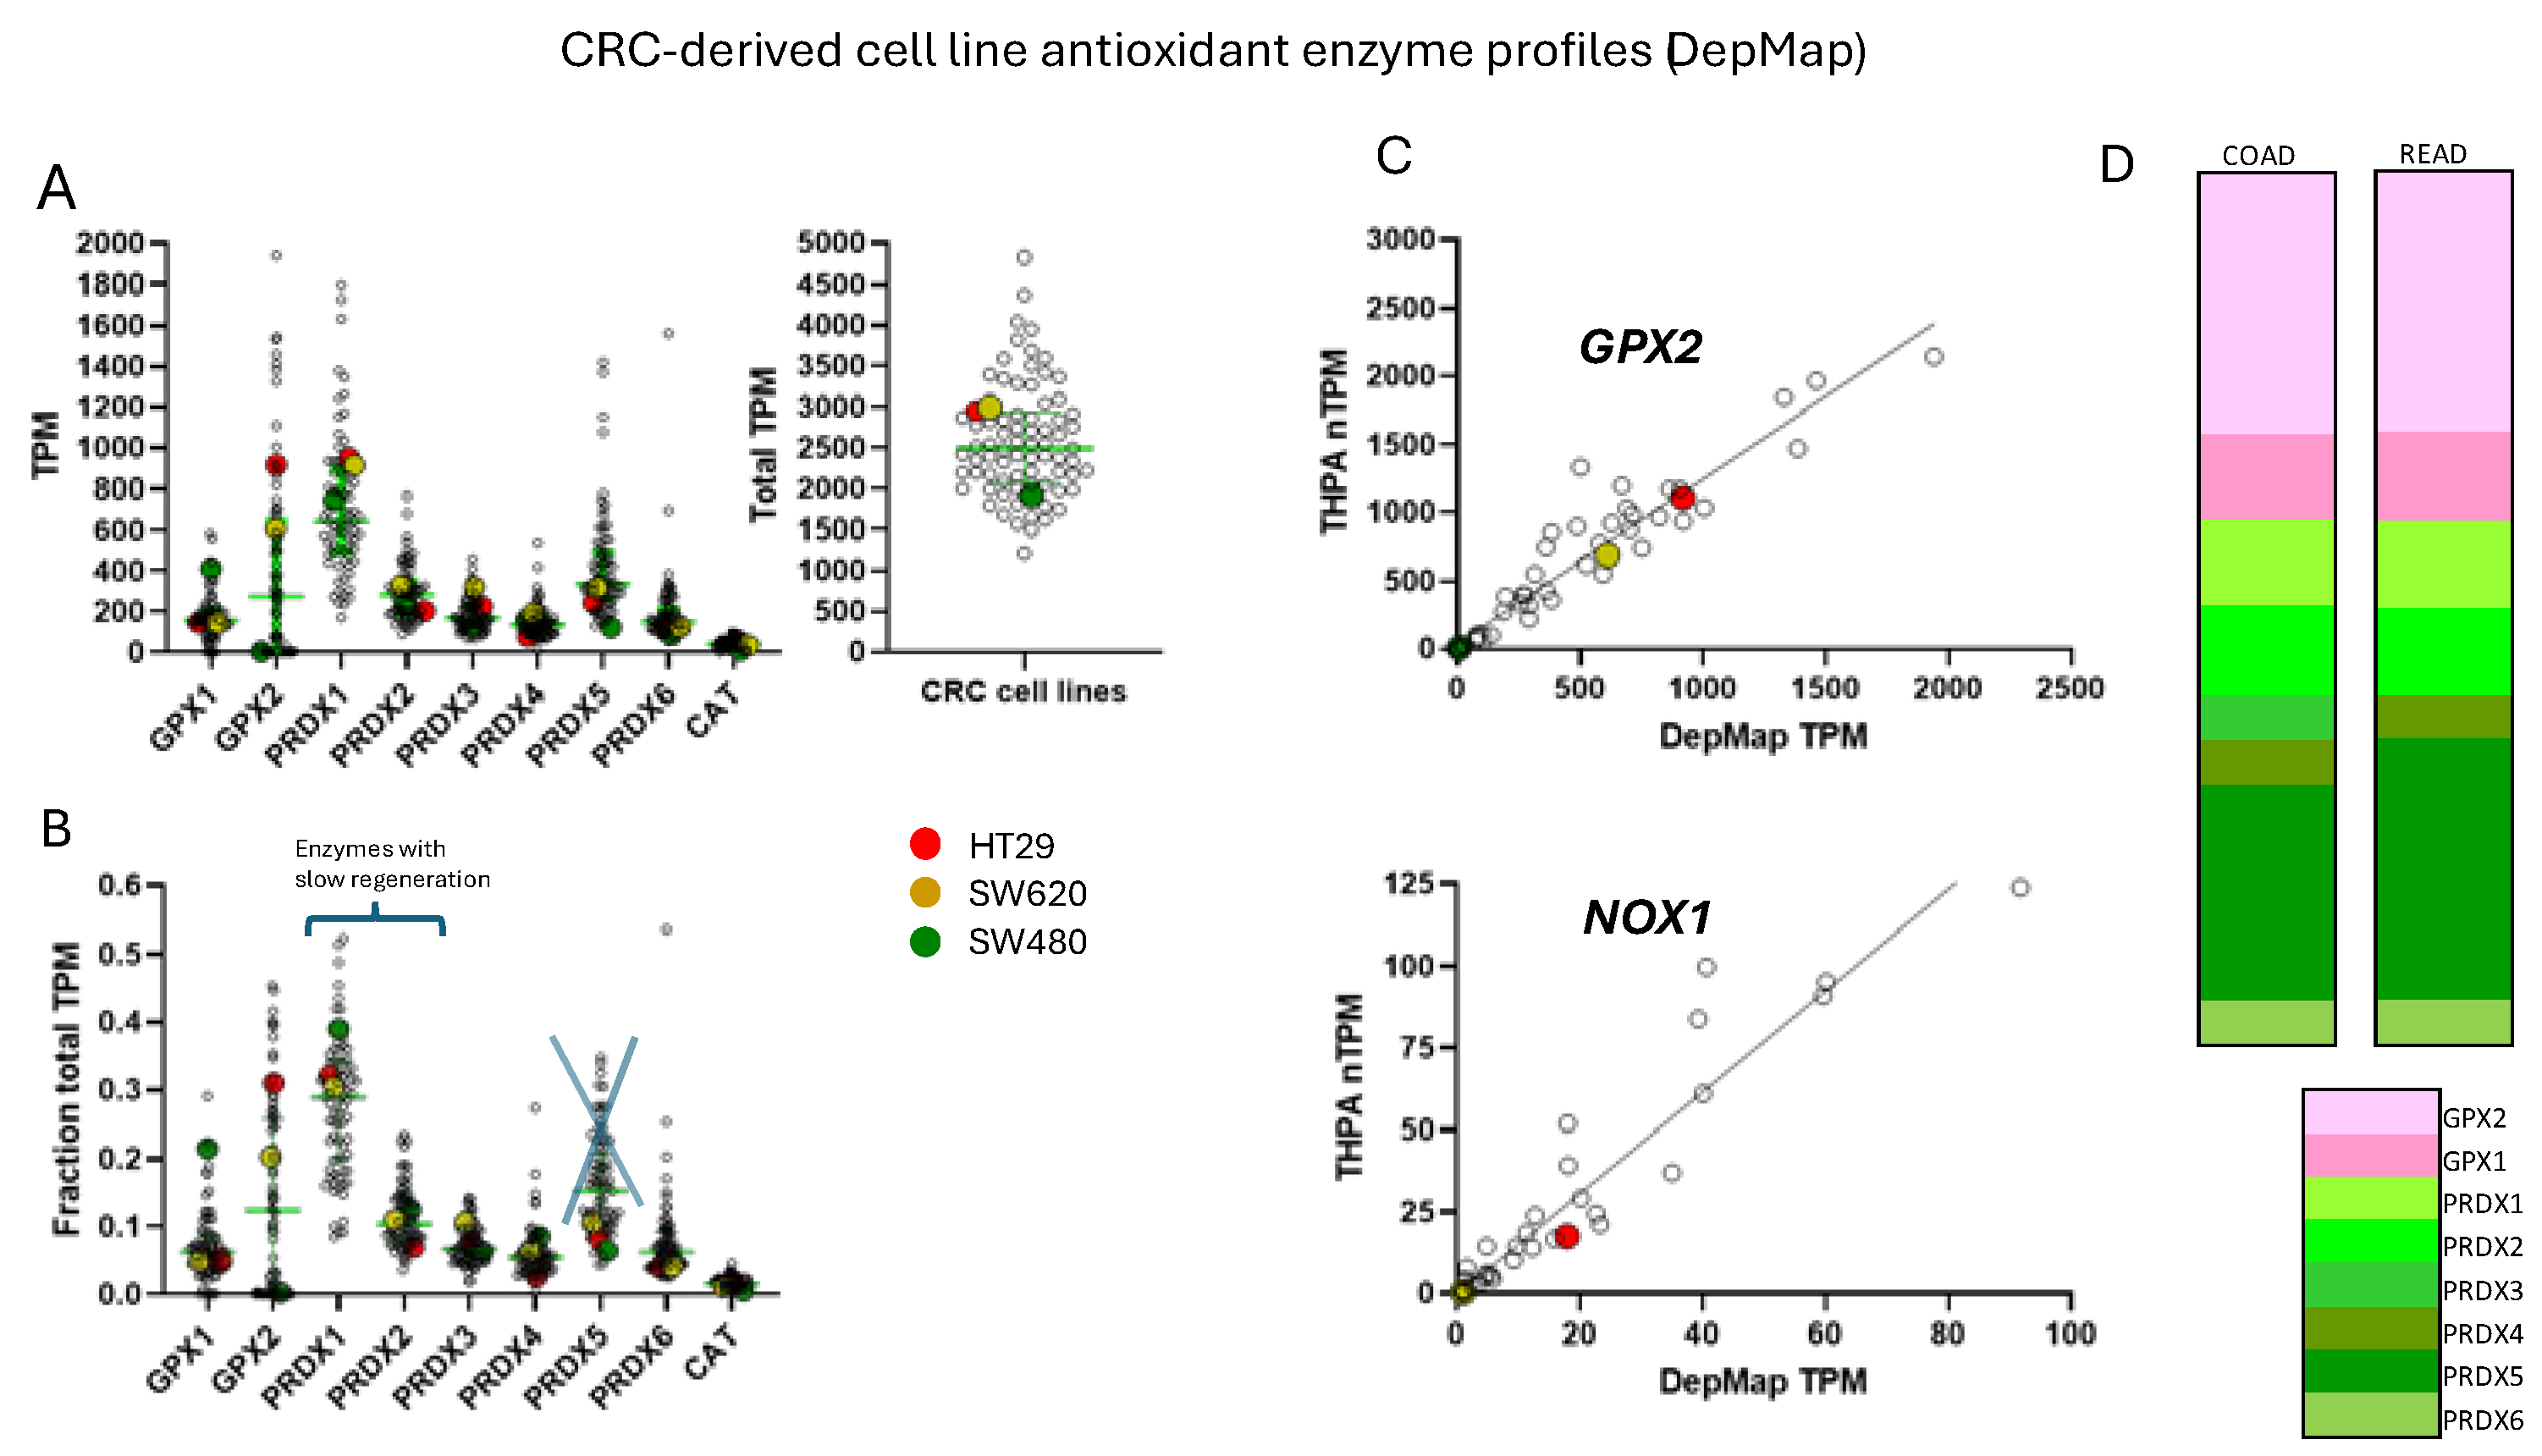
Figure 5.
Correlation of GPX2 and NOX1 expression in the set of 77 CRC-derived cell lines in DepMap (5/2024), denoted by APC gene mutation status. Cell lines HT29, SW480 and SW620 are indicated with arrows. The dashed circle encloses paired cell lines, GP2D and GP5D (same primary), and the dashed oval the suspected DLD1 and HCT15 pair. WT-wildtype APC gene.
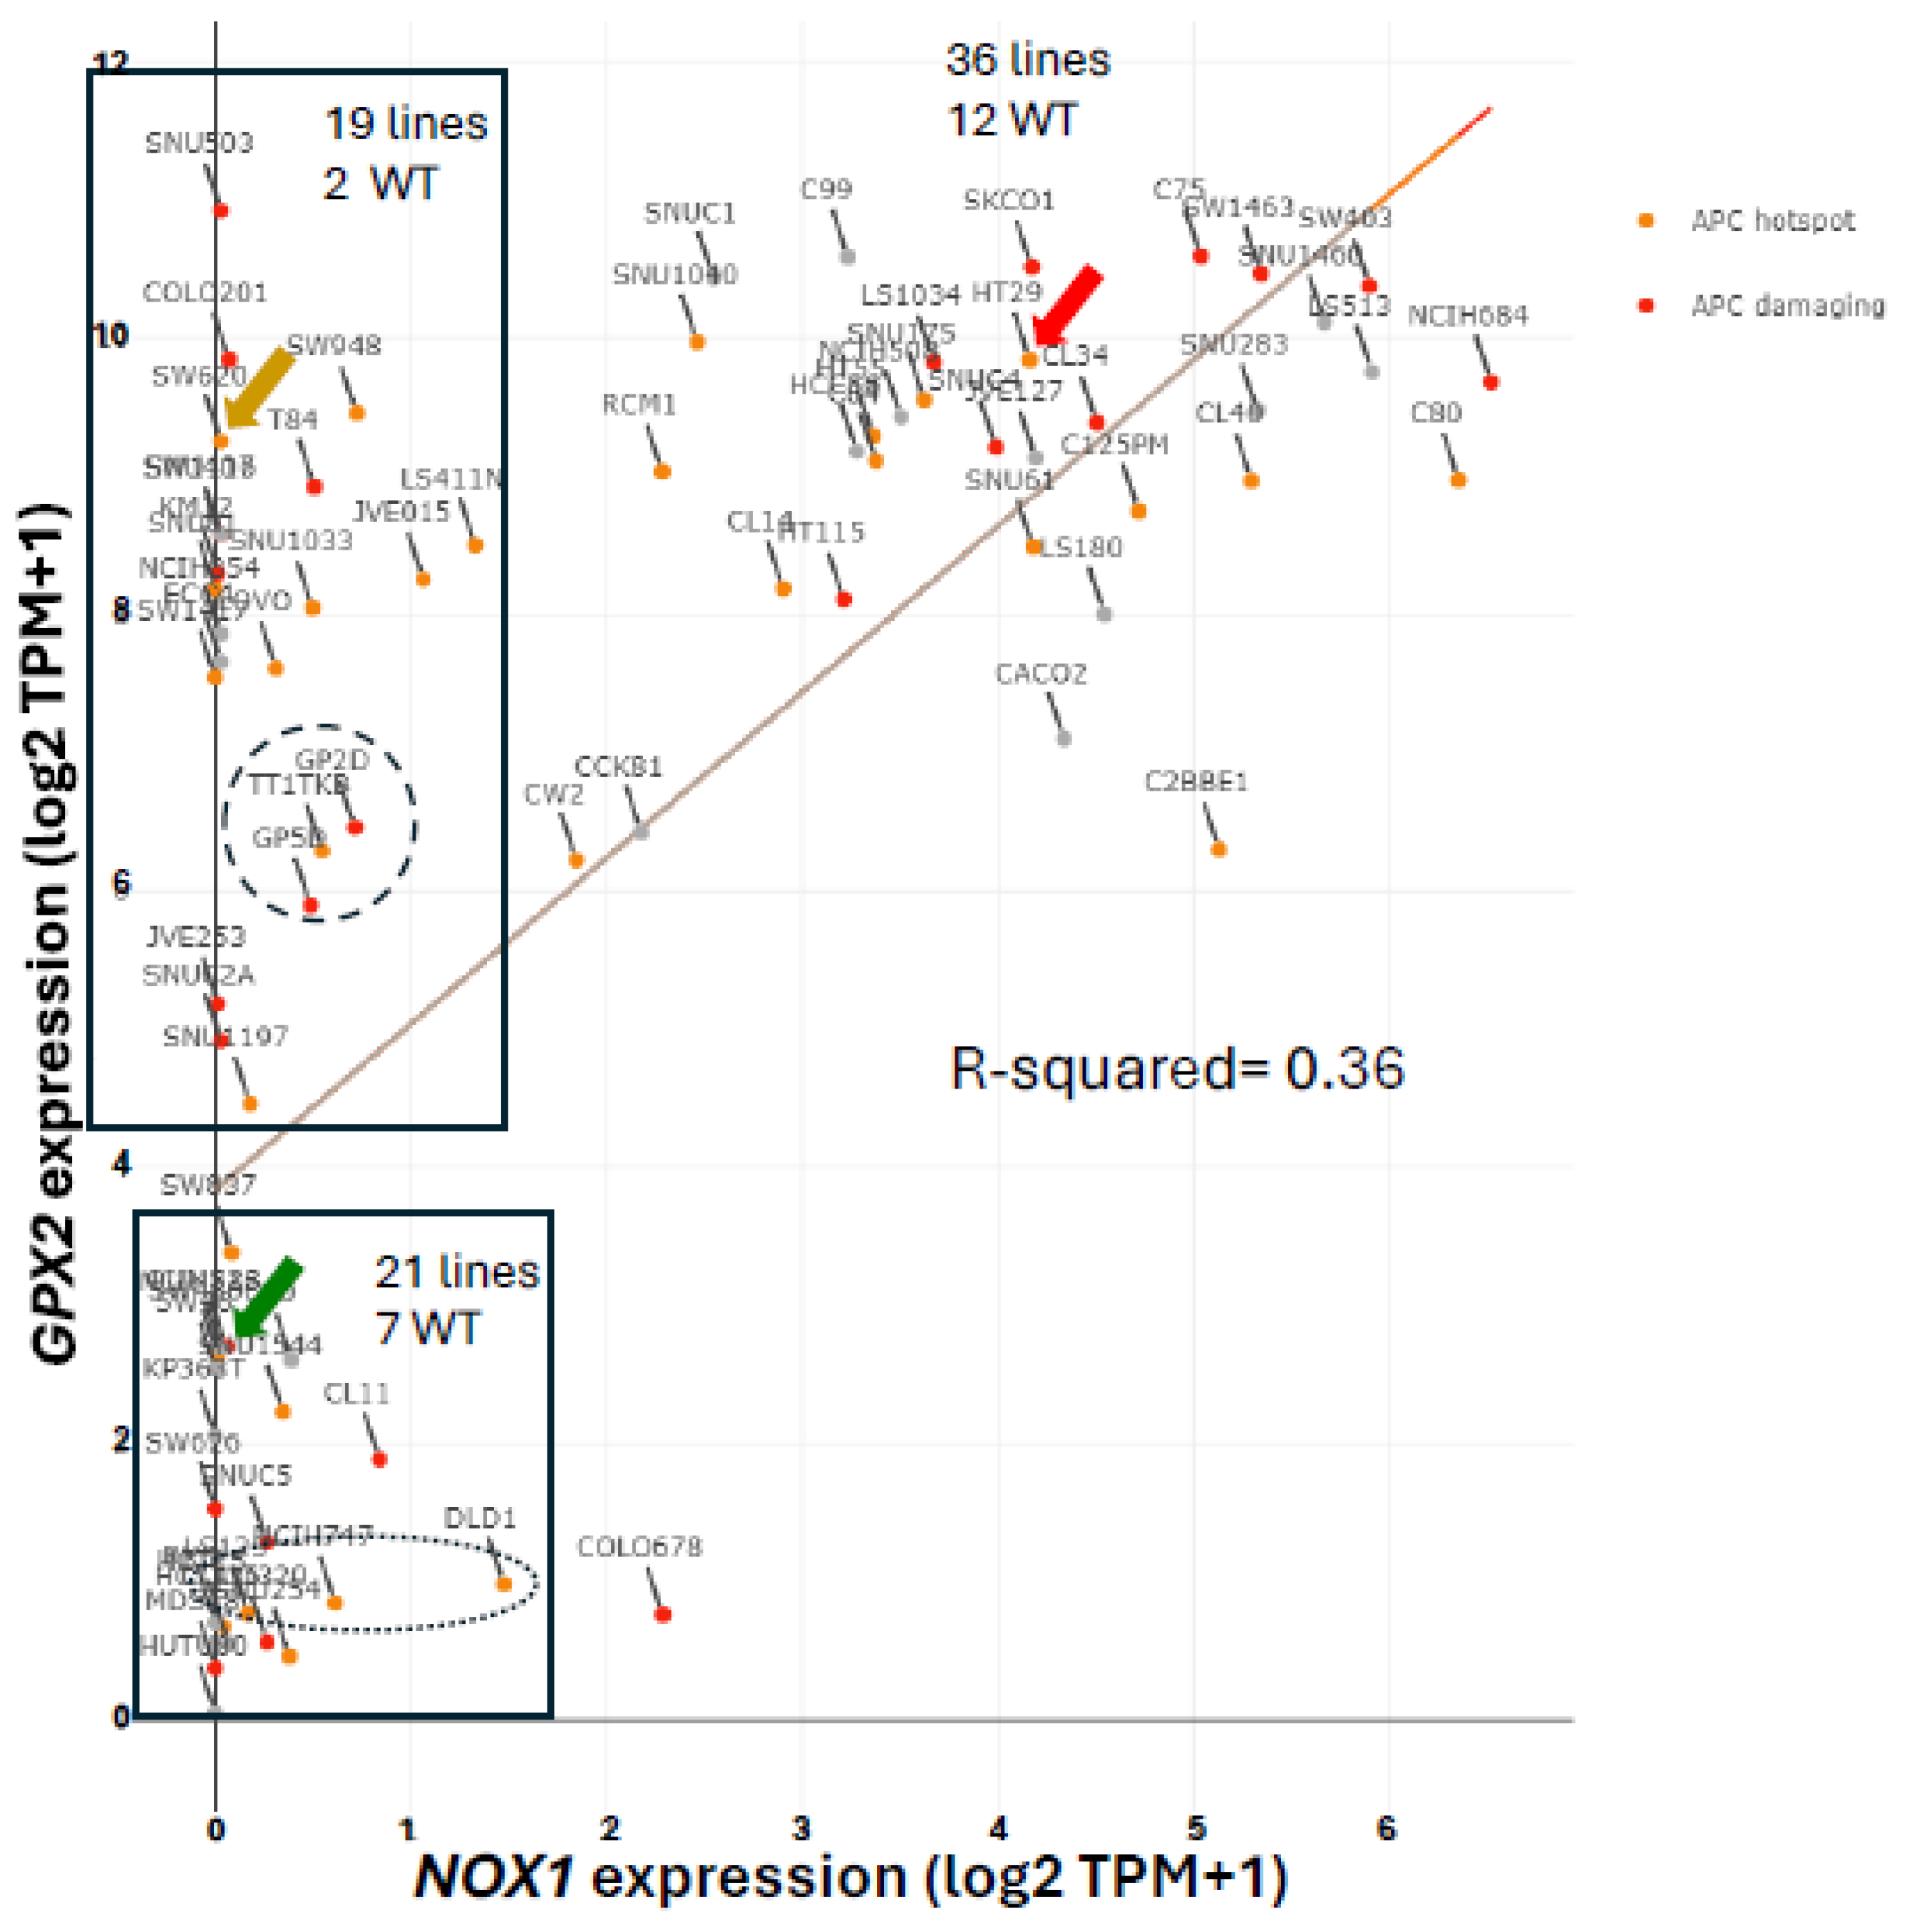
Figure 6.
Discrepancies in the GPX2 expression levels of normal samples in GEPIA based on database sources (TCGA alone or including GTEx). Red text indicates the 2 discrepant sample processing protocols mentioned in GTEx that might contribute to the outcomes. Other genes, such as VIL (villin) are apparently impacted by the alternative GTEx normal tissue sampling protocols; compared to β-actin.
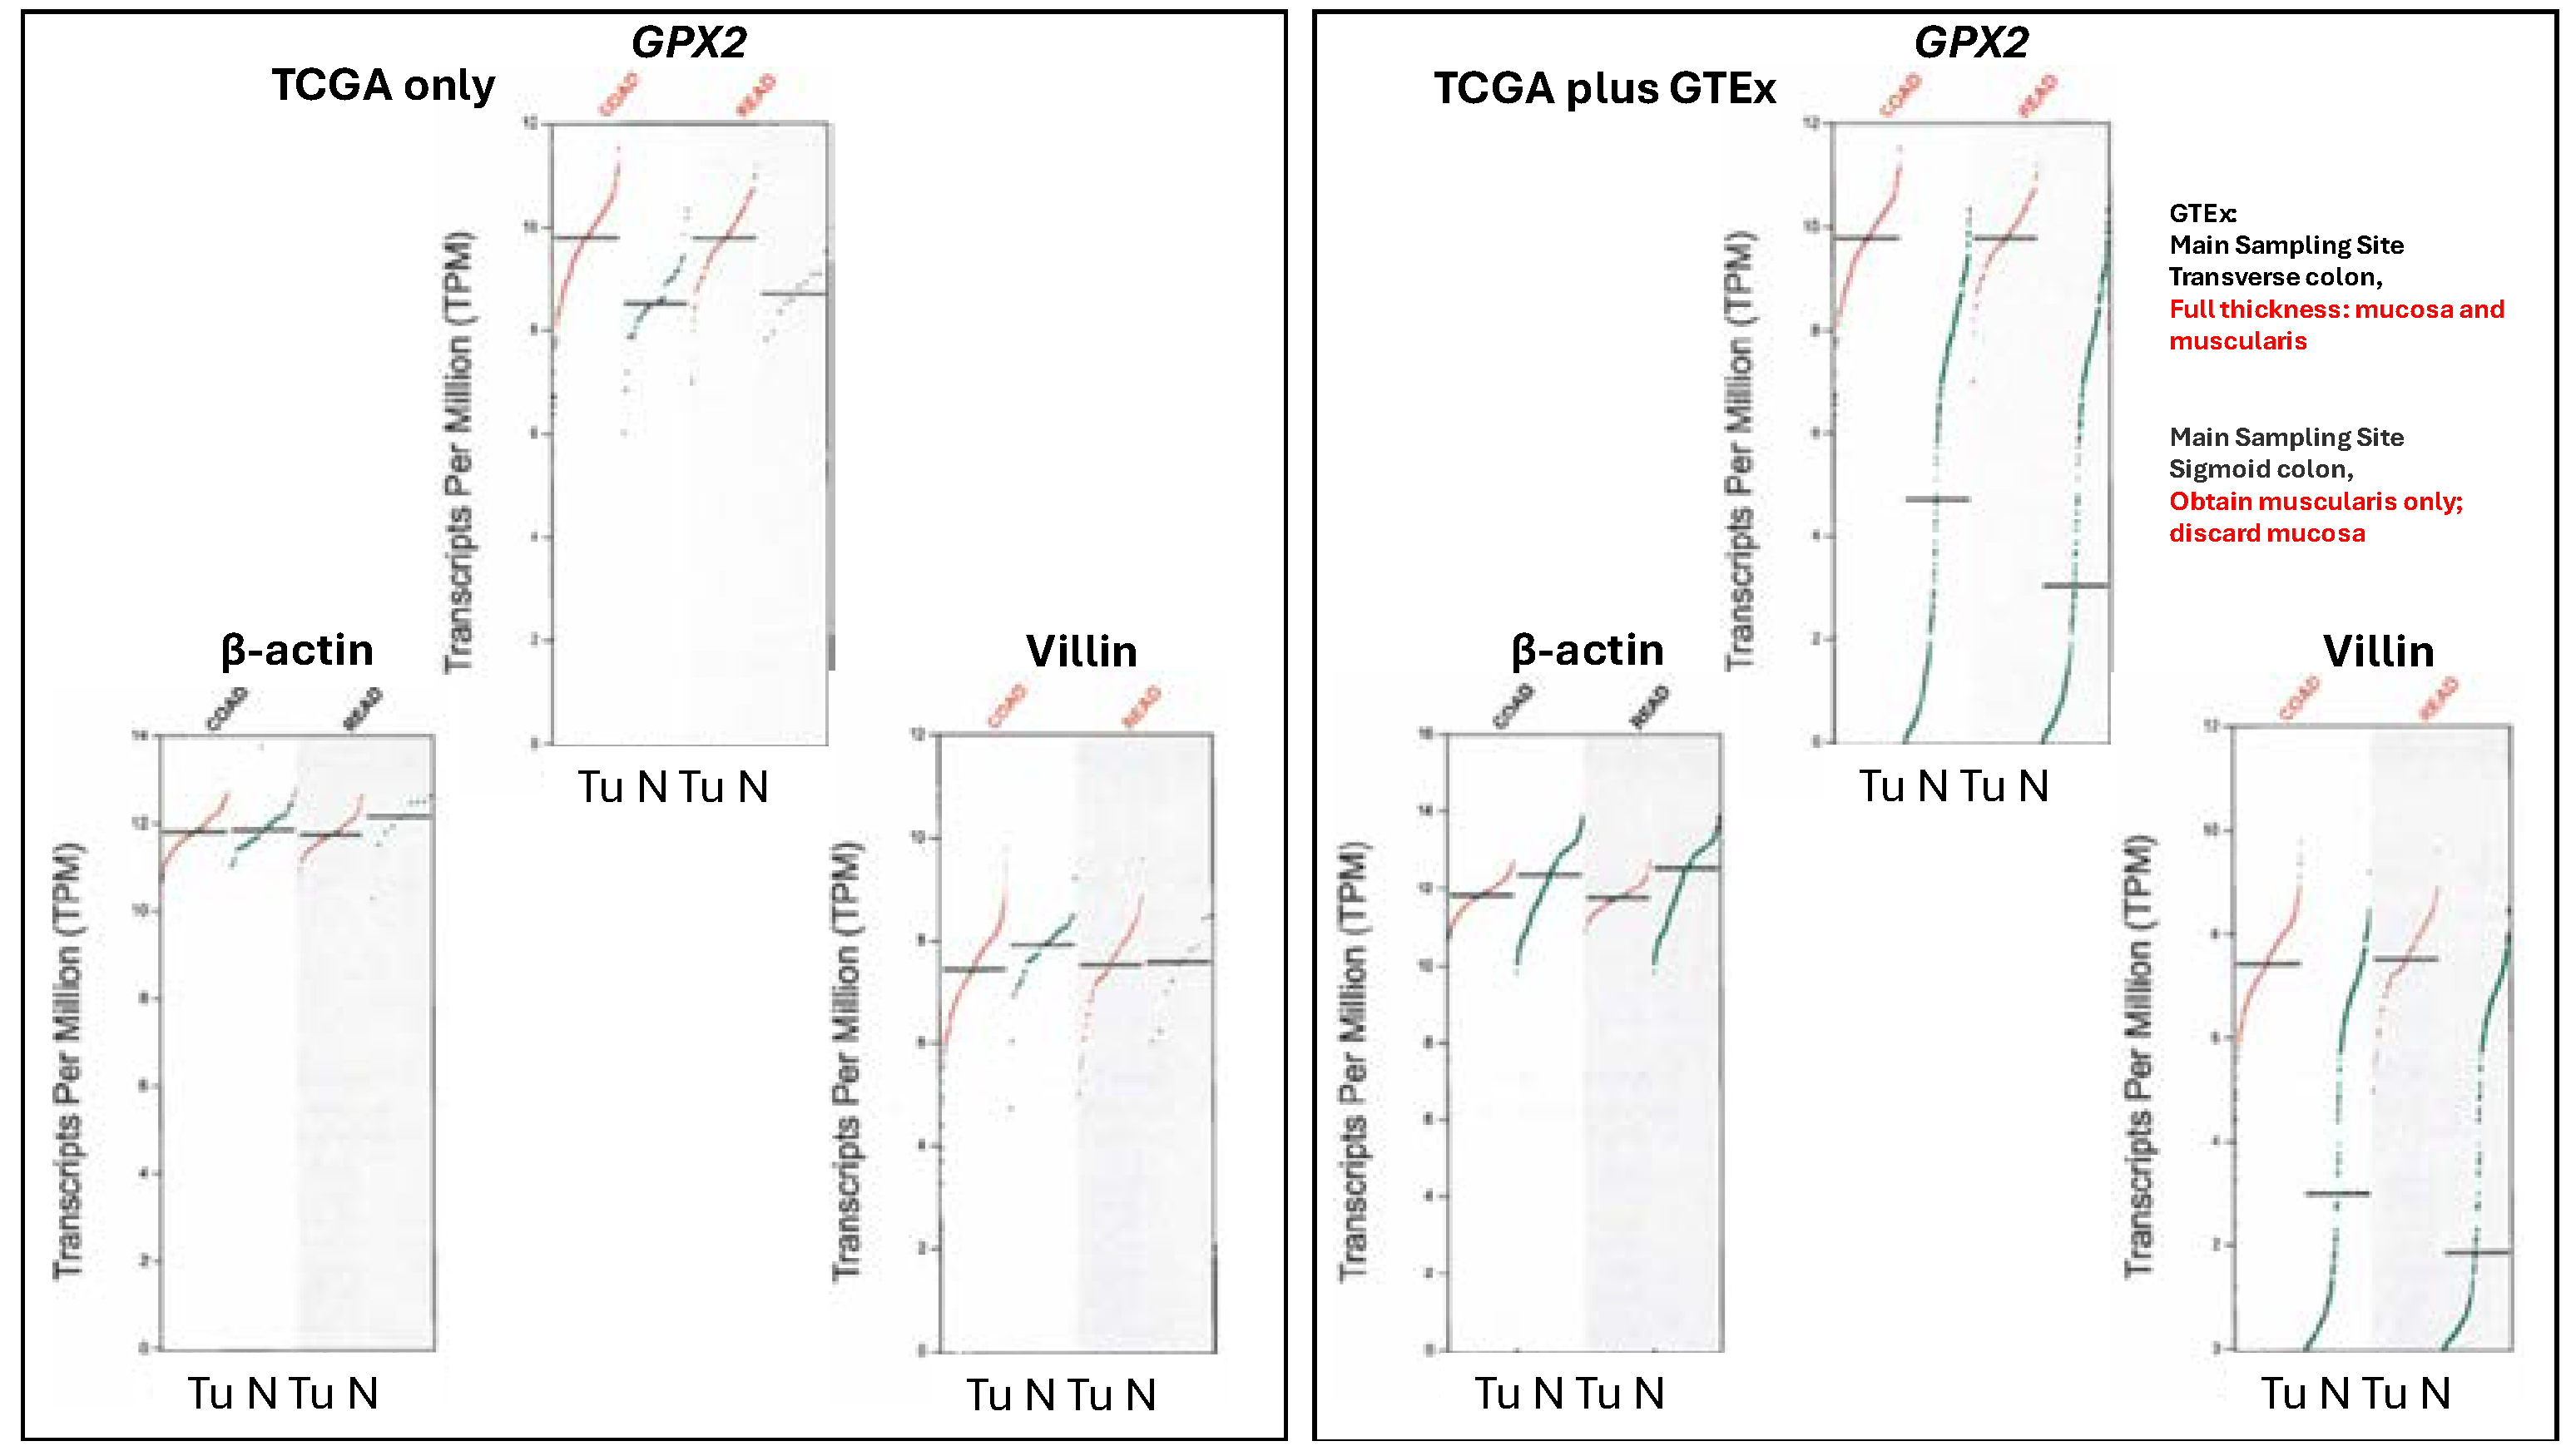
Figure 7.
A set of GPX2 CRC IHC-stained samples showing some variation in staining intensity within the tumors (THPA, 2-5/2024).
Figure 7.
A set of GPX2 CRC IHC-stained samples showing some variation in staining intensity within the tumors (THPA, 2-5/2024).
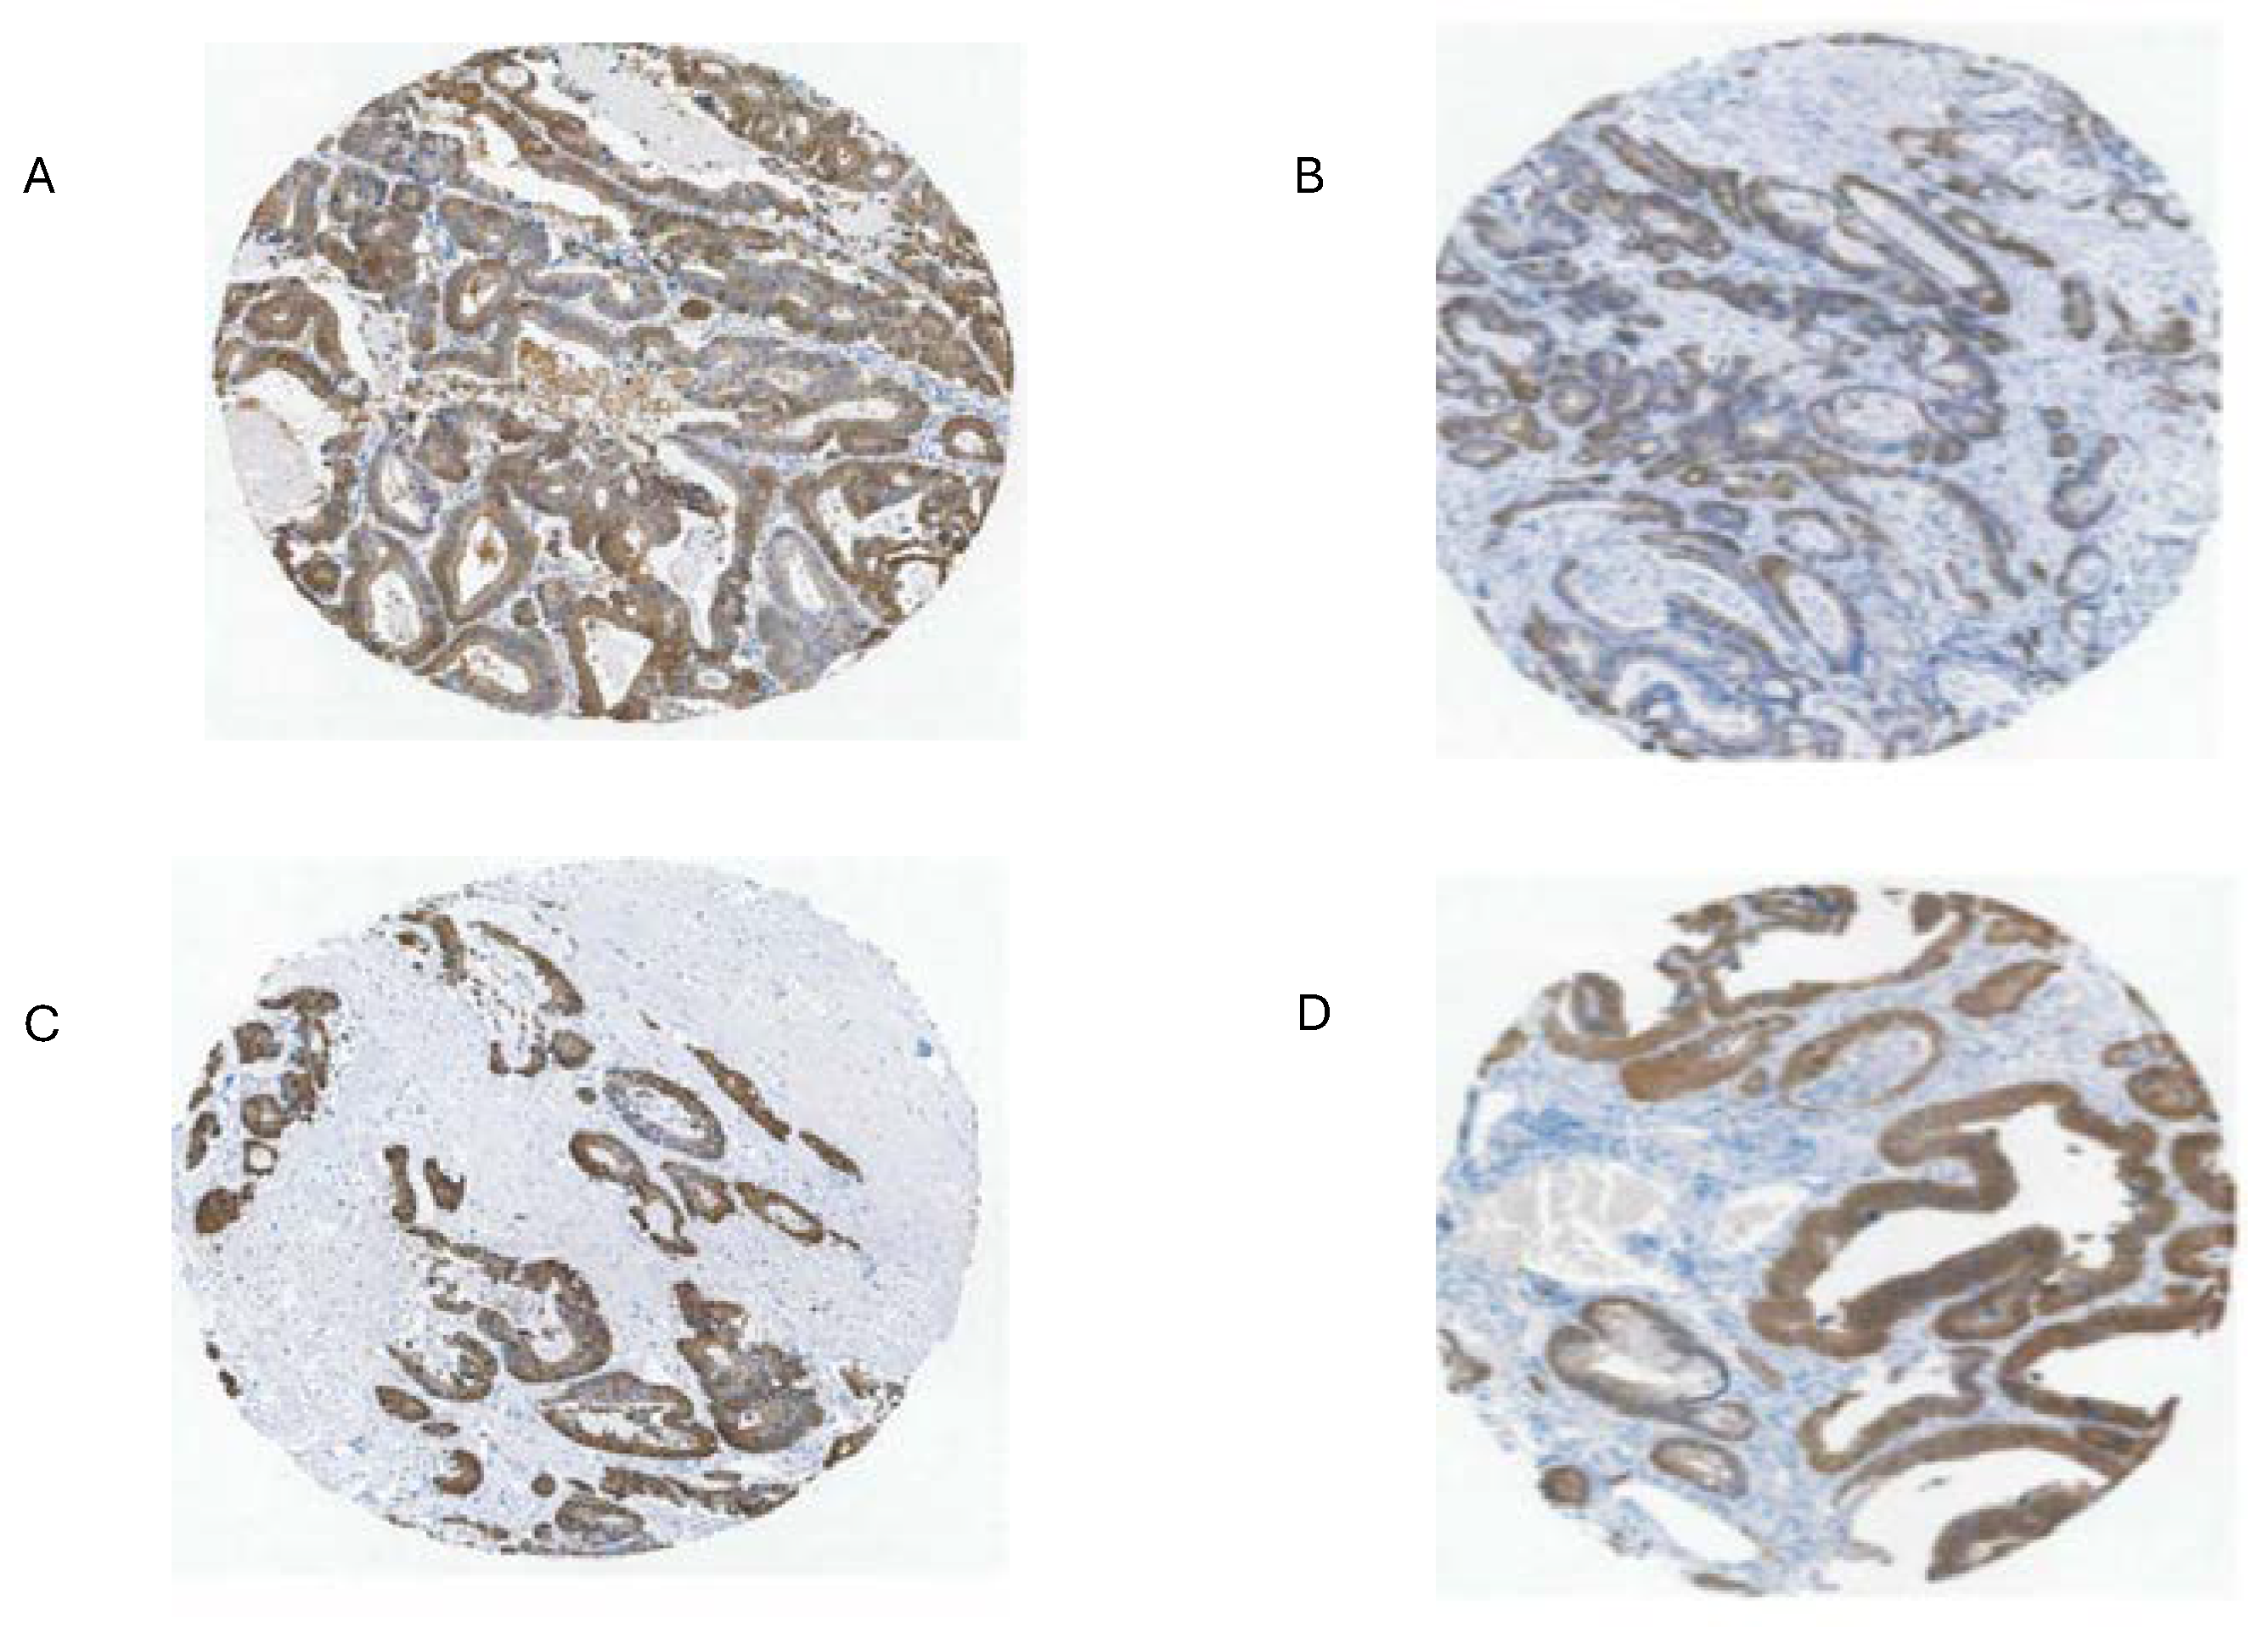
Figure 8.
Classification of cell lines in various schemes into CRC subtypes with GPX2 expression levels (log2 TPM+1)(see references 6-15). Medico et al [6] has the largest set of lines, although only 65 are found in common with DepMAP. NF in panel A indicates cell lines in DepMap and not in Medico et al. Medico et al examines cell lines, exclusively, and expands on the classification scheme of Sadnandam et al [7] with some differences arising between the two with no real impact on the grouping of low and high expressing lines. The Medico/Sadnandam group names are carried over into the other schemes (panels B-H; ent-enterocyte-like; gob-goblet-like; ta-transit amplifying-like; inf-inflammatory-like; stem-stem cell-like; nf-not found in Medico et al) since the information was obtained from processing by Medico et al, except for panels F, H and G. Properties of the groups are listed above in panels B-H (EMT-epithelial to mesenchymal transition; Cimp- CpG island methylator phenotype; MSI-microsatellite instability). Panel H is a consensus set of the groups in panels B-G that contained 34 cell lines in total with the overlap with DepMap shown [13]. Panel I shows groupings obtained using markers differentiating adenocarcinoma and mucinous adenocarcinoma portrayed as a spectrum of goblet-like properties [14]. Panel J shows the origin of the cell lines between the primary tumor (Prim) and metastatic sites (Met). ? Not clear. MSI+ cell lines. NS-no significant differences in GPX2 expression levels among groups. Oversized dots indicate cell lines HT29 (red), SW480 (dark green) and SW620 (yellow). Stout arrow in panel G indicates that EMT is a strong property of the 1.1 class and the thin arrow that class 1.2 has the most inflammatory-like lines.
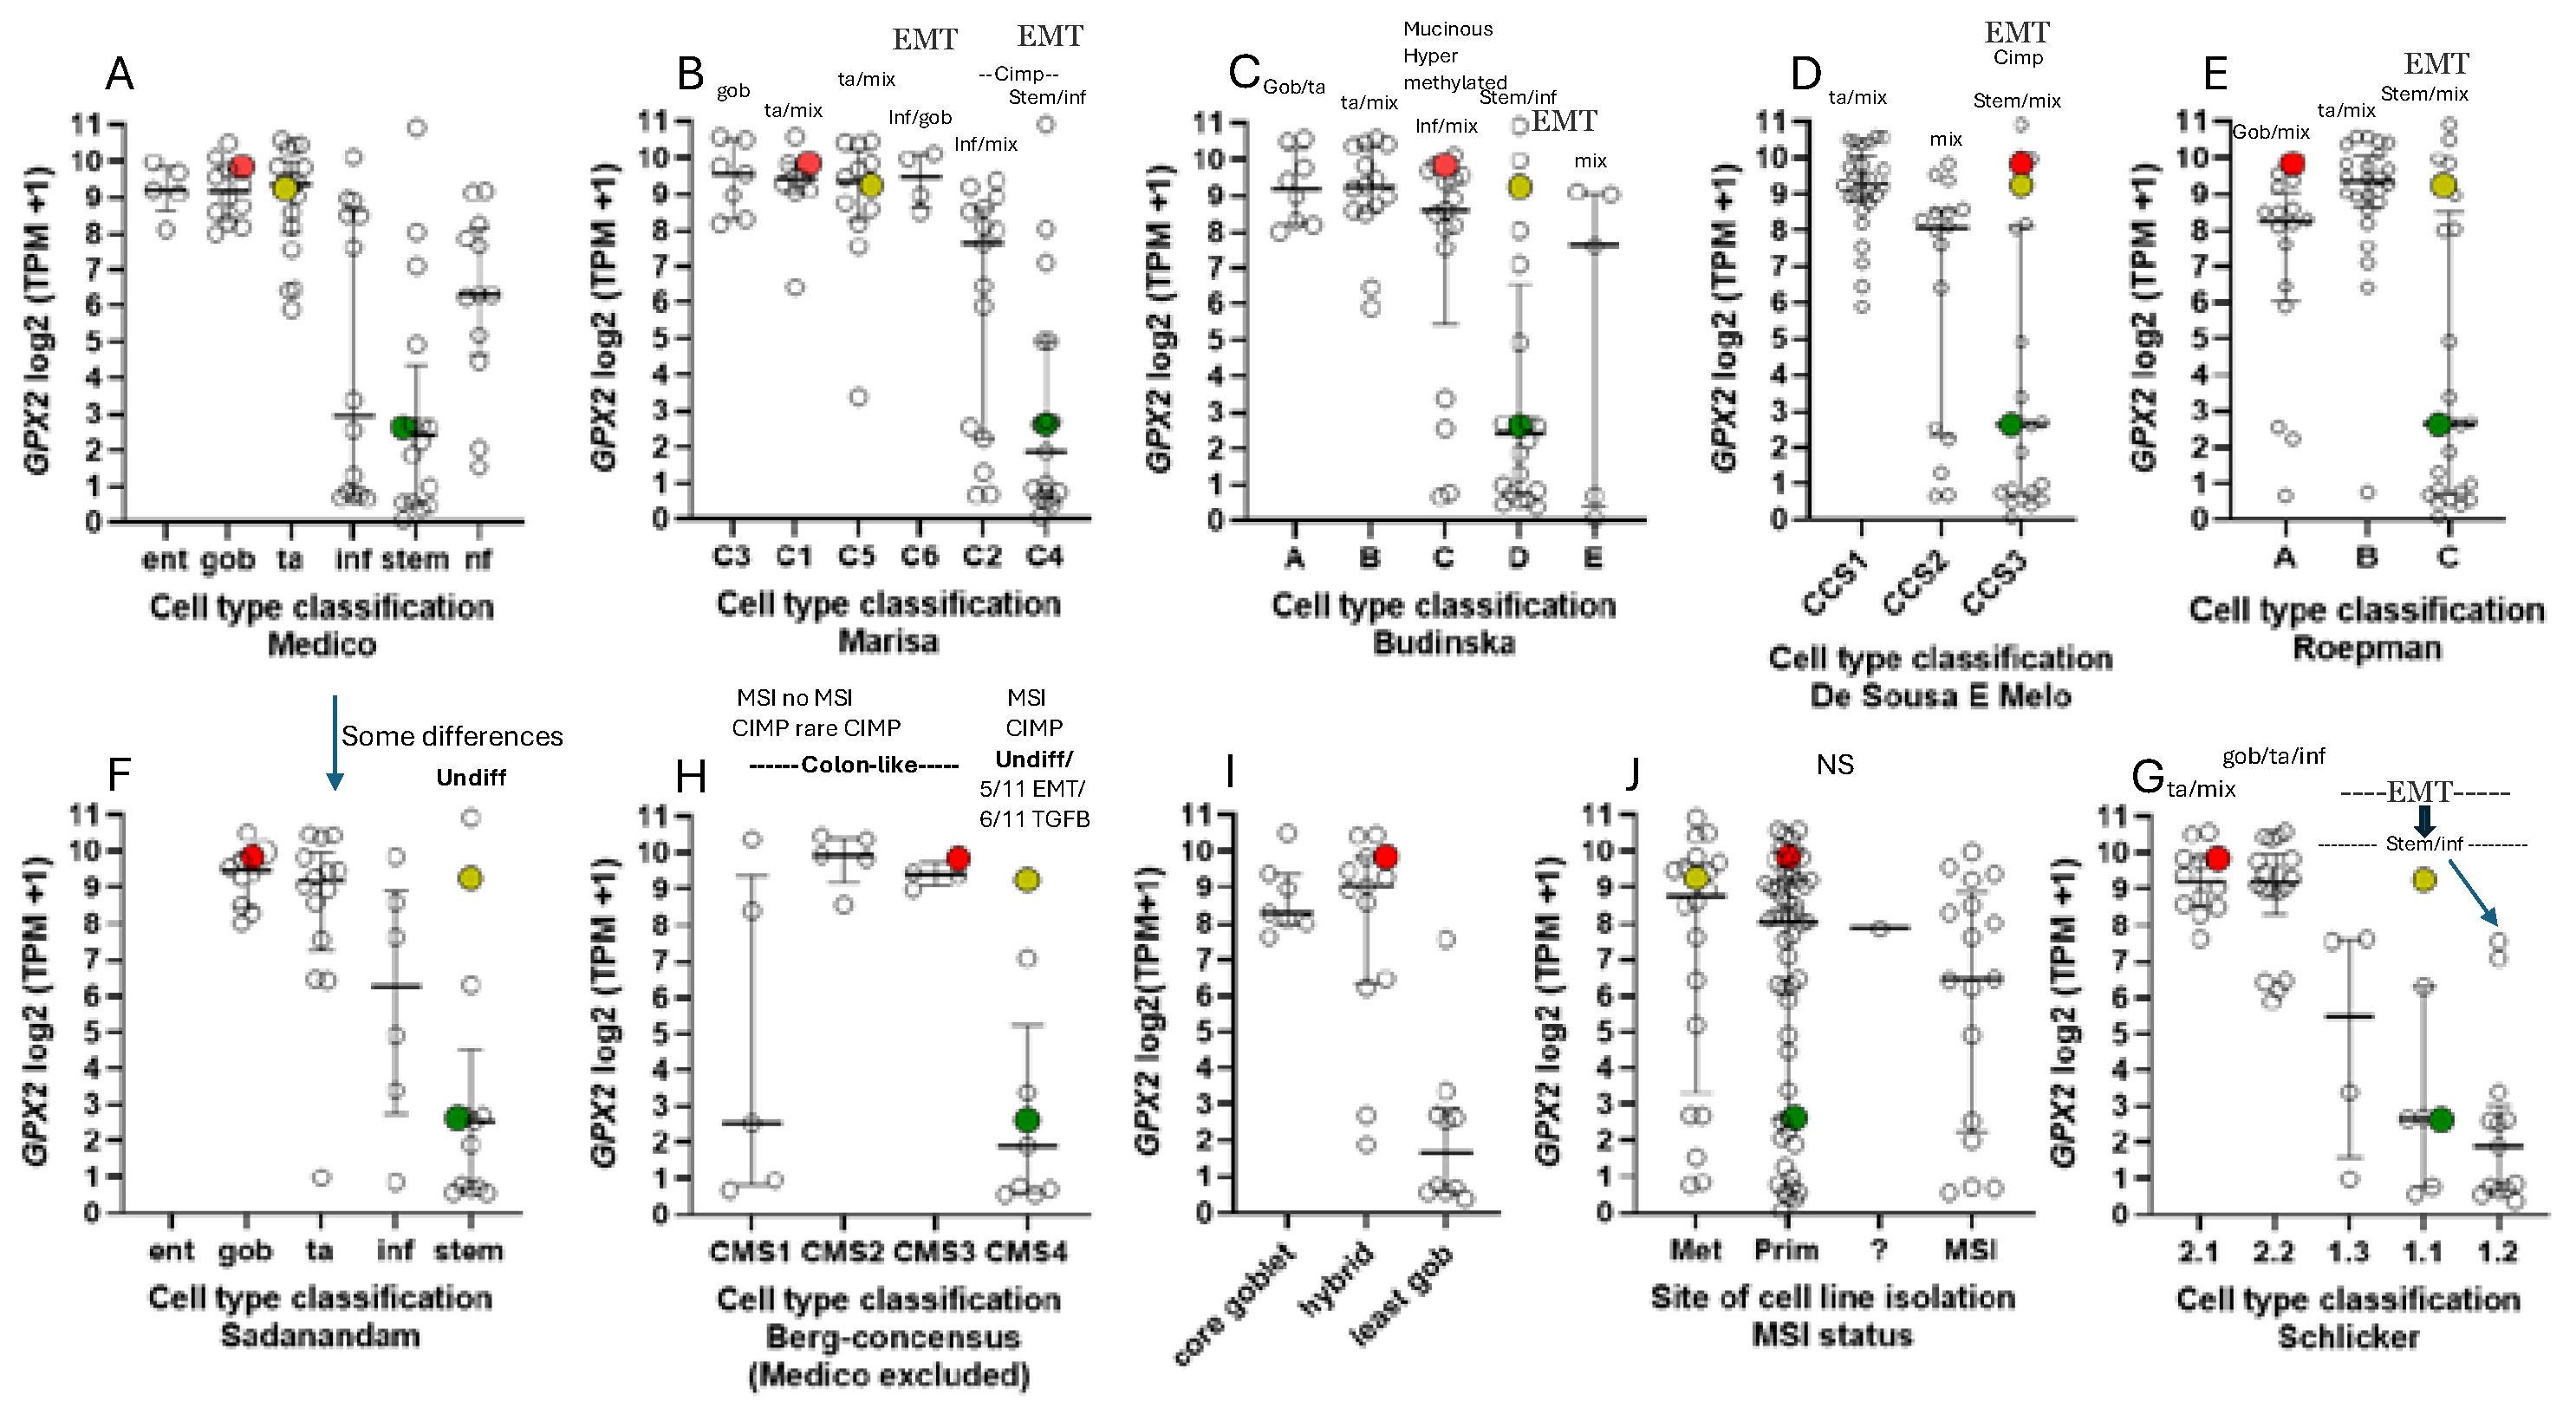
Figure 9.
Panels A and B show the correlation of GPX2 levels with the average of 4 differentiation markers (A) and a classification plot for cell lines with high or low expression of differentiation markers based in the iCMS system (B) [15]. In both panels HT29 is indicated in red, SW620 in yellow and SW480 in dark green. Panels C and D show the correlation of GPX2 expression levels with the average of ASCL2 + CDX2 + LGR5 + MYC + TCF7 + TEAD expression in cell lines (C) and in a cell line classification plot with high or low proliferation/WNT marker cell lines (D). In panels A and C, the vertical blue lines denote the rather arbitrary division of low vs. high marker expression. While isogenic lines, SW480 and SW620, are separated in Panels B and D, the isogenic pair GP2D and GP5D (large white circles) remain associated.

Figure 10.
Normal and cancer tissues expression of TP63 vs. ASCL2 and LGR5 in cancers by source. Black rectangles denote COAD and READ, red-BCLA and blue-H&N cancer. Panels B shows the lack of TP63 expression in CRC-derived lines, comparable to results in panel A, while panels C and D show generally higher expression of TP63 in cell lined from H&N cancers and BCLA with some indication of a positive correlation with GPX2 expression.
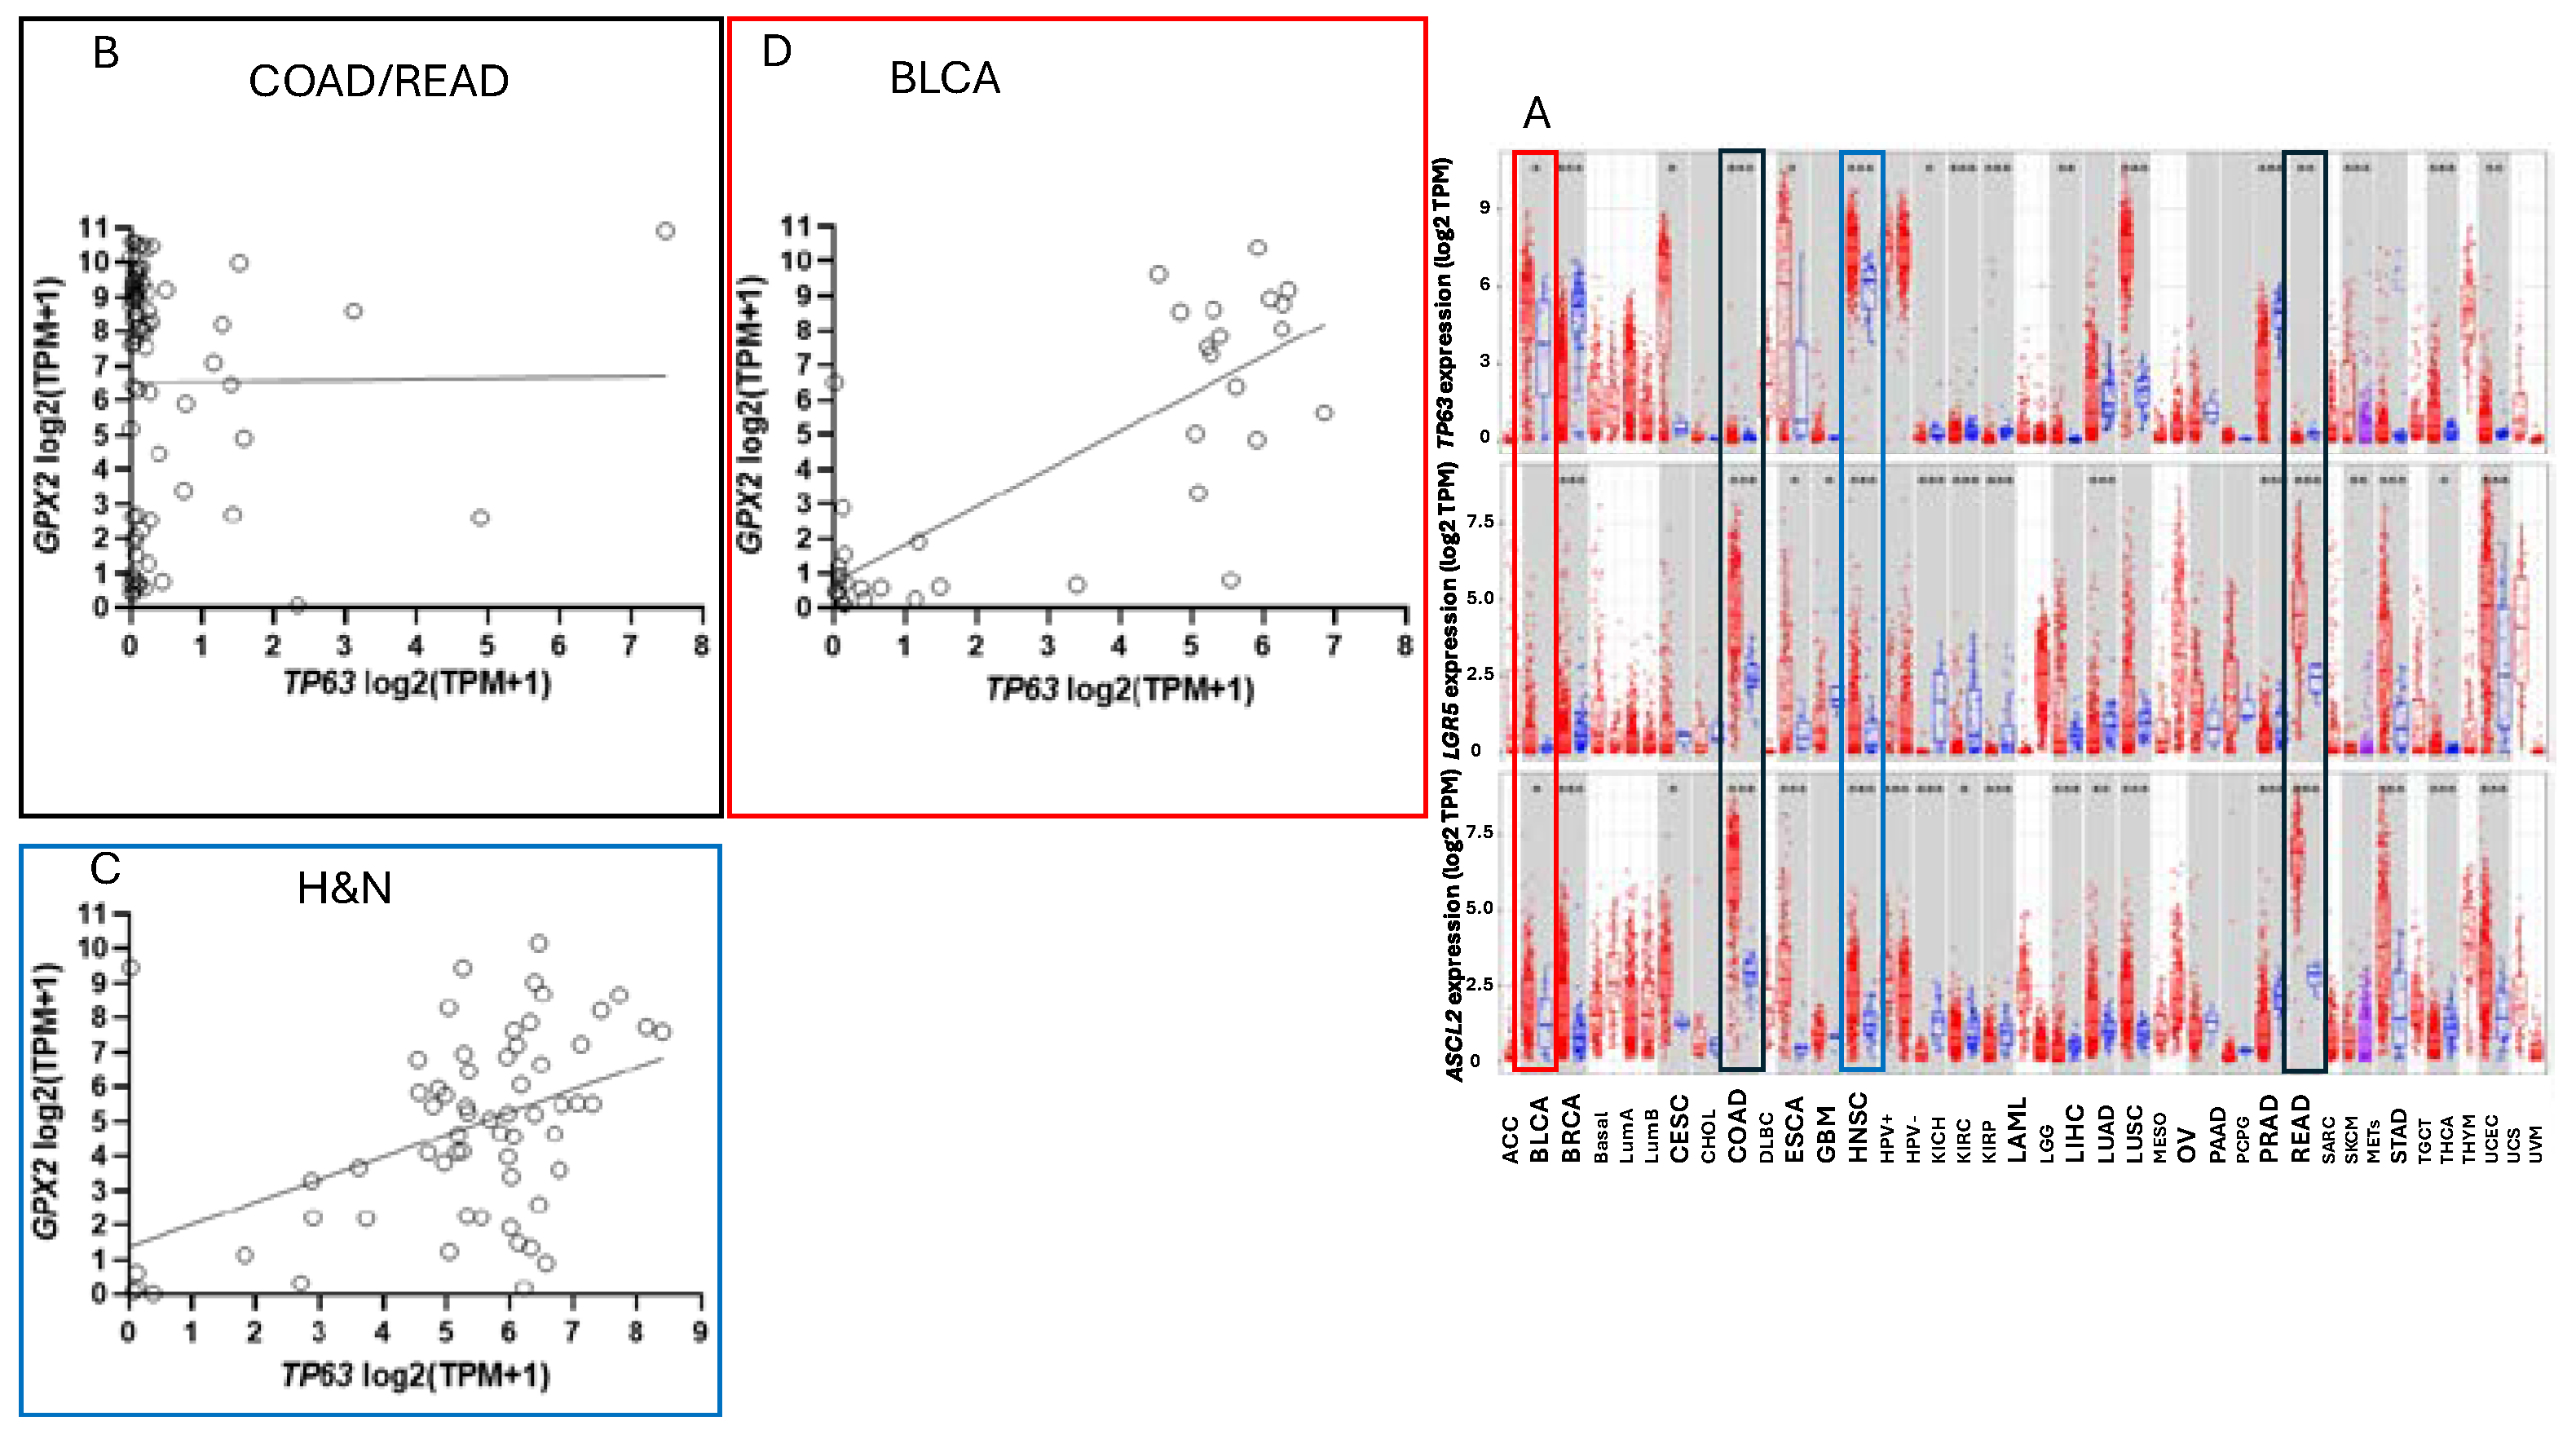
Figure 11.
Kaplan-Meir plots from THPA (6/24) assessing OS prognosis based on GPX2 and NOX1 expression levels. The approximate cutoff levels are indicated as horizontal lines on the cell lines classification/expression levels plots. The upper line in the GPX2 and NOX1 plots are a correction to the TPM for the median tumor purity for CRC samples. The bracketed cell lines in the GPX2 plot are those with expression levels below the cutoff, although cell lines with values less than log2 8 are not really indicated by tumor data. The inserts are the distribution of tumor sample expression levels in FPKM.
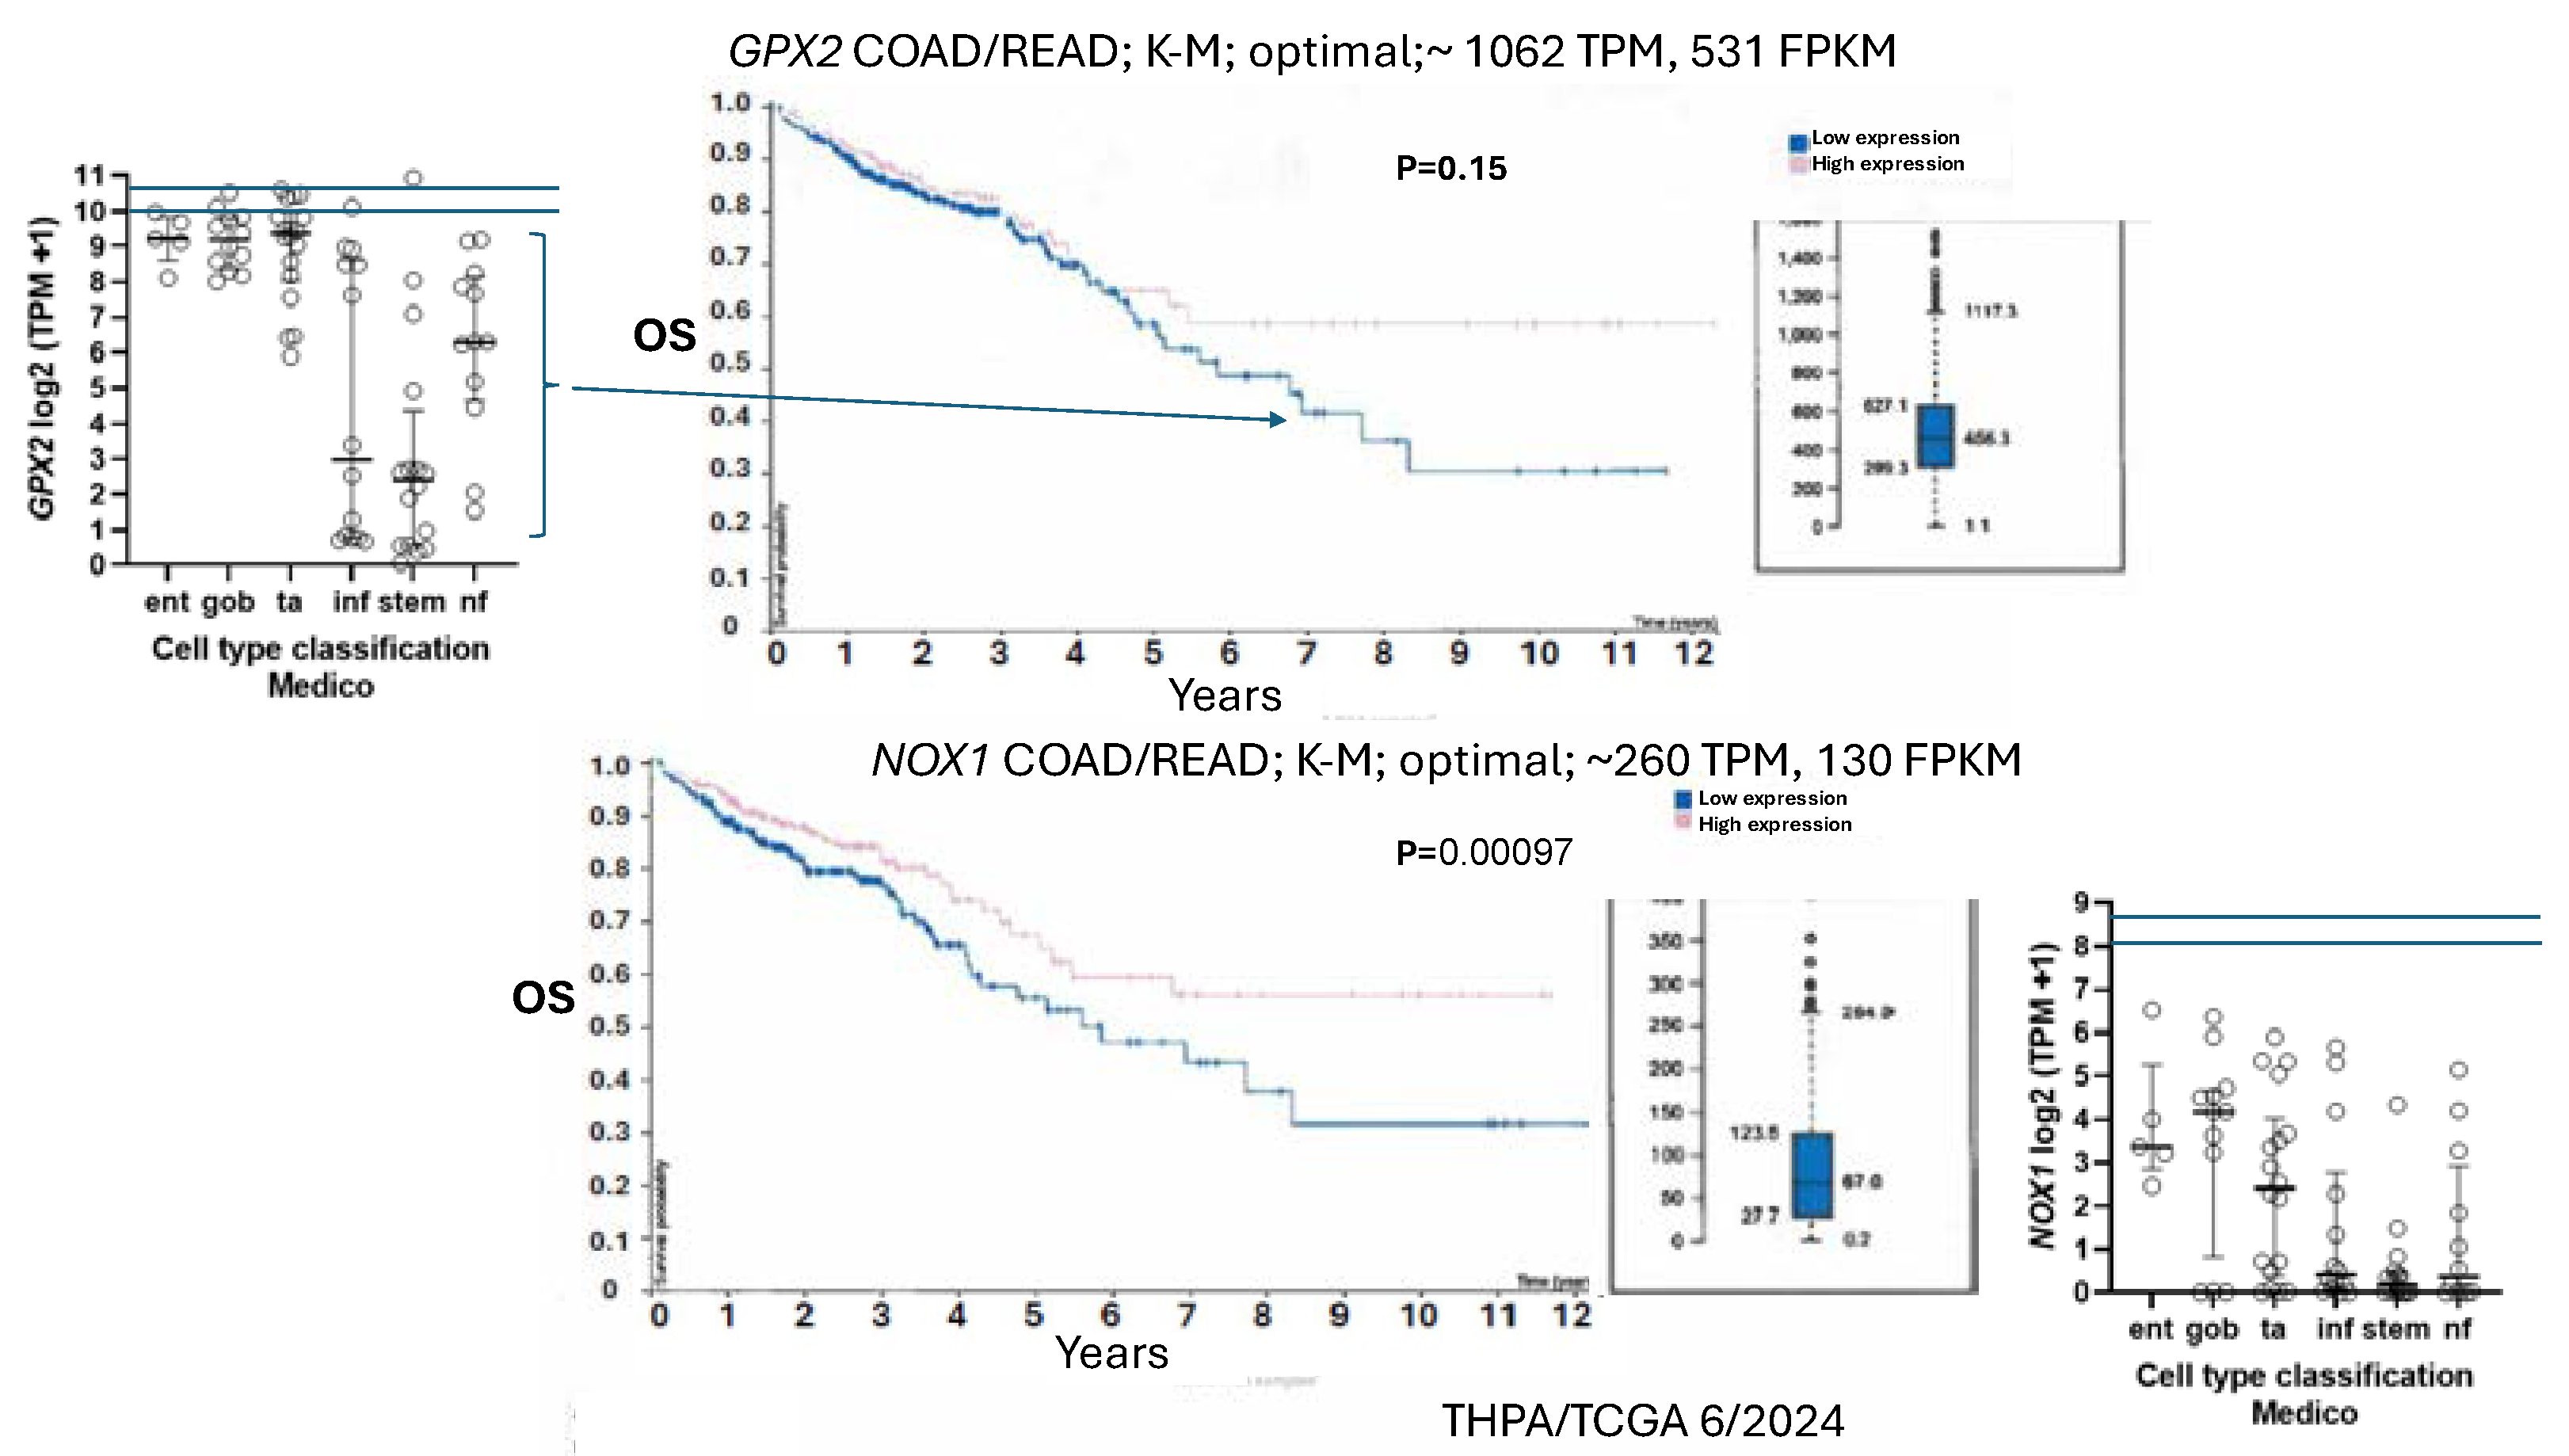

Table 1.
Color coding indicates cell lines appearing in multiple classifications; see Figure 8 and main text. MSS-microsatellite stable; MET-cell line derived from metastasis.
Table 1.
Color coding indicates cell lines appearing in multiple classifications; see Figure 8 and main text. MSS-microsatellite stable; MET-cell line derived from metastasis.
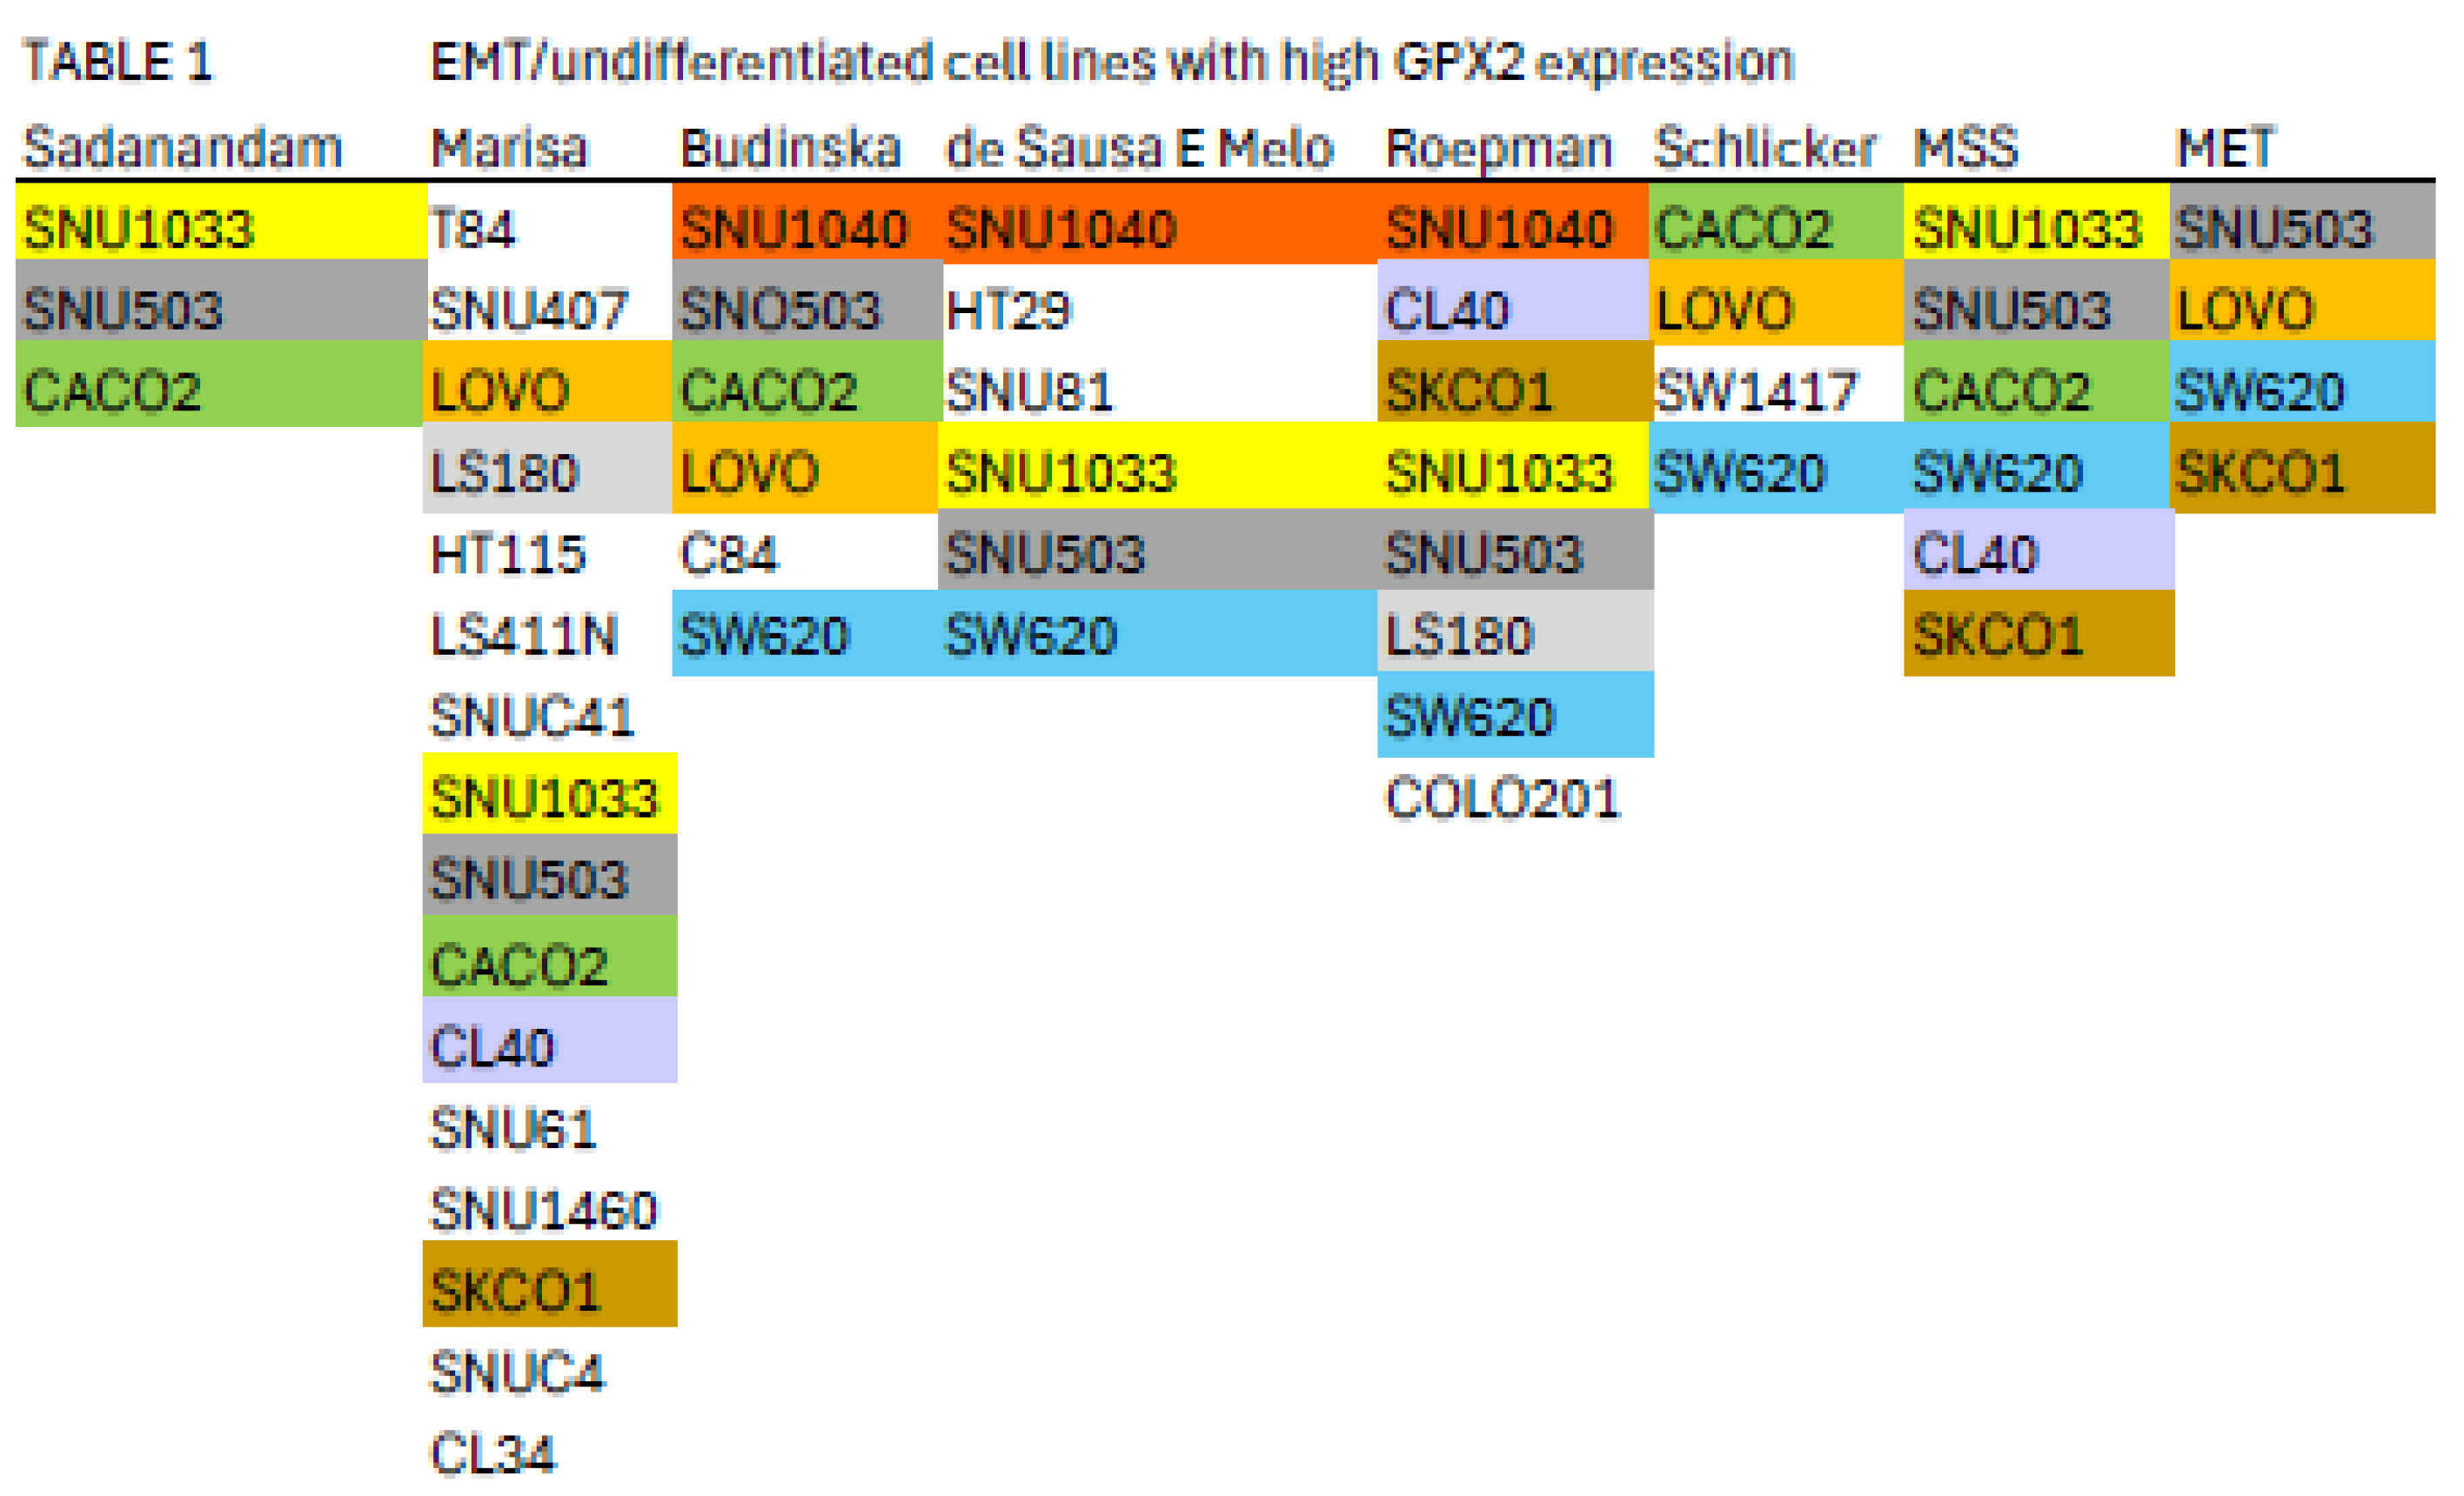
Disclaimer/Publisher’s Note: The statements, opinions and data contained in all publications are solely those of the individual author(s) and contributor(s) and not of MDPI and/or the editor(s). MDPI and/or the editor(s) disclaim responsibility for any injury to people or property resulting from any ideas, methods, instructions or products referred to in the content. |
© 2024 by the authors. Licensee MDPI, Basel, Switzerland. This article is an open access article distributed under the terms and conditions of the Creative Commons Attribution (CC BY) license (http://creativecommons.org/licenses/by/4.0/).
Copyright: This open access article is published under a Creative Commons CC BY 4.0 license, which permit the free download, distribution, and reuse, provided that the author and preprint are cited in any reuse.


