Functional Organization of Proximal Straight Tubules
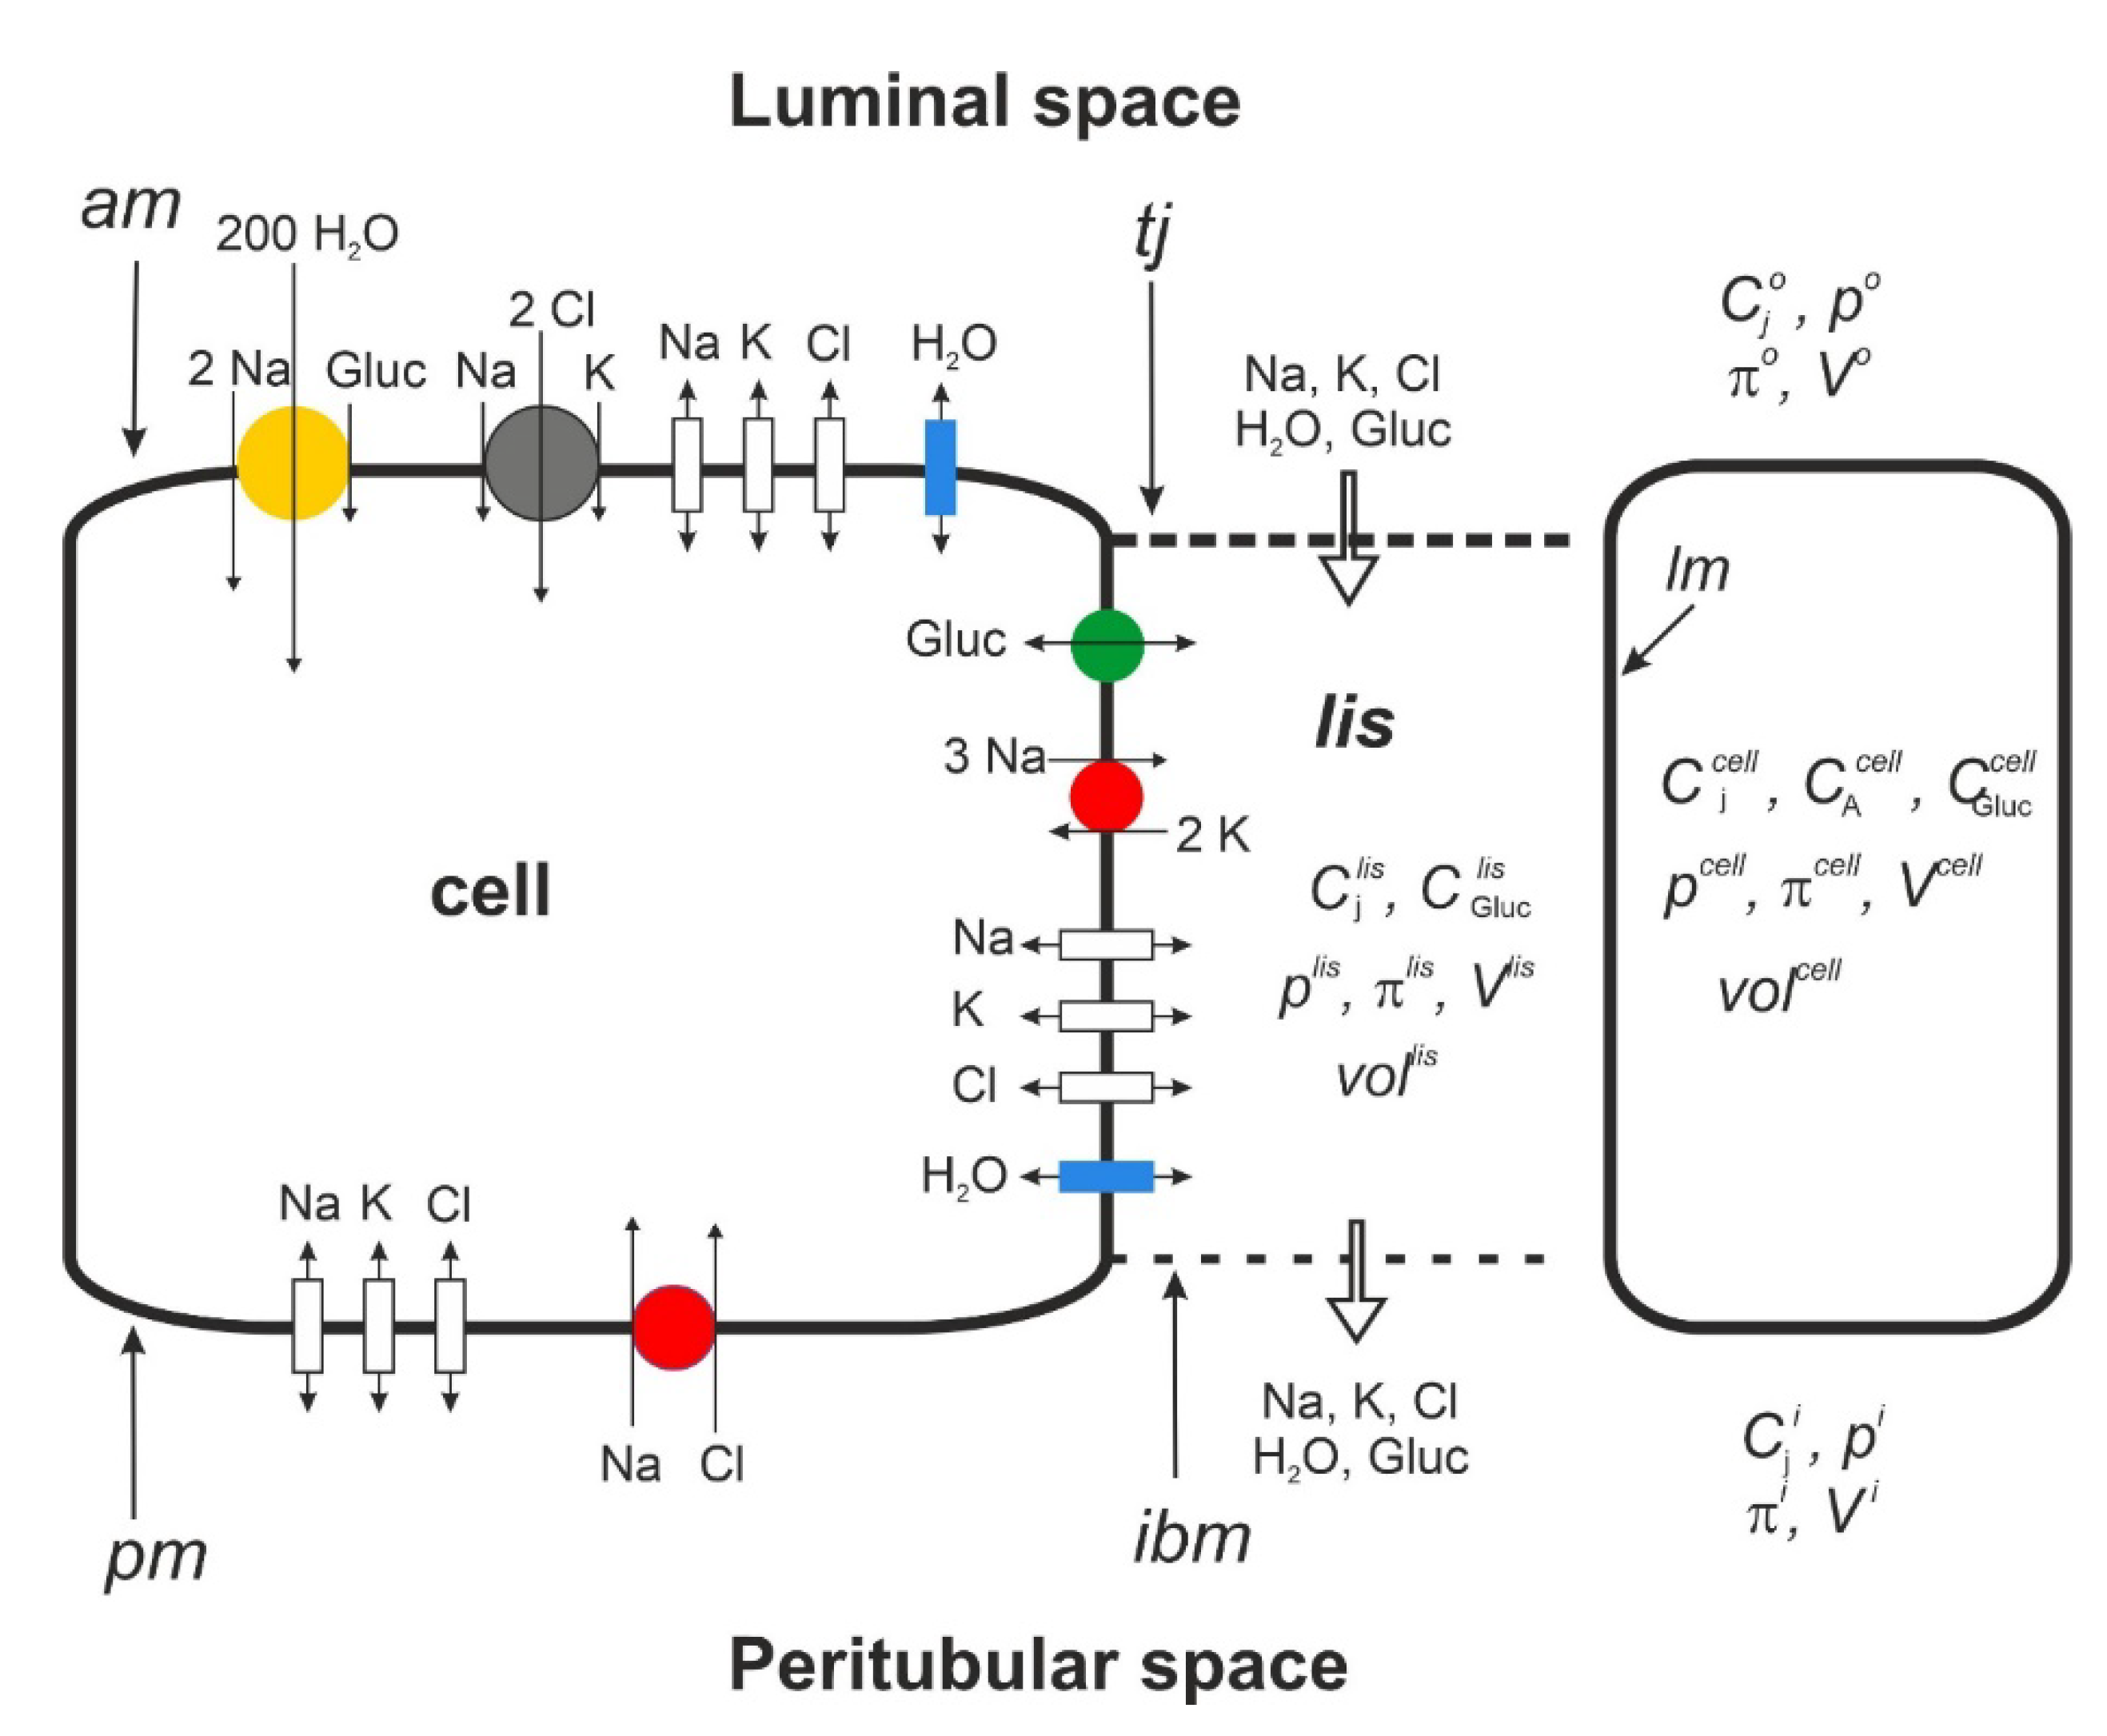
The biophysical model comprises four well-stirred compartments, outer (lumen,
o) and peritubular (
ps), both of infinite volume, cell (
c), and lateral intercellular space (
lis) confined by five membranes: apical (
am), lateral (
lm), tight junction (
tj) and intercellular basement membrane (
ibm) (
Figure 1A). It should be noted that apical and lateral cell membranes have similar relatively large areas compared with the peritubular (contra-luminal) membrane contacting the basement membrane [
9]. Because they are continuous with the lateral membrane, the so-called ‘basal infoldings’ are not derived from the contra luminal membrane. It follows that the interspace basement membrane (
ibm), which constitutes approximately 10% of the area of the entire basement membrane [
10], provides the exit path from the lateral intercellular space (
lis). Sodium pumps are confined to lateral membranes and to the complex of lateral membrane infoldings at the cell base [
11] (
Figure 1B). Thus, lateral and peritubular membranes represent different functional domains, implying that sodium ions transported into the cell through
am are actively transported into the lateral intercellular space (
lis) for exiting the epithelium through
ibm. It follows that the so-called ‘basolateral’ osmotic permeability conferred by AQP1 [
12,
13] is confined to lateral membranes, with the lateral intercellular space constituting a compartment of its own. The membrane organization of our minimalistic model of proximal straight tubules is depicted in
Figure 1B and is described in detail below. The primary unknowns include cellular and paracellular concentrations of Na
+, K
+, Cl
-, glucose and nondiffusible intracellular anions; hydrostatic pressure in the cell and lateral intercellular space; and electric potential in the cell,
lis, and luminal space with the electric potential of the peritubular space
.
The electroneutral NHE3 sodium ion/proton antiporter of the apical membrane discovered by Murer et al. [
14] and studied in detail by Boron and coworkers, e.g., [
15], mediates transcellular uptake of bicarbonate. Below we discuss evidence for another function of the NEH3 transporter, which is to export the free protons generated during oxidative metabolism by physiologically active tubule cells. In the absence of experimental data connecting NHE3 to glucose transport, its inclusion in the model at this stage was considered premature. With our strategy of using known experimental results to constrain model outcomes to minimize the free parameter space, its inclusion would be justified if the assembly of the current model components failed to account for glucose clearance or as part of a wider exploration of unanticipated side effects.
Figure 1.
A. Membrane organization of the kidney tubule epithelium. The apical (am) and lateral (lm) cell membranes have similar relatively large areas compared with the contra-luminal (peritubular) cell membrane (pm) contacting the basement membrane (bm). Tight junctions (tj) provide entrance to the lateral intercellular space (lis). The so-called ‘basal infoldings’ are continuous with the lateral membranes; the interspace basement membrane (ibm) providing exit from lis is approximately 10% of the area of the entire basement membrane. Sodium pumps are confined to lateral membranes and to the complex of lateral membrane infoldings at the cell base. Thus, lateral and peritubular membranes represent different functional domains, implying that sodium ions transported into the cell through the am are actively transported into the lis for exiting the epithelium through the ibm. It follows that the so-called ‘basolateral’ osmotic permeability conferred by AQP1 is confined to lateral membranes, with the lateral intercellular space constituting a compartment of its own.
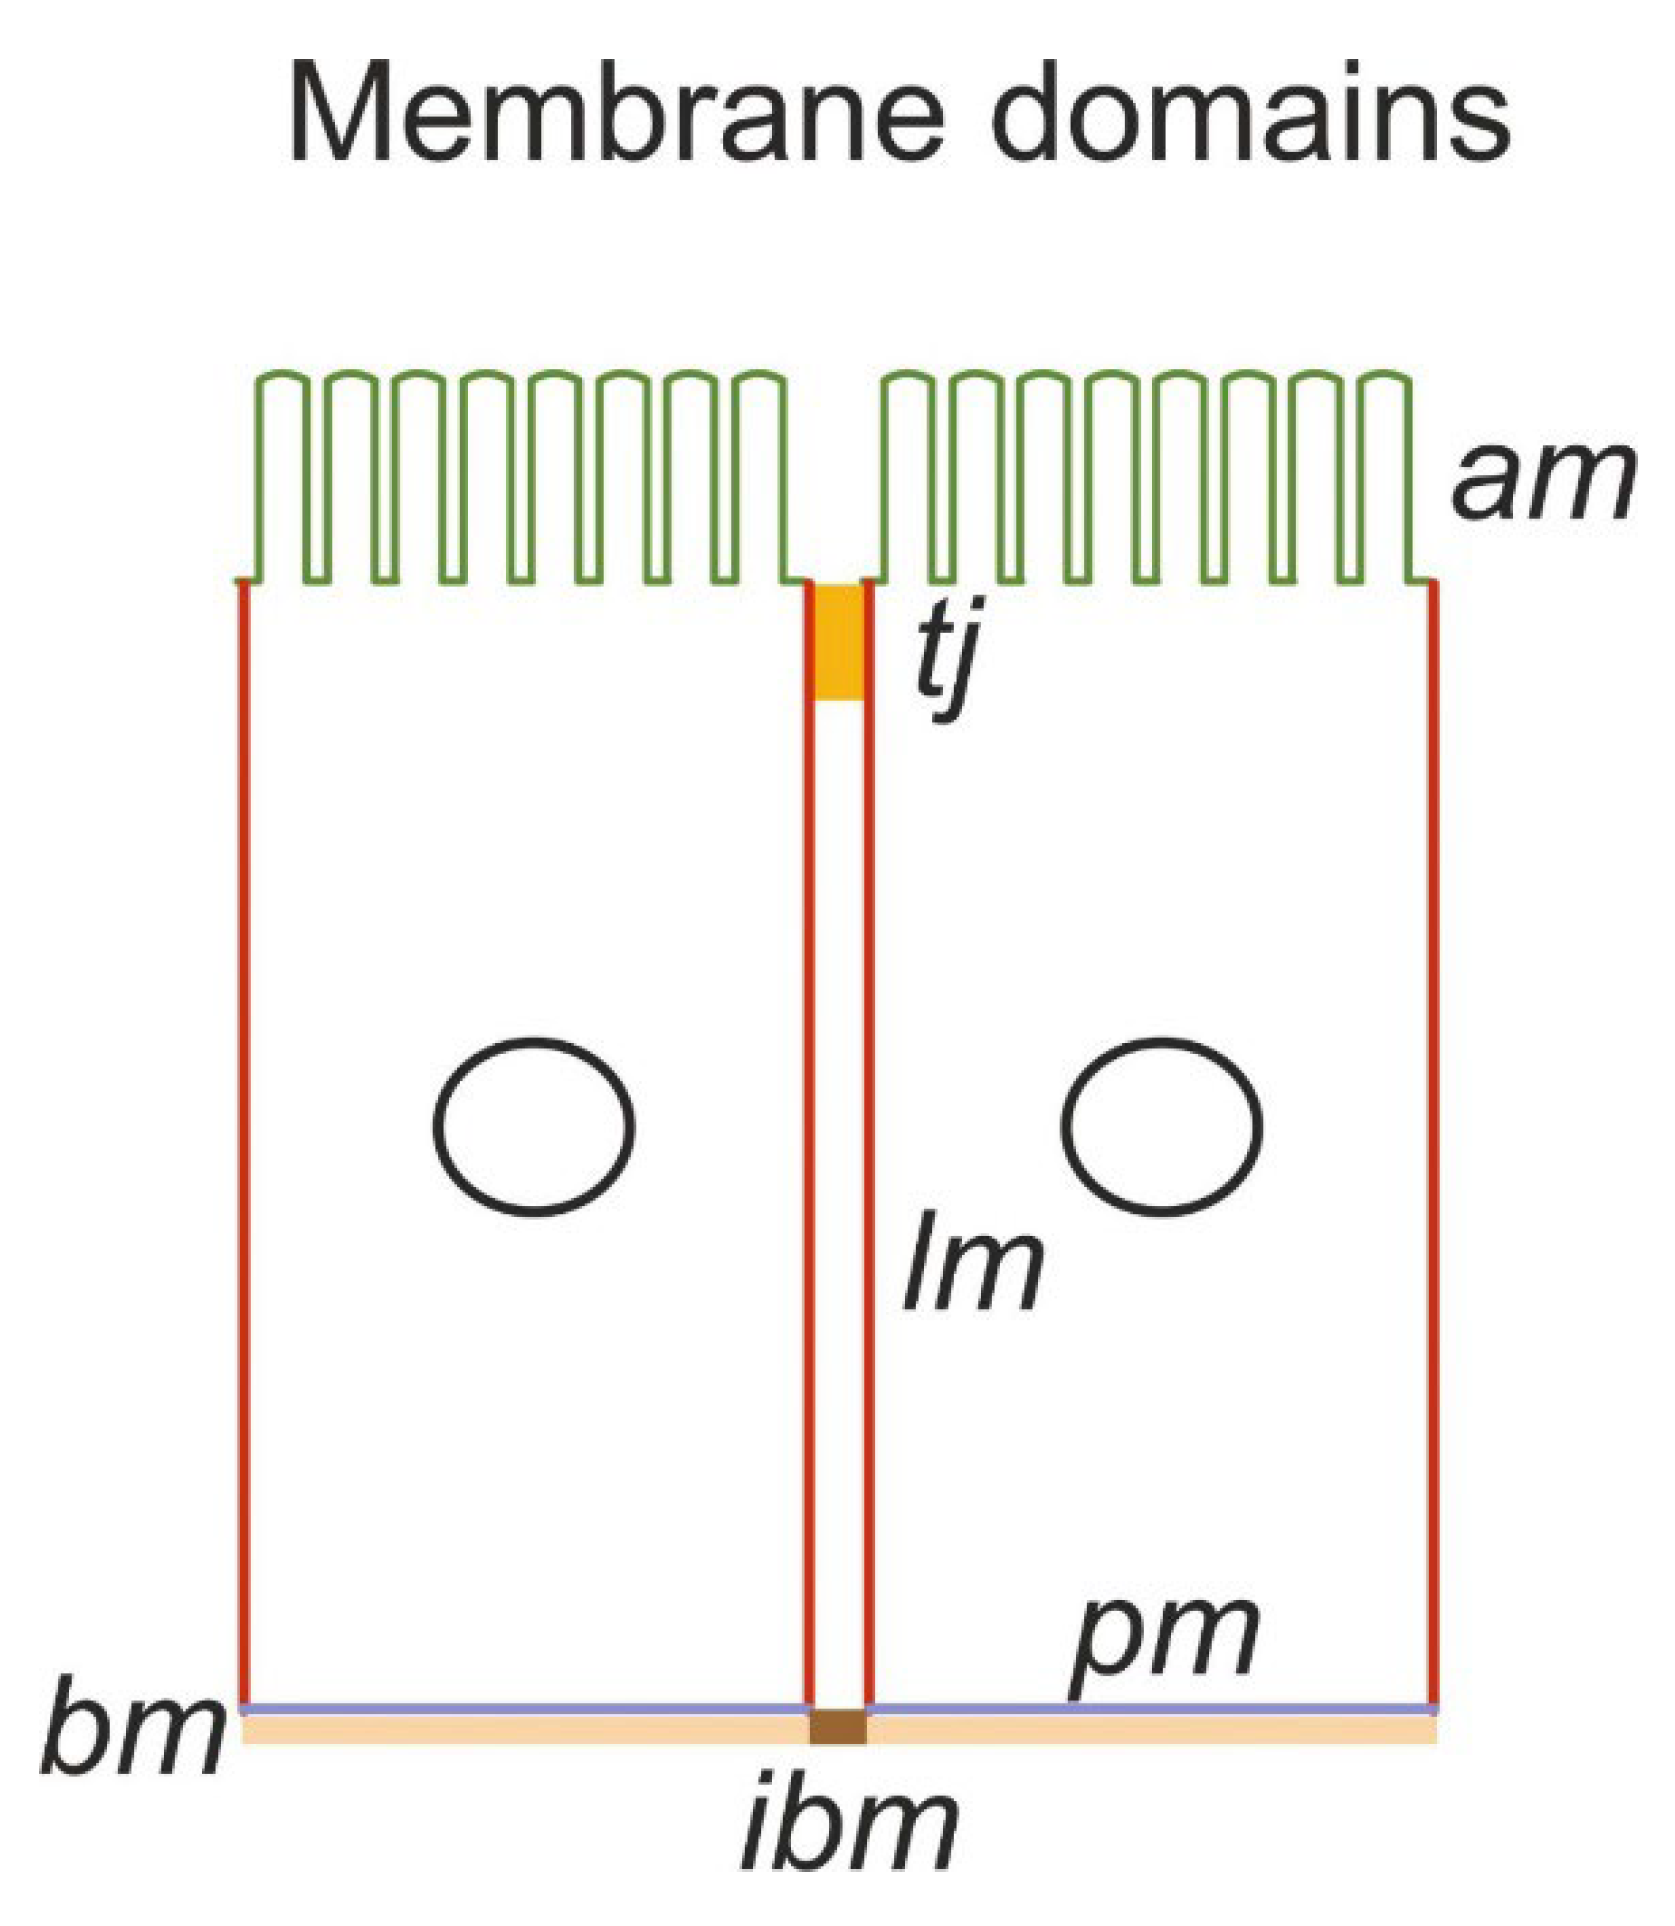
Figure 1.
B. Functional membrane organization of the proximal tubule S3 segment. SGLT1 (yellow) couples 1 glucose with 2 Na+ and 200 H2O. The driving force for glucose is given by the transmembrane concentration differences of sodium and glucose and the apical membrane potential according to Eqn. 3a. Together with paracellular solvent drag, the apical 1Na-2Cl-1K cotransporter ensures the reabsorption of filtered K+. By being water permeable, the junctional ion and glucose pathways play important roles in preventing the loss of glucose via urine. In modeling isosmotic transport, the serosal Na–Cl cotransporter was activated iteratively to achieve overall osmotic equilibrium between the peritubular and reabsorbed fluid.
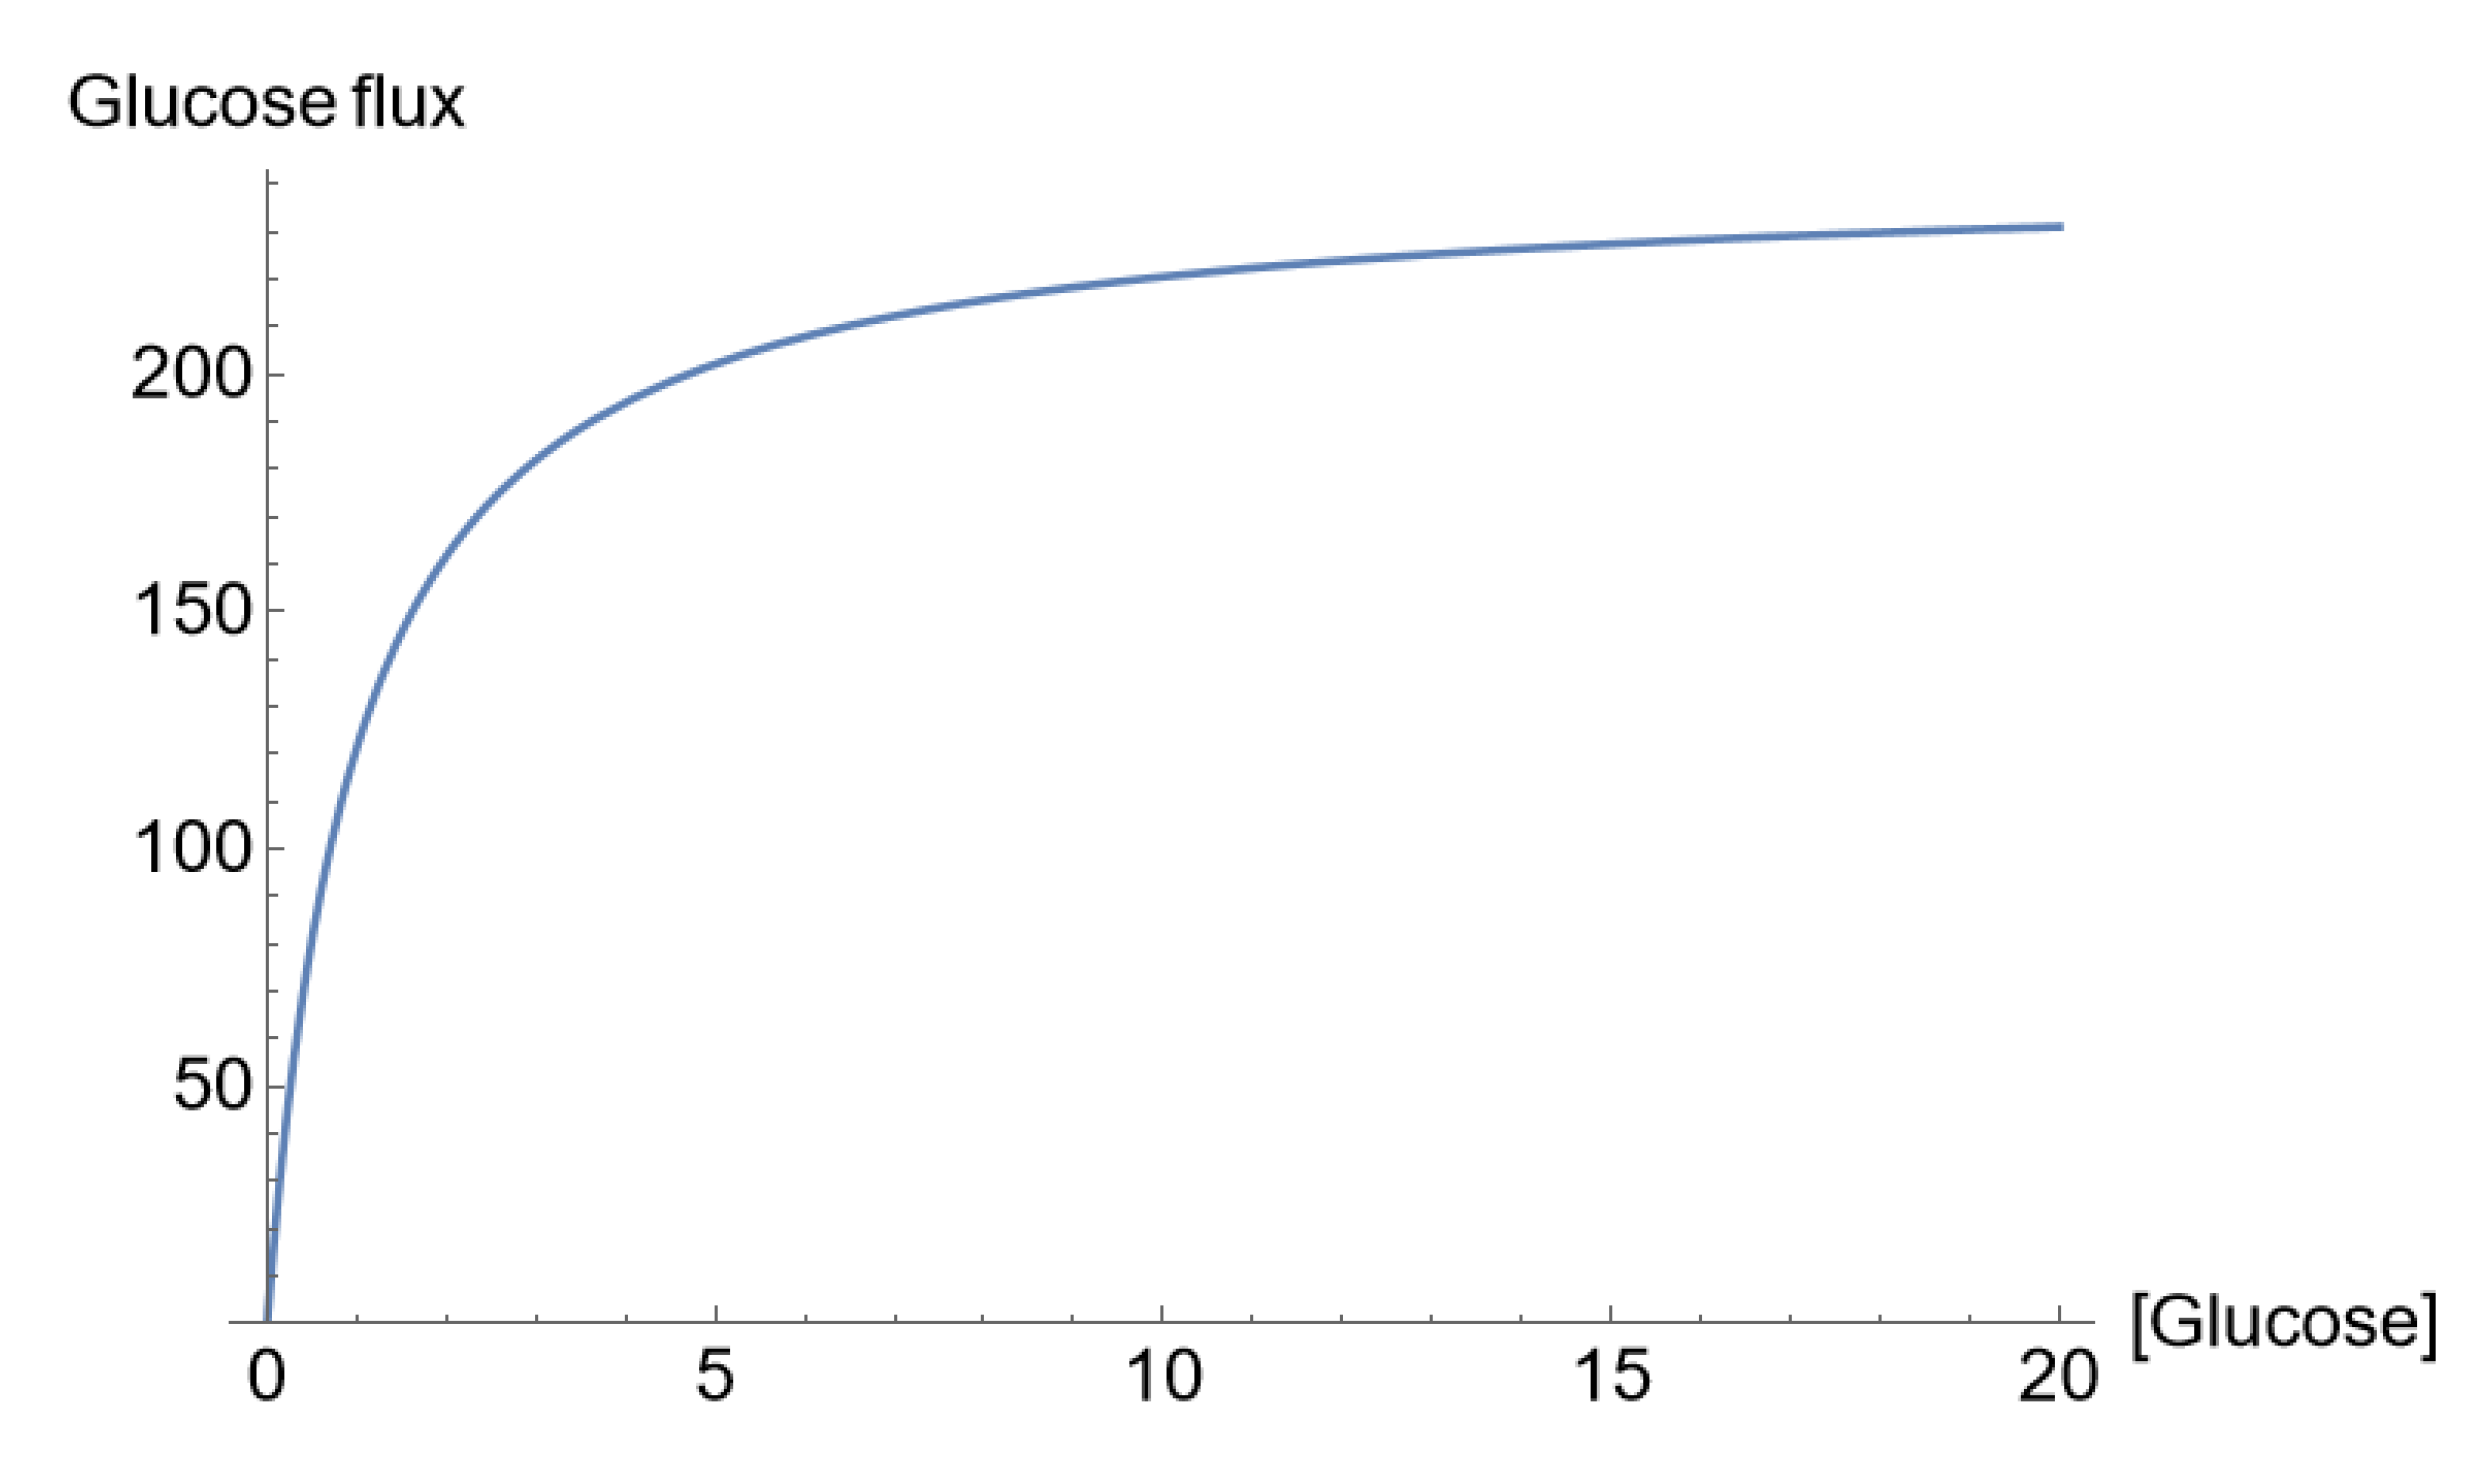
Figure 1.
C. ‘Saturation’ of the glucose flux across the apical membrane (pmol/cm
2/s) with the luminal glucose concentration (mM), which, in our mathematical analysis, was due to glucose concentration-dependent SGLT1 permeability according to Eqn. 3a [
31].
Figure 1.
C. ‘Saturation’ of the glucose flux across the apical membrane (pmol/cm
2/s) with the luminal glucose concentration (mM), which, in our mathematical analysis, was due to glucose concentration-dependent SGLT1 permeability according to Eqn. 3a [
31].
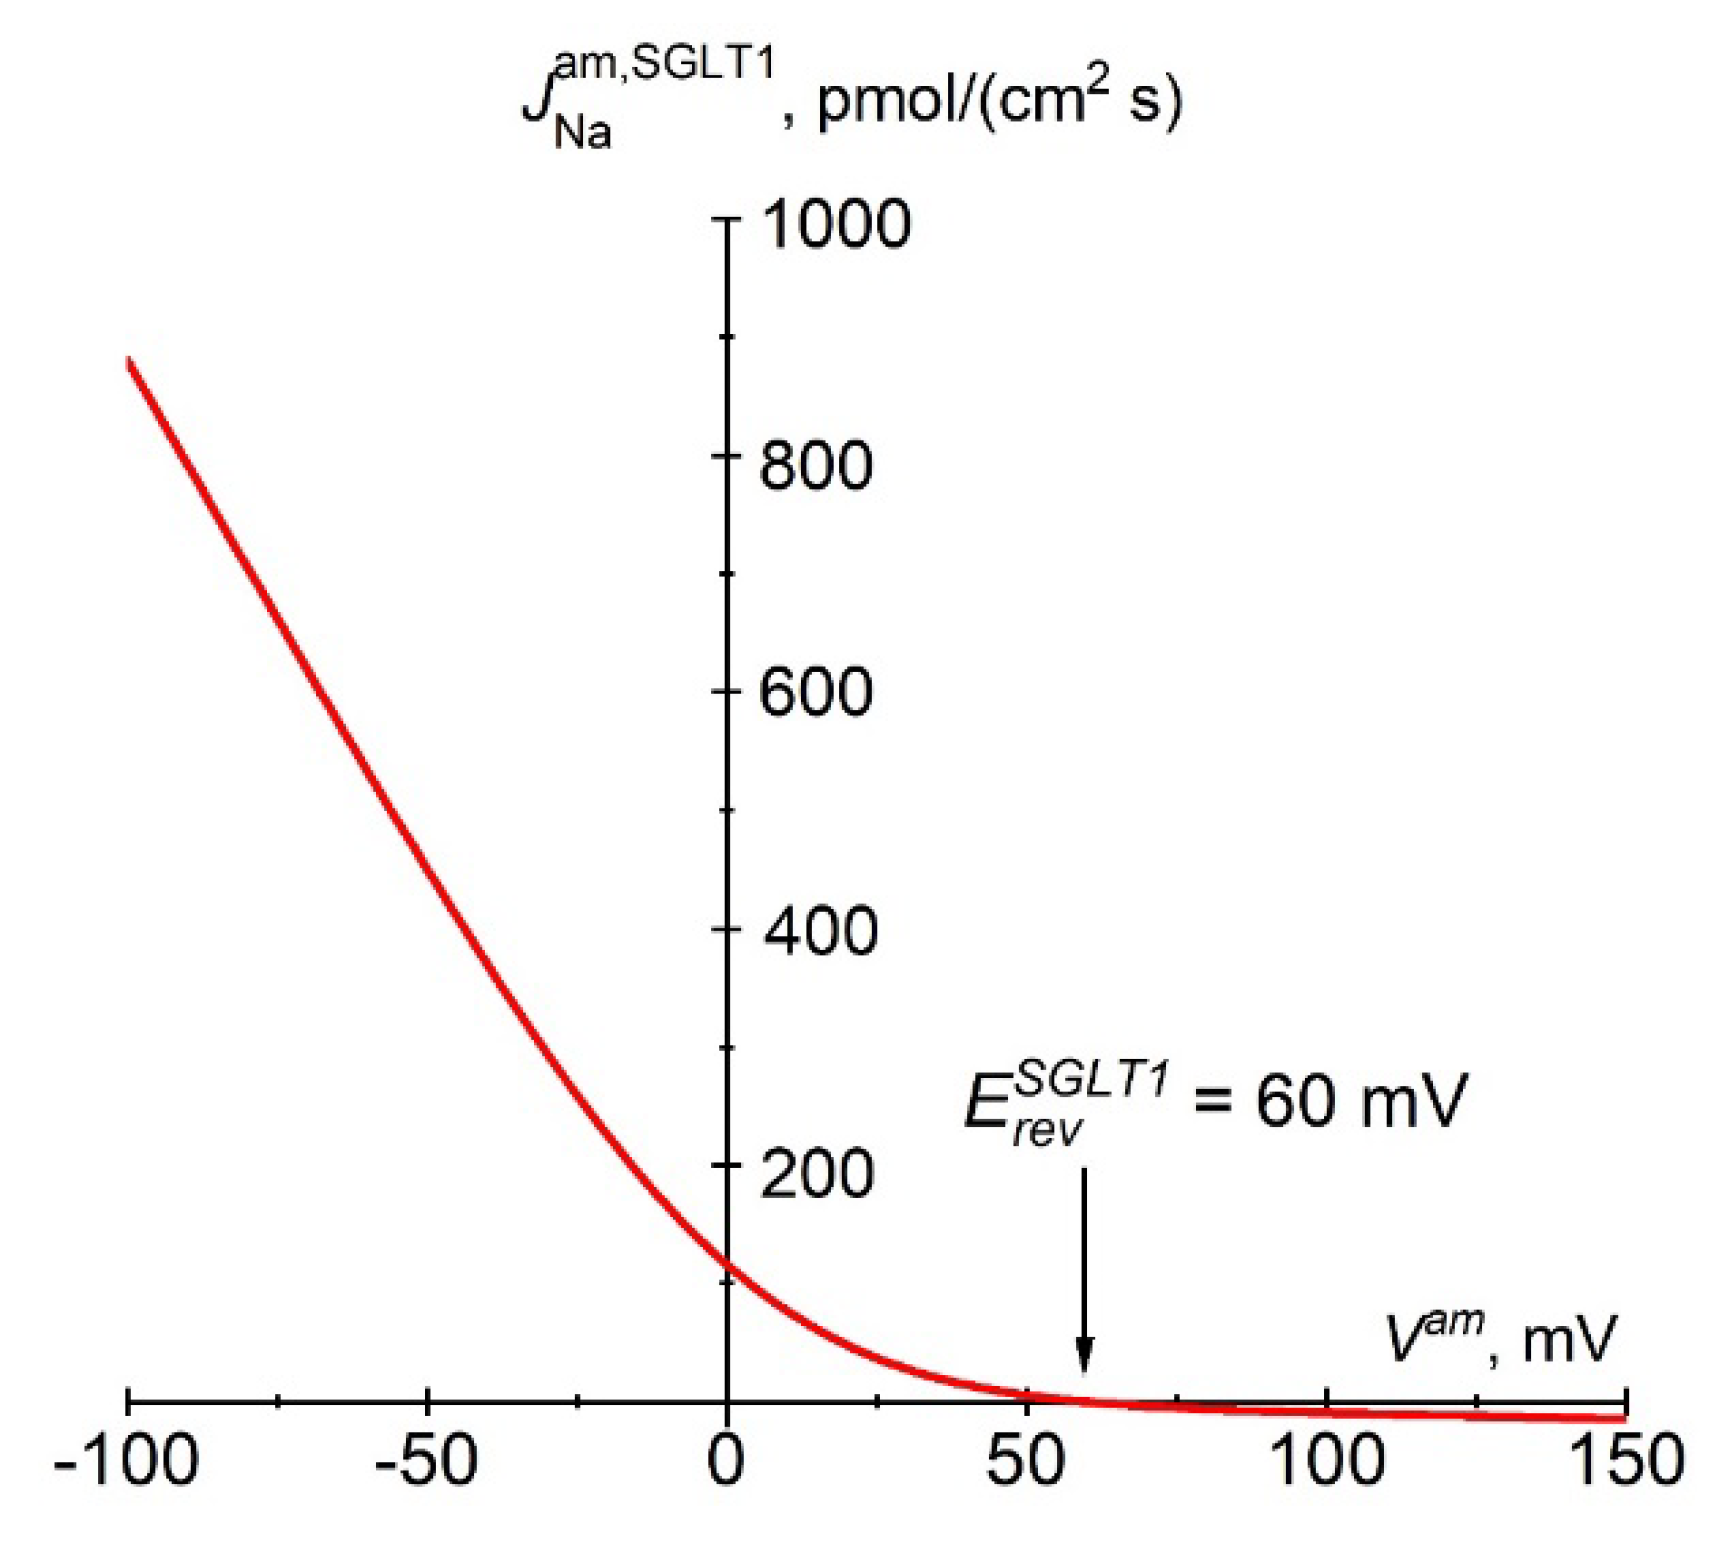
Figure 1.
D. Instantaneous relationship between the Na+ flux carried by SGLT1 and apical membrane potential according to Eqn. 3a. The constant electrical field in the membrane and the fixed stoichiometry of 2 Na+:1 glucose predict strong inward rectification of SGLT1 fluxes. The reversal potential, , is +60 mV at physiological concentrations and 37 °C, i.e., ~125 mV above the apical membrane potential of approximately -65 mV.
Mathematical Description
Cellular solute flux equations. Electrodiffusion fluxes including the flux in the apical Na
+ channel [
16,
17,
18] are handled by the GHK constant field-equation with associated integral conductance equation [
19,
20],
Pj is the ion permeability, and
V is the potential difference across the membrane. I =
lumen and II =
cell for the apical membrane, I =
cell and II =
lis for the lateral membrane, and I =
cell and II =
peritubular space for the serosal membrane. As previously discussed, the principal importance of uphill K
+ absorption by the proximal tubule is that the potassium concentration of the absorbate is close to that of the extracellular fluid. Potassium absorption is mediated both by paracellular solvent drag and secondary active transport, the latter of which is driven by the prevailing inwardly directed electrochemical sodium gradient [
21]. The precise mechanism of uphill K
+ uptake is unknown. In our model [
5], potassium absorption is handled by a 1Na
+, 1K
+, 2Cl
- cotransporter
where
r = 1 for Na
+ and K
+ and
r = 2 for Cl
-. The recovery of luminal K
+ is associated with relatively very small currents (see below) of little significance for overall bioelectrical properties. The application of Eqn. 2 has the additional advantage of enabling apical secondary active Cl
- uptake to be electroneutral, which is consistent with cellular Cl
- accumulation via Na
+-dependent transport in Necturus [
22,
23,
24] and rats [
25].
The proximal tubule reabsorbs most of the glucose in the glomerular filtrate [
26]. In the tubule’s S3 segments, glucose is coupled to Na
+ uptake via SGLT1 of 2 Na
+:1 glucose [
1]. SGLT1 also functions as a low-conductance water channel that stoichiometrically couples Na
+, sugar and water, with 1 glucose:2 Na
+, and 200 H
2O [
27,
28] (
Figure 1B). The driving forces for glucose uptake across the luminal membrane are the transmembrane glucose concentration gradient, the transmembrane Na
+ concentration gradient, and the apical membrane potential,
Vam. Typically, for thin membranes, the electric field is assumed to be constant [
29]. To simplify the integration, we assumed that one glucose and two Na
+ molecules pass through the membrane ‘in unity as a divalent particle’, in accordance with a recent model of SGLT1 transport [
30]. In our handling of the ‘saturation kinetics’ of glucose uptake from tubular fluid, we introduced a concentration-dependent SGLT1 permeability, defined by [
31],
Thus, the following three instantaneously coupled flux equations apply:
Figure 1C shows the concentration dependence of the luminal glucose uptake at a constant apical membrane potential indicating ‘saturation kinetics’ in agreement with observation [
1]. Voltage-clamp studies of cloned SGLT1 [
32] revealed a near-linear dependence of SGLT1 currents in the voltage range between -40 and -100 mV [
30], which is reproduced by the above Eqn. 3b (
Figure 1D). Independent of the shape of the current-voltage relationship, the reversal potential,
, is that of the Na
+ flux carried by SGLT1,
In the physiological range of membrane potentials, the integral conductance of SGLT1 is,
Exit flux of glucose via GLUT1 [
33] from cell to
lis is handled by Stein’s equation for a symmetrical, saturating carrier [
34],
The sodium pump is expressed exclusively in the lateral membrane [
11]. The rate of active cation fluxes is a saturating function of the concentration of Na
+ in the cell,
and the concentration of K
+ in the lateral intercellular space,
[
35]. The rate of pumping of the two cations across the lateral membrane (
lm) with a stoichiometry of 3Na/2K is also a function of the electric work performed while moving one charge across the membrane per pump cycle [
36], which is dependent on the membrane potential [
37]. Eqn. 5 below fulfills these requirements [
5,
38].
Therefore, the chord conductance of the pump is
With
F being Faraday, the dimension of
is mol∙s
-1 ∙V
-1.
= 3.4 mM and
= 0.75 mM [
39]. According to Ussing [
40],
Epump is the
electromotive force of the pump given by the change in free energy of ATP hydrolysis in the vicinity of the pump, which is numerically equal to the reversal potential of the pump current,
. Assuming a change in the free energy of ATP hydrolysis of
= -58 kJ/mole [
41,
42,
43,
44], stoichiometry of 3 Na
+: 1 ATP, mitochondria situated near pump sites [
45], and well-aerated tubules, the reversal potential of the pump,
= (-58×10
3/3
F)×10
3 = -200 mV. This agrees with the upper limiting value obtained in experiments on isolated frog skin epithelium [
40]. In the physiological range of membrane potentials, Eqn. 5a generates pump currents that are near-linearly dependent on
Vlm, which is in agreement with experiment [
37].
Paracellular flux equations. We treat paracellular solvent drag on small diffusible ions by Hertz’s equation [
19,
46] applied to a membrane with a nonzero reflection coefficient, σ
j, of ion j [
47,
48],
For the tight junction membrane, I =
o, while II =
lis. For the interspace basement membrane, I =
lis and II =
ps. Eqn. 6 assumes a symmetric pore with a reflection coefficient (
) and partition coefficient (
) related by
[
49].
JV is the volume flow from compartment I (lumen or
lis) to II (
lis or peritubular space). Eqn. 6 applies to Na
+ and K
+ passing the paracellular tight junctions through the water permeable claudin-2 [
50,
51], and is applied for solutes passing non-specified pathways of
ibm. Claudin-17/10a are permeable to small anions but not to water [
50,
52]; therefore, the junctional Cl
- flux is calculated by the formula for simple electrodiffusion (Eqn. 1). Solvent drag on sucrose and other electroneutral molecules in the kidney proximal tubule [
53,
54] makes it plausible that electroneutral glucose is also submitted to paracellular transport by frictional interactions with water. This flux may correspond with the component of glucose uptake in the proximal tubule designated ‘moderate glucose leak’ [
55]. The paracellular glucose fluxes across the tight junction (
tj) and interspace basement membrane (
ibm) are computed by [
47]
Water flow via aquaporins. In agreement with the cloned aquaporins of proximal tubules [
12], we assume a reflection coefficient of unity for water flow through cell membranes. With
i denoting the individual element or molecule, the equations for the respective volume flows per unit area of apical membrane are
As the osmotic permeability of the individual SGLT1 channel is no more than approximately 1% of that of a single aquaporin molecule (AQP1) independent of the presence of glucose [
28], we assume that the small
osmotic water flow through SGLT1 is included in Eqn. 8a. The equations for water flow through membranes,
tj and
ibm, delimiting the lateral intercellular space from luminal and peritubular solutions, respectively, include reflection coefficients,
The reflection coefficients of tight junctions are obtained from the literature,
and
[
56], while for large electroneutral glucose, we assume that
. The computations to be presented are not sensitive to this choice as long as
. Generally, for fluid absorption, the reflection coefficients of
ibm must be smaller than those of tight junctions; here, we assume that
= 10
-4. In the literature, the hydraulic conductance,
Lp, is translated to the osmotic permeability,
Pf. With the molar volume of water indicated by
,
Lp and
Pf are related by [
49],
Electroneutrality. With the mean valence of nondiffusible anions in the cell denoted,
zA, the electroneutrality requirement,
If
Iclamp is the transepithelial clamping current and
Ij is the current carried by
j through the membrane indicated by superscript (
j = Na
+, K
+, or Cl
-), the mathematical solution would have to obey the following requirement:
Here, Iclamp = 0 defines the mathematical solution containing the transepithelial potential difference, Vtrans.
Hydrostatic pressure and intraepithelial volumes. To obtain the hydrostatic pressures of the cell and
lis, we apply the following compliance model [
5]:
in which
µ is the compliance factor of the membrane indicated. With
lis volume in the absence of fluid flow indicated by
Volislis, ref the cell volume is calculated by [
5],
We denote the number of cells per unit area of apical membrane and the amount of nondiffusible anions per cell,
Dc and
MA, respectively. Hence, the volume of the functional syncytium is
Here, is the dependent variable.
Electrical-circuit analysis and sign conventions. Because the transepithelial potential difference is a function of current flow in cellular and paracellular pathways, for a given set of independent variables,
Vtrans is computed after the solution to the above set of equations is obtained. Our method makes use of the resistance of each of the five membranes of the equivalent bridge circuit [
5],
Rm (
m = 1-5) obtained from the summation of chord conductances of individual ion pathways,
i.e., Eqn. 1b for ion channels, Eqn. 3c for SGLT1, and Eqn. 5b for the Na/K pump. To simulate a step change in the transepithelial current,
ΔItrans and Kirchhoff’s rules are applied to set up five simultaneous linear equations:
The currents,
In (
n = 1-5), flowing through the five resistors were obtained by the
Solve routine of
Mathematica©,
The transepithelial potential difference can now be calculated by
Fluxes directed from lumen to cell and to lis, from cell to peritubular bath and to lis, and from lis to peritubular bath have a positive sign. Electric potentials are referenced with respect to the peritubular (serosal) side, i.e., ψps ≡ 0.
Numerical methods. The transport equations for water and solutes are as follows:
denotes the volume of the cell or the lateral intercellular space, and
and
denote the water and solute fluxes through the various membranes, respectively, where
m indicates the membrane (
m = 1-5). The left-hand sides are zero at the steady state, while the study of time-dependent behavior requires Eqns. 23 and 24 to be simulated. To solve the equations in time, we apply second-order accurate, three-point backward difference schemes (Taylor expansion) as follows:
The index
refers to time
tn, and Δ
t is the time step, such that
tn =
tn-1 + Δ
t. Thus, the equations are solved for all variables with index
at time
t =
tn, leaving the remaining terms known from former time steps. The equations are solved together with the above equations for electroneutrality and the compliance model. The strongly coupled nonlinear equations were solved for machine accuracy by a conventional iterative Newton–Raphson method. In forming the Jacobian matrix, rather than analytical differentiations, we employed a simple difference scheme. The term ‘sampling frequency’ used in analyses of non-steady-state behavior refers to the chosen frequency of time steps [
5].
Independent variables. Appendix 2 lists the independent variables of the model selected for simulating proximal tubule S3 segments [
57,
58]. For model computations, we apply MKSA units for physical constants, independent variables, and computed dependent variables; however, in the text, they are converted to units generally used in physiological literature. The solute permeabilities were chosen for obtaining values in the physiological range of intracellular ion concentrations, transcellular fluxes and membrane potentials [
57], while the hydraulic conductances were obtained from refs. [
59,
60,
61].
Prelude
In calibrating the model for kidney proximal tubules, it became clear that published intracellular cation concentrations cover unusual ranges, as exemplified by generally very low intracellular potassium concentrations, e.g., 79 mM (Necturus [
62]), 68 mM (rabbit [
63]), and 113 mM (rat [
64]). Likewise, available measurements indicated the intracellular sodium concentration of proximal tubule cells to be in the high end as compared to other cell types, e.g. 44 mM (rabbit [
65]) and 17.5 mM (rat [
66]). Proximal tubules are metabolically very active due to reabsorption of electrolytes, glucose, and other nutrients from the glomerular filtrate, in human of 180 L per day, which places the kidney as second only to the heart with respect to specific metabolic rate [
67]. Here we analyze the mechanisms by which the tightly regulated cell sodium and potassium concentrations under physiological conditions can deviate so significantly under experimental conditions. As argued below, we suggest that the electromotive force of the sodium pump is of significance for the deviating cation concentrations, thus hinting at insufficient availability of free oxygen.
Table 1 covers a range of electromotive forces of the sodium pump,
Epump (Eqn. 5a), here indicated by the reversal potential of the sodium pump current,
(see
Mathematical description) and the associated free energy change of ATP hydrolysis,
, in the vicinity of the pump’s ATPase site. The reference concentrations indicated in line 1 are about those of cardiac muscle cells of specific energy metabolism comparable to that of proximal tubule [
68]. The standard
of cytosolic ATP hydrolysis (column 2) agrees well with measured values varying little between brain, liver and muscle cells [
44]. As can be seen, our computations indicate that both
and
dramatically depend on
Epump, which provides plausible biophysical explanation for measured intracellular cation concentrations of proximal tubule deviating from those of other cell types. This is unlike the two kinetic variables, the sodium pump flux (column 9) and the volume flow (column 10), which are related to the number and turnover of functionally expressed pumps, both of which are weakly dependent on the
Epump. Given that, these last mentioned variables are indicators of well-functioning in vitro preparations; this is the other remarkable result of
Table 1. The insignificant change in transepithelial potential difference,
Vtrans, with
Epump (column 8) is due to its ohmic relationship with the active Na
+ current and the leak current carried predominantly by junctional claudin-17/10a, which has largely invariable conductance at the prevailing very small transepithelial potential difference. The electrochemical work performed by the kidney proximal tubule is fueled by lipid oxidation, which requires relatively more O
2 than glucose metabolism,
e.g., palmitic acid yields 106 ATP per 23 O
2, whereas glucose oxidation yields 38 ATP per 6 O
2 [
69]. With compromised in vitro-O
2 delivery to tubule cells, these cells inevitably enter partial anaerobic metabolism, which in turn leads to a reduced ATP/ADP ratio with associated reduced
and
Epump. In the laboratory, this would be reflected in the reversal potential of the pump current,
being numerically smaller than its physiological value of about -200 mV. Free protons generated by mitochondrial metabolism have to be eliminated from the cells. It is likely that the highly expressed Na
+/H
+ exchanger of isolated proximal tubules[
14,
70] serves this function.
Results
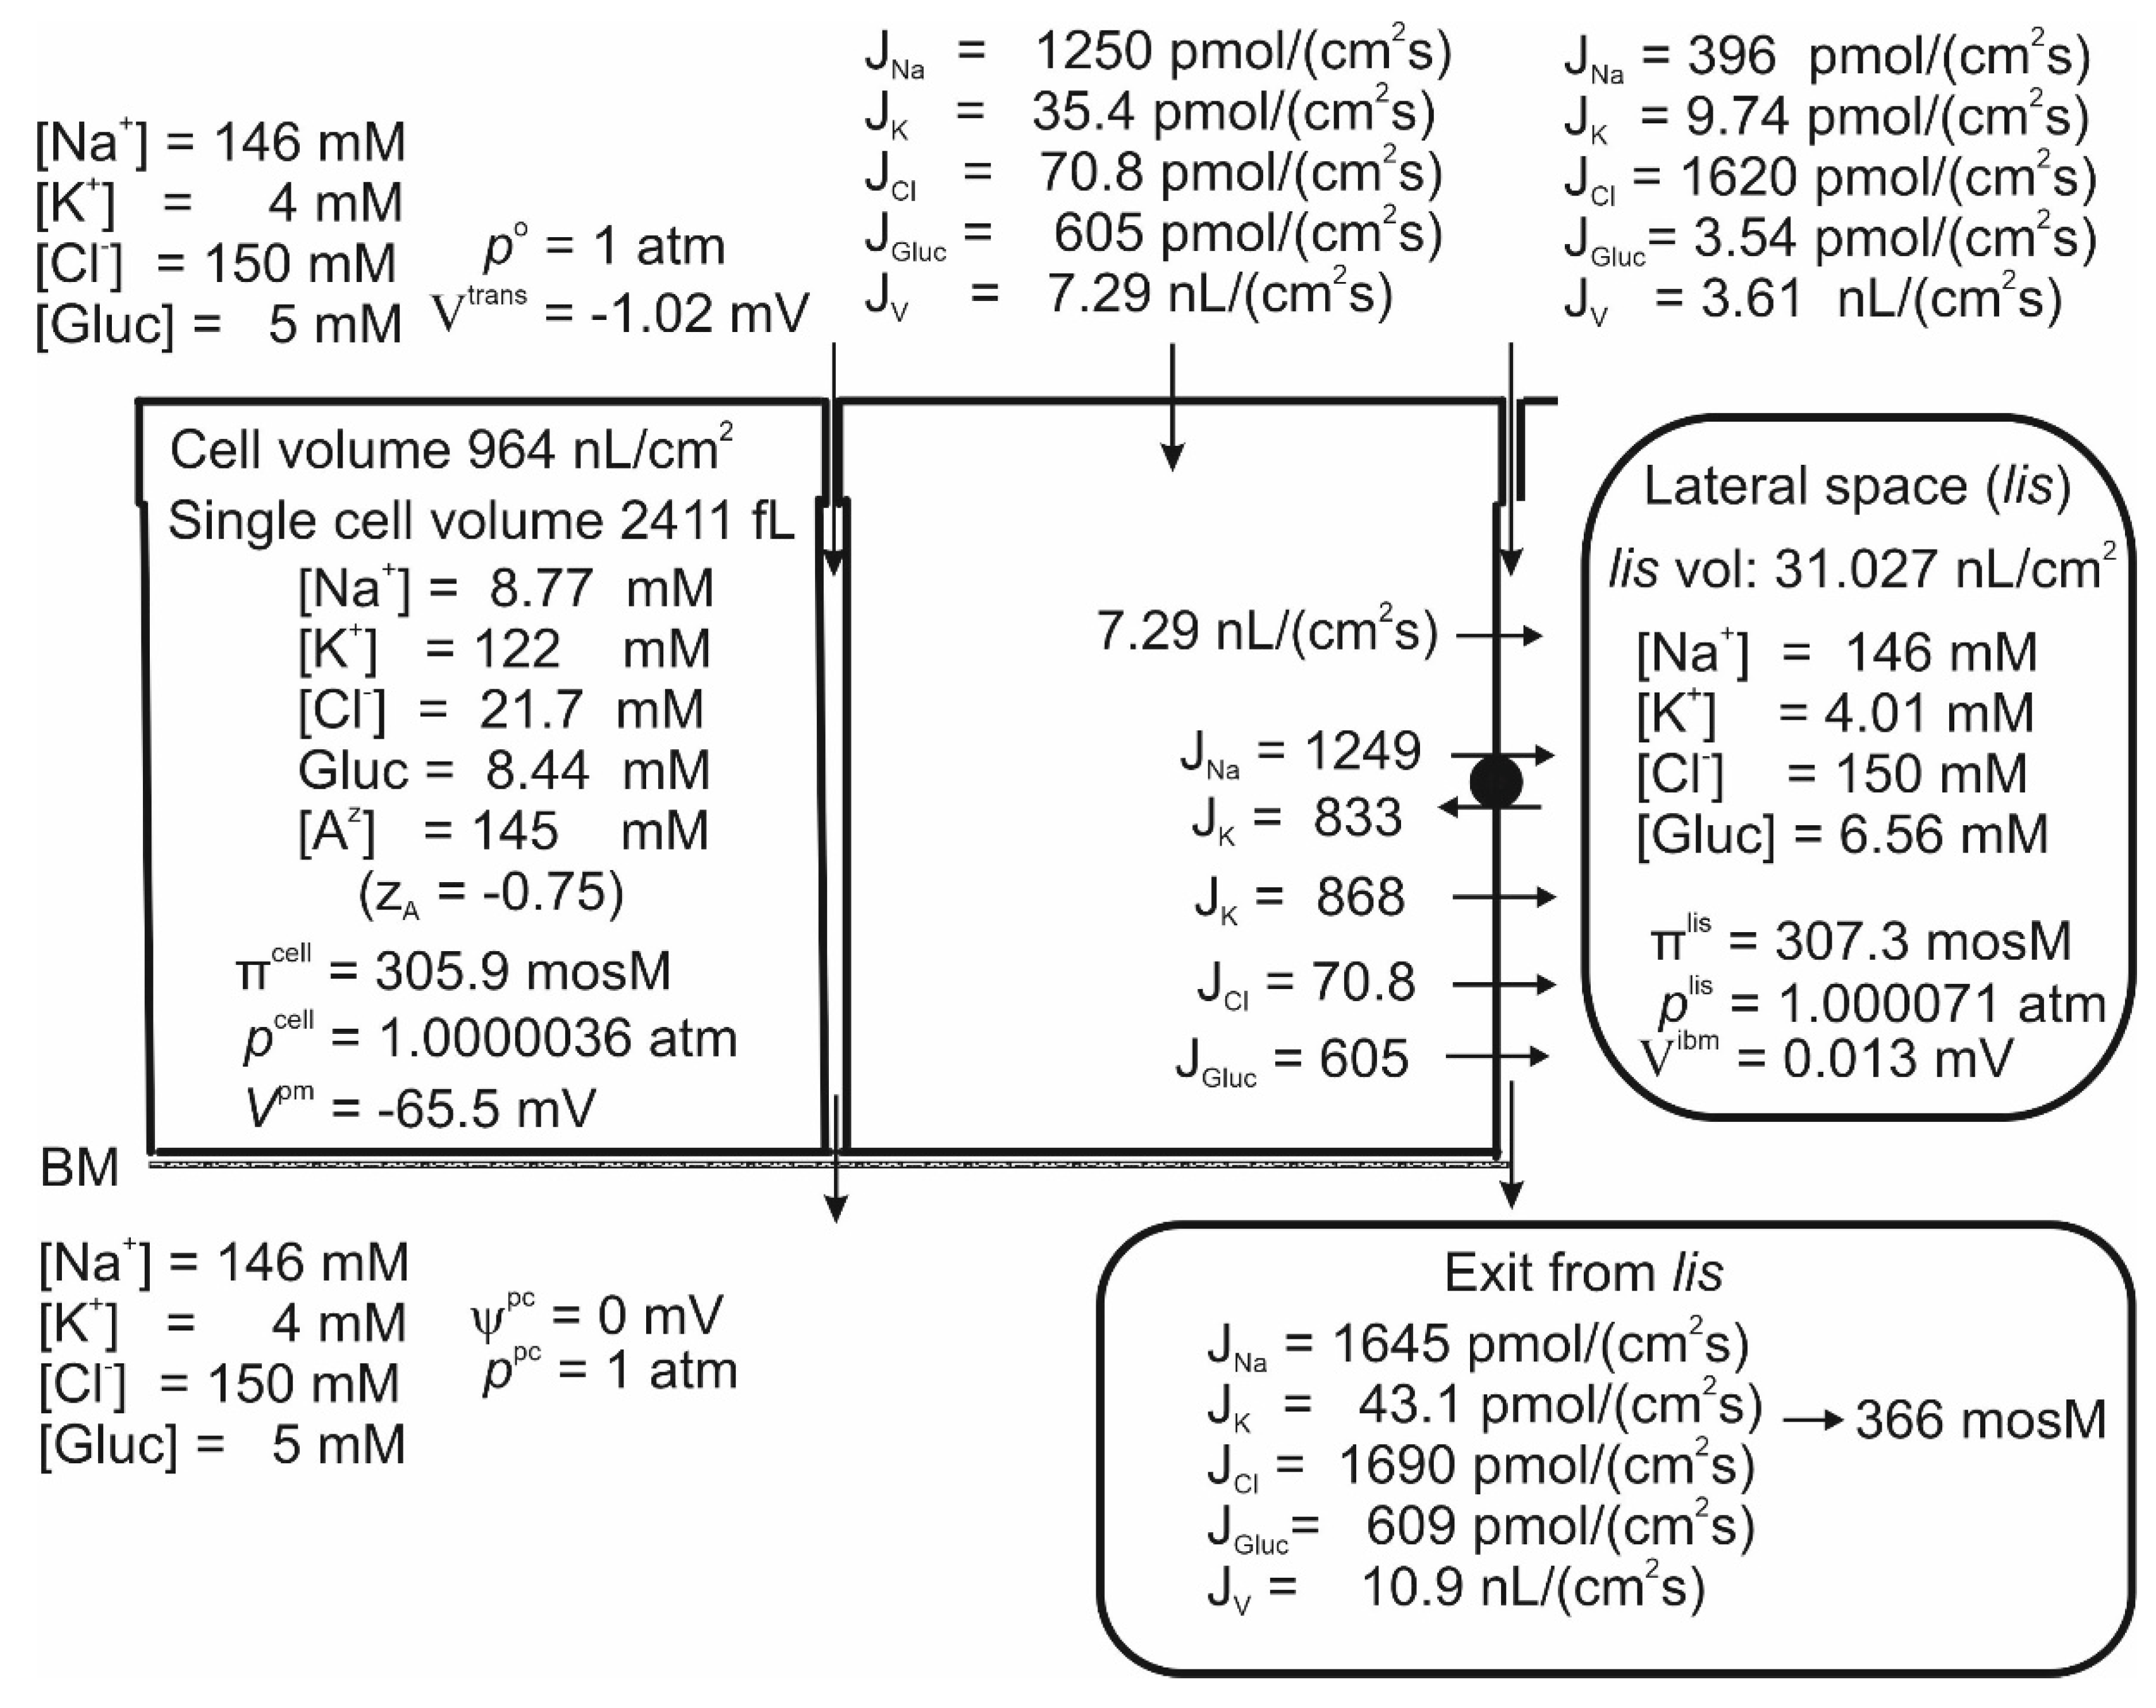
Studies of proximal straight tubules exposed to bicarbonate-free solutions reported a small transepithelial potential difference of approximately -1 mV [
71,
72]. Our model tubule in bicarbonate-free saline supplied with 5 mM glucose absorbs H
2O, Na
+, K
+, Cl
- and glucose at
Vtrans = -1.02 mV,
Table 1 line 1 and
Figure 2. While the negative sign of
Vtrans is a consequence of the active Na
+ flux being conductive and inwardly directed [
16,
71], its numerical value is given by the active Na
+ flux shunted by the Cl
- conductance mediated by claudin-10a in tight junctions [
50]. Apical SGLT1 contributes with a relatively significant water flux of 2.19 nL·cm
-2∙s
-1, that is, compared to the transepithelial water uptake of 10.9 nL·cm
-2∙s
-1 largely flowing through AQP1 water channels, as much as ~20% is carried by luminal SGLT1 driven by cotransport with Na
+ and glucose. The cellular uptake of Na
+ across the luminal membrane,
= 1250 pmol∙cm
-2∙s
-1 occurs via three pathways. (
i) The small flux carried by the 1Na-1K-2Cl cotransporter,
= 35.4 pmol∙cm
-2∙s
-1 (Eqn. 2); (
ii) the even smaller flux through the amiloride-inhibitable Na
+ channel,
= 3.75 pmol∙cm
-2∙s
-1, which is difficult to detect experimentally; and (
iii) the numerically dominating SGLT1,
= 1210 pmol∙cm
-2∙s
-1. The Na/K-pump energizes the low cellular Na
+ concentration, here 8.77 mM, and the hyperosmotic
lis of 307.3 mosM. The paracellular Na
+ uptake of 396 pmol∙cm
-2∙s
-1 is driven by solvent drag via claudin-2 water permeable cation selective channels of tight junction [
51], indicating that a significant fraction of transepithelial Na
+ uptake bypasses the Na/K pump. This finding is compatible with the early study of Na
+ reabsorption by mammalian kidney in vivo, which concluded that the reabsorption of tubular fluid energetically is significantly more efficient than estimated from the Na
+-flux-dependent O
2 consumption, which is a measure of ATP hydrolysis at the lateral Na/K-pump ATPase [
73,
74]. The uptake of K
+ via the luminal cotransporter, and by solvent drag in tight junction claudin-2-mediated channels, result in a K
+ concentration in the absorbate of
CK = (35.4+9.74)/10.9 pmol∙cm
-2∙s
-1∙nL
-1∙cm
2∙s
1 = 4.14 mM (
Figure 2), which is in the range of K
+ concentrations in the extracellular fluid
75. As shown in
Figure 2, the paracellular K
+ uptake did not exceed 9.74/10.9 pmol∙cm
-2∙s
-1∙nL
-1∙cm
2∙s = 0.89 mM. Therefore, the apical cotransporter effectively compensates for the component driven by solvent drag via the paracellular route is insufficient for reabsorbing potassium. At the cell potential of -65.5 mV and an intracellular Cl
- concentration of 21.7 mM (
Figure 2), the Cl
- distribution between the cell and the symmetrical bathing solutions is above thermodynamic equilibrium (
ECl = -51.6 mV). By being in series with an apical Na
+-gradient-driven cotransporter [
23], here assumed to be a 1Na-1K-2Cl mechanism [
22,
23,
25], the lateral Na/K pump also energizes this steady-state disequilibrium.
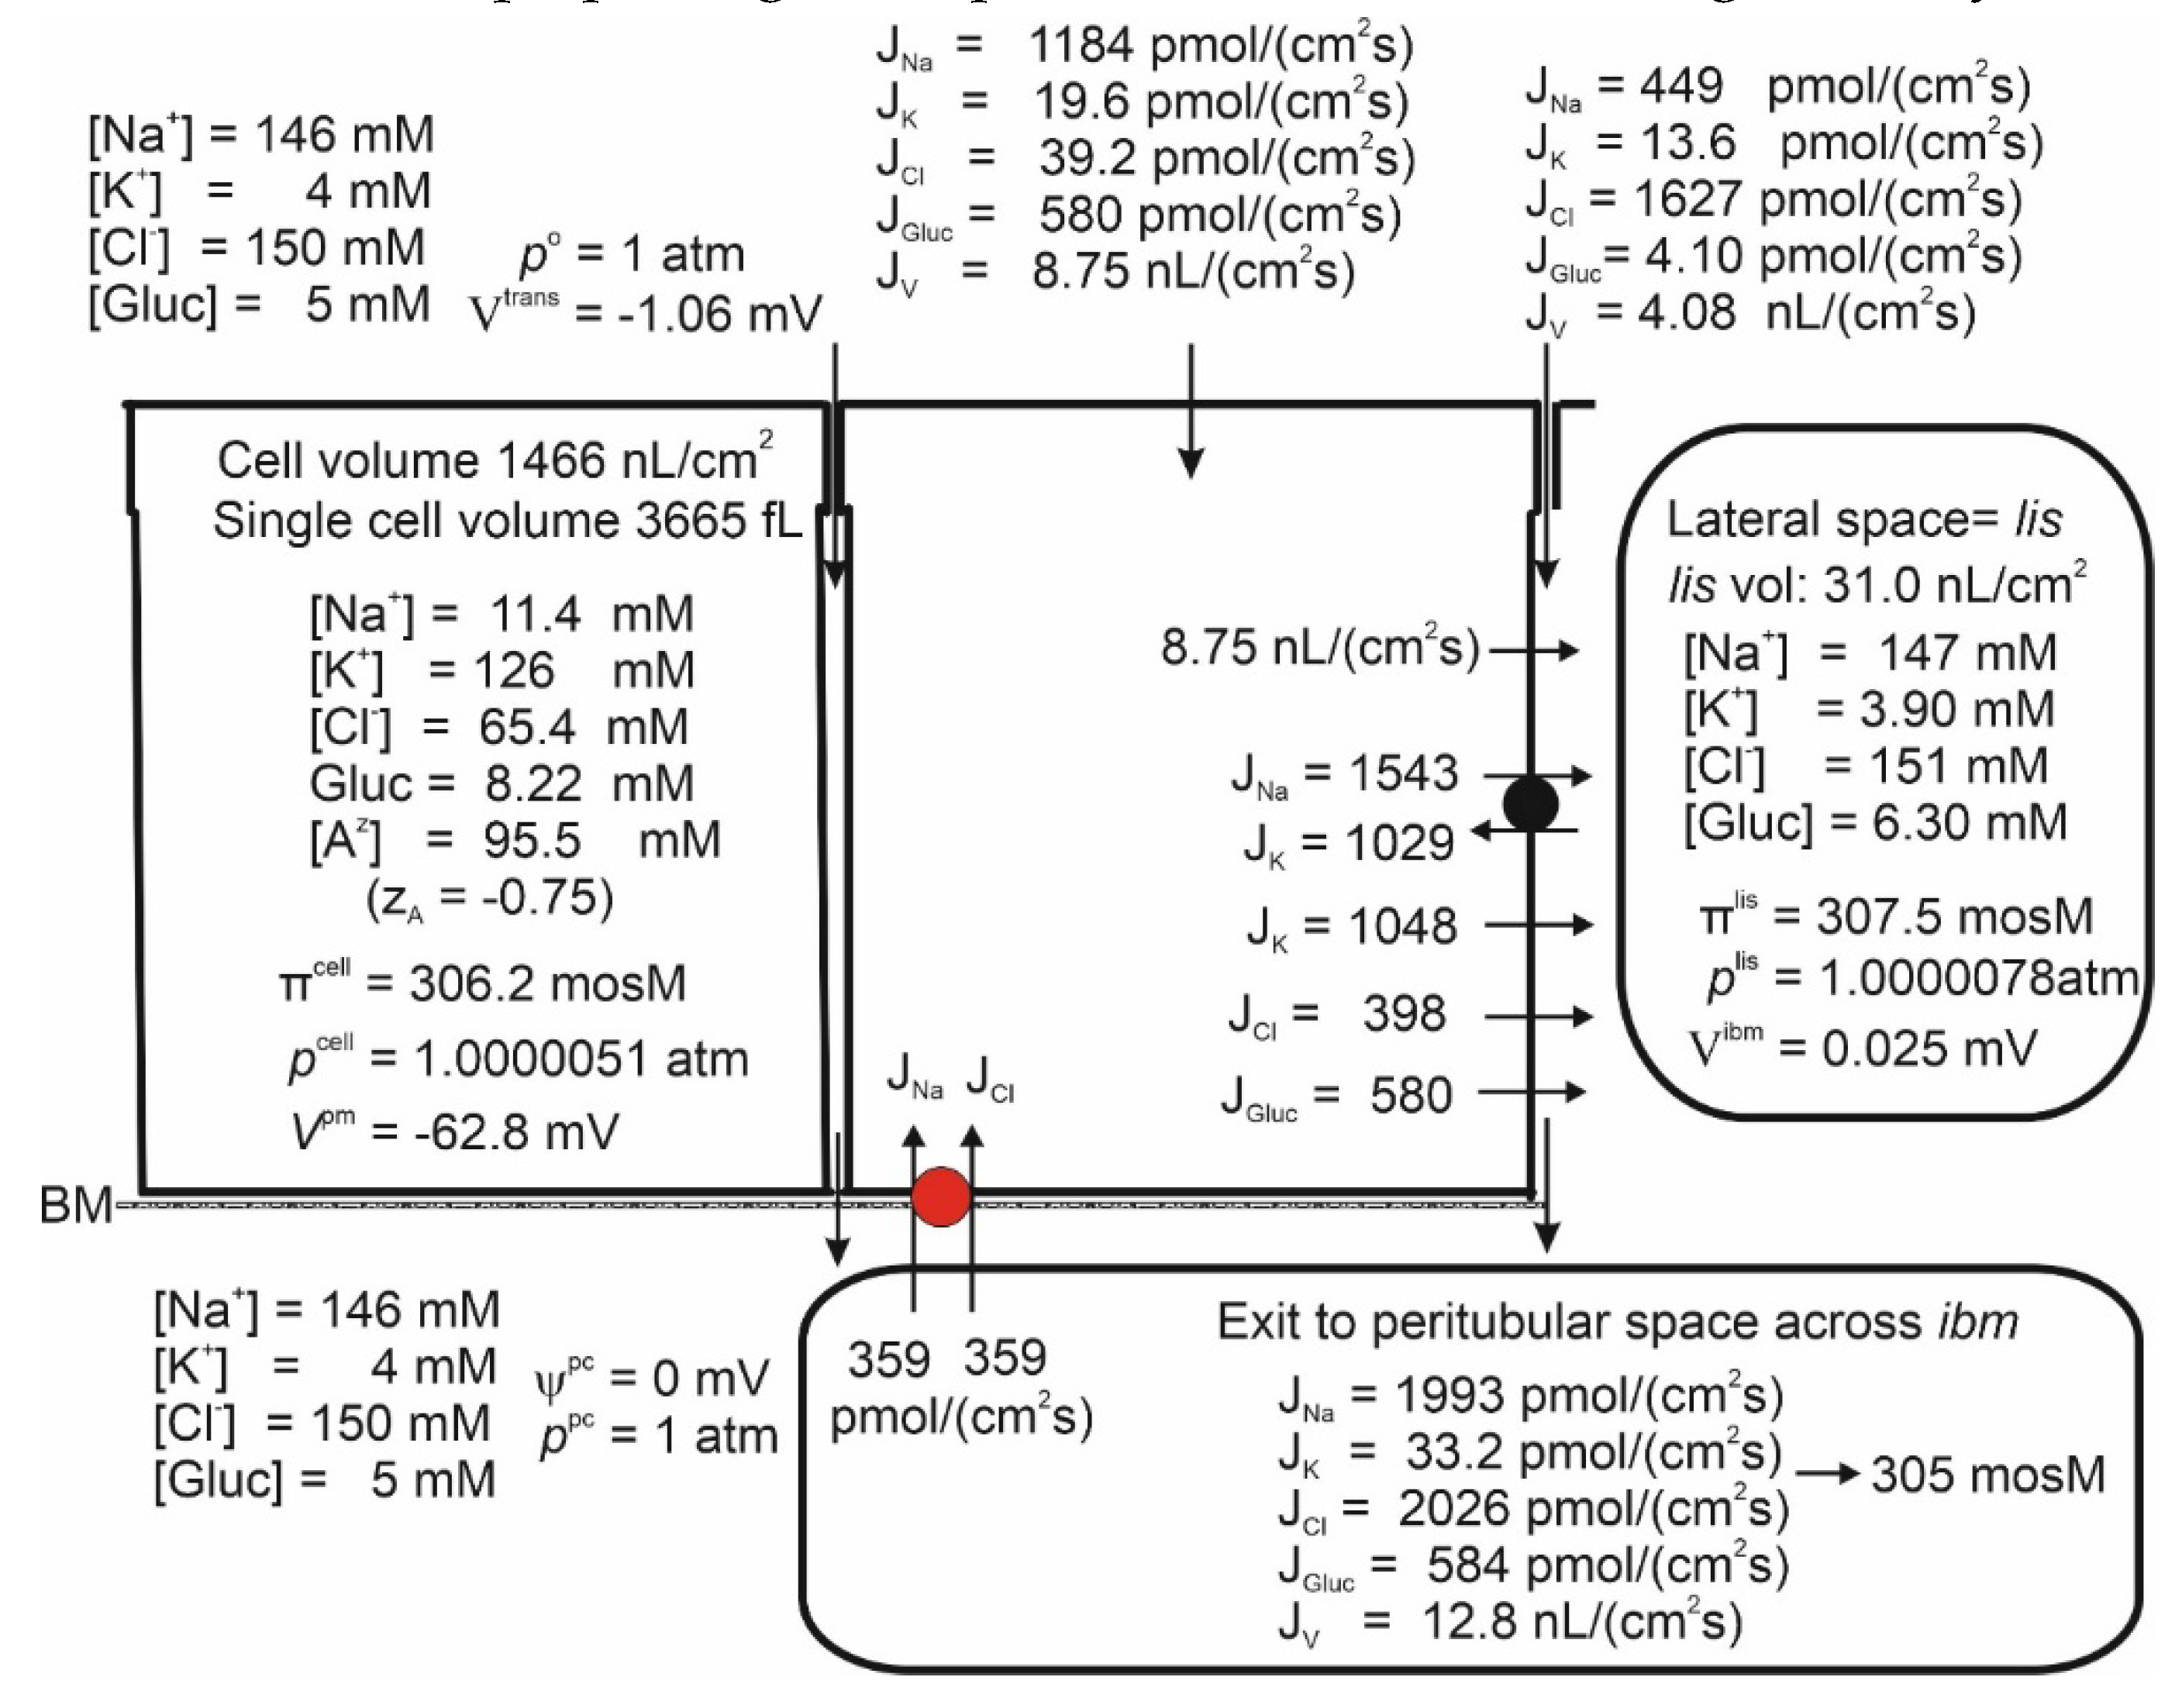
Figure 2.
Computations predict that mammalian kidney late proximal straight tubules spontaneously generate a hyperosmotic transportate. Model epithelium ‘perfused on both sides’ with simulated saline containing (mM), 146 Na+, 4 K+, 150 Cl- and 5 glucose, as indicated on the left-hand top and left-hand bottom panels, respectively. Notably, the epithelium generates significant transepithelial water flow at transepithelial osmotic equilibrium. Note that the space between the cells, lis, is slightly hyperosmotic (307.3 mosM) to the bilateral bathing solutions of similar composition (305 mosM), while the fluid flowing into the peritubular space across ibm is significantly hyperosmotic (366 mosM).
Crosstalk between Electrogenic Apical SGLT1 and Electrogenic Lateral Na/K Pumps
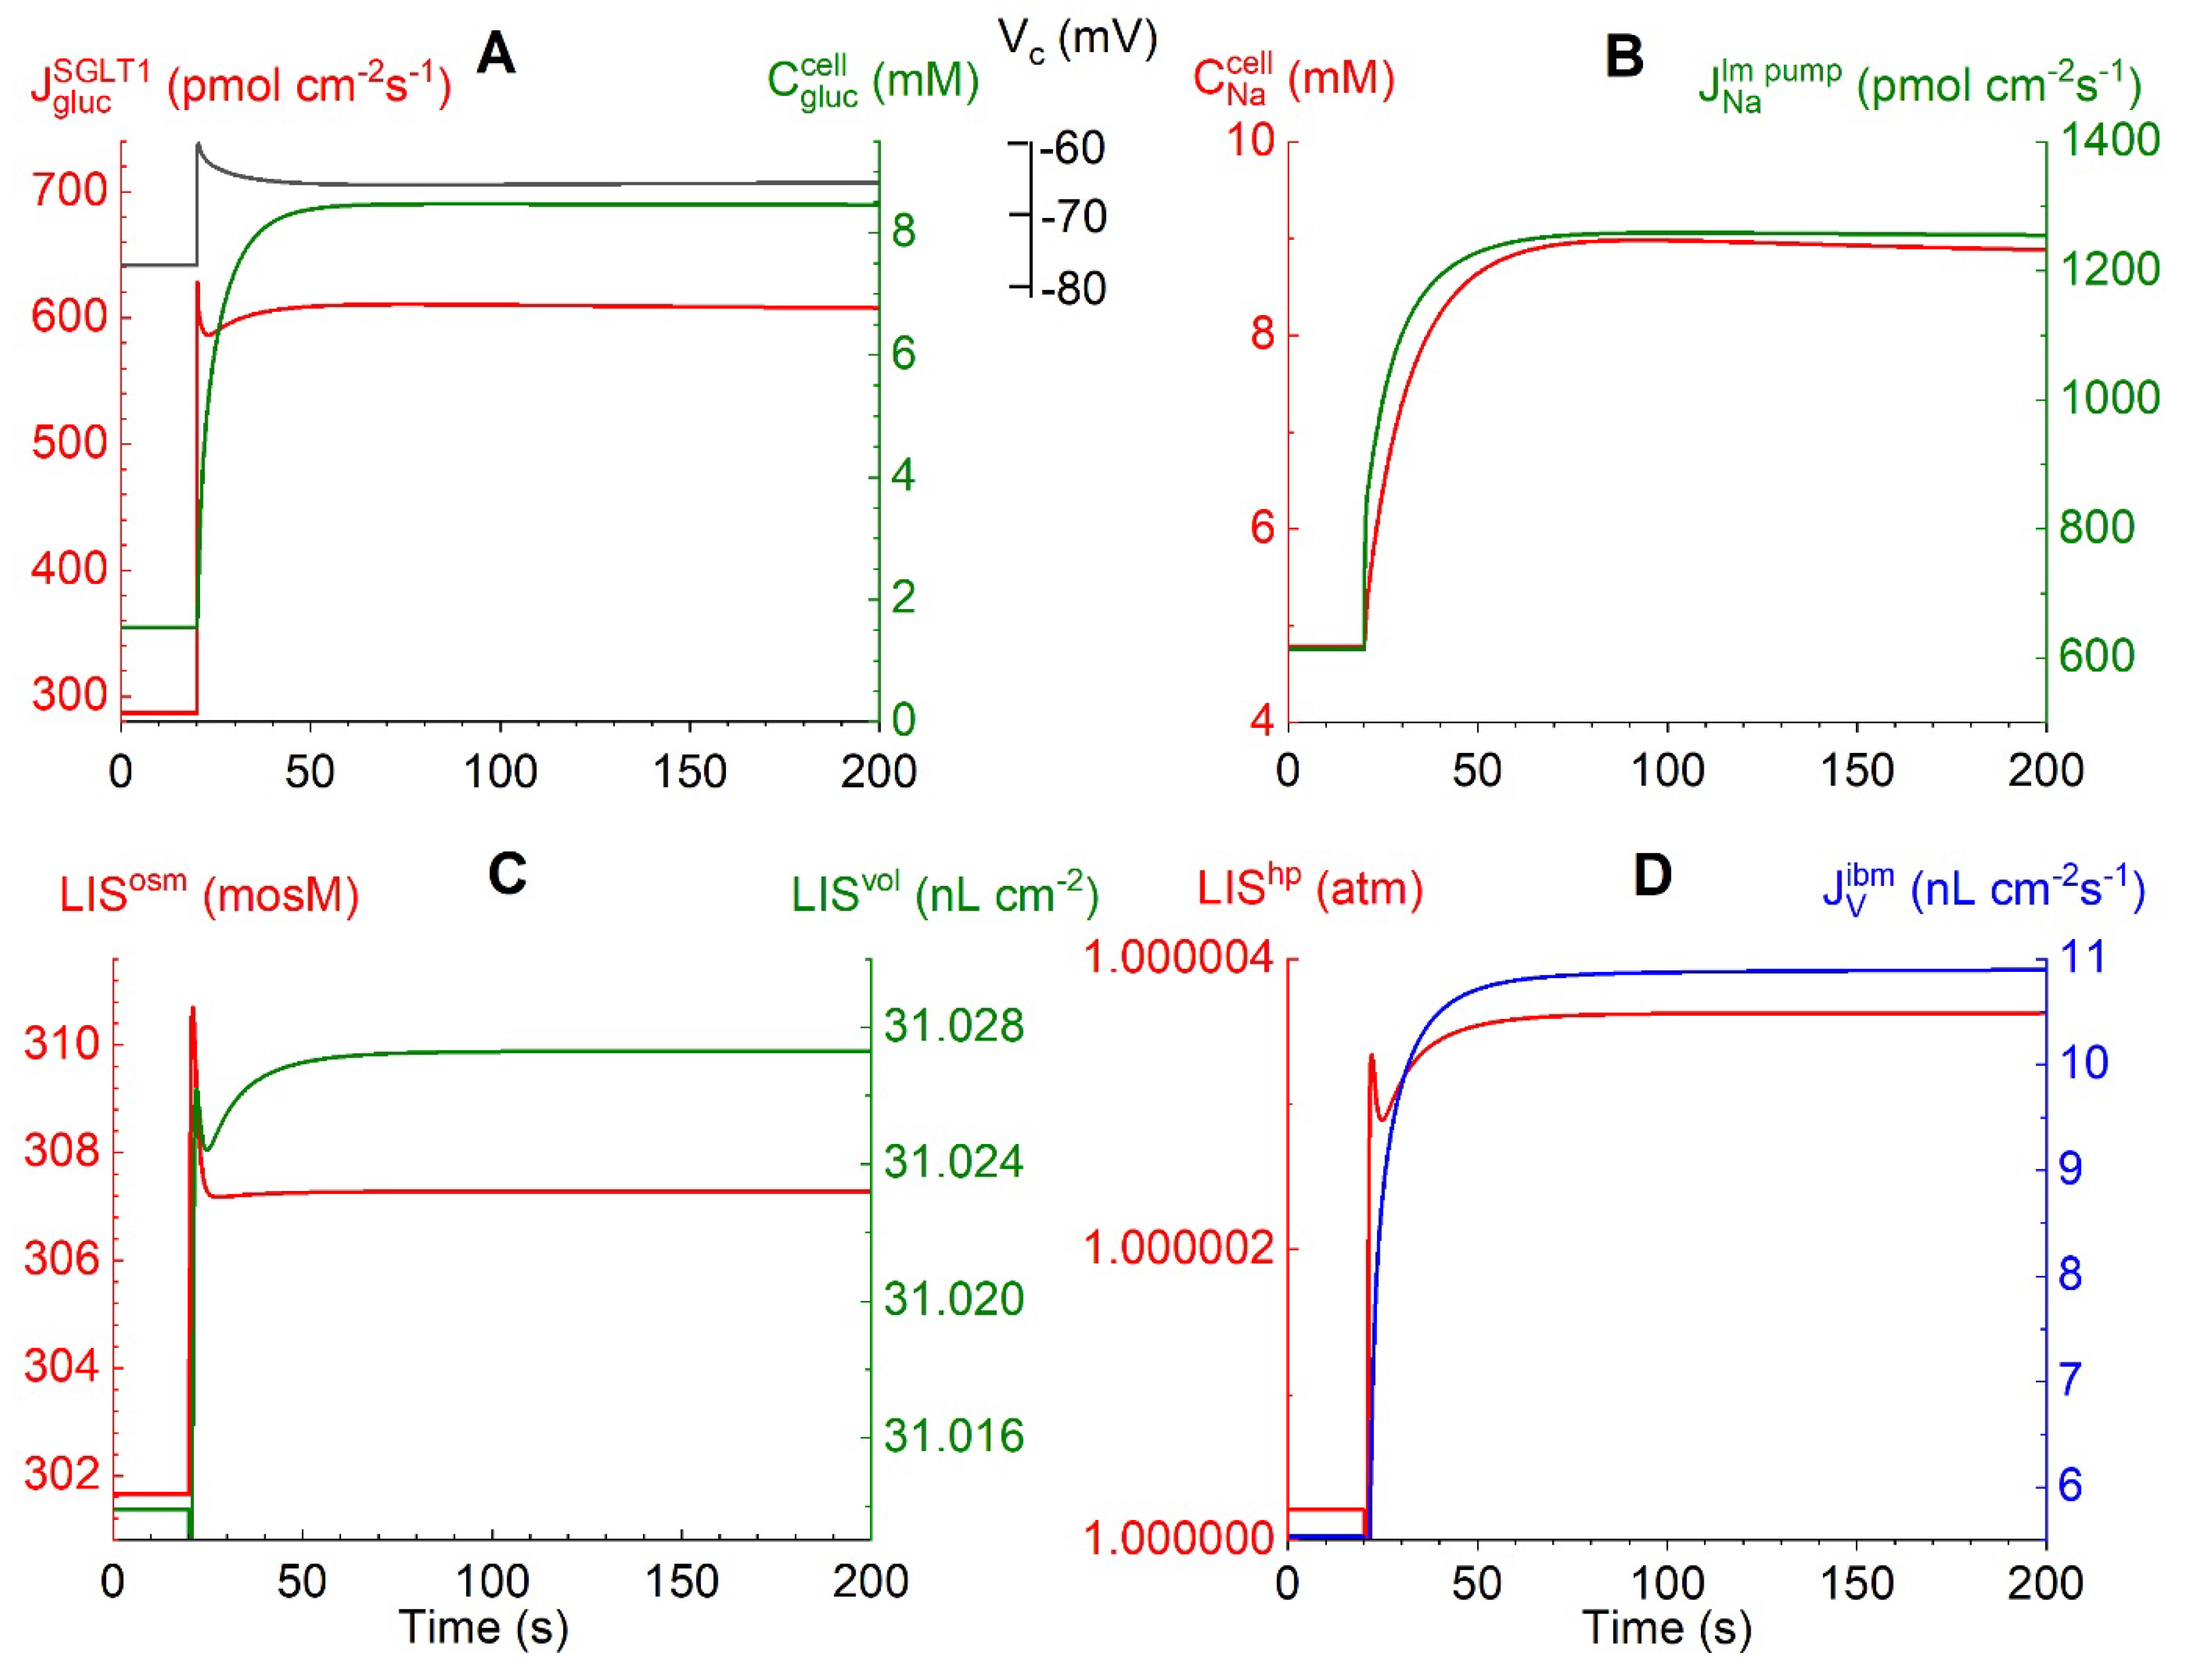
Figures 3A-D depict time-dependent changes in selected physiological variables in response to a bilateral monoexponential (τ = 1 s) 10-fold increase in external glucose concentrations from 0.5 to 5 mM.
Figure 3A: The flux of glucose carried by the voltage-dependent SGLT1,
= 286 pmol∙cm
-2∙s
-1 at
= 0.5 mM prior to the bilateral glucose step, increases to a peak value of 609 pmol∙cm
-2∙s
-1. Simultaneously, the apical membrane depolarizes from -76.7 to -60.1 mV due to the ohmic membrane potential response to the fast inflow of two positively charged sodium ions per glucose molecule. The subsequent decrease in
to 595 pmol∙cm
-2∙s
-1 and increase in
Vcell to -60.3 mV are caused by the following entangled interactions. The fast cellular uptake of glucose causes
to increase steeply from 1.55 to 8.36 mM. Therefore, the glucose influx and the associated ohmic membrane potential response diminish
pari passu with decreasing glucose concentration difference between the cell and the luminal solution.
Figure 3B: The stimulated
causes
to increase from 4.7 to 8.7 mM. The flux of sodium ions pumped into the lateral intercellular space,
(Eqns. 5), increases from 613 to 1255 pmol∙cm
-2∙s
-1, initially with fast time course because of the exponential SGLT1-generated cell depolarization, and subsequently slowly owing to the similarly slow increase in
.
Figure 3C: The
lis uptake of Na
+ and Cl
- leads to an increase in the
lis osmolarity from 301.6 mosM through the transient peak at 310 mosM before attaining a steady-state value of 307.3 mosM associated with solute fluxes across the interspace basement membrane into the peritubular space. This in turn drove the volume expansion of the
lis from 31.014 to 31.027 nL∙cm
-2. The water uptake from luminal fluid occurs through three different pathways: via AQP1 by osmosis, via SGLT1 associated with glucose influx (Eqn. 3a), and by flow in the water permeable claudin-2 of tight junctions, as analyzed below.
Figure 3D: The associated increase in the hydrostatic pressure of
lis constitutes the force driving water across the interspace basement membrane (
ibm) with a low reflection coefficient into the peritubular compartment, at 200 s
= 10.9 nL∙cm
-2∙s
-1. Taken together, the results shown in
Figure 3A-D indicate instantaneous ‘cross-talk’ between apical rheogenic SGLT1 fluxes and the lateral Na/K pump flux by 1:1 electric coupling between apical and lateral membrane depolarizations owing to the relatively very small junctional resistance.
Figure 3.
Computed trans- and intraepithelial biophysical variables following a step change of bilateral glucose from 0.5 to 5 mM at t =20 s. A. The evoked fast increase in rheogenic SGLT1 flux passing a peak of 628 pmol∙cm-2∙s-1 (red) leads to fast cell depolarization from -77.1 to -60.7 mV (black). The subsequently slower relaxation to -65.7 mV follows the transient decrease in rheogenic 2Na+:1 glucose uptake while the cellular glucose concentration increases to 8 mM (green). B. The fast increase in the depolarization-generated rheogenic active Na+ flux across lm proceeded through a slower increase caused by the increase in the cellular Na+ concentration, as indicated in the red graph. C. Uptake by lis of NaCl results in an increase in osmolarity (LISosm) and volume (LISvol) of the lateral intercellular space. D. The increase in lis volume results in an increase in hydrostatic pressure (LIShp), which drives fluid out of lis into the peritubular space resulting in a steady state transepithelial water uptake of 10.9 nL∙cm-2∙s-1 (blue).
Contributions of Epithelial Water Pathways to Transepithelial Water Absorption
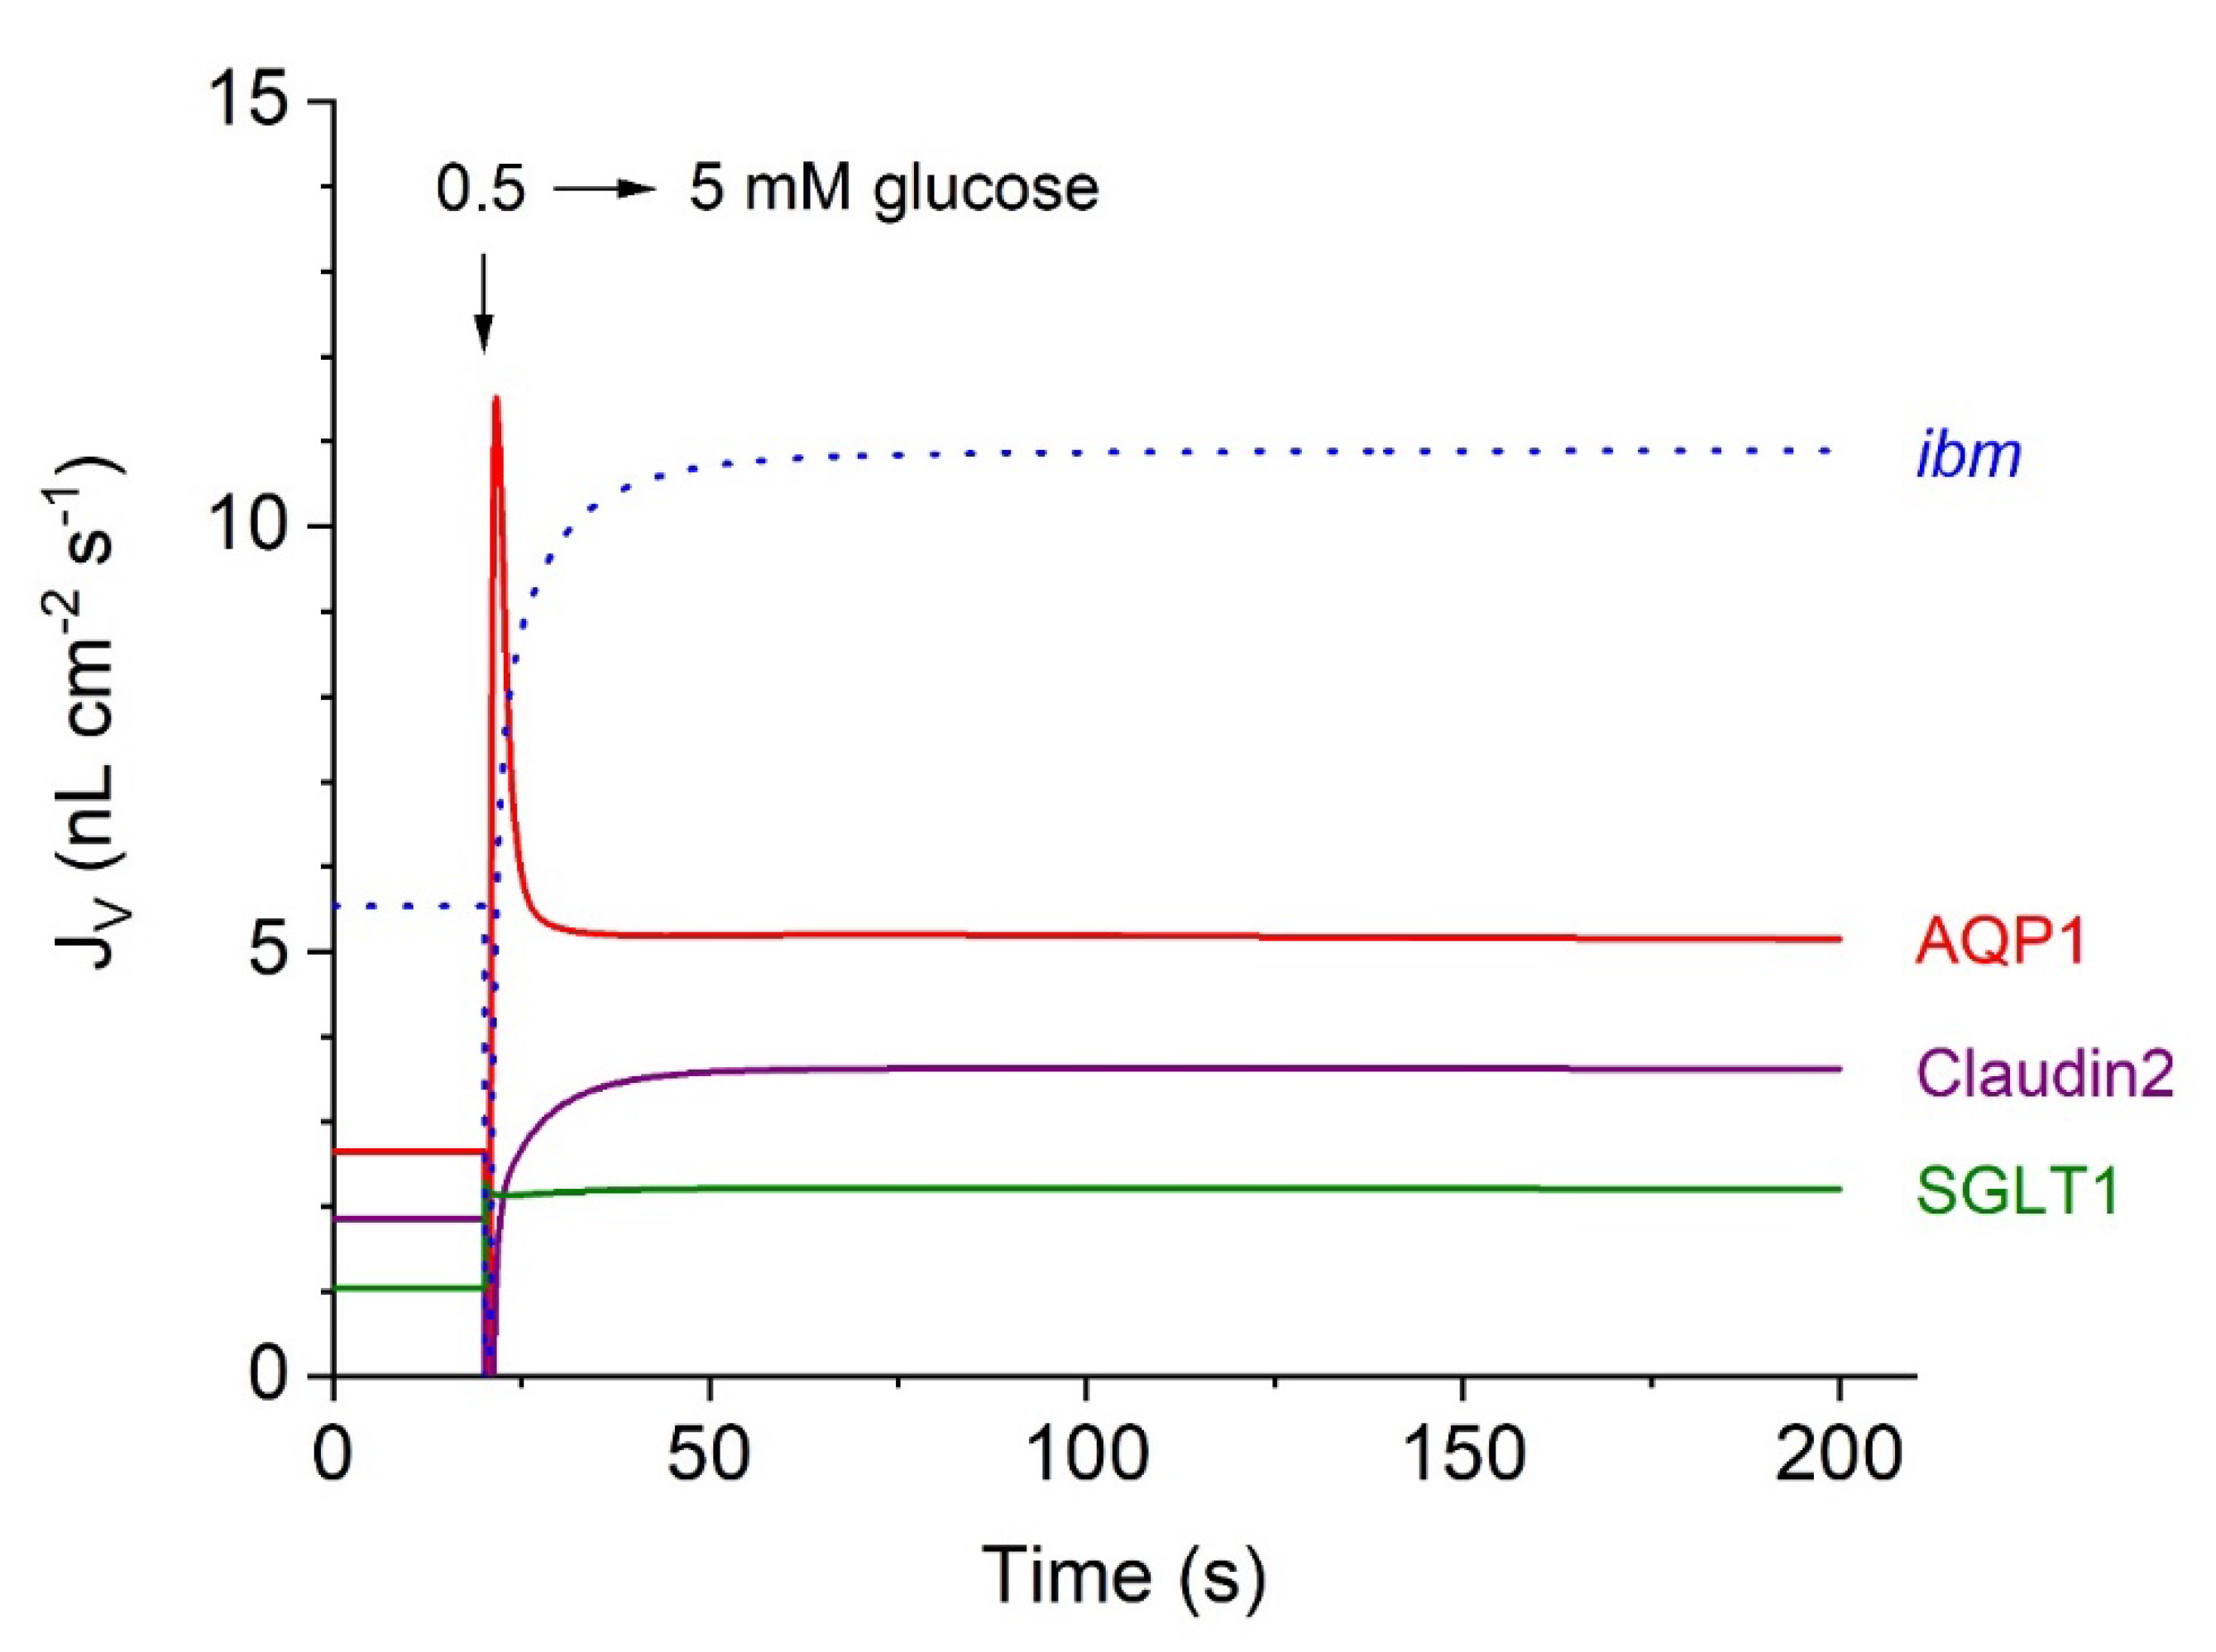
In our mathematical treatment, water flow across the tubular epithelium is separated into three entrance pathways of quite different natures; see
Figure 4, which continues
Figure 3A-D.
(
i) The classical aquaporin mechanism, AQP1, which carries approximately 50% of the steady-state water uptake (Eqn. 8a); (
ii) water transport in SGLT1 coupled to the inward fluxes of Na
+ and glucose (Eqn. 3a); and (
iii) water transport in junctional claudin-2, which is also permeable to small cations (Eqn. 9a). Notably, following a rapid increase in
from 0.5 to 5 mM, water flows mediated by AQP1 and SGLT1, respectively, exhibit an initial ‘overshoot’, reflecting the rapid initial inflow of 2-sodium and 1-glucose, resulting in a rapid increase in cell osmolarity, conf.
Figure 3C. In contrast, at
t = 20 s, the initial water flow through junctional claudin-2 exhibited a brief (~900 ms) outwardly directed surge caused by the sudden increase in the osmolarity of the external solutions (not shown in detail). Subsequently, fluid transport in this pathway becomes inward, which is associated the steep increase in
as indicated in
Figure 3B.
Figure 4.
Computed water flows in the three entrance pathways of the proximal tubule S3 segment, continued from
Figure 3A-D. At 20 s, the glucose concentration increased bilaterally from 0.5 to 5 mM. The time course of
inward water transport through two pathways in the apical membrane, AQP1 and SGLT1, was compared with that of junctional water transport through cation-permeable claudin-2. The dotted blue graph shows the time course of fluid
exit across the interspace basement membrane (
ibm) approaching a steady-state flow of 10.9 nL∙cm
-2∙s
-1, which is the sum of stationary flows in the three luminal entrance pathways; in nL cm
-2 s
-1, AQP = 5.11, claudin-2 = 3.61, and SGLT1 = 2.19.
Isosmotic Transport
The fluid reabsorbed by the proximal tubule is in near-thermodynamic equilibrium with extracellular fluid [
8,
76,
77,
78,
79]. The general and important finding of
Figure 2 is that the fluid transported from the tubular lumen to the peritubular space is significantly hyperosmotic to bathing solutions. Inspection revealed that the fluid emerging from
lis has greater osmolarity than the fluid of departure
in casu 366 versus 307 mosM, which is qualitatively similar to our analysis of proximal convoluted tubules [
5] and compatible with the Diamond–Bossert analysis of gallbladder epithelium [
80]. This indicates that diffusion rather than convection (solvent drag) dominates mass movement from the lateral intercellular space to the peritubular compartment, effectively preventing absorbed fluid from becoming isosmotic to body fluids. Faced with a similar challenge in studies of the vertebrate small intestine, Hans Ussing suggested that a way of securing isosmotic transport would be to recirculate the ‘surplus of ions’ back into the lateral intercellular space. Aspects of the Na
+ recirculation theory were investigated for fluid absorption in the small intestine with bumetanide-inhibitable 1Na-1K-2Cl cotransporters in the contra-luminal cell membrane [
81,
82] and for the exocrine glands of frog skin by whole-cell and single-channel patch-clamp studies indicating the expression of Na
+ channels in the luminal membrane of this secretory epithelium [
83,
84]. In the present study, we investigated the effect of Na
+ recirculation by incorporating a Na–Cl cotransporter in the peritubular membrane, similar to our previous study of proximal tubules [
5,
6]. We approached this problem by starting from the already obtained mathematical solution with no recirculation (
Figure 2). Then, the rate of ion recirculation was increased iteratively while checking for osmolarity of the transported fluid.
Figure 5 shows that this procedure caused the absorbed fluid to converge to osmotic equilibrium with the peritubular fluid. The principal finding is that, relative to the active Na
+ sodium flux, the Na
+ recirculation flux of the S3 segment, 359/1543 = 0.23, is significantly smaller than that of the intestinal preparation, 0.65±0.03, which has been studied in amphibian small intestinal epithelium [
81]. The logical explanation for this difference is that apical AQP1 constitutes a dominating apical water pathway of the S3 segment, while the small intestine is relatively ‘watertight’ [
28,
85] because of a lack of aquaporin gene expression in fluid-absorbing enterocytes [
27].
Figure 5.
Isosmotic transport is achieved by regulating the recirculation flux of small ions between the lateral intercellular space and the peritubular solution. Like in the small intestine, isosmotic transport occurs through the regulation of the activity of the cotransporter of the peritubular membrane (red). Notably, significant cell swelling from 964 (
Figure 2) to 1466 nL/cm
2 (above) was caused by the uptake of Na
+ and Cl
- via the cotransporter. The water flows in the two apical pathways are as follows: AQP-mediated, 6.65 nL∙cm
-2∙s
-1, and SGLT1-mediated, 2.10 nL∙cm
-2∙s
-1. .
Isosmotic Transport Requires Cell Volume Regulation to Maintain Cellular Homeostasis
By introducing Na
+ recirculation to achieve isosmotic transport,
increased from 21.7 to 65.4 mM with an associated cell volume expansion of Δ
Vol = 1466 – 964 = 502 nL/cm
2 (
Figure 2 and
Figure 5). Following osmotic swelling in vitro, the cell volume of the proximal straight tubule rapidly decreased toward its original volume prior to osmotic challenge [
86], which is now known to be accomplished by stimulation of the volume-regulated anion channel VRAC [
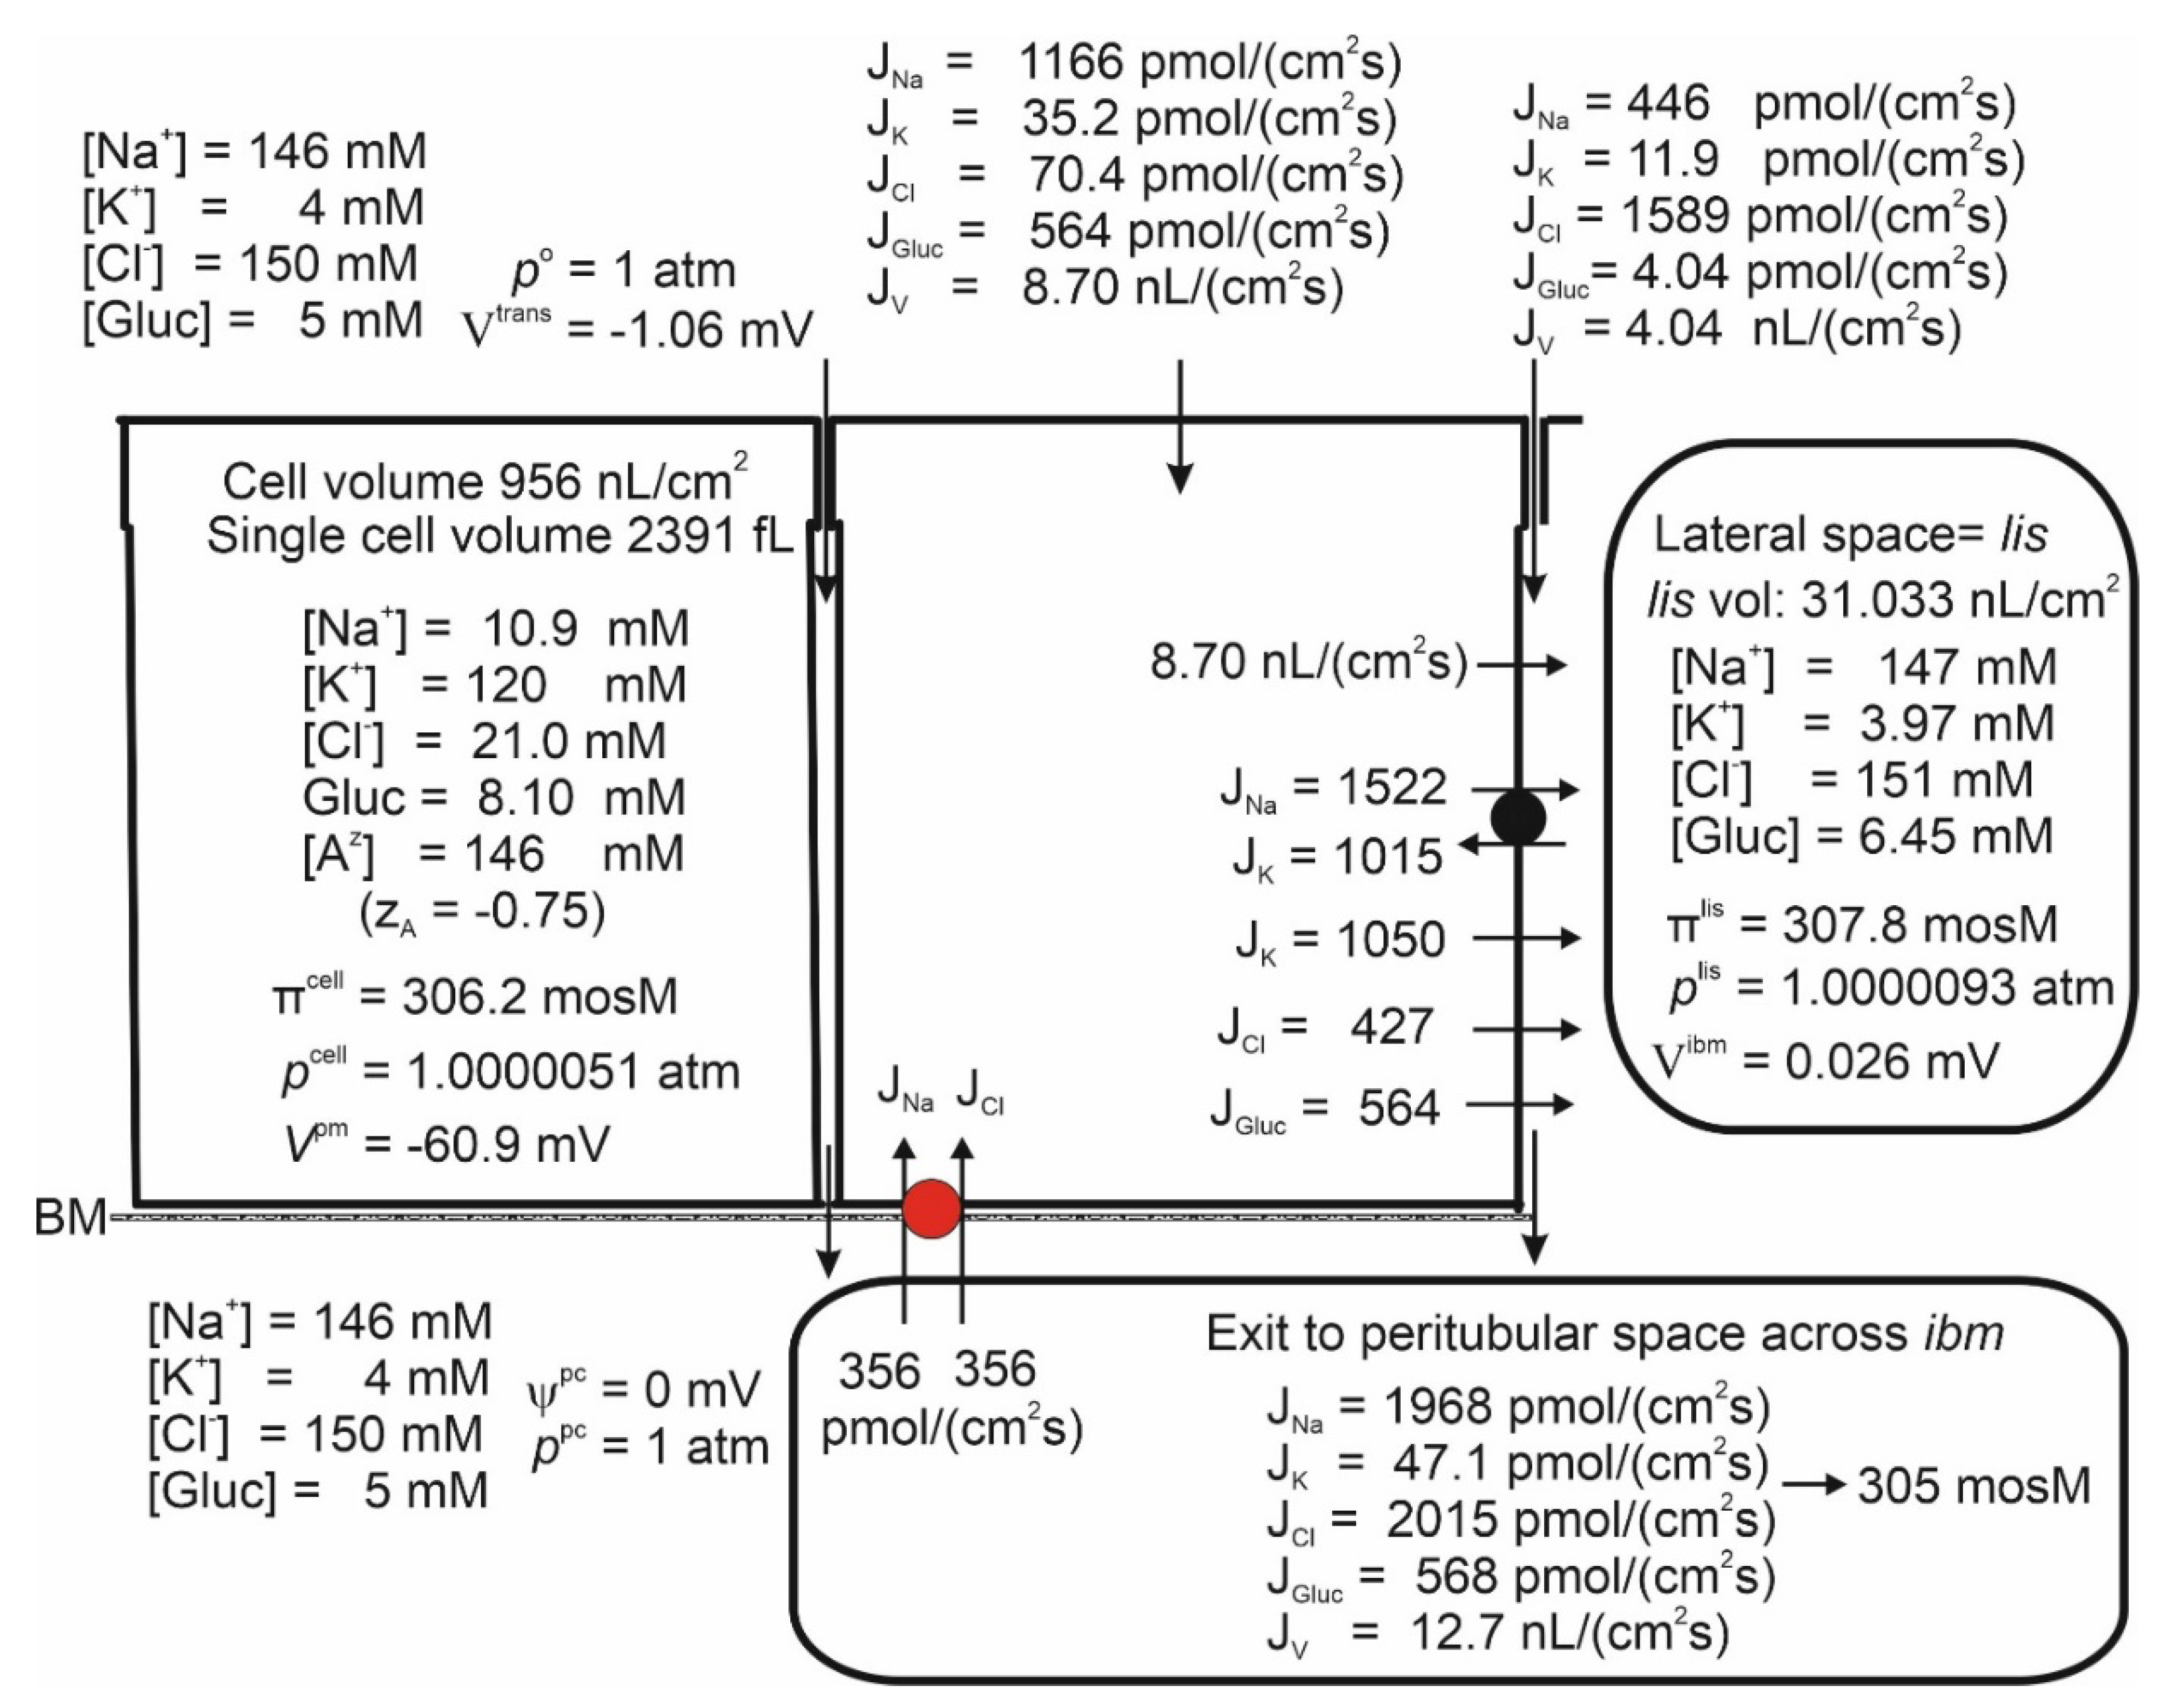
87]. If the cell volume of the model epithelium is forced back toward its control volume (
Figure 2) by increasing
(‘VRAC activation’), we obtain a new set of dependent variables still governing isosmotic transport (
Figure 6). As shown in
Figure 5 and
Figure 6, the volume decrease is accompanied by a loss of cell K
+ of 126·1466–120·956 = 69,996 pmol∙cm
-2. It is reassuring for our modelling that loss of intracellular potassium occurred in perfused straight tubules in response to VRAC stimulation of osmotically swelled enterocytes [
88].
Figure 6.
Increasing the lateral membrane’s Cl
- permeability from 0.3×10
-7 m/s (
Figure 5) to 0.6×10
-6 m/s simulating VRAC activation decreased the epithelial cell volume back to its ‘physiological value’ of
Figure 5.
Figure 6.
Increasing the lateral membrane’s Cl
- permeability from 0.3×10
-7 m/s (
Figure 5) to 0.6×10
-6 m/s simulating VRAC activation decreased the epithelial cell volume back to its ‘physiological value’ of
Figure 5.
Discussion
Renal fluxes of ions, glucose, and water constitute a mutually interdependent functional network that is impossible to comprehend intuitively. In the present and previous studies [
5], we delineated the interdependence of intraepithelial ion and water fluxes and their driving forces along the proximal tubule. The flux equation of SGLT1 comprises the dependence on apical membrane potential together with the experimentally described saturation for both substrates by a mechanism similar to that of the Na
+ uptake by frog skin (Eqn. 3b) [
31]. Furthermore, we incorporated water fluxes in SGLT1 coupled stoichiometrically to the solute fluxes according to experiment [
28], 200 H
2O: 2 Na
+: 1 glucose. The frictional force driving glucose through the water permeable pore of tight junction into the peritubular space has not been considered before. By incorporating this mechanism in our model, we have been able to discuss for the first time the quantitative significance of paracellular glucose fluxes for overall glucose recovery along the proximal tubule.
In evaluating analytical computations and the conclusions drawn from these, we emphasize that although the applied mathematical equations conform to classical concepts in biophysics, the quantitative outcome of the modeling depends on the values of independent variables. With some of the independent variables impossible to obtain experimentally and others, unavailable from common preparations, we selected the independent variables to reproduce the range of concentrations, membrane potentials, fluxes, etc., in agreement with experiments on mammals, including humans. In our calibration of the model for reproducing published observations, the large range of measured intracellular cation concentrations surprised us. This forced us to perform a quantitative biophysical analysis, which suggested that insufficient oxygenated preparations were the cause of high intracellular Na+ and generally very low intracellular K+ concentrations reported for in vitro preparations. In the present study, these measurements were disregarded in our calibration of the model. This procedure is trivial and not controversial.
By applying our previously derived mathematical equations governing paracellular solvent drag [
48] to the recently identified sodium and water permeable junctional claudin-2 channels [
50,
51] we solved the early enigma that a significant fraction of the transepithelial Na
+ reabsorption by mammalian kidney bypass the sodium pump [
73,
74].
Another issue that demands attention concerns the isosmotic fluid absorption. The underlying mechanism has been debated since it was realized that the osmolarity of luminal fluid does not change measurably during the absorption of ~70% of the volume generated by glomerular filtration [
8,
76,
77,
78,
89]. In textbooks [
75,
79], isosmotic transport is assumed to be an inevitable condition owing to the documented high hydraulic cell membrane conductances of kidney epithelia. Our quantitative analysis of proximal tubules revealed that the significant diffusion permeabilities of the interspace basement membrane of low reflections coefficient results in the reabsorbed fluid being hyperosmotic to body fluids. Thus, isosmotic transport is not a simple consequence of passive ion fluxes across highly water permeable membranes but requires tightly regulated reabsorption of ions depending on metabolic energy. In our treatment, the osmolarity of the transported fluid is a derived quantity with isosmotic transport resulting from regulation of the recirculation of small diffusible ions depending on additional activity of the lateral Na/K pump, in accordance with experimental studies of other transporting epithelia [
81,
83].
Another important focus of the present study is on the interdependence of the glucose flux carried by SGLT1 in the luminal membrane and transepithelial water flow. In summarizing the results regarding fluid absorption by late proximal straight tubules, we could conclude that electric cross talk between rheogenic apical SGLT1 and rheogenic depolarization-activated lateral Na/K pumps constitutes both a logical and a sufficient explanation for the observed coupling between SGLT1-mediated glucose reabsorption and transepithelial water uptake driven by the increased osmolarity of lis. The functional linkage between apical and lateral rheogenic fluxes is particularly tight in the kidney proximal tubule owing to the large paracellular electrical conductance, which ensures effective ~1:1 coupling between luminal and lateral membrane depolarizations.
Correspondence: Erik H. Larsen (ehlarsen@bio.ku.dk)
Code availability. The code belongs to the authors but is freely available upon contacting the authors.
Data availability. All required data are given explicitly in the paper.
Author contributions: EHL defined the problem of the work, developed the mathematical model, and designed and analyzed the computations. JNS developed the FORTRAN program and the numerical methods. The writing of the manuscript was shared by EHL and JNS.
External Funding Source: Supported by the Carlsberg Foundation
Statement of Ethics: The authors have no ethical conflicts to disclose.
Disclosure Statement: The authors have no conflicts of interest to declare.


