Submitted:
25 June 2024
Posted:
25 June 2024
You are already at the latest version
Abstract
Keywords:
1. Introduction
2. Materials and Methods
2.1. Mapping population and trait evaluation
2.2. QTL mapping
2.3. Gene annotation and candidate gene selection
3. Results
3.1. Phenotypic variation and trait correlation analysis
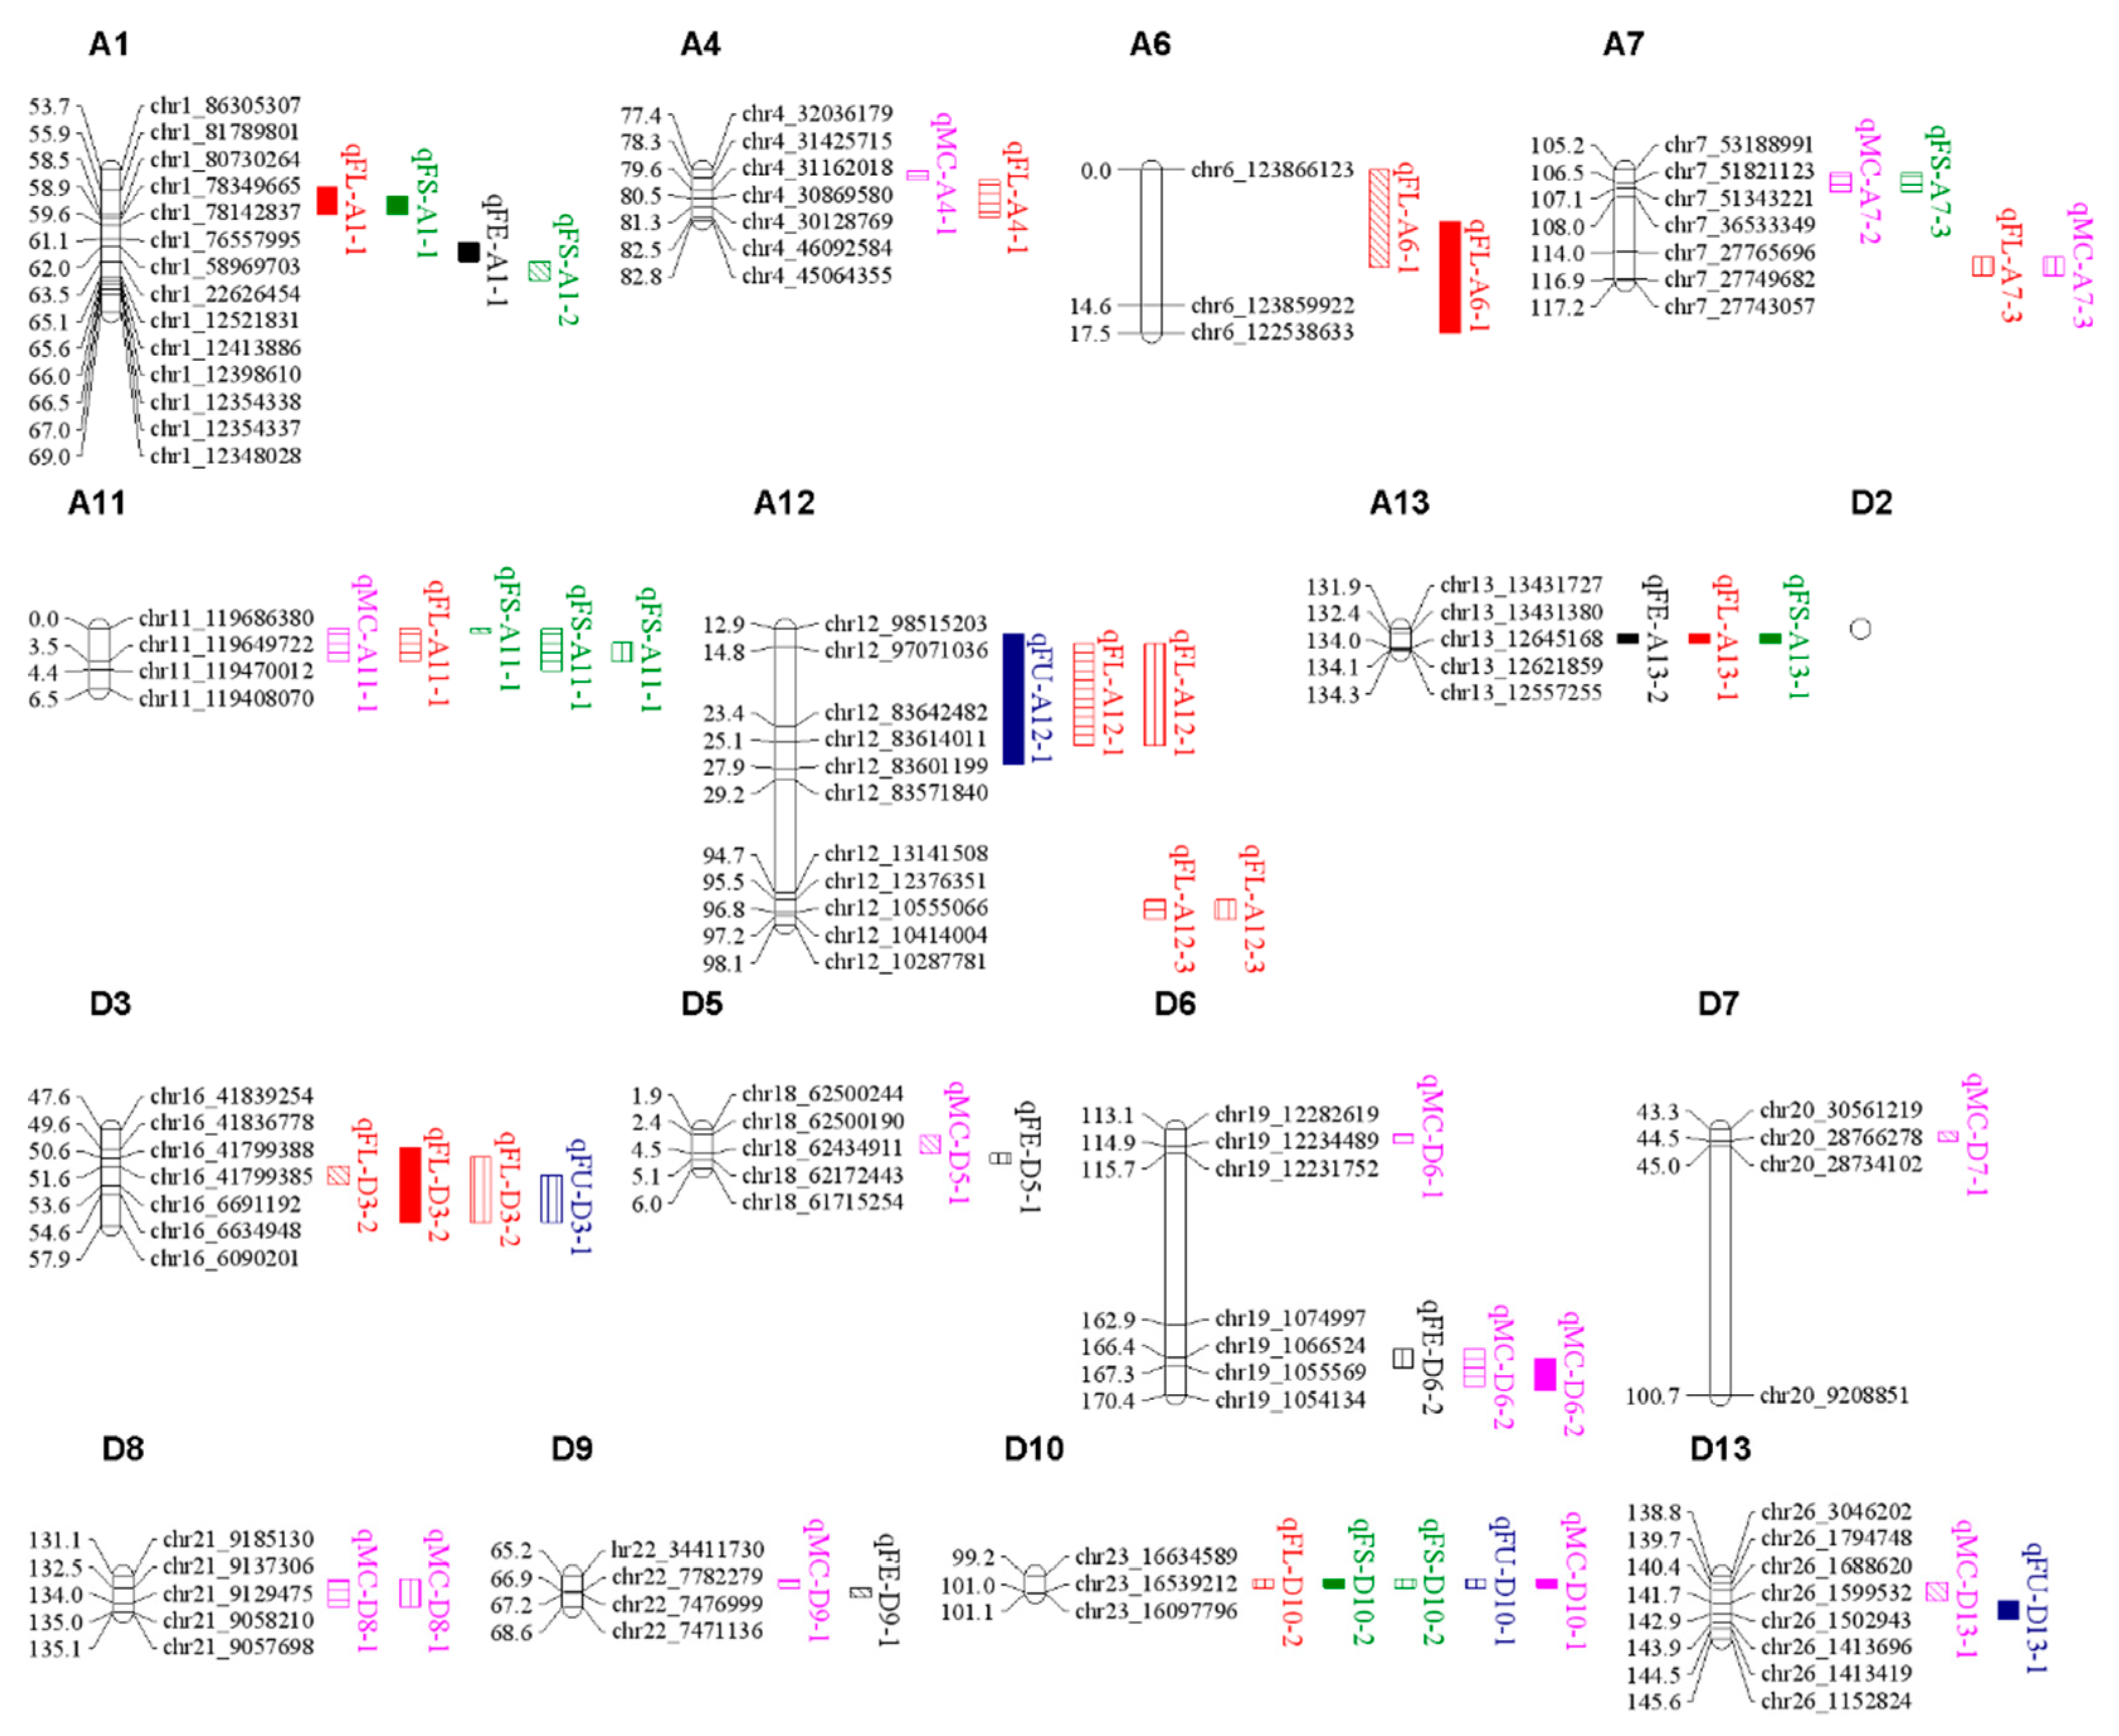
3.2. QTL mapping for fiber quality traits
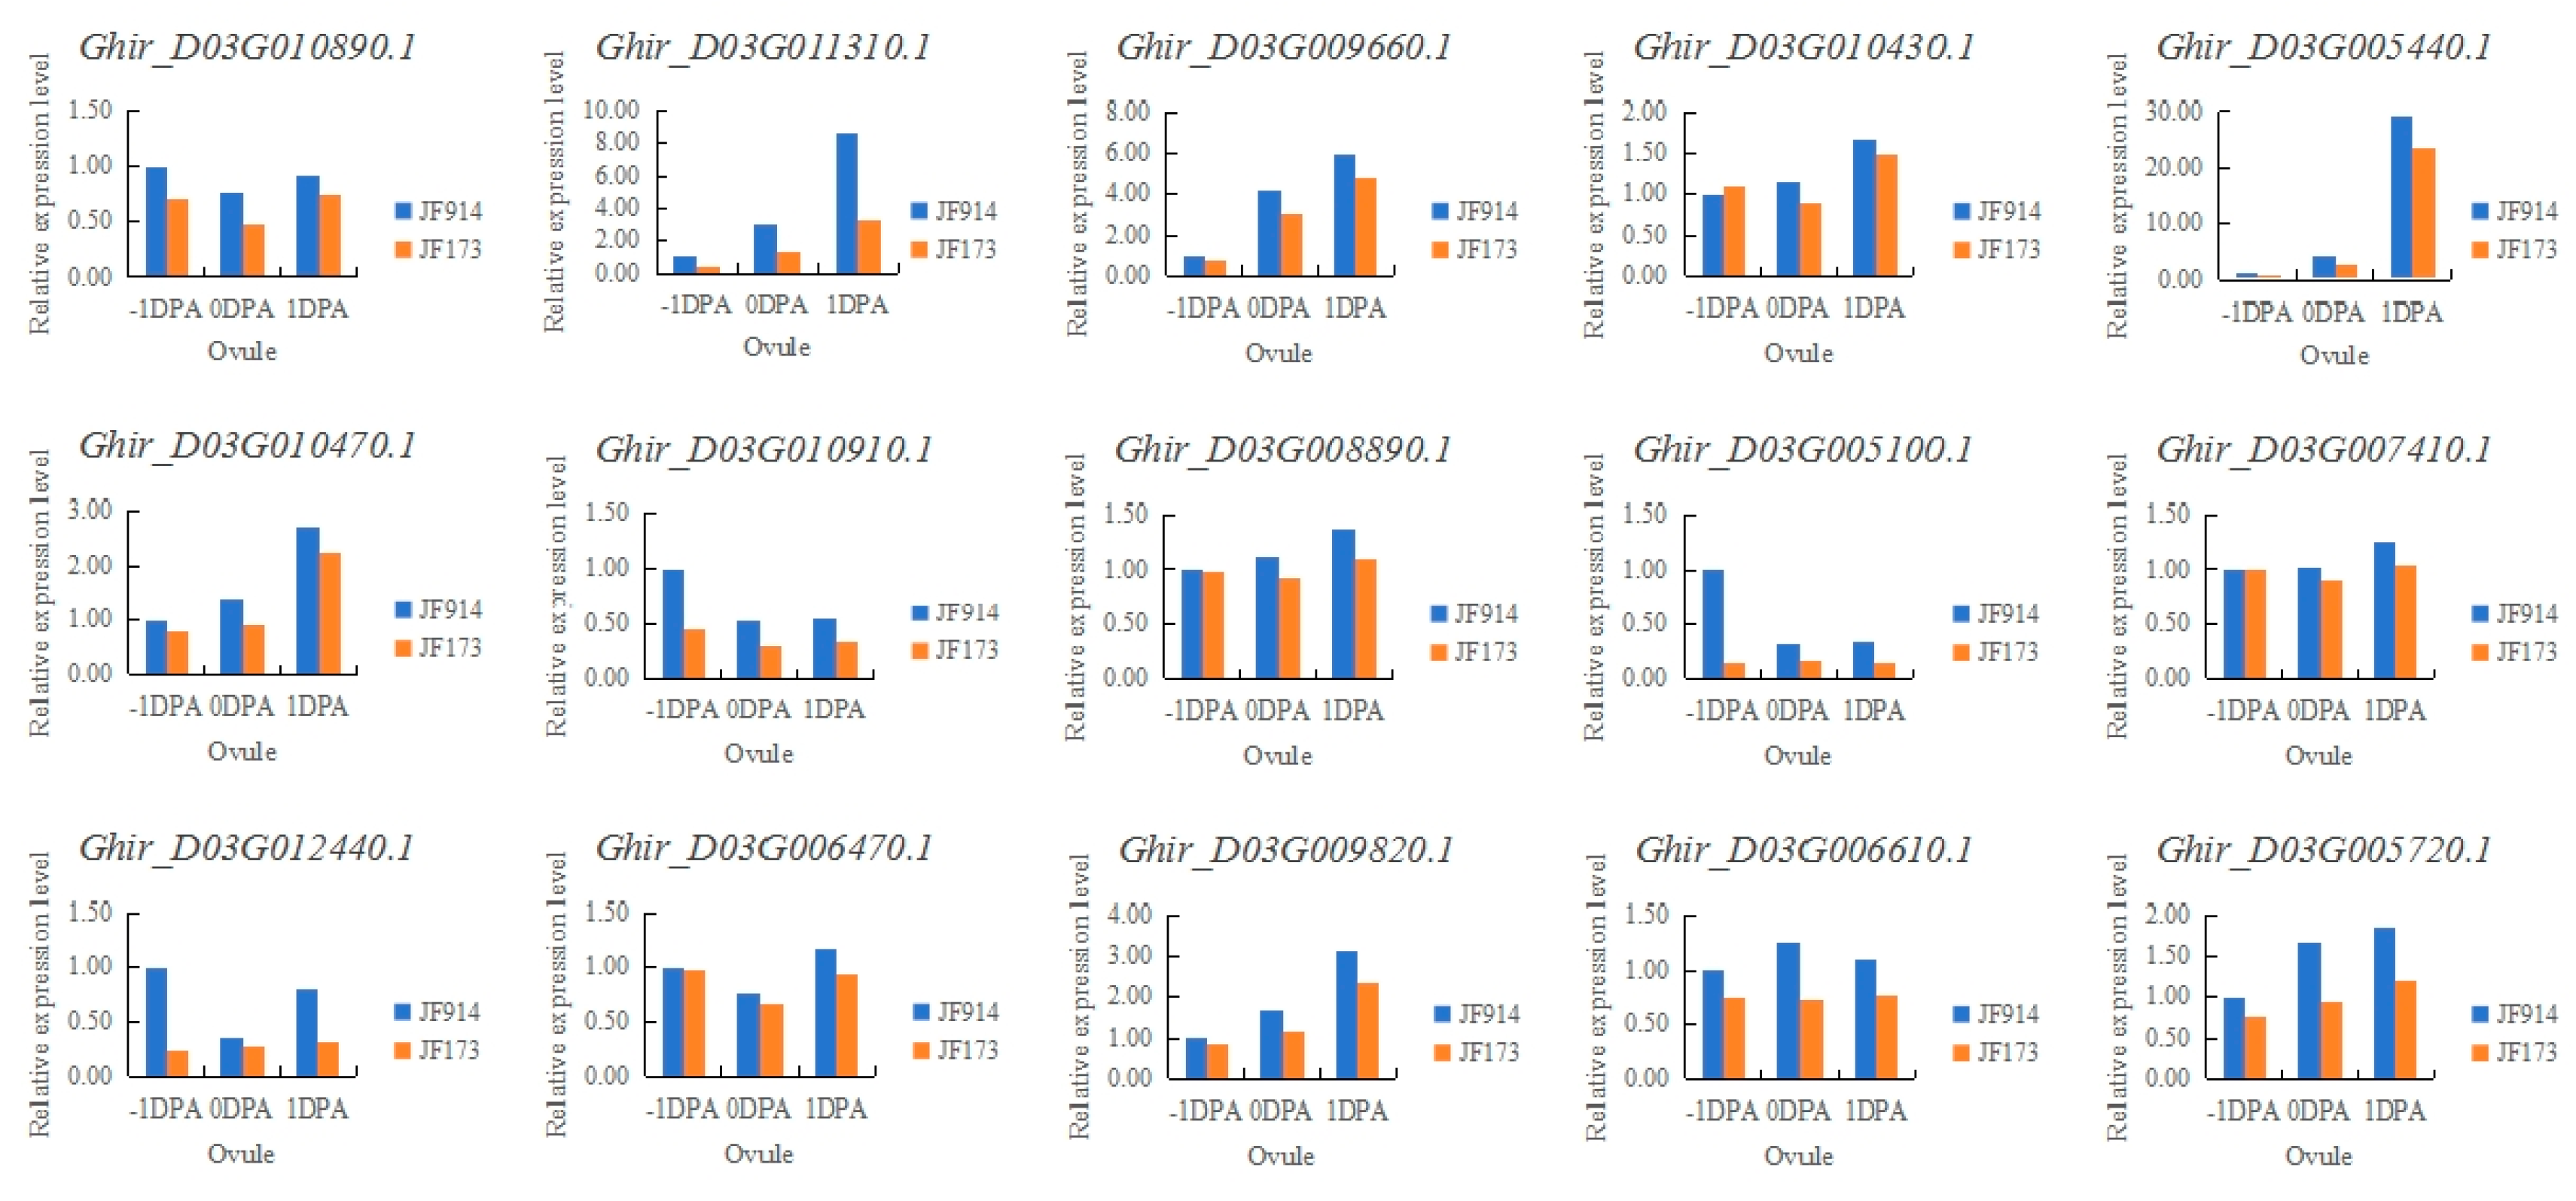
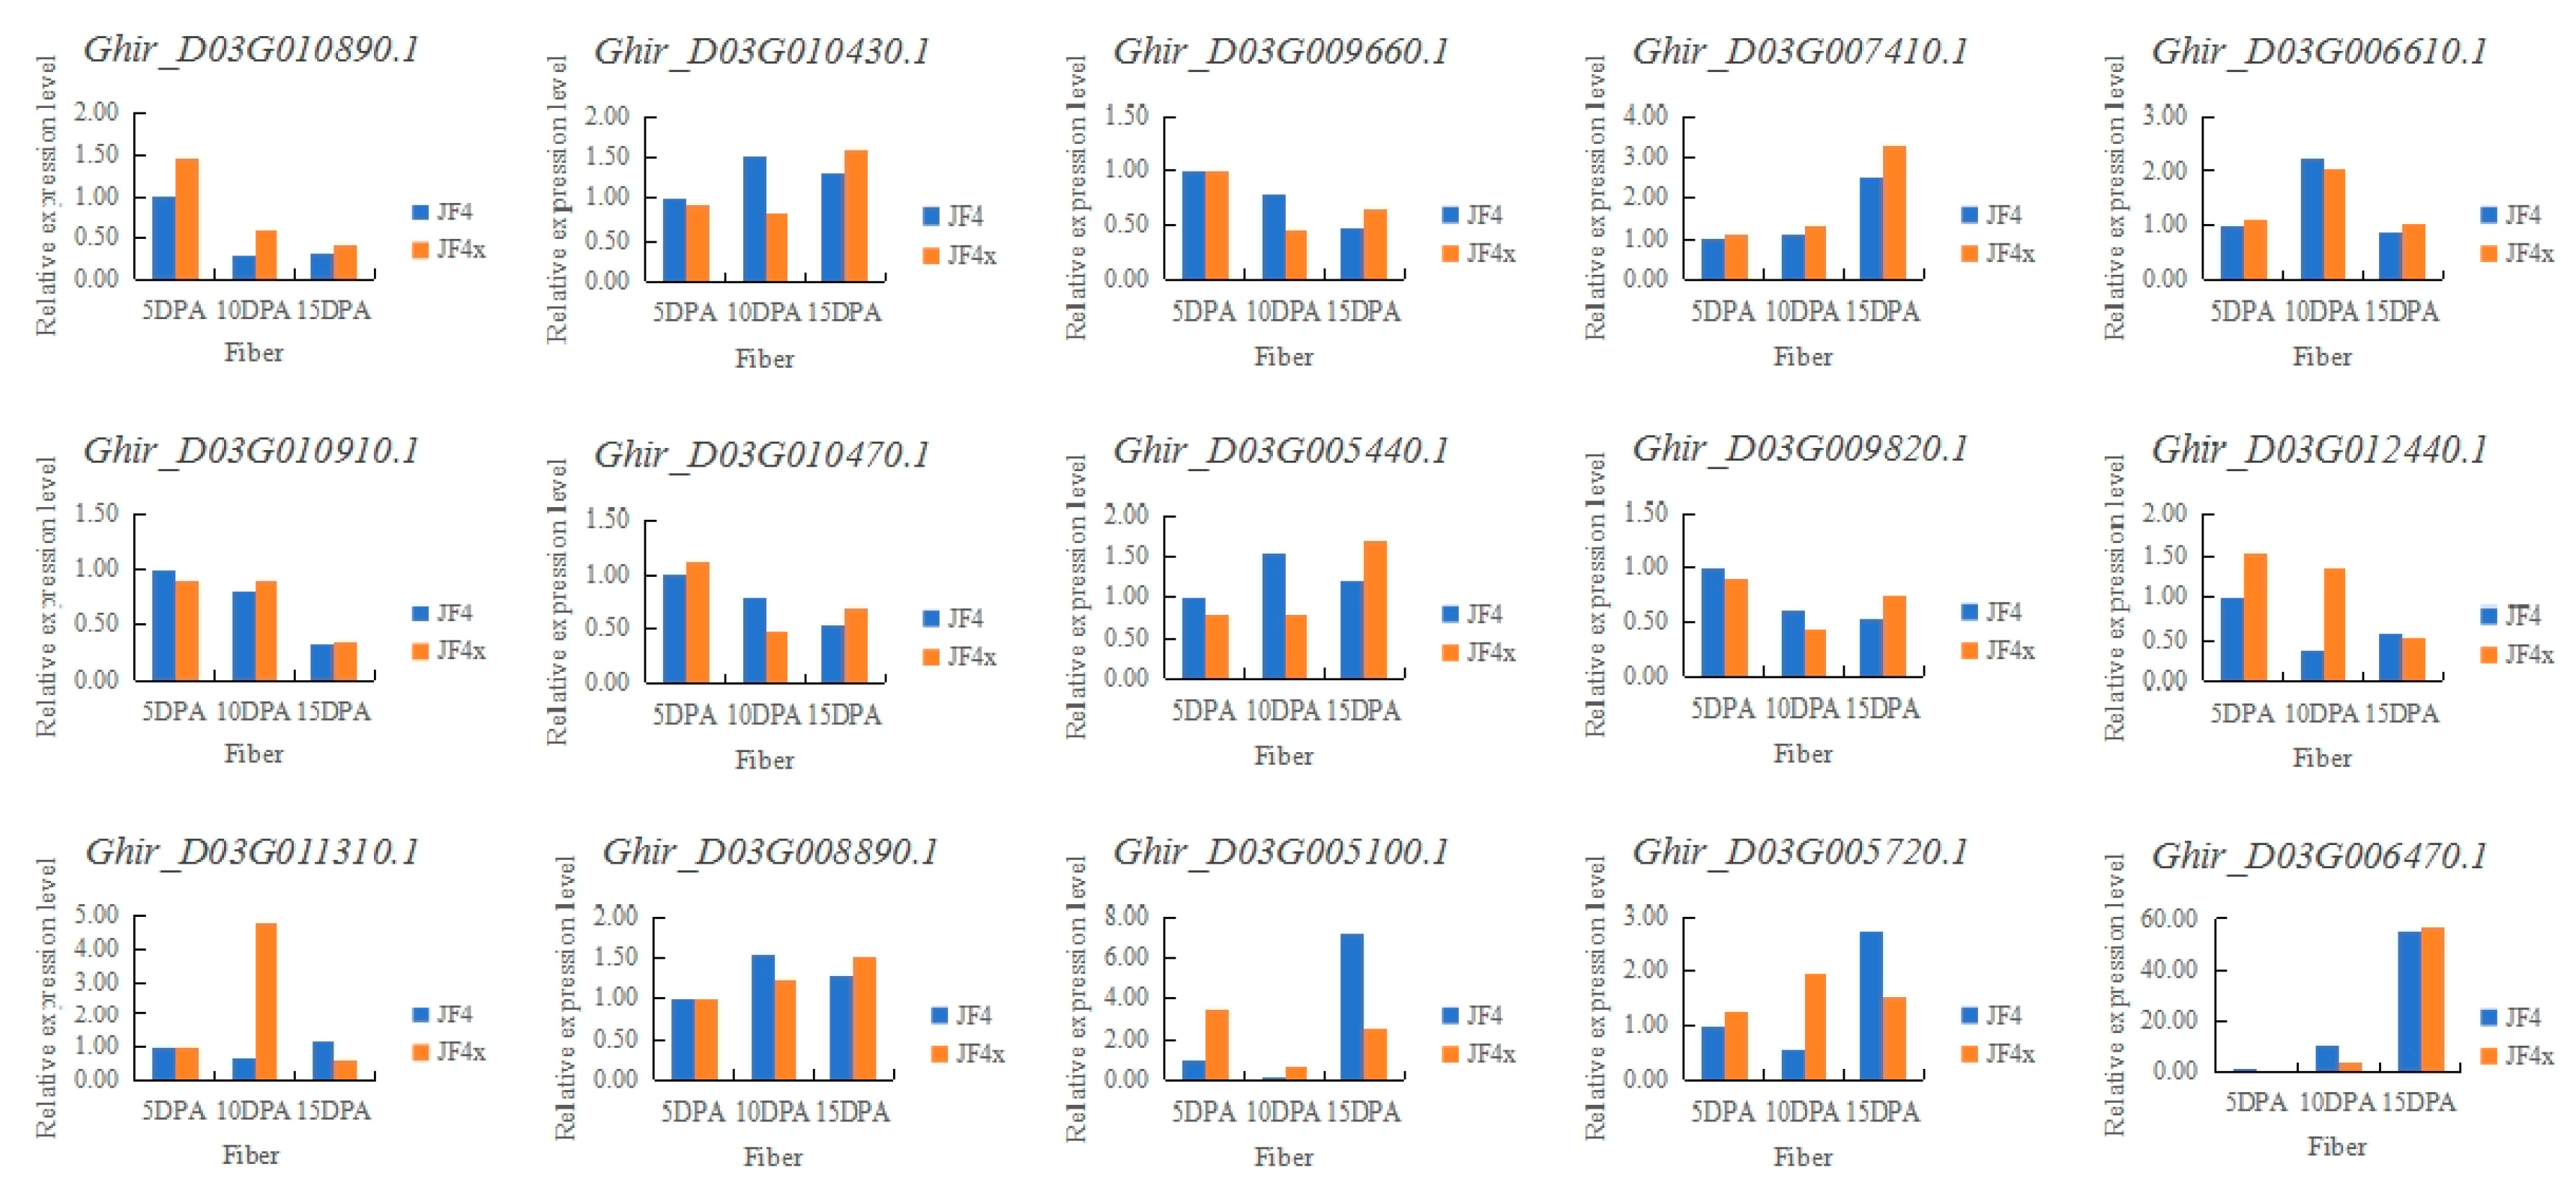
3.3. Candidate gene analysis
4. Discussion
Supplementary Materials
Author Contributions
Funding
Data Availability Statement
Conflicts of Interest
References
- Wang, F.; Zhang, J.; Chen, Y.; Zhang, C.; Gong, J.; Song, Z.; Zhou, J.; Wang, J.; Zhao, C.; Jiao, M.; et al. Identification of candidate genes for key fibre-related QTLs and derivation of favourable alleles in Gossypium hirsutum recombinant inbred lines with G. barbadense introgressions. Plant Biotechnol. J. 2020, 18, 707–720. [Google Scholar] [CrossRef]
- Li, Y.; Mo, T.; Ran, L.; Zeng, J.; Wang, C.; Liang, A.; Dai, Y.; Wu, Y.; Zhong, Z.; Xiao, Y. Genome resequencing-based high-density genetic map and QTL detection for yield and fiber quality traits in diploid Asiatic cotton (Gossypium arboreum). Mol. Genet. Genom. 2022, 297, 199–212. [Google Scholar] [CrossRef]
- Said, J.; Lin, Z.; Zhang, X.; Song, M.; Zhang, J. A comprehensive meta QTL analysis for fiber quality, yield, yield related and morphological traits, drought tolerance, and disease resistance in tetraploid cotton. BMC Genom. 2013, 14, 776. [Google Scholar] [CrossRef]
- Said, J.; Song, M.; Wang, H.; Lin, Z.; Zhang, X.; Fang, D.; Zhang, J. A comparative meta-analysis of QTL between intraspecific Gossypium hirsutum and interspecific G. hirsutum × G.barbadense populations. Mol. Genet. Genom. 2015, 290, 1003–1025. [Google Scholar] [CrossRef] [PubMed]
- Grover, C.; Yoo, M.; Lin, M.; Murphy, M.; Harker, D.; Byers, R.; Lipka, A.; Hu, G.; Yuan, D.; Conover, J.; et al. Genetic analysis of the transition from wild to domesticated cotton ( Gossypium hirsutum L.). G3 (Bethesda, Md.) 2020, 10, 731–754. [Google Scholar] [CrossRef]
- Ma, Z.; He, S.; Wang, X.; Sun, J.; Zhang, Y.; Zhang, G.; Wu, L.; Li, Z.; Liu, Z.; Sun, G.; et al. Resequencing a core collection of upland cotton identifies genomic variation and loci influencing fiber quality and yield. Nat. Genet. 2018, 50, 803–813. [Google Scholar] [CrossRef] [PubMed]
- Li, F.; Fan, G.; Lu, C.; Xiao, G.; Zou, C.; Kohel, R.; Ma, Z.; Shang, H.; Ma, X.; Wu, J.; et al. Genome sequence of cultivated upland cotton (Gossypium hirsutum TM-1) provides insights into genome evolution. Nat. Biotechnol. 2015, 33, 524–530. [Google Scholar] [CrossRef] [PubMed]
- Zhang, T.; Hu, Y.; Jiang, W.; Fang, L.; Guan, X.; Chen, J.; Zhang, J.; Saski, C.; Scheffler, B.; Stelly, D.; et al. Sequencing of allotetraploid cotton (Gossypium hirsutum L. acc. TM-1) provides a resource for fiber improvement. Nat. Biotechnol. 2015, 33, 531–537. [Google Scholar] [CrossRef] [PubMed]
- Wang, M.; Tu, L.; Yuan, D.; Zhu, D.; Shen, C.; Li, J.; Liu, F.; Pei, L.; Wang, P.; Zhao, G.; et al. Reference genome sequences of two cultivated allotetraploid cottons, Gossypium hirsutum and Gossypium barbadense. Nat. Genet. 2019, 51, 224–229. [Google Scholar] [CrossRef]
- Hu, Y.; Chen, J.; Fang, L.; Zhang, Z.; Ma, W.; Niu, Y.; Ju, L.; Deng, J.; Zhao, T.; Lian, J.; et al. Gossypium barbadense and Gossypium hirsutum genomes provide insights into the origin and evolution of allotetraploid cotton. Nat. Genet. 2019, 51, 739–748. [Google Scholar] [CrossRef]
- Chang, X.; He, X.; Li, J.; Liu, Z.; Pi, R.; Luo, X.; Wang, R.; Hu, X.; Lu, S.; Zhang, X.; et al. High-quality Gossypium hirsutum and Gossypium barbadense genome assemblies reveal the landscape and evolution of centromeres. Plant Commun. 2023, 5, 100722. [Google Scholar] [CrossRef] [PubMed]
- Ma, Z.; Zhang, Y.; Wu, L.; Zhang, G.; Sun, Z.; Li, Z.; Jiang, Y.; Ke, H.; Chen, B.; Liu, Z.; et al. High-quality genome assembly and resequencing of modern cotton cultivars provide resources for crop improvement. Nat. Genet. 2021, 53, 1385–1391. [Google Scholar] [CrossRef]
- Li, L.; Zhao, S.; Su, J.; Fan, S.; Pang, C.; Wei, H.; Wang, H.; Gu, L.; Zhang, C.; Liu, G.; et al. High-density genetic linkage map construction by F2 populations and QTL analysis of early-maturity traits in upland cotton (Gossypium hirsutum L.). PLoS ONE 2017, 12, e182918. [Google Scholar] [CrossRef] [PubMed]
- Su, J.; Pang, C.; Wei, H.; Li, L.; Liang, B.; Wang, C.; Song, M.; Wang, H.; Zhao, S.; Jia, X.; et al. Identification of favorable SNP alleles and candidate genes for traits related to early maturity via GWAS in upland cotton. BMC Genom. 2016, 17, 687. [Google Scholar] [CrossRef] [PubMed]
- Jia, X.; Pang, C.; Wei, H.; Wang, H.; Ma, Q.; Yang, J.; Cheng, S.; Su, J.; Fan, S.; Song, M.; et al. High-density linkage map construction and QTL analysis for earliness-related traits in Gossypium hirsutum L. BMC Genom. 2016, 17, 909. [Google Scholar] [CrossRef] [PubMed]
- Qi, H.; Wang, N.; Qiao, W.; Xu, Q.; Zhou, H.; Shi, J.; Yan, G.; Huang, Q. Construction of a high-density genetic map using genotyping by sequencing (GBS) for quantitative trait loci (QTL) analysis of three plant morphological traits in upland cotton (Gossypium hirsutum L.). Euphytica 2017, 213, 83. [Google Scholar] [CrossRef]
- Su, J.; Li, L.; Zhang, C.; Wang, C.; Gu, L.; Wang, H.; Wei, H.; Liu, Q.; Huang, L.; Yu, S. Genome-wide association study identified genetic variations and candidate genes for plant architecture component traits in Chinese upland cotton. Theor. Appl. Genet. 2018, 131, 1299–1314. [Google Scholar] [CrossRef] [PubMed]
- Ma, J.; Pei, W.; Ma, Q.; Geng, Y.; Liu, G.; Liu, J.; Cui, Y.; Zhang, X.; Wu, M.; Li, X.; et al. QTL analysis and candidate gene identification for plant height in cotton based on an interspecific backcross inbred line population of Gossypium hirsutum × Gossypium barbadense. Theor. Appl. Genet. 2019, 132, 2663–2676. [Google Scholar] [CrossRef] [PubMed]
- Liu, R.; Xiao, X.; Gong, J.; Li, J.; Zhang, Z.; Liu, A.; Lu, Q.; Shang, H.; Shi, Y.; Ge, Q.; et al. QTL mapping for plant height and fruit branch number based on RIL population of upland cotton. J. Cotton Res. 2020, 3, 5. [Google Scholar] [CrossRef]
- Zhu, Q.; Zhang, J.; Liu, D.; Stiller, W.; Liu, D.; Zhang, Z.; Llewellyn, D.; Wilson, I. Integrated mapping and characterization of the gene underlying the okra leaf trait in Gossypium hirsutum L. J. Exp. Bot. 2016, 67, 763–774. [Google Scholar] [CrossRef]
- Wang, H.; Jin, X.; Zhang, B.; Shen, C.; Lin, Z. Enrichment of an intraspecific genetic map of upland cotton by developing markers using parental RAD sequencing. DNA Res. 2015, 22, 147–160. [Google Scholar] [CrossRef]
- Jia, X.; Wang, H.; Pang, C.; Ma, Q.; Su, J.; Wei, H.; Song, M.; Fan, S.; Yu, S. QTL delineation for five fiber quality traits based on an intra-specific Gossypium hirsutum L. recombinant inbred line population. Mol. Genet. Genom. 2018, 293, 831–843. [Google Scholar] [CrossRef]
- Ma, J.; Geng, Y.; Pei, W.; Wu, M.; Li, X.; Liu, G.; Li, D.; Ma, Q.; Zang, X.; Yu, S.; et al. Genetic variation of dynamic fiber elongation and developmental quantitative trait locus mapping of fiber length in upland cotton (Gossypium hirsutum L.). BMC Genom. 2018, 19, 882. [Google Scholar] [CrossRef]
- Thyssen, G.; Jenkins, J.; McCarty, J.; Zeng, L.; Campbell, B.; Delhom, C.; Islam, M.; Li, P.; Jones, D.; Condon, B.; et al. Whole genome sequencing of a MAGIC population identified genomic loci and candidate genes for major fiber quality traits in upland cotton (Gossypium hirsutum L.). Theor. Appl. Genet. 2019, 132, 989–999. [Google Scholar] [CrossRef]
- Islam, M.; Thyssen, G.; Jenkins, J.; Fang, D. Detection, Validation, and Application of Genotyping-by-Sequencing based single nucleotide polymorphisms in upland cotton. Plant Genome-US 2015, 8. [Google Scholar] [CrossRef]
- Su, J.; Li, L.; Pang, C.; Wei, H.; Wang, C.; Song, M.; Wang, H.; Zhao, S.; Zhang, C.; Mao, G.; et al. Two genomic regions associated with fiber quality traits in Chinese upland cotton under apparent breeding selection. Sci. Rep.-UK 2016, 6, 38496. [Google Scholar] [CrossRef]
- Sun, Z.; Wang, X.; Liu, Z.; Gu, Q.; Zhang, Y.; Li, Z.; Ke, H.; Yang, J.; Wu, J.; Wu, L.; et al. Genome-wide association study discovered genetic variation and candidate genes of fibre quality traits in Gossypium hirsutum L. Plant Biotechnol. J. 2017, 15, 982–996. [Google Scholar] [CrossRef]
- Zhang, Z.; Li, J.; Jamshed, M.; Shi, Y.; Liu, A.; Gong, J.; Wang, S.; Zhang, J.; Sun, F.; Jia, F.; et al. Genome-wide quantitative trait loci reveal the genetic basis of cotton fibre quality and yield-related traits in a Gossypium hirsutum recombinant inbred line population. Plant Biotechnol. J. 2020, 18, 239–253. [Google Scholar] [CrossRef]
- Li, S.; Kong, L.; Xiao, X.; Li, P.; Liu, A.; Li, J.; Gong, J.; Gong, W.; Ge, Q.; Shang, H.; et al. Genome-wide artificial introgressions of Gossypium barbadense into G. hirsutum reveal superior loci for simultaneous improvement of cotton fiber quality and yield traits. J. Advenced Res. 2023, 53, 1–16. [Google Scholar] [CrossRef]
- Jia, X.; Wang, S.; Zhao, H.; Zhu, J.; Li, M.; Wang, G. QTL mapping and BSA-seq map a major QTL for the node of the first fruiting branch in cotton. Front. Plant Sci. 2023, 14, 1113059. [Google Scholar] [CrossRef]
- Zhu, T.; Liang, C.; Meng, Z.; Sun, G.; Meng, Z.; Guo, S.; Zhang, R. CottonFGD: An integrated functional genomics database for cotton. BMC Plant Biol. 2017, 17, 101. [Google Scholar] [CrossRef]
- Yang, Z.; Wang, J.; Huang, Y.; Wang, S.; Wei, L.; Liu, D.; Weng, Y.; Xiang, J.; Zhu, Q.; Yang, Z.; et al. CottonMD: A multi-omics database for cotton biological study. Nucleic Acids Res. 2022, 51, D1446–D1456. [Google Scholar] [CrossRef]
- Yu, J.; Zhang, K.; Li, S.; Yu, S.; Zhai, H.; Wu, M.; Li, X.; Fan, S.; Song, M.; Yang, D.; et al. Mapping quantitative trait loci for lint yield and fiber quality across environments in a Gossypium hirsutum × Gossypium barbadense backcross inbred line population. Theor. Appl. Genet. 2013, 126, 275–287. [Google Scholar] [CrossRef]
- Zhang, Z.; Shang, H.; Shi, Y.; Huang, L.; Li, J.; Ge, Q.; Gong, J.; Liu, A.; Chen, T.; Wang, D.; et al. Construction of a high-density genetic map by specific locus amplified fragment sequencing (SLAF-seq) and its application to quantitative trait loci (QTL) analysis for boll weight in upland cotton (Gossypium hirsutum). BMC Plant Biol. 2016, 16, 79. [Google Scholar] [CrossRef]
- Fang, L.; Wang, Q.; Hu, Y.; Jia, Y.; Chen, J.; Liu, B.; Zhang, Z.; Guan, X.; Chen, S.; Zhou, B.; et al. Genomic analyses in cotton identify signatures of selection and loci associated with fiber quality and yield traits. Nat. Genet. 2017, 49, 1089–1098. [Google Scholar] [CrossRef]
- Huang, C.; Nie, X.; Shen, C.; You, C.; Li, W.; Zhao, W.; Zhang, X.; Lin, Z. Population structure and genetic basis of the agronomic traits of upland cotton in China revealed by a genome-wide association study using high-density SNPs. Plant Biotechnol. J. 2017, 15, 1374–1386. [Google Scholar] [CrossRef]
- Sun, W.; Gao, Z.; Wang, J.; Huang, Y.; Chen, Y.; Li, J.; Lv, M.; Wang, J.; Luo, M.; Zuo, K. Cotton fiber elongation requires the transcription factor GhMYB212 to regulate sucrose transportation into expanding fibers. New Phytol. 2019, 222, 864–881. [Google Scholar] [CrossRef]
- Yang, Z.; Zhang, C.; Yang, X.; Liu, K.; Wu, Z.; Zhang, X.; Zheng, W.; Xun, Q.; Liu, C.; Lu, L.; et al. PAG1, a cotton brassinosteroid catabolism gene, modulates fiber elongation. New Phytol. 2014, 203, 437–448. [Google Scholar] [CrossRef]
- Yang, Y.; Bian, S.; Yao, Y.; Liu, J. Comparative proteomic analysis provides new insights into the fiber elongating process in cotton. J. Proteome Res. 2008, 7, 4623–4637. [Google Scholar] [CrossRef]
- Gilbert, M.; Bland, J.; Shockey, J.; Cao, H.; Hinchliffe, D.; Fang, D.; Naoumkina, M. A transcript profiling approach reveals an abscisic acid-specific glycosyltransferase (UGT73C14) induced in developing fiber of Ligon lintless-2 mutant of cotton (Gossypium hirsutum L.). PLoS ONE 2013, 8, e75268. [Google Scholar] [CrossRef]
- Hu, G.; Koh, J.; Yoo, M.; Grupp, K.; Chen, S.; Wendel, J. Proteomic profiling of developing cotton fibers from wild and domesticated Gossypium barbadense. New Phytol. 2013, 200, 570–582. [Google Scholar] [CrossRef]
- Zheng, M.; Meng, Y.; Yang, C.; Zhou, Z.; Wang, Y.; Chen, B. Protein expression changes during cotton fiber elongation in response to drought stress and recovery. Proteomics 2014, 15, 1776–1795. [Google Scholar] [CrossRef] [PubMed]
- Feng, L.; Zhou, C.; Su, Q.; Xu, M.; Yue, H.; Zhang, S.; Zhou, B. Fine-mapping and candidate gene analysis of qFS-Chr. D02, a QTL for fibre strength introgressed from a semi-wild cotton into Gossypium hirsutum. Plant Sci. 2020, 297, 110524. [Google Scholar] [CrossRef] [PubMed]


| Trait | Year | Parents | Offspring populations | ||||||
| Jifeng 914 | Jifeng 173 | Max | Min | Mean | Skew | Kurt | CV(%) | ||
| FL(mm) | 2019 | 29.00 | 32.10** | 32.90 | 25.90 | 28.96 | -0.06 | -0.13 | 4.62 |
| 2020 | 29.25 | 31.65** | 35.10 | 26.70 | 30.97 | 0.00 | 0.47 | 4.37 | |
| 2021 | 30.15 | 32.65** | 35.50 | 27.60 | 31.68 | 0.18 | -0.26 | 4.61 | |
| 2022 | 29.65 | 32.40** | 33.10 | 26.80 | 30.38 | -0.16 | -0.39 | 4.14 | |
| FS(cn/tex) | 2019 | 31.10 | 34.70** | 37.50 | 24.90 | 30.82 | -0.09 | -0.56 | 6.94 |
| 2020 | 30.50 | 31.35** | 34.20 | 26.00 | 30.43 | 0.12 | 0.04 | 4.96 | |
| 2021 | 30.20 | 33.85** | 37.00 | 28.20 | 32.72 | -0.13 | -0.02 | 5.42 | |
| 2022 | 28.50 | 33.30** | 35.90 | 26.30 | 31.25 | -0.19 | 0.22 | 5.78 | |
| FU(%) | 2019 | 84.80 | 84.90 | 87.40 | 81.20 | 84.45 | -0.25 | -0.09 | 1.33 |
| 2020 | 84.60 | 84.30 | 87.30 | 80.70 | 84.48 | -0.34 | 0.34 | 1.27 | |
| 2021 | 82.65 | 83.70* | 86.30 | 81.20 | 83.79 | -0.30 | -0.03 | 1.25 | |
| 2022 | 87.80 | 85.10** | 88.00 | 82.20 | 85.53 | 0.15 | -0.28 | 1.18 | |
| MC | 2019 | 5.60 | 4.50** | 5.80 | 4.00 | 5.06 | -0.49 | -0.09 | 6.69 |
| 2020 | 5.30 | 4.80** | 5.80 | 4.00 | 4.92 | -0.14 | -0.72 | 8.25 | |
| 2021 | 5.25 | 4.45** | 5.70 | 3.70 | 4.67 | -0.42 | 0.05 | 7.96 | |
| 2022 | 5.20 | 4.50** | 5.40 | 3.50 | 4.49 | -0.24 | -0.04 | 8.35 | |
| FE(%) | 2019 | 6.80 | 6.80 | 6.90 | 6.60 | 6.77 | -0.07 | -0.22 | 0.88 |
| 2020 | 6.80 | 6.80 | 7.00 | 6.50 | 6.78 | -0.24 | 0.35 | 1.25 | |
| 2021 | 6.80 | 6.70 | 6.90 | 6.70 | 6.78 | 0.81 | -0.61 | 0.67 | |
| 2022 | 6.00 | 6.00 | 6.10 | 6.00 | 6.00 | 17.74 | 4.42 | 0.35 | |
Disclaimer/Publisher’s Note: The statements, opinions and data contained in all publications are solely those of the individual author(s) and contributor(s) and not of MDPI and/or the editor(s). MDPI and/or the editor(s) disclaim responsibility for any injury to people or property resulting from any ideas, methods, instructions or products referred to in the content. |
© 2024 by the authors. Licensee MDPI, Basel, Switzerland. This article is an open access article distributed under the terms and conditions of the Creative Commons Attribution (CC BY) license (http://creativecommons.org/licenses/by/4.0/).


