Preprint
Article
A Fast Multi-Threshold Color Image Segmentation Algorithm Using Bayesian Forecasting Evolutionary Algorithm
Altmetrics
Downloads
95
Views
26
Comments
0
This version is not peer-reviewed
Submitted:
25 June 2024
Posted:
26 June 2024
You are already at the latest version
Alerts
Abstract
Multi-threshold image segmentation is a relevant research field in further higher-level image preprocessing and computer vision. This paper adopts the Bayesian Forecasting Evolutionary Algorithm (BFEA) for natural scenery image segmentation using multilevel thresholding. An update method for the prediction vector is designed for image segmentation. The design idea of the BFEA algorithm for multilevel thresholding is based on the basic principle of Evolutionary Computation, the probability distribution of promising solutions, and the Bayesian theorem. BFEA could effectively solve the curse of dimensionality. Extensive experiments have demonstrated that the proposed algorithm dominated the state-of-the-art population-based thresholding method in term of the quality of image, function fitness value, optimal threshold value, SSIM value, PSNR value, computation time, dimensionality issue and convergence rate. The proposed method is very effective for color image segmentation.
Keywords:
Subject: Computer Science and Mathematics - Computer Vision and Graphics
I. INTRODUCTION
Image and video are the most important carriers and media of information communication in people's life. Wireless Multimedia Sensor Networks (WMSN) differs from wireless sensor networks and wired networks. There are some problems to be solved in this area, such as the size of transmitted data, memory resources, and power consumption of each node, and so on. Image compression technology is one of the most effective solutions to overcome those problems. Due to the redundancy caused by the high correlation between a very large number of pixels in the image or video, many compression algorithms are developed. Multilevel image thresholding technology is widely used in image preprocessing or video compression, and it is a challenging task. However, due to the increase in the number of thresholds in multilevel image thresholding, the computational complexity increases exponentially [1,2,3]. In order to solve the problem, many multi-level threshold methods based on Intelligent Optimization Algorithm (IOA) have been proposed in recent years.
The Electromagnetism-like Algorithm for multilevel thresholding was introduced by Oliva et al. [2]. The algorithm can effectively calculate the threshold values within the reduced number of generations. An improved Particle Swarm Optimization Algorithm based on quantum behavior (CQPSO) was proposed by Gao et al. [4]. The algorithm uses a collaborative method to improve efficiency. Dey et al. [5] also concluded that the Particle Swarm Optimization based on quantum-inspired was superior to the other five methods using quantum meta-heuristic. Mohamed Abd El et al. [6] proposed two new swarm algorithms to determine the optimal multilevel threshold for image segmentation. One is the Whale Optimization Algorithm (WOA), which imitates the natural cooperative behavior of whales; the other is the Moth-Flame Optimization (MFO), which mimics the natural behavior of moths.These solutions were assessed using Otsu's fitness functions. MFO, which struck a better balance between exploitation and exploration, showed better results than WOA. Kumar et al. [7] proposed a different objective function that uses the homogeneity histogram of the image and the original histogram for image segmentation to improve the efficiency of the evolutionary algorithm. Zhao et al. [8] proposed a multi-objective evolutionary algorithm to perform image segmentation tasks based on intuitionistic fuzzy clustering and image spatial information. M.S.R. Naidu et al. proposed a multilevel image thresholding method based on the inspiration of fireflies by using fuzzy entropy or maximizing Shannon entropy [9]. Experiments showed that using the maximum Fuzzy entropy or Shannon entropy as the fitness function in the firefly algorithm is a very efficient image thresholding method. A multi-objective clustering-based PSO image segmentation method was proposed by Liu et al. [10], in which a similarity computing method based on electromagnetic forces was offered, and the appropriate cluster number was obtained according to the scale-space theory. Bhandari et al. [11] proposed the 3D Otsu’s based Cuttlefish Algorithm (CFA) for color image multilevel thresholding segmentation to get optimal threshold values. Experimental results showed that, compared with other algorithms listed in the literature, 3D Otsu’s based-CFA had obtained the best results. In the paper [12], the three strategies, “the Gaussian mutation, the Levy flight, and the opposition-based learning,” were employed in Emperor Penguin Optimization (EPO) to increase the searchability, jump out local optimization.
The Bee Mating Algorithm (HBMA) is an important intelligent optimization algorithm that simulates the mating process of real bees. Horng [13] proposed a honey bee mating optimization algorithm (MEHBMOT) for image segmentation, which obtained multilevel threshold selection based on maximum entropy criterion. Jiang et al. [1] proposed an improved honey bee mating optimization by using the cooperative strategy (CHBMA). However, the importance of dynamically generating a high-quality population in each generation was neglected in MEHBMOT and CHBMA algorithms. Hence, a fast multi-threshold color image segmentation algorithm by using Bayesian Forecasting Evolutionary Algorithm [14] is proposed in this paper, in which the prediction vector PVector[n] is real-time dynamically determined based on Bayesian forecasting technology, and new population can be dynamically generated according to PVector[n]. Such a strategy can increase computational efficiency and reduce the complexity of multi-level threshold processing.
The main contributions of this paper are the following four points. First, this paper established a Bayesian Forecasting Evolutionary Algorithm (BFEA) based multilevel thresholding for color image segmentation after BFEA [14] was proposed for application in function optimization. Second, BFEA was often used to solve continuous function optimization before. However, it is simplified and applied in the discrete combinatorial optimization problem that is color image segmentation in this paper. Third, combining a population initialization strategy with BFEA can jump out of local optimum as much as possible. Fourth, an update method for the prediction vector is designed for image segmentation.
Section Ⅱ describes related work. Section Ⅲ presents BFEA and its analysis. Section Ⅳ presents performance evaluation and experimental study. Finally, some conclusions are drawn in Section Ⅴ.
II. RELATED WORK
A. Bayesian Forecasting Evolutionary Algorithm
Bayesian Forecasting Evolutionary Algorithm was proposed for solving the linkage problem and deceptive problem effectively. In this paper, it is employed in image thresholding for solving the curse of dimensionality in image segmentation.
BFEA combines Bayesian theorem with the probability distribution over the set of promising solutions and integrates with the basic principle of evolutionary computation. In BFEA, it guides the exploration of the search space according to the prediction vector PVector[n], each component of which is the corresponding subspace’s prediction probability including the optimal solutions. Both the information from all the generated generations and the prior information about the problem are used to estimate the prediction vector. This algorithm is also proved to converge fast to the subspaces with optimal solutions at a faster speed [14]. The procedure of BFEA is shown in Figure 1.
B. Measure Based on Entropy Criterion
Let L be gray levels and N pixels in an image and gray levels are ranged over [0, L-1]. Let h(i) be the observed frequency of gray-level i; let
N=h(0)+…+h(i)+ …+h(L-1)
pi= h(i)/N
Suppose there are M thresholds: {t1, t2,…,tM}, where (1≤M≤L-1), these thresholds divide the original image into M+1 clusters, represented by the following notation:
C0= {0,1,…,t1-1},
C1= {t1, t1+2,…, t2-1} ,
…,
CM = {tM, tM+2,…,L-1}.
Kapur entropy was initially proposed to deal with the double threshold image segmentation problem, and we can extend it to the multilevel threshold image segmentation as given by Equation (3). We maximize the equation to search these optimal thresholds: {t1, t2, …, tM}. The proposed algorithm in this paper uses the formula (3) as the objective function.
III. THE PROCEDURE AND ANALYSIS OF THE PROPOSED ALGORITHM
In this section, it is explained how Bayesian Forecasting Evolutionary Algorithm using Kapur’s entropy as the objective function is applied to the fast multi-threshold image segmentation problem. The flow chart is shown in Figure 2. Next, we introduce the detailed process of BFEA for color image segmentation and some analysis of it.
In Section 3.A, we designed the initialization strategy of BFEA. In Section 3.B, we explained the reason for adding one new population in each generation. In Section 3.C, we explained the prediction method of the proposed algorithm. In Section 3.D, we designed the breeding operator. In Section 3.E, we explained the mutation operator. In Section 3.F, we give reasons and rules for deleting similar thresholds. In Section 3.G, the parameter settings used in the proposed algorithm are given.
A. The Initialization Scheme
The population is initialized as follows. We can generate the position of an arbitrary individual Xi in dth dimension, i.e. Xid, from in the closed interval [(d-1)×floor(L/D), d×floor(L/D)] (i=1, 2, …, PopulationSize) according to the uniform distribution, with using the property of image multilevel thresholds arranged from a low gray level to a high one. Among all individuals, the one with the maximum objective function value is selected as the best individual BestX.
B. The Introduction of New Population
We imitate the natural phenomenon that a homogeneous swarm in nature needs to continually interact with new homogenous swarm to prevent the population from generating too many eccentric and homogeneous individuals in BFEA. Considering the efficiency, we adopted the strategy of reducing the initial population size and adding a new population to each generation. The size of new populations is the same as the size of old populations.
C. The proposed Prediction Method
We select some elites from the initial population. The new population is generated by elite individuals chosen from the current generation in the BFEA search space. TopSize represents the number of elites, and TopSize is set to 10. This strategy can increase the population diversity, and the overall searchability can also be significantly improved.
Therefore, the difference between the jth individual Xj in the elite individuals and the current best individual BestX is denoted by the vector (Xj-BestX). How many individuals should one elite individual generate? It’s decided by the corresponding component of the prediction vector PVector[1, 2, …, TopSize]. The jth elite individual will generate PopulationSize ×PVector[j] (j=1, 2, …, TopSize) individuals. How to initialize and update the prediction vector is discussed below.
Each component of the prediction vector is initialized with (1/TopSize) in the first generation of the population (t=0). That is, the prediction vector is initialized with uniform distribution when the population is initialized. For the (t+1) generations, the components of the prediction vector should be assigned separately so that they have different fertility, according to varying levels of excellence. With the creation of the new generation population, the method can adjust PVector[j] dynamically according to the difference vector (Xj-BestX) and the corresponding posterior probability in BFEA Algorithm. PVector[j] varies with the corresponding the distance (Xj-BestX). If an elite individual jth is equal to the BestX, the PVector[j] will be the largest one of the prediction vector. Then BFEA Algorithm updates it according to the following expression Equation (4).
Regarding P(B|Aj), different calculation methods can be used for different types of problems. A different update method for the prediction vector is designed for image segmentation. In our experiment, it was found that there was not much difference in the fitness value of excellent individuals. If the probability P(B|Aj) was directly calculated based on the fitness value, the effect would be not good. Therefore, the following expression Equation (5) is applied to calculate P(B|Aj) in the proposed algorithm.
The MATLAB Pseudocode for the Bayesian prediction method is shown in Figure 3. In order to prevent the premature convergence of the algorithm, we need to construct an operator, doubly stochastic matrix operator (denoted by P). The operator is shown in Equation (6), assuming that s=1+2+…+TopSize, whose function is theoretically explained in the paper [15]. The experimental analysis of the effect of this matrix operator on the convergence rate is shown in Figure 4. The BFEA parameters are shown in Table 1(a), except that the number of threshold value is set to 5. In this experiment, we tested the corresponding grayscale images of color images (Test01- Test08). Each experiment simulated 25 runs, and we used the average of the results.
D. Breeding Operator
A new individual Xi of the current population is generated from the jth elite individual Xj based on the Equation (7), which is the breeding operator of the BFEA algorithm.
Xi = Xj+uint8(randi(10,1, C)-5)
The uint8(Y) function converts the elements of the arrayYinto unsigned 8-bit integers. The randi(10,1, C) function generates C integer values from the uniform distribution on the set 1:10.
E. Mutation Operator
In this stage, some new individuals will be produced by mutation operator. In each generation, PopulationSize*Pm individuals are selected to mutate. The value ofXid(the dth dimension of any individualXi) can be mutated according to formula (8). Through lots of experiments, we found that Equation (8) can help preserve population diversity. The scope of mutation Rm is set to 8. The signs (plus sign and minus sign) are equally likely to be positive or negative. If only plus sign or minus sign is used in Equation (8), the objective function value ofXid will always increase or decrease significantly.
Xid = Xid±Rm×rand(1)
The rand(1) function randomly generates a decimal number greater than zero and less than one according to a uniform distribution. The appropriate value of Rm can speed up the algorithm convergence speed.
F. Removing the Similar Threshold Values
In our experiment, when the absolute value of the difference between the two thresholds in the same image is less than 6, we will replace the smaller one with a larger one. This has little effect on the image quality after segmentation, but the segmentation efficiency of the proposed algorithm can be further improved. Therefore, the number of thresholds obtained after the segmentation of an image may be smaller than the number of thresholds initially set in the proposed algorithm.
G. The Parameters Used in BFEA
Table 1(a) lists the parameter values in the BFEA algorithm in this experiment, with the help of a large number of tests.
IV. EXPERIMENTAL STUDIES
One hundred images from the Berkeley image segmentation dataset (www.eecs.berkeley.edu) have been tested to evaluate the effectiveness of the BFEA algorithm. In the experiments in this paper, we conducted a detailed study of eight color images with different characteristics to show the performance differences of different algorithms. For color image segmentation, the red, green, and blue components need to be searched for the optimal threshold separately.
Algorithm experiment platform: WINDOW 7 system; 2.20 GHz CPU; 4 GB RAM; MATLAB R2016a (win64).
We compared the results of BFEA with some other representative algorithms so far to evaluate the performance of the proposed algorithm: quantum behavioral PSO with a cooperative method (CQPSO) [4]; Cuckoo Search (CS) method [16]; Honey Bee Mating Algorithm with a cooperative method (CHBMA) [1]; Emperor Penguin Optimizer (EPO) [17]; Firefly Algorithm (FA) [18,19].
BFEA parameters and other different algorithm parameters are shown in Table 1(a) ~ (f). The test image and corresponding histogram are presented in Figure 5. In order to evaluate the performance of the algorithms fairly, we use the same stopping criteria.
A. Comparison of Results after Segmentation
Figure 6 shows the segmented images when the threshold number is five. These results demonstrates that the BFEA algorithm has more favorable and reliable segmentation results for most of the test images from the visual effects of human eyes. From the segmented images with M = 7, 9, and 12, BFEA algorithm can also obtain better results; these segmentation results are not given because of the space limitations of the paper.
B. Comparison of Fitness, PSNR, SSIM, Computation Time
The average fitness value of the three components of an image is calculated as the Fitness Value of it.
PSNR is defined as shown in Equation (9) and is used to evaluate the image quality after multi-threshold image segmentation.
In the above formula, RMSE is defined in Equation (10) and denotes the mean-squared error.
In the above formula, I represents the original grayscale image of m×n and I’ represents the corresponding grayscale image obtained after segmentation. The larger the PSNR value, the better the quality of the segmented image. For color images, we need to calculate the PSNR value of each component and then average them.
SSIM [20] can be used to measure the structural similarity between any two images. In general, the smaller the SSIM value, the lower the similarity between the two images. The SSIM value is calculated by the function ssim() provided by MATLAB R2016a.
For easy comparison, we take the average of the calculation time of the three components of the color image as the Computation Time.
We used six algorithms to calculate the original image and its corresponding segmented image under 5, 7, 9, 12 levels thresholding. The data in Table 2 gives the Fitness, PSNR, SSIM, and computation time. It can be seen from Table 2 that in most cases, BFEA was faster than other algorithms; its calculation time was less affected by the threshold number and can meet the needs of real-time applications. Generally, the Fitness, PSNR, or SSIM values obtained from BFEA were more competitive,which were optimal or close to optimal in most cases. This phenomenon is more apparent when the number of thresholds is large. At the same time, the results of several other algorithms are also acceptable. Besides, Table 3 contains the thresholds obtained by segmenting eight images using six algorithms.
C. Steadiness of Algorithm (M=5,7,9,12)
The standard deviation of optimal fitness value of the red component for each image is mentioned in Table 4. Under the same circumstances, the larger the standard deviation (std) value, the more unstable the experimental results are. From the experimental results above, in general we found that EPO and FA are superior to the other three algorithms, so in the stability test, we only use EPO and FA to compare with the proposed algorithm. Table 4 lists the standard deviation values obtained by running the three algorithms BFEA, EPO, and FA one hundred times independently, when the threshold number M = 5, 7, 9, and 12. We can draw a conclusion from the experimental data that BFEA is more efficient and stable than EPO and FA on most images.
The algorithm proposed in this paper has achieved excellent results for two main reasons: (1) An appropriate new population in each generation is introduced to avoid premature convergence and fall into local optimum. (2) The prediction method helps search more accurately and more quickly.
D. Experiment to Conquer the Curse of Dimensionality (M= 9, 12, 15, 18)
We also tested the computational power of the proposed method for the red component of each image in a higher dimension, where M = 9, 12, 15, 18. Table 5 lists the average calculation time (seconds) of one hundred runs using the BFEA algorithm. The experiment shows that when there are many thresholds, the efficiency of the BFEA algorithm is also excellent, which can solve the problem of high-resolution image segmentation to a certain extent.
V. CONCLUSIONS
In this paper, we described the Bayesian Forecasting Evolutionary Algorithm for color image segmentation. The optimal solution prediction technology in the algorithm can improve the efficiency of the algorithm. This algorithm is suitable for the compression technology of image or video transmission. In addition to evaluating the eight benchmark images shown above, a variety of images provided by the Berkeley segmentation data set were also tested. The experimental results showed that the proposed algorithm could usually produce better results than several well-known contemporary methods such as CQPSO, CS, CHBMA, EPO, and FA. That is, the proposed algorithm dominated the state-of-the-art population-based thresholding method in term of function fitness value, optimal threshold value, SSIM value, PSNR value, computation time. The optimal solution prediction technology from the proposed algorithm can also be used in other population-based color image segmentation methods.
The future work is on how to apply it to video compressing for effective transmission, wildlife monitoring with wireless multimedia sensor networks, satellite image enhancement and satellite image denoising.
Acknowledgments
Supported by Natural Science Foundation of China (61702118), the Chinese Scholarship Council (CSC), Overseas Master Project of Department of Finance of Guangdong Province (Document No.: YUE-CAI-KE-JIAO [2022]184), Department of Education of Guangdong Province (2022ZDJS013).
Declaration of Interests
The authors declare that they have no known competing financial interests or personal relationships that could have appeared to influence the work reported in this paper.
Notation
| L | The gray levels belonging to [0, L−1] |
| h(r) | Observed frequency of gray-level r, where r =0, 1,…, L−1 |
| N | The sum number of pixels in image |
| pr | The ratio of the observed frequency of the rth gray-level to N, where r =0, 1,…, L−1 |
| M | The number of thresholds 1≤ M ≤ L−1 |
| tj | jth thresholds, where j = 1,2,…,M. |
| Ek | Entropy of kth class of image divided by the thresholds, where k = C0, C1, C2,…, CM. |
| f(•) | Objective function of event • |
| wk | Cumulated frequency of pr, where k = C0, C1, C2,…, CM and r =0, 1,…, L−1 |
| Rand(1) | A random number from the uniform distribution [0, 1] |
| β | The breeding coefficient |
| D | The dimensionality of an individual and is the sum of the number of thresholds M and 1 |
| Xi | An arbitrary individual from the population |
| BestX | The individual with the maximum fitness is selected as BestX |
| Xid | The position status of an arbitrary individual Xi in dth dimension, i.e. Xid, is generated from the uniform distribution in the closed interval [(d-1)×floor(L/D), d×floor(L/D)], i=1, 2, …, PopulationSize. |
| PVector[n] | Prediction vector |
| TopSize | Number of elite individuals |
References
- Jiang, Y., Yang, Z., Hao, Z., Wang, Y., and He, H.: A cooperative honey bee mating algorithm and its application in multi-threshold image segmentation, in Editor (Ed.) A cooperative honey bee mating algorithm and its application in multi-threshold image segmentation (2014,edn.), pp. 1579-1585.
- Oliva, D., Cuevas, E., Pajares, G., Zaldivar, D., and Osuna, V.: A Multilevel Thresholding algorithm using electromagnetism optimization, NEUROCOMPUTING, 2014, 139, pp. 357-381 . [CrossRef]
- Jiang, Y., Tsai, P., Hao, Z., and Cao, L.: Automatic multilevel thresholding for image segmentation using stratified sampling and Tabu Search, SOFT COMPUT, 2015, 19, (9), pp. 2605-2617 . [CrossRef]
- Gao, H., Xu, W., Sun, J., and Tang, Y.: Multilevel Thresholding for Image Segmentation Through an Improved Quantum-Behaved Particle Swarm Algorithm, IEEE T INSTRUM MEAS, 2010, 59, (4), pp. 934-946 . [CrossRef]
- Dey, S., Saha, I., Bhattacharyya, S., and Maulik, U.: Multi-level thresholding using quantum inspired meta-heuristics, KNOWL-BASED SYST, 2014, 67, (3), pp. 373-400 . [CrossRef]
- Aziz, M.A.E., Ewees, A.A., and Hassanien, A.E.: Whale Optimization Algorithm and Moth-Flame Optimization for multilevel thresholding image segmentation, EXPERT SYST APPL, 2017, 83, pp. 242-256. [CrossRef]
- Kumar, S., Pant, M., Kumar, M., and Dutt, A.: Colour image segmentation with histogram and homogeneity histogram difference using evolutionary algorithms, INT J MACH LEARN CYB, 2018, 9, (1), pp. 163-183 . [CrossRef]
- Zhao, F., Liu, H., Fan, J., Chen, C.W., Lan, R., and Li, N.: Intuitionistic fuzzy set approach to multi-objective evolutionary clustering with multiple spatial information for image segmentation, NEUROCOMPUTING, 2018 . [CrossRef]
- Naidu, M.S.R., Rajesh Kumar, P., and Chiranjeevi, K.: Shannon and Fuzzy entropy based evolutionary image thresholding for image segmentation, Alexandria Engineering Journal, 2018, 57, (3), pp. 1643-1655 . [CrossRef]
- Liu, Z., Xiang, B., Song, Y., Lu, H., and Liu, Q.: An Improved Unsupervised Image Segmentation Method Based on Multi-objective Particle Swarm Optimization Clustering Algorithm, Computers, Materials & Continua, 2019, 58, (2), pp. 451-461 . [CrossRef]
- Bhandari, A.K., Kumar, I.V., and Srinivas, K.: Cuttlefish Algorithm-Based Multilevel 3-D Otsu Function for Color Image Segmentation, IEEE T INSTRUM MEAS, 2020, 69, (5), pp. 1871-1880 . [CrossRef]
- Xing, Z.: An improved emperor penguin optimization based multilevel thresholding for color image segmentation, KNOWL-BASED SYST, 2020, pp. 105570 . [CrossRef]
- Horng, M.: A multilevel image thresholding using the honey bee mating optimization, APPL MATH COMPUT, 2010, 215, (9), pp. 3302-3310 . [CrossRef]
- YunZhi, J., ZhiFeng, H., YuShan, Z., Han, H., YingLong, W., and HuoJiao, H.: Bayesian Forecasting Evolutionary Algorithm, Chinese Journal of Computers, 2014, 37, (8).
- Jiang, Y., Tsai, P., Yeh, W., and Cao, L.: A honey-bee-mating based algorithm for multilevel image segmentation using Bayesian theorem, APPL SOFT COMPUT, 2017, 52, pp. 1181-1190 . [CrossRef]
- Agrawal, S., Panda, R., Bhuyan, S., and Panigrahi, B.K.: Tsallis entropy based optimal multilevel thresholding using cuckoo search algorithm, SWARM EVOL COMPUT, 2013, 11, pp. 16-30 . [CrossRef]
- Dhiman, G., and Kumar, V.: Emperor penguin optimizer: A bio-inspired algorithm for engineering problems, KNOWL-BASED SYST, 2018, 159, pp. 20-50 . [CrossRef]
- Naidu, M.S.R., Rajesh Kumar, P., and Chiranjeevi, K.: Shannon and Fuzzy entropy based evolutionary image thresholding for image segmentation, Alexandria Engineering Journal, 2018, 57, (3), pp. 1643-1655 . [CrossRef]
- Rajinikanth, V., and Couceiro, M.S.: RGB Histogram Based Color Image Segmentation Using Firefly Algorithm, Procedia Computer Science, 2015, 46, pp. 1449-1457 . [CrossRef]
- He, L., and Huang, S.: Modified firefly algorithm based multilevel thresholding for color image segmentation, NEUROCOMPUTING, 2017, 240, pp. 152-174. [CrossRef]
Figure 1.
Procedure of BFEA.

Figure 2.
The flowchart of BFEA for color image segmentation.
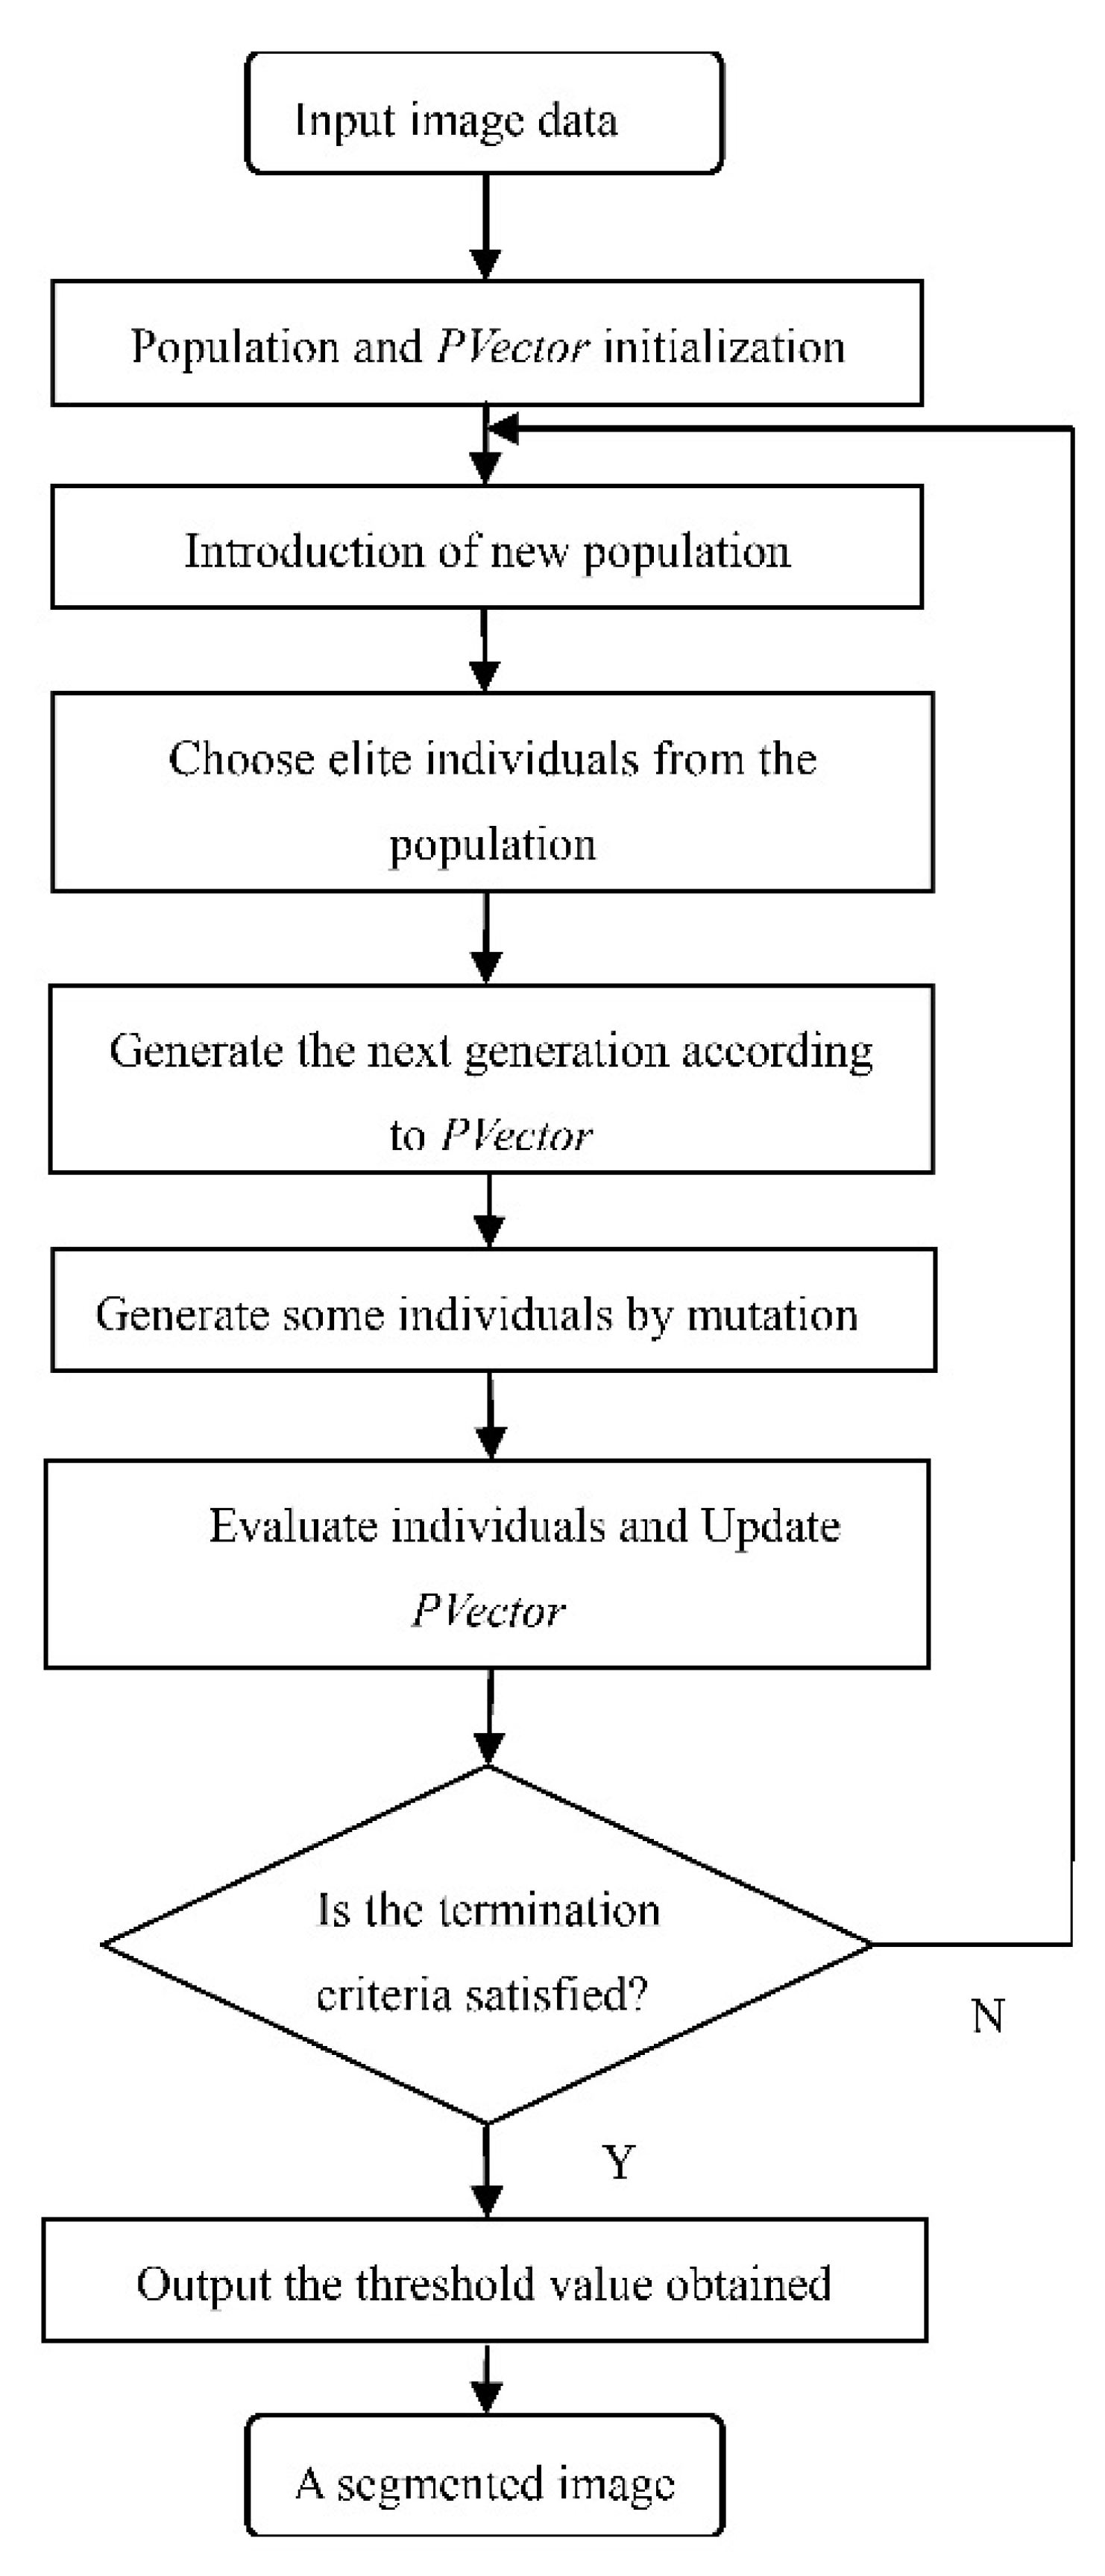
Figure 3.
The MATLAB Pseudocode of Bayesian prediction method.
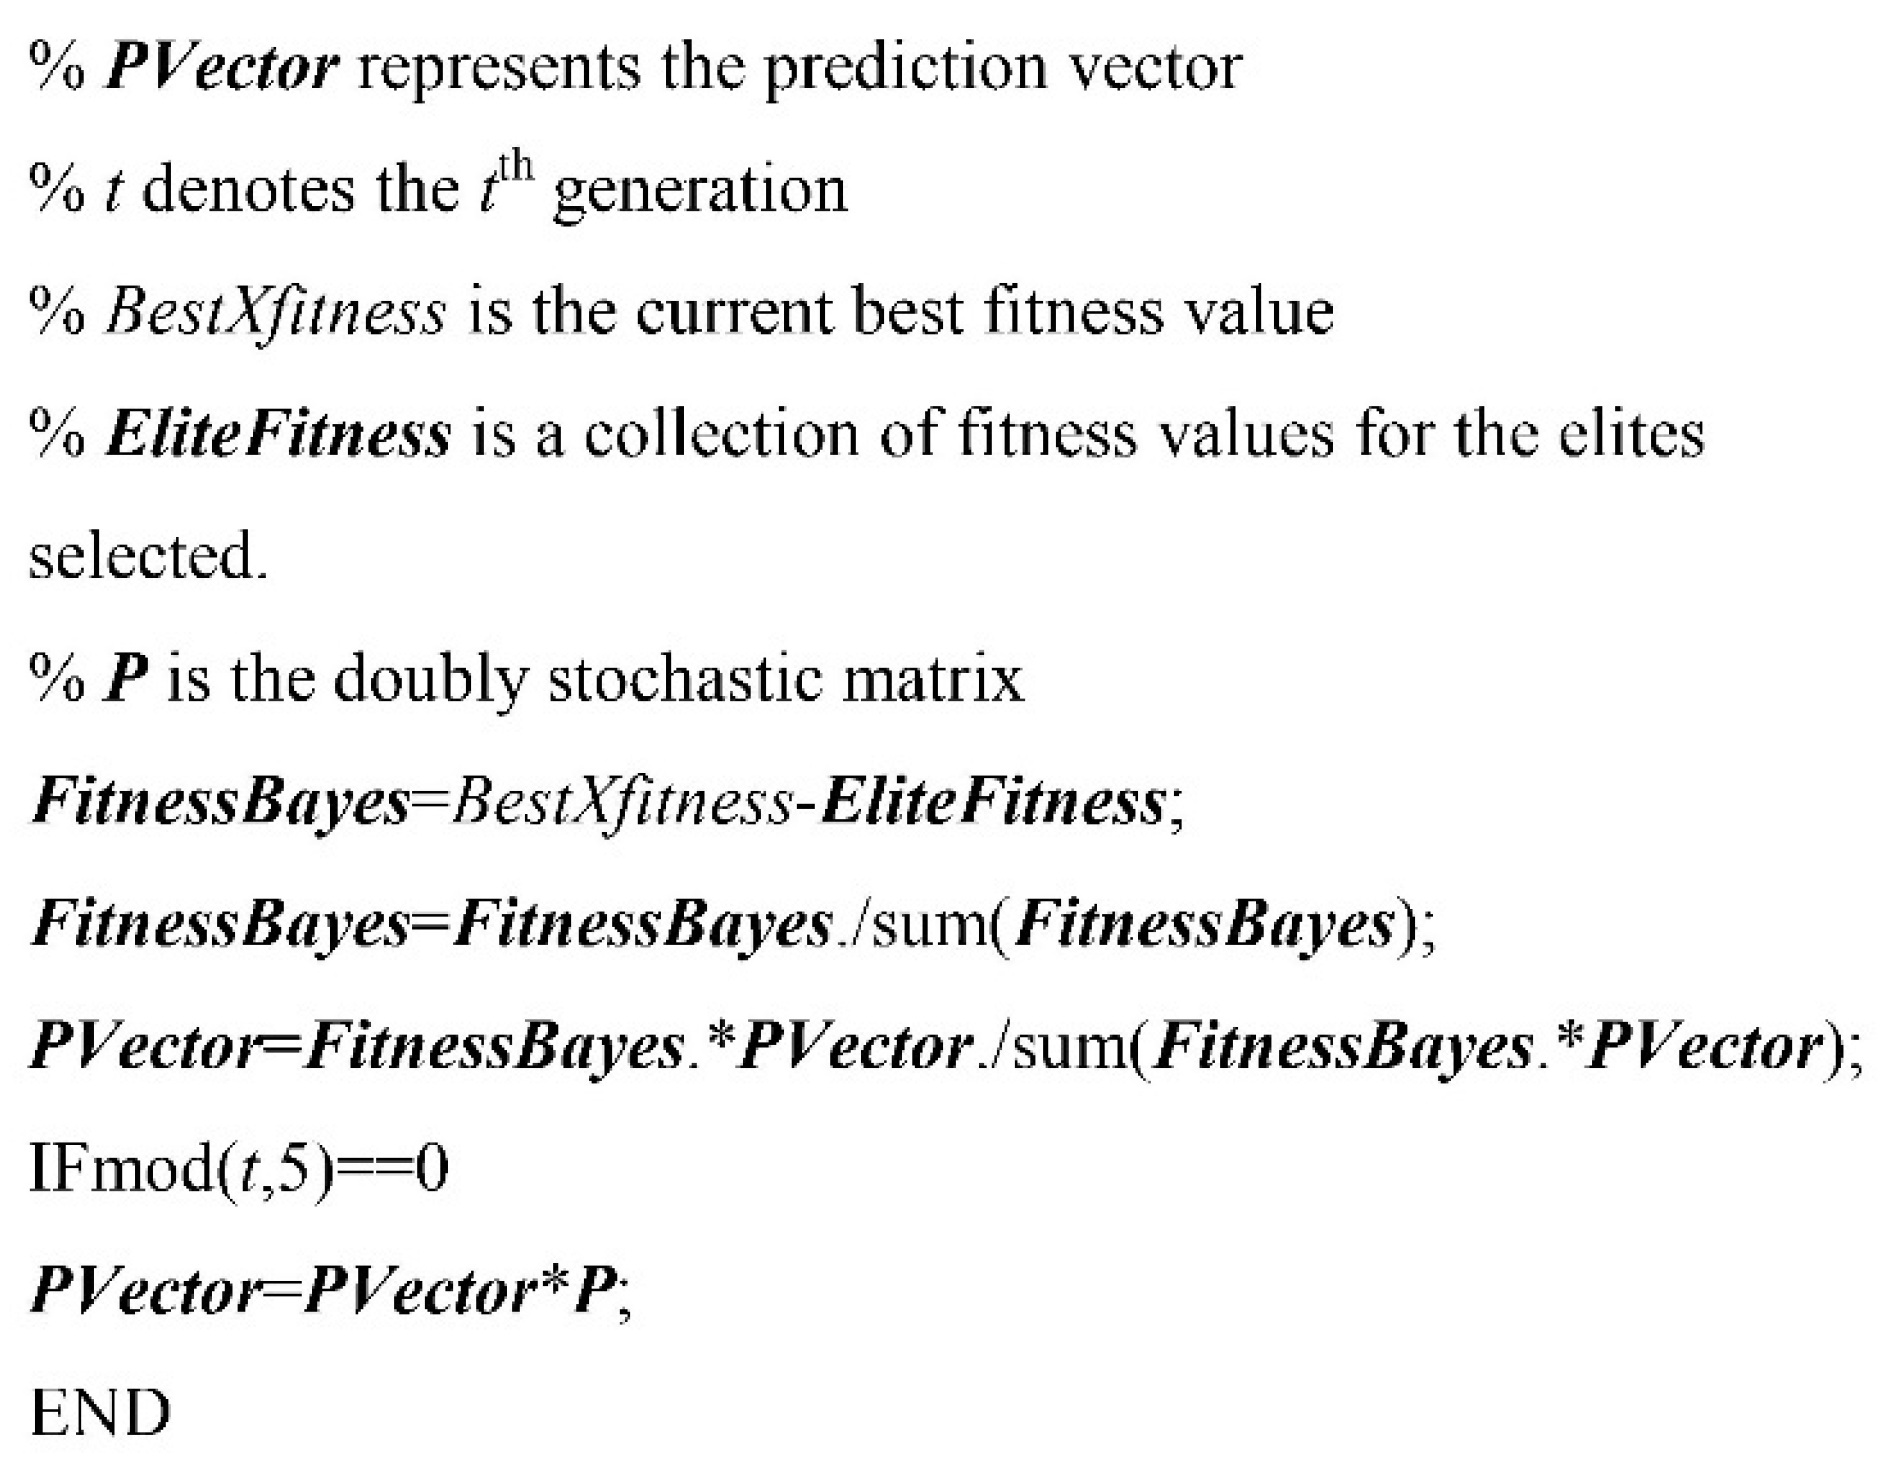
Figure 4.
Comparative analysis of convergence rate.
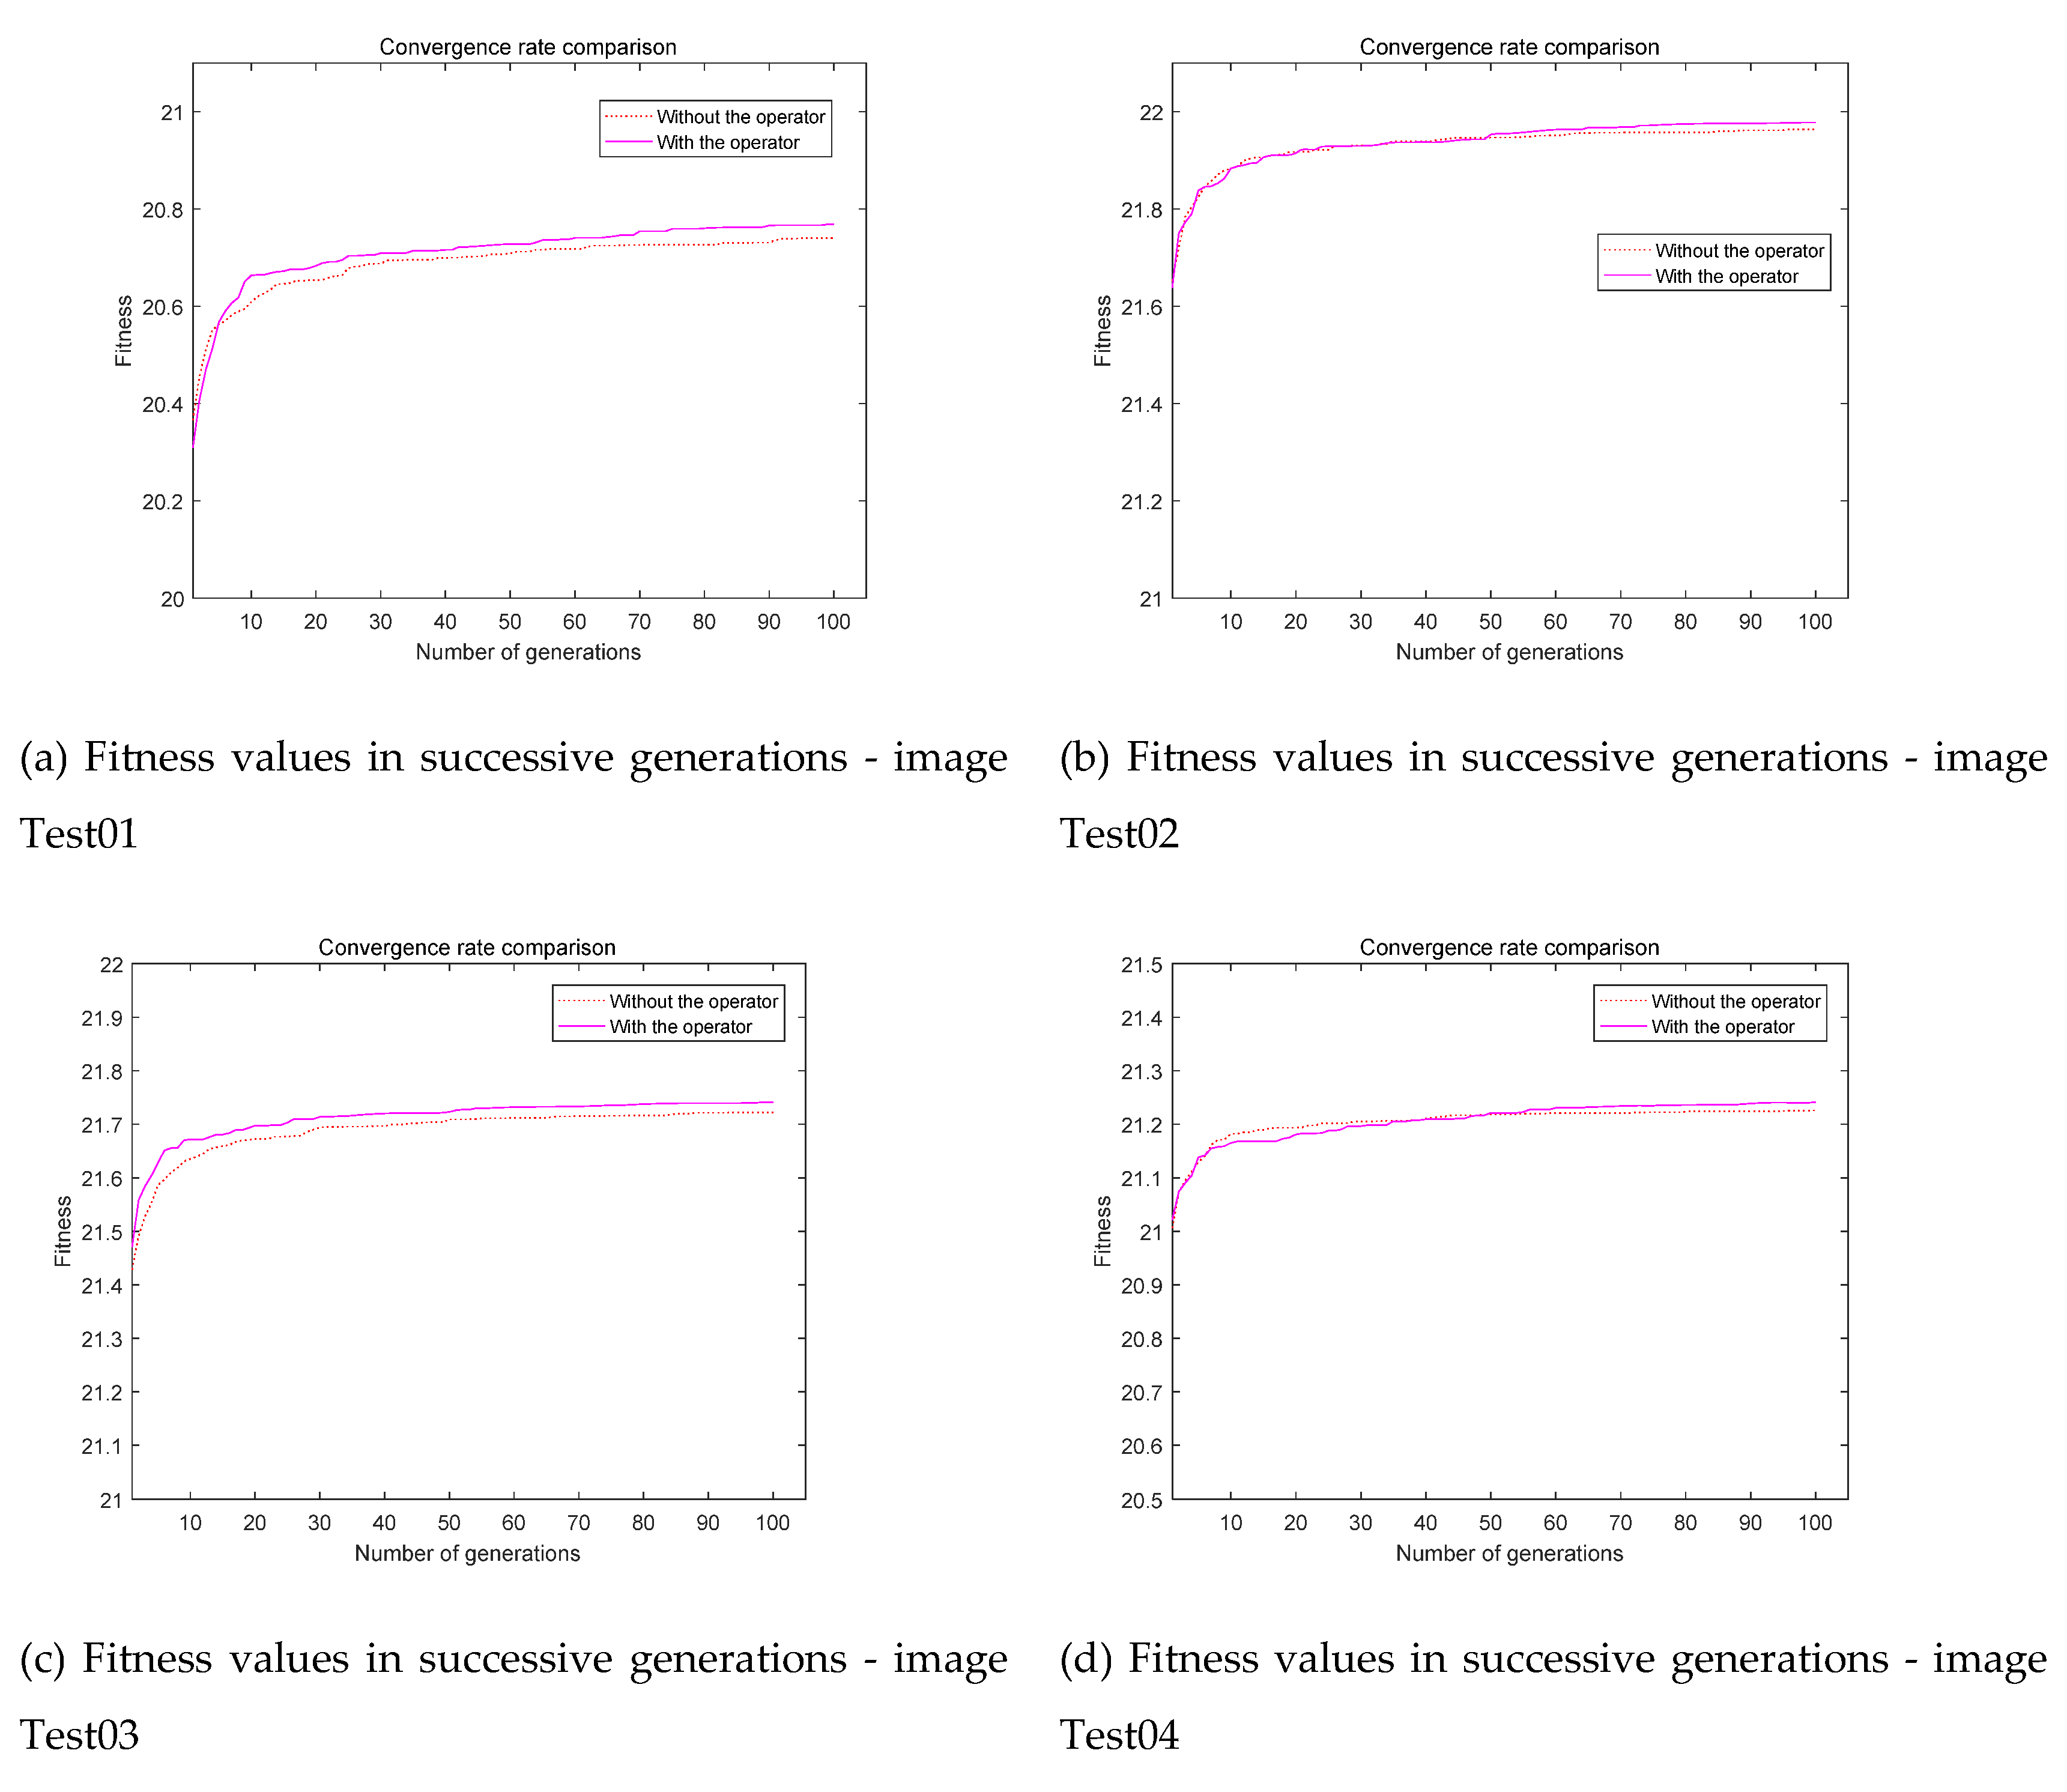
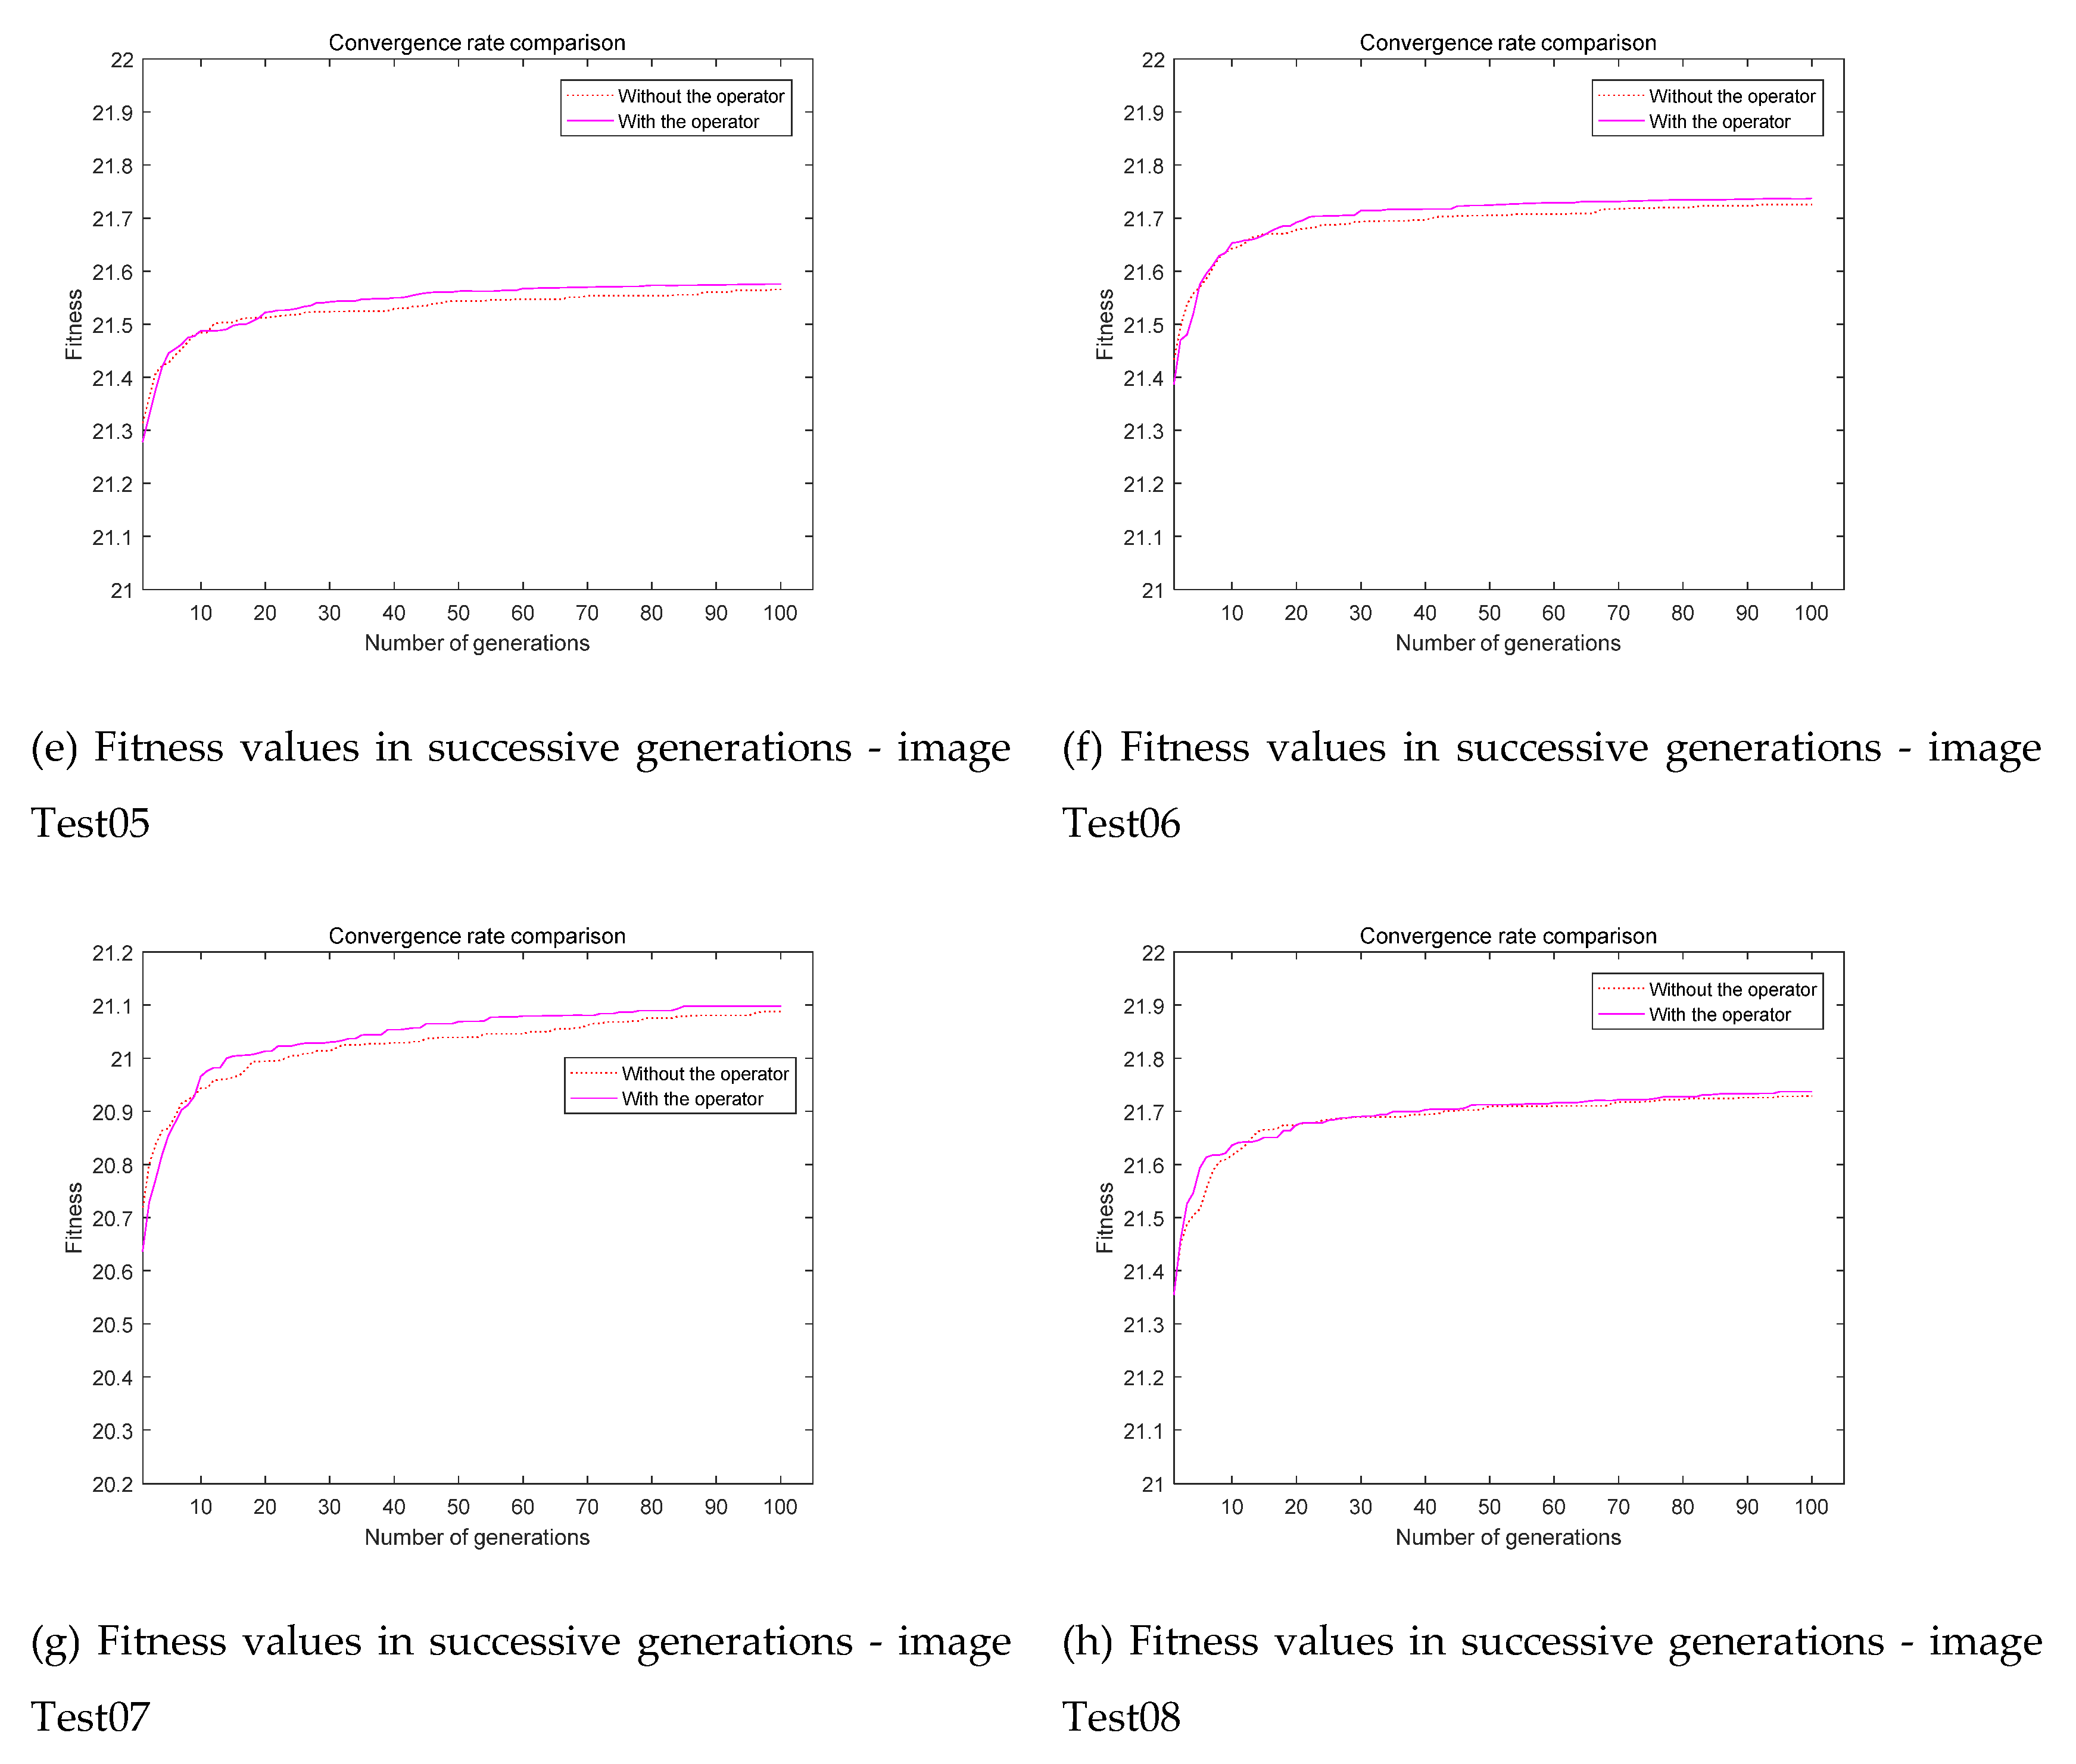
Figure 5.
Test images and corresponding histograms.
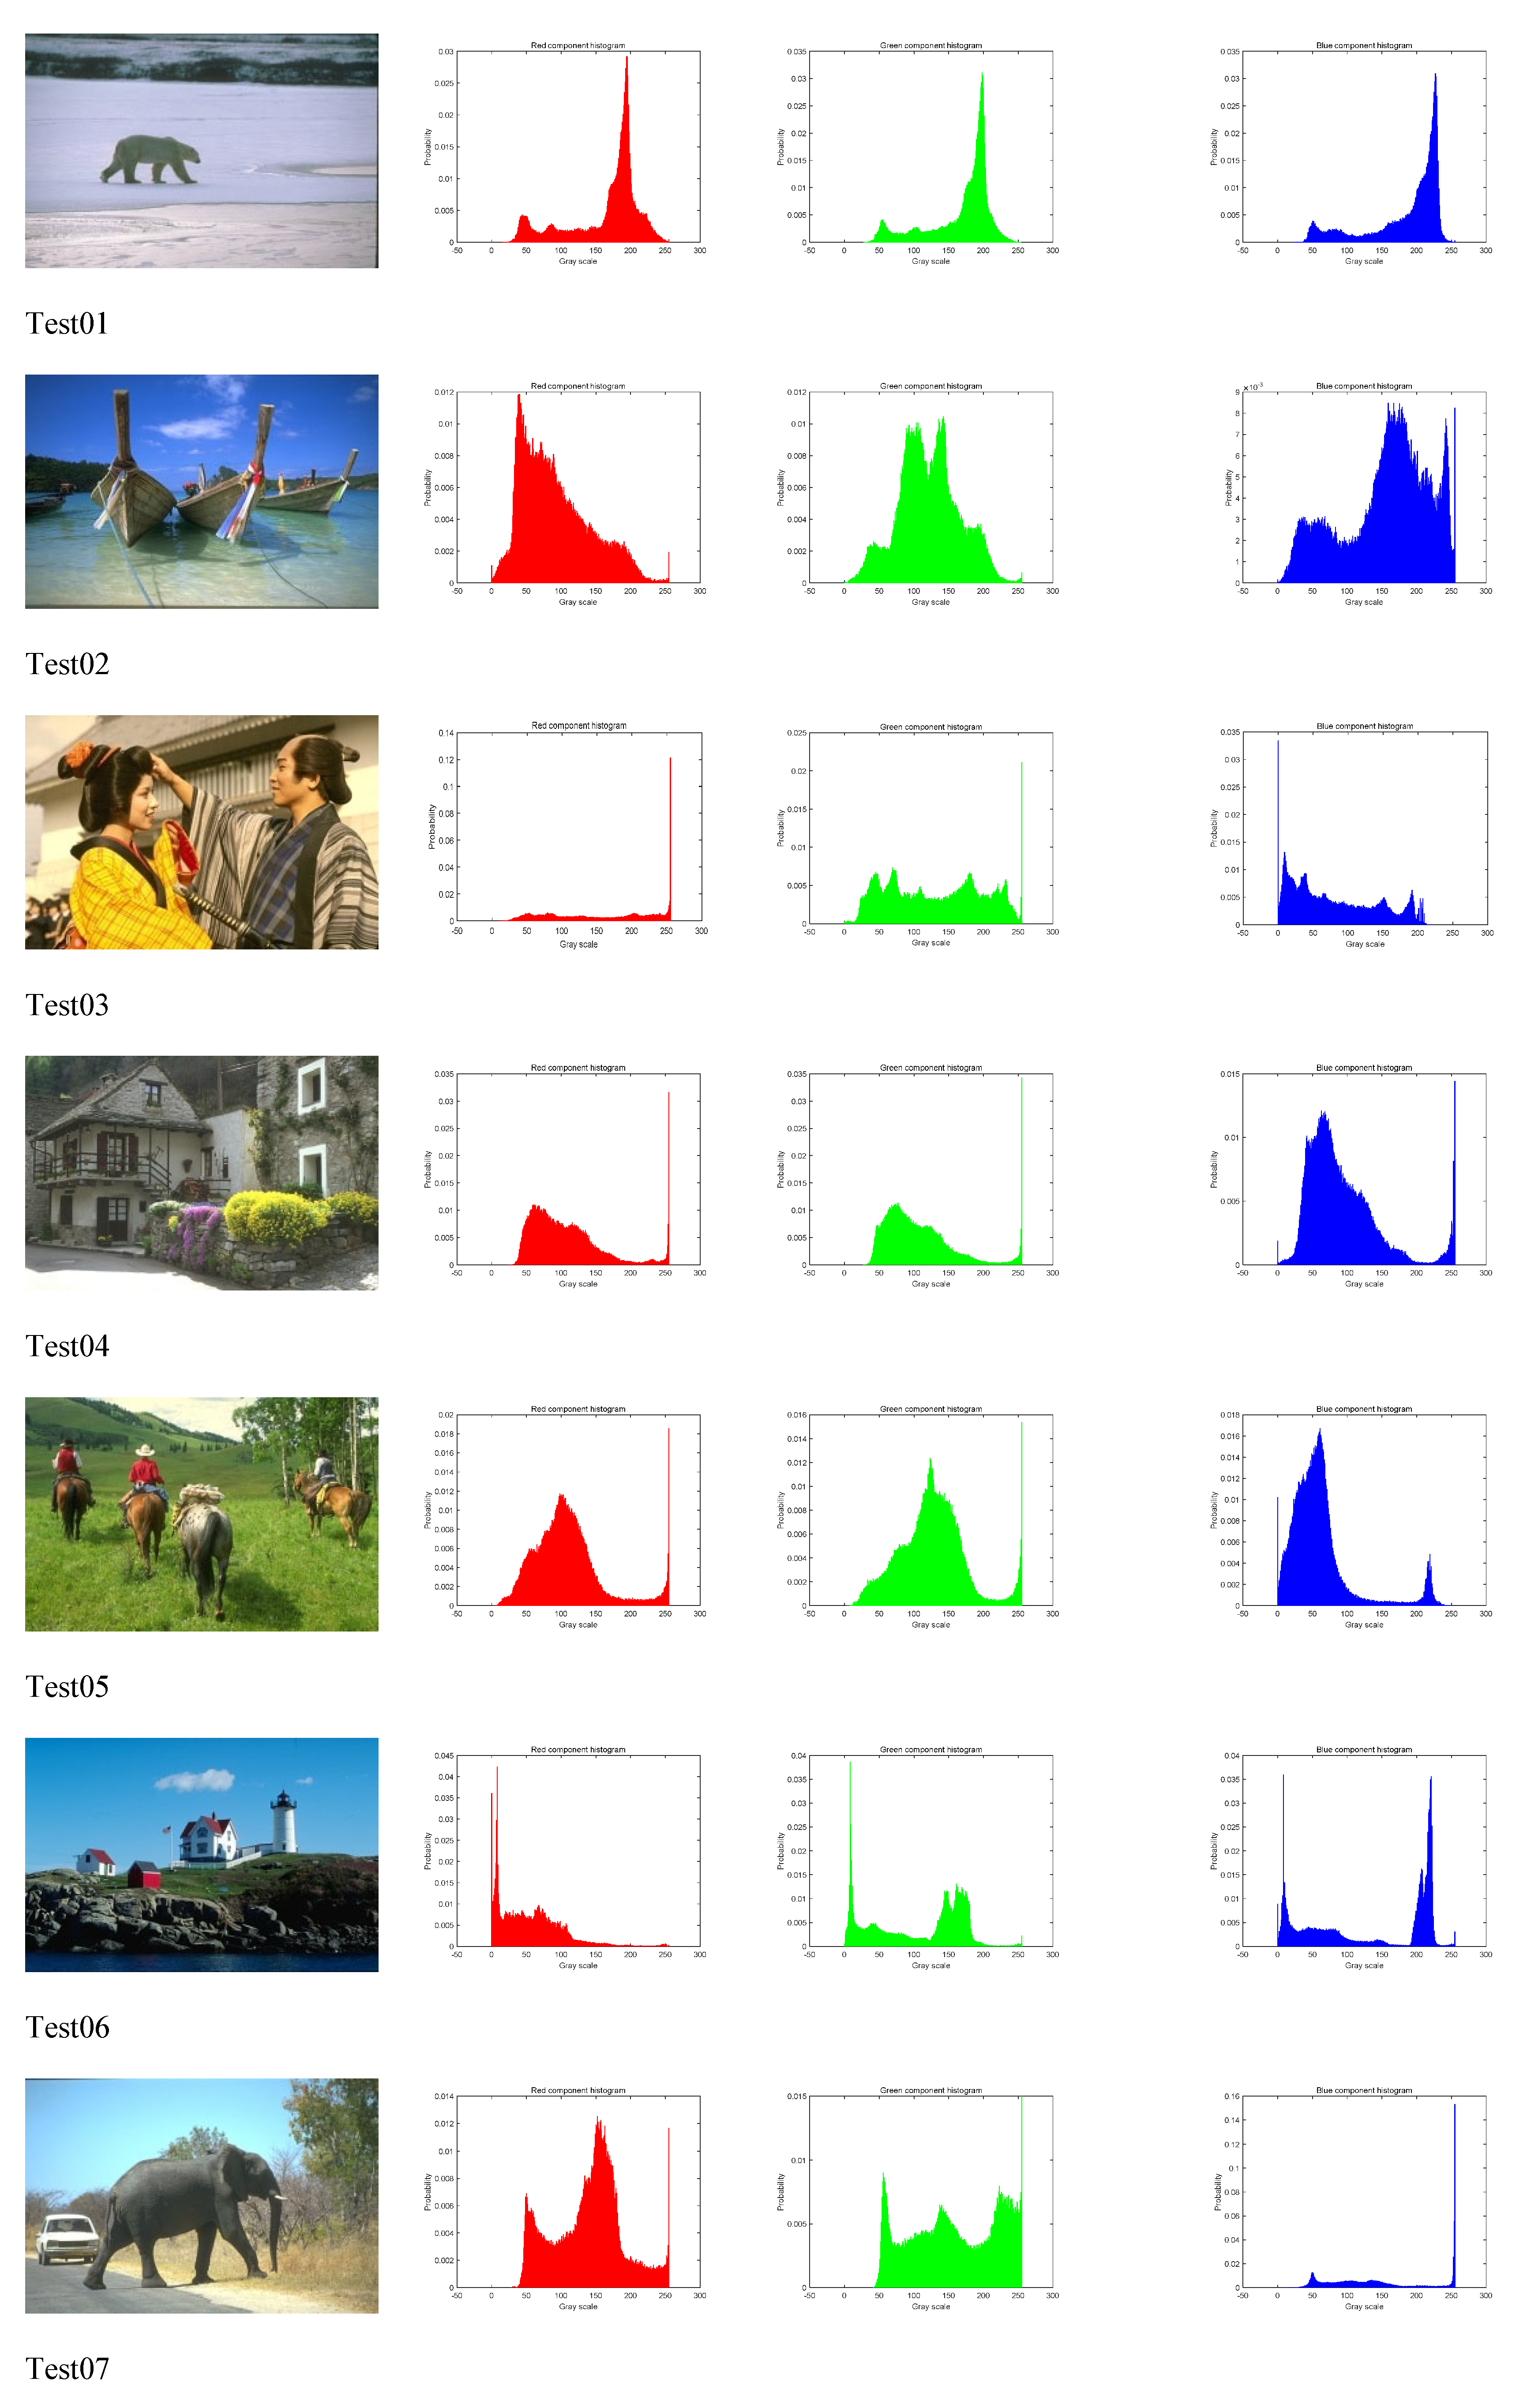

Figure 6.
The segmented images with the threshold number is five.
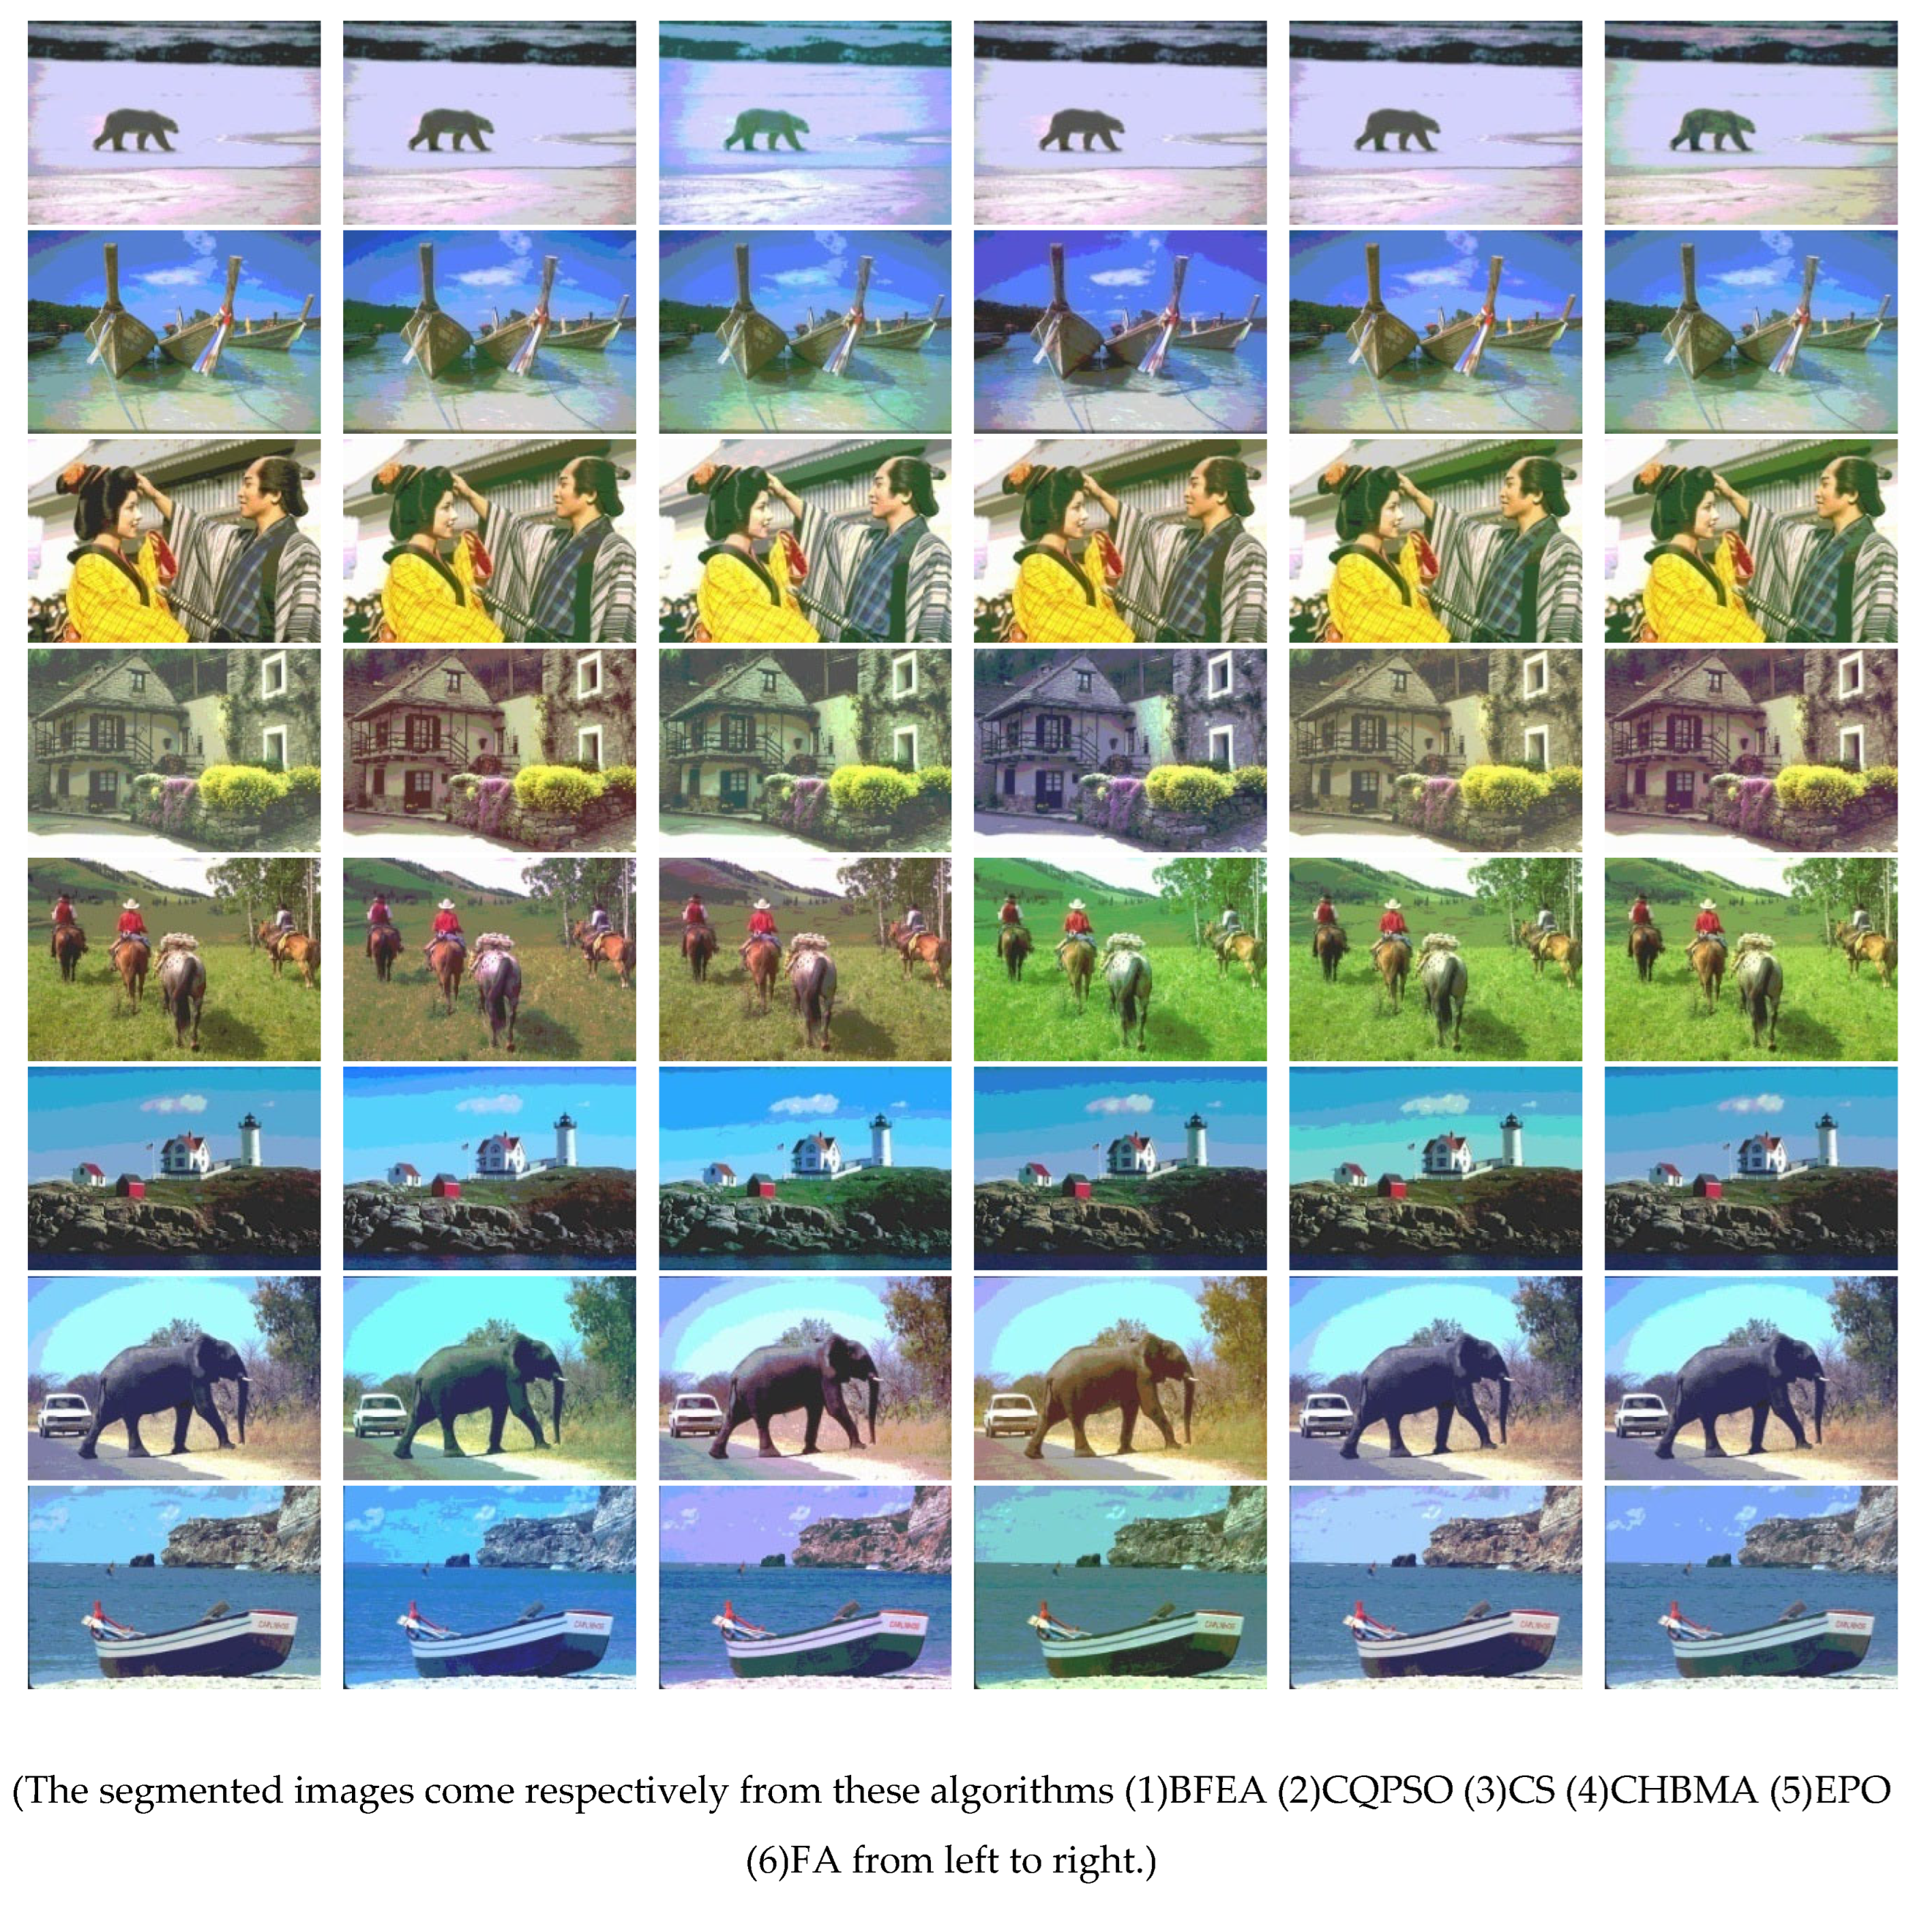
Table 1.
PARAMETER SETTINGS.
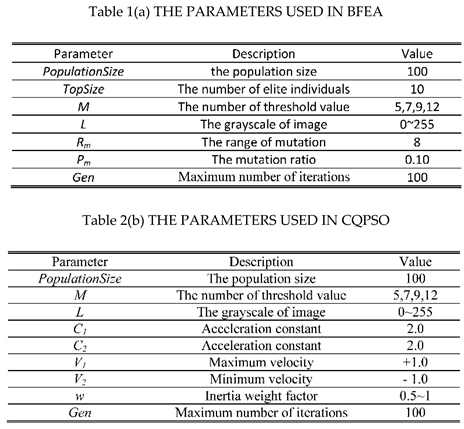
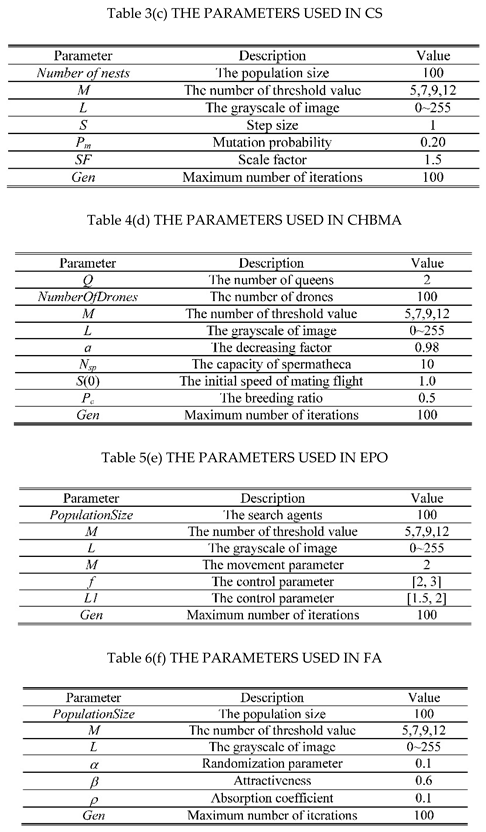
Table 2.
The comparison of Fitness, PSNR, SSIM, computation time.
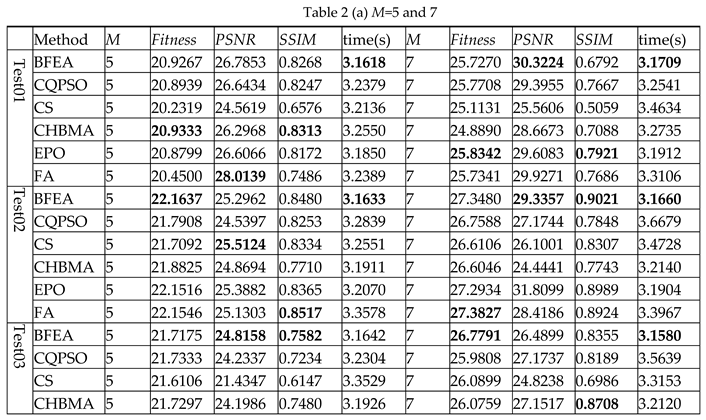

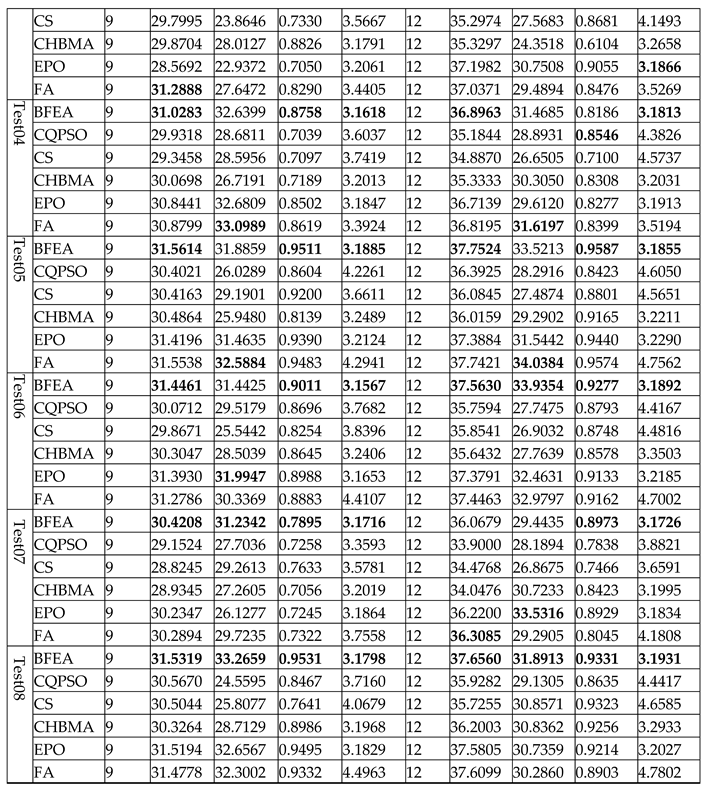
Table 3.
The optimal threshold value of each algorithm.
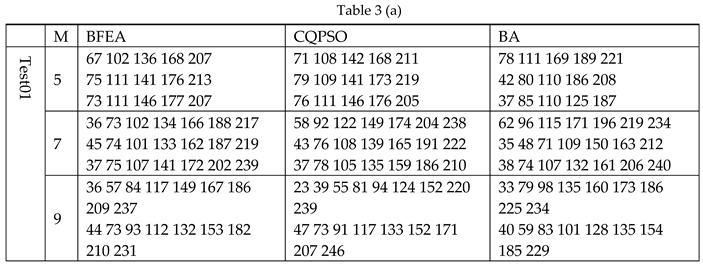
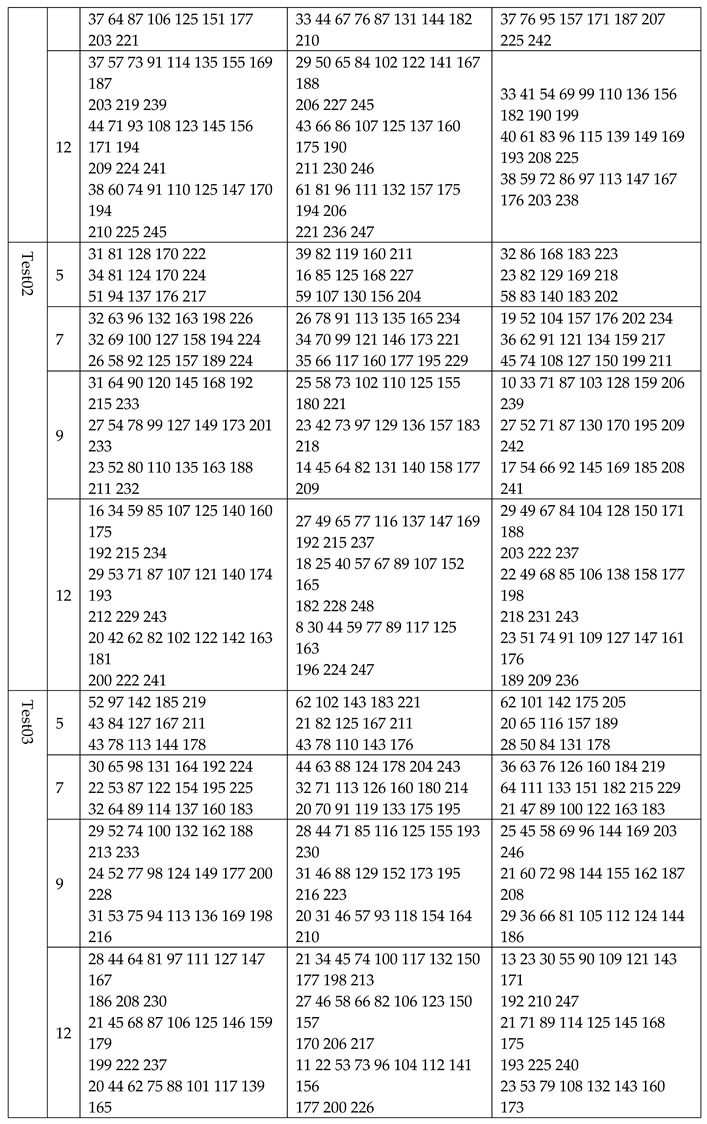
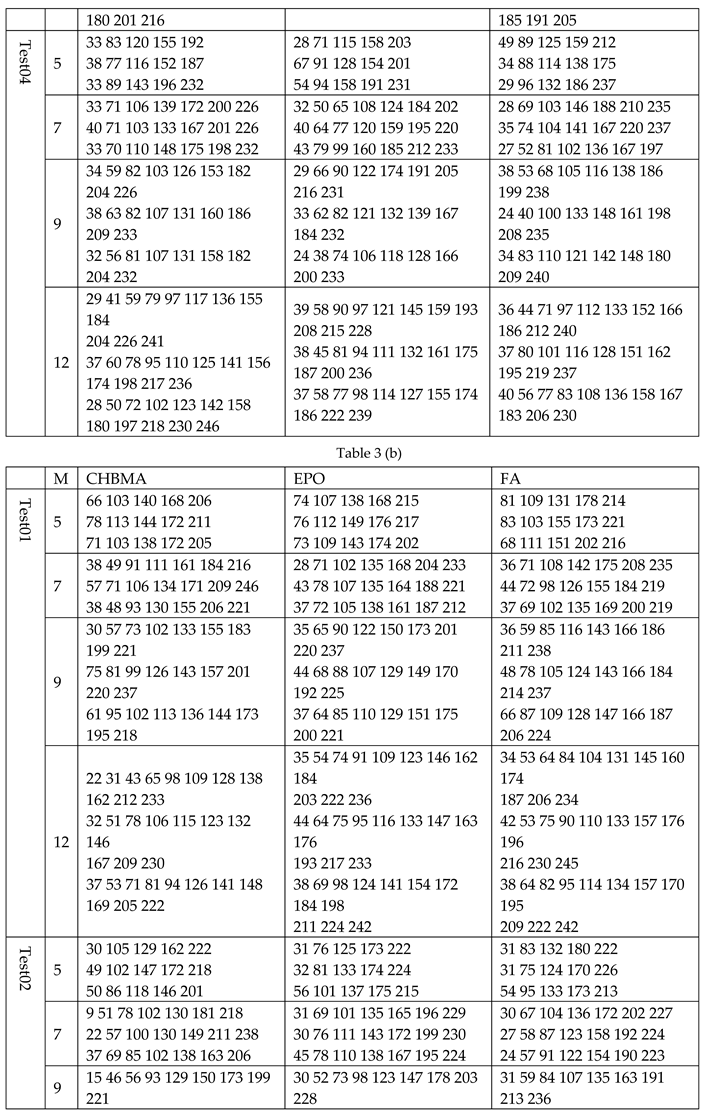

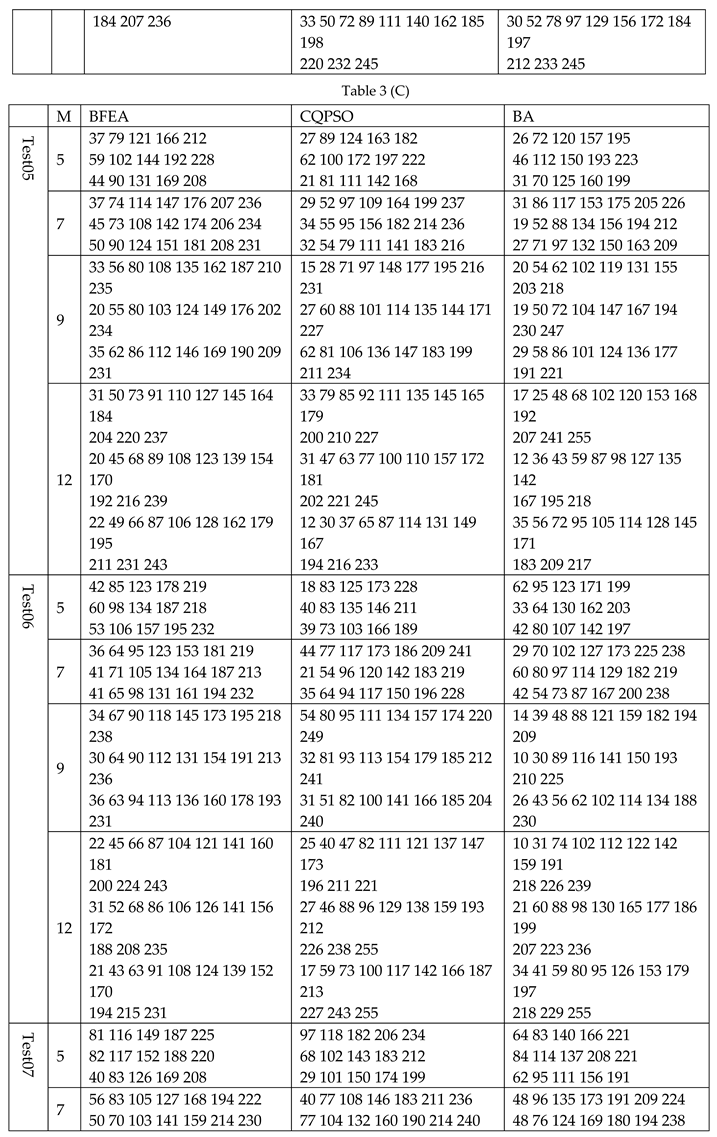
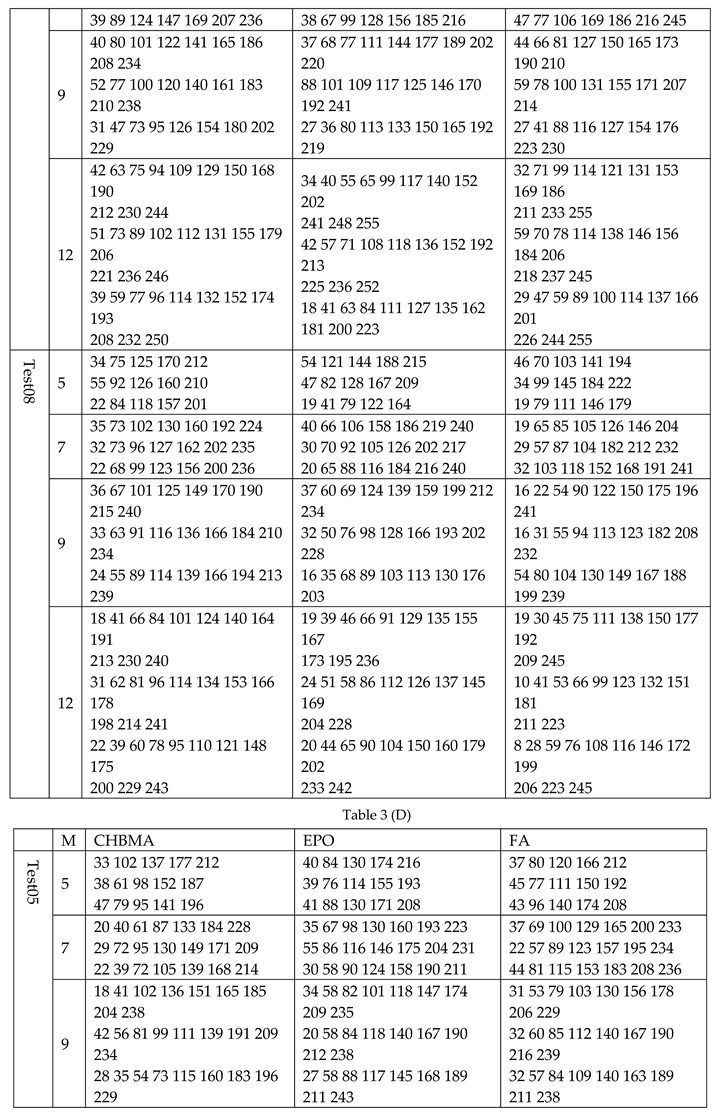
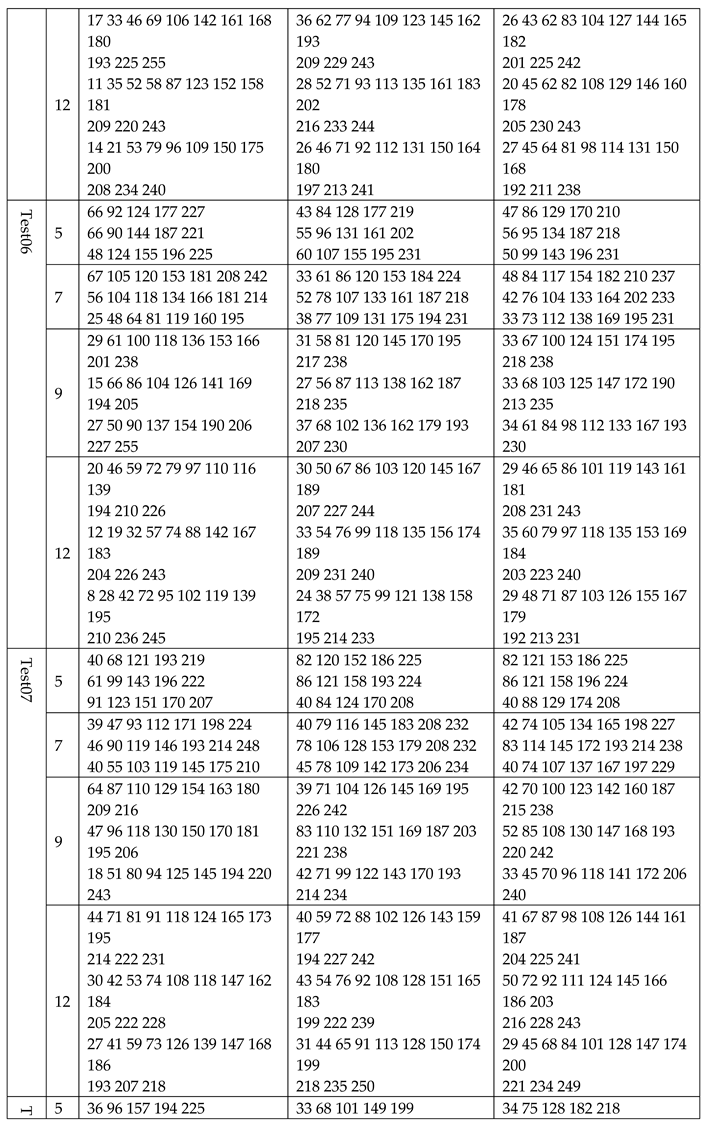
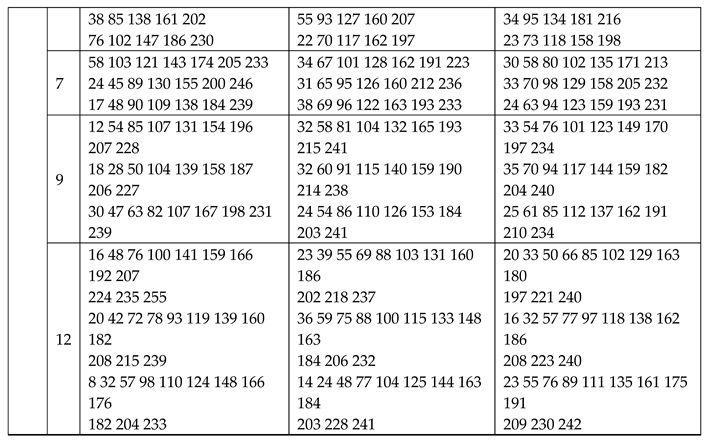
Table 4.
The Stability with M=5, 7, 9, 12 (It's the standard deviation in the table.).

Table 5.
The mean computation time with m=9, 12, 15, 18.

Disclaimer/Publisher’s Note: The statements, opinions and data contained in all publications are solely those of the individual author(s) and contributor(s) and not of MDPI and/or the editor(s). MDPI and/or the editor(s) disclaim responsibility for any injury to people or property resulting from any ideas, methods, instructions or products referred to in the content. |
© 2024 by the authors. Licensee MDPI, Basel, Switzerland. This article is an open access article distributed under the terms and conditions of the Creative Commons Attribution (CC BY) license (http://creativecommons.org/licenses/by/4.0/).
Copyright: This open access article is published under a Creative Commons CC BY 4.0 license, which permit the free download, distribution, and reuse, provided that the author and preprint are cited in any reuse.
MDPI Initiatives
Important Links
© 2024 MDPI (Basel, Switzerland) unless otherwise stated


