1. Introduction
The surface water mass in the seas and oceans is influenced by processes in the atmosphere and at depth, the intensity of which varies over time. Therefore, all processes occurring on the sea surface are non-stationary. In order to study any of these processes, it is necessary to assume the insignificant influence of other processes occurring in the water mass. In the problem under consideration: the formation of the ice cover and its structure, the absence of current and wind waves is assumed. This implies the formation and growth of ice crystals on the surface of a stationary water mass, in which only thermoconvective vertical currents occur.
The ice cover on the surface of the freezing seas has a crystalline structure that differs significantly from the crystalline structure of freshwater ice on rivers and lakes. This difference is primarily related to the conditions of the ice cover formation and the salinity of the seawater.
Freshwater ice crystals are formed in the cooling horizontal layers of water, which have a lower density at freezing temperature (compared to the maximum at +3.98°С), and take the form of horizontal plates with a vertically directed optical axis.
Sea ice crystals arise under conditions of the constant vertical convective upward-downward movement of the cooling on the boundary surface (interface ice – water) and becoming heavier salt water. Therefore, they have the form of vertical plates with a horizontal optical axis. Subsequently, the crystal structure of the sea ice is affected by the changing meteorological conditions, as well as the interaction of ice floes with each other under the influence of the wind, waves and currents. As a result, sea ice has up to nine types of crystalline structure [
1,
2,
3], differing in size, shape and the orientation of the crystals.
During the sea ice formation, the brine drops (solution of salts with high concentration) and gas cavities appear among its crystals, which form the specific characteristic property - ice porosity. The shape and size of the ice crystals, as well as the value of the porosity, determine the mechanical properties of the sea ice [
1,
4]. Therefore, they are the subject of special investigations in the interests of assessing the loads on the offshore structures and the ice propulsion of ice-going ships. The content of the brine and the gas cavities also determines the specific properties of the sea ice cover, which are manifested during microwave sounding [
5,
6]. In addition, there are reasons to believe that the composition of the gas cavities contain some information about the conditions for the formation of sea ice, and this information can be used for any practical applications.
The article contains an analysis of the possible mechanisms of sea ice saturation with gas cavities, including
the displacement of the air dissolved in the seawater during the crystallization,
the replacement of heavy brine flowing down with atmospheric air, and
the penetration of gas bubbles contained in the water space and emerging from the seabed sediments into the crystal structure of the sea ice.
The results of the analysis of the available experimental data of measuring the porosity of sea ice are presented in order to assess the comparative reality of the mechanisms of the gas pore formation under consideration. For the same purpose, computer modeling of the processes of gas inflow to the ice-water ice-forming boundary was carried out.
The study provided grounds for the conclusion that the main source of the gas pores in sea ice are gas bubbles emerging from the seabed.
The conclusion presents the main results of the studies and recommendations for the further research and practical application.
The preliminary results of the problem studies were presented in part at the International Scientific Conference POAC 2011 [
7].
2. Porosity of the Sea Ice and Main Peculiarities of the Gas Cavities
Sea ice porosity is one of the main characteristics that determine the strength of the ice and therefore is the object of study by various methods. Microphotography is the most informative method because it allows the isolating and analysing of the parameters of individual gas cavities.
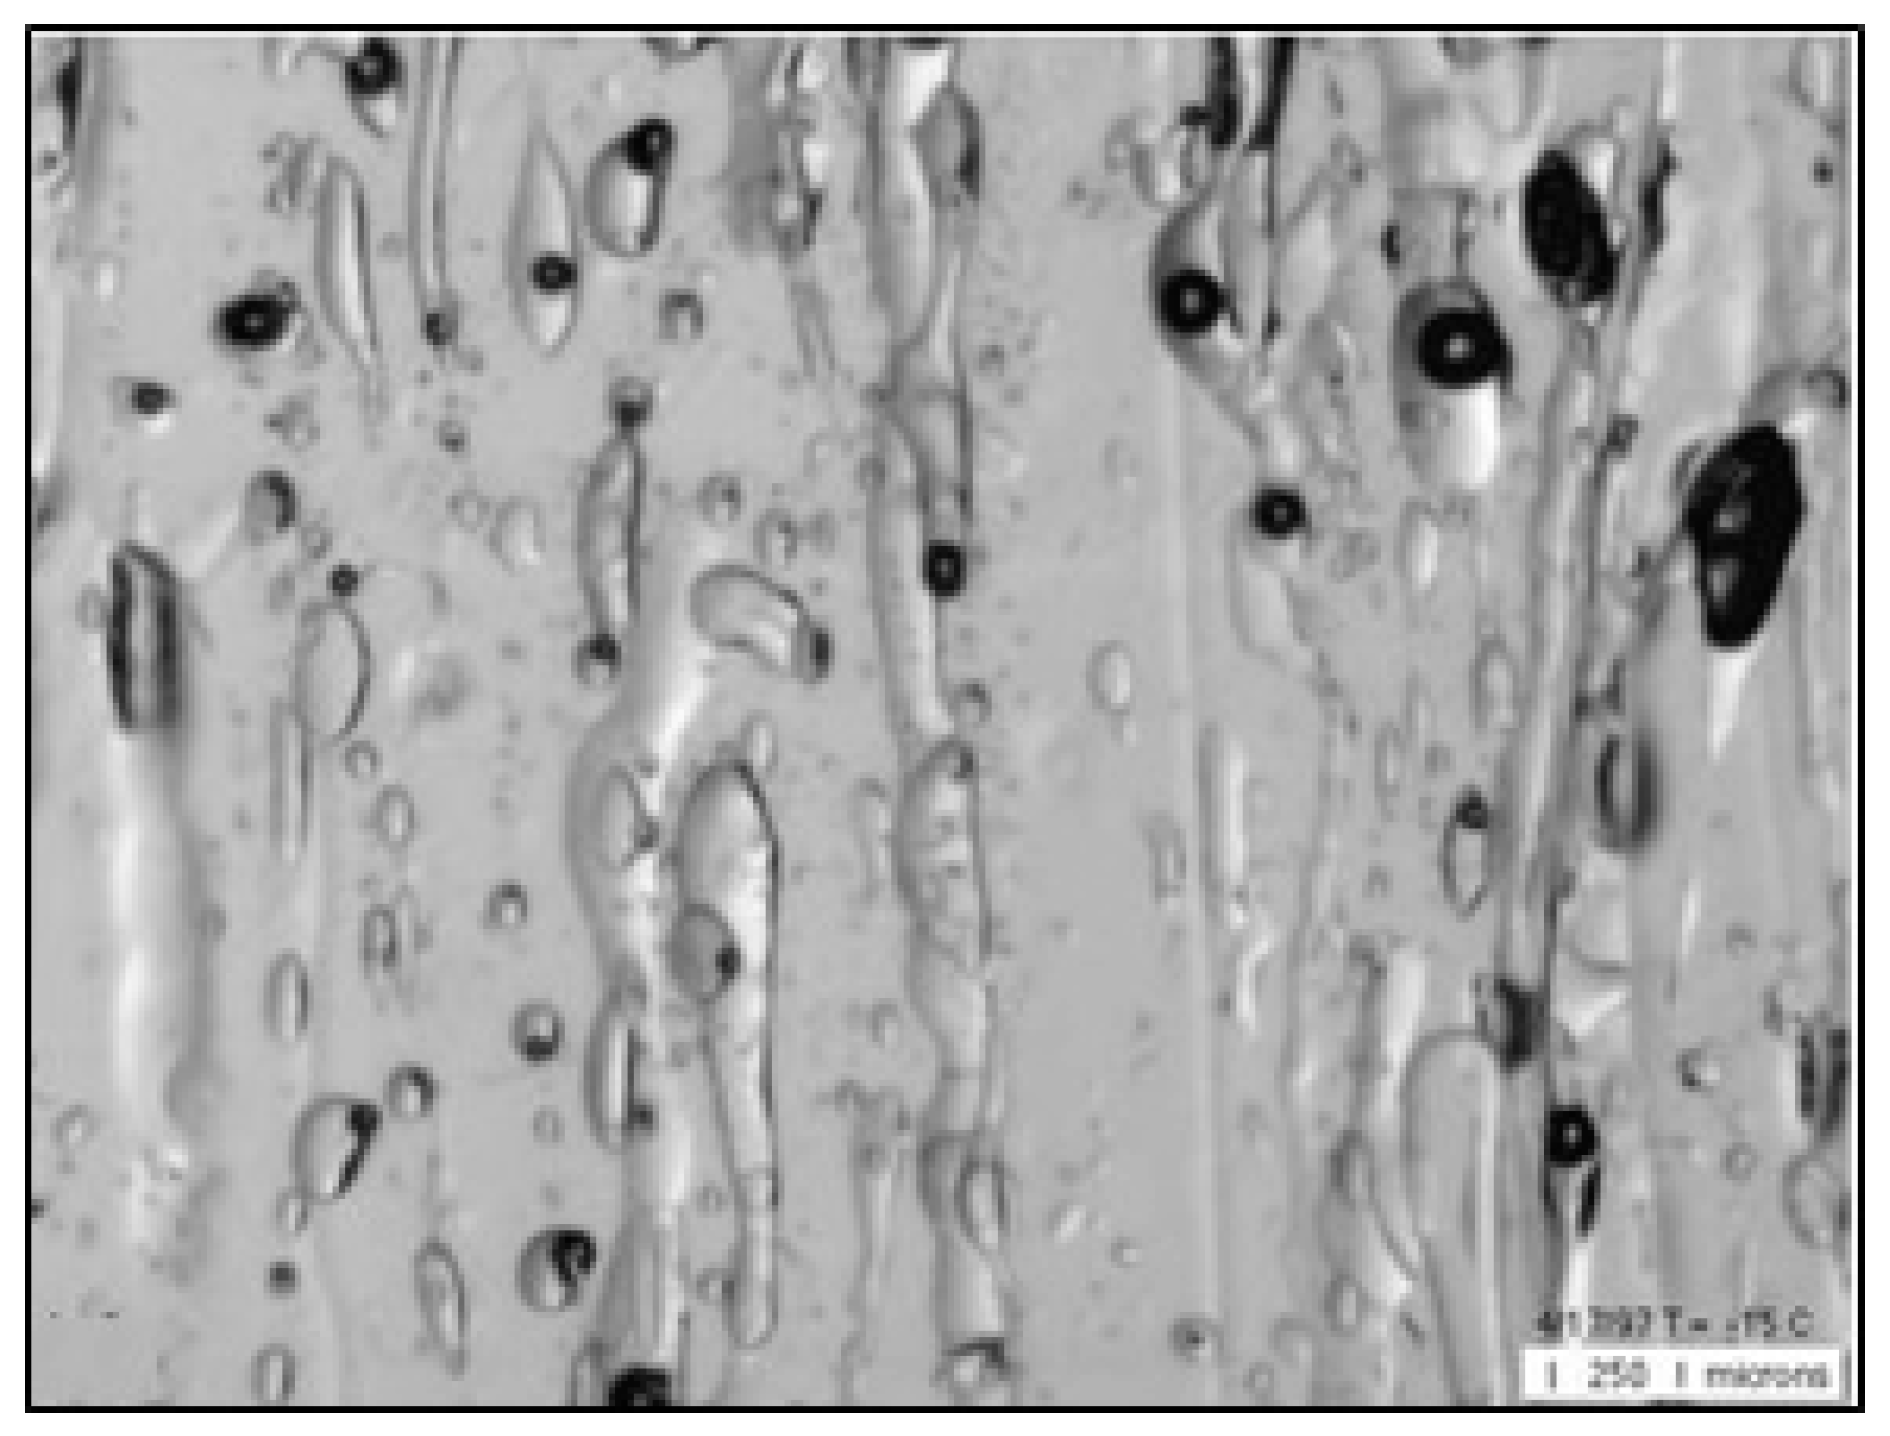
Figure 1 presents an image of the microstructure of first-year congelation of ice under a temperature of -15°C (Image width is 3.5 mm) [
8].
The form of sea ice porosity with the specified gas cavities differs significantly from that of freshwater ice. While the gas cavities in freshwater ice have a form close to spherical [
9], the gas cavities in the sea ice have a variety of forms. There are cavities with forms close to spherical, elongated cavities and channels of varying heights, as presented in
Figure 1. (Sea ice also contains the pockets with the brine – a strong salts solution that is black in colour.) This variety of gas cavity form gives a basise to consider that there are various mechanisms involved in the formation of gas cavities in sea ice formation.
3. Possible Mechanisms for the Formation of Gas Cavities in the Sea Ice
The initial stage of the ice cover formation is the stable hexagonal ice crystals initiation from the initially unstable and close to tetrahedral internal structure of liquid water. The main regularity of the formation of stable ice crystals is the minimization of the internal energy of the crystal lattice, which causes the displacement of foreign substances - impurities from the initial solution, which are the salts and the gases contained in the seawater [
10,
11].
Unlike the salts, the gas molecules are not chemically connecting with the polarized water molecules. The gas molecules locate in the space within the liquid water crystals. Therefore, the solubility of the gases in the water space increases with the pressure and decreases when increasing the temperature, which leads to the destruction of the water crystals. The seawater is in constant dynamic interaction with the atmosphere, therefore its surface layer contains the limiting - saturating concentration of the dissolved air and bubbles that occur, when the wind waves break. The concentration of dissolved gases increases with the depth growth [
12], and the content of the dispersed gas bubbles decreases [
13].
During ice crystal formation, the excess air (contained in the deep-water mass rising by the convective current to the zone of ice formation) displaces at the interface: water - ice. The main part of this air form bubbles, which are captured and then frozen into the space between the ice crystals. The cavities with a form close to spherical ones visible in
Figure 1 are the most likely outcomes of this mechanism realization.
Gas bubbles formed when wind waves break up appear only near the boundaries of the ice cover, which is an obstacle to wave movement. Therefore, this source of gas bubbles makes a negligible contribution to the gas porosity of the sea ice.
Another possible mechanism for sea ice saturation with gas cavities is the penetration of the atmospheric air into channels that remain in the upper layer of the ice cover behind the sea salt water flowing down between the ice crystals. This process takes place under the gravity’s action on the salt water while the ice cover is freezing and its thickness increases due to the rise of its surface above the sea level [
5]. During the ice crystals formation, the salt molecules are displaced into the water spaces between the ice crystals, increasing the concentration of the saline and forming the brine drops. The volume and salinity of the brine varies under the action of the temperature variation due to the formation or the breaking of the chemical bonds between the salt and water molecules, and therefore the cavities are filled with the brine and the air together. These air-filled vertical channels of various lengths (heights) and thicknesses, the cavities with brine and air together are observed in
Figure 1.
It is possible that the third mechanism of sea ice saturation with gas cavities is not related to the crystallization of the seawater. At the interface: water - ice, gas bubbles can float up from the bottom sediments, where the decomposition of organic matter deposited on the bottom occurs. (This option is the most significant for the shallow coastal water areas). In the water areas with bottom deposits of natural gas, methane can seep into the water space and form bubble plumes which rise from great depths to the ice cover [
14]. The gas bubbles reaching the ice-water interface have dimensions exceeding those formed during the crystallization and displacement of the air dissolved in the seawater. Therefore, these bubbles can be assumed as the elongated gas cavities in
Figure 1 and are related to this possible mechanism.
To assess the reality and the role of these mechanisms in the formation of the physical and mechanical properties of the sea ice, it is necessary to analyse the available experimental data on measuring the porosity of sea ice and numerically simulate the processes of the gas bubbles’ movement to the sea water-ice interface.
4. Analysis of Experimental Data
Investigation of the gas cavities in fresh water ice and sea ice is a very complicated problem because it requires special devices for registering the dimensions and form of the small gas cavities and equipment for the temperature of the ice sample stabilization.
In many publications devoted to the research of the physical and mechanical properties of sea ice, the integrated estimations of the air bubble and the brine drop contents – the total porosity are stated. In the data [
5] the porosity lies in a range: between 20 - 60‰, and also has the greatest value near to the lower surface of the ice cover where it reaches 200‰. In [
1] it is stated that sea ice has a porosity in a range of 1 - 50‰. Porosity has a maximum value: 12 - 18‰ in the top and lower layers of the young ice, and a minimum: 8‰ in the centre layer. According to [
15] the air bubbles are dispersed in all ice thickness, but the greatest concentration of the gas bubbles were observed near to the top surface of the ice.
The dynamics of brine inclusions in the first year sea ice was the main content of investigation presented in [
8]. The characteristics of the gas cavities close to spherical form (bubbles) were also analysed and the following results were obtained. The gas bubbles had a radius in a range from 0.004 mm to 0.07 mm. Their total density was 1.3 per mm
3.
According to the results of the measurements performed in the samples from the top layer of the first year ice (named “bubbly” ice) [
17] the bubble radii are in the range from 0.2 – 2 mm and their number per mm
3 is in the range of 0.004 (largest bubbles) – 0.09 (smallest bubbles).
Detailed investigations of the total air content in the sea ice was performed in [
16], where the vertical distribution of the density, the salinity and the porosity (air content only) sampled in the Baffin Bay was measured in two cores of the first-year ice in a diameter of 75 mm. The first core had a length of 0.740 m and was investigated in situ. Samples - pieces with a thickness of 50 mm – were cut and each sample was controlled apart. The second core, 0.795 m in length, had been frozen to - 40°С, and delivered to the laboratory and then investigated with a discreteness of 25 mm. Arrays of the sea ice characteristics were obtained: core № 1 - 15 values and a core № 2 - 32 values. This method allows us to get a more detailed understanding about the considered phenomenon and to draw statistically significant conclusions.
Table 1 contains the averages (average-out on length of the cores) and dispersions of the density, the salinity and the porosity of the ice for each core and for its unified array.
Comparison of the measured values of the sea properties: density, salinity and porosity (average on the height of each core) using “Student criterion” has revealed that the difference between the cores is not statistically significant. It means an essential change of characteristics of the No 2 core during transportation and storage has not occurred. (The probability to observe similar or smaller difference between these characteristics of the sea ice for any other cores from the same ice field equals 50% - 70 %). It allows us to analyse the data on both cores in common, as the unified array in volume of 47 values for each characteristic.
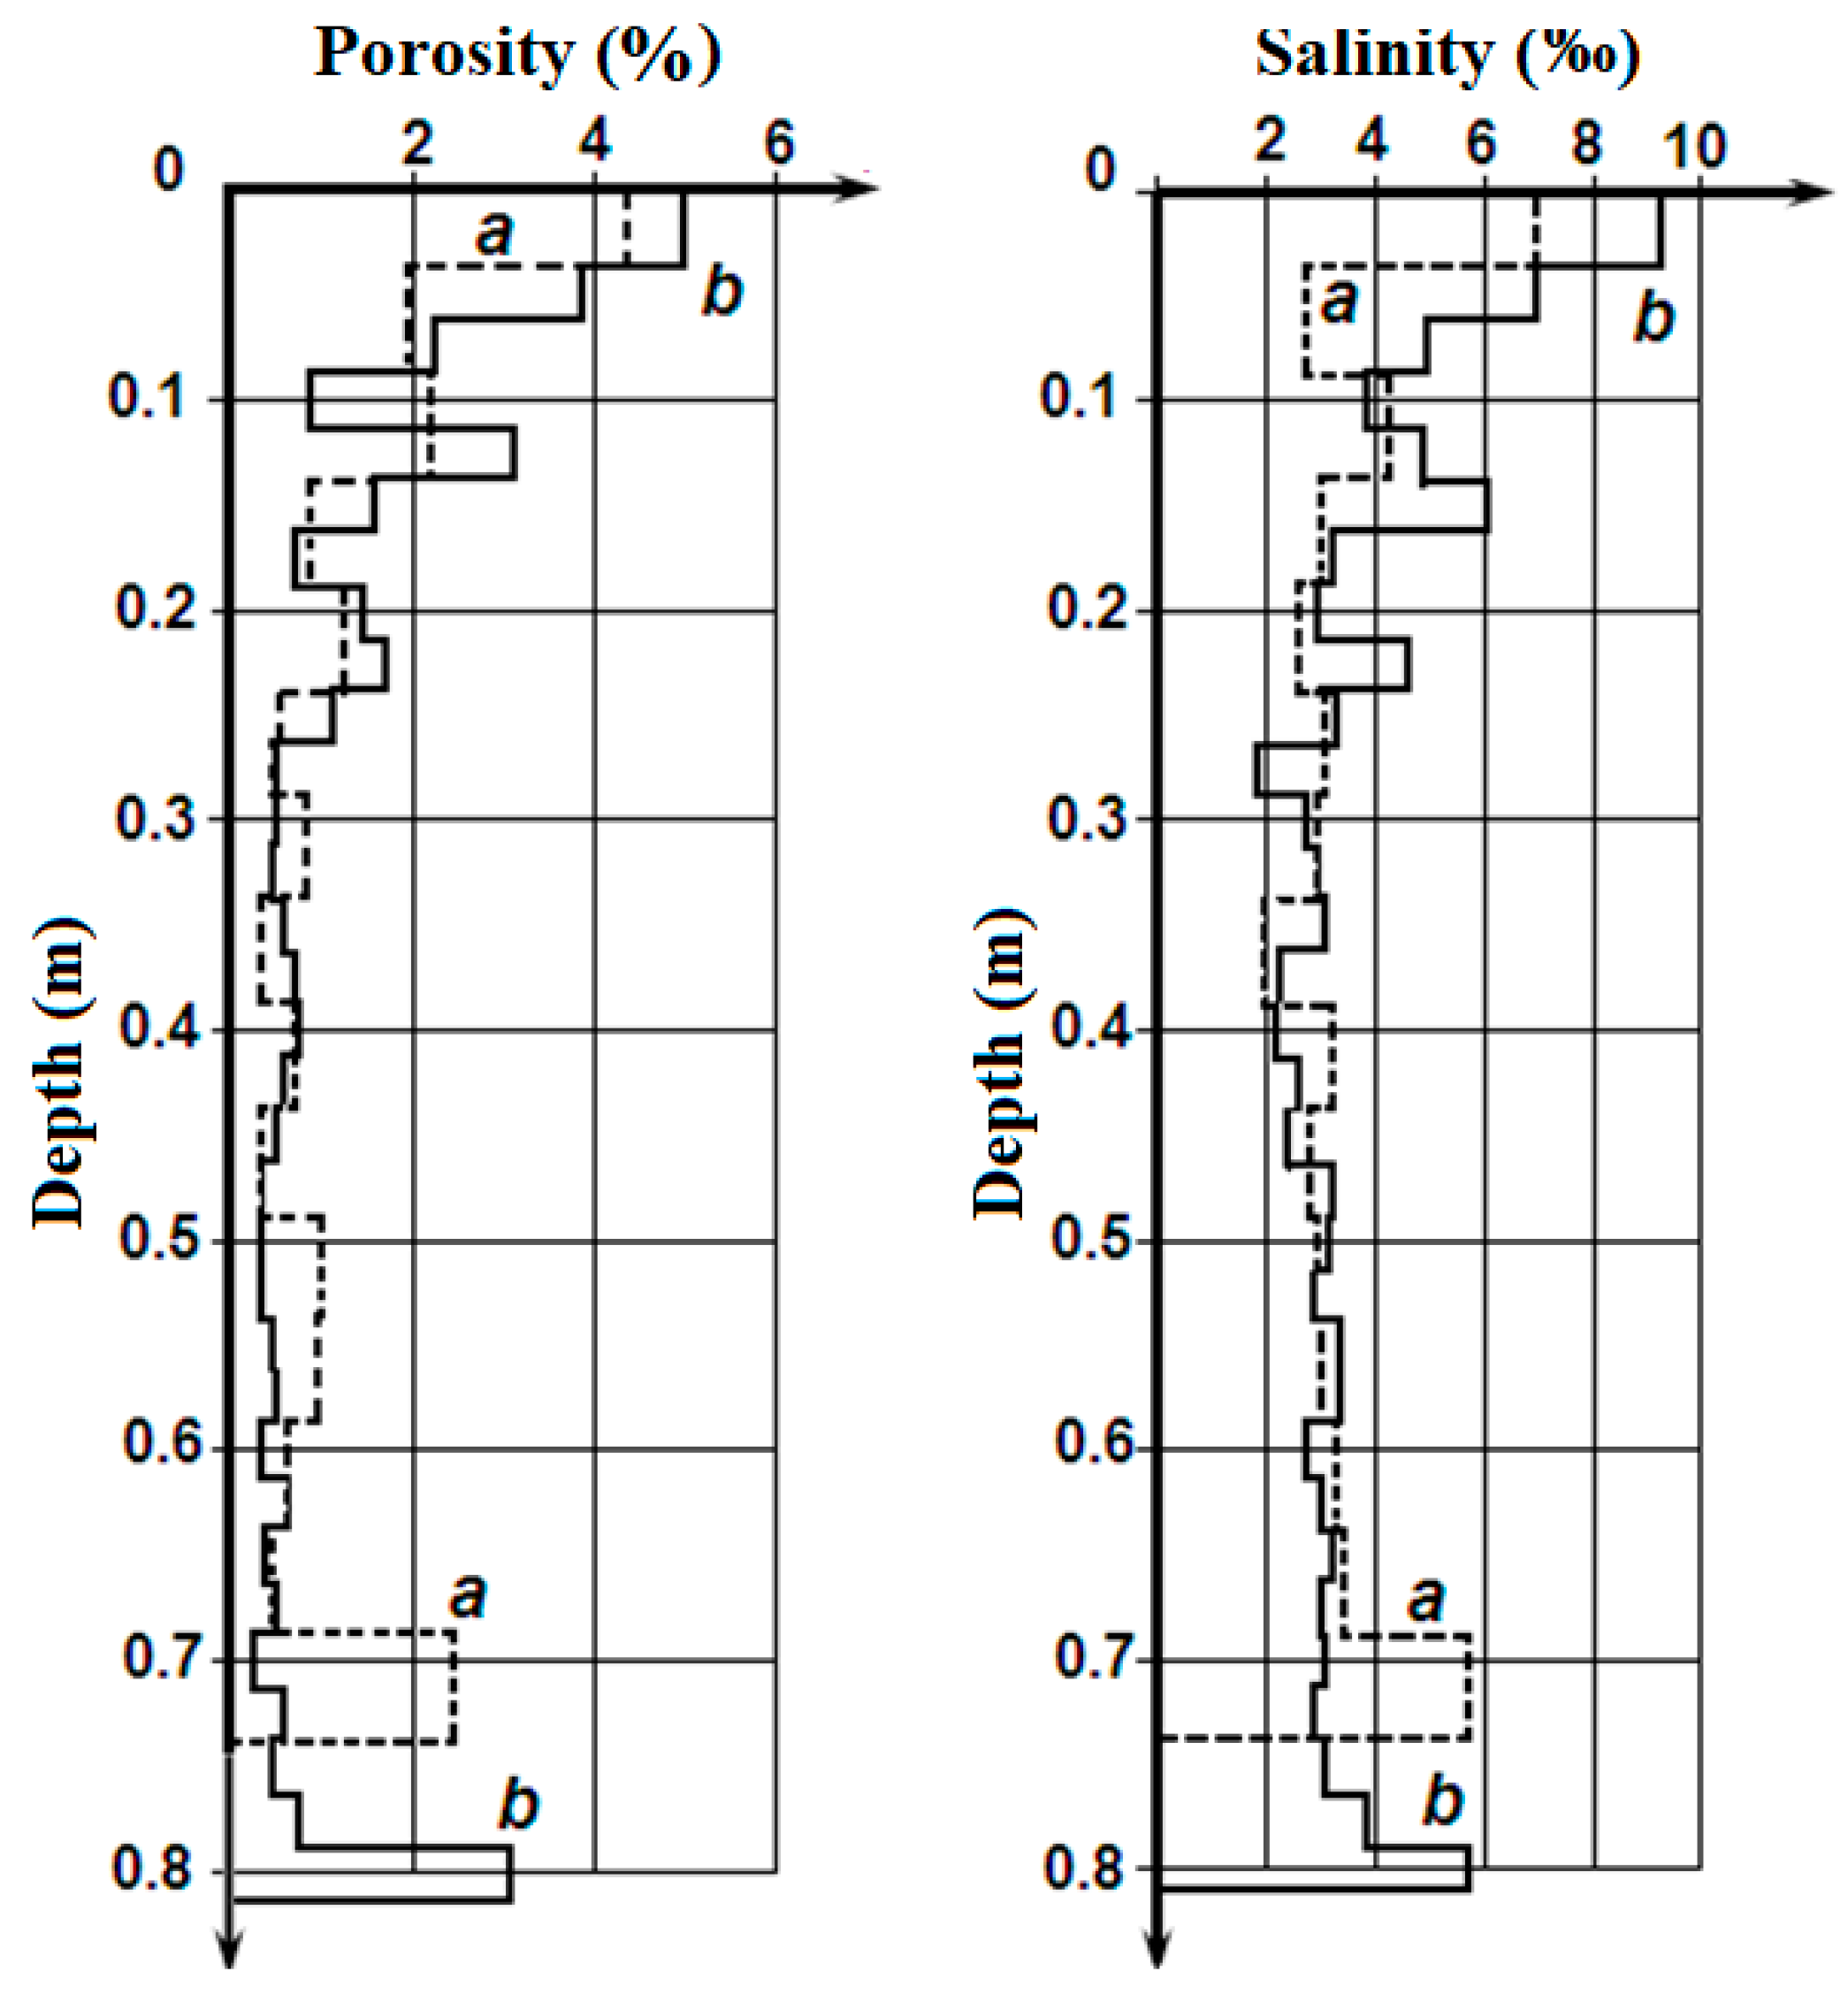
Figure 2 presents the variation of porosity (on the left) and salinity (on the right) along the cores (on thickness of ice). The analysis of this data shows the following:
The obvious similarity of the porosity and salinity variation on the length of the cores.
The similarity of the porosity and salinity variation along core for both cores.
The substantial increase of the porosity and the salinity values on the upper and lower boundaries of the cores and the rather small variation of these parameters in the middle part of cores.
Figure 2.
Variation of the sea ice porosity (on left) and the salinity (on right) along ice cores No 1 (
a) and No 2 (
b) [
16].
Figure 2.
Variation of the sea ice porosity (on left) and the salinity (on right) along ice cores No 1 (
a) and No 2 (
b) [
16].
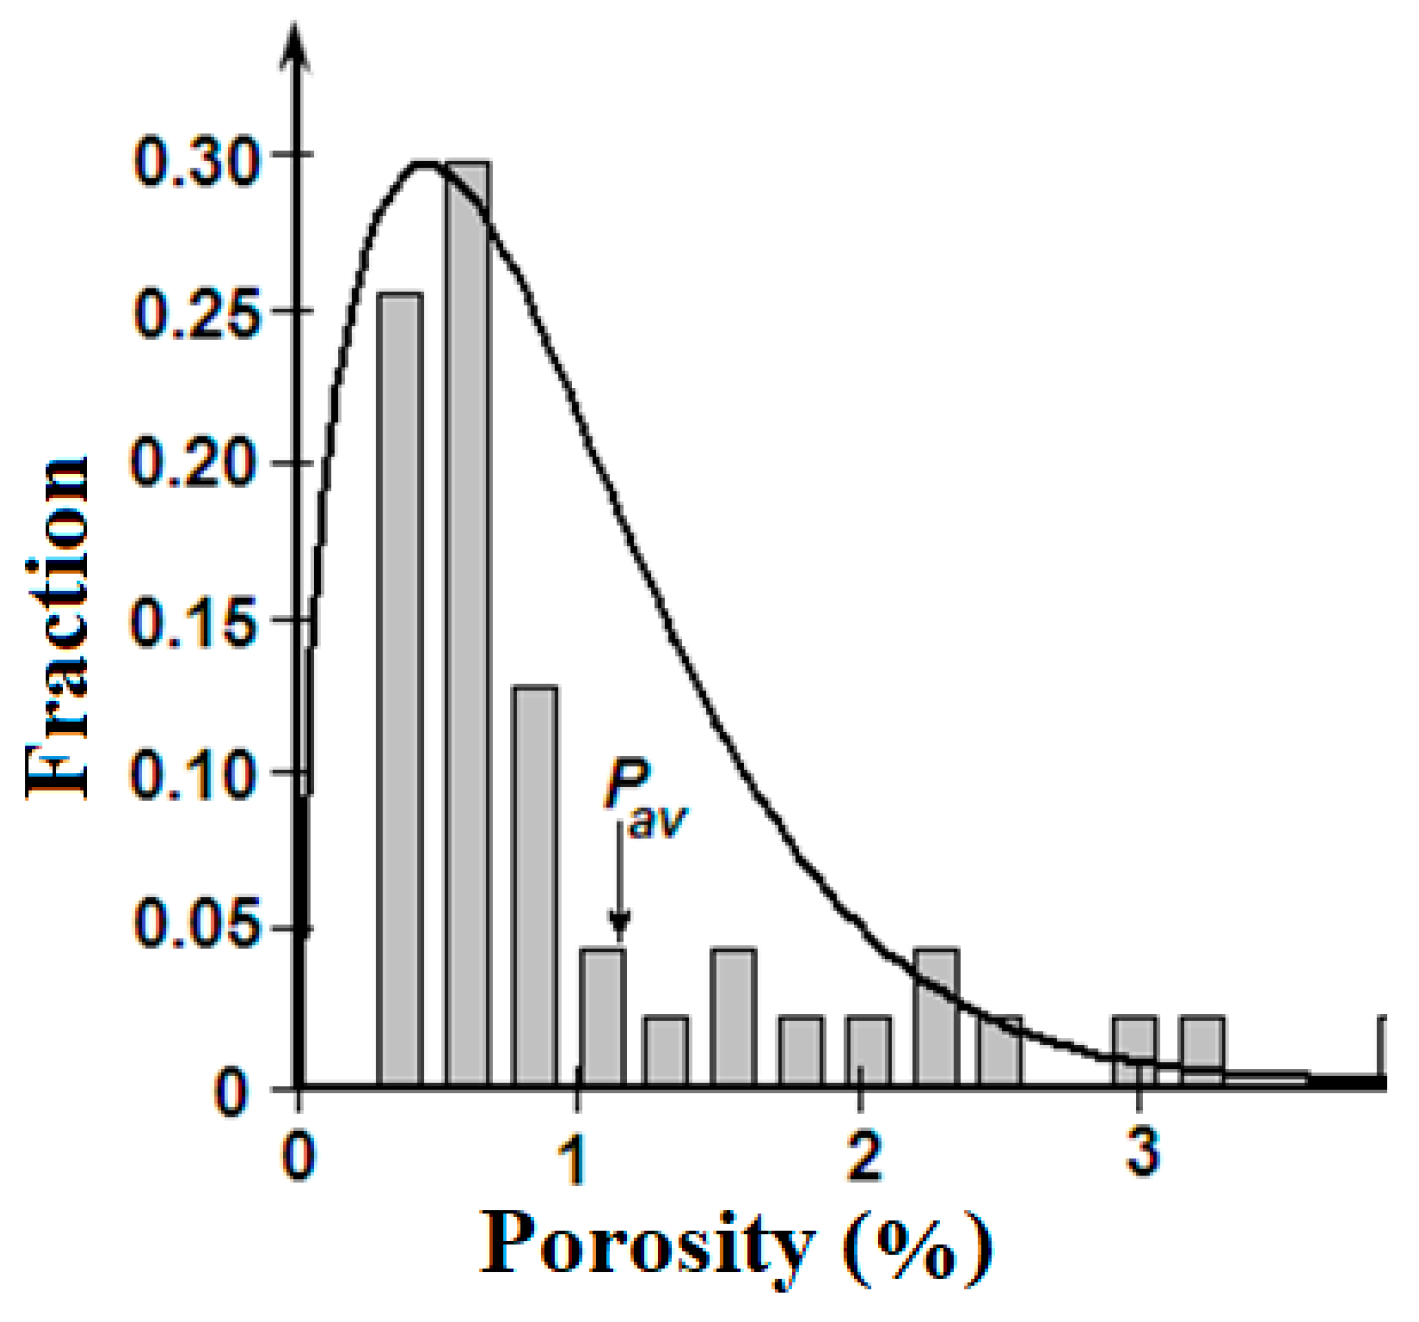
Figure 3.
Histogram of porosity for unified sample and Weibull probability density function.
Figure 3.
Histogram of porosity for unified sample and Weibull probability density function.
Higher salinity in the upper and lower layers of the first-year sea ice was marked in much of the research [
1,
15]. The phenomena of the porosity increase in the border layers of the sea ice requires special investigations.
The correlation analysis between measured characteristics of the sea ice: density, salinity and porosity, on base of the unified array of their values has been carried out.
Table 2 presents the results of the coefficients of correlation estimations.
All values of the coefficients of correlation are great enough, and it is possible to consider them as statistically significant values. The analysis of
Table 2 data allows us to form the following conclusions:
A high correlation between the sea ice density and porosity is natural and does not demand additional comments.
A high, but negative correlation between the salinity and the density seems strange. However, the average value of the salinity Sav = 3.577‰ essentially less than average value of the porosity Pav = 1.140%. Therefore, the contribution of the porosity into the density of the sea ice is more than the contribution of the salinity. The negative sign of the correlation: the salinity - the density, in this case is connected to the porosity.
A high and positive correlation between the porosity and the salinity of the sea ice requires special investigation.
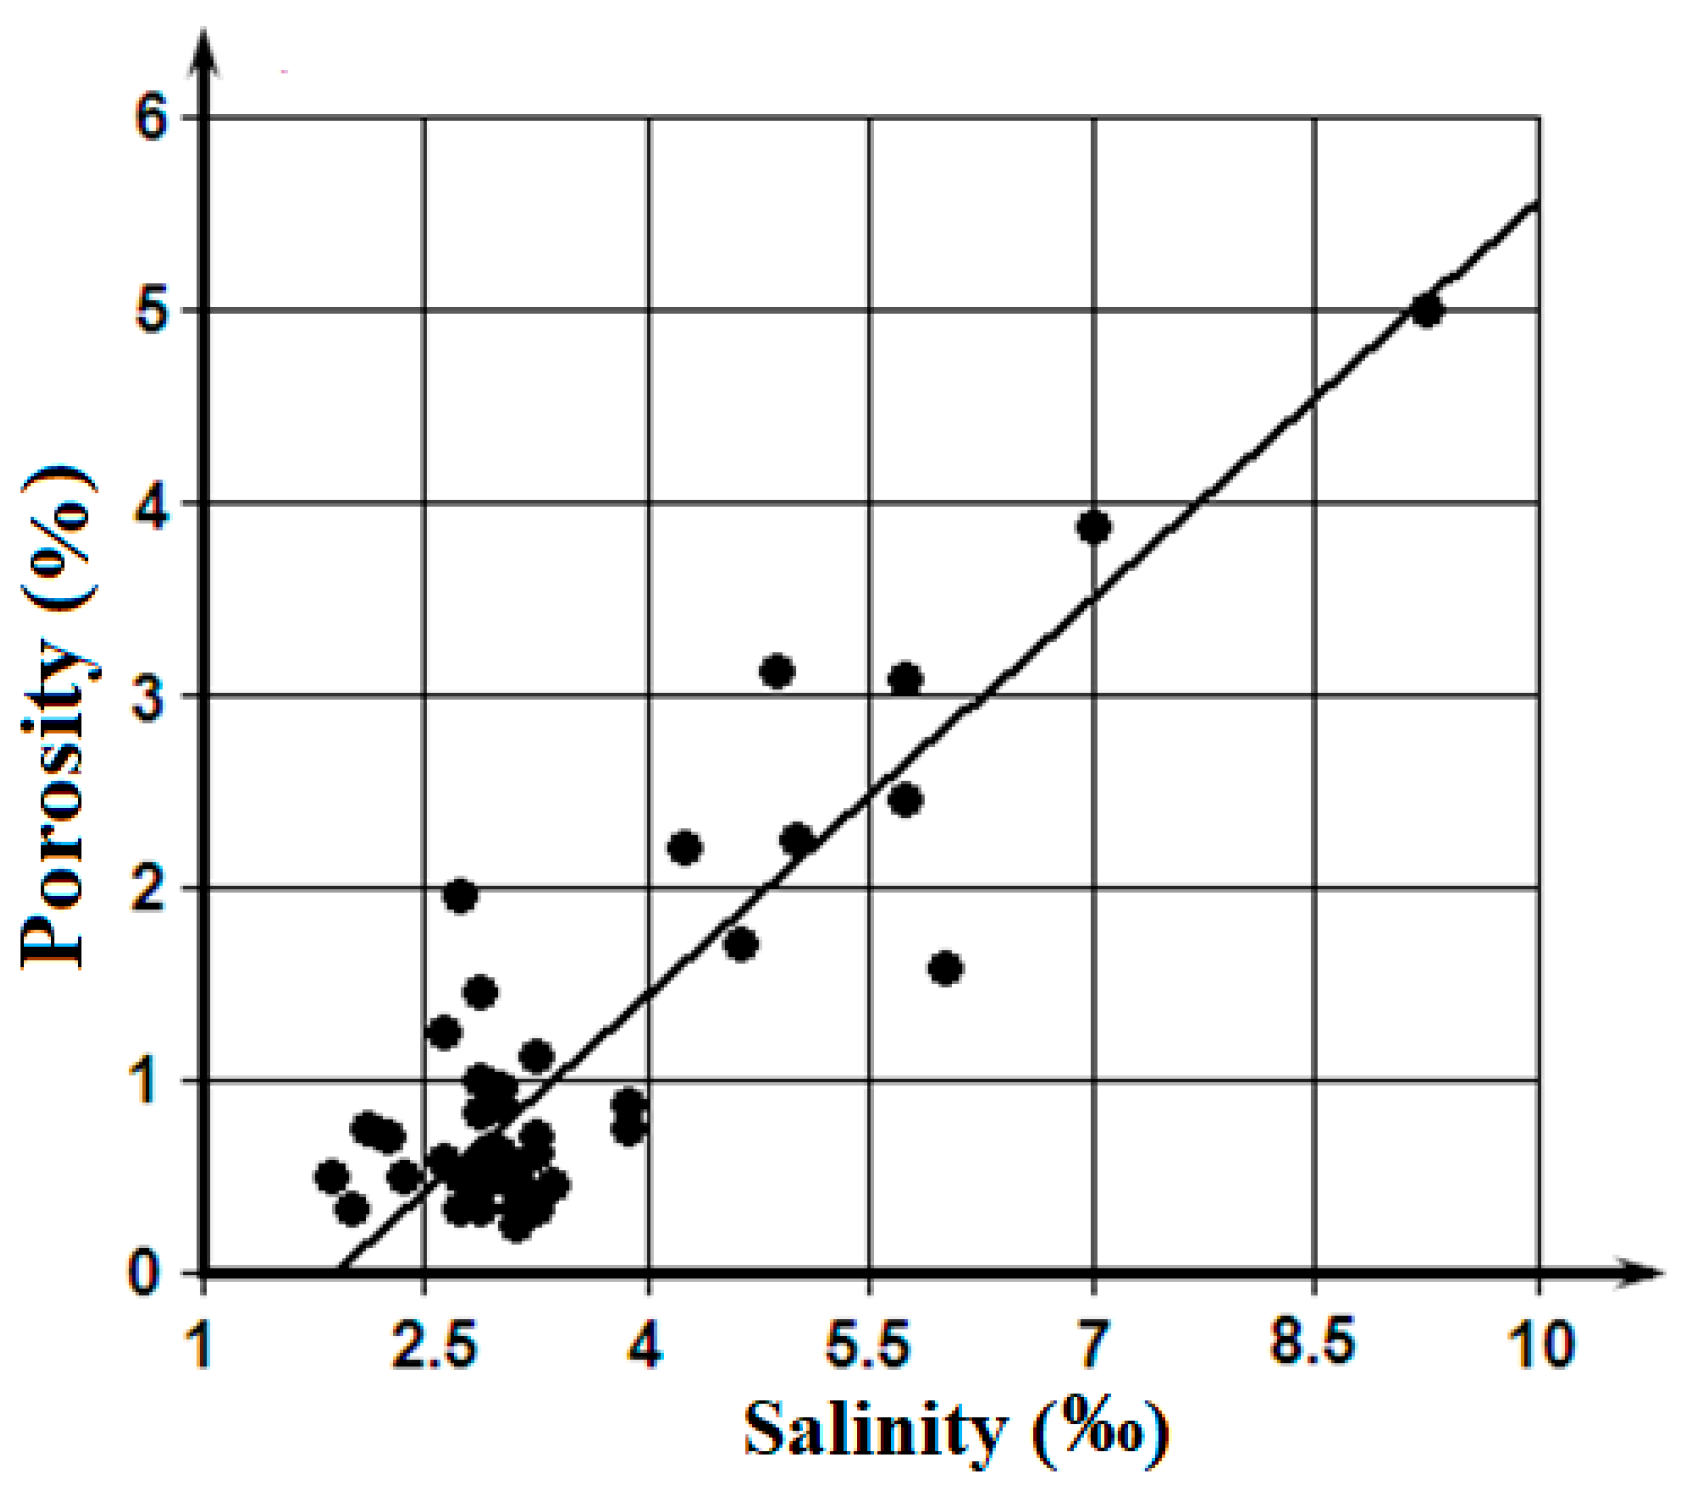
Figure 4 presents a linear regression of porosity on salinity. These materials show, that a high correlation between the porosity and the salinity is connected with largest values of these parameters, which amounts, approximately, to 1/5 part of an array. The main bulk of data is grouped in the minor area:
S < 4‰ and
P < 1%, where any statistically significant interdependence between porosity and salinity is difficultly to establish.
It is reasonable to apply the presented outcomes of the accessible experimental data analysis for the possible mechanism of the sea ice crystalline structure with gas bubbles saturation analysis.
5. Evaluation and Modelling the Mechanisms of the Sea Ice with Gas Bubbles Saturation
5.1. Displacement of the Dissolved Atmospheric Air and Capturing the Bubbles Contained in the Seawater
The main and evident mechanism of sea ice saturation with atmospheric air is the displacement of the seawater before the air is dissolved into bubbles during the course of formation and growth of the ice crystals. According to [
12] in the waters of the Northern Atlantic (for example), the content of the basic components of the atmospheric air are as follows: nitrogen 9.2 - 14.4 ml/l and the oxygen 6.99 ml/l. Therefore, the average content of air dissolved in the seawater is: 16.2 - 21.4 ml/l. Taking into account the increase in volume of the ice in comparison with the volume of the unfrozen water, it is possible to accept, that the volume of the air in the ice will be 14.85 – 19.62‰. These values exceed porosity in the central part of the cores [
16] which confirms the effect of displacement of the atmospheric gases at the ice crystallization. At the same time, porosity in the lower layers of the cores turned to water space considerably exceeds the specified values.
The zone of contact: ice - water space, is the area of their continuous interaction. Therefore, characteristics of ice and water in this zone considerably differ from other volumes of ice and a water [
18]. It is possible to expect, that the crystal structure of the sea ice in the bottom layer is less compact, than in the overlying layers. Hence, this layer is capable of containing a larger quantity of gas bubbles in the case of its inflow from the water column. The drops of “brine” gradually flow down to the same layer from overlying ice layers, and these can explain the correlation of porosity and salinity in the bottom layers of both cores [
16].
To evaluate the reality of the indicated mechanism, it is necessary to examine the following sources of the bubbles. Air bubbles appear in the near-surface layers of a sea owing to the breaking down of the wind waves and as result of other (including biological) processes. The wind waves are absent in the presence of the ice cover of the sea surface. Therefore, it is necessary to pay attention to the bubbles of various origins existing for a long time in the water space owing to the organic film of surfactants preventing their dissolution.
Results of research by various methods of the content of the air bubbles in the near-surface layer of the seas [
13,
19] has shown the bubbles with radii in a range of: 2.5 - 20 microns existing at depths greater than 5 m. Their volume concentration, accordingly, is in a range from 1300 to 25 1/m
3. Based on this data, it is possible to estimate a flux of the air from the water column on the lower surface of the ice cover.
As stated in [
16] the average rate of the sea ice growth was about ≈ 0.05 micron/s. It is possible to assume that the bottom layer of the cores of thickness 50 mm freeze up to an extent in about 278 hours. The velocity of the air bubbles floating up (if representing them in the form of a sphere and applying Stokes decision [
20]) can be estimated using the following formula
In this formula
g - the gravity acceleration (9.81 m/s
2),
ν - the kinematic viscosity of the seawater (1.826⋅10
-6 m
2/s for 0°С and 34.3 ‰),
R – the radius of the air bubble. For the bubble in radius
R1 = 2.5 microns the velocity of emersion is
w = 7.46⋅10
-6 m/s, and for the air bubble
R2 = 20 microns -
w = 4.68⋅10
-4 m/s. The flux of the air from the water space through the area unit (1/m
2⋅s) can be estimated using the following formula.
The performed calculation showed the inflow of the air on the bottom surface of the ice cover for the freezing period up to a thickness 50 mm can achieve the following values: for the bubbles with R1 = 2.5 microns inflow Q1 = 6.40⋅10-7 ml/m2⋅s, and for the bubbles with R2 = 20 microns inflow Q2 = 4.00⋅10-4 ml/m2⋅s. These quantities are negligibly small in comparison with the porosity of the ice cores in the lower layer. Therefore, the examined source of the sea ice saturation with the air does not play an essential role.
5.2. Penetration of the Atmospheric Air into the Channels behind Salt Seawater Flowing Down
The sea ice density depends on its salinity and porosity and varies in range of 0.834 g/cm
3 – 0.924 g/cm
3. The sea ice that does not contain the air has density of 0.940 g/cm
3 [
1] which means that the sea ice is lighter than the water. Therefore the upper surface of the ice cover rises over the sea water level. This rise defines the length of the channel that is left after the salt water flows down. The snowfall on the ice cover and freezing close up this channel and new channels form. It is possible to estimate the extreme heights of these channels in dependence on the thickness and density of the sea ice.
The minimal height of the channel appears in the young ice cover, when the upper surface comes up to the water surface. This is the sea ice form named “light nilas” and it has a thickness in range of 5 – 10 cm [
1].
In regard to the maximal density of the sea ice, the elevation of the ice surface above the water level is 0.3 – 0.8 cm, and it is the minimal dimension of the air-filled vertical channels between the ice crystals.
It is possible to consider as the maximal dimension of the air channels the thickness of the “first-year” ices in a range of 0.3 – 1.2 m. During the ice cover summer melting, the “dried ice” contains the through channels through that melt water flows down.
It is possible to explain the increased porosity in the top layer of the ice cover adjoined with the snow cover by the air replacement of channels, which are formed as result of the salt water draining to the depth of the ice cover [
5]. At the same time, results of measurements of the salinity in the ice cores, presented in
Figure 3, do not give the necessary bases for the analysis of this process, for example, by methods of the theory of filtration as the salinity does not increase and even decreases in the direction to the middle parts of both ice cores. It is possible to assume, that process of filtration of the salt water has occurred at the early stages of the ice cover formation, when the temperature of the atmospheric air and the ice surface was higher than at the time of sampling of the cores. When the temperature of the air and the ice surface pull-down, this process gradually stopped, and the examined profiles of the salinity and the porosity were generated. This phenomenon requires special research, for example, by a survey of the cores selected at different stages of the ice cover freezing, by the technique used in [
16].
5.3. Floating Up of the Gas Bubbles to the Ice-Water Interface
Possible sources of the gas bubbles in the seawater space are the organic bottom sediments in the course of decomposition and the seabed natural gas deposits that release the methane in form of the bubbles emerging at the sea surface. Plumes of the bubbles containing methane gas exist in some water areas [
21,
22].
In the course of floating, the majority of the bubbles are dissolved, and as result, the ocean waters contain the dissolved methane in concentration of 10
-3 ml/l in the near bottom layer and about 10
-4 ml/l in the overlying water space [
12]. Performed modelling of the bubbles emerging and the dissolution processes for the Okhotsk and the Black seas [
23,
24] confirms the reality of these sources.
Methane can play an essential role in the increase of sea ice porosity in the case that the bubbles containing methane have the possibility to emerge from the seabed (not be completely dissolved) to the lower border of an ice cover. The possibility of gas bubble dissolution in turn depends on their original sizes and from the depth, where emerge [
23].
Occurrence of the bubbles containing methane from the bottom sediments is most probable at depths less than 250 m as at greater depths methane can exist only in the methane’s crystalline hydrate form. It can be assumed that the ice cores investigated in [
16] were most likely taken off the inshore part of the water area.
For the estimation of the real possibilities of methane bubbles coming up on the lower surface of the ice cover the mathematical model of the floating up and dissolution of a single gas bubble in the sea space [
23] has been applied. This model includes the following components:
The equations for the gas bubble movement that takes into account the resistance for the bubble movement in dependence on its volume and form connected with the dissolution and the external hydrostatical pressure decrease in the process of floating
The equation for the radius of bubble evolution owing to the diffusion of gases contained in a bubble through its surface and owing to a change of external pressure.
The equations for the methane mole fraction originally filling the bubble and for the mole fractions of the nitrogen and the oxygen, which diffuse in the bubble or from it in the course of floating up
In these formulas, the following notations are used: t and z are the time and the vertical coordinate with an origin on the seabed, r and w are the radius of gas bubble and its velocity of floating up, ρaj, μj and κj are the density j-gas inside the bubble under normal atmospheric pressure, its gram-molecular weight and the mole fraction. Then, αsj and αwj are the saturating and real (in seawater) relative volumetric content of j-gas, Dj is the diffusion coefficient j-gas through the bubble surface in the seawater without surfactants, k is the coefficient that accounts the effect of the surfactant film on the diffusion intensity, and H and pa are the initial depth and the atmospheric pressure. Then, ρw and σw are the mass density and the capillary constant of the seawater, g is the gravity acceleration, ζ is the coefficient of the floating up resistance, εj is the relative part of the bubble surface, through which j-gas diffuses.
Value
εj depends on the fraction of
j-gas in the total gas flux and the following formula determines it
Initial data about the concentration and the solubility of the gases proper to seawater pointed to in [
12] have been used for the modelling of the gas bubble dynamic. To take into account the surfactant film forming on the bubble border and its influence on the bubble dissolution, the correction to the diffusion coefficient (
k = 0.10) has been accepted [
25]. In the course of modelling, the initial sizes of bubbles (0.5 – 3.0 mm) and initial depths (until 250 m) were varied data based on the results of the acoustic sounding [
22,
23]. The first goal of modelling was the range of the depths, from which the flowing up of bubbles to the ice cover is possible. The second goal was to estimate amount of methane in relation to the initial one that the bubbles were capable of carrying from the seabed to the sea ice cover.
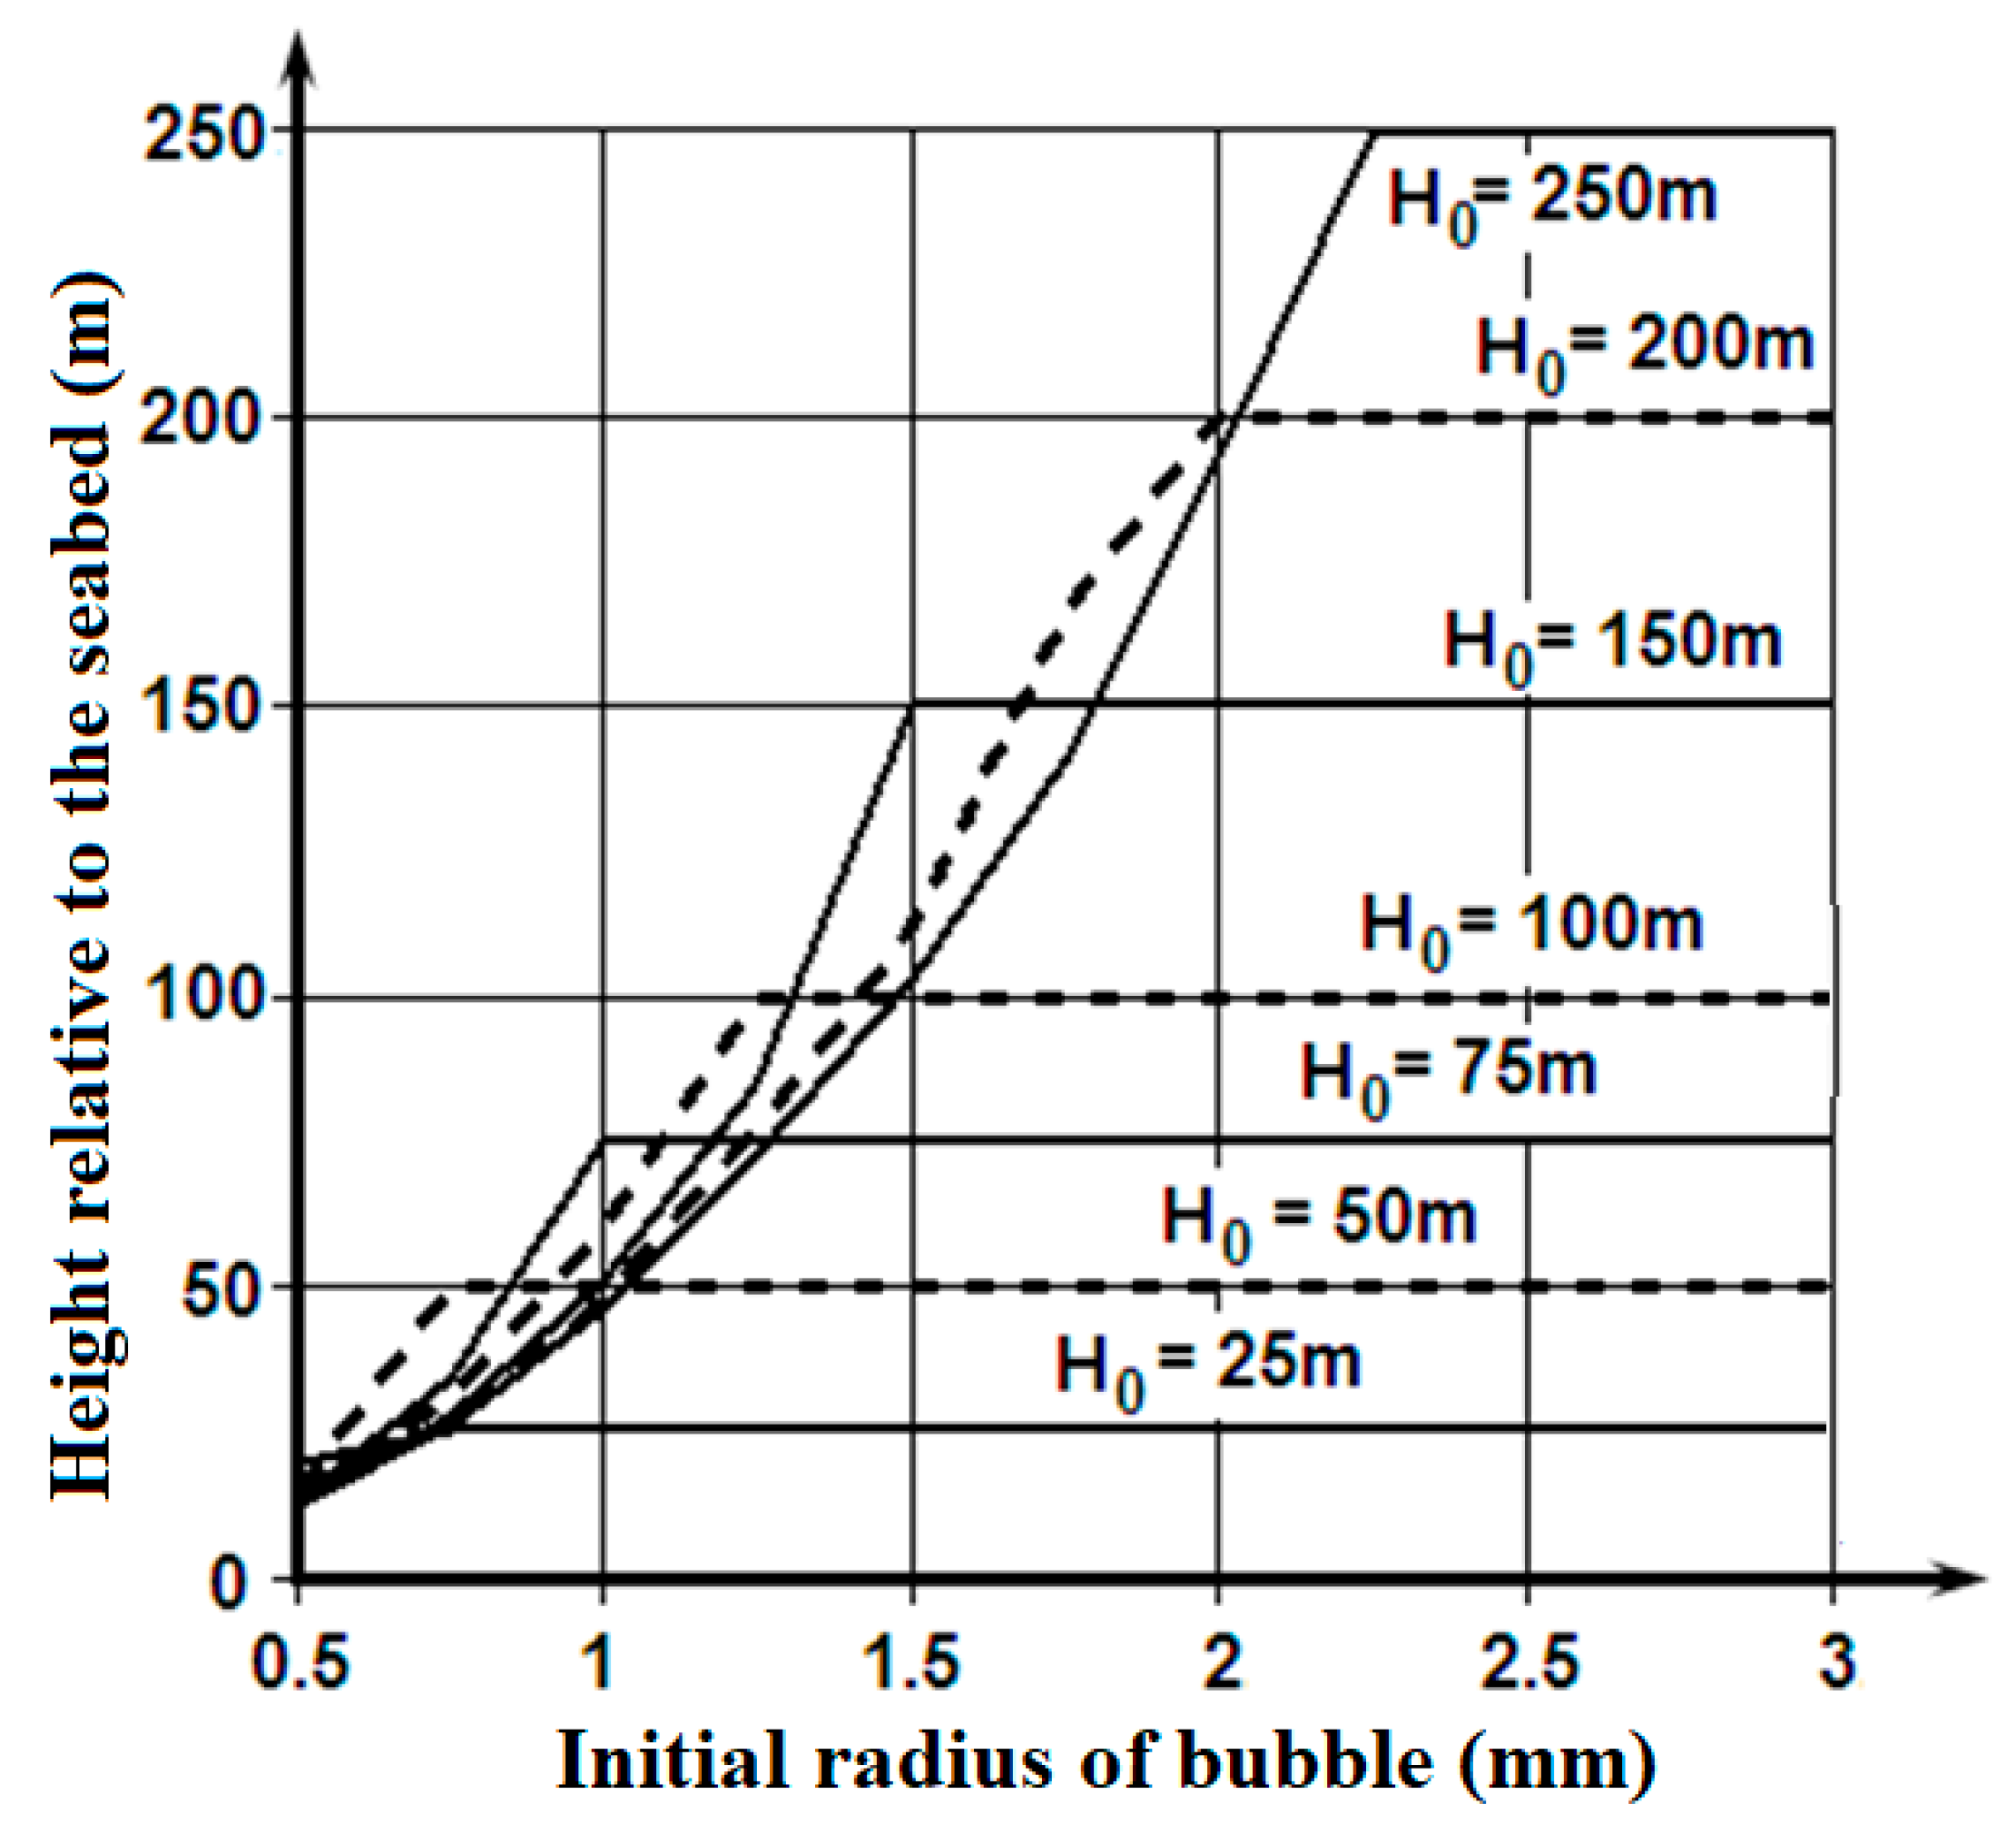
Figure 5 shows the ranges of depths, from which the bubbles fumed by the bottom sediments or the natural gas deposit, are capable of floating up to the ice cover that are not dissolved completely.
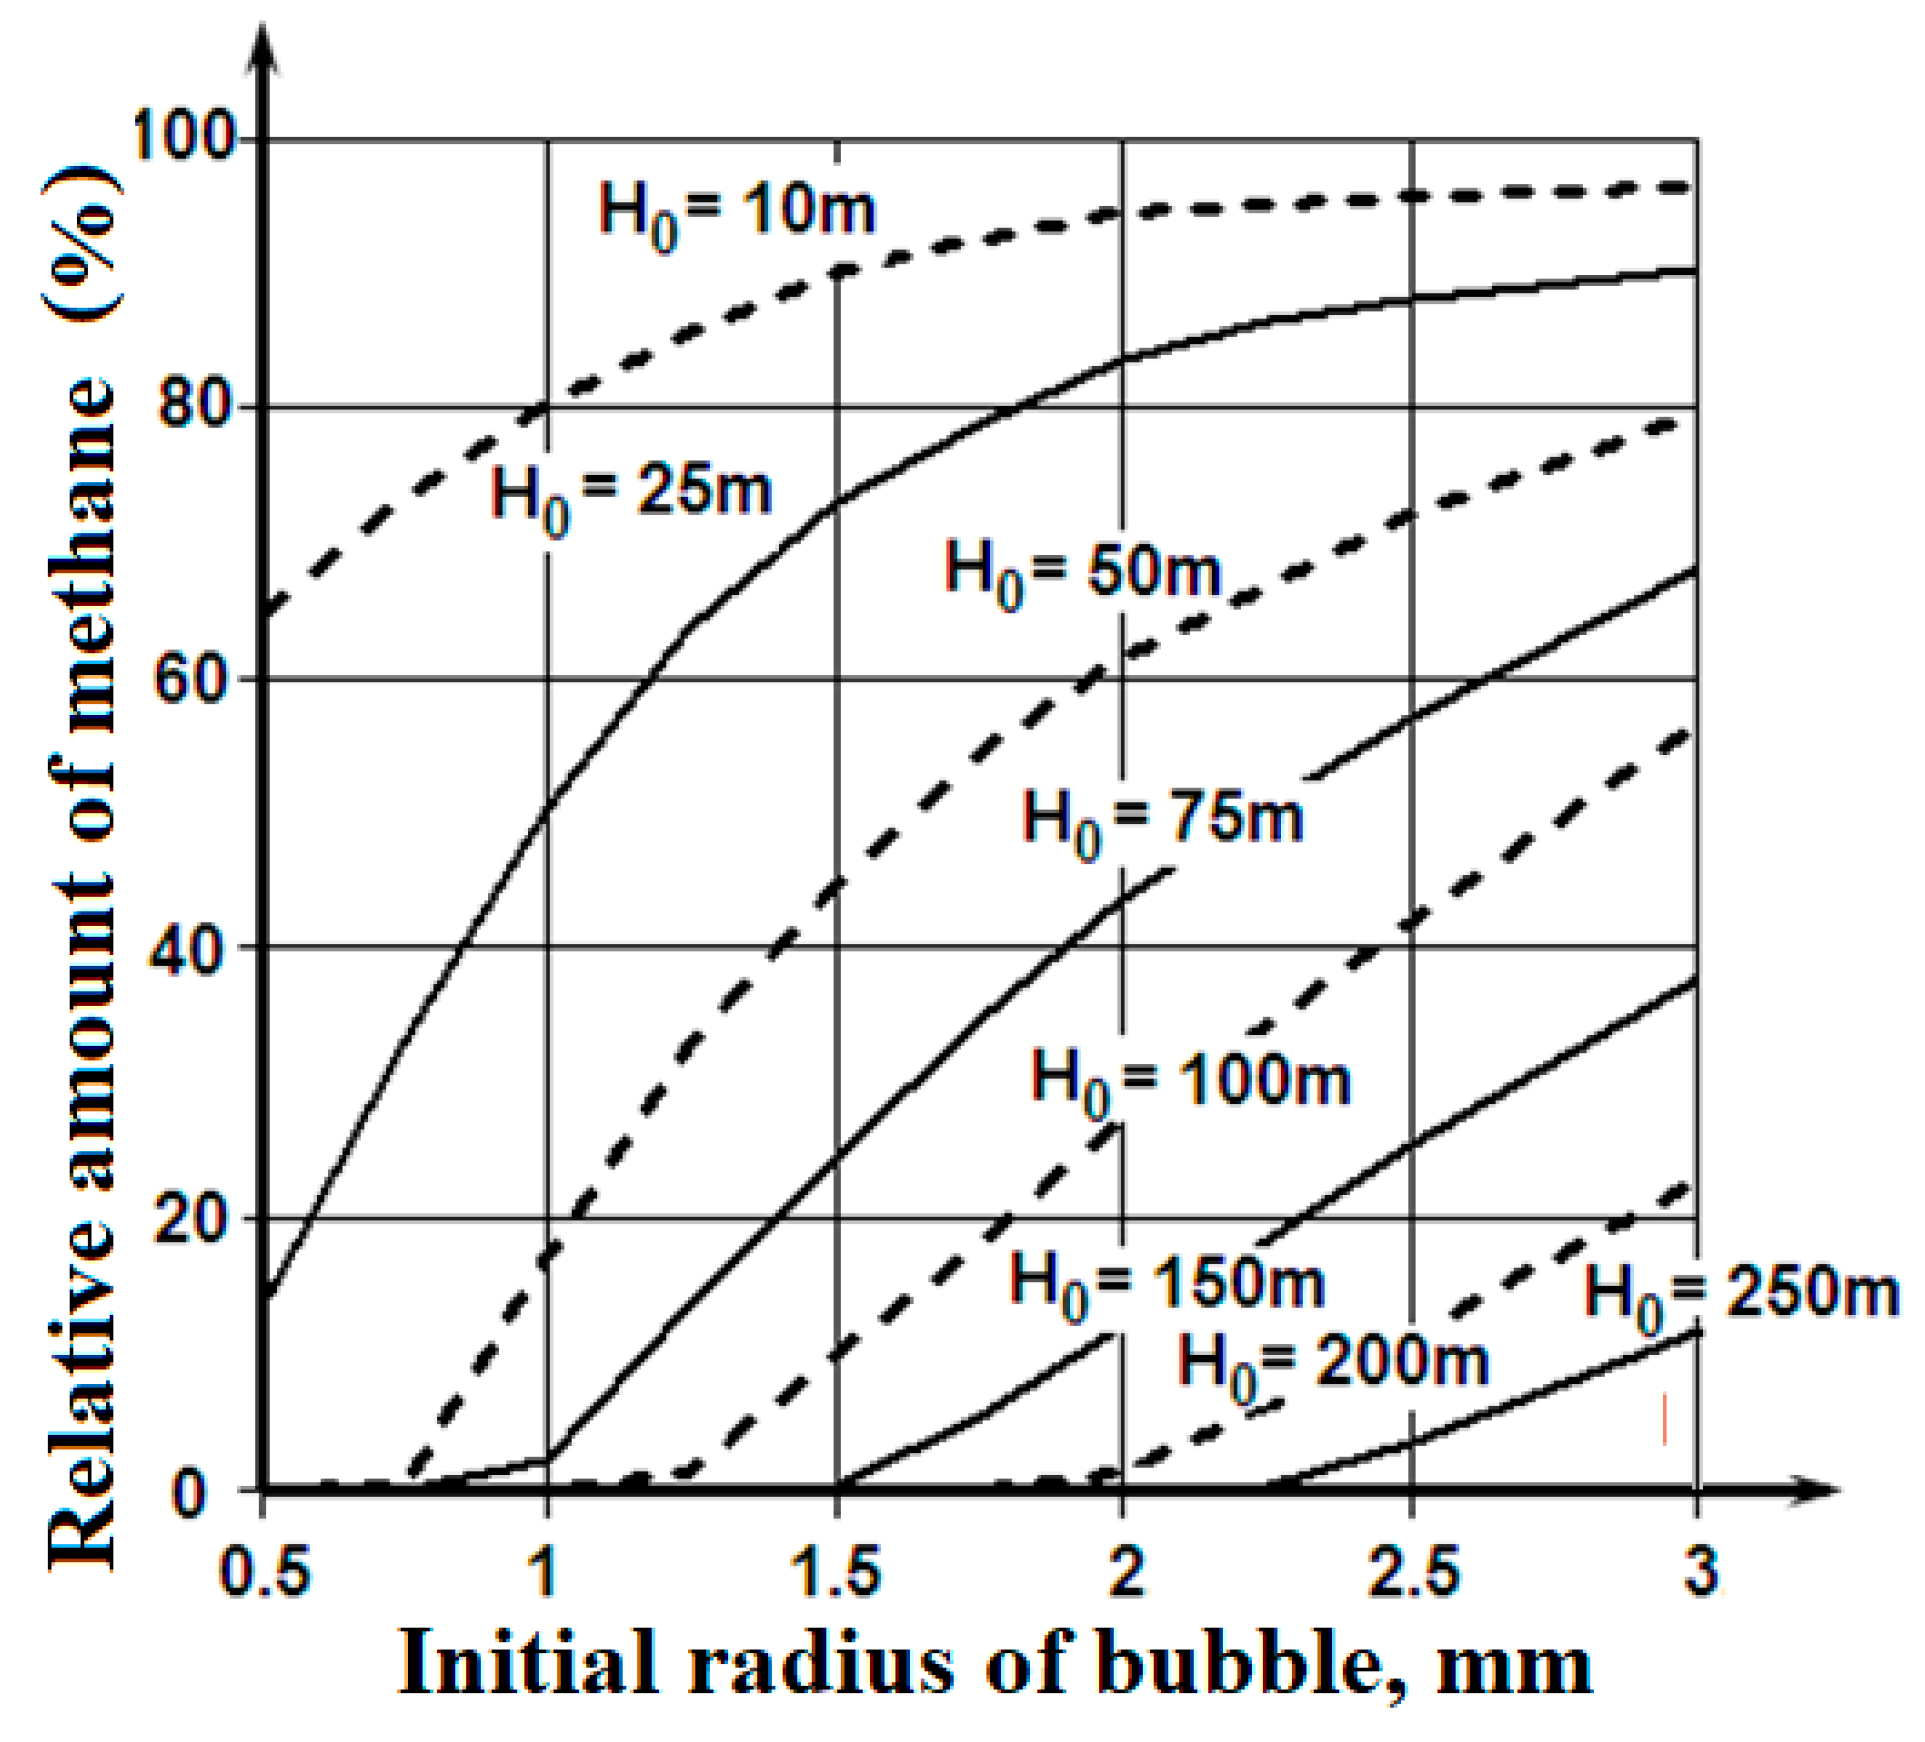
Figure 6 illustrates the amount of methane that the emerged bubbles are capable of carrying to the lower surface of the ice cover.
These materials show the bubbles fumed by the seabed sediments or the natural gas deposit at depths of 100 - 150 m and filled with methane with an initial radius of more than 1.5 mm are capable of really increasing the porosity on the lower surface of the ice cover. It is a possible explanation of the lower layer of the ice cover porosity, which exceeds values that are connected with the replacement of the gases dissolved in the seawater between the ice crystals.
The considered mechanism can be real also for the deep-water sources of the bubbles containing methane, which form plumes on the marine natural gas fields. In this case, there is the consecutive transformation during the gas bubbles floating up process: the bubble with methane – the globule of crystalline hydrate of methane – the bubble with methane [
14]. Disintegration of the crystalline hydrate of methane globules formation of the usual bubbles can occur at depths of 200 - 150 m. The following process of the gas bubble floating up is similar to the one modelled previously and the results on
Figure 5 and
Figure 6 are applicable for it.
6. Conclusion
The problem of sea ice saturation with gas bubbles has a practical value as the porosity defines the strength of the ice cover. Studies of the mechanisms of the porosity formation process will allow us to predict the strength characteristics of sea ice cover that will be based on the place of its formation. It would be very interesting to see experiments in laboratory based on the special variation air access to the ice samples during freezing.
Research carried out has shown that a porosity increase on the lower border of an ice cover can be the consequence of the capture of the bubbles containing methane formed aa result of decomposition of seabed sediments, or leaks of methane from marine natural gas deposits. It allows us to expect that ice cover formed in the shallow water areas would have a lesser strength than ice with the same thickness in the deep-water areas. On the other hand, the increased porosity or the concentration of methane in the lower layer of the ice cover can specify the probable existence of seabed deposits of natural gas in the given water area.
The diversity in the shape of the gas cavities in the sea ice indicates that their formation is the result of various physical mechanisms. The study of these mechanisms is of scientific interest and can be used in practical applications. The article discusses the most obvious three mechanisms that are associated with the shape of the gas cavities and with the interaction of the sea ice with the atmosphere and the underlying seawater space. This does not exclude the possibility of the existence of other mechanisms, the search and study of which is the task of further research into the physics of sea ice.
References
- Frolova, I.V.; Gavrilo, V.P. (eds) Sea Ice. Reference book. Gidrometeoizdat. Saint Petersburg. Russia. 1997. p 402.
- Mohammed E. Shork, Nirmal. K. Snha. Arctic Sea Ice Microstructure Observation Relevant to Microwave Scattering. Arctic. 1994. No 3. page 265 – 279. [CrossRef]
- Wang, Q., Lu, P., Leppäranta, M., Cheng, B., Zhang, G., Li, Z. Physical properties of summer sea ice in the Pacific sector of the Arctic during 2008–2018. Journal of Geophysical Research: Oceans, 2020. Vol 125. [CrossRef]
- Mellor, M. Mechanical behavior of sea ice. In Untersteiner, N. (eds) The Geophysics of Sea Ice. NATO ASI Series. Springer. Boston. USA.1986. pp 165-281. [CrossRef]
- Tucker, W.B.; Perovich, D.K.; Gow, A.J.; Weeks W.F.; Drinkwater, M.R. Physical Properties of Sea Ice relevant to Remote Sensing. Microwave remote Sensing of Sea Ice. Geophysical Monograph 68, American Geophysical Union. USA. 1992. page 9 – 28.
- Malinka, A.; Zege, E.; Heygster, G.; Istomina, E. Reflective properties of white sea ice and snow. The Cryosphere. 2016. Vol 10. page 2541–2557. [CrossRef]
- Goncharov, V.K.; Klementieva, N.Yu.; Qin, J. Analysis of the problem of saturation of ice with air bubbles. In Proceedings of the 21st International Conference on Port and Ocean Engineering under Arctic Conditions (POAC 2011), Montreal, Canada, July 10 – 14. 2011. Paper No 013. p 10.
- Light, B.; Maykut, G.A.; Grenfell, T.C. Effects of temperature on the microstructure of first--year Arctic sea ice. Journal of geophysical research. 2003. Vol. 108 (C2). 3051. p 16. [CrossRef]
- Zhang, Y.; Li, Z.; Xiu, Y.; Li, C.; Zhang, B.; Deng, Y. Microstructural Characteristics of Frazil Particles and the Physical Properties of Frazil Ice in the Yellow River, China. Crystals. 2021, Vol 11, 617. [CrossRef]
- Horne B.A. Marine Chemistry. The structure of Water and the Chemistry of the Hydrosphere. Wiley – Interscience. 1970. p 198.
- Maeno, N. 1988. Science about Ice. Mir. Moscow. SU. 1998. p 231.
- Popov, N.I.; Fedorov, K.N.; Orlov, V.M. 1979. Sea Water. Reference book. Nauka. Moscow. SU. 1979. p 328.
- Goncharov, V.K. Investigation into bubble contents in the upper ocean from their cavitation manifestation Marine n water flow: Analytical treatment of results. Oceanology. 1997. Vol. 37. No 4. page 465–471.
- Goncharov, V.K. Modelling of evolution of the bubble plumes arising under leaks of natural gas from deep-water pipeline. In Proceeding of the Twenty-fifth Arctic and Marine Oil Spill Program (AMOP). Technical Seminar. Calgary. Canada. 2002. Vol. I. pp 45–56.
- Andersen, D.L. A model for determining sea ice properties. Arctic Sea Ice. In Proceedings of the Conference conducted by the Division of Earth Sciences and supported by the Office of Naval Research. Easton, Maryland. USA. 1958. pp 148–152.
- Nakawo, M. Measurement on air porosity of sea ice. Annals of Glaciology. 1983. No 4, page 204–208.
- Gavrilo, V. P.; Gaitskhoki, B. Y. The statistics of air inclusions in ice. In: The Physics of Ice. Eited by: Bogorodskii, V. V. Isr. Program for Sci. Transl. Jerusalem. Israel. 1970. pp 125– 128.
- Backstrom, L.G.E.; Eicken, H. Capacitance probe measurements of brine volume and bulk salinity in first-year sea ice. Cold Regions Science and Technology. 2006. No 46, page 167 -180. [CrossRef]
- Akulichev, V.A.; Bulanov, V.A.; Klenin S.S. Acoustical probing of the gas bubbles in the sea space. Akusticheskii zhurnal. 1986. Vol. 32. No 3. page 289–295.
- Newman, J.N. Marine hydrodynamics. 40th Anniversary edition. The MIT Press. Cambridge, London. England. 2017. p 450.
- Merewether, R.; Olsson, M.S. Acoustically detected hydrocarbon plumes rising from 2-km depths in Guaymes Basin, Gulf of California. Journal of Geophysical Research. 1985. Vol 90. No B4. page 3075-3085.
- Anikiev, V.V.; Obszhirov, A.I. Influence of low temperature hydroterms on the gas composition of the bottom water in the Okhotsk Sea”. Oceanologia. 1993. Vol 33. No 3. Page 360–366.
- Goncharov, V.K.; Klementieva, N.Yu. Modelling the dynamics and conditions of sound scattering by gas bubbles floating up from deep water oil and gas deposits. Acoustical Physics, 1996. 42. No 3. Page 323-328.
- Sovga, E.E.; Lyubartseva, S.P.; Lyubitsky, A.A. Investigation of methane biogeochemistry and mechanisms of its transport in the Black Sea. Morskoi gidrophisicheskii zhurnal. 2008. 5. Page 40-56.
- Goncharov, V.K., Klementieva, N.Yu. Investigation of surfactant film influence on solution of a moving bubble in sea water. Izvestya Rossiiskoi Akademii Nauk. Physika atmosphery i okeana. 1995. 31. No 5. Page 705 – 712.
|
Disclaimer/Publisher’s Note: The statements, opinions and data contained in all publications are solely those of the individual author(s) and contributor(s) and not of MDPI and/or the editor(s). MDPI and/or the editor(s) disclaim responsibility for any injury to people or property resulting from any ideas, methods, instructions or products referred to in the content. |
© 2024 by the authors. Licensee MDPI, Basel, Switzerland. This article is an open access article distributed under the terms and conditions of the Creative Commons Attribution (CC BY) license (http://creativecommons.org/licenses/by/4.0/).
