Submitted:
25 June 2024
Posted:
27 June 2024
You are already at the latest version
Abstract
According to many research groups, high glucose induces over production of superoxide anions, and reactive oxygen species (ROS) in general is the link between high glucose levels and the toxicities seen at cellular levels. Respiratory complex anomalies could lead to the production of ROS. Calcium [Ca2+], at physiological levels serves as a second messenger in many physiological functions. Accordingly, mitochondrial calcium [Ca2+]m overload leads to ROS production which could be lethal to the mitochondria through various mechanisms. The F1F0-ATPase (ATP syn-thase or complex V) is the enzyme that is responsible for catalyzing the final step of oxidative phosphorylation. It does so by coupling the translocation of protons in the mitochondrial in-termembrane space and shuttling them to the mitochondrial matrix for ATP synthesis to take place. Mitochondrial complex V T8993G mutation specifically blocks the translocation of protons across the intermembrane space thereby blocking ATP synthesis leading to Neuropathy, Ataxia and Retinitis Pigmentosa Syndromes (NARP). This study seeks to explore the possibility of [Ca2+]m overload mediating the pathological roles of high glucose in defective respiratory chain mediated mitochondrial stress. The NARP cybrids are the in vitro experimental models for the cells with F1FO-ATPase defects, these cells harbor 98% of mtDNA T8993G mutation. Their coun-terparts 143B osteosarcoma cell lines are the parental cell lines used for comparisons. We uncov-ered that, NARP cells mediated and enhanced the death of the cells (apoptosis) when incubated with hydrogen peroxide (H2O2) and high glucose respectively as depicted by the MTT assay of cell viability. Furthermore, using the fluorescence probe-coupled laser scanning confocal imag-ing microscopy, NARP cells significantly enabled mitochondrial reactive oxygen species (mROS) formation and enhanced the depolarization of the mitochondrial membrane potential (ΔΨm). Elucidating the mechanisms of sugar enhanced toxicity on mitochondria would help in the fu-ture to alleviate the symptoms of patients associated with (NARP) syndromes.
Keywords:
mitochondrial permeability transition pore (MPTP)
; high glucose toxicity
; oxidative stress
; mROS
; cardiolipin
; mitochondrial DNA (mtDNA)
; mitochondrial calcium stress [Ca2+]m
; complex v
1. Introduction
Mitochondria are ancient endomembrane organelles found in eukaryotic cells that have the ability to be a driving force in evolution, producing ATP through respiration. Inducing mutations in either the nuclear or mitochondrial DNA genes encoding proteins required for aerobic ATP production leads to a variety of human mitochondrial diseases irrespective of the organ. Complications that develop in diabetes mellitus affecting the vascular and multiorgan systems are causally and highly associated with overproduction of reactive oxygen species (ROS) induced by hyperglycemia [1,2,3]. Additionally, the critically ill patients often depict levels of glucose in the blood and this aggravates the multiorgan injuries [4]. High glucose conditions induce the metabolic substrate entry into the mitochondria and this weakens the electron transport system culminating in the over production of ROS [1]. A deficiency of mitochondrial protein synthesis was observed in the drosophila mutant tko25t characterized by respiratory and oxidative phosphorylation defects leading to developmental delay as well as being sensitive to seizures by mechanical stress. It was uncovered that the mutant effects are aggravated by high dietary sugar intake levels in dose dependent fashion. Series of metabolic abnormalities have also been found out as a result of high sugar intake diets and some of the lethal effects include decreased NADPH and ATP productions and an increase in the levels of lactate and pyruvate [5]. Glycation of extracellular proteins ensue when there is an abnormally high concentration of glucose such as in the case of diabetic hyperglycemia [12]. Under high glucose conditions, there is an abnormally high concentration of glucose in the neurons because absorption of glucose by neurons is insulin independent. Under such instances, glucose is oxidized to form reactive carbonyls and ROS, ultimately activating MAP kinases and this has effects on the phenotype of the cells [13]. Calcium (Ca2+) plays a critical role in mediating many important biological functions and has been implicated as an intracellular regulatory factor in many physiological and pathological processes in the cell. A disruption of intracellular Ca2+ homeostasis is frequently associated with the early development of cell injury. Research has established pathological mechanisms by which intracellular Ca2+ overload triggers either necrotic or apoptotic cell death. From studies on different tissues in a variety of pathological conditions a general consensus emerges on the role of mitochondrial Ca2+ overload as a pivotal link between cellular alterations and mitochondrial dysfunction [19]. Mitochondrial Ca2+ uptake is driven by mitochondrial membrane potential (∆Ψm) [20]. Under conditions of oxidative stress, mitochondrial Ca2+ cycling can reach critical levels, leading to increased energy expenditure and a dramatic fall in ∆Ψm. Recent work has shown that a fall in mitochondrial ∆Ψm is an early event in apoptosis [21]. Researchers presume the dependence of mitochondrial Ca2+ uptake on the membrane potential and the intracellular distribution of the organelle, both of which may be altered in mitochondrial diseases [22]. Mitochondrial Permeability Transition (MPT) is the key switch to turn on cell apoptotic pathway. The MPT pore is a mega channel complex that contains an adenine nucleotide translocase (ANT), cyclophilin-D (CyP-D) and a voltage-dependent anion channel (VDAC). The complexity of the pore structure demonstrates how MPT can act as multiple sensors for various cellular messages originated from both intra as well as extra mitochondrial environment including Ca2+ overload, membrane potential depolarization, oxidative pressure, as well as receptors connected cellular signals [23]. The channel complex opening occurs as a result of the binding of CyP-D to ANT in the inner mitochondrial membrane. CyP-D binding enhances the ability of the ANT to undergo a conformational change triggered by Ca2+. Binding of ADP or ATP to a matrix site of the ANT antagonizes this effect of Ca2+. Modification of other ANT thiol groups inhibits ADP binding and sensitizes the MPT to Ca2+ [24]. Increased membrane potential changes the ANT conformation to enhance ATP binding and hence inhibit the MPT [25]. In isolated mitochondria, opening of MPT pore leads to collapse of the electrochemical gradient of H+ i.e. causing mitochondrial membrane potential depolarization, thereby, annihilates the driving force needed for ATP production and triggers the production of ROS. Moreover, the pore opening also releases several apoptotic proteins, such as cytochrome c, apoptosis inducing factors (AIF), and procaspase-9, and turns on cellular apoptotic cascades that eventually lead the cell to the 'point of no return' journey of apoptotic pathway. The MPT is regulated by a variety of cellular physiological and pathological effectors such as mitochondrial Ca2+ overload transients, oxidative stress, and depolarization of mitochondrial membrane potential in the concentration of polyamines [26]. The voltage and Ca2+ threshold at which MTP pore opening occurs are modulated by a variety of agents and conditions [27]. Cyclosporin A and its non-immunosuppressive analogue N methyl-Val-4 cyclosporin A (PKF220-384) both inhibit opening and prevent the translocation of cyclophilin D from the matrix to the membranes of cortical mitochondria [28]. Although existence of transient or flicker opening of MPT has long been debated from different aspects, using isolated mitochondria, MPT pore flicker has recently been elegantly demonstrated. Mitochondria immobilized on coverslips were imaged using tetramethylrhodamine methyl ester as membrane-potential indicator; pore opening was triggered by the generation of mROS on photodecomposition of the indicator. Pore flicker was apparent as a transient depolarization inhibited by Cyclosporin A. This phenomenon has been suggested as a protective mechanism against mitochondrial Ca2+ overload and mitochondrial membrane potential depolarization [29]. It is not uncommon to find a decrease of mitochondrial functions in neurodegenerative diseases, this is critical as far as mitochondrial biology is concerned, but the molecular basis to confirm this is elusive. The human mtDNA is a double membrane circular molecule of 16,569 bp and it critically encodes 13 polypeptides of the mitochondrial respiratory chain for oxidative phosphorylation, 22 tRNAs and two small and large subunits of rRNA for protein synthesis [24]. The F1F0-ATPase (ATP synthase or complex V) is the enzyme that is responsible for catalyzing the final step of oxidative phosphorylation. It does so by coupling the translocation of the protons that are in the intermembrane space and shuttling them to the mitochondrial matrix for ATP synthesis to take place. In the mammals, the ATP synthase structure consists of a soluble portion denoted F1 in which catalyzing ATP synthesis takes place. It also has the F0 portion that is found embedded in the inner membrane of mitochondria and serves as a proton channel. Proton shuttling in the F0 takes place at the interface between ATP6 subunit and the C-ring, enhances conformational changes or modifications that are transmitted to the F1 portion, hence providing energy for the synthesis of ATP via rotation of the stalk [30]. Mitochondrial DNA (mtDNA) encoded ATP6 subunit mutations cause complex disorders with varying and heterogeneous expressions as well as severity, this ranges from adult onset Neurogenic Muscle Weakness, Ataxia and Retinitis Pigmentosa (NARP) syndrome to a fatal infantile subacute necrotizing encephalomyelopathy, a maternally inherited form of Leigh Syndrome (MILS). The most frequent and first mutation that is associated with NARP/MILS is the ATP6 mutation (T8993G) which results in the substitution of a highly conserved amino acid leucine to arginine (L156R) [31]. NARP cybrids can be established when human osteosarcoma 143B cells are depleted and gotten rid of the mtDNA by exposing the cells to ethidium bromide and obtain a cell line that is devoid of mtDNA (ρº rho) cells. Human skin fibroblasts that are obtained from a patient that is clinically confirmed to have NARP syndrome are enucleated and fused with the ρº cells to create a 98% mutant type (NARP) cybrids [32]. The effects of high glucose toxicity on NARP cells has not been explored. Our research group hereby hypothesized that mitochondrial calcium [Ca2+]m overload modulates high glucose toxicity on respiratory chain defects in NARP cells. The ultimate aim of this research is to investigate how mitochondrial calcium [Ca2+]m overload in tandem with oxidative stress modulate high glucose toxicity on respiratory chain defect-augmented mitochondrial reactive oxygen species (ROS) production, membrane potential (ΔΨ) depolarization, cardiolipin (CL) remodeling, calcium (mCa2+) homeostasis and mitochondrial permeability transition pore (MPTP) including transient (t-MPT) and permanent-MPT (p-MPT).
2. Materials and Methods
2.1. The NARP Cells (Cybrids) and Parental 143B Cells
Both the NARP cybrids and 143B cells described above were kindly provided by our collaborator in the person of Dr. Tanaka from Japan. The cells had been used in other previous studies by our group. The NARP cybrids and rho zero (ρ°) cells are maintained in Dulbecco’s modified Eagle’s medium (DMEM) containing 10% fetal bovine serum supplemented with high glucose (4.5 g/L), pyruvate (0.11 mg/mL), and uridine (0.1 mg/mL). NARP cybrids with a high mutant mtDNA to wildtype mtDNA ratio of approximately 98% are used for experiments, and comparisons made with the parental Osteosarcoma 143B cell line.
2.2. Measurement of Cell Viability Using the MTT Assay
From a hydrogen peroxide stock solution of 10M, we diluted to the working concentrations of 1mM, 10mM, 20mM, 50mM and 100mM. We then exposed the cells to varying stress conditions of hydrogen peroxide at 1mM, 10mM, 20mM, 50mM and 100mM respectively for 30 mins at room temperature, then cleaned with HEPES and incubated the cells with MTT solutions for 40 mins at 37℃ then measured the cell viability using the elisa plate reader. Cell viability is detected by using the colorimetric 3-(4,5dimethyl-2 thiazolyl)-2,5-diphenyl-2 Htetrazolium bromide (MTT) assay. The activity of the mitochondrial reductase to convert a soluble tetrazolium salt into an insoluble formazan precipitate is measured using an enzymelinked immunoabsorbent assay (ELISA) reader (A-5082; TECAN, Grödig/Salzburg, Austria). The MTT assay is performed 30mins after stress exposure (for hydrogen peroxide) and 48-72hrs of high glucose exposure. The activity of the mitochondrial reductase calculated as the amount of MTT dye conversion in treated cells relative to that of sham-treated control cells.
2.3. Preparation of the Cells for Imaging
For imaging detection, cells will be grown in medium consisting of DMEM containing 10% fetal bovine serum supplemented with glucose (4.5 g/L), pyruvate (0.11 mg/mL), and uridine (0.1mg/mL). All cells would be plated onto #1 glass cover slips for fluorescent microscopy.
2.4. Chemical and Fluorescent Dye Loading for Fluorescence Measurement of Mitochondrial Events
Loading conditions for each specific fluorescent probe are described as follows: ΔΨm would be detected using 200 nM tetramethylrhodamine methyl ester (TMRM); and mCa2+ as well using 2 µM Rhod-2 AM (Rhod-2); ROS would be detected using 2 µM 6 carboxy2',7'dichlorodihydrofluorescein diacetate (DCFH-DA); nitric oxide (NO) using 5 µM 4 amino-5-methylamino-2',7'difluorofluorescein diacetate (DAF-FM); and cardiolipin using 80 nM nonylacridine orange (NAO). All fluorescent probes need to be loaded at RT for 30 min except TMRM, which should be loaded for 10 min to prevent quenching. After loading, cells would be rinsed 3 times with HEPES-buffered saline solution (containing 140 mM NaCl, 5.4 mM KCl, 1.8 mM CaCl2, 0.8 mM MgCl, 10 mM glucose, 10 mM HEPES; pH7.4). Dye-loaded cells would then be mounted on a cell chamber for conventional or laser-coupled imaging microscopic observation.
2.5. Imaging Analysis of Living Cells
Confocal fluorescence images and image stacks in our lab are collected using a Zeiss LSM 510 META NLO mounted on an Axiovert 200 M inverted microscope (Carl Zeiss Microimaging, Inc., Thornwood, NY). All fluorescence images should be collected using a Zeiss objective lens (Plan-Apochromat 100X, NA1.4 oil DIC M27). NAO gets excited using the Argon/2 laser (30mW) for excitation. The excitation wavelength is 488 nm, the main dichroic beam splitter is 488/561 nm, and the emission detection filter is band pass 500–550 nm. All images are to be processed and analyzed using MetaMorph software (Universal Imaging Corp., West Chester, PA,USA). Intensity levels would be analyzed from the original images and graphed using Microsoft Excel software and Photoshop. For analyzing mROS and mitochondrial NO (mNO) fluorescent intensity, we would select and measure the regions overlapping with DCFH-DA (to measure ROS) and TMRM (to measure ΔΨm) signals, DAF-FM (to measure NO) and TMRM signals, respectively. Therefore, we shall be able to make sure that the regions we analyze are indeed mitochondrial regions.
2.6. Statistical Analysis
Data are represented as the means ± standard error (SE) of at least three independent experiments. We used paired t. tests between the groups where p. value of < 0.05 is considered significant (*).
3. Results
3.1. Assessing Cell Viability under Different Stress Conditions
From a hydrogen peroxide stock solution of 10M, we diluted to the working concentrations of 1mM, 10mM, 20mM, 50mM and 100mM. We then exposed the cells to varying stress conditions of hydrogen peroxide at 1mM, 10mM, 20mM, 50mM and 100mM respectively for 30 mins at room temperature, then cleaned with HEPES and incubated the cells with MTT solutions for 40 mins at 37℃ then measured the cell viability using the elisa plate reader. As expected, the NARP cybrids exhibited significant cell toxicity as compared to the normal parental control 143B cells (Figure 1A). Furthermore, we tested and treated the cells with glucose at varying concentrations of 25mM (control), 50mM and 75mM. The cells have been exposed for 48hrs, then we determined the cell viability by MTT assay. Again as expected, dose dependent toxicities of glucose on the cells have been observed and significantly more toxicities being demonstrated in the NARP cells as compared to the parental 143B cells (Figure 1B).
3.2. Determining the Toxicities of High Glucose and Mitochondrial Calcium (Ca2+)m Overload on 143B Cells and NARP Cybrids
In determining the toxicities, both the 143B cells and NARP cybrids have been prepared and incubated overnight with either low glucose (25mM) with or without Ca2+ or high glucose (75mM) with or without Ca2+. To induce oxidative stress, we mounted the cells on Zeiss LSM 510 META NLO confocal microscope using 561nm lens. The lens is focused on the cells at different regions namely the irradiation region (IR) regions, near IR regions and Far from the IR regions. The images are then taken and analyzed. The images for both glucose concentrations at ‘Near the IR regions’ and ‘far from IR regions’ in the presence or absence of Ca2+, to determine the effects or toxicities on membrane potential depolarization levels measured by TMRM (red) stain levels and oxidative stress levels as measured by DCF (green) stain levels. As expected the NARP cybrids depolarized faster with corresponding rises in DCF levels under Ca2+ treated conditions at both ‘Near IR’ and ‘Far from IR’ regions. Unsurprisingly, NARP cybrids significantly induced membrane potential depolarization and higher DCF levels compared to the parental 143B cells (Figure 2A, 2B, 2C and 2D).
3.3. Depicting How Mitochondrial Calcium Overload [Ca2+]m Modulates High Glucose Toxicity on Respiratory Chain– Defect Augmented Mitochondrial Reactive Oxygen Species (ROS) Production and Membrane Potential (ΔΨ) Depolarization in Parental 143B Cells and NARP Cybrids
In trying to assess how mitochondrial calcium overload [Ca2+]m modulates high glucose toxicity on respiratory chain – defect augmented mitochondrial reactive oxygen species (R.O.S) production and membrane potential (ΔΨ) depolarization, we prepared Hepes solution containing Calcium Chloride (CaCl2) and another one without CaCl2 (Ca2+ free) Hepes. The 143B and NARP cells were incubated with either low glucose (25mM) or high glucose (75mM) glucose for 24 hours. Cells are stained with the fluorophores with either Ca2+ containing Hepes or Ca2+ free Hepes and mounted on the LSM 510 META NLO confocal microscope to observe the effects. The cells are treated in two pairs or groups. 143B cells are treated with either 25mM glucose or 75mM glucose and NARP cells also treated with either 25mM glucose or 75mM glucose. One group is stained in either Ca2+ containing Hepes or Ca2+ free Hepes solution and comparisons are made between the two groups after being irradiated with 561nm laser irradiation to assess the membrane potential depolarization and ROS effects on the two cell types at different concentrations of glucose. The 561nm laser irradiation is pointed at 3 different spots on an individual cell namely irradiation point (IR), near irradiation point (NEAR) and far from the irradiation point (far), analyzed and assess the membrane potential depolarization and ROS formation. Iterations at 561nm laser irradiations start at 20 seconds and ends at 300 seconds. We uncovered that the Ca2+ treated cells for both 143B and NARP cybrids have membrane potential depolarized faster than the Ca2+ free cells with the high glucose treated NARP cells showing the fastest depolarization and highest DCF levels compared to the 143B cells, with the Ca2+ treated cells showing significant levels of toxicity (Figure 3B, 3C and 3D). Mitochondrial ROS (mROS) is detected by the fluorophore DCF (green) and membrane potential depolarization is detected by the TMRM (red) fluorophore as shown in Figure 3 below.
3.4. Depicting How Mitochondrial Calcium Overload [Ca2+]m Modulates High Glucose Toxicity on Respiratory Chain – Defect Augmented Mitochondrial Reactive Oxygen Species (ROS) Production and Membrane Potential (ΔΨ) Depolarization in Parental 143B Cells and NARP Cybrids under Antioxidant Conditions
In Figure 2 and Figure 3 above, we have demonstrated that calcium contributes to the toxicities observed notably under high glucose conditions. Hence we then tried to depict how mitochondrial calcium overload [Ca2+]m modulates high glucose toxicity on respiratory chain – defect augmented mitochondrial reactive oxygen species (ROS) production and membrane potential (ΔΨ) depolarization in parental 143B cells and NARP cybrids under antioxidant conditions. Mito-quinone (mito-Q) is a potent mitochondria-targeted antioxidant synthesized by covalent attachment of a Coenzyme Q10 (quinone) to a lipophilic triphenylphosphonium cation to allow selective mitochondria targeting for prevention of mitochondrial reactive oxygen species (mROS). Mitochondrial membrane potential (Δψm) allows the cations to accumulate selectively in mitochondria up to 1000 fold compared to non-targeted Coenzyme Q. Once produced, mROS indiscriminately damages mitochondrial components and more importantly they crucially activate directly the mitochondrial permeability transition (MPT), one of the critical mechanisms for initiating post mitochondrial apoptotic signaling (Figure 4 below). No significant depolarization of the mitochondrial membrane potential as well as oxidative stress levels between the Ca2+ treated and Ca2+ free cells have been observed, this could mean that scavenging ROS helps maintain the mitochondrial membrane potential and the production of ROS is critical for Ca2+ to exert toxicity. From (mito-Q) stock solution of 7.36mM, we diluted to the working concentration of 100µM and aliquoted into the 1ml tubes. From the working solution we pipetted 1µl to pretreat the cells in the medium for 30 minutes. Then pipet another 1µl into 1ml of hepes, mix thoroughly and stain the cells together with the dyes, then mount on the confocal microscope for imaging.
3.5. Demonstrating How Mitochondrial Calcium Overload Modulates High Glucose Toxicity on Respiratory Chain Defect Augmented Mitochondrial Cardiolipin (CL) Remodeling and Calcium (Ca2+) Homeostasis in Parental 143B Cells and NARP Cybrids under Ca2+ Treated Hepex Conditions
Cardiolipin (CL) is a unique phospholipid that is found in the inner mitochondrial membranes that gives mitochondria its unique architectural structure and function. According to a clinical and experimental model, a malfunctioning or damaged CL could lead to an abysmal mitochondrial function which might be linked to a host of diseases. The oxidation levels also have a direct link to many disease types including metabolic disorders, neuronal dysfunction as well as cardiomyopathy [40]. We hypothesized that high glucose conditions could overwhelm CL functions and remodeling. From a 10mM NAO stock solution, 1µl is pipetted onto a 1ml hepes solution and stained the cells for 30 minutes to detect CL. From a working solution of 1mM, 1µl is pipetted into a 1ml tube containing hepes to stain the cells for 10 minutes then mount on the confocal microscope for imaging. Comparable levels of CL are detected almost throughout the time lapse recordings upto 600 secs in both 25mM glucose treated 143B cells (Figure 5A) and NARP cells (Figure 5C). Rhod 2 fluorescence intensity levels are also comparable after testing both 143B cells and NARP cells with low glucose (25mM) (Figure 5 A and C). CL levels have been reduced from 100% down to 68% for IR, and 84% for the NEAR and FAR points. However, there is an increase in the Rhod 2 levels for the IR, NEAR and FAR points at 80%, 60% and 45% respectively in parental 143B cells after (75mM glucose) treatments (Figure 5. B). NAO/CL fluorescence intensity levels are lower following testing with high glucose 75mM as the NAO fluorescence intensity levels start to deplete steeply after just 20 secs and mitochondrial calcium (mCa2+) homeostasis levels rise almost double respectively at IR 100%, NEAR 83% and FAR 93% in 143B cells (Figure 5. D). Cardiolipin is detected using 80 nM nonylacridine orange (NAO, green) and mCa2+ as well using 2µM Rhod-2 AM (Rhod-2, red) using 850nm irradiations.
3.6. Investigating How High Glucose Augment Respiratory Chain Defect Augmented Mitochondrial Permeability Transition Pore (MPTP) Including Transient (t-MPT) and Permanent (p-MPT) on Parental 143B Cells and NARP Cybrids
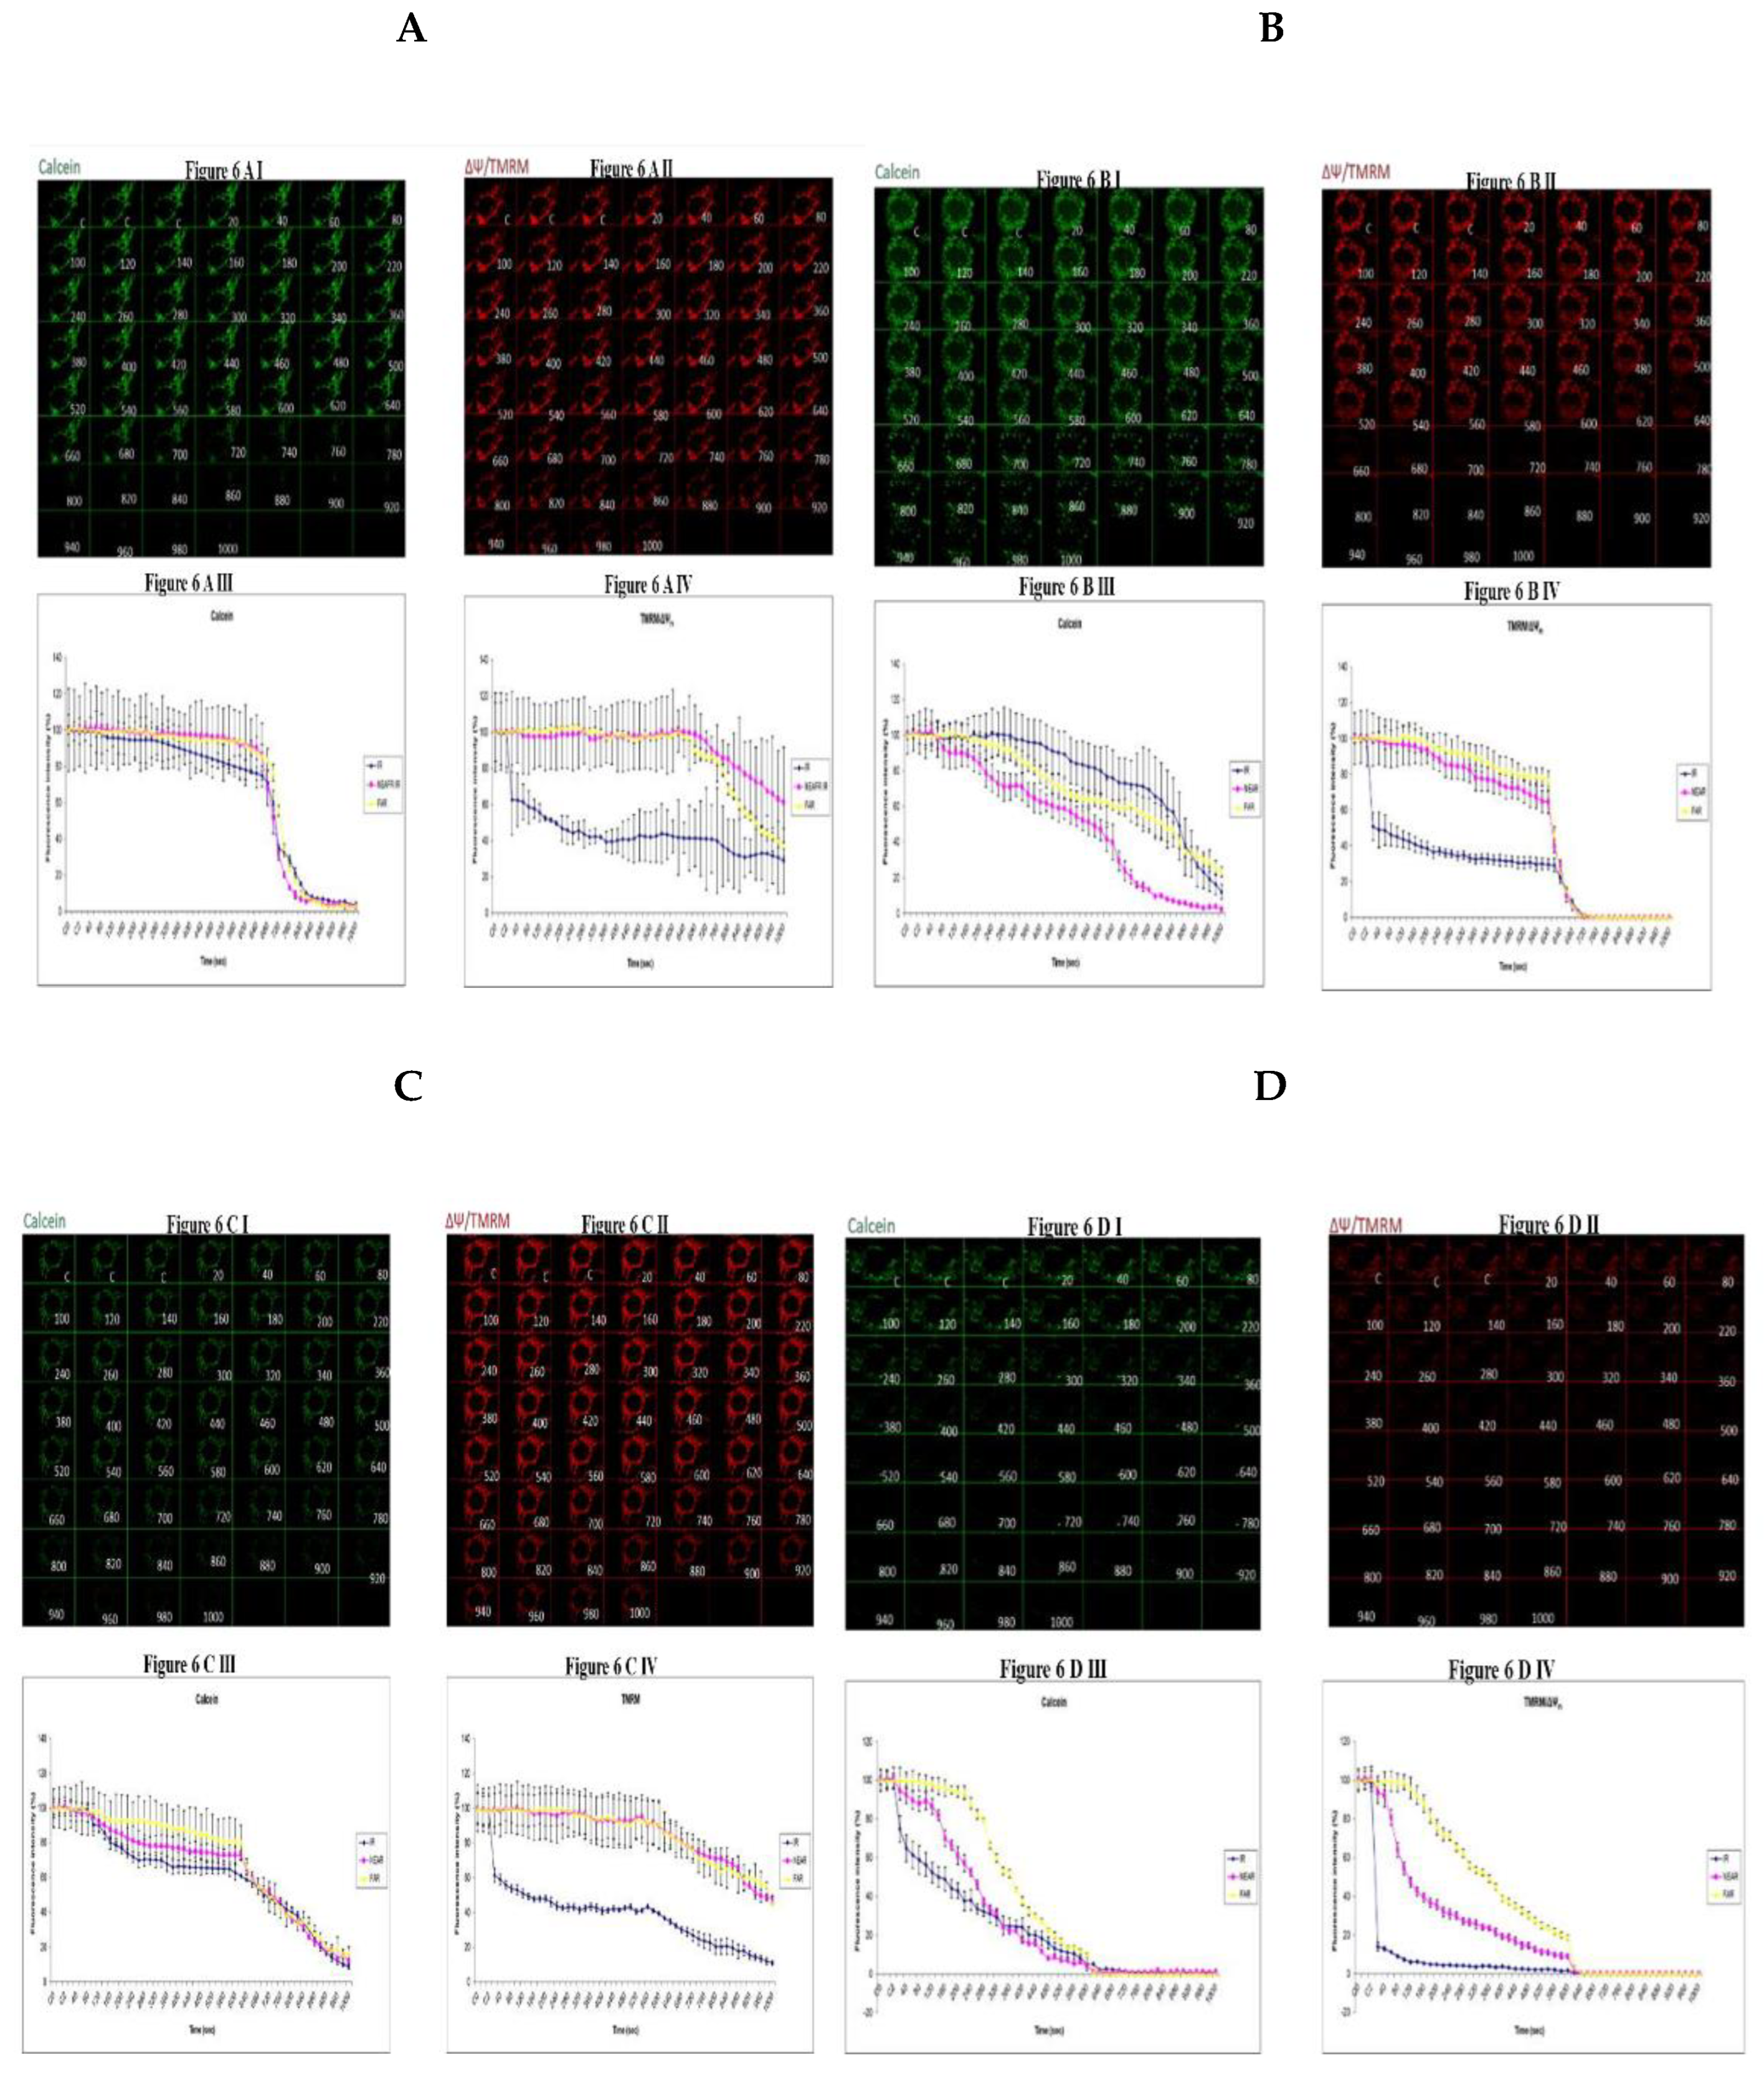
The mitochondrial permeability transition pore is a channel that is composed of voltage dependent anion channels that span the mitochondrial outer membrane. The channel serves the physiological function of sensing environmental oxidative stresses including Ca2+ amongst other ions and compounds. This is achieved through the flickr opening of the pore holes. However, this could overwhelm the cell functions if the pore is continuously or permanently kept opened often leading to apoptosis. In staining for imaging we use 0.7µl CoCl2 and 0.5 µl of calcein and mix in 1ml tube of hepes and stain the slides for 30 minutes. 0.3 µl of TMRM is to be stained for 10 minutes. After that we mount the slides for confocal imaging. Transient (t-MPT) could be detected under low glucose (25mM) conditions in the parental cells 143B cells as can be seen by the depletion of the calcein stains at 720 secs (Figure 6A I) compared to the TMRM stains at the same time point (Figure 6A II) panel. The same trend shows for the fluorescence intensity (FI) levels in the graphs. After 640 secs, Fluorescence Intensity for calcein falls steeply (Figure 6A III) compared to the TMRM fluorescence intensity (Figure 6A IV). Permanent MPT (p-MPT) might have been demonstrated in parental 143B cells under high glucose (75mM) conditions as the TMRM stains start to fade at 620 secs in the time lapse recordings and almost completely fades at 660 secs (Figure 6B II) panel while calcein stains remain continuous in the recordings (Figure 6B I). TMRM fluorescence intensity (FI) falls steeply after 620 seconds (Figure 6B IV) compared to the calcein (Figure 6B III) which continues beyond 620 secs. After testing with (25mM glucose), the calcein stains almost completely fades away after 920 secs (Figure 6C I) compared to the TMRM stains which continue to the end of the time lapse recording (fig. 6C II) albeit fading slightly. Permanent MPT (p-MPT) may have been depicted as the TMRM levels deplete after just 220 secs in the time lapse recordings (Figure 6D II) panel compared to calcein stains (Figure 6D I).
4. Discussion
The F1F0 ATPase (ATP synthase complex V) is the enzyme that is responsible for catalyzing for catalyzing the final committed step of oxidative phosphorylation. It does so by coupling the translocation of protons in the mitochondrial intermembrane space and shuttling them to the mitochondrial matrix for ATP synthesis to take place. Mitochondrial complex V T8993G point mutation specifically blocks the translocation of protons across the intermembrane space thereby blocking ATP synthesis leading to the syndrome of Neuropathy, Ataxia and Retinitis Pigmentosa syndromes (NARP). In line with our hypothesis, we first of all determine the viability of the cells to be used in the experiment to be more confident. As expected, the NARP cells show significantly more dose dependent toxicities under both hydrogen peroxide (H2O2) (Figure 1A) and high glucose conditions (Figure 1B). Then we put into perspective our main hypothesis that Ca2+ mediates glucose toxicity. Both 143B and NARP were used under the same experimental conditions of Ca2+ treatments and Ca2+ free treatments for low and high glucose at ‘near’ irradiation points and ‘far’ from Irradiation points. Treating the cells with Ca2+ induced significant membrane potential depolarization and ROS levels in NARP cybrids compared to Ca2+ free treatments which did not exhibit statistically significant differences (Figure 2). Additionally, we undertook to combine imaging and graphical representation to delineate the effects of mitochondrial Ca2+ overload mediating high glucose toxicity in 143B and NARP cells, consistent with the findings in Figure 2, Ca2+ treatment induced toxicities and faster membrane potential depolarizations in the Ca2+ treated NARP cells, more especially in the high glucose conditions (Figure 3). Since it is reported that ROS is the link between high glucose and the toxicities seen at cellular levels, we sought to scavenge ROS and determine if Ca2+ can independently induce toxicities observed in Figure 3. We used a powerful antioxidant mitoquinone (mitoQ) which is a potent mitochondria targeted antioxidant synthesized by covalent attachment of a coenzyme Q10 (quinone) to a lipophilic triphenylphosphonium cation to allow selective mitochondria targeting for prevention of mitochondrial reactive oxygen species (ROS). By employing this technique, Ca2+ could not independently induce any significant changes in both TMRM and DCF levels in both 143B cells and NARP cells signifying that for Ca2+ to induce any significant toxicities, ROS presence is a critical factor. We have also uncovered that mitochondrial calcium overload leads to the depletion of CL which is an important component of the cell ultrastructure to maintain integrity. We have shown that the higher the glucose levels, the higher the calcium homeostasis and hence an increase in Rhod-2 levels in the NARP cells compared to the 143B cells. Mitochondrial Permeability Transition Pore (MPTP) is a is a part of the normal physiological response or process of the cell whereby chemicals, solutes and compounds can be easily flushed through the channel opening. This is achieved through the transient or flickr opening. In line with our hypothesis that mitochondrial Ca2+ overload could overwhelm this opening and become the permanent opening. In this state the opening becomes permanent and the cell contents get released unchecked and ultimately leads to apoptosis of the cell. Just in line with our hypothesis, we have depicted that mitochondrial Ca2+ overload led to the depletion of the calcein stains much before the TMRM stains under low glucose conditions in both in both 143B and NARP cybrids (Figure 6A and 6C). conversely, we may have detected permanent opening of the pores when the cells were treated with high glucose conditions as evidenced when the TMRM stains deplete well before the calcein stains in both 143B and NARP cells (Figure 6B and 6D).
Conclusion
Based on the data we presented in this research, we have just demonstrated that mitochondrial DNA T8993G mutations (NARP) syndrome induced more toxicities observed in the NARP cells compared to the 143B cells. The high glucose toxicity is modulated by mitochondrial calcium overload (Ca2+) m while the presence of ROS is critical.
Author Contributions
E. D. C. Designed and carried out the research, analyzed the data and write up. M. J. J discussed the initial ideas and preliminary results of the research as well as improving the manuscript. T. I. P discussed the directions and approach of the research as well as the logics and ideologies. All of us agreed to publish the research.
Funding
Thiswork was supported by the grants CMRPD 180491 (to Jou) from the Chang Gung Medical Research Foundation, Taiwan, and NSC 98-2320-B-182-005-MY3 (to Jou), NSC 992314-B-182A-063-MY3, NSC 98-2314-B-182A-077-, NSC 96-2314-B-182A-102-MY2.
Institutional Review Board Statement
Not applicable.
Informed Consent Statement
Not applicable.
Data Availability Statement
Data are contained within the article, also contact corresponding author.
Acknowledgements
The authors thank Dr. Tsung I Peng for his unwavering support throughout the research for his invaluable contributions and suggestions. Additionally, the authors would like to thank the technical support provided by the Microscopy Core Laboratory, Chang Gung Memorial Hospital, Linkou, Taiwan and Microscopy Center at Chang Gung University, Taoyuan, Taiwan.
Conflict of Interest
The authors declare no conflict of interest.
References
- Brownlee, M. , Biochemistry and molecular cell biology of diabetic complications. Nature, 2001. 414(6865): p.813-20. [CrossRef]
- Green, K., M. D. Brand, and M.P. Murphy, Prevention of mitochondrial oxidative damage as a therapeutic strategy in diabetes. Diabetes, 2004. 53 Suppl 1: p. S110-8. [CrossRef]
- Nishikawa, T. , et al., Normalizing mitochondrial superoxide production blocks three pathways of hyperglycaemic damage. Nature, 2000. 404(6779): p. 787-90. [CrossRef]
- Van den Berghe, G. , How does blood glucose control with insulin save lives in intensive care? J Clin Invest, 2004. 114(9): p. 1187-95.
- Kemppainen, E. , et al., Mitochondrial Dysfunction Plus High-Sugar Diet Provokes a Metabolic Crisis That Inhibits Growth. PLoS One, 2016. 11(1): p. e0145836.
- Chen, H. and D.C. Chan, Emerging functions of mammalian mitochondrial fusion and fission. Hum Mol Genet, 2005. 14 Spec No. 2: p. R283-9. [CrossRef]
- Vanhorebeek, I. , et al., Protection of hepatocyte mitochondrial ultrastructure and function by strict blood glucose control with insulin in critically ill patients. Lancet, 2005. 365(9453): p. 53-9. [CrossRef]
- Cai, D. , Neuroinflammation and neurodegeneration in overnutrition-induced diseases. Trends Endocrinol Metab, 2013. 24(1): p. 40-7. [CrossRef]
- Kahn, S.E., M. E. Cooper, and S. Del Prato, Pathophysiology and treatment of type 2 diabetes: perspectives on the past, present, and future. Lancet, 2014. 383(9922): p. 1068-83. [CrossRef]
- Szkudelski, T. , Streptozotocin-nicotinamide-induced diabetes in the rat. Characteristics of the experimental model. Exp Biol Med (Maywood), 2012. 237(5): p. 481-90.
- Somesh, B.P. , et al., Chronic glucolipotoxic conditions in pancreatic islets impair insulin secretion due to dysregulated calcium dynamics, glucose responsiveness and mitochondrial activity. BMC Cell Biol, 2013. 14: p.31. [CrossRef]
- Duchen, M.R. , Mitochondria and calcium: from cell signalling to cell death. J Physiol, 2000. 529 Pt 1: p. 57-68. [CrossRef]
- Tomlinson, D.R. and N.J. Gardiner, Glucose neurotoxicity. Nat Rev Neurosci, 2008. 9(1): p. 36-45. [CrossRef]
- Lamb, C.A., T. Yoshimori, and S.A. Tooze, The autophagosome: origins unknown, biogenesis complex. Nat Rev Mol Cell Biol, 2013. 14(12): p. 759-74. [CrossRef]
- Altshuler-Keylin, S. and S. Kajimura, Mitochondrial homeostasis in adipose tissue remodeling. Sci Signal, 2017.10(468). [CrossRef]
- Liesa, M. and O.S. Shirihai, Mitochondrial dynamics in the regulation of nutrient utilization and energy expenditure. Cell Metab, 2013. 17(4): p. 491-506. [CrossRef]
- Lopez-Otin, C. , et al., The hallmarks of aging. Cell, 2013. 153(6): p. 1194-217.
- Park, J.T. , et al., Adjustment of the lysosomal-mitochondrial axis for control of cellular senescence. Ageing Res Rev, 2018. 47: p. 176-182. [CrossRef]
- Schlame, M., D. Rua, and M.L. Greenberg, The biosynthesis and functional role of cardiolipin. Prog Lipid Res, 2000. 39(3): p. 257-88. [CrossRef]
- Lange, C. , et al., Specific roles of protein-phospholipid interactions in the yeast cytochrome bc1 complex structure. EMBO J, 2001. 20(23): p. 6591-600. [CrossRef]
- Koshkin, V. and M.L. Greenberg, Cardiolipin prevents rate-dependent uncoupling and provides osmotic stability in yeast mitochondria. Biochem J, 2002. 364(Pt 1): p. 317-22. [CrossRef]
- Ott, M. , et al., Cytochrome c release from mitochondria proceeds by a two-step process. Proc Natl Acad Sci U S A, 2002. 99(3): p. 1259-63. [CrossRef]
- Pfeiffer, K. , et al., Cardiolipin stabilizes respiratory chain supercomplexes. J Biol Chem, 2003. 278(52): p. 52873-80. [CrossRef]
- DiMauro, S. and E.A. Schon, Mitochondrial respiratory-chain diseases. N Engl J Med, 2003. 348(26): p. 2656-68. [CrossRef]
- Yu, T., B. S. Jhun, and Y. Yoon, High-glucose stimulation increases reactive oxygen species production through the calcium and mitogen-activated protein kinase-mediated activation of mitochondrial fission. Antioxid Redox Signal, 2011. 14(3): p. 425-37. [CrossRef]
- Baracca, A. , et al., Catalytic activities of mitochondrial ATP synthase in patients with mitochondrial DNA T8993G mutation in the ATPase 6 gene encoding subunit a. J Biol Chem, 2000. 275(6): p. 4177-82. [CrossRef]
- Kim, H.K. and J. Han, Mitochondria-Targeted Antioxidants for the Treatment of Cardiovascular Disorders. Adv Exp Med Biol, 2017. 982: p. 621-646. [CrossRef]
- Jou, M.J. , Pathophysiological and pharmacological implications of mitochondria-targeted reactive oxygen species generation in astrocytes. Adv Drug Deliv Rev, 2008. 60(13-14): p. 1512-26. [CrossRef]
- Huser, J., C. E. Rechenmacher, and L.A. Blatter, Imaging the permeability pore transition in single mitochondria. Biophys J, 1998. 74(4): p. 2129-37. [CrossRef]
- D'Aurelio, M. , et al., Mitochondrial DNA background modifies the bioenergetics of NARP/MILS ATP6 mutant cells. Hum Mol Genet, 2010. 19(2): p. 374-86. [CrossRef]
- Carrozzo, R. , et al., The T9176G mtDNA mutation severely affects ATP production and results in Leigh syndrome. Neurology, 2001. 56(5): p. 687-90. [CrossRef]
- Peng, T.I. , et al., mtDNA T8993G mutation-induced mitochondrial complex V inhibition augments cardiolipindependent alterations in mitochondrial dynamics during oxidative, Ca(2+), and lipid insults in NARP cybrids: a potential therapeutic target for melatonin. J Pineal Res, 2012. 52(1):p. 93-106.
- De Meirleir, L. , et al., Respiratory chain complex V deficiency due to a mutation in the assembly gene ATP12. J Med Genet, 2004. 41(2): p. 120-4. [CrossRef]
- Huang, W.Y., M. J. Jou, and T.I. Peng, mtDNA T8993G mutation-induced F1F0-ATP synthase defect augments mitochondrial dysfunction associated with hypoxia/reoxygenation: the protective role of melatonin. PLoS One, 2013. 8(11): p. e81546. [CrossRef]
- Molina, A.J. , et al., Mitochondrial networking protects beta-cells from nutrient-induced apoptosis. Diabetes, 2009. 58(10): p. 2303-15.
- Youle, R.J. and A.M. van der Bliek, Mitochondrial fission, fusion, and stress. Science, 2012. 337(6098): p. 10625.
- Shefa, U. , et al., Mitophagy links oxidative stress conditions and neurodegenerative diseases. Neural Regen Res, 2019. 14(5): p. 749-756. [CrossRef]
- Bhansali, S. , et al., Alterations in Mitochondrial Oxidative Stress and Mitophagy in Subjects with Prediabetes and Type 2 Diabetes Mellitus. Front Endocrinol (Lausanne), 2017. 8: p. 347. [CrossRef]
- Jou, M.J., T. I. Peng, and R.J. Reiter, Protective stabilization of mitochondrial permeability transition and mitochondrial oxidation during mitochondrial Ca(2+) stress by melatonin's cascade metabolites C3-OHM and AFMK in RBA1 astrocytes. J Pineal Res, 2019. 66(1): p. e12538.
Figure 1.
Assessing the cell viability of 143B cells and NARP cybrids at various concentrations (toxicities) of [A] hydrogen peroxide (H2O2) and [B] glucose, demonstrating the dose dependent toxicities of H2O2 and glucose in MTT assays in [A] and [B] respectively.
Figure 1.
Assessing the cell viability of 143B cells and NARP cybrids at various concentrations (toxicities) of [A] hydrogen peroxide (H2O2) and [B] glucose, demonstrating the dose dependent toxicities of H2O2 and glucose in MTT assays in [A] and [B] respectively.

Figure 2.
(A) Assessing the effects of high and low glucose in the presence of (Ca2+) between 143B cells and NARP cybrids at near the irradiation point (near IR). Differences have been observed in membrane potential depolarization (TMRM) levels between Ca2+ treated 143B cells (Figure 2AI) and Ca2+ treated NARP cybrids (Figure 2AII). Similarly, differences in oxidative stress (DCF) levels between Ca2+ treated 143B cells (Figure 2AIII) and Ca2+ treated NARP cybrids (Figure 2AIV) implying the NARP cybrids induced significantly more toxicities than 143B cells under the same conditions of Ca2+ treatments and high or low glucose treatments. (B) Assessing the effects of high and low glucose in the absence of Ca2+ between 143B cells and NARP cybrids at (Near the IR) point. Comparable levels of membrane potential (TMRM) have been observed between high and low glucose treated Ca2+ free 143B cells (Figure 2B I) and Ca2+ free NARP cybrids (Figure 2B II). Similarly, comparable levels of oxidative stress (DCF) between Ca2+ free 143B cells (figure. 2B III) and Ca2+ free NARP cybrids (figure. 2B IV) have been depicted, implying the presence of Ca2+ could be critical to the toxicities observed in NARP cybrids. (C). Assessing the effects of high and low glucose in the presence of Ca2+ between 143B cells and NARP cybrids at (far from IR) regions. Differences have been observed in the membrane potential (TMRM) levels between Ca2+ treated 143B cells (Figure 2C I) and Ca2+ treated NARP cybrids (Figure 2C II). Similarly, differences in oxidative stress (DCF) levels between Ca2+ treated 143B cells (Figure 2C III) and Ca2+ treated NARP cybrids (Figure 2C IV) have been demonstrated, implying that NARP cybrids induced more toxicities than 143B cells under the same conditions of treatments in high or low glucose conditions. (D) Assessing the effects of high and low glucose in the absence of Ca2+ between 143B cells and NARP cybrids at (far from IR) regions. Comparable differences have been observed in membrane potential (TMRM) levels between high or low glucose treated Ca2+ free 143B cells (figure. 2D I) and Ca2+ free NARP cybrids (figure.2D II). Similarly, comparable oxidative stress levels (DCF) between Ca2+ free 143B cells (figure. 2D III) and Ca2+ free NARP cybrids (figure. 2D IV) have been illustrated, depicting that the presence of Ca2+ could be critical to the toxicities observed in NARP cybrids.
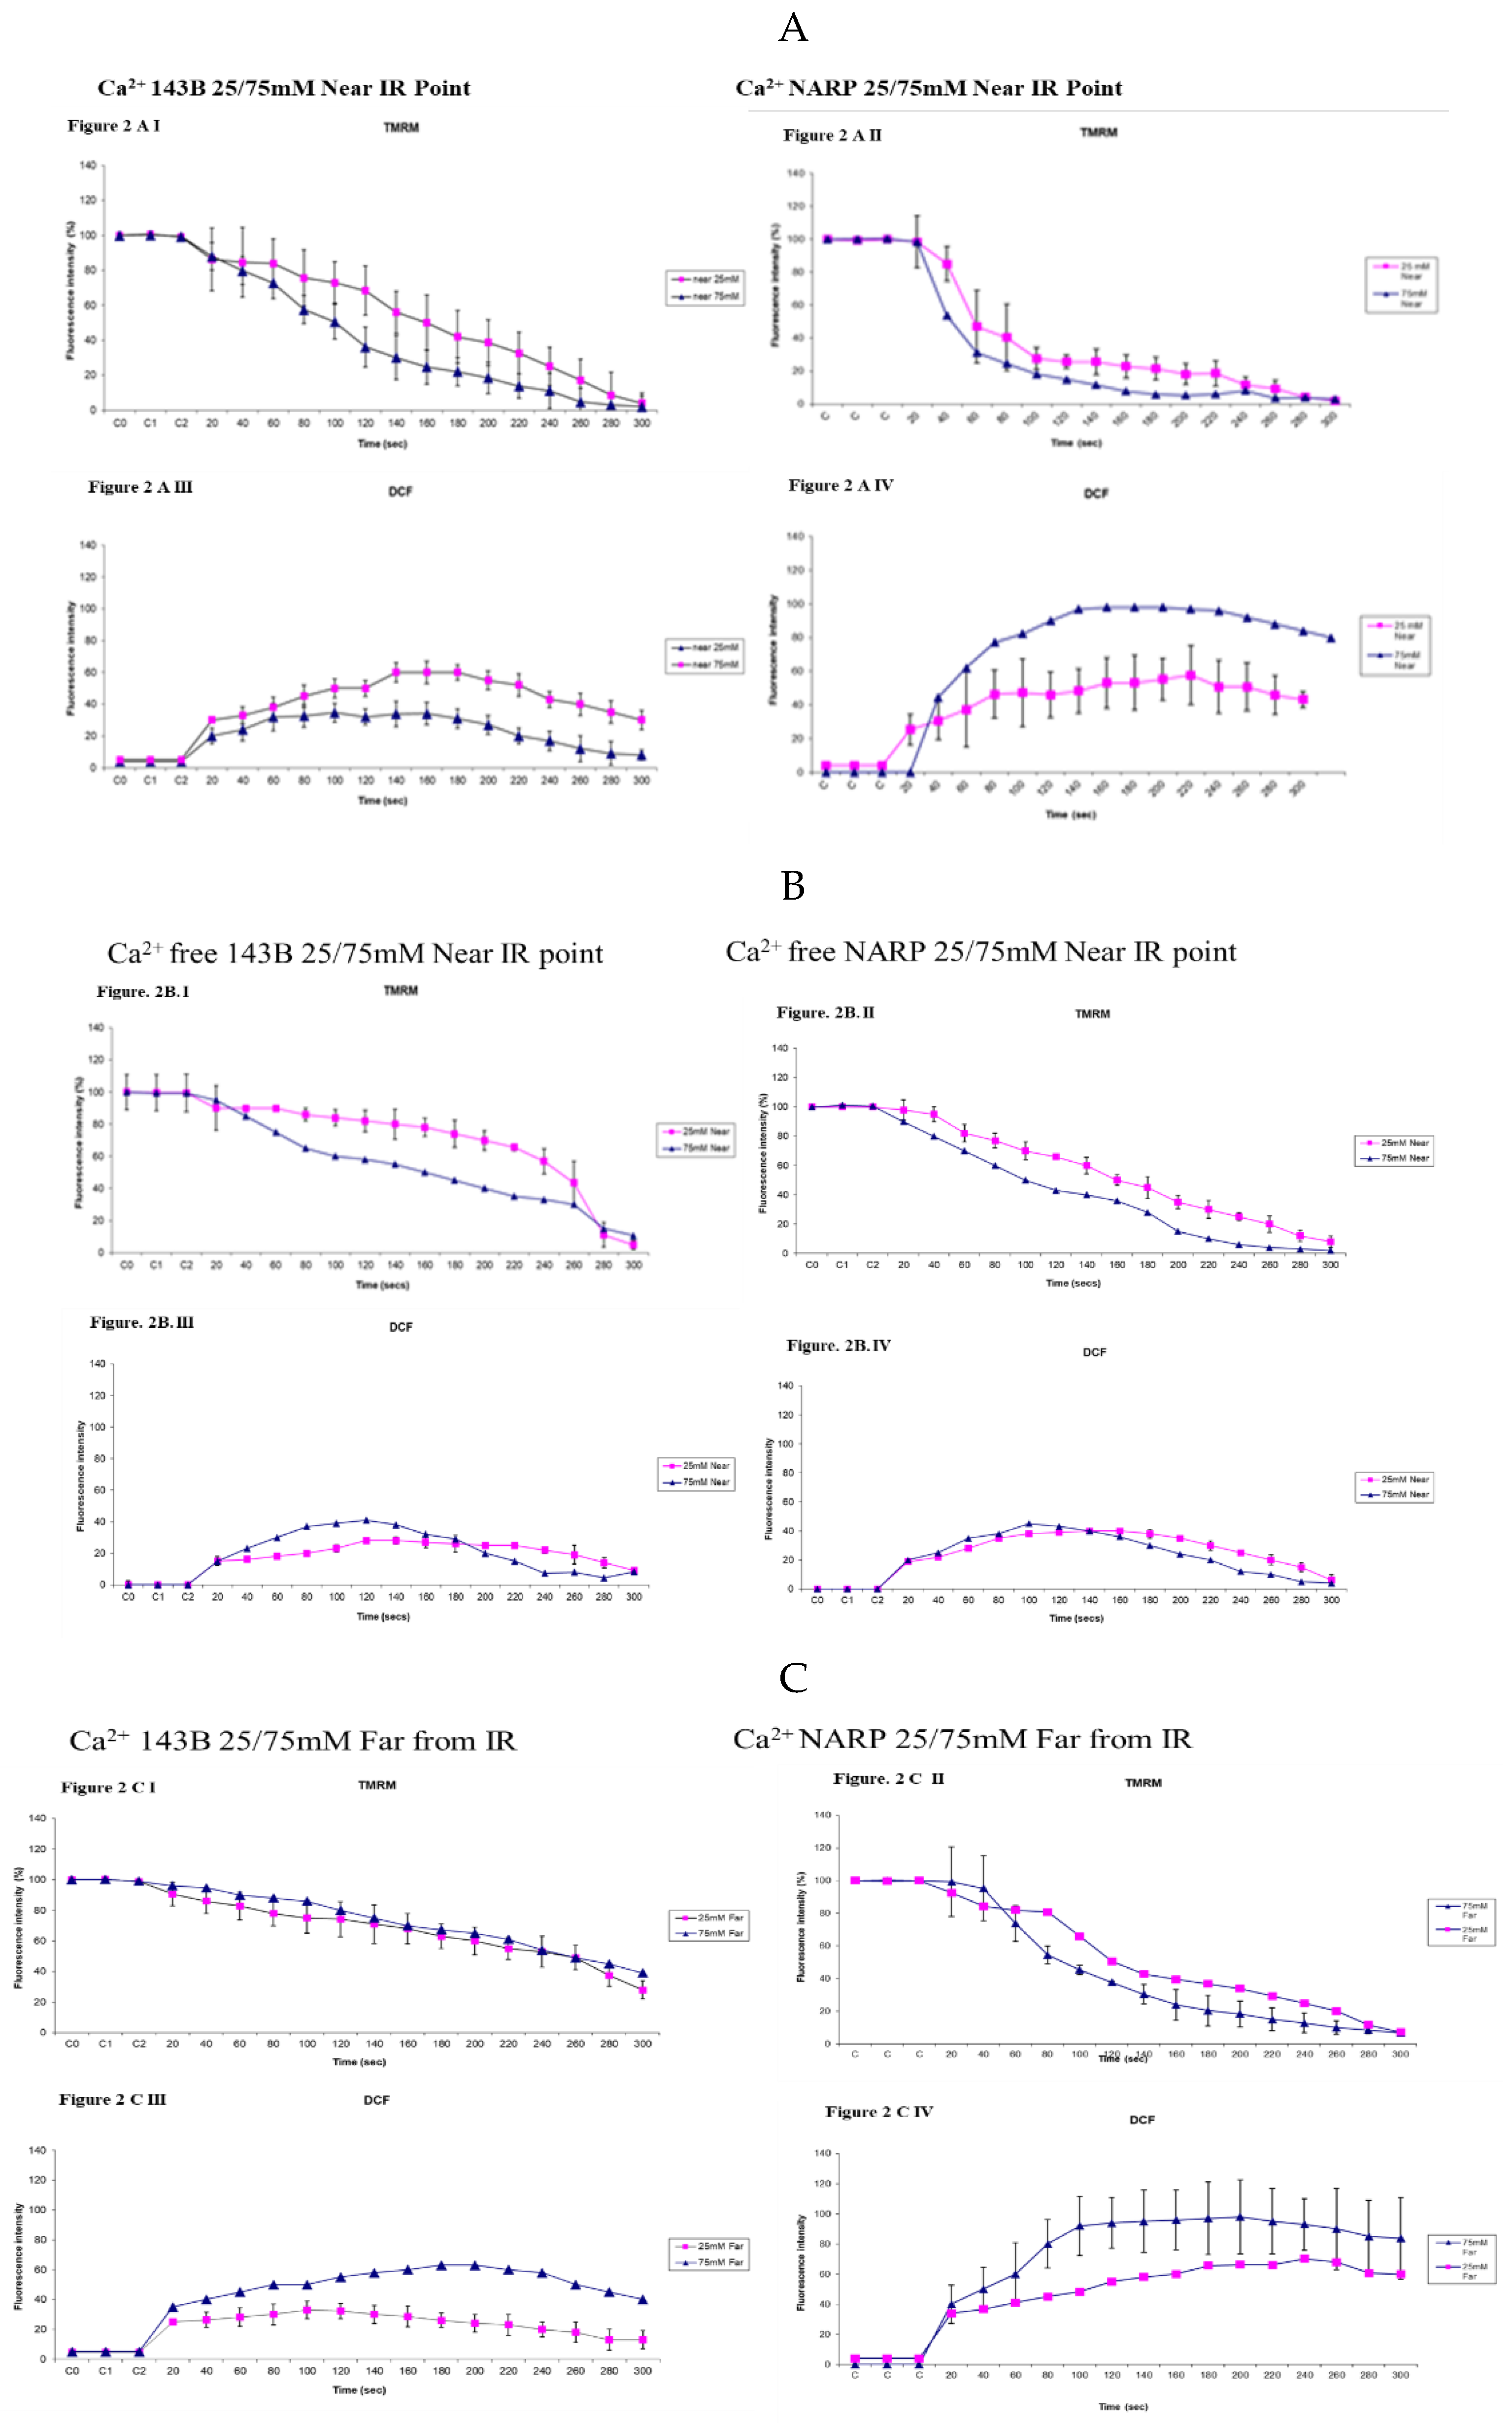
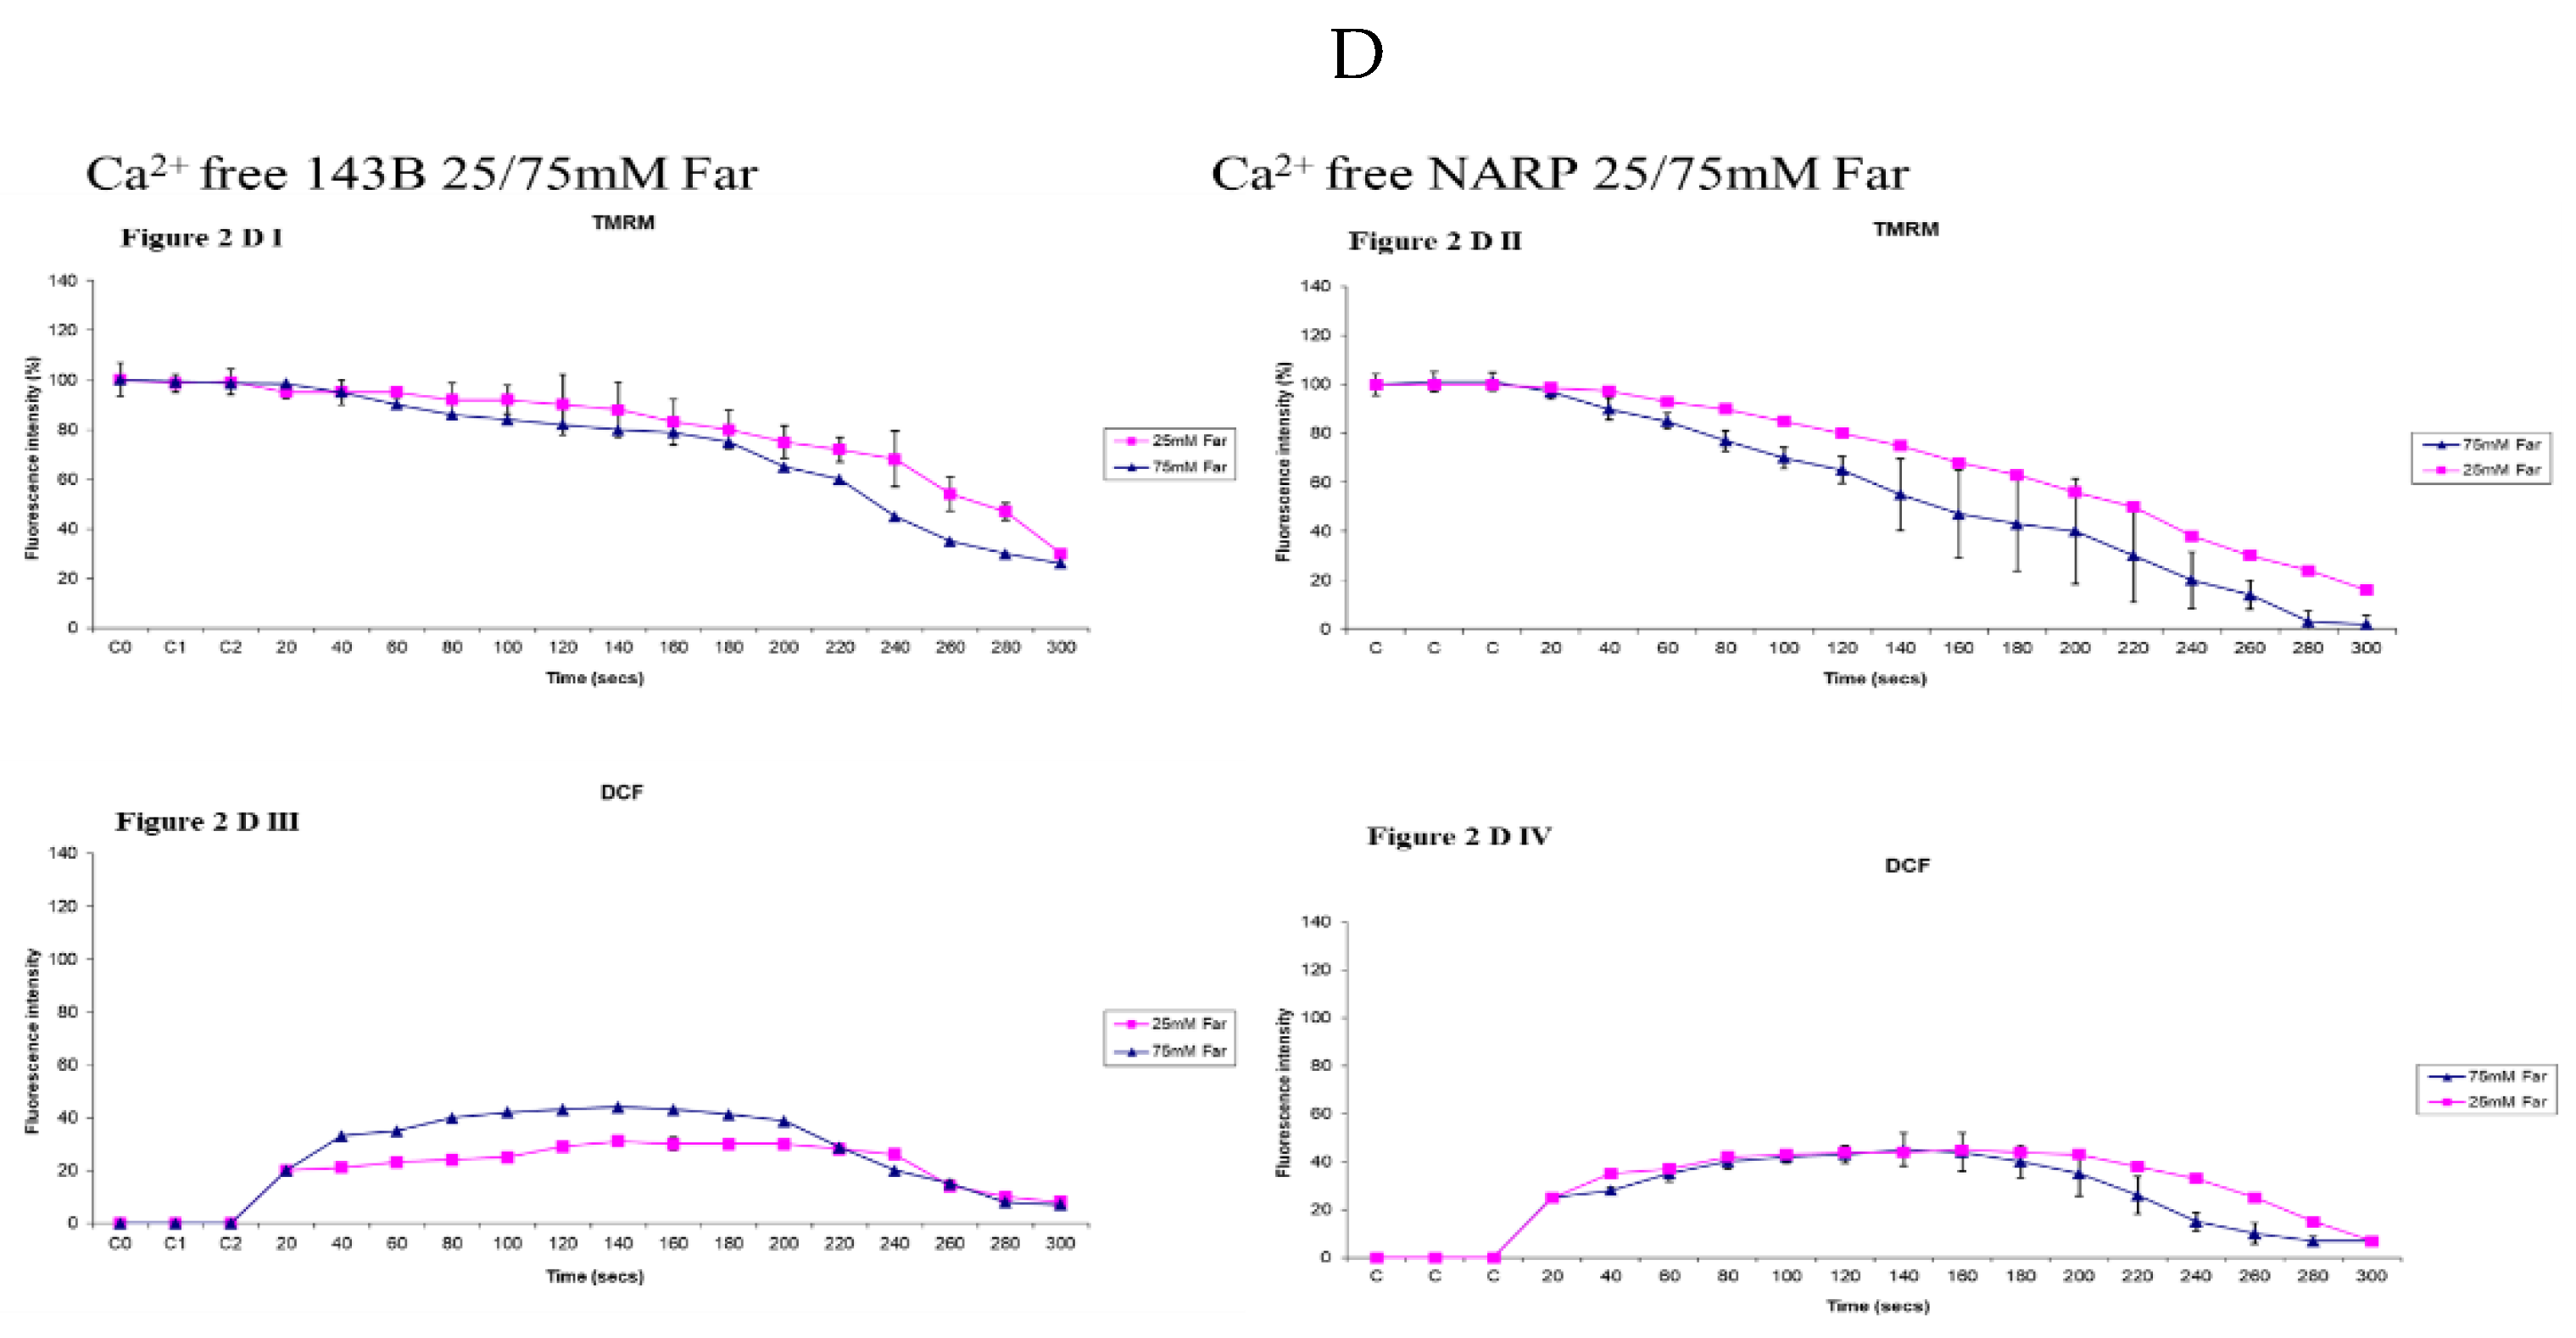
Figure 3.
(A,A’) 143B 25mM glucose and Ca2+ treated cells (figure. 3A) is being compared to (Figure
3A’) on the right hand side, also 25mM glucose treated and Ca2+ free. The Ca2+ treated 143B cells
showed comparable levels of membrane potential depolarization (TMRM) and oxidative stress levels
(DCF) with the Ca2+ free cells. Figures 3AI, 3AII, 3AIII and 3AIV are being directly compared to figures
3A’I, 3A’II, 3A’III and 3A’IV respectively. Figure 3A I shows the TMRM (red) levels and 3A II, show
the oxidative stress (DCF) levels (green). Figure 3A I shows the TMRM (red) levels and 3A II shows
the oxidative stress (DCF) levels (green). Figure 3A III and 3A IV show the graphical representations
of TMRM and DCF levels respectively. Figure 3A’ I and 3A’II show TMRM and DCF levels. Figure
3A’ III and 3A’ IV show the graphical representations of TMRM levels in Figure 3A’ I and DCF levels
in 3A’ II respectively. (B,B’). Figure 3B is 143B 75mM glucose and Ca2+ treated, is being compared to
Figure 3B’, also 75mM glucose treated and Ca2+ free. The Ca2+ treated 143B cells significantly
depolarize faster and significantly higher oxidative stress (DCF) levels than the Ca2+ free 143B cells.
Figure 3B I, 3B II, 3B III and 3B IV are being directly compared to Figure 3B’ I, 3B’ II, 3B’ III and 3B’
IV respectively. Figure 3B I shows TMRM (red) levels and 3B II shows the oxidative stress (DCF,
green) levels. Figure 3B III and 3B IV show the graphical representations of TMRM and DCF levels
respectively. Figure 3B’ I and 3B’ II show TMRM (red) and DCF levels. Figure 3B’ III and 3B’ IV show
the graphical representations of TMRM in Figure 3B’ I and DCF levels in Figure 3B’ II
respectively.(C,C’). NARP 25mM glucose (Figure 3C) and Ca2+ treated is being compared to Figure
3C’, also 25mM glucose treated NARP cells and Ca2+ free. The Ca2+ treated NARP cells depolarize
faster with higher DCF values than Ca2+ free cells. Figure 3C I, 3C II, 3C III and 3C IV are being directly
compared to Figure 3C’ I, 3C’II, 3C’III and 3C’ IV respectively. Figure 3C I shows TMRM (red) levels
and 3C II shows the oxidative stress levels (DCF, green). Figure 3C III and 3C IV show the graphical
representations of TMRM and DCF levels respectively. Figure 3C’ I and 3C’ II show TMRM (red) and
DCF levels. Figure 3C’ III and 3C’ IV show the graphical representations of TMRM in Figure 3B I and
DCF levels in Figure 3C’ II respectively. (D,D’). NARP 75mM glucose (Figure 3D) and Ca2+ treated is
being compared to Figure 3D’ which is also NARP75mM glucose treated and Ca2+ free. The Ca2+
treated NARP cells significantly depolarize faster with significantly high oxidative stress (DCF, green)
levels than Ca2+ free high glucose treated cells.
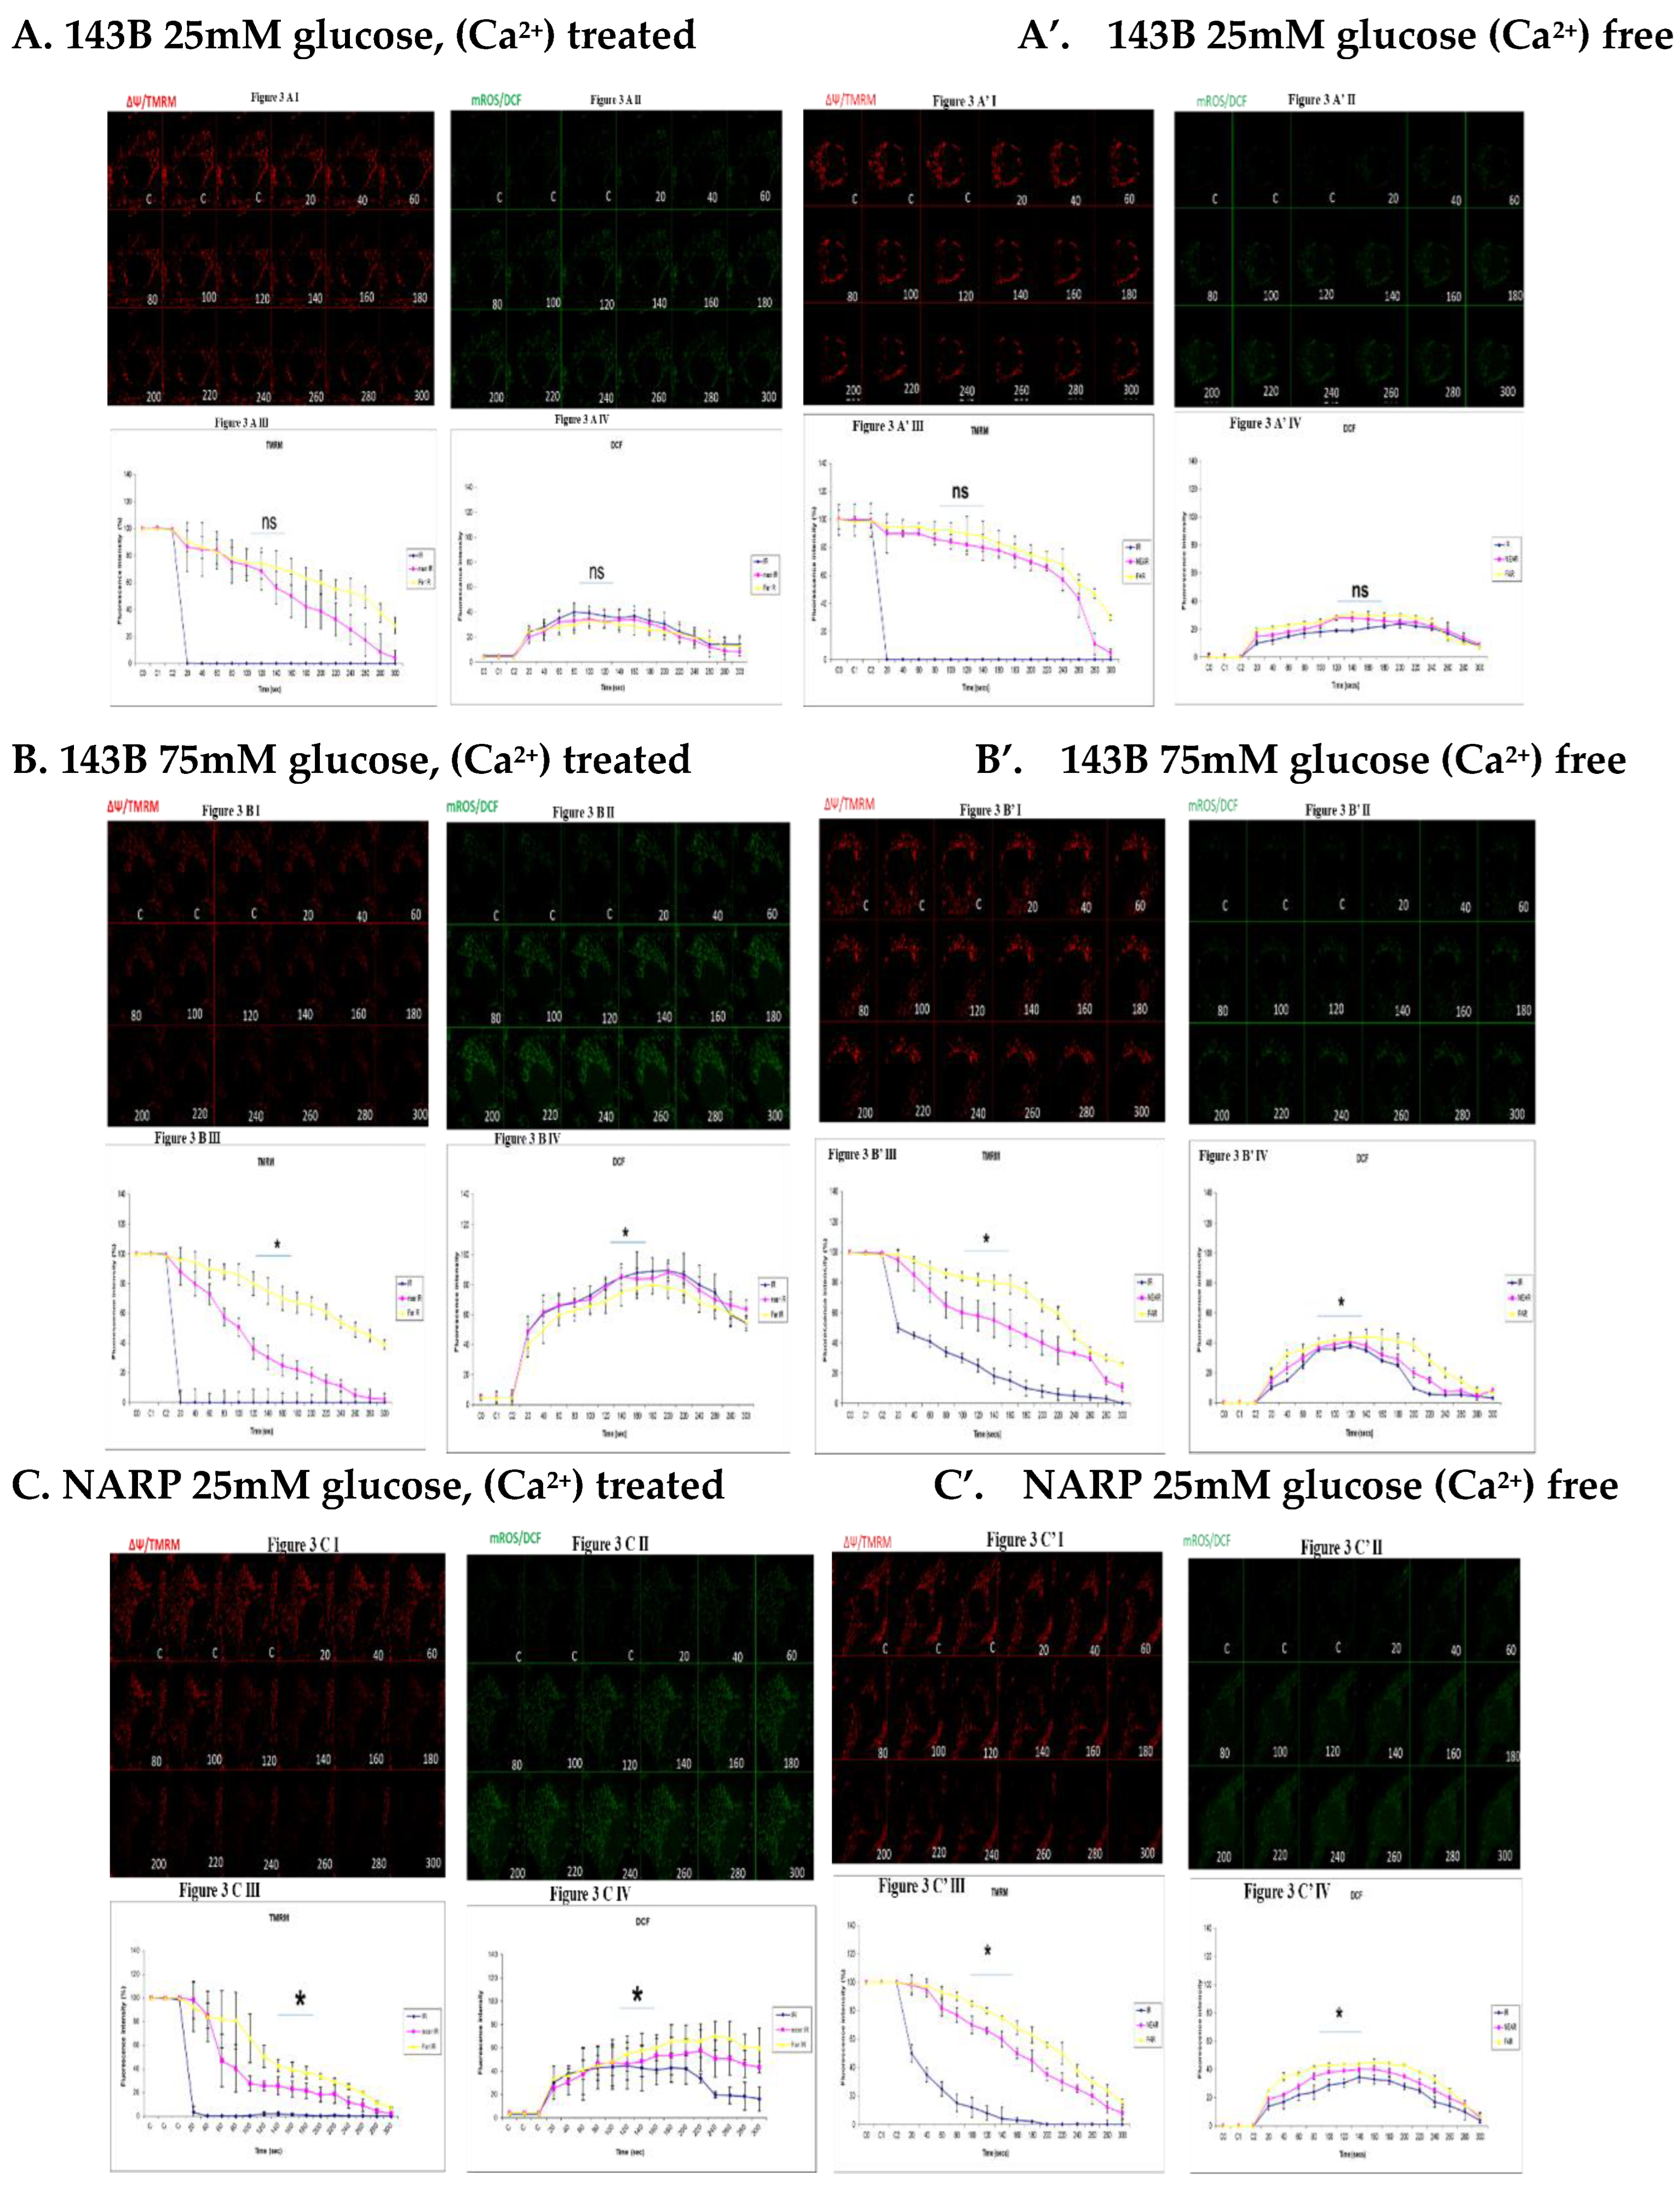
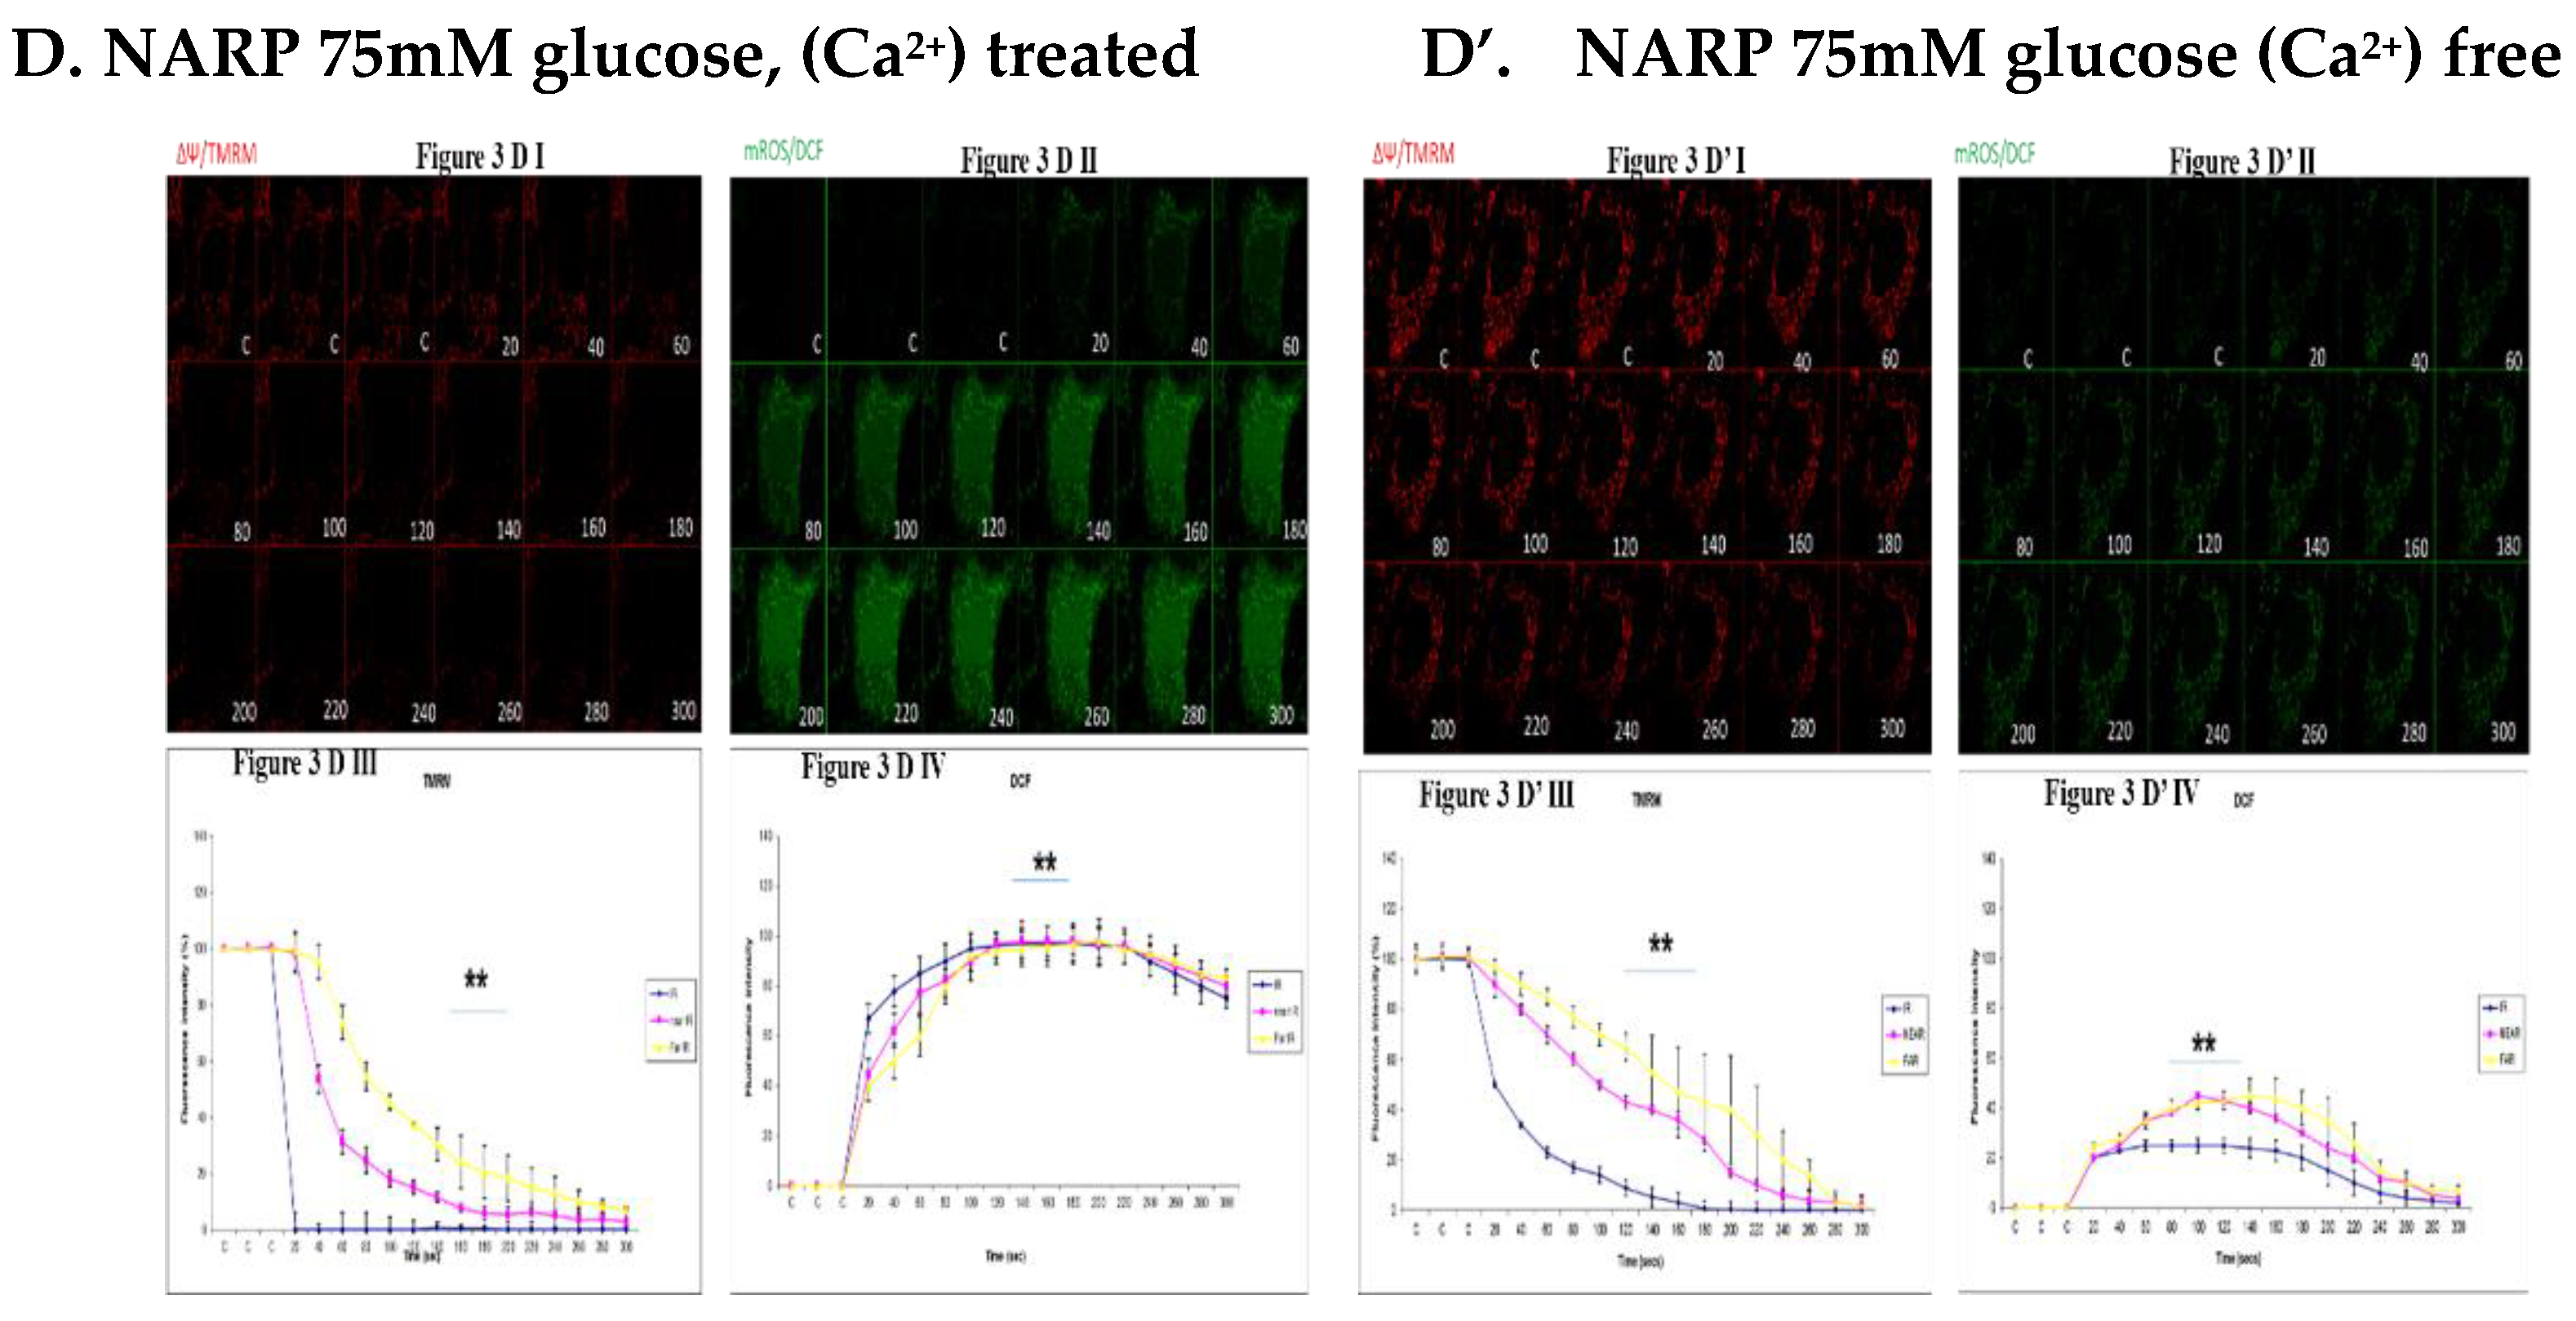
Figure 4.
(A,A’). 143B 25mM glucose, Ca2+ and MitoQ treatment (figure. 4A) is being compared to Figure 4A’, also 25mM glucose and MitoQ treated but Ca2+ free. The Ca2+ treated 143B cells have comparable levels of membrane potential depolarization (TMRM, red) and oxidative stress (DCF, green) levels with the 25mM glucose and MitoQ treated but Ca2+ free cells. Fig 4A I, 4A II, 4A III and 4A IV are being directly compared to fig 4A’ I, 4A’ II, 4A’ III and 4A’ IV. Fig 4A I and 4A II show the TMRM levels and oxidative stress levels (DCF, green) respectively and fig 4A III and 4A IV show the graphical representations of fig 4A I and 4A II (DCF). Fig 4A’ I and 4A’ II show the TMRM and DCF levels and fig 4A’ III and 4A’ IV show the graphical representations respectively. (B,B’). 143B 75mM glucose, Ca2+ and MitoQ treatment (figure. 4B) is being compared to Figure 4B’, also 75mM glucose and MitoQ treated and Ca2+ free. The Ca2+ treated cells depolarize relatively faster with comparable levels of DCF with the Ca2+ free cells. Figures 4B I, 4B II, 4B III and 4B IV are being directly compared to figures 4B’ I, 4B’ II, 4B’ III and 4B’ IV. Fig 4B I and 4B II show the TMRM levels and oxidative stress levels (DCF, green) respectively and fig 4B III and 4B IV show the graphical representations of fig 4B I and 4B II (DCF). Figures 4B’ I and 4B’ II show the TMRM and DCF levels and figures 4B’ III and 4B’ IV show the graphical representations respectively. (C,C’). NARP 25mM glucose, Ca2+ and MitoQ treated cells (Figure 4C) is compared to Figure 4C’, also NARP 25Mm glucose and MitoQ treated but Ca2+ free. The Ca2+ treated NARP cells depolarize relatively faster with comparable DCF levels with the Ca2+ free 25mM glucose treated cells. Fig 4C I, 4C II, 4C III and 4C IV are being directly compared to fig 4C’ I, 4C’ II, 4C’ III and 4C’ IV. Figure 4C I and 4C II show the TMRM levels and oxidative stress levels (DCF, green) respectively and Figure 4C III and 4C IV show the graphical representations of Figure 4C I and 4C II (DCF). Figure 4C’ I and 4C’ II show the TMRM and DCF levels and fig 4C’ III and 4C’ IV show the graphical representations respectively. (D,D’). NARP 75mM glucose, Ca2+ and MitoQ treated cells (Figure 4D) is compared to Figure 4D’, also NARP 75Mm glucose and MitoQ treated but Ca2+ free. The Ca2+ treated NARP cells have comparable levels of membrane potential depolarization (TMRM, red) and ROS production levels with the Ca2+ free 75mM glucose treated cells. Figure 4D I, 4D II, 4D III and 4D IV are being directly compared to fig 4D’ I, 4D’ II, 4D’ III and 4D’ IV. Figure 4D I and 4D II show the TMRM levels and oxidative stress levels (DCF, green) respectively and Figure 4D III and 4D IV show the graphical representations of Figure 4D I and 4D II. Fig 4D’ I and 4D’ II show the TMRM and DCF levels and figures 4D’ III and 4D’ IV show the graphical representations respectively.
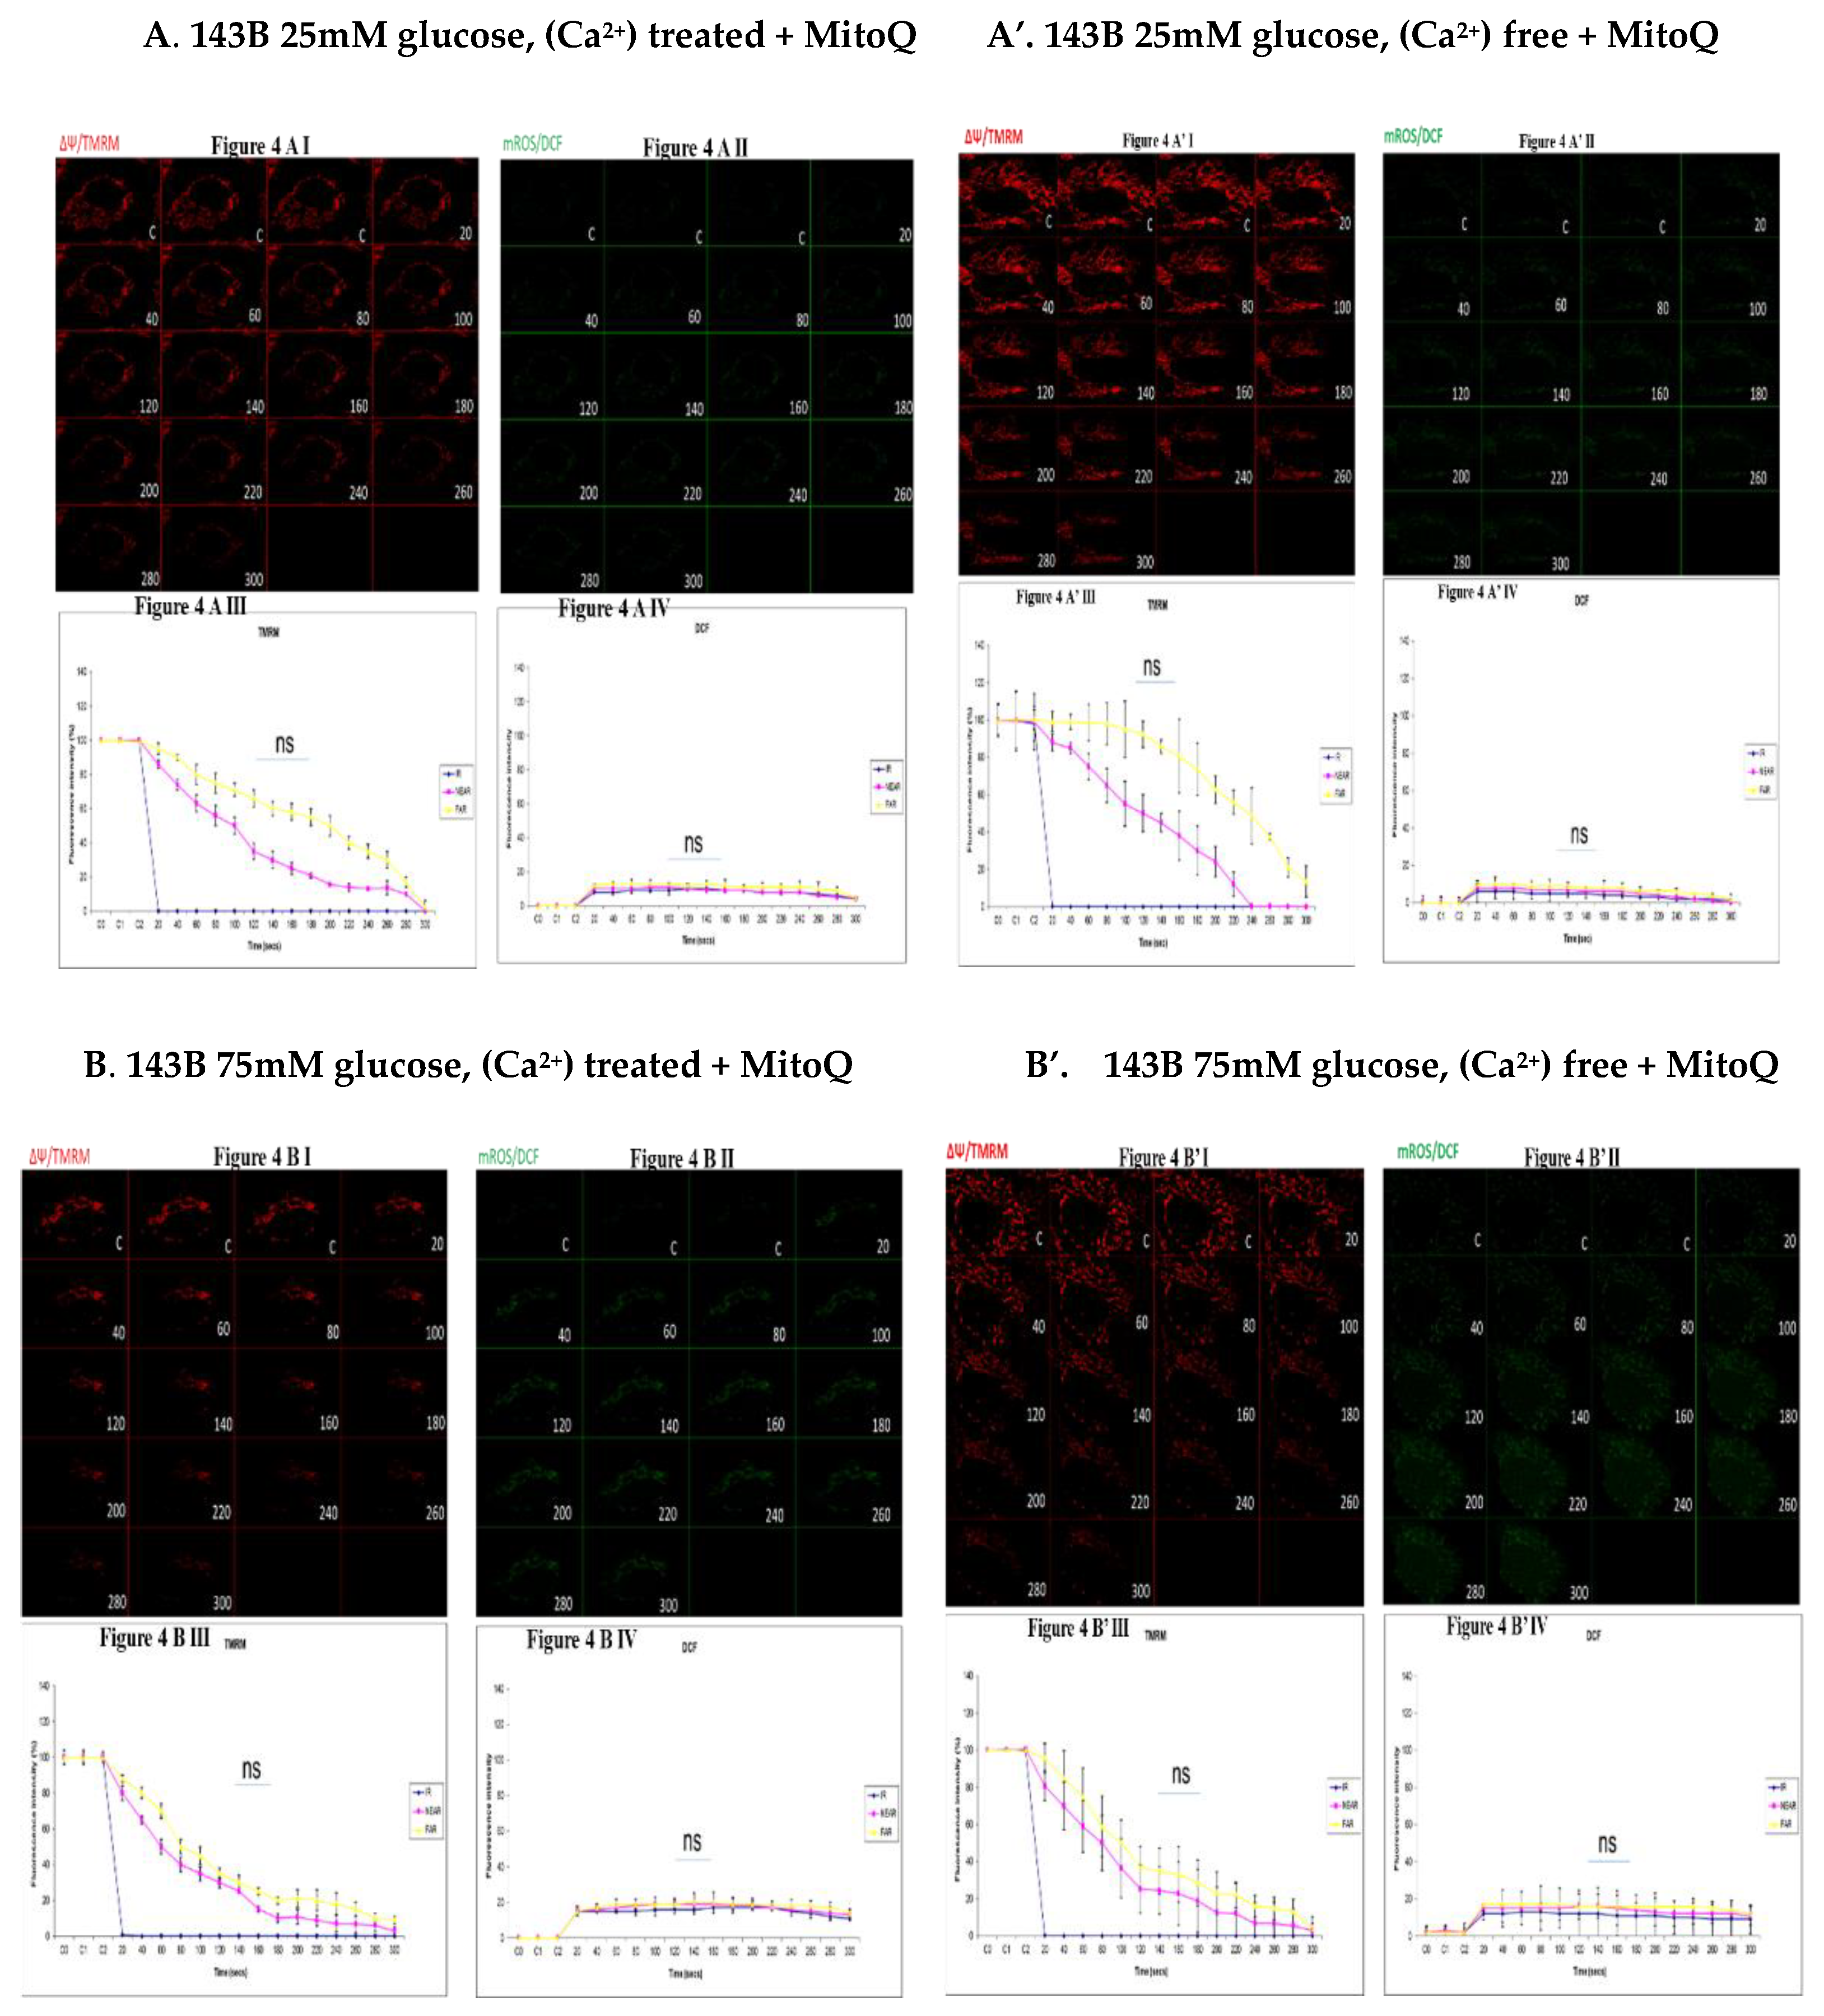
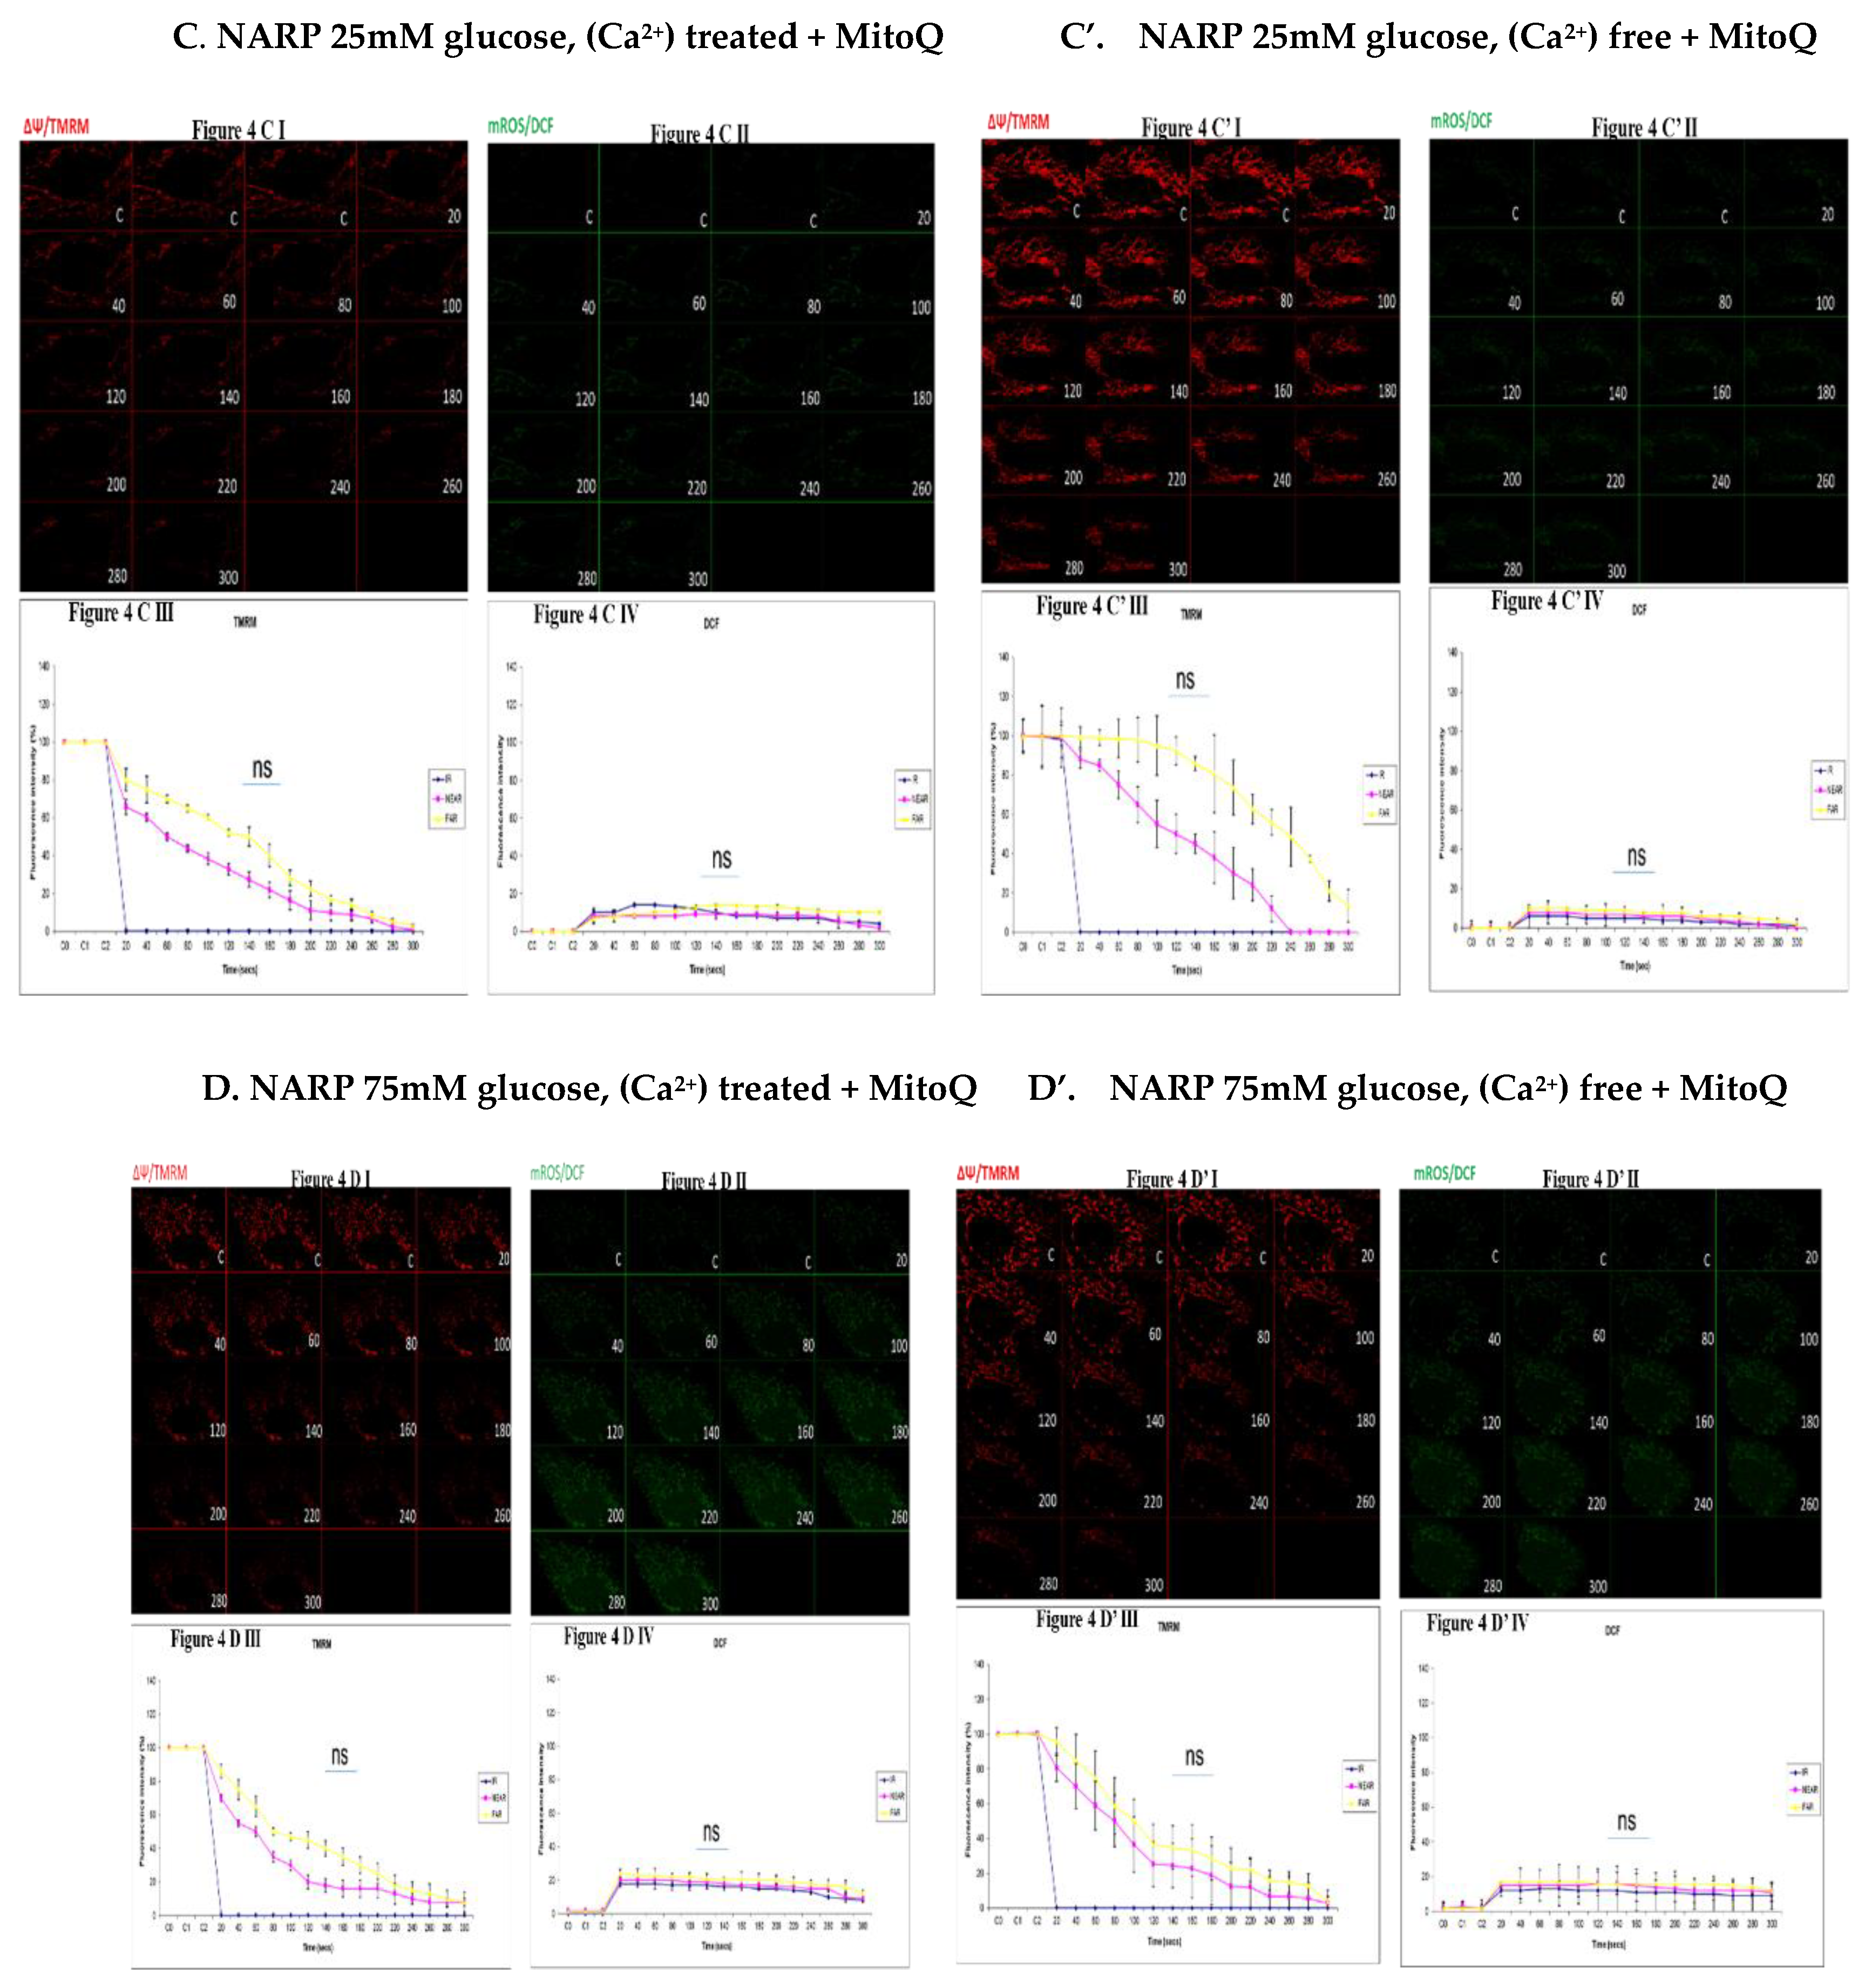
Figure 5.
Demonstrating how high sugar augment respiratory chain defect augmented mitochondrial cardiolipin (CL) remodeling and calcium (Ca2+) homeostasis in parental 143B cells and NARP cybrids. Figure 5A (143B) cells are treated with low glucose (25mM) and being compared to fig 5C (NARP) cells, also treated with low glucose. Fig 5A I shows NAO (CL) levels, 5A II shows Rhod2 (red) denoting mitochondria Ca2+ levels (mCa2+). Figure 5A III and 5A IV show graphical representations CL and mCa2+ levels respectively. Time lapse recordings show that CL levels in 25mM glucose treated NARP cybrids in Figure 5C depolarize faster than the CL levels in 25mM glucose treated 143B cells (Figure 5A) with comparable levels of mCa2+. Figure 5C I shows the time lapse recordings for CL, Figure 5C II shows the time lapse recordings for Rhod2 (mCa2+) levels and Figure 5C III and Figure 5C IV showing the graphical representations of NAO/CL and mCa2+ respectively. NAO/CL levels start to fall steeply after just 20 seconds of time lapse recordings in 75mM glucose treated NARP cells (Figure 5D I and 5D III) compared to 75mM glucose treated 143B cells (Figure 5B I and 5B III) with higher Rhod2/ mCa2+ levels as well (Figure 5D II and 5D IV).
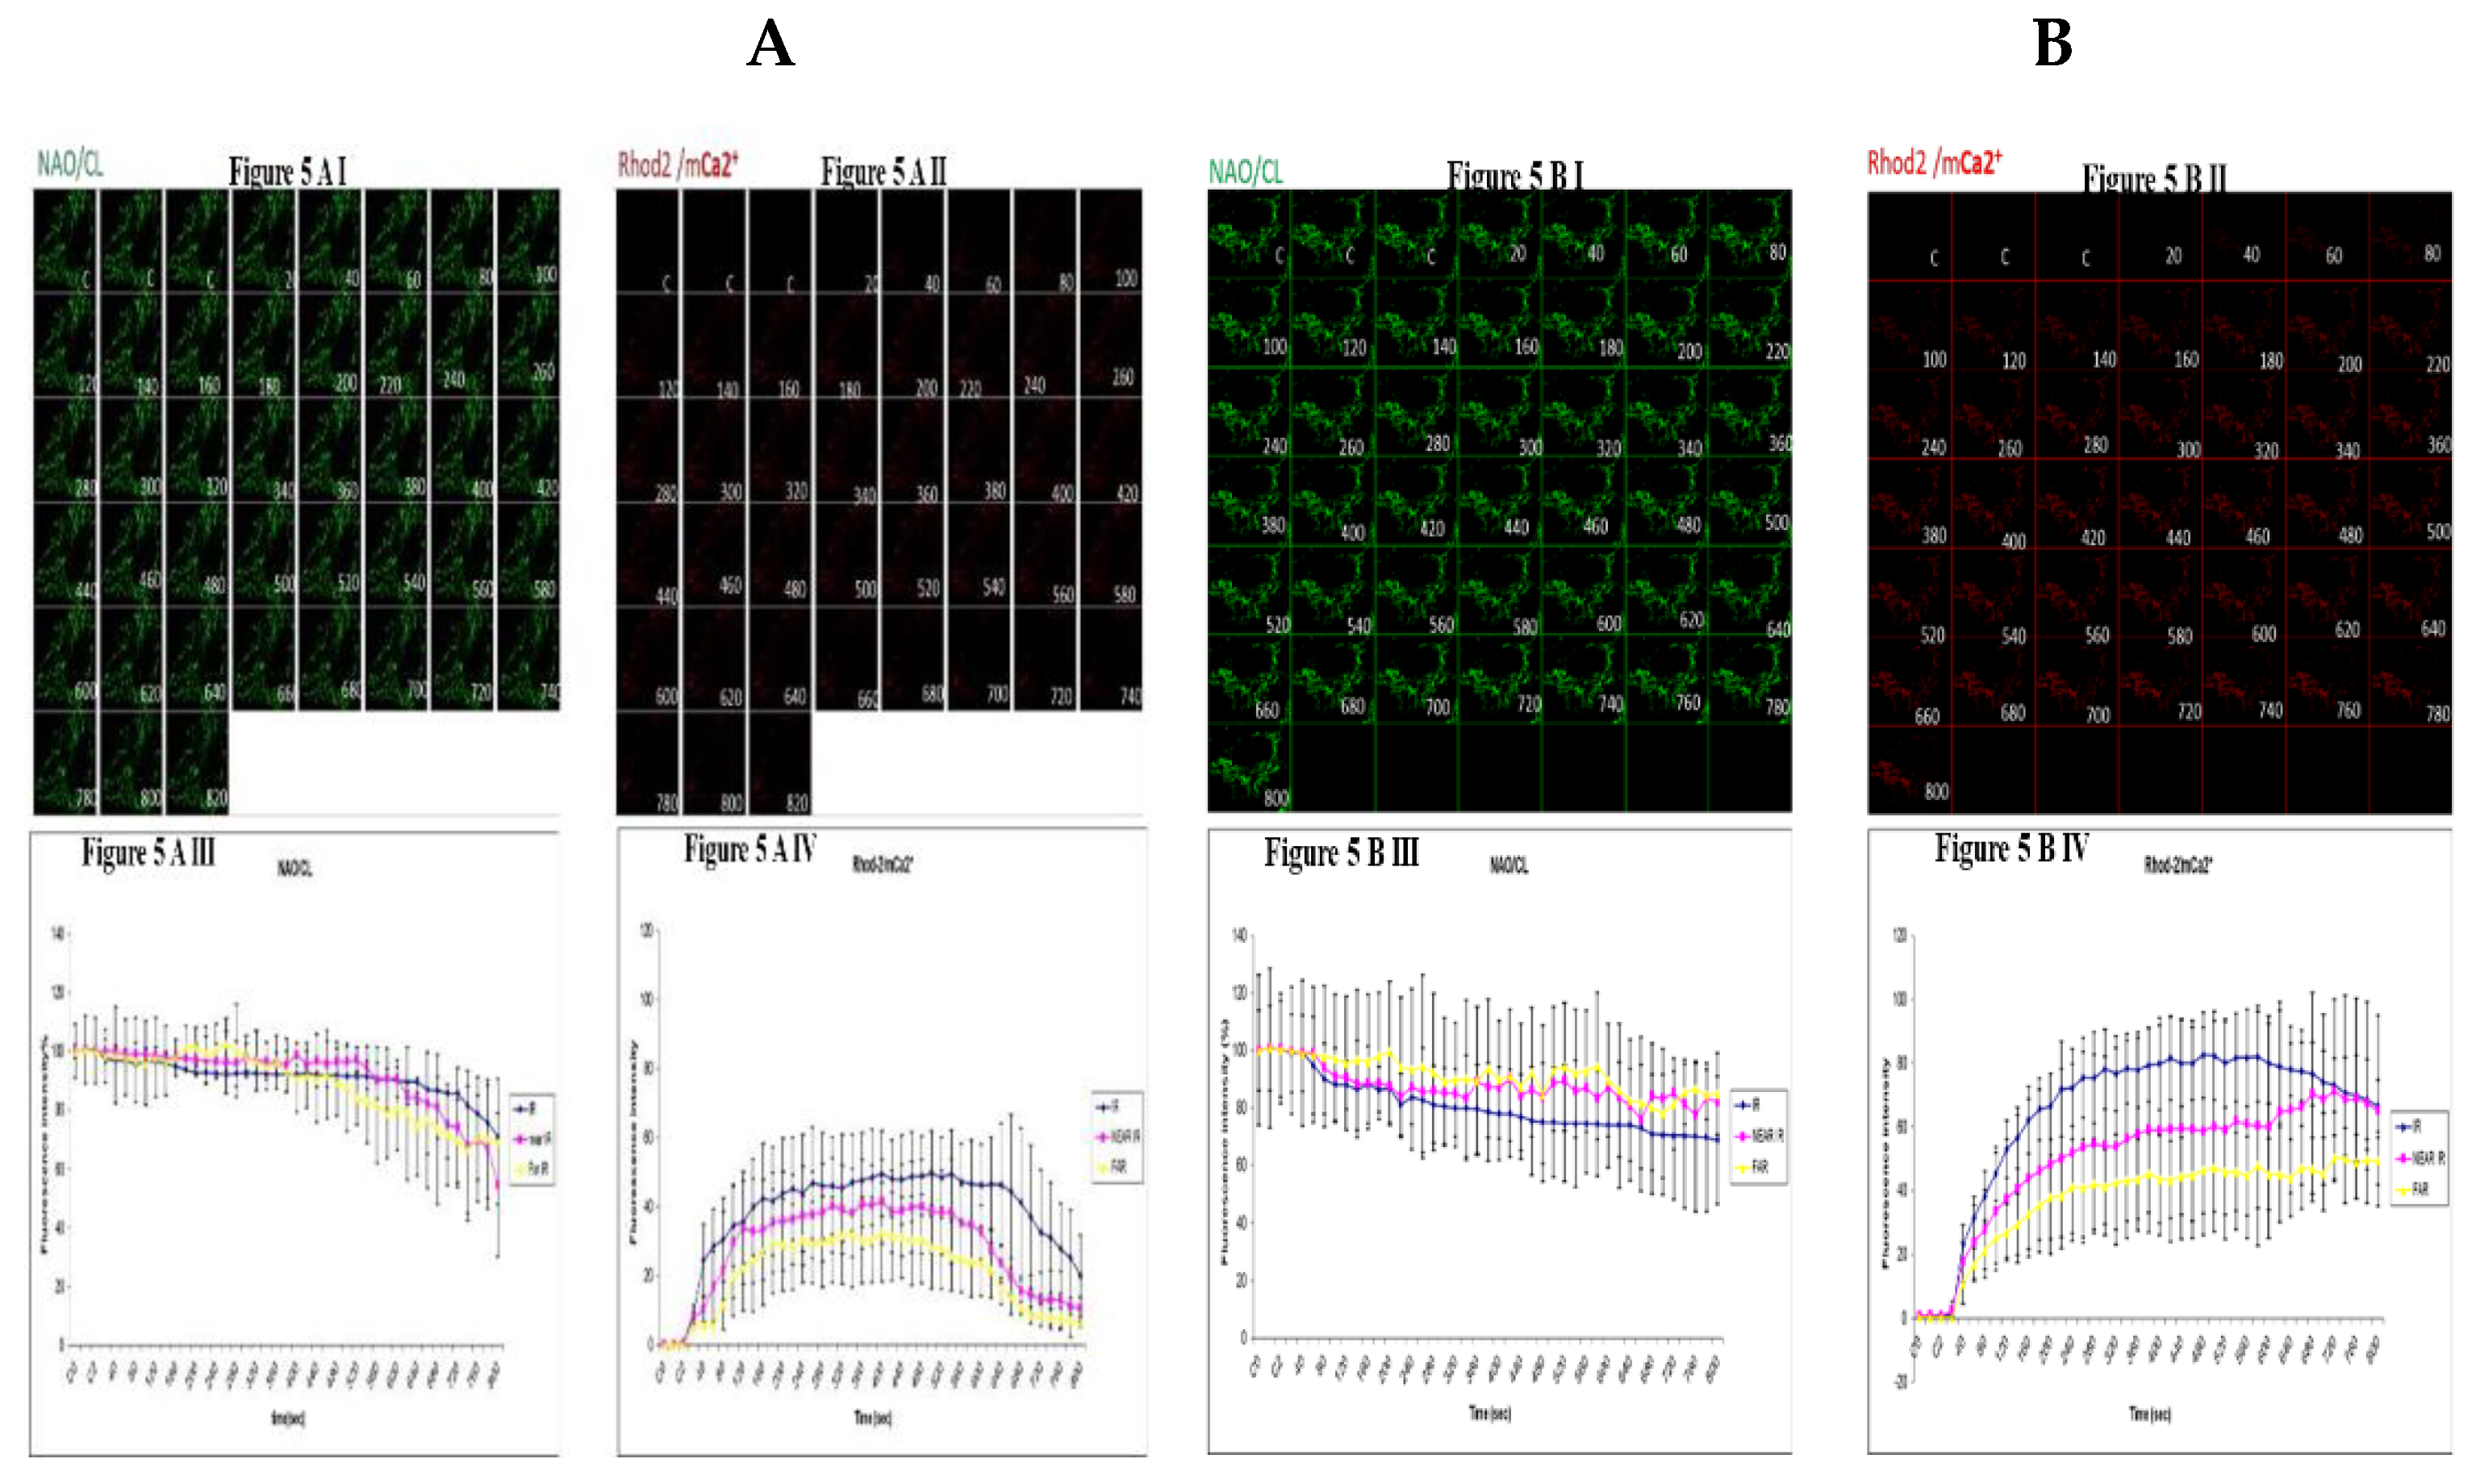
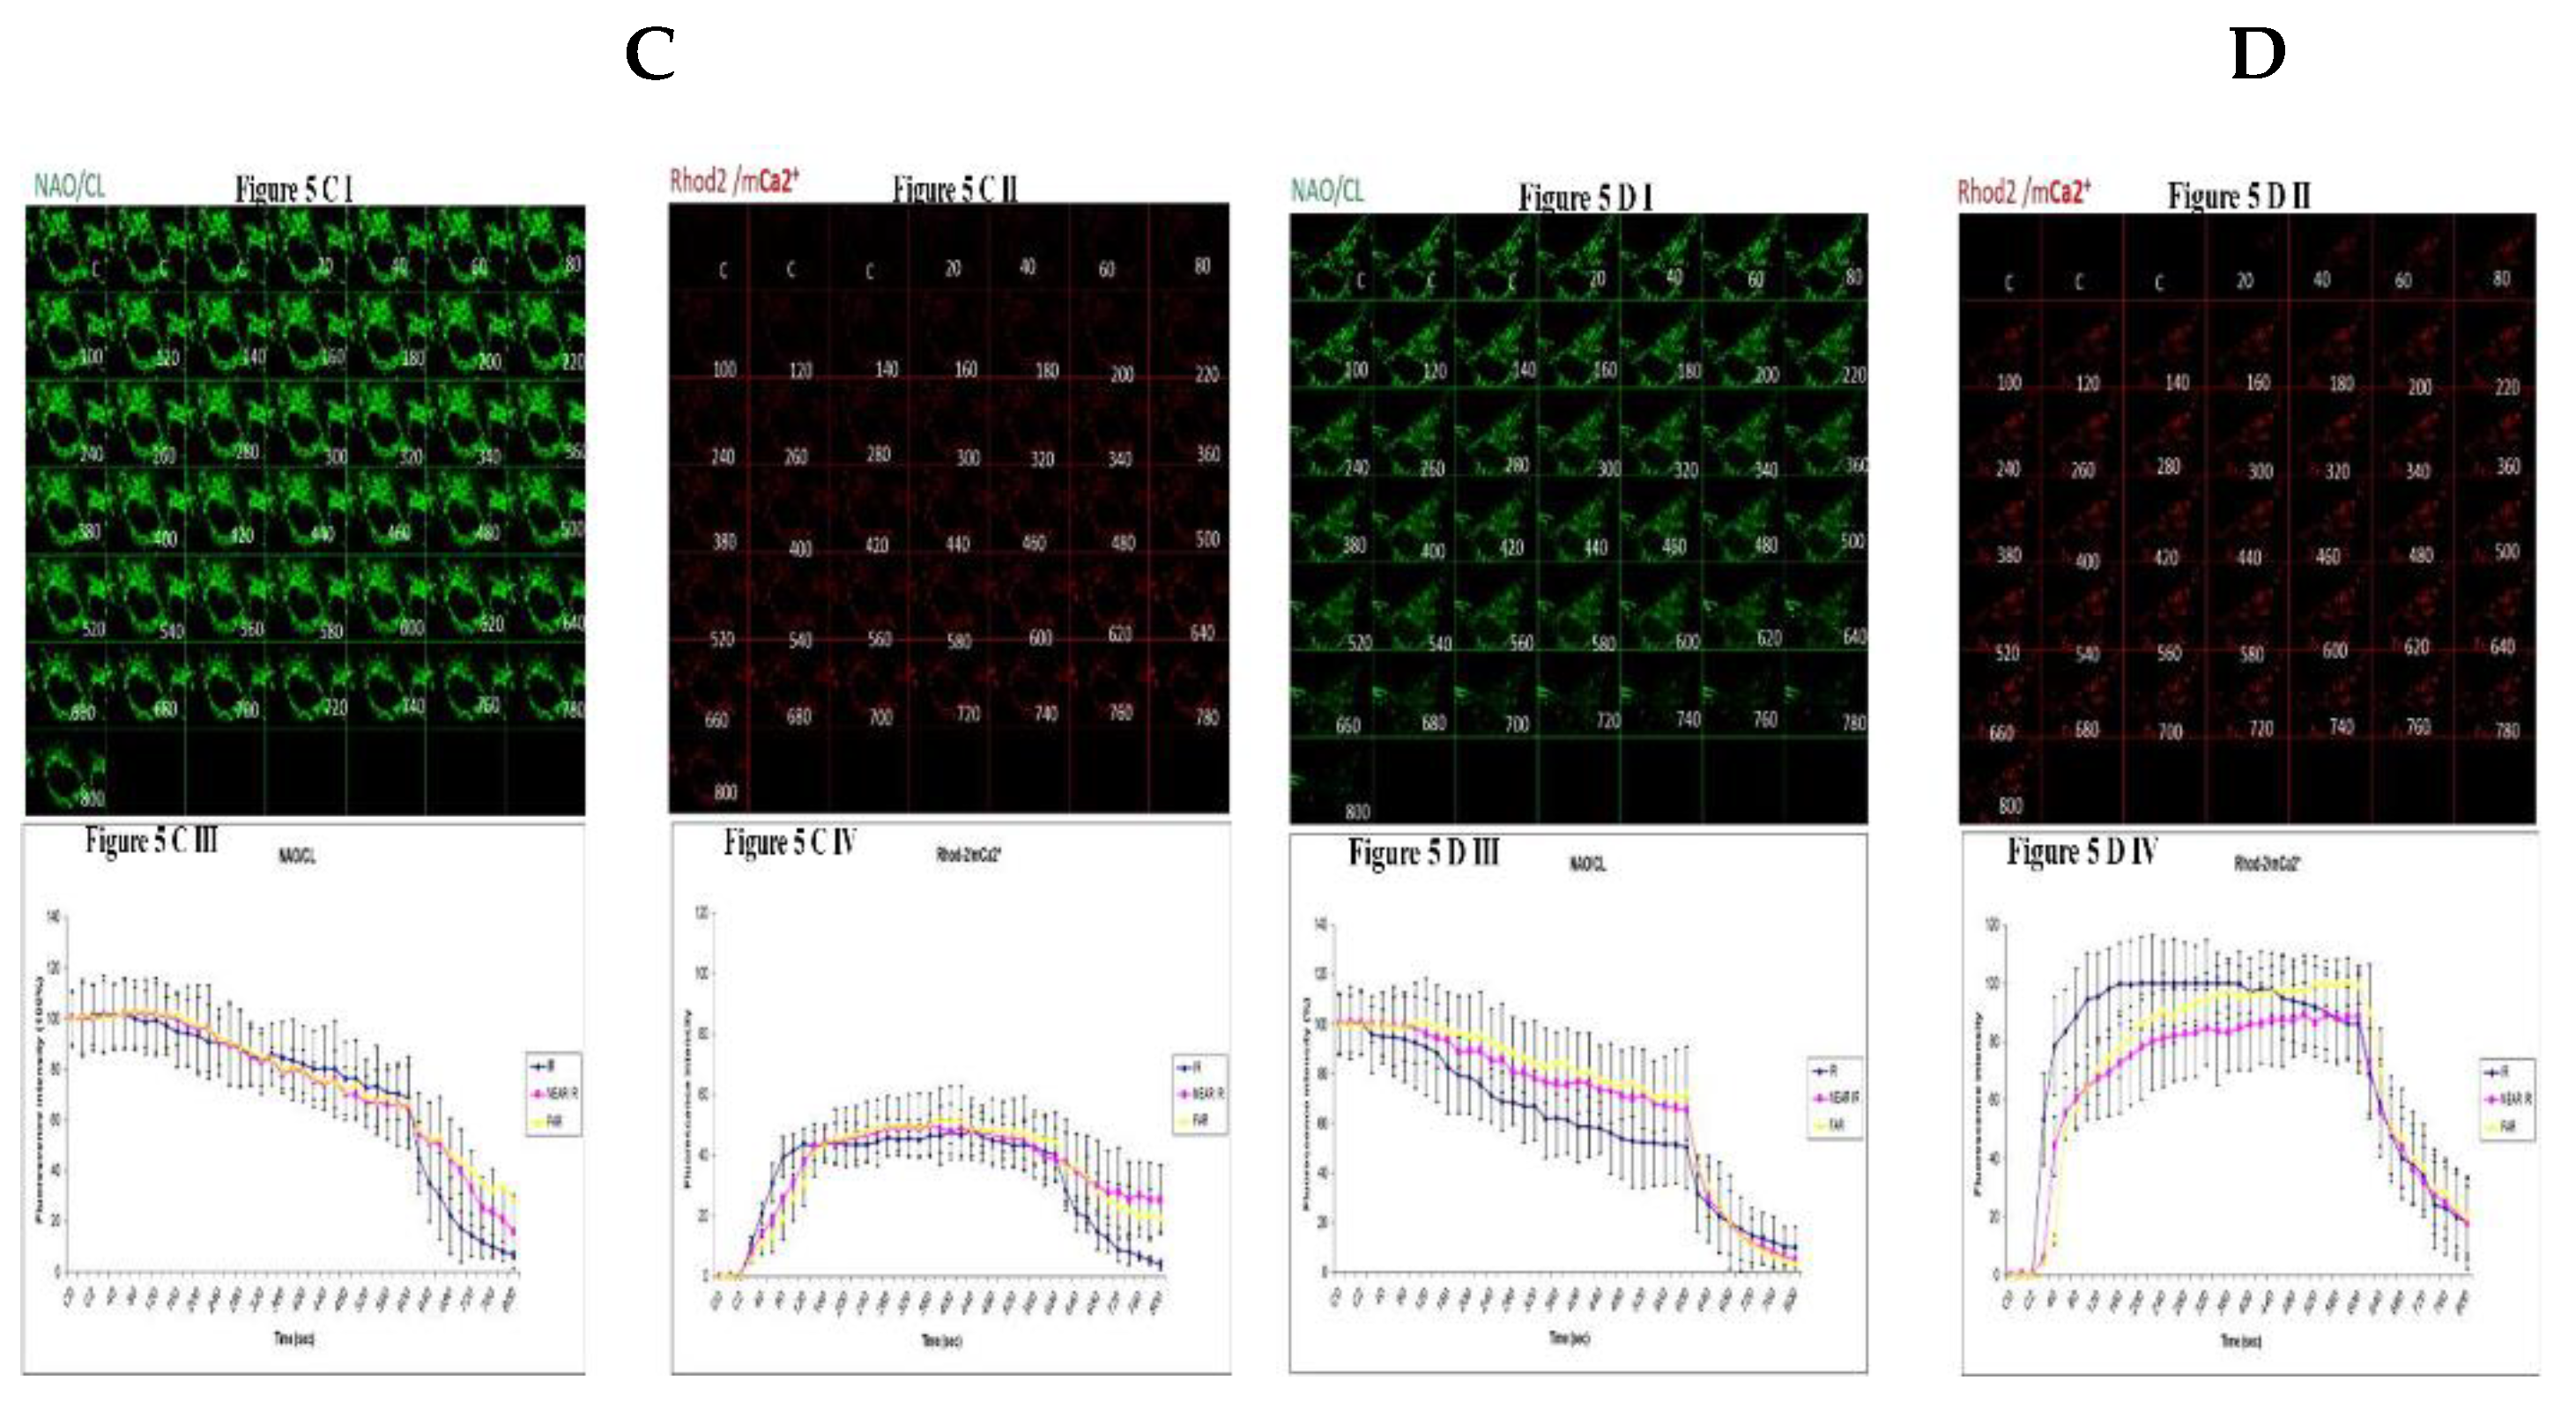
Figure 6.
Investigating how high glucose augment respiratory chain defect augmented mitochondrial permeability transition pore (MPTP) including transient (t-MPT) and permanent (p-MPT) on parental 143B cells and NARP cybrids. Figure 6A, 143B cells have been treated with low glucose (25mM) glucose and the calcein stains start to deplete at 720 secs (Figure 6A. I) compared to the TMRM at the same time points (Figure 6A II). After 640 secs, the fluorescence intensity for calcein falls steeply (Figure 6A III) compared to the TMRM fluorescence intensity (Figure 6A IV). After testing the 143B cells with 75mM glucose, the TMRM fluorescence intensity starts to fade at 620 secs in the time lapse recordings and almost completely depletes at 660 secs (Figure 6B II) while the calcein stains continue beyond the same time point (Figure 6B I) and gradually depletes ultimately. TMRM fluorescence intensity falls steeply after 620 secs (Figure 6B IV) compared to calcein stains which continue beyond 620 secs and for longer periods. Upon testing NARP cells with low glucose (25mM), the calcein stains deplete after 920 secs (Figure 6C I) compared to the TMRM stains that persist throughout the time lapse recordings (Figure 6 C II). After treating with high glucose (25mM), the TMRM stains deplete after just 220 secs in the time lapse recordings (Figure 6 D II) compared to the calcein stains (Figure 6 D I). Figure 6D III and Figure 6D IV are graphical representations of Figure 6D I and Figure 6D II respectively.
Disclaimer/Publisher’s Note: The statements, opinions and data contained in all publications are solely those of the individual author(s) and contributor(s) and not of MDPI and/or the editor(s). MDPI and/or the editor(s) disclaim responsibility for any injury to people or property resulting from any ideas, methods, instructions or products referred to in the content. |
© 2024 by the authors. Licensee MDPI, Basel, Switzerland. This article is an open access article distributed under the terms and conditions of the Creative Commons Attribution (CC BY) license (http://creativecommons.org/licenses/by/4.0/).
Copyright: This open access article is published under a Creative Commons CC BY 4.0 license, which permit the free download, distribution, and reuse, provided that the author and preprint are cited in any reuse.


