Submitted:
26 June 2024
Posted:
27 June 2024
You are already at the latest version
Abstract
Keywords:
1. Introduction
2. Material and Methods
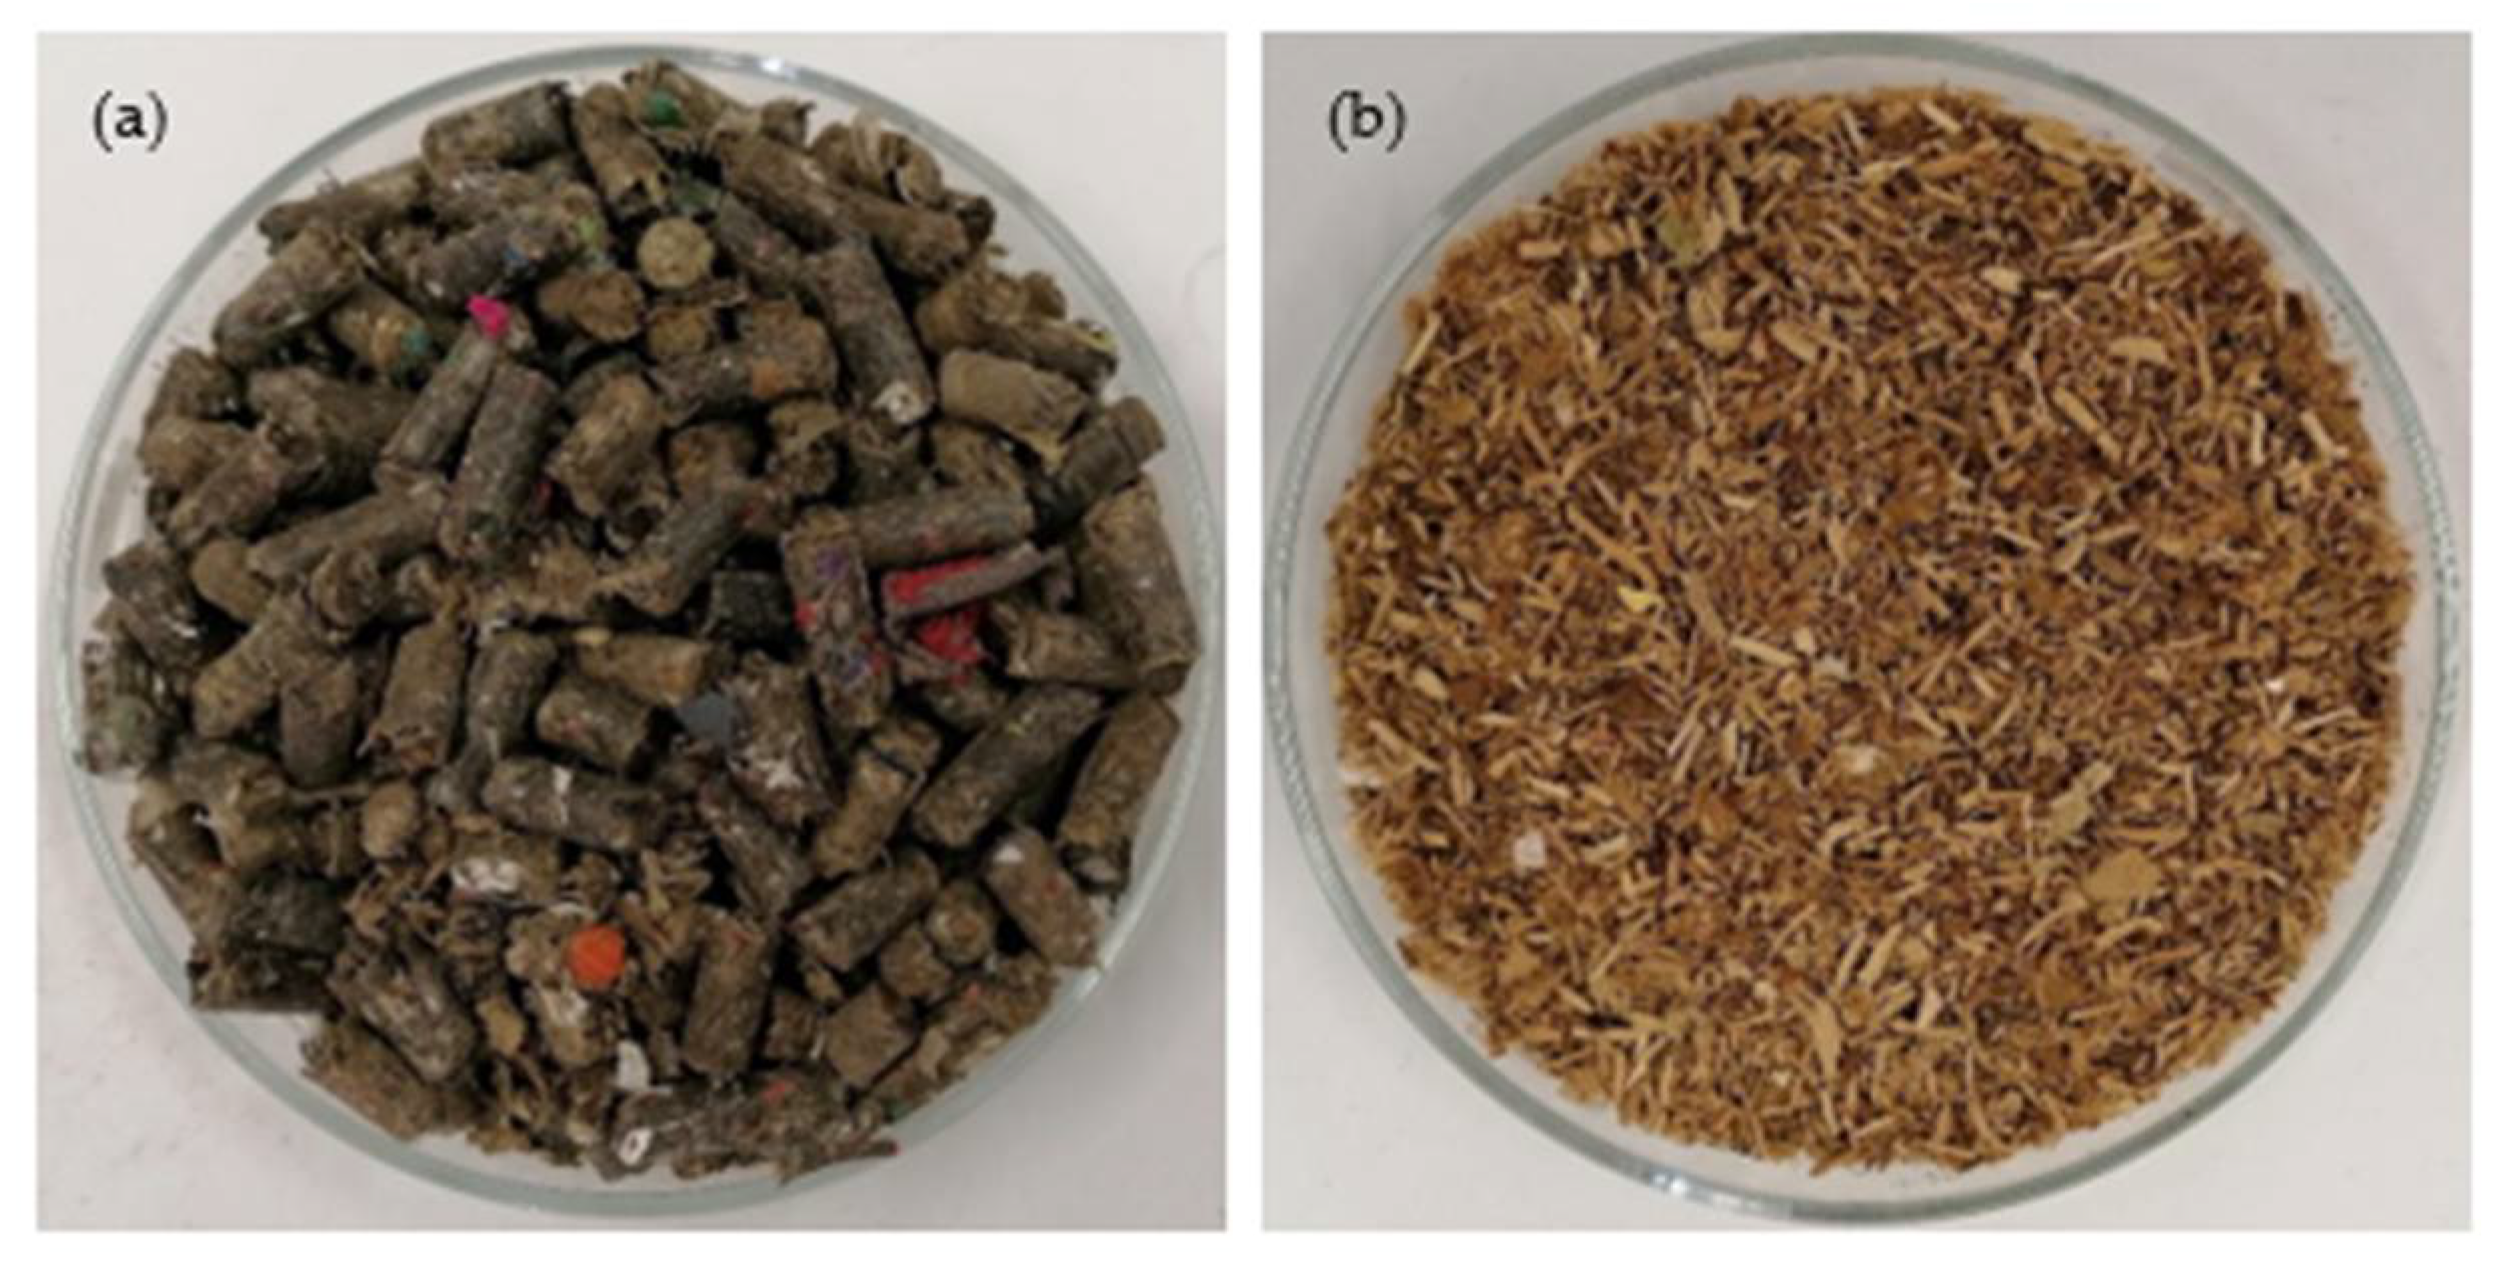
2.1. Refused-Derived Fuel Pellet Sample
2.2. Carbonization Tests
2.3. Chars Characterization and Fuel Properties
2.4. Char Washing and Effluent Characterization
3. Results and Discussion
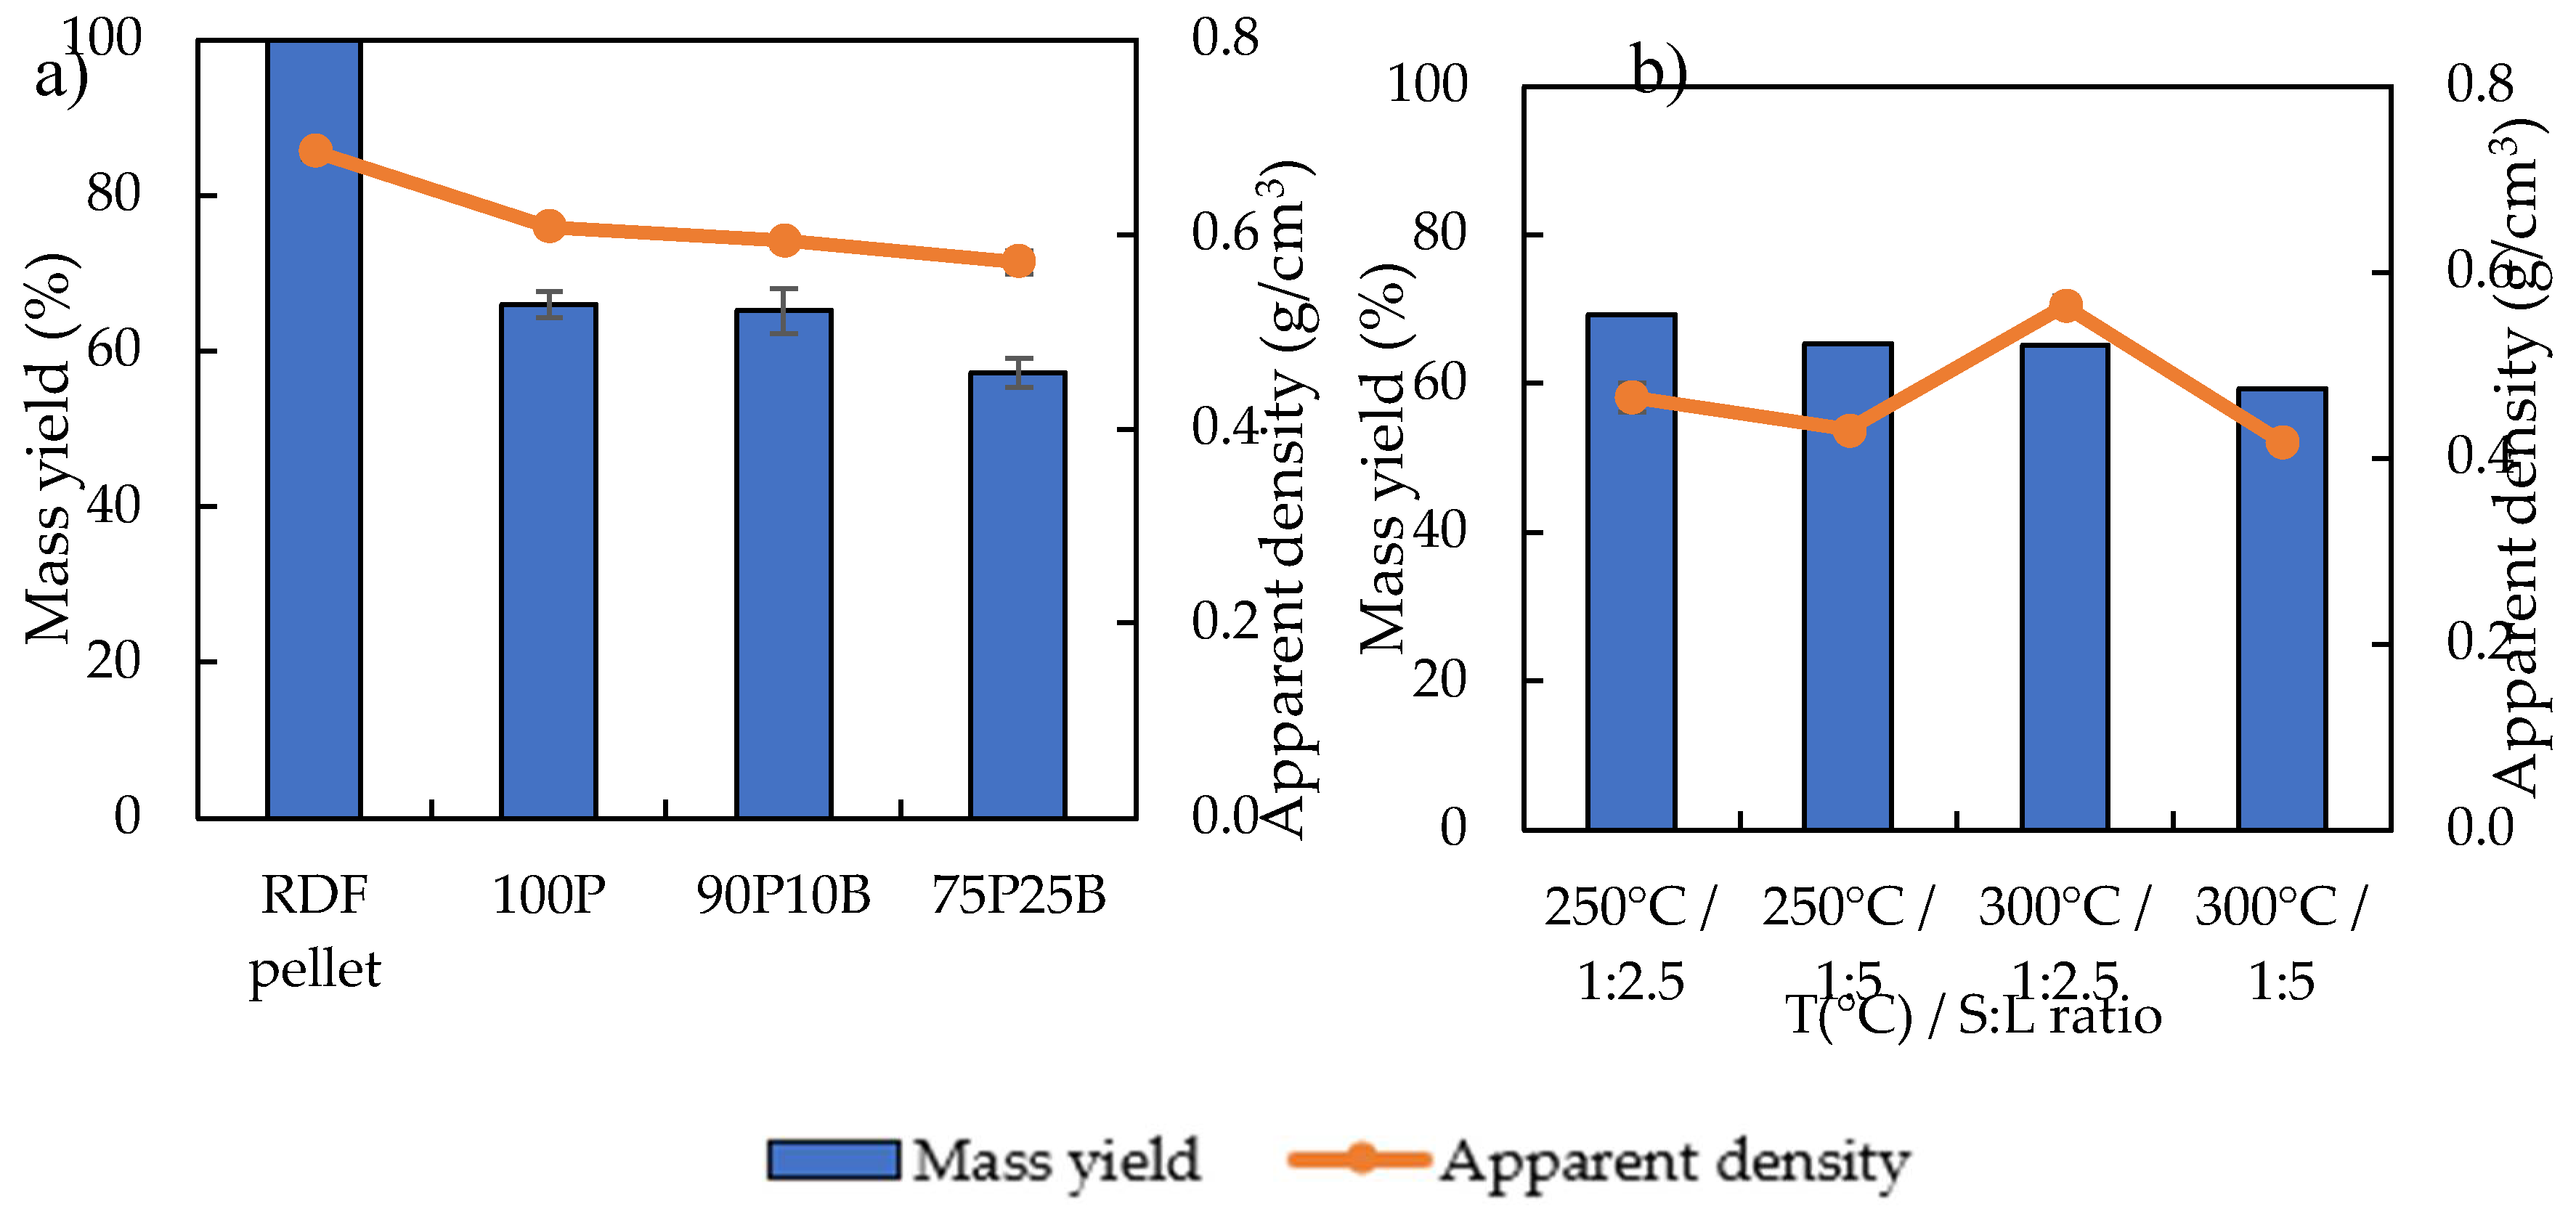
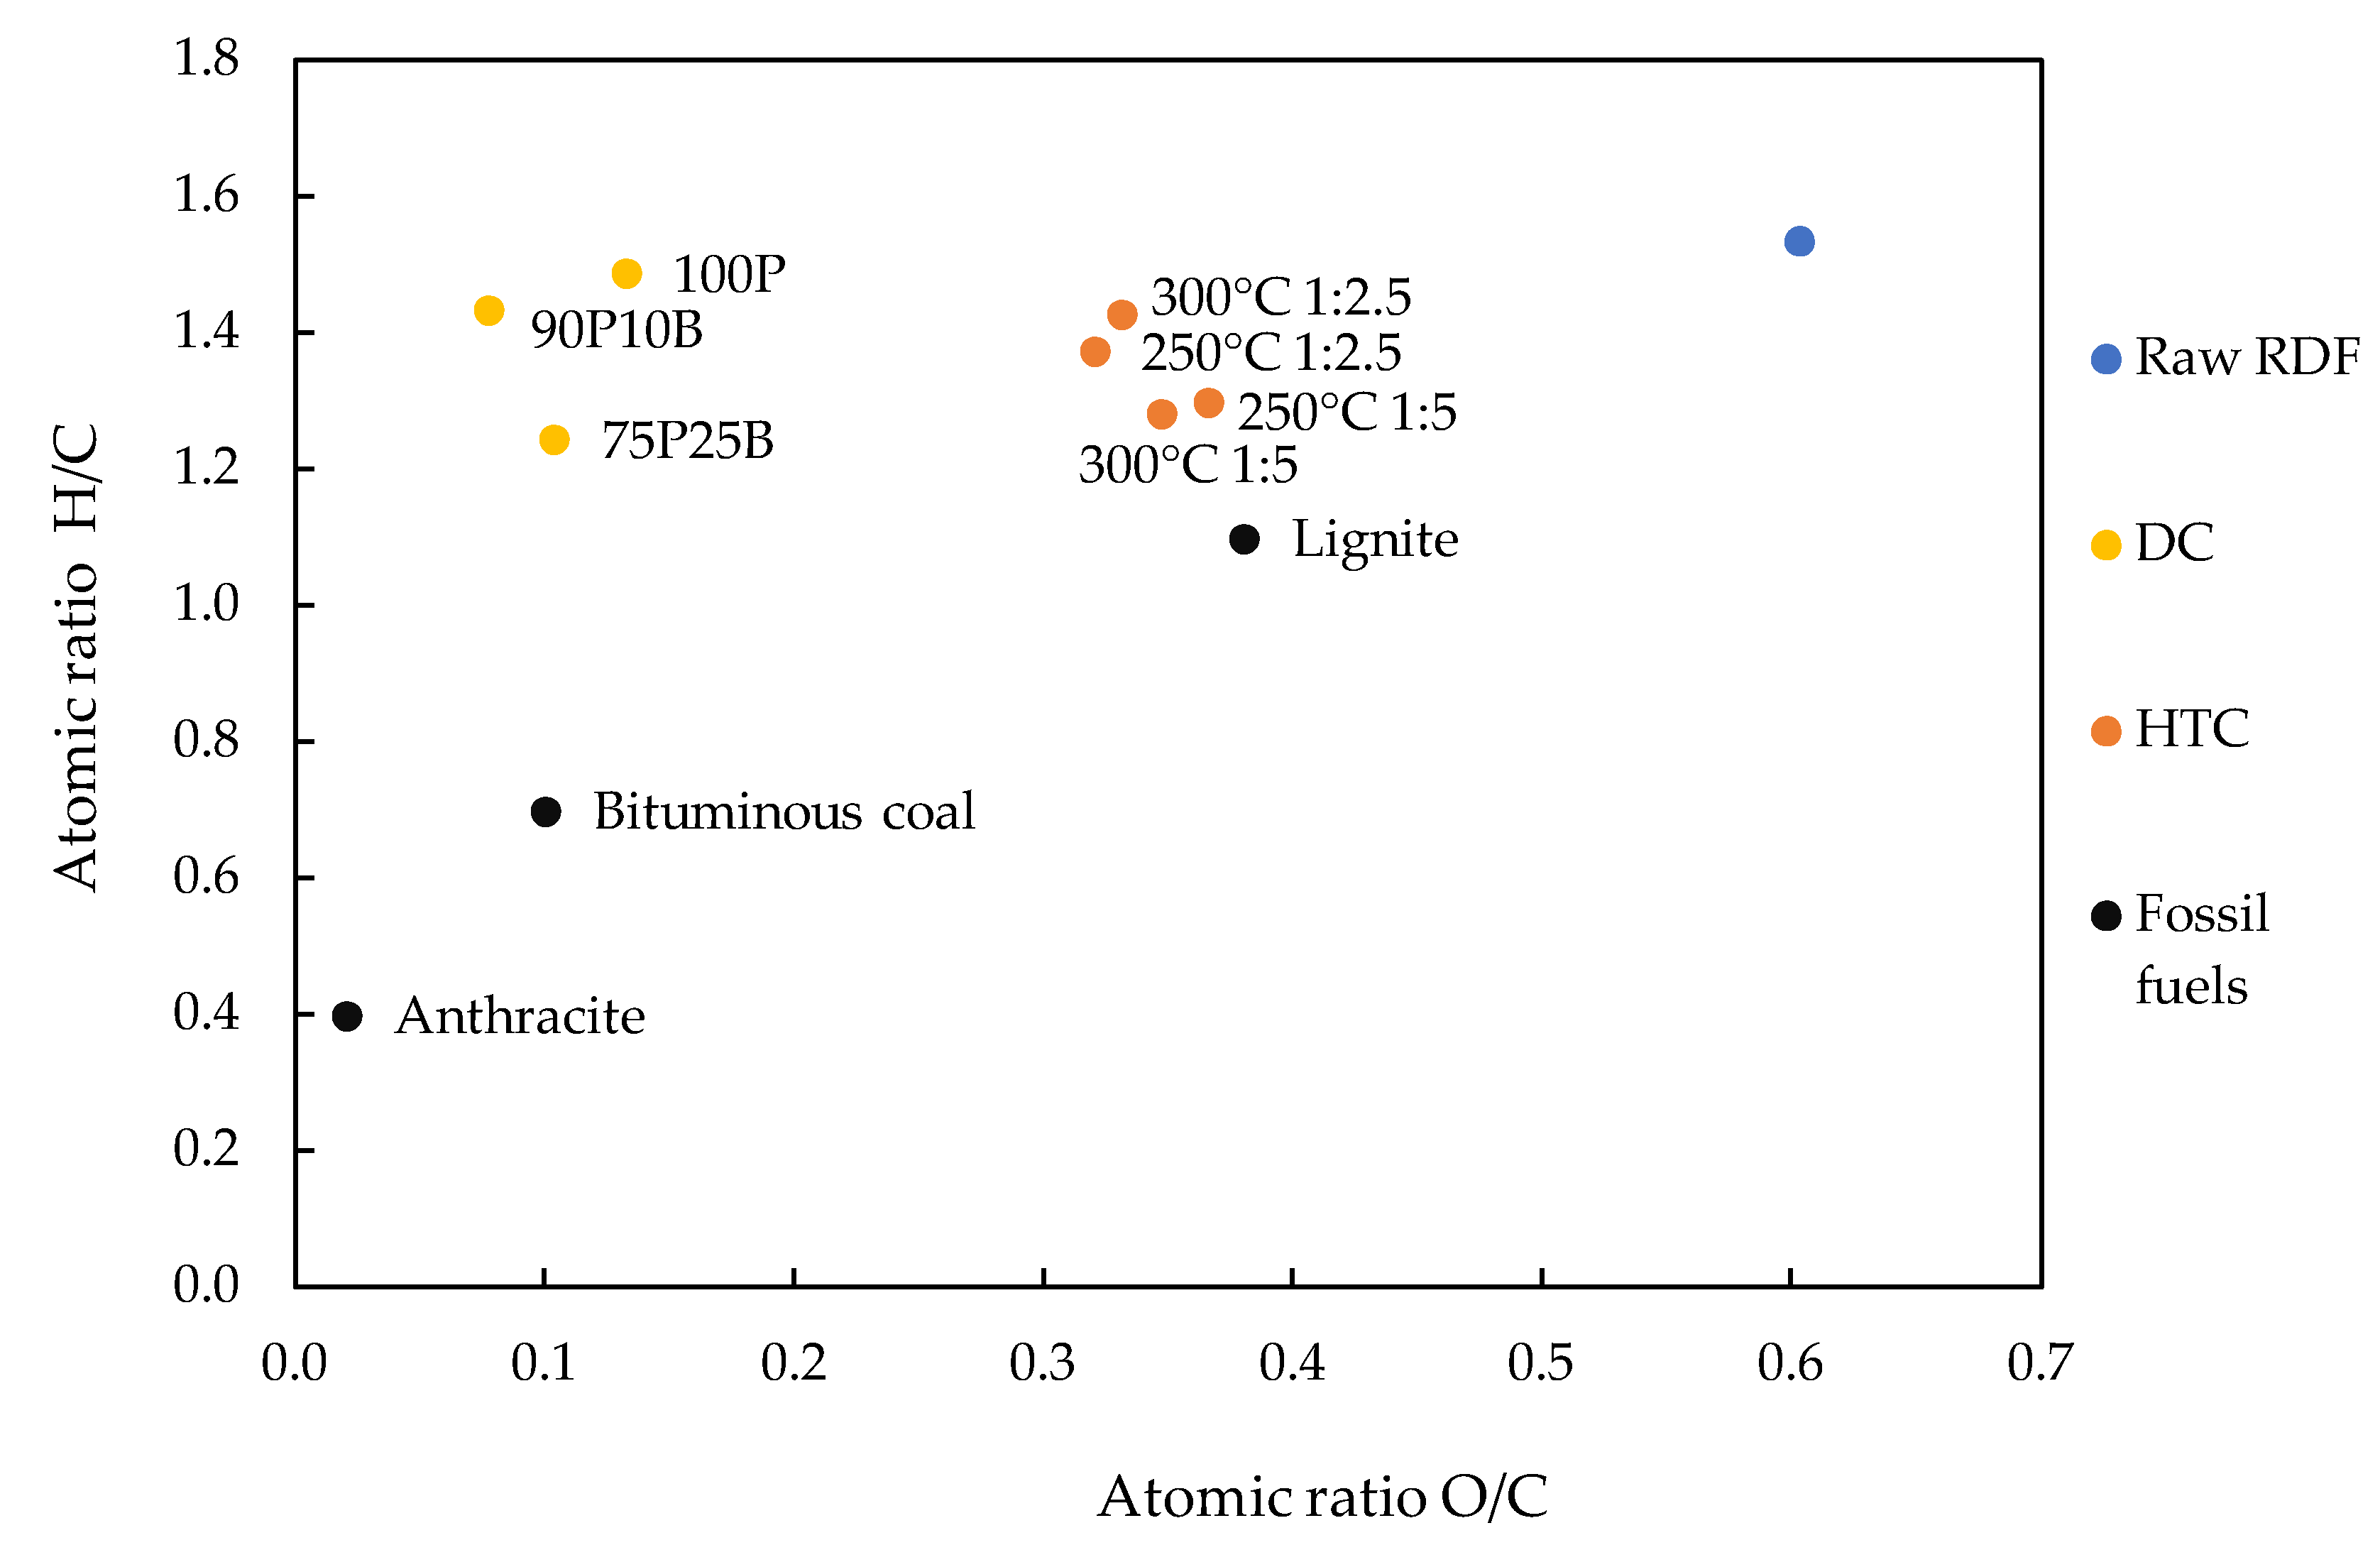
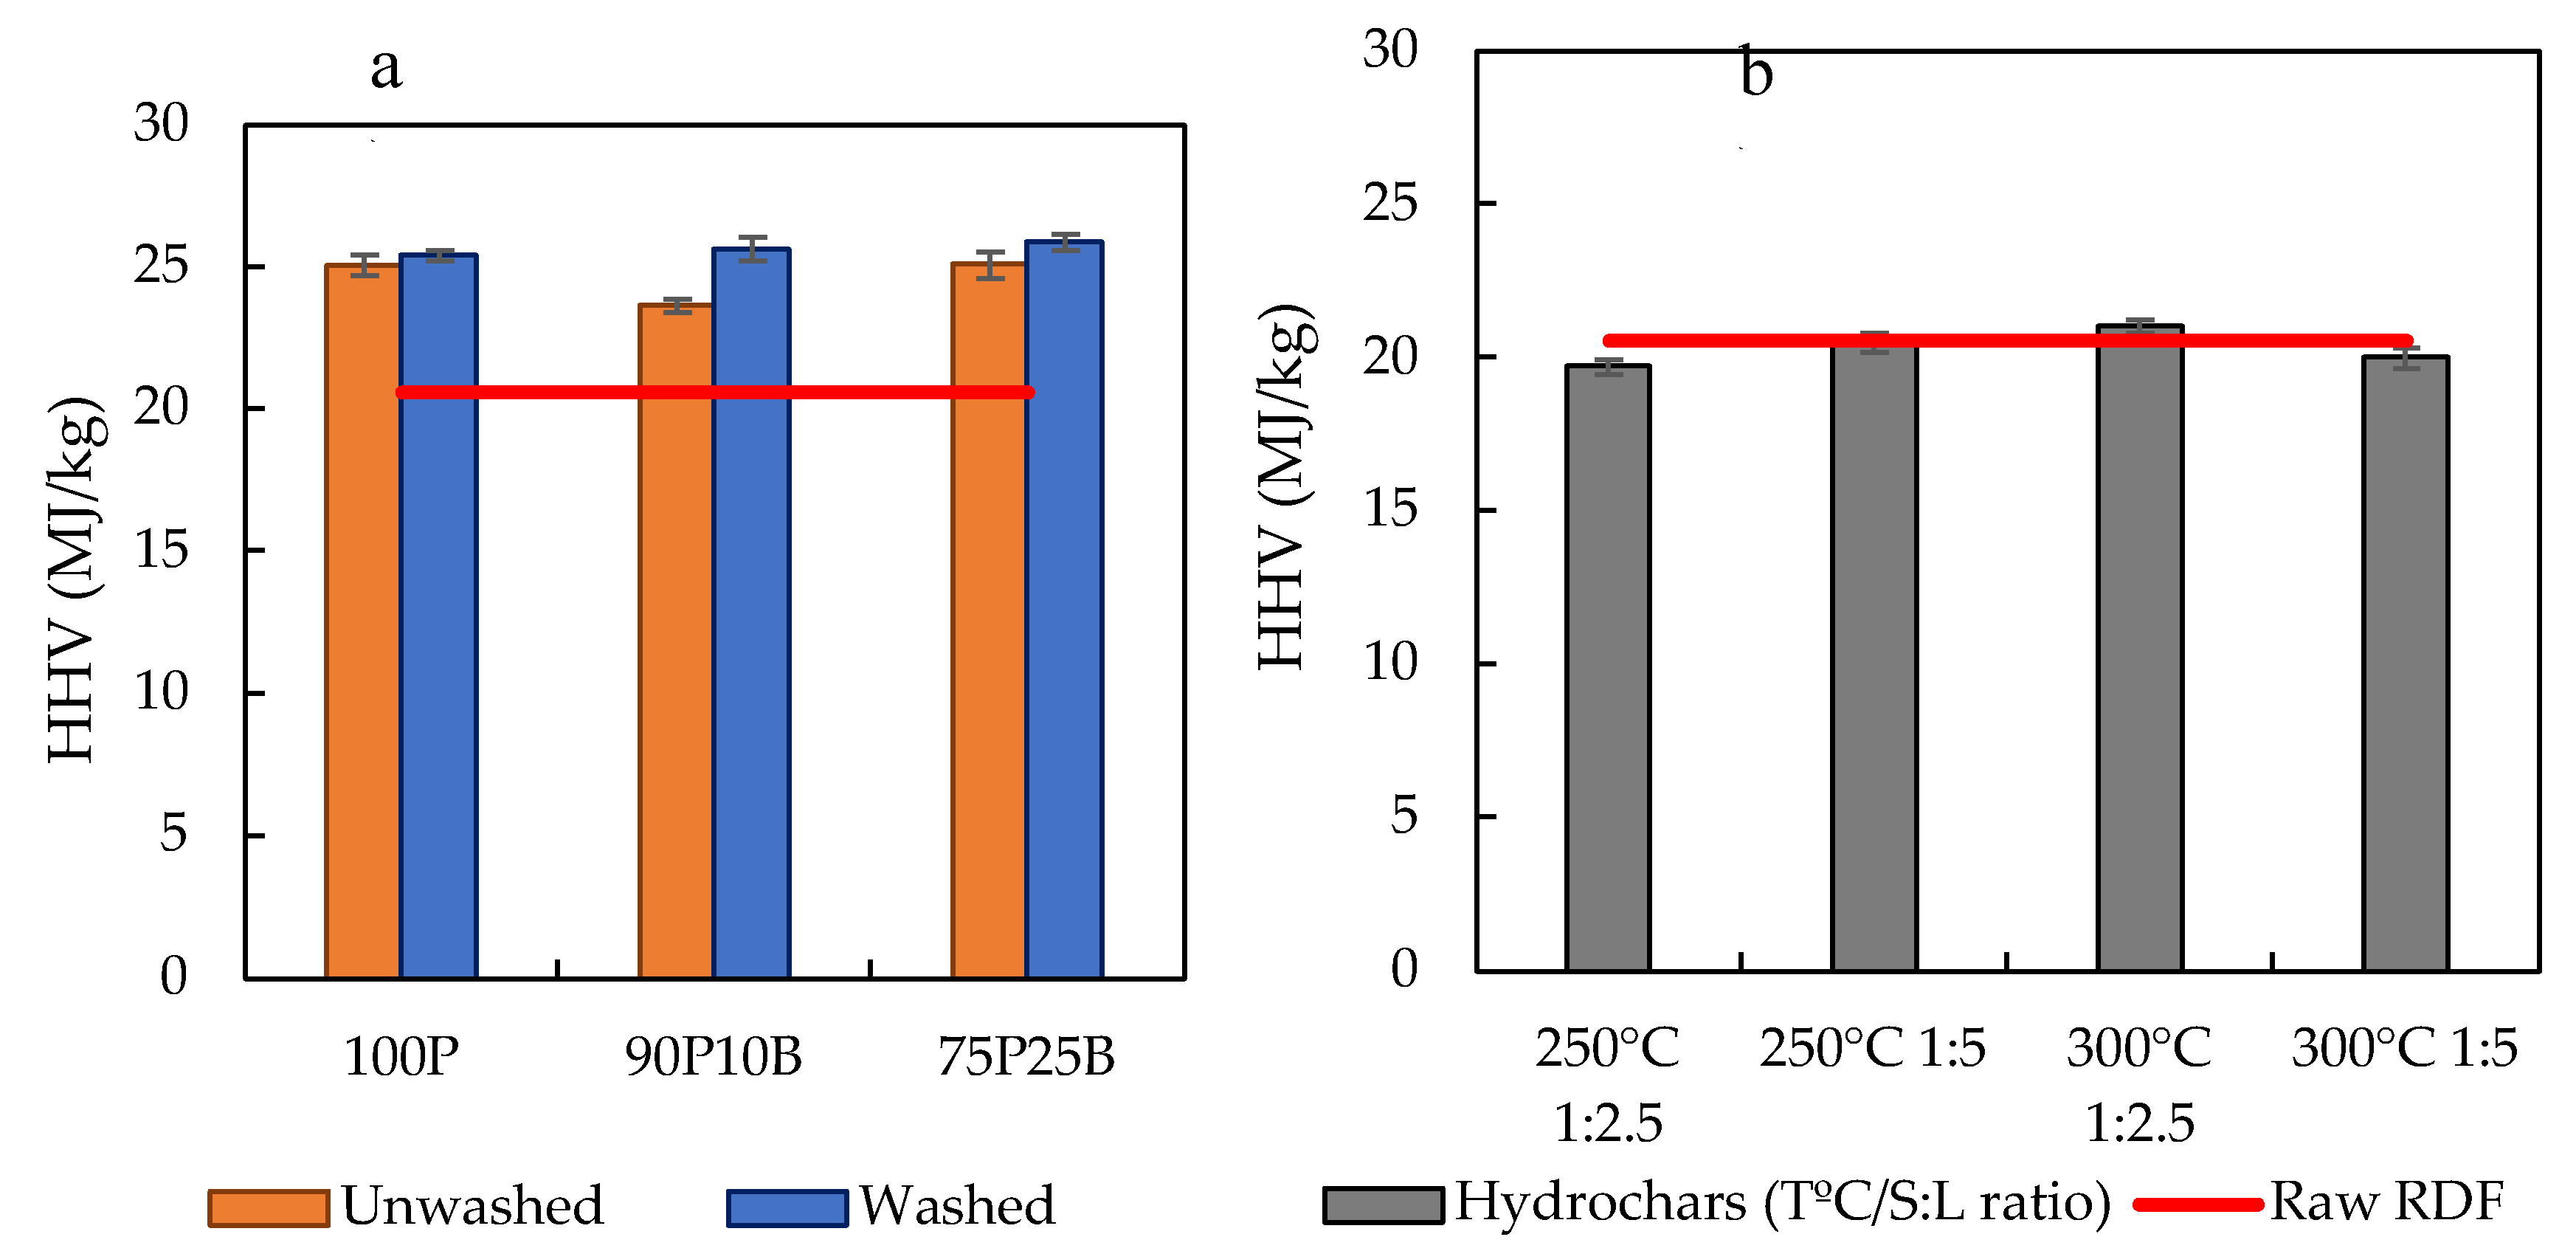
3.1. Carbonization Tests and Char’s Characterization
| Ash mineral composition |
Dry carbonization |
Hydrothermal carbonization |
||||
|---|---|---|---|---|---|---|
| 100P | 90P10B | 75P25B | 100P 250°C/1:2.5 | 100P 300°C/1:2.5 | ||
| Oxides (%, w/w) |
Al2O3 | 13.9 | 14.1 | 12.5 | 19.6 | 13.8 |
| CaO | 30.8 | 32.6 | 29.4 | 35.6 | 22.1 | |
| Fe2O3 | 5.4 | 4.3 | 3.7 | 4.8 | 3.1 | |
| K2O | 3.2 | 3.4 | 3.3 | 1.3 | 0.8 | |
| MgO | 9.0 | 9.5 | 9.8 | 5.3 | 4.4 | |
| Na2O | 1.8 | 1.9 | 1.9 | 0.8 | 0.5 | |
| SiO2 | 0.2 | 0.3 | 0.4 | 6.7 | 0.5 | |
| TiO2 | 0.6 | 0.6 | 0.7 | 0.3 | 0.2 | |
| Fouling and slagging index | B/A | 3.4 h | 3.4 h | 3.5 h | 1.8 h | 2.1 h |
| BAI | 1.1 l | 0.8 l | 0.7 l | 2.4 l | 2.3 l | |
| Fu | 7.5 h | 7.6 h | 7.6 h | 0.1 l | 0.4 l | |
| S/A | 0.0 l | 0.0 l | 0.0 l | 0.3 m | 0.0 l | |
| TA | 5.0 h | 5.3 h | 5.2 h | 2.0 h | 1.3 h | |
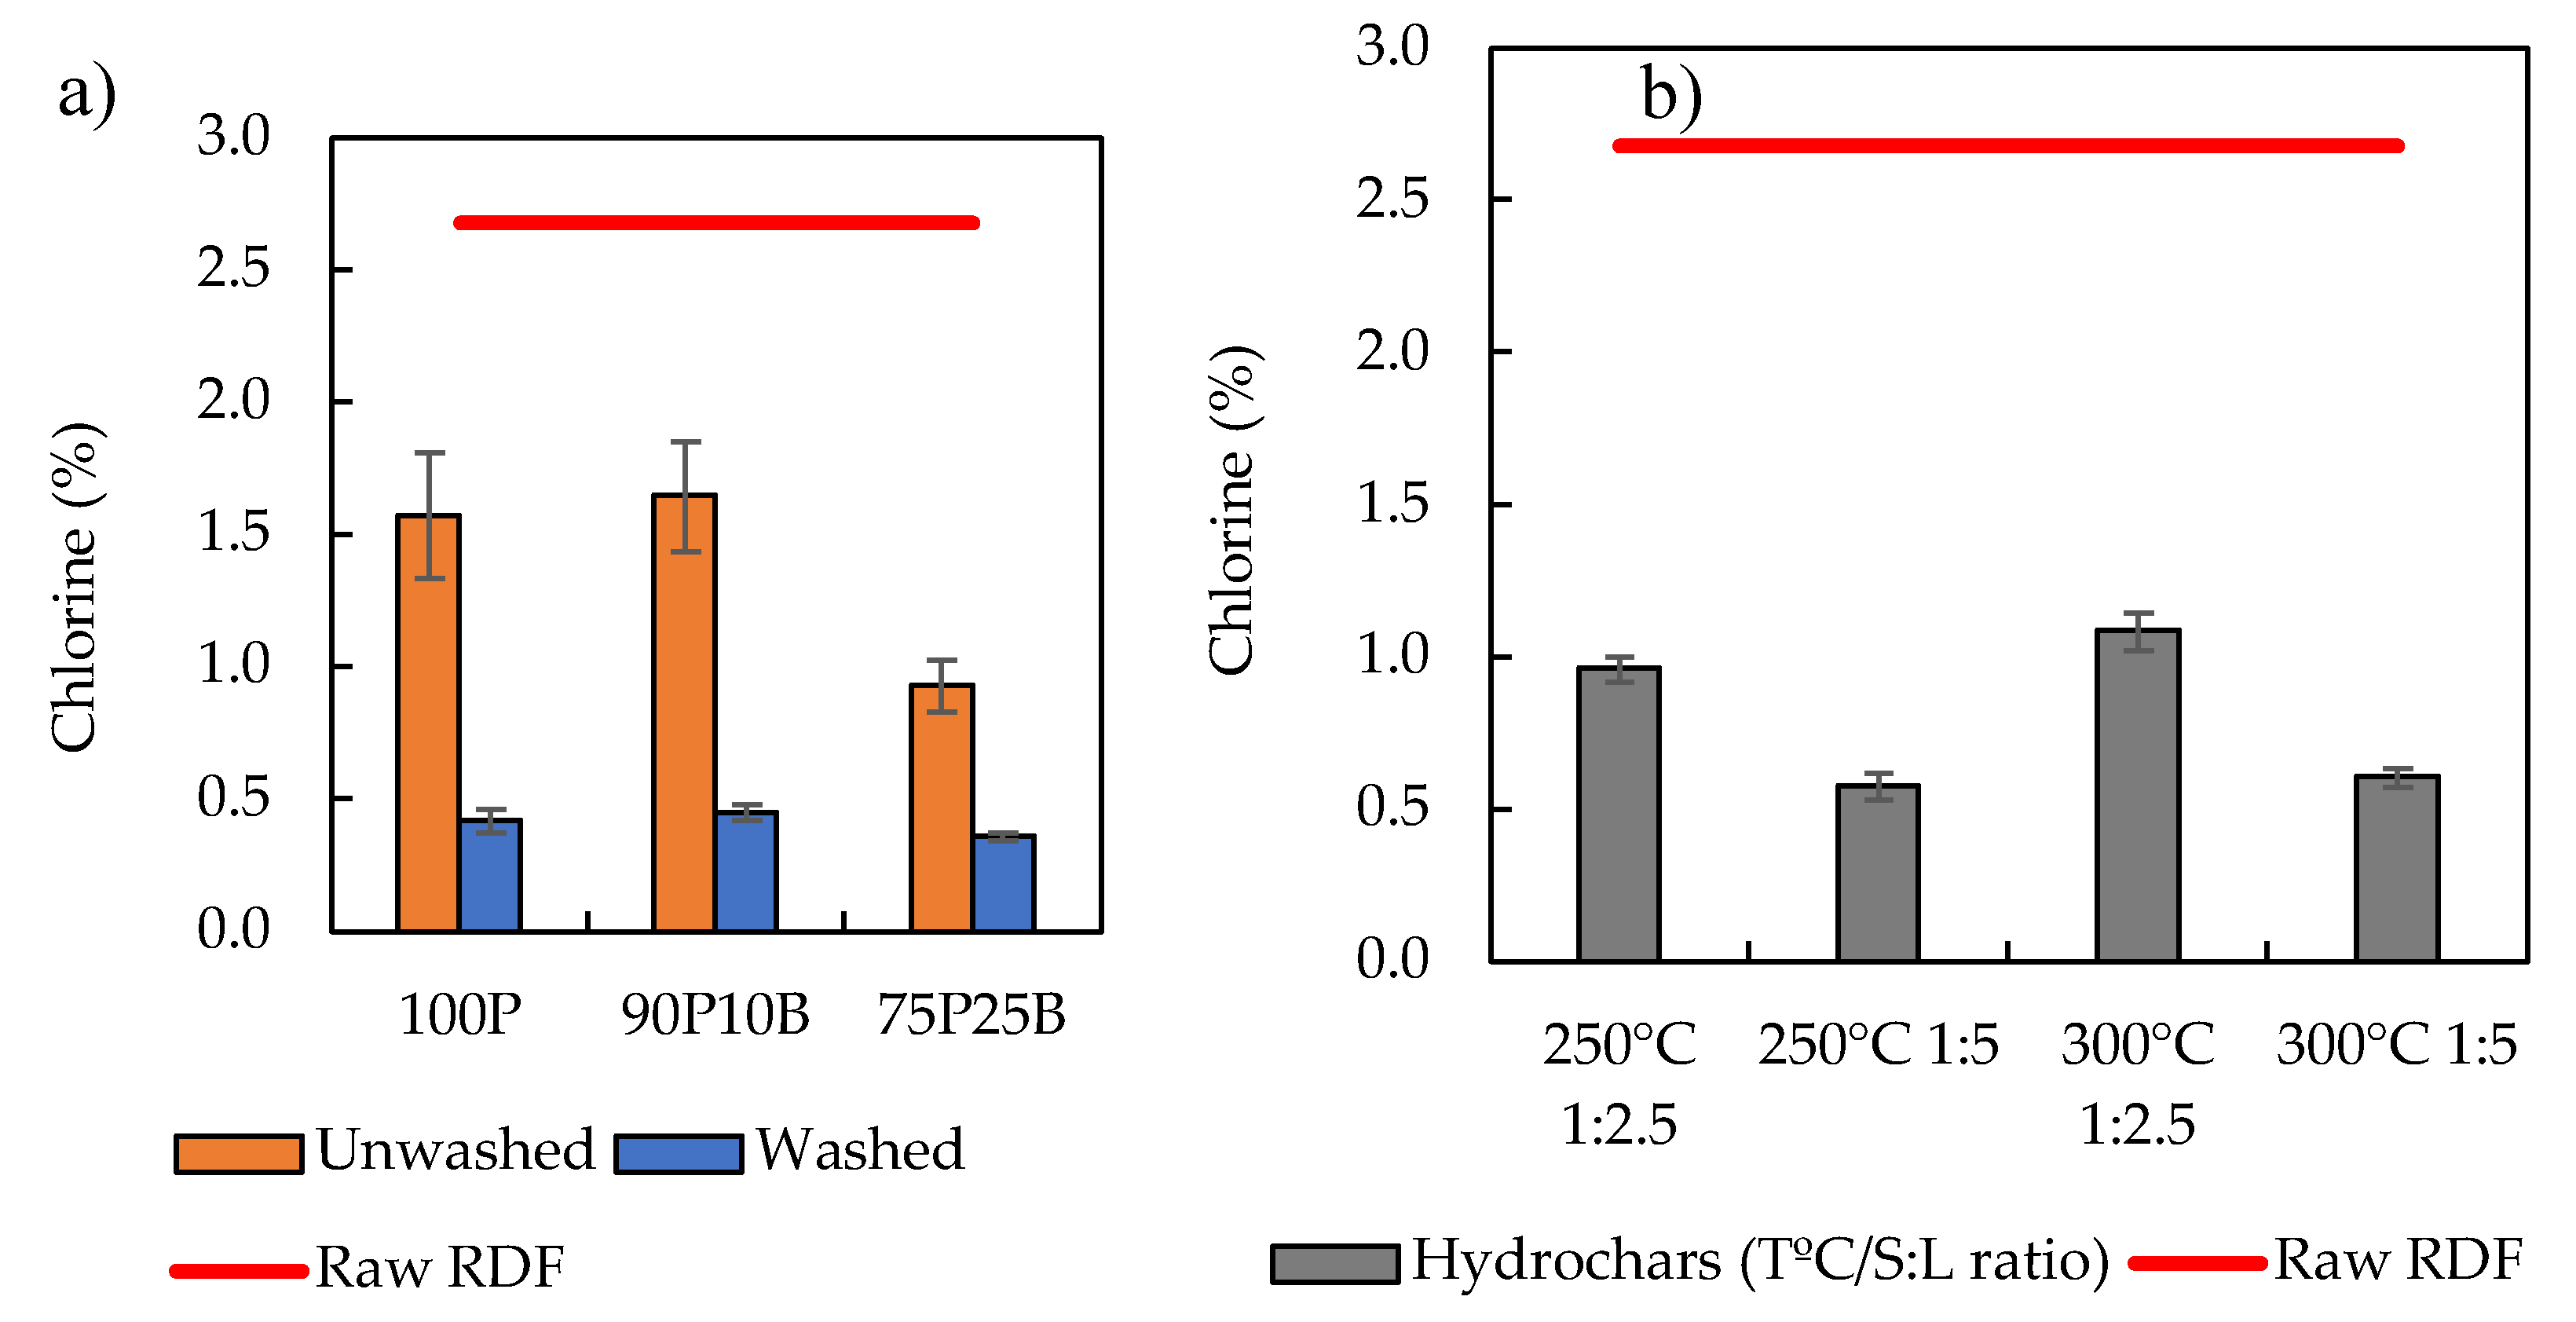
| Chlorine (%) | 0,4 | 0.4 | 0.4 | 1.0 | 1.1 | |
| Ash (%) | 26,3 | 25.0 | 21.6 | 17.2 | 21.0 | |
3.2. Effluents Characterization
4. Conclusion
Author Contributions
Funding
Data Availability Statement
Conflicts of Interest
References
- Alam, S.; Rokonuzzaman, M.; Rahman, K.S.; Haque, A.; Chowdhury, S.; Prasetya, T.A.E. Techno-economic and environmental analysis of organic municipal solid waste for energy production. Heliyon 2024, 10, e31670. [Google Scholar] [CrossRef] [PubMed]
- Wang, X.; Li, C.; Lam, C.H.; Subramanian, K.; Qin, Z-H.; Mou, J-H.; Jin, M.; Chopra, S.S.; Singh, V.; Ok, Y.S.; Yan, J.; Li, H-Y.; Lin, C.S.K. Emerging waste valorisation techniques to moderate the hazardous impacts, and their path towards sustainability. J. Hazard. Mater. 2022, 423, 127023. [Google Scholar] [CrossRef]
- Mong, G.R.; Tan, H.; Sheng, D.D.C.V.; Kek, H.Y.; Nyakuma, B.B.; Woon, K.S.; Othman, M.H.D.; Kang, H.S.; Goh, P.S.; Wong, K.Y. A review on plastic waste valorisation to advanced materials: Solutions and technologies to curb plastic waste pollution. J. Clean. Prod. 2024; 434, 140180. [Google Scholar] [CrossRef]
- Said, Z.; Sharma, P.; Nhuong, Q.T.B.; Bora, B.J.; Lichtfouse, E.; Khalid, H.M.; Luque, R.; Nguyen, X.P.; Hoang, A.T. Intelligent approaches for sustainable management and valorisation of food waste. Bioresour. Technol. 2023, 377, 128952. [Google Scholar] [CrossRef] [PubMed]
- Hong, J.; Chen, Y.; Wang, M.; Ye, L.; Qi, C.; Yuan, H.; Zheng, T.; Li, X. Intensification of municipal solid waste disposal in China. Renew. Sustain. Energy Rev. 2017, 69, 168–176. [Google Scholar] [CrossRef]
- Santos, S.M.; Nobre, C.; Brito, P.; Gonçalves, M. Brief Overview of Refuse-Derived Fuel Production and Energetic Valorization: Applied Technology and Main Challenges. Sustainability 2023, 15, 10342. [Google Scholar] [CrossRef]
- Tihin, G.L.; Mo, K.H.; Onn, C.C.; Ong, H.C.; Taufiq-Yap, Y.H.; Lee, H.V. Overview of municipal solid wastes-derived refuse-derived fuels for cement co-processing. Alexandria Eng. J. 2023, 84, 153–174. [Google Scholar] [CrossRef]
- Guo, M.; Wang, K.; Bing, X.; Cheng, J.; Zhang, Y.; Sun, X.; Guan, B.; Yu, J. Pyrolysis of plastics-free refuse derived fuel derived from municipal solid waste and combustion of the char products in lab and pilot scales: A comparative study. Fuel 2024, 359, 130335. [Google Scholar] [CrossRef]
- Domínguez, J.I.; Blanco Machín, E.; Travieso Pedroso, D.; Wagemman Herrera, E.; Cuevas Barraza, C. Advanced thermoconversion technology for municipal solid waste energetic valorization. Renew. Energy 2024, 228, 120604. [Google Scholar] [CrossRef]
- Chen, S.; Liu, Z.; Jiang, S.; Hou, H. Carbonization: A feasible route for reutilization of plastic wastes. Sci. Total Environ. 2020, 710, 136250. [Google Scholar] [CrossRef]
- Bardhan, M.; Novera, T.M.; Tabassum, M.; Islam, M.A.; Islam, M.A.; Hameed, B.H. Co-hydrothermal carbonization of different feedstocks to hydrochar as potential energy for the future world: A review. J. Clean. Prod. 2021, 298, 126734. [Google Scholar] [CrossRef]
- Lin, Y.; Ge, Y.; Xiao, H.; He, Q.; Wang, W.; Chen, B. Investigation of hydrothermal co-carbonization of waste textile with waste wood, waste paper and waste food from typical municipal solid wastes. Energy 2020, 210, 118606. [Google Scholar] [CrossRef]
- He, C.; Zhang, Z.; Ge, C.; Liu, W.; Tang, Y.; Zhunag, X.; Qiu, R. Synergistic effect of hydrothermal co-carbonization of sewage sludge with fruit and agricultural wastes on hydrochar fuel quality and combustion behavior. Waste Manag. 2019, 100, 171–181. [Google Scholar] [CrossRef] [PubMed]
- Li, Q.; Lin, H.; Zhang, S.; Yuan, X.; Gholizadeh, M.; Wang, Y.; Xiang, J.; Hu, S.; Hu, X. Co-hydrothermal carbonization of swine manure and cellulose: Influence of mutual interaction of intermediates on properties of the products. Sci. Total Environ. 2021, 791, 148134. [Google Scholar] [CrossRef]
- Dong, X.; Wang, Z.; Zhang, J.; Zhan, W.; Gao, L.; He, Z. Synthesis and characteristics of carbon-based synfuel from biomass and coal powder by synergistic co-carbonization technology. Renew. Energy 2024, 227, 120458. [Google Scholar] [CrossRef]
- Rago, Y.P.; Collard, F.X.; Görgens, J.F.; Surroop, D.; Mohee, R. Torrefaction of biomass and plastic from municipal solid waste streams and their blends: Evaluation of interactive effects. Fuel 2020, 277, 118089. [Google Scholar] [CrossRef]
- Shen, Y.; Yu, S.; Ge, S.; Chen, X.; Ge, X.; Chen, M. Hydrothermal carbonization of medical wastes and lignocellulosic biomass for solid fuel production from lab-scale to pilot-scale. Energy 2017, 118, 312–323. [Google Scholar] [CrossRef]
- Yao, Z.; Ma, X. Characteristics of co-hydrothermal carbonization on polyvinyl chloride wastes with bamboo. Bioresour. Technol. 2018, 247, 302–309. [Google Scholar] [CrossRef] [PubMed]
- Brand, M.A.; Mariano Rodrigues, T.; Peretti da Silva, J.; Oliveira, J. Recovery of agricultural and wood wastes: The effect of biomass blends on the quality of pellets. Fuel 2021, 284, 118881. [Google Scholar] [CrossRef]
- Yang, Y.; Sun, M.; Zhang, M.; Zhang, K.; Wang, D.; Lei, C. A fundamental research on synchronized torrefaction and pelleting of biomass. Renew. Energy 2019, 142, 668–676. [Google Scholar] [CrossRef]
- Kaliyan, N.; Vance Morey, R. Factors affecting strength and durability of densified biomass products. Biomass and Bioenergy 2009, 33, 337–359. [Google Scholar] [CrossRef]
- Sprenger, C.J.; Tabil, L.G.; Soleimani, M.; Agnew, J.; Harrison, A. Pelletization of refuse-derived fuel fluff to produce high quality feedstock. J. Energy Resour. Technol. Trans. ASME, 2018; 140, 042003. [Google Scholar] [CrossRef]
- Zaini, I.N.; Wen, Y.; Mousa, E.; Jönsson, P.G.; Yang, W. Primary fragmentation behavior of refuse derived fuel pellets during rapid pyrolysis. Fuel Process. Technol. 2021, 216, 106796. [Google Scholar] [CrossRef]
- García, R.; González-Vázquez, M.P.; Rubiera, F.; Pevida, C.; Gil, M.V. Co-pelletization of pine sawdust and refused derived fuel (RDF) to high-quality waste-derived pellets. J. Clean. Prod. 2021, 328, 129635. [Google Scholar] [CrossRef]
- Rezaei, H.; Yazdanpanah, F.; Lim, C.J.; Sokhansanj, S. Pelletization properties of refuse-derived fuel - Effects of particle size and moisture content. Fuel Process. Technol. 2020, 205, 106437. [Google Scholar] [CrossRef]
- Surup, G.R.; Leahy, J.J.; Timko, M.T.; Trubetskaya, A. Hydrothermal carbonization of olive wastes to produce renewable, binder-free pellets for use as metallurgical reducing agents. Renew. Energy 2020, 155, 347–357. [Google Scholar] [CrossRef]
- Cao, Z.; Zhang, Z.; Huang, X.; Liu, H.; Sun, M.; Lyu, J. Correlations between the compressive strength of the hydrochar pellets and the chemical components: Evolution and densification mechanism. J. Anal. Appl. Pyrolysis 2020, 152, 104956. [Google Scholar] [CrossRef]
- Sharma, H.B.; Dubey, B.K. Binderless fuel pellets from hydrothermal carbonization of municipal yard waste: Effect of severity factor on the hydrochar pellets properties. J. Clean. Prod. 2020, 277, 124295. [Google Scholar] [CrossRef]
- Sharma, H.B.; Dubey, B.K. Co-hydrothermal carbonization of food waste with yard waste for solid biofuel production: Hydrochar characterization and its pelletization. Waste Manag. 2020, 118, 521–533. [Google Scholar] [CrossRef] [PubMed]
- Jewiarz, M.; Mudryk, K.; Wróbel, M.; Fraczek, J.; Dziedzic, K. Parameters affecting RDF-based pellet quality. Energies 2020, 13, 910. [Google Scholar] [CrossRef]
- Nasiri, S.; Hajinezhad, A.; Kianmehr, M.H.; Tajik, S. Enhancing municipal solid waste efficiency through Refuse Derived Fuel pellets: Additive analysis, die retention time, and temperature impact. Energy Reports 2023, 10, 941–957. [Google Scholar] [CrossRef]
- Ovčačíková, H. , Velička, M., Vlček, J., Topinková, M., Klárová, M., Burda, J. Corrosive Effect of Wood Ash Produced by Biomass Combustion on Refractory Materials in a Binary Al–Si System. Materials 2022, 15, 5796. [Google Scholar] [CrossRef] [PubMed]
- Liu, X. , Tan, H., Wang, X., Wang, Z., Xiong, X. Oxidation reactivity and kinetic analysis of bituminous coal char from high-temperature pyrolysis: Effect of heating rate and pyrolysis temperature. Thermochim. Acta 2020, 690, 178660. [Google Scholar] [CrossRef]
- Longo, A. , Sen, A.U., Nobre, C., Brito, P., Gonçalves, M. Dry and Hydrothermal Co-Carbonization of Mixed Refuse-Derived Fuel (RDF) for Solid Fuel Production. Reactions 2024, 5, 77–97. [Google Scholar] [CrossRef]
- Kambo, H.S. , Dutta, A. Comparative evaluation of torrefaction and hydrothermal carbonization of lignocellulosic biomass for the production of solid biofuel. Energy Convers. Manag. 2015, 105, 746–755. [Google Scholar] [CrossRef]
- Verhoeff, F. , Adell i Arnuelos, A., Boersma, A.R., Pels, J.R., Lensselink, J., Kiel, J.H.A., Schukken, H. TorTech Torrefaction Technology for the production of solid bioenergy carriers from biomass and waste. Energy Research Centre of the Netherlands, 2011; 82pp. [Google Scholar]
- Chen, W.H. , Lu, K.M., Tsai, C.M. An experimental analysis on property and structure variations of agricultural wastes undergoing torrefaction. Appl. Energy 2012, 100, 318–325. [Google Scholar] [CrossRef]
- Kim, D. , Park, K.Y., Yoshikawa, K. Conversion of Municipal Solid Wastes into Biochar through Hydrothermal Carbonization. Eng. Appl. Biochar 2017, 31–46. [Google Scholar] [CrossRef]
- Alves, O. , Nobre, C., Durão, L., Monteiro, E., Brito, P., Gonçalves, M. Effects of dry and hydrothermal carbonisation on the properties of solid recovered fuels from construction and municipal solid wastes. Energy Convers. Manag. 2021, 237, 114101. [Google Scholar] [CrossRef]
- Vassilev, S.V. , Baxter, D., Andersen, L.K., Vassileva, C.G. An overview of the chemical composition of biomass. Fuel 2010, 89, 913–933. [Google Scholar] [CrossRef]
- Li, M-F. , Chen, L-X., Li, X., Chen, C-Z., Lai, Y-C., Xiao, X., Wu, Y-Y. Evaluation of the structure and fuel properties of lignocelluloses through carbon dioxide torrefaction. Energy Convers. Manag. 2016, 119, 463–472. [Google Scholar] [CrossRef]
- Bach, Q.V. , Skreiberg, O. Upgrading biomass fuels via wet torrefaction: A review and comparison with dry torrefaction. Renew. Sustain. Energy Rev. 2016, 54, 665–677. [Google Scholar] [CrossRef]
- Mota-Panizio, R. , Hermoso-Orzáez, M.J., Carmo-Calado, L., Calado, H., Goncalves, M., Brito, P. Co-carbonization of a mixture of waste insulation electric cables (WIEC) and lignocellulosic waste, for the removal of chlorine: Biochar properties and their behaviors. Fuel 2022, 320, 123932. [Google Scholar] [CrossRef]
- Nobre, C. , Alves, O., Durão, L., Şen, A., Vilarinho, C., Gonçalves, M. Characterization of hydrochar and process water from the hydrothermal carbonization of Refuse Derived Fuel. Waste Manag. 2021, 120, 303–313. [Google Scholar] [CrossRef]
| Thermochemical process | Sample | Sample composition (%) | S/L ratio |
T (°C) |
t (min.) |
|
|---|---|---|---|---|---|---|
| RDF | Biomass | |||||
| Dry carbonization (DC) |
100P | 100 | - | - | 400 | 30 |
| 90P10B | 90 | 10 | - | |||
| 75P25B | 75 | 25 | - | |||
| Hydrothermal carbonization (HTC) |
100P | 100 | - | 1:2.5 | 250 | 30 |
| 1:5 | 300 | |||||
| Sample | Proximate composition (%) | |||
|---|---|---|---|---|
| Moisture | Volatile matter* | Ash* | Fixed carbon* | |
| Raw RDF pellet | 12.6 ± 0.3 | 76.9 ± 3.7 | 15.9 ± 1.1 | 7.2 ± 2.9 |
| LBW | 10.7 ± 0.2 | 76.0 ± 1.0 | 6.2 ± 0.5 | 17.8 ± 1.4 |
| 100P | 2.5 ± 0.1 | 63.1 ± 1.3 | 26.3 ± 0.7 | 10.6 ± 1.5 |
| 90P10B | 3.0 ± 0.1 | 60.8 ± 1.0 | 25.0 ± 0.3 | 14.2 ± 1.2 |
| 75P25B | 2.6 ± 0.1 | 55.2 ± 0.6 | 21.6 ± 0.4 | 23.1 ± 0.8 |
| 100P 250°C 1:2.5 | 2.7 ± 0.0 | 70.1 ± 1.3 | 22.5 ± 1.4 | 7.0 ± 2.2 |
| 100P 250°C 1:5 | 1.8 ± 0.0 | 72.8 ± 1.0 | 21.0 ± 1.7 | 6.2 ± 0.6 |
| 100P 300°C 1:2.5 | 1.9 ± 0.1 | 70.6 ± 2.5 | 17.2 ± 2.2 | 13.3 ± 0.8 |
| 100P 300°C 1:5 | 2.7 ± 0.0 | 71.4 ± 0.9 | ± 0.5 | 8.3 ± 1.2 |
| Sample | Elemental composition (%, daf) | ||||
|---|---|---|---|---|---|
| C | H | N | S | O | |
| Raw RDF | 45.8 ± 1.9 | 5.9 ± 0.4 | 1.0 ± 0.2 | 0.1 ± 0.0 | 31.3 ± 2.5 |
| LBW | 49.4 ± 0.2 | 6.3 ± 0.1 | 0.9 ± 0.1 | 0.1 ± 0.0 | 37.1 ± 0.3 |
| 100P | 55.5 ± 1.7 | 6.9 ± 0.3 | 1.5 ± 0.2 | 0.0 ± 0.0 | 9.8 ± 1.0 |
| 90P10B | 60.0 ± 1.1 | 7.2 ± 0.2 | 1.7 ± 0.1 | 0.0 ± 0.0 | 6.2 ± 0.3 |
| 75P25B | 61.7 ± 1.8 | 6.4 ± 0.3 | 1.7 ± 0.2 | 0.0 ± 0.0 | 8.5 ± 0.8 |
| 100P 250°C 1:2.5 | 47.8 ± 1.1 | 5.5 ± 0.2 | 1.5 ± 0.1 | 0.2 ± 0.0 | 20.4 ± 1.5 |
| 100P 250°C 1:5 | 49.6 ± 1.1 | 5.9 ± 0.2 | 1.3 ± 0.1 | 0.2 ± 0.0 | 21.9 ± 1.6 |
| 100P 300°C 1:2.5 | 49.7 ± 1.6 | 5.4 ± 0.3 | 1.7 ± 0.2 | 0.2 ±0.1 | 24.2 ± 1.2 |
| 100P 300°C 1:5 | 49.5 ± 1.3 | 5.3 ± 0.2 | 1.6 ± 0.1 | 0.2 ± 0.0 | 22.9 ± 1.5 |
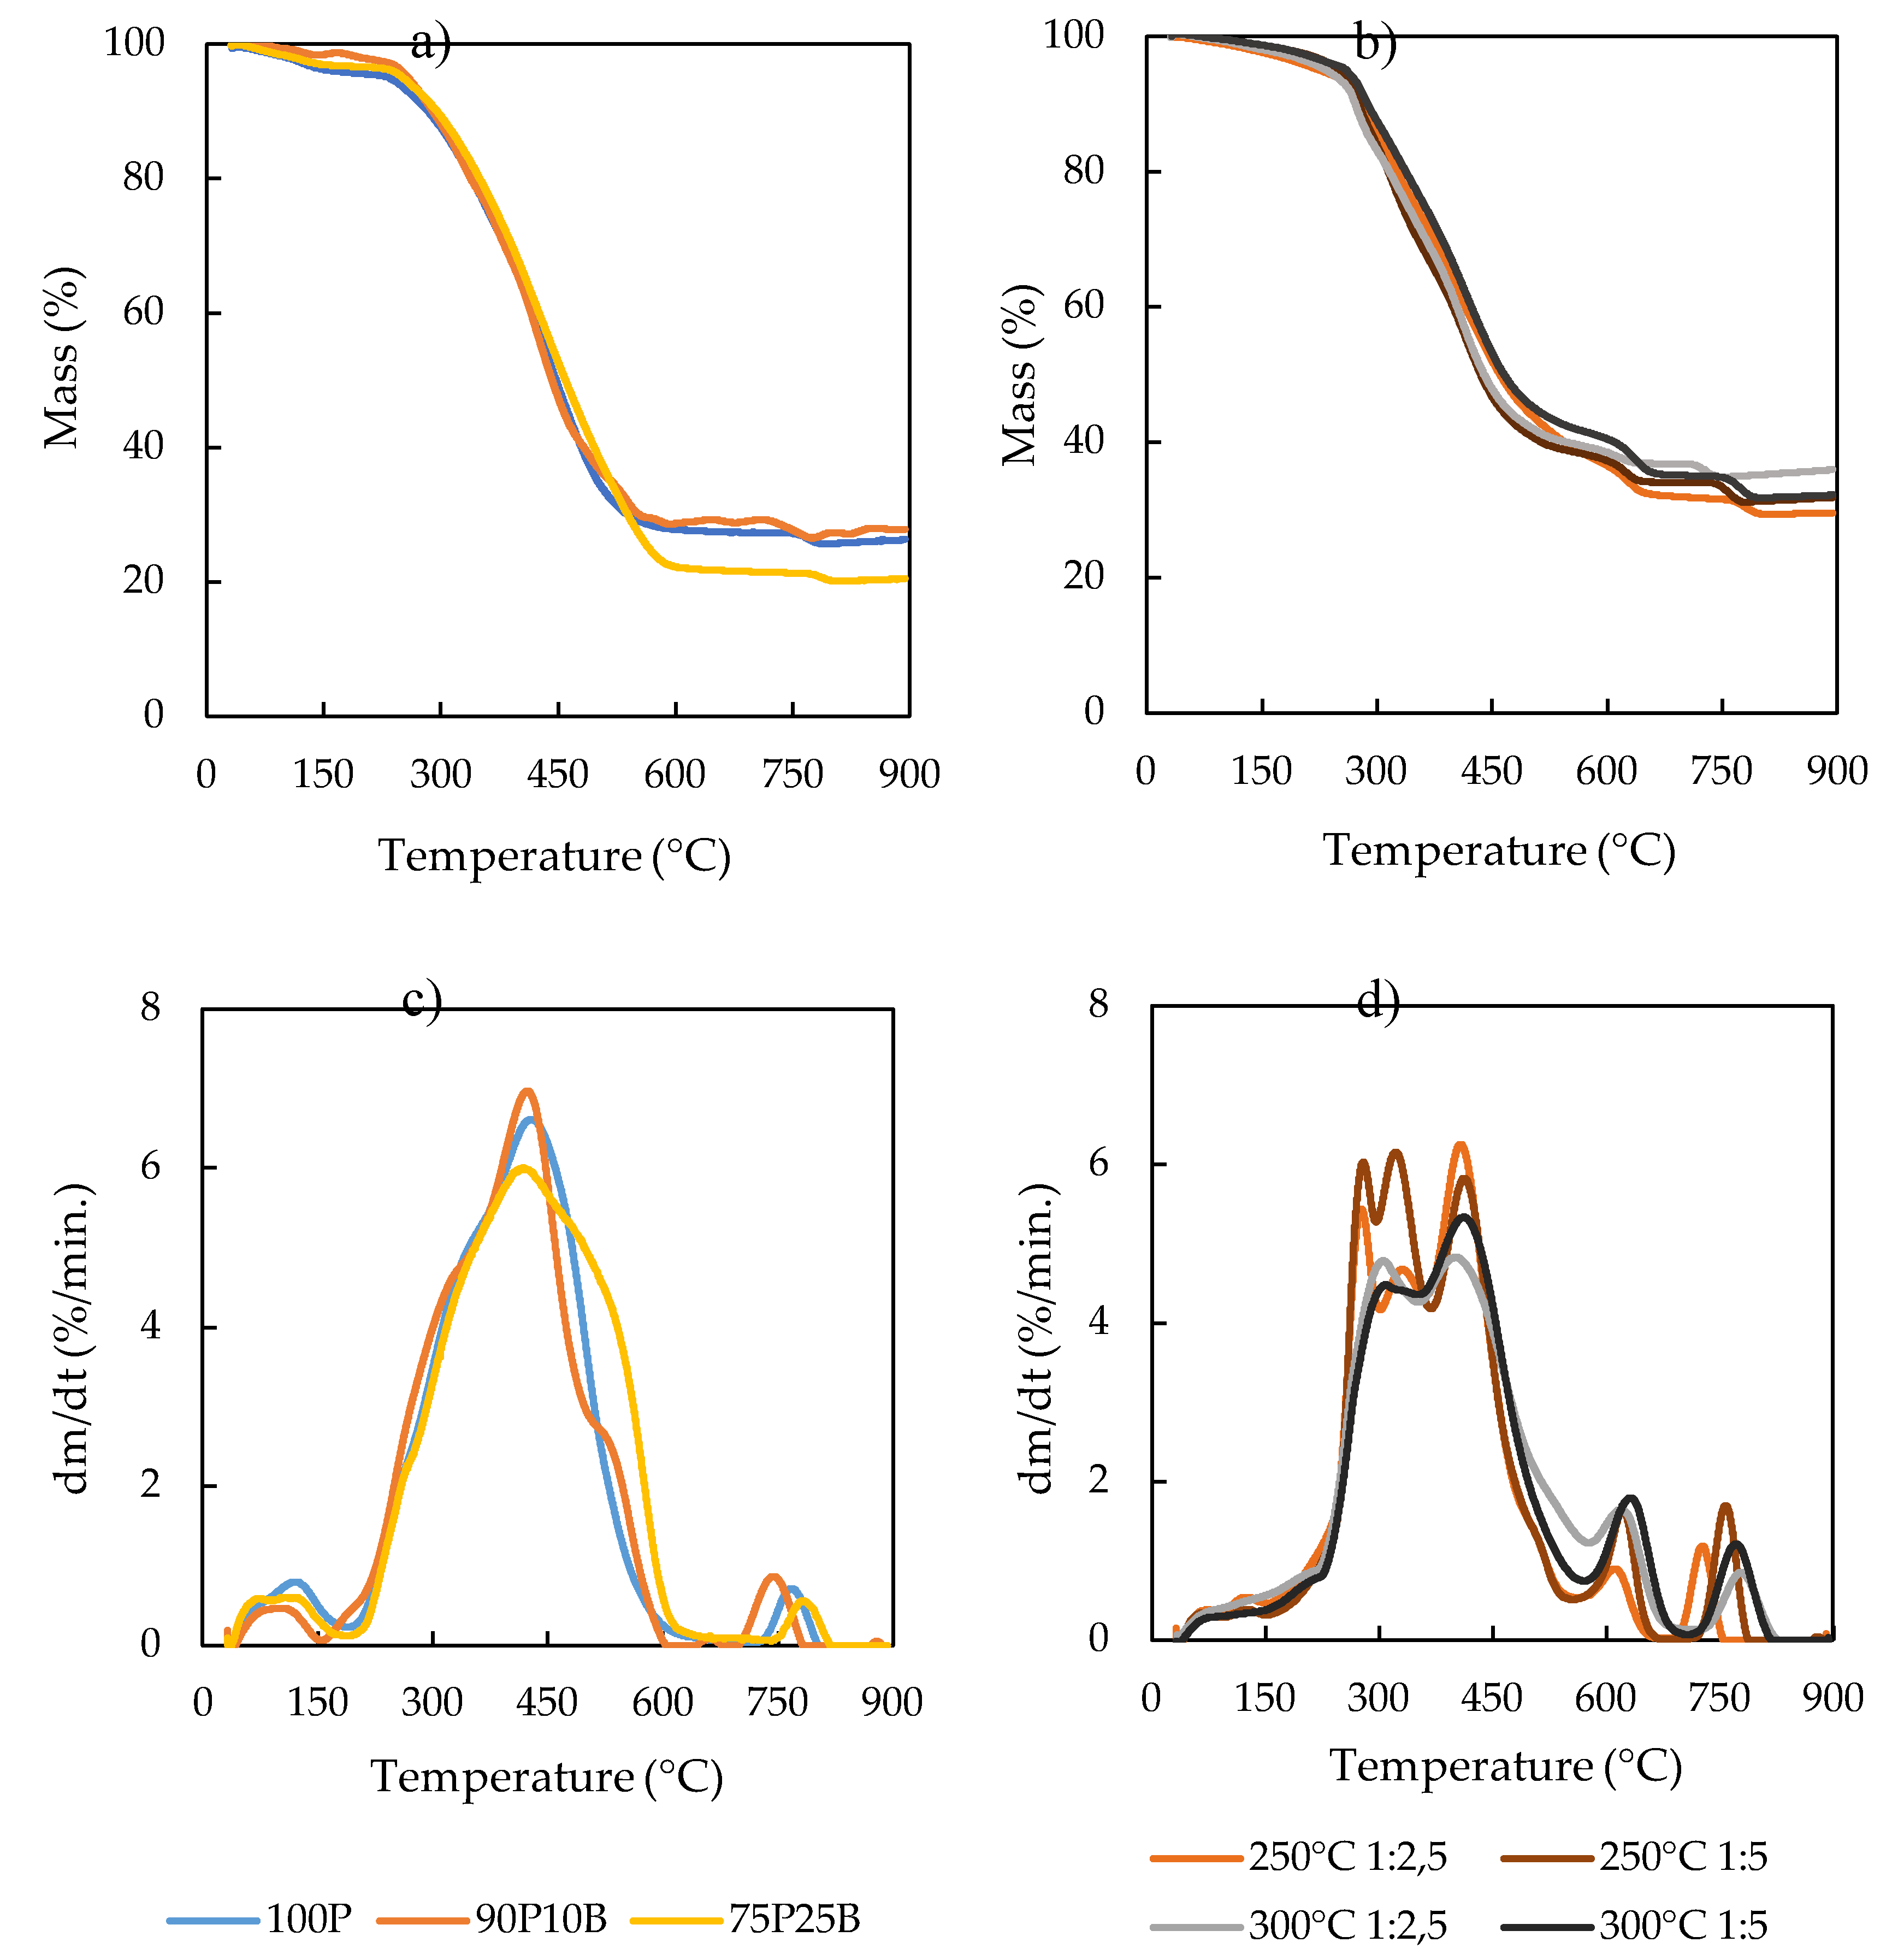
| Sample | Ti (°C) |
Tb (°C) |
T1 (°C) |
T2 (°C) |
DTG1 (%/min.) | DTG2 (%/min.) |
|---|---|---|---|---|---|---|
| 100P | 332 | 765 | 441 | 769 | 6.6 | 0.7 |
| 90P10B | 332 | 760 | 422 | 745 | 7.0 | 0.9 |
| 75P25B | 337 | 766 | 418 | 782 | 6.0 | 0.5 |
| 100P 250 1:2,5 | 299 | 732 | 408 | 727 | 6.2 | 1.2 |
| 100P 250 1:5 | 310 | 850 | 324 | 757 | 6.1 | 1.7 |
| 100P 300 1:2,5 | 288 | 796 | 408 | 776 | 4.8 | 0.9 |
| 100P 300 1:5 | 300 | 798 | 422 | 764 | 5.3 | 1.2 |
| Analysis | Samples | |||||||
|---|---|---|---|---|---|---|---|---|
| DC | HTC | |||||||
| 100P | 90P10B | 75P25B | 100P 250/1:2,5 |
100P 250/1:5 | 100P 300/1:2,5 | 100P 300/1:5 | ||
| pH | 6.8 | 6.8 | 6.7 | 4.8 | 4.8 | 4.8 | 5.0 | |
| COD (g/L) | 4.3 | 3.4 | 4.5 | 61.0 | 37.3 | 60.4 | 37.1 | |
| Chlorides (mg/L) | 1.8 | 1.9 | 1.3 | 4.1 | 2.1 | 5.6 | 2.5 | |
| Total solids (g/L) | 8.3 | 8.1 | 7.7 | 41.8 | 14.8 | 43.4 | 11.9 | |
| Volatile solids (g/L) | 4.4 | 4.1 | 4.4 | 31.2 | 11.4 | 24.7 | 8.7 | |
| Fixed solids (g/L) | 3.9 | 3.9 | 3.3 | 10.6 | 3.4 | 18.7 | 3.2 | |
| Ash mineral composition (w/w%, db) | Al2O3 | 0.4 | 0.5 | 2.7 | 0.4 | 0.2 | 0.6 | 0.1 |
| CaO | 25.3 | 20.5 | 23.1 | 32.4 | 15.8 | 21.4 | 17.3 | |
| Fe2O3 | 0.2 | 0.1 | 0.3 | 2.6 | 1.1 | 0.3 | 0.1 | |
| K2O | 22.5 | 22.1 | 23.6 | 22.0 | 6.7 | 18.0 | 9.3 | |
| MgO | 4.8 | 4.7 | 6.6 | 16.8 | 2.4 | 17.9 | 1.3 | |
| Na2O | 17.6 | 14.1 | 17.2 | 12.7 | 11.7 | 11.1 | 7.4 | |
| SiO2 | 0.9 | 1.3 | 6.0 | 2.3 | 2.6 | 3.3 | 2.4 | |
| TiO2 | 0.0 | 0.0 | 0.0 | 0.0 | 0.0 | 0.0 | 0.0 | |
Disclaimer/Publisher’s Note: The statements, opinions and data contained in all publications are solely those of the individual author(s) and contributor(s) and not of MDPI and/or the editor(s). MDPI and/or the editor(s) disclaim responsibility for any injury to people or property resulting from any ideas, methods, instructions, or products referred to in the content. |
© 2024 by the authors. Licensee MDPI, Basel, Switzerland. This article is an open access article distributed under the terms and conditions of the Creative Commons Attribution (CC BY) license (http://creativecommons.org/licenses/by/4.0/).


