1. Introduction
Heart failure (HF) is divided into three basic categories based on left ventricular (LV) ejection fraction (EF): HF with preserved ejection fraction (HFpEF; EF ≥ 50%), HF with reduced EF (HFrEF; EF < 40%), and HF with midrange EF (HFmEF, EF ≥ 40 and < 50%) [
1]. Patients with HFpEF are often older, more of them female, hypertensive and obese [
2]. Patients with HFpEF have higher rates of morbidities, mortality, and rehospitalization than those with HFrEF and have poorer quality of life [
3].
HFpEF is a multifactorial disease displaying various phenotypes. Age, hypertension, and female sex are classical risk factors contributing to its development. Atrial fibrillation is also present in a significant portion of patients suffering from HFpEF. A cardiometabolic phenotype, including obesity and type 2 diabetes mellitus, has become more prevalent in recent years [
4,
5].
The development of efficient medical therapies for HFpEF has lagged behind the one made for HFrEF, where many drugs have been proven helpful in reducing the burden of symptoms and improving survival [
6]. The recent EMPEROR-Preserved clinical trial has yielded encouraging results, showing for the first time that a medication (SGLT2 inhibitors) could benefit significant clinical endpoints in HFpEF [
7]. This has come after years of unsuccessful trials with many classes of drugs that sometimes had shown clear benefits in HFrEF.
Aerobic exercise training has emerged as one of the most effective means of improving outcomes in patients with HFpEF. Therapeutic strategies for managing this population should probably combine a pharmacological intervention with one targeting lifestyle changes. Multiple randomized clinical trials of supervised exercise training in selected patients with chronic and stable HFpEF showed that exercise could provide clinically relevant improvements in exercise capacity and quality of life. Lifestyle changes constantly show improvement in studies conducted in HFpEF patients [
8].
The search for specific biomarkers has been an ever-expanding research effort to assess the efficacy of these interventions [
9]. Among potential circulatory biomarkers, microRNAs (miRs) have emerged as exciting targets and possible therapeutic agents for HF [
10]. MiRs are small (22 nucleotides) non-coding RNA able to repress messenger RNA translation or cause its degradation [
11]. The underlying dysregulation of the cardiac transcriptome or the miRNome in myocardial remodelling, reverse remodelling (RR), or HF has been studied in the past [
12,
13,
14,
15,
16,
17]. Several studies have described the expression of different sets of miRs in the myocardium and circulation of human HF patients [
18,
19,
20,
21]. Comparing those two miRNomes after myocardial remodelling and RR has received less attention, especially in HFpEF.
The availability of suitable HFpEF animal models reflecting different phenotypes has progressed significantly in recent years. In the mouse, HFpEF models triggered by a single factor (hypertension, obesity/diabetes or aging) have been replaced by more complex models combining more than one factor [
22].
Here, we use a “two-hit” murine HFpEF (Angiotensin II (AngII) + High-Fat Diet (HFD); MHS) to study whether stopping AngII, normalizing the diet, and introducing voluntary exercise (VE) could help reverse cardiac damage and improve exercise intolerance. In addition, we aimed to describe better the circulatory and myocardial miRNome's response to stress and to characterize its eventual normalization afterwards [
23]. Our main aim was to identify miR markers of myocardial reverse remodelling.
We show that MHS for 28 days in 8-week-old male and female mice induced a light HFpEF phenotype combining cardiac hypertrophy (CH), concentric LV remodelling, left atrial enlargement and reduced exercise capacity. After stopping MHS, four additional weeks normalized CH, concentric LV remodelling and increased exercise capacity. We observed extensive changes in the circulatory and myocardial miRNomes after MHS. Only the circulatory miRNome was normalized after RR, whereas the myocardial miRNome remained abnormal.
2. Materials and Methods
2.1. Animals
C57BL6/J male and female 7-week mice were purchased from Jackson Laboratory (Bar Harbor, ME, USA). Mice were housed on a 12h light-12 h dark cycle with free access to chow and water. The protocol was approved by the Université Laval's animal protection committee and followed the recommendations of the Canadian Council on Laboratory Animal Care (#2020-603 and #2023-1250).
2.2. Experimental design
Mice were randomly distributed in the various experimental groups. We used a two-hit HFpEF model we recently described [
22]. A. 48 two-month-old mice were divided into four groups (n=6) as male (M) or female (F) implanted or not with an osmotic minipump providing a continuous infusion of angiotensin II (AngII; 1.5mg/kg/day) (Sigma) for 28 days and fed or not with a high-fat diet (HFD: 60% calories from fat, 20% from protein and 20% from carbohydrates; Research Diets Cat. #D12492). The standard diet had 10% calories from fat (D12450J). These mice were followed by echocardiography (echo) at baseline (8-week-old) and the day before euthanasia. B. A second batch of mice received AngII + HFD (MHS) for four weeks. Then, on day 28, osmotic minipumps were removed, and the diet of HFD-fed mice was changed to the standard diet (RR). The same day, a flying saucer-type exercise device was introduced in their cage (Innowheel™, Innovive, Billerica, MA, USA). Twenty-eight days later, the protocol was stopped. Mice had an echo exam on day 55 and were euthanatized the day after. The heart was weighted and harvested. The animal’s behaviour was monitored daily by experienced Technicians for health and behaviour during the protocol. The animals were weighed weekly. No mouse displayed signs associated with poor prognosis of quality of life or specific signs of severe suffering or distress. Among those signs, significant loss or gain of weight, grooming and changes in behaviour were recorded.
2.3. Echocardiography
Echocardiography, osmotic mini-pump surgery, and euthanasia were performed under isoflurane anesthesia as described previously [
24,
25]. The same investigator, blinded for mouse identification, acquired Echo images on a Vevo 3100 imaging system (VisualSonics, FujiFilm, Toronto, Canada). Transthoracic echocardiography was performed using a 40 MHz image transducer (MX550S).
2.4. RNA Isolation
Total RNA from LV tissue was extracted using TRI Reagent (Sigma), as described previously (22). Plasma (200µl) total RNA, including miRNA, was extracted using the Qiagen miRNeasy Serum/Plasma Advanced Kit following suppliers’ instructions (Qiagen, Inc, Toronto, ON).
2.5. RNA Preparation for Sequencing
Immediately after total RNA extraction, DNAse treatment of LV sample, long RNA (>200 bp, mRNA), and small RNA (<200 bp) were separated using different ethanol percentage solutions and Qiagen mini-Kit columns. When necessary, samples were cleaned using the Qiagen RNeasy MinElute Cleanup Kit to remove genomic DNA traces. RNA integrity and quality (RIN averaging 8.8 (8.1-9.1)) were acquired using Agilent Technologies 2100 Bioanalyzer, namely using an RNA-specific chip (Agilent Eukaryote Total RNA Nano 1000). To measure complementary DNA (cDNA) library concentrations, the Kapa Universal Library Quantitation kit was used (Roche).
2.6. Bulk microRNA-Sequencing
RNA samples were processed with the Qiagen miRNA Library kit following the manufacturer’s recommendations. Each sample was constituted of RNA from one mouse, either male or female. Sequencing libraries were analyzed using an Agilent Bioanalyzer to verify their size. An aliquot of the library was run on a 6% PAGE gel, and a band at 175 bp corresponding to the expected size of the library was excised and purified. Indexed libraries were pooled and sequenced on the Illumina NextSeq 2000 (single-end 75 bp) according to the manufacturer’s protocols. An average number of 6.8 million reads per sample was obtained. Micro RNA-Seq Alignment was processed on the Qiagen RNA portal for sequence alignment using the Mus musculus miRBase version 22 (GRCm38.101) reference genome. Around 80% of UMI reads were annotated with the miRBase for left ventricle samples and 15% for plasma samples. The differentially regulated microRNAs were identified with a false discovery rate (FDR) ≤ 0.05, a Log2 fold change (Log2FC), |Log2 FC| ≥ 1 and a normalized count exceeding 10. Volcano plots and heat maps were then generated using this Qiagen platform.
2.7. MicroRNA analyses
The miRNEt (
www.mirnet.ca) tools were used to determine potential miRNA-target interactions and built network-based analysis. For the modulated plasma miRs, we used the TargetScan database to determine possible targets. For the myocardial miRs, we created a functional network by pairing upregulated miRs with differentially regulated LV genes after MHS from a Previous study [
22]. The same was done for downregulated miRs [
26,
27]. Cytoscape software was used to build the illustration [
28].
2.8. Plasma Inflammatory Marker Measurements
The mouse plasma inflammatory protein content was externally characterized by Olink Proteomics® (Uppsala, Sweden) using a proteomics assay simultaneously measuring 43 proteins per sample (Olink Target 48 Mouse Cytokine Panel). In brief, this assay involves protein-specific antibody pairs labelled with unique complementary oligonucleotides (probes) being added to 1 μL of sample in a 96-well plate. Only when both antibodies in the pair bind to the corresponding protein are their attached probes close enough to hybridize. This generates a polymerase chain reaction (PCR) target sequence amplified and detected using a standard real-time PCR protocol. Thirty cytokines of 43 passed the level of quantification and could be measured in the plasma of the animals. Four animals for each of these groups were evaluated: male or female and control or MHS.
2.9. Statistical Analysis
All data are expressed as mean ± standard error of the mean (SEM). Intergroup comparisons were conducted using students' T-tests using GraphPad Prism 10 (GraphPad Software Inc., La Jolla, CA, USA). Comparisons of more than two groups were analyzed using one-way or two-way ANOVA and Holm-Sidak post-test. P<0.05 was considered statistically significant.
4. Discussion
This study used a two-hit mouse model of HFpEF combining AngII and an HFD for 28 days (MHS) [
22]. This model shows many similarities with clinical HFpEF, including hypertension, obesity, preserved EF, concentric LV remodelling, left atrial hypertrophy, and reduced exercise tolerance. We observed that many of these abnormalities were reversed after stopping MHS and introducing voluntary exercise for an additional 28 days (RR). Although extensive RR was observed, myocardial recovery was still incomplete. For instance, though significantly increased from voluntary exercise in all animals, exercise tolerance stayed inferior in the RR group compared to controls. Moreover, we now show that the myocardial miRNome of RR animals did not differ much from that of MHS animals four weeks before.
Our mouse model of heart failure has some strengths and weaknesses. Unlike humans, the mice in this study were young, and their heart growth was incomplete [
24]. In mice, the heart continues to gain mass throughout their lives. Female mice were not ovariectomized to simulate menopause, allowing for potential protection from ovarian hormones.
Angiotensin II infusion counterbalanced high-fat diet-induced obesity. Angiotensin II has been shown to induce lipolysis in mice, which opposes the HFD effects [
31]. Therefore, it will be important in a future study to better characterize the changes that MHS causes to specific fat depots in mice since these produce an important proportion of circulating miRs [
32].
To study RR and potentially myocardial recovery, we used a model where HFpEF was still mild, although significant. Pulmonary congestion, a marker of heart failure, was absent except for HFD females and AngII males (p=0.051). That said, from a clinical perspective, pulmonary congestion is treated with diuretics, and an intervention involving an aerobic exercise program will not be initiated in a patient with this condition untreated.
Aging remains an unmet criterion in this study. We still do not know if reverse remodelling is as effective in an older animal with age-related myocardial abnormalities. The answer is probably no, but that doesn't mean some degree of reverse remodelling couldn't be achieved. In HFpEF patients, the benefits of exercise are associated with a decrease in hospitalizations and an increase in quality of life [
33,
34,
35]. Cardiac benefits are less evident, suggesting that the effects we observed in our young adult mice may be less in older animals. Another difference between humans and mice is that a sedentary lifestyle is not a choice for the latter. What we call voluntary training is more of a return to a normal lifestyle for these animals [
36,
37,
38]. This also lowers the stress of life in captivity.
Clinically, valve replacement in patients with aortic stenosis is where reverse remodelling can be observed. The phenotype of aortic stenosis patients shares many features with HFpEF patients. In these patients, depending on the level of heart damage present before the procedure, only a tiny proportion will see their condition improve in one year, and for the most part, the damage will remain stable [
39]. The reasons why some individuals see their clinical state improve or remain stable and others deteriorate with similar heart damage to begin with remain unclear [
39].
We observed that myocardial and circulatory miRNome did not respond similarly to the four weeks granted for myocardial recovery. The circulatory miRNome seemed to return to normal, but not the LV one, suggesting that abnormal processes were still active in the myocardium. Two hypotheses can be offered here. The first is that the changes in the circulatory and myocardial miRNomes observed following MHS were mainly a reaction seeking to reduce the harmful effects of the stress and that despite the four weeks of recovery, myocardial repair or protection processes were still necessary. The second is that the remaining alterations in the LV miRNome point toward abnormalities that are now irreversible to the myocardium. Both hypotheses are probably true in proportions that are still difficult to establish. The data obtained from transcriptomic studies or, here, on microRNAs rarely succeed in pointing to a single cause for a phenotype. Our observations highlight the complexity of the phenomena and mechanisms involved and their interrelations.
Nevertheless, some observations seem essential to emphasize. Despite a myocardial miRNome profile still essentially abnormal, the circulating one now seemed to have returned to normal, suggesting that the contribution of cardiac microRNAs to the circulating miRNome is probably low in mice. In addition, non-cardiac tissues appear after RR to release a normalized microRNA content into the circulation. This does not mean that other factors (proteins, other RNAs, peptides…) produced by these tissues have also returned to normal, and this will have to be investigated in the future.
When we separate the MHS into its entities, namely AngII, a vasoconstrictor and hypertensive factor with pro-hypertrophic effects on the heart but also at the kidney level and the HFD, obesogenic stress, probably inducing some insulin resistance and alterations on adipose and liver tissues, we find ourselves in front of highly similar circulating miRNomes. This does not mean that the different miRNomes of the tissues contributing significantly to the circulating one have a similar response to these stresses but that the circulatory resultant is mostly identical. This is surprising, considering the adipose tissue is a primary producer of circulating microRNAs. Stresses with opposite effects on the visceral fat, such as AngII and HFD, did not result in miRNome profiles with marked differences.
We identified more than 215 different miRs modulated by the various stresses and possibly involved in the following cardiac remodelling and myocardial recovery. These miRs have several possible gene targets, making the total number very high. On the other hand, not all circulating miRs directly influence cardiac physiology and not all target genes and the proteins they encode are expressed at significant levels in the myocardium. In addition, other molecules, such as long non-coding RNAs acting as sponges and counterbalancing miRs effects, have not been studied here but probably would help offer a more complete picture [
40].
Some miRs or families of miRs stand out as modulated in several of our experimental groups. Although many of them have been described before as associated with cardiac physiology, a more direct demonstration of their targets in the heart remains to be shown.
High levels of miR in the post-MHS myocardium may reflect both their inhibitory action on the expression of a factor associated with normal physiology or a way to inhibit a harmful stress-induced factor. This is probably true for a miR whose levels were lowered.
One such example where levels of a miR can lead to such conclusions is let-7i. Both in the myocardium and in the circulation, let-7i levels are increased after MHS. Myocardial levels remain high after the recovery period. Yet, let-7i has been shown to have lower levels in the heart of mice receiving AngII for 3 or 7 days, and its administration can reduce the expression of several genes associated with fibrosis and protect the heart [
41]. It can be speculated that over a more extended period of exposure to MHS, the myocardium induces the expression of protective miRs to attenuate the pro-fibrotic action of chronically administered AngII.
If let-7i has an anti-fibrotic action in the heart, as mentioned above, but also in the lungs or arteries, it is instead a pro-fibrotic action that seems to have this same miR in the kidney [
42]. These observations suggest that processes involving the conventional TGFbeta signalling pathway would be modulated inversely by the same miR.
Moreover, in the let-7 family, five (let-7a to let-7e) saw their levels decrease by the MHS and the reverse was observed for let-7f, g and i. This family of miRs has a highly conserved sequence and shares many possible targets [
43]. Therefore, it seems that the different members of this family may differ in their actions or intervene at various times during stress, as here for MHS.
Focusing on a miR or a family of these is probably reductive to understanding the stress-related action leading to heart failure, as in our mice. However, these miRs remain potential circulating biomarkers to follow the evolution of a condition or treatment over time. Unfortunately, the answers obtained from circulating miR changes can be falsely reassuring. This study shows significant molecular myocardial abnormalities remain despite seemingly complete reverse remodelling at the morphological and functional levels and normalized circulatory miR profile.
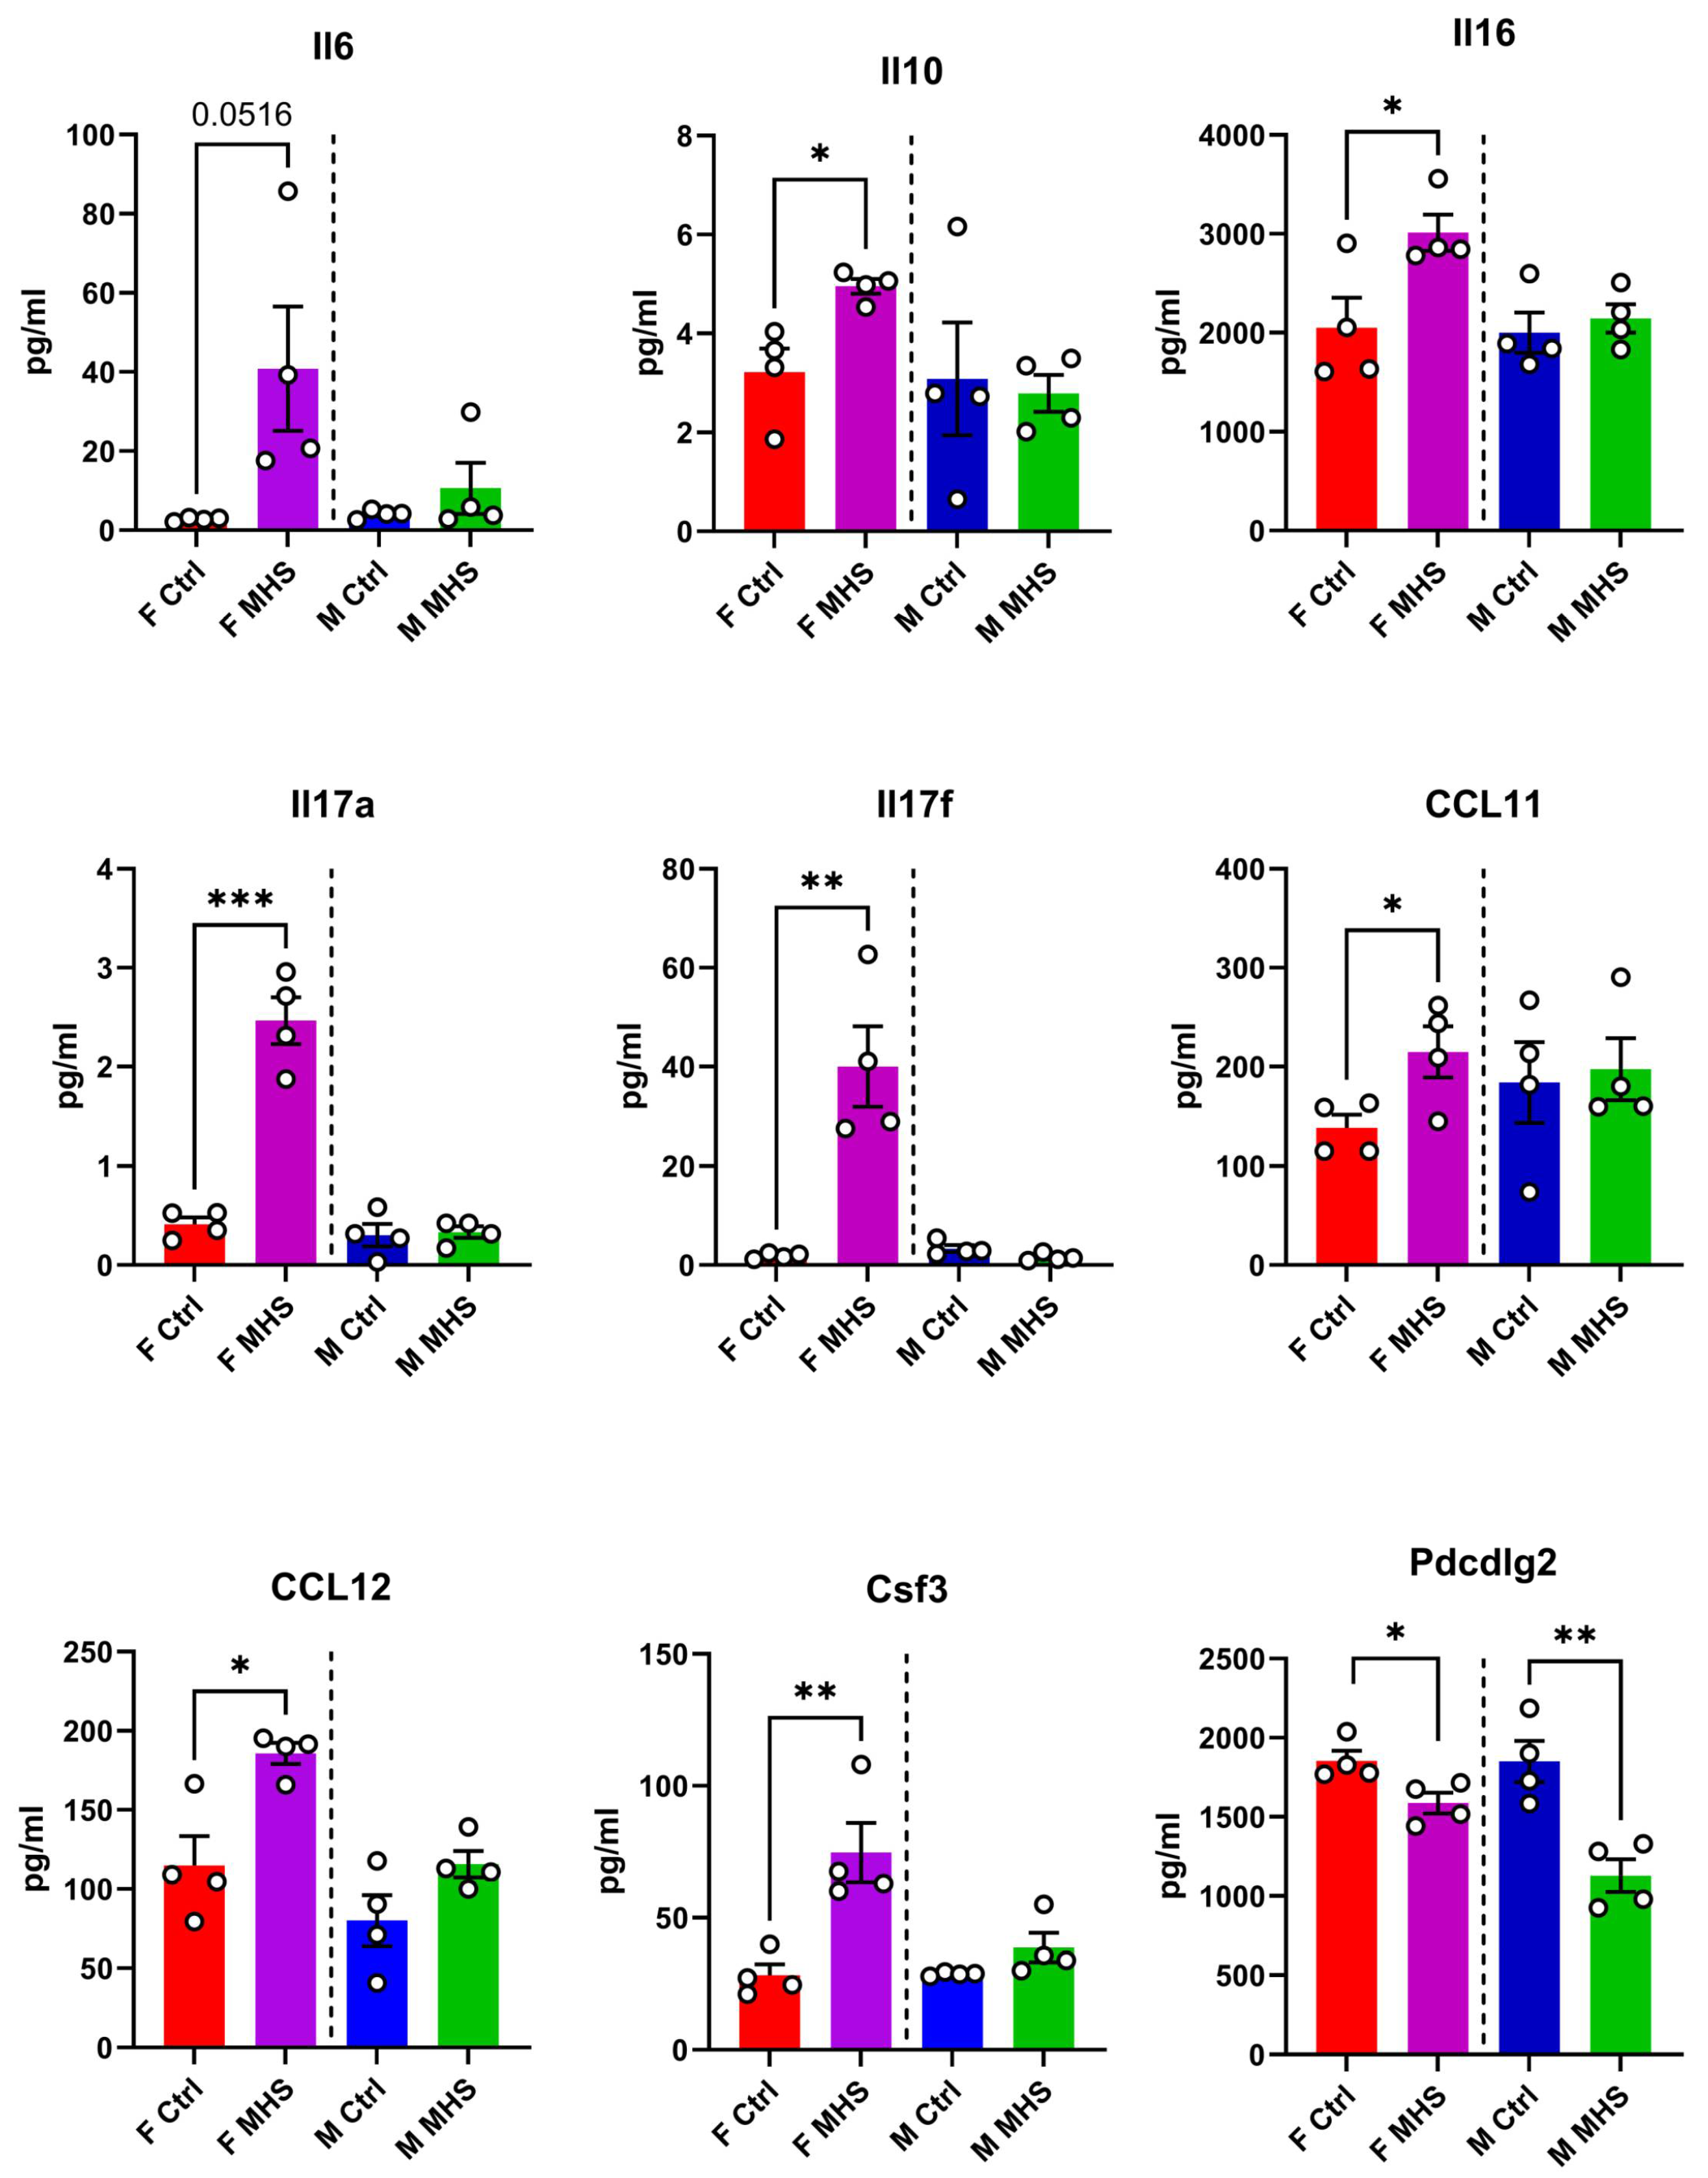
We intended to identify differentially modulated miRs between male and female mice after MHS and RR. In the end, there were few sex differences, and we studied all the animals together. However, the heart response to the high-fat diet differed between male and female mice, the latter being more sensitive to this stress. Although we did not measure plasma inflammatory markers in mice fed the HFD but not receiving AngII, we observed that several of these markers were increased by MHS only in females and not males, suggesting a more acute inflammatory response in female mice. The HFD could be the causing factor. Interleukins 17a and 17f were markedly increased only in MHS females. In conjunction with the observation that miRs related to the control of the JAK-STAT and the TH17 cell differentiation are modulated, this offers new research avenues to explore and explain this sex difference towards HFD in our HFpEF model. Male mice fed a high-fat diet for an extended period (12-16 weeks) have been shown to increase the production of IL-17 [
44]. We observed this in females after only four weeks. For this parameter, the male response to HFD may be slower than that of females. In addition, at the myocardial level, the inflammatory molecule profile may differ. Still, this sex difference was unexpected and deserves further study.
Figure 1.
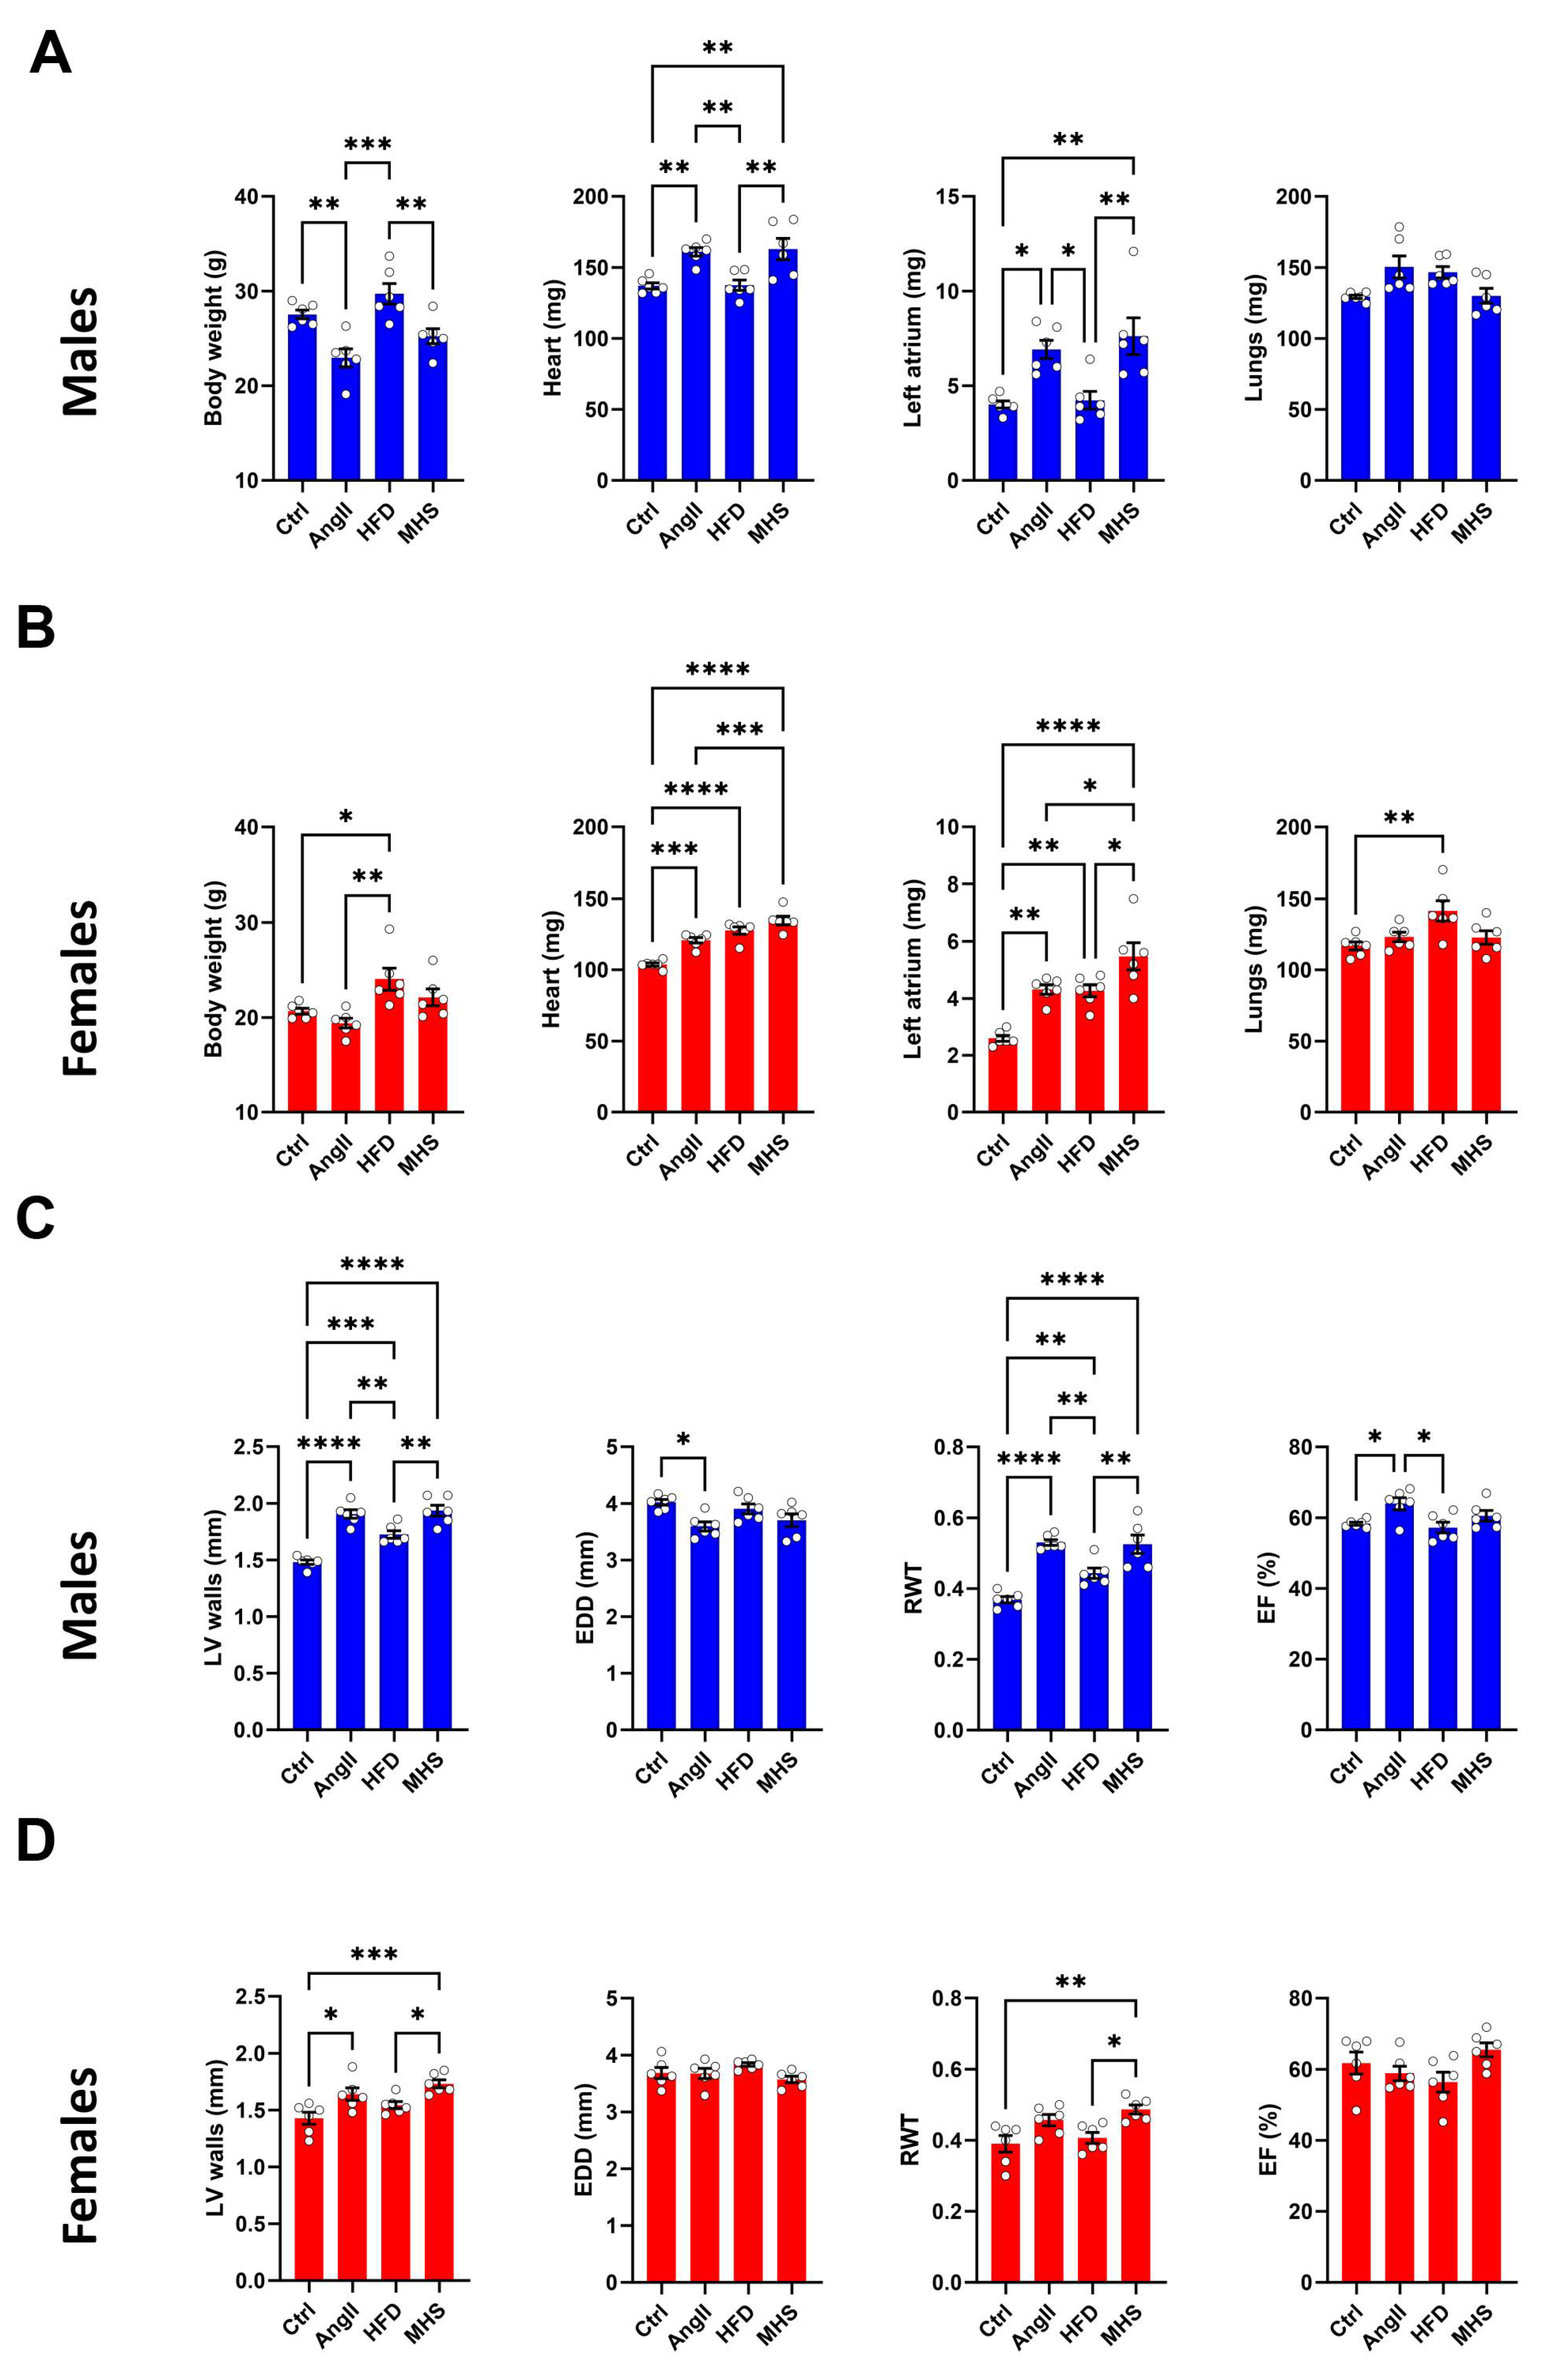
AngII alone or combined (MHS) with HFD induces cardiac hypertrophy and left atrial enlargement in male and female mice. A. Males. Data at euthanasia (n=6/group). AngII and MHS increased heart and left atrial weight but not lung weight. B. Females. HFD causes obesity, cardiac hypertrophy, left atrial enlargement and lung congestion. AngII and MHS increased heart and left atrial weight. C. Males. Echo data. AngII and/or HFD increased LV wall thickness and relative wall thickness (RWT) without reducing ejection fraction (EF). D. Females. MHS had the strongest effects on LV wall thickening and RWT. Data are represented as mean +SEM. One-way ANOVA followed by Holm-Sidak post-test. *: p<0.05, **: p<0.01, ***: p<0.001 and ****: p<0.0001 between indicated groups.
Figure 2.
Alteration of the plasma miRNomes after four weeks of AngII, HFD or MHS. A. Venn diagrams illustrating the number of modulated miRs between the control group and the indicated stress group. (AngII: blue, HFD: red or MHS: purple). Many modulated miRs between each stress group were common. B. Upregulated and downregulated circulating miR after four weeks of AngII (blue) or HFD (red). Graphs represent fold change (log2) of all significantly modulated miRs (FDR<0.05) after four weeks of the indicated stress. C) Volcano plots of differently expressed miRs after AngII (up) or HFD (bottom). Green dots illustrate upregulated miRs, and yellow dots downregulated ones. Grey dots either had a fold change below ±2 or had a false discovery rate (FDR) over 0.5. D) Heat maps of modulated miRs after AngII (up) and HFD (bottom) stress compared to control mice. Purple samples are controls, and green ones are AngII or HFD. Colours range from blue (low expression) to red (high expression). E) Venn diagrams of modulated miRs in AngII (blue), HFD (red) and MHS (purple) compared to control animals. Thirty-one miRs are shared between the three stresses. Twenty-four are upregulated, and seven are downregulated. These miRs are listed below the Venn diagrams.
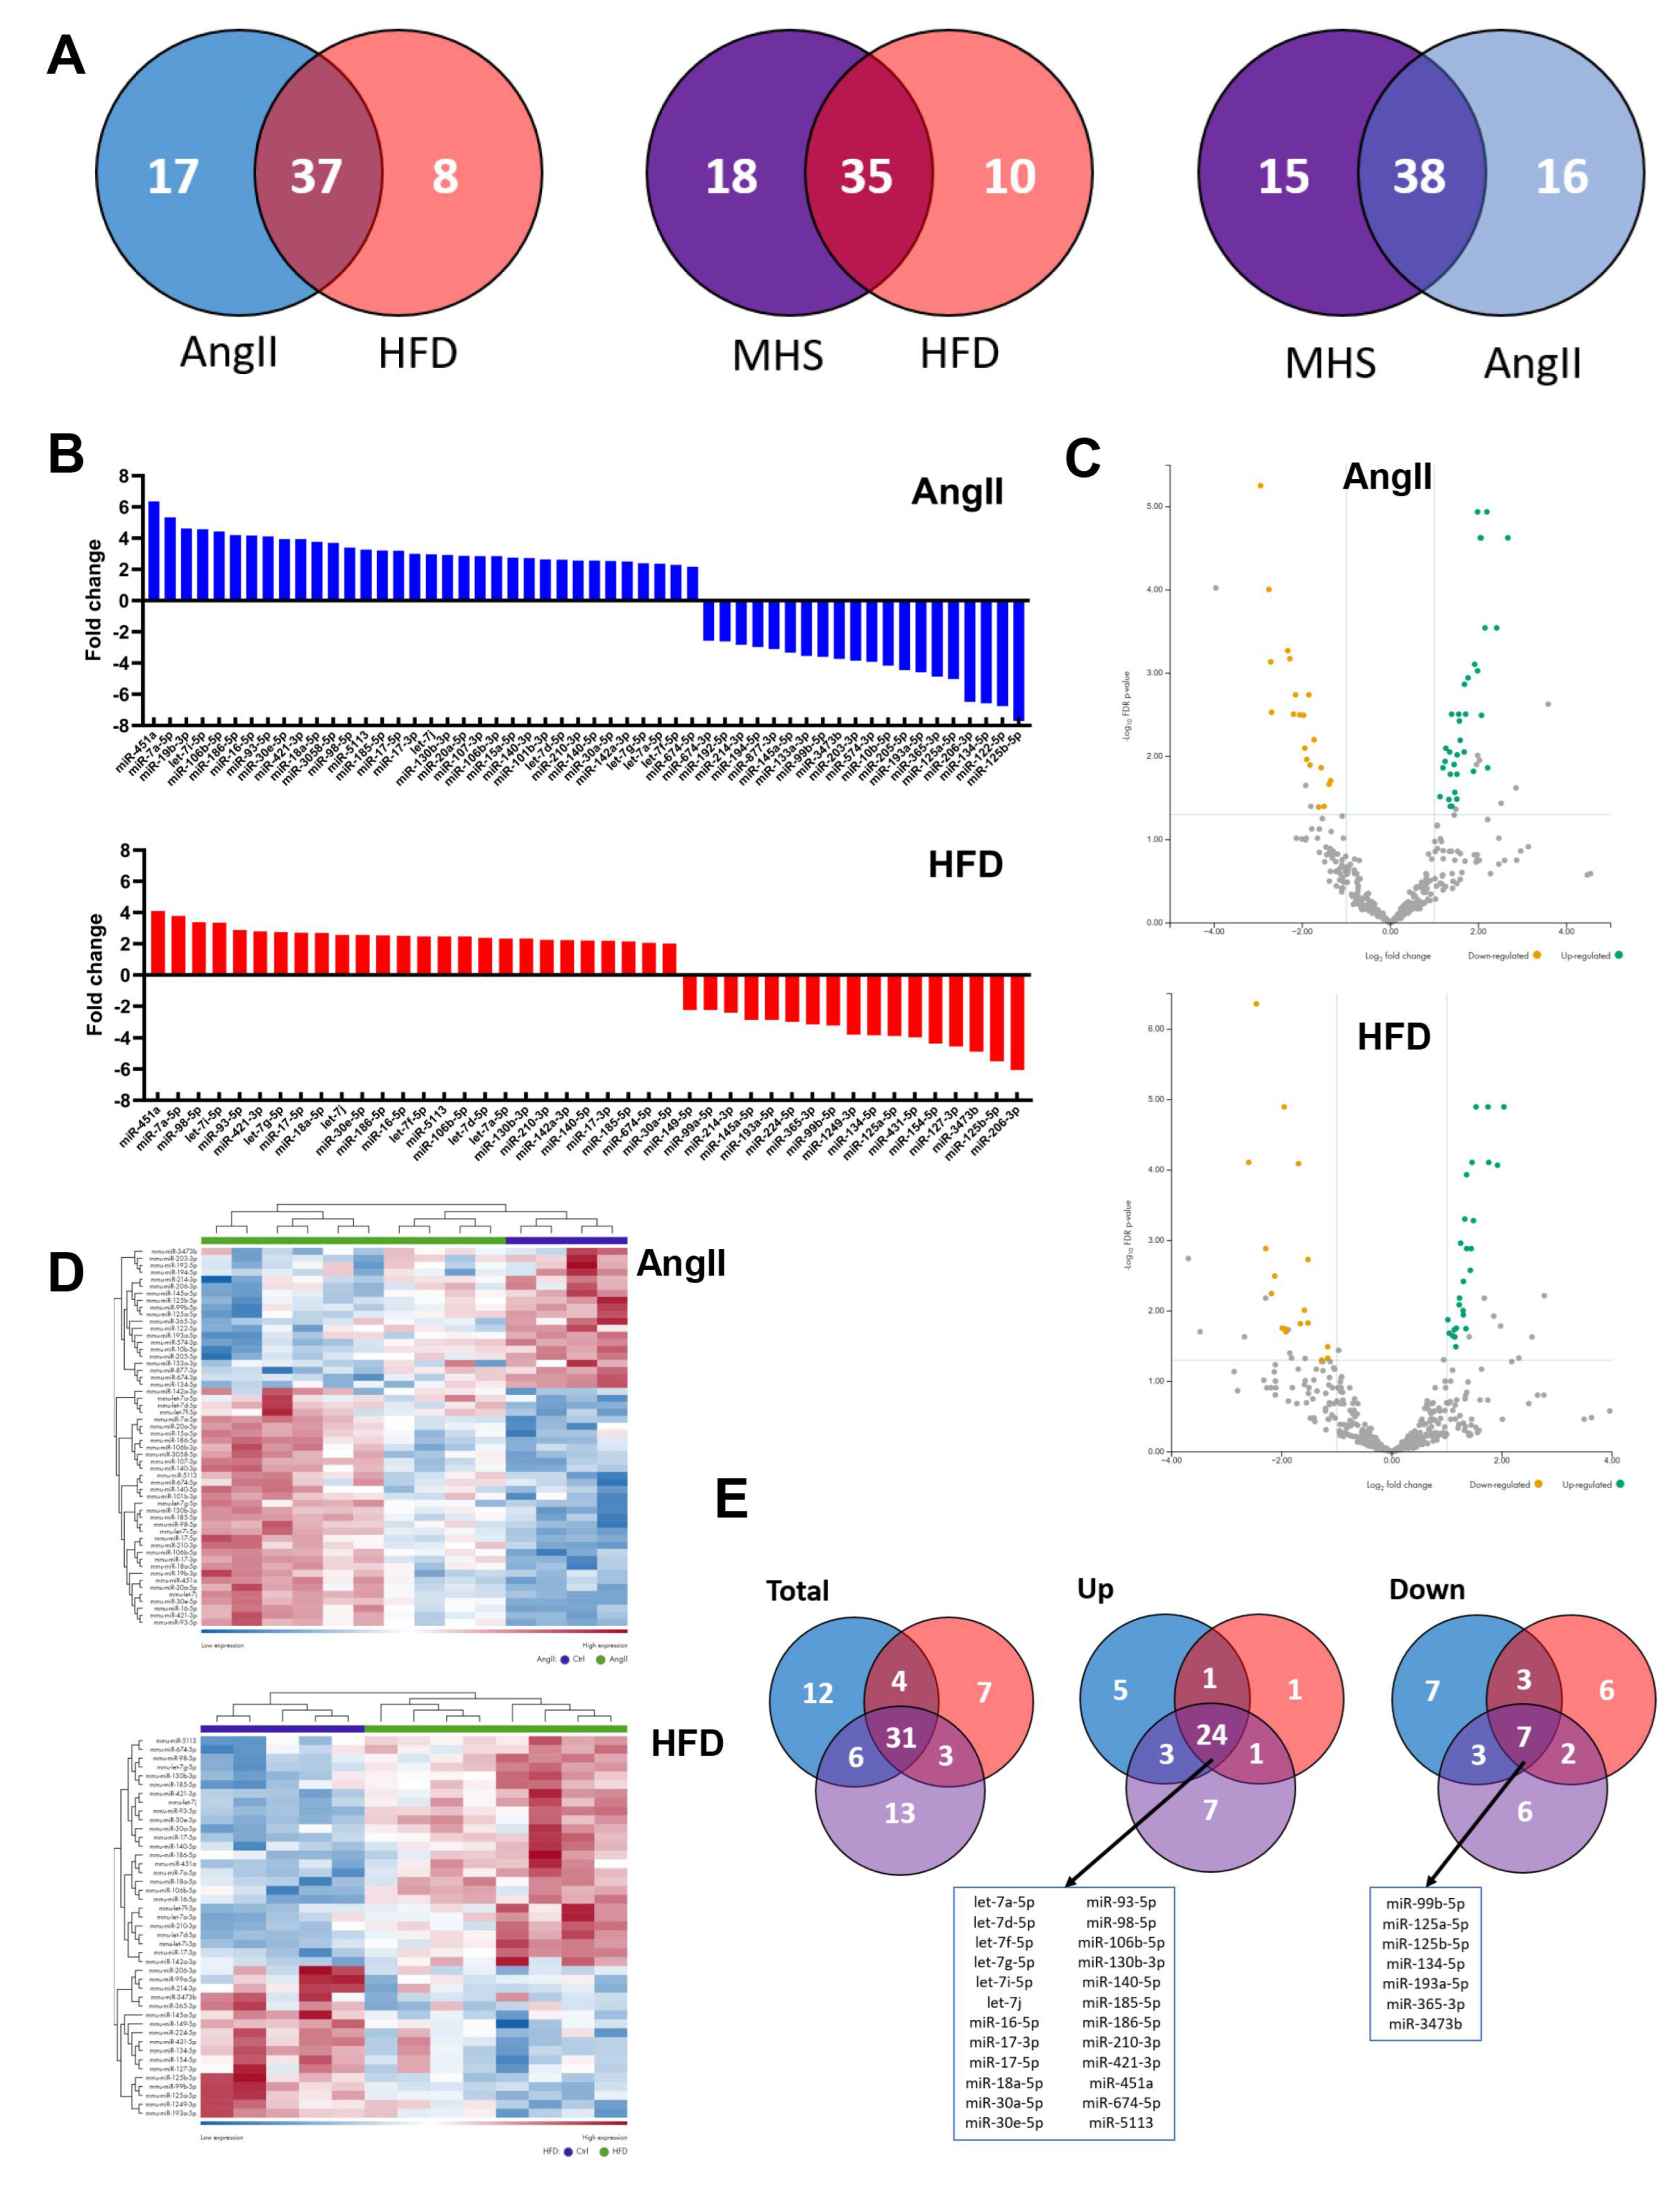
Figure 3.
A. Interactome network of the 24 common plasma miRs with their potential target from the TargetScan database. This network was generated using the miRNet 2.0 analytical tool and Cytoscape to build the illustrated network. The location of the plasma miRs is indicated and was classed in tertiles (low, blue, mid, green, high, and red) based on their normalized counts after sequencing. Dots represent target genes. B. Go molecular functions ten most significant categories from the interactome (FDR: false discovery rate value). C. Ten most significant pathways from the KEGG database.
Figure 4.
Plasma protein concentration of 9 immunity-related molecules in male and female mice exposed or not to MHS. Levels of these molecules were evaluated as described in the Material and Methods section. Il6: interleukin-6, IL10: interleukin-10, IL16: interleukin 16, IL17: interleukin 17, CCL11: C-C Motif Chemokine Ligand 11, CCL12: C-C Motif Chemokine Ligand 12, Csf3: Colony Stimulating Factor 3, and Pdcd1lg2: Programmed Cell Death 1 Ligand 2. Data are represented as mean +SEM (n=4). F: females, and M: males. Student T-test between controls (Ctrl) and MHS. *: p<0.05, **: p<0.01 and, ***: p<0.001 between indicated groups.
Figure 5.
Four weeks after AngII and HFD cessation and introduction of voluntary exercise reversed cardiac hypertrophy and left atrial enlargement in male and female mice. A. Males. Data at euthanasia (n=6/group) Blue columns and open dots (28 days) and green columns and black dots (56 days). MHS increased heart and left atrial weight, and RR returned these parameters to values comparable to those of age-matched control mice. B. Females. Red columns and open dots (28 days) and purple columns and black dots (56 days). MHS increased heart and left atrial weight, and RR returned these parameters to values comparable to those of age-matched control mice. C. Males. Echo data. RR returned MHS-increased LV wall thickness to normal. This was true for the end-diastolic LV diameter (EDD) and relative wall thickness (RWT) but reduced ejection fraction (EF). D. Females. RR returned MHS-increased LV wall thickness to normal. This was true for the end-diastolic LV diameter (EDD), and relative wall thickness (RWT) and ejection fraction (EF) were preserved. Data are represented as mean +SEM. Two-way ANOVA followed by Holm-Sidak post-test. *: p<0.05, **: p<0.01, ***: p<0.001 and ****: p<0.0001 between indicated groups. Factors (MHS, RR of their interaction) below p<0.05 are indicated below graphs.
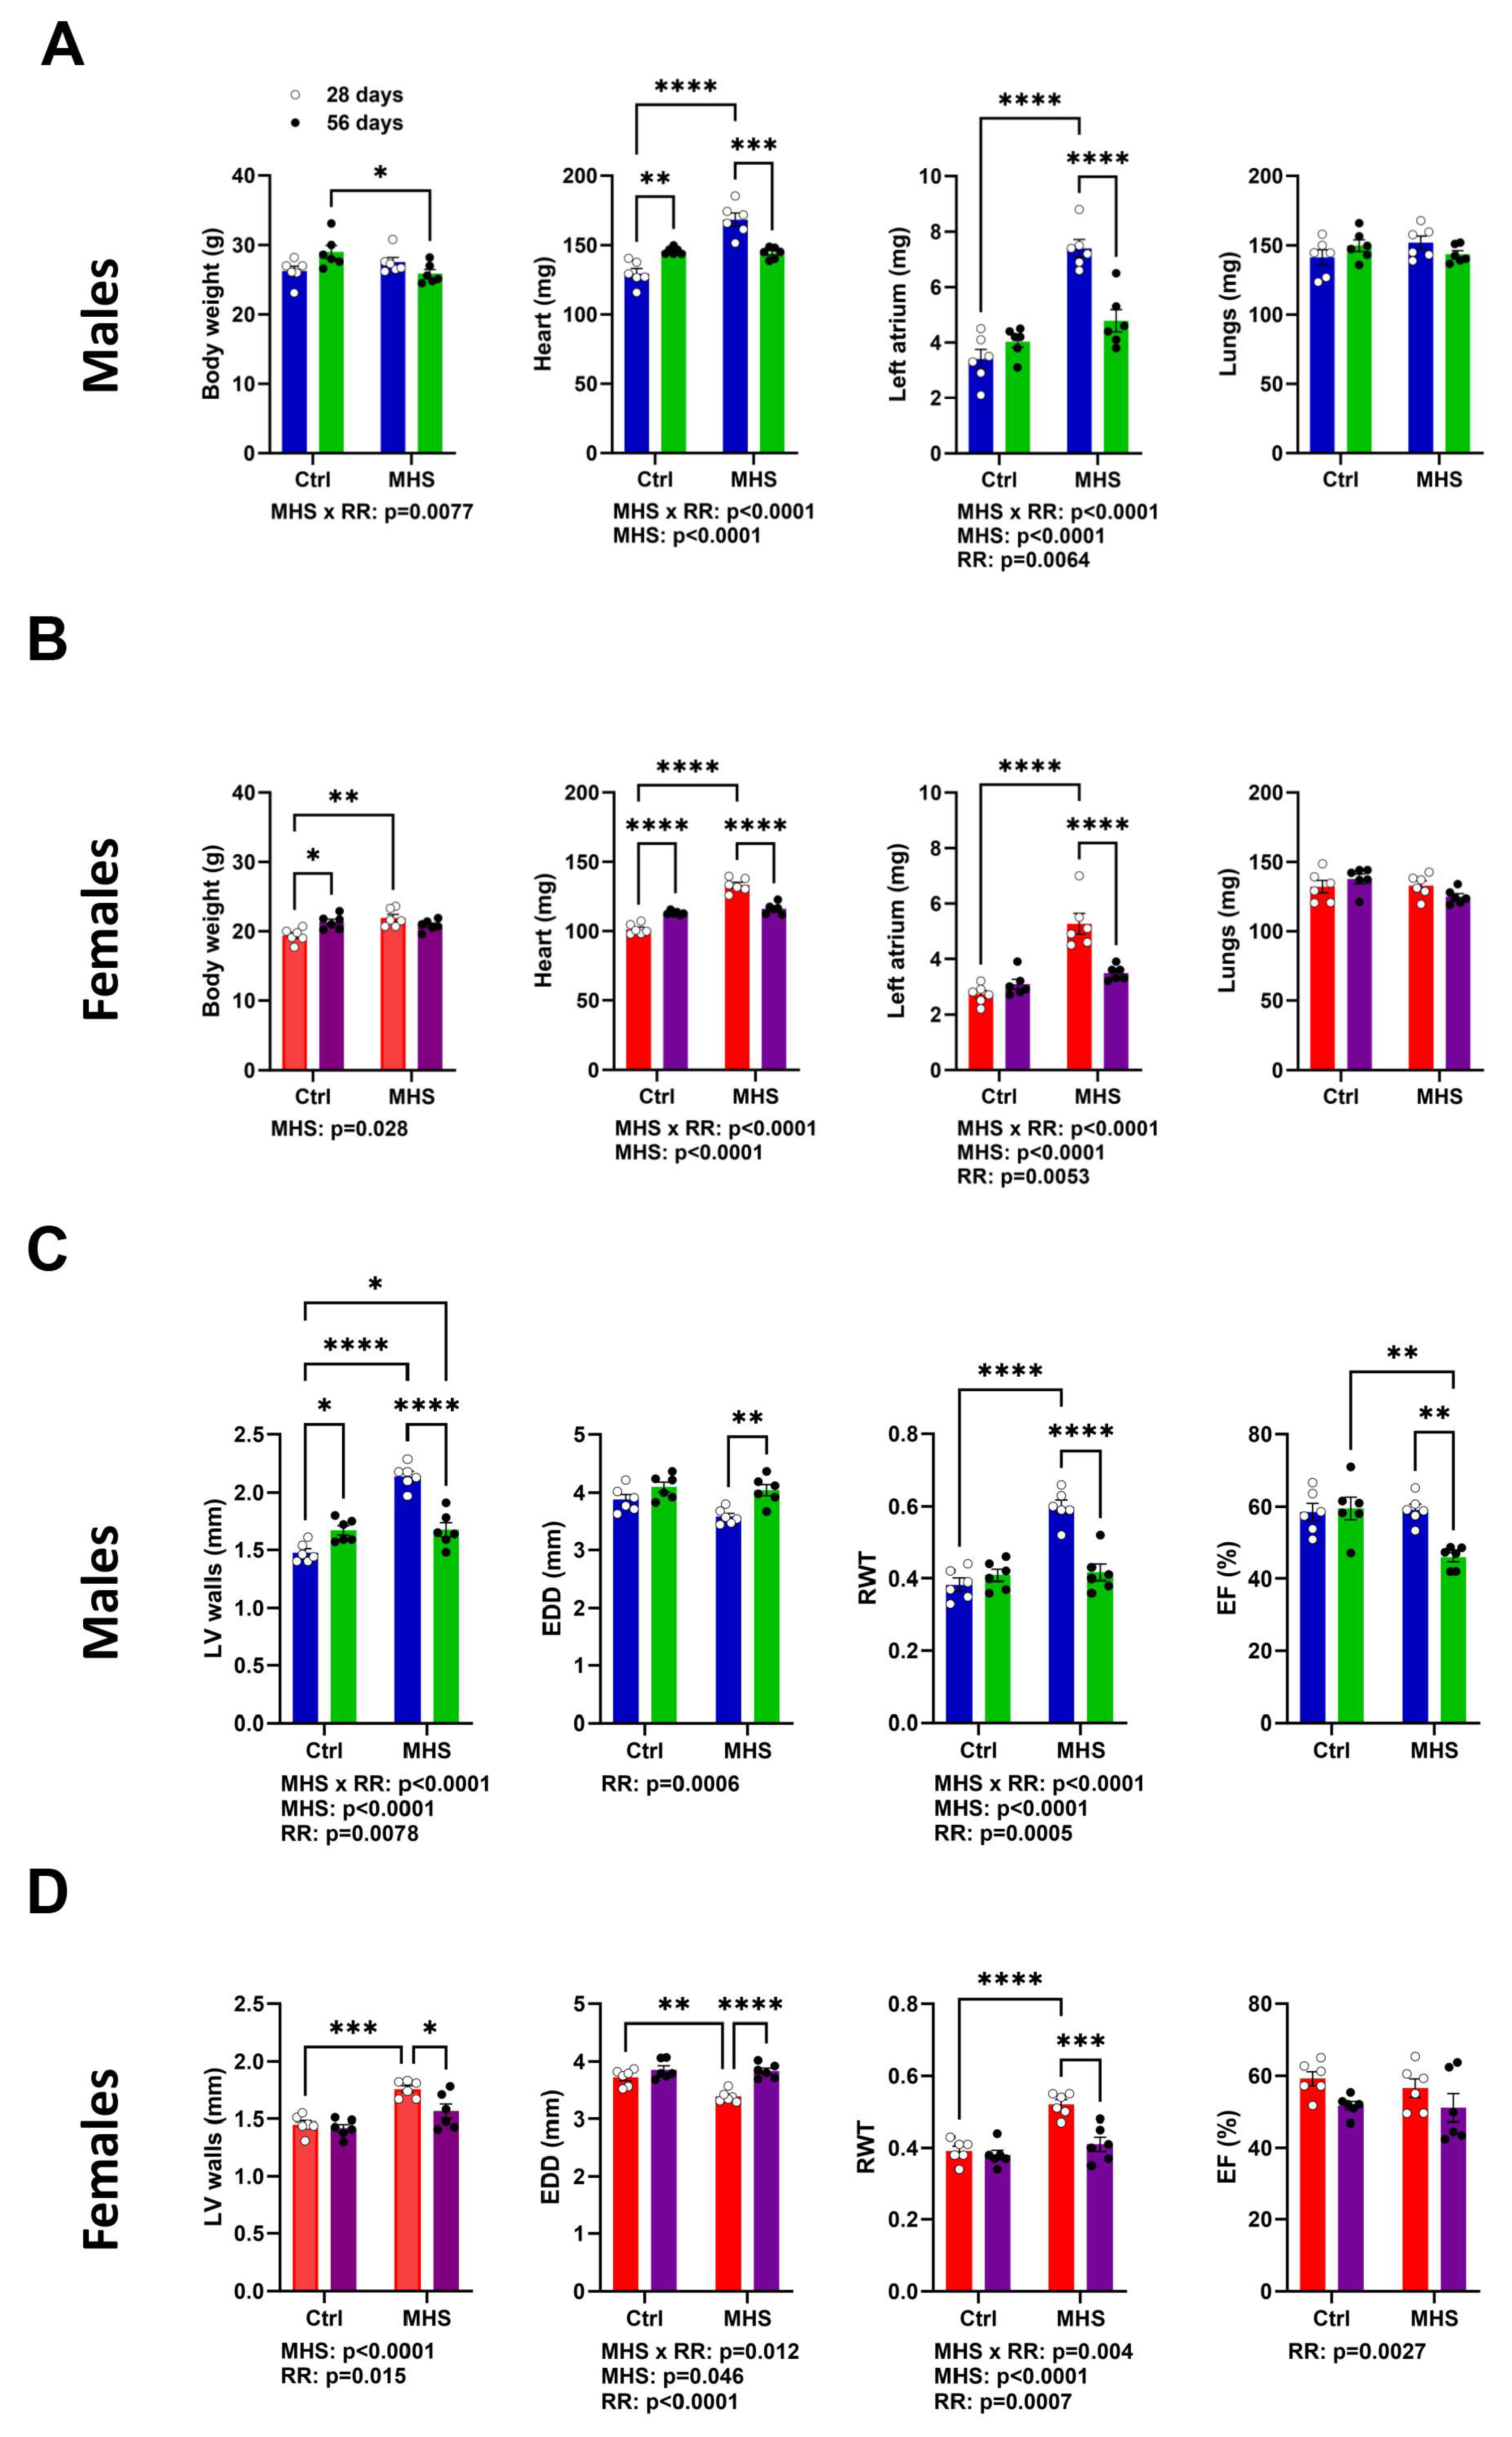
Figure 6.
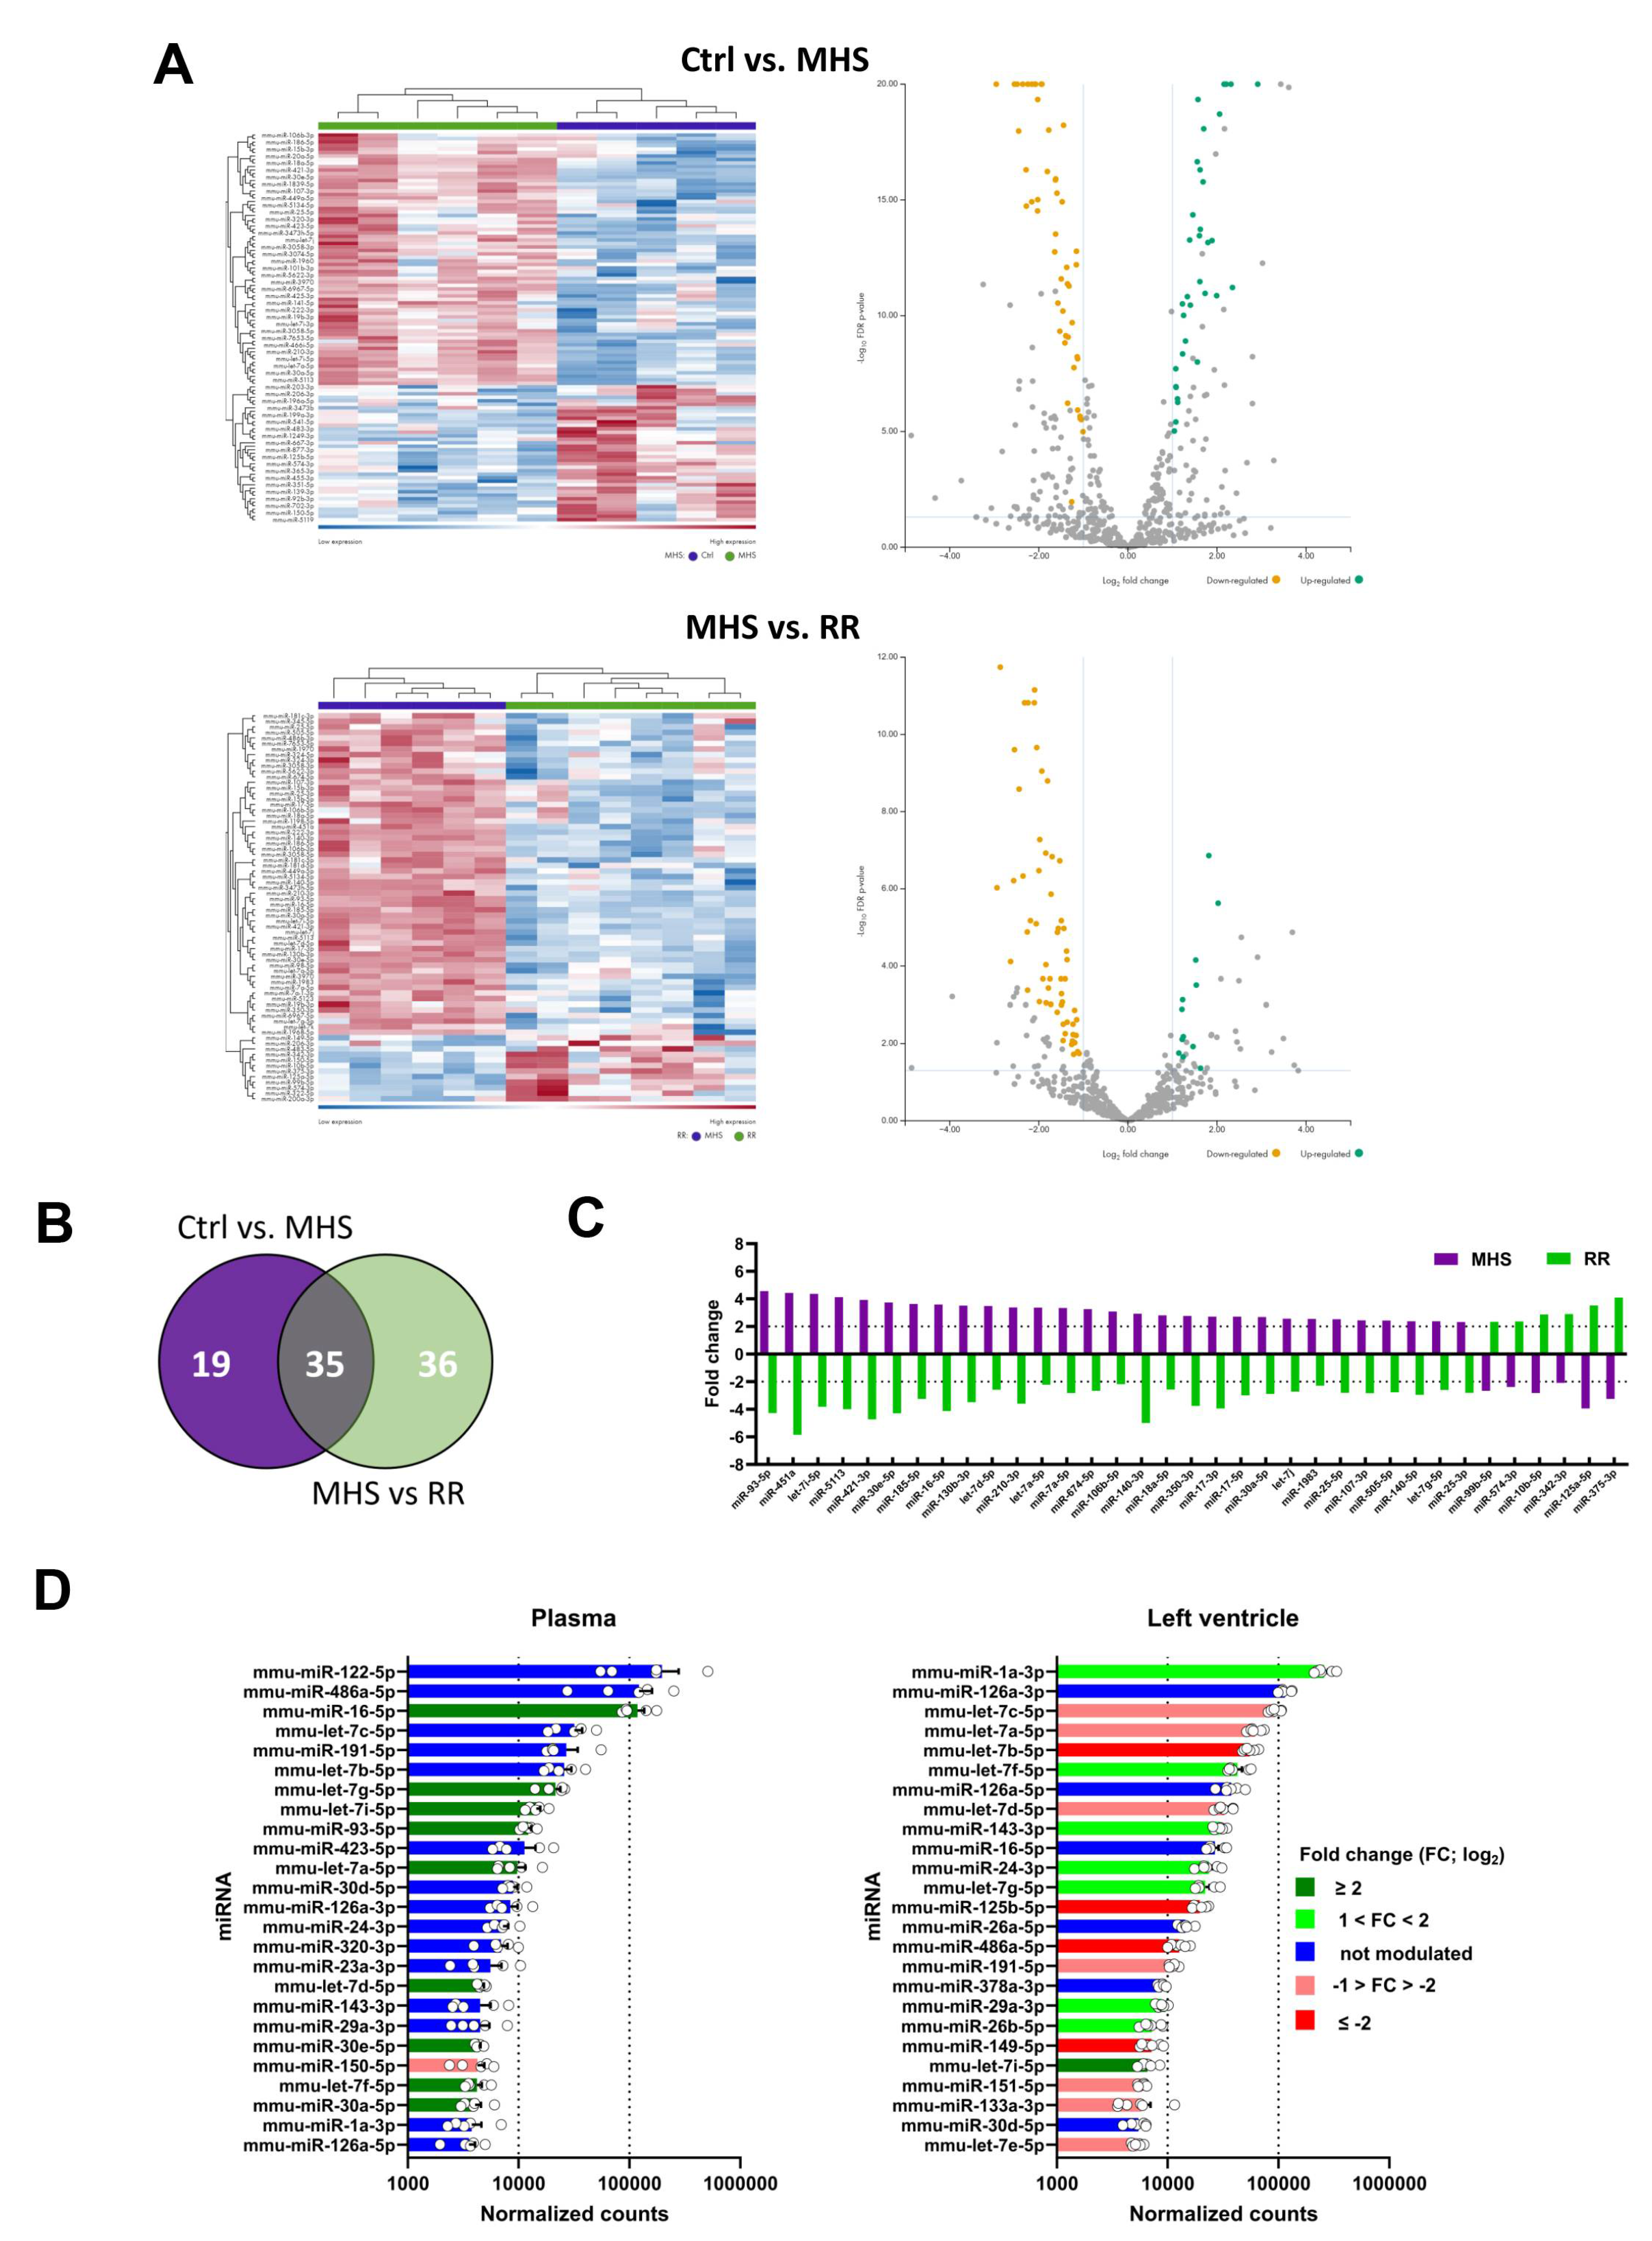
Alteration of the LV miRNome after four weeks of MHS and then RR. Volcano plots and heat map of differently expressed miRs after MHS compared to controls (A), RR compared to controls (B) and C, between MHS and RR. Green dots illustrate upregulated miRs and yellow dots downregulated ones. Grey dots either had a fold change below ±2 or had a false discovery rate (FDR) over 0.5. Dark blue samples are controls (MHS in C), and green ones are MHS (A) or RR (B and C). Colours range from blue (low expression) to red (high expression). D. Venn's diagram illustrates the number of modulated miRs between the control group and MHS and between the control and RR groups. (MHS: purple and RR: Green). E. All miRs upregulated (left) and downregulated (right) between control and MHS (purple) or RR (green) in the LV are modulated in the same fashion. F. Only 20 miRs are differentially modulated when comparing the LV miRNomes of the MHS group (purple) at 28 days and the RR group (green) at 56 days, and 12 of them are regulated in different directions. G. Most plasma miRs modulated in the LV are also modulated in the plasma. In the LV, this represents only 21% of modulated miRs. H. Most of the 33 common miRs between the plasma and LV miRNome of MHS-treated mice are modulated in the same direction (27 of 33).
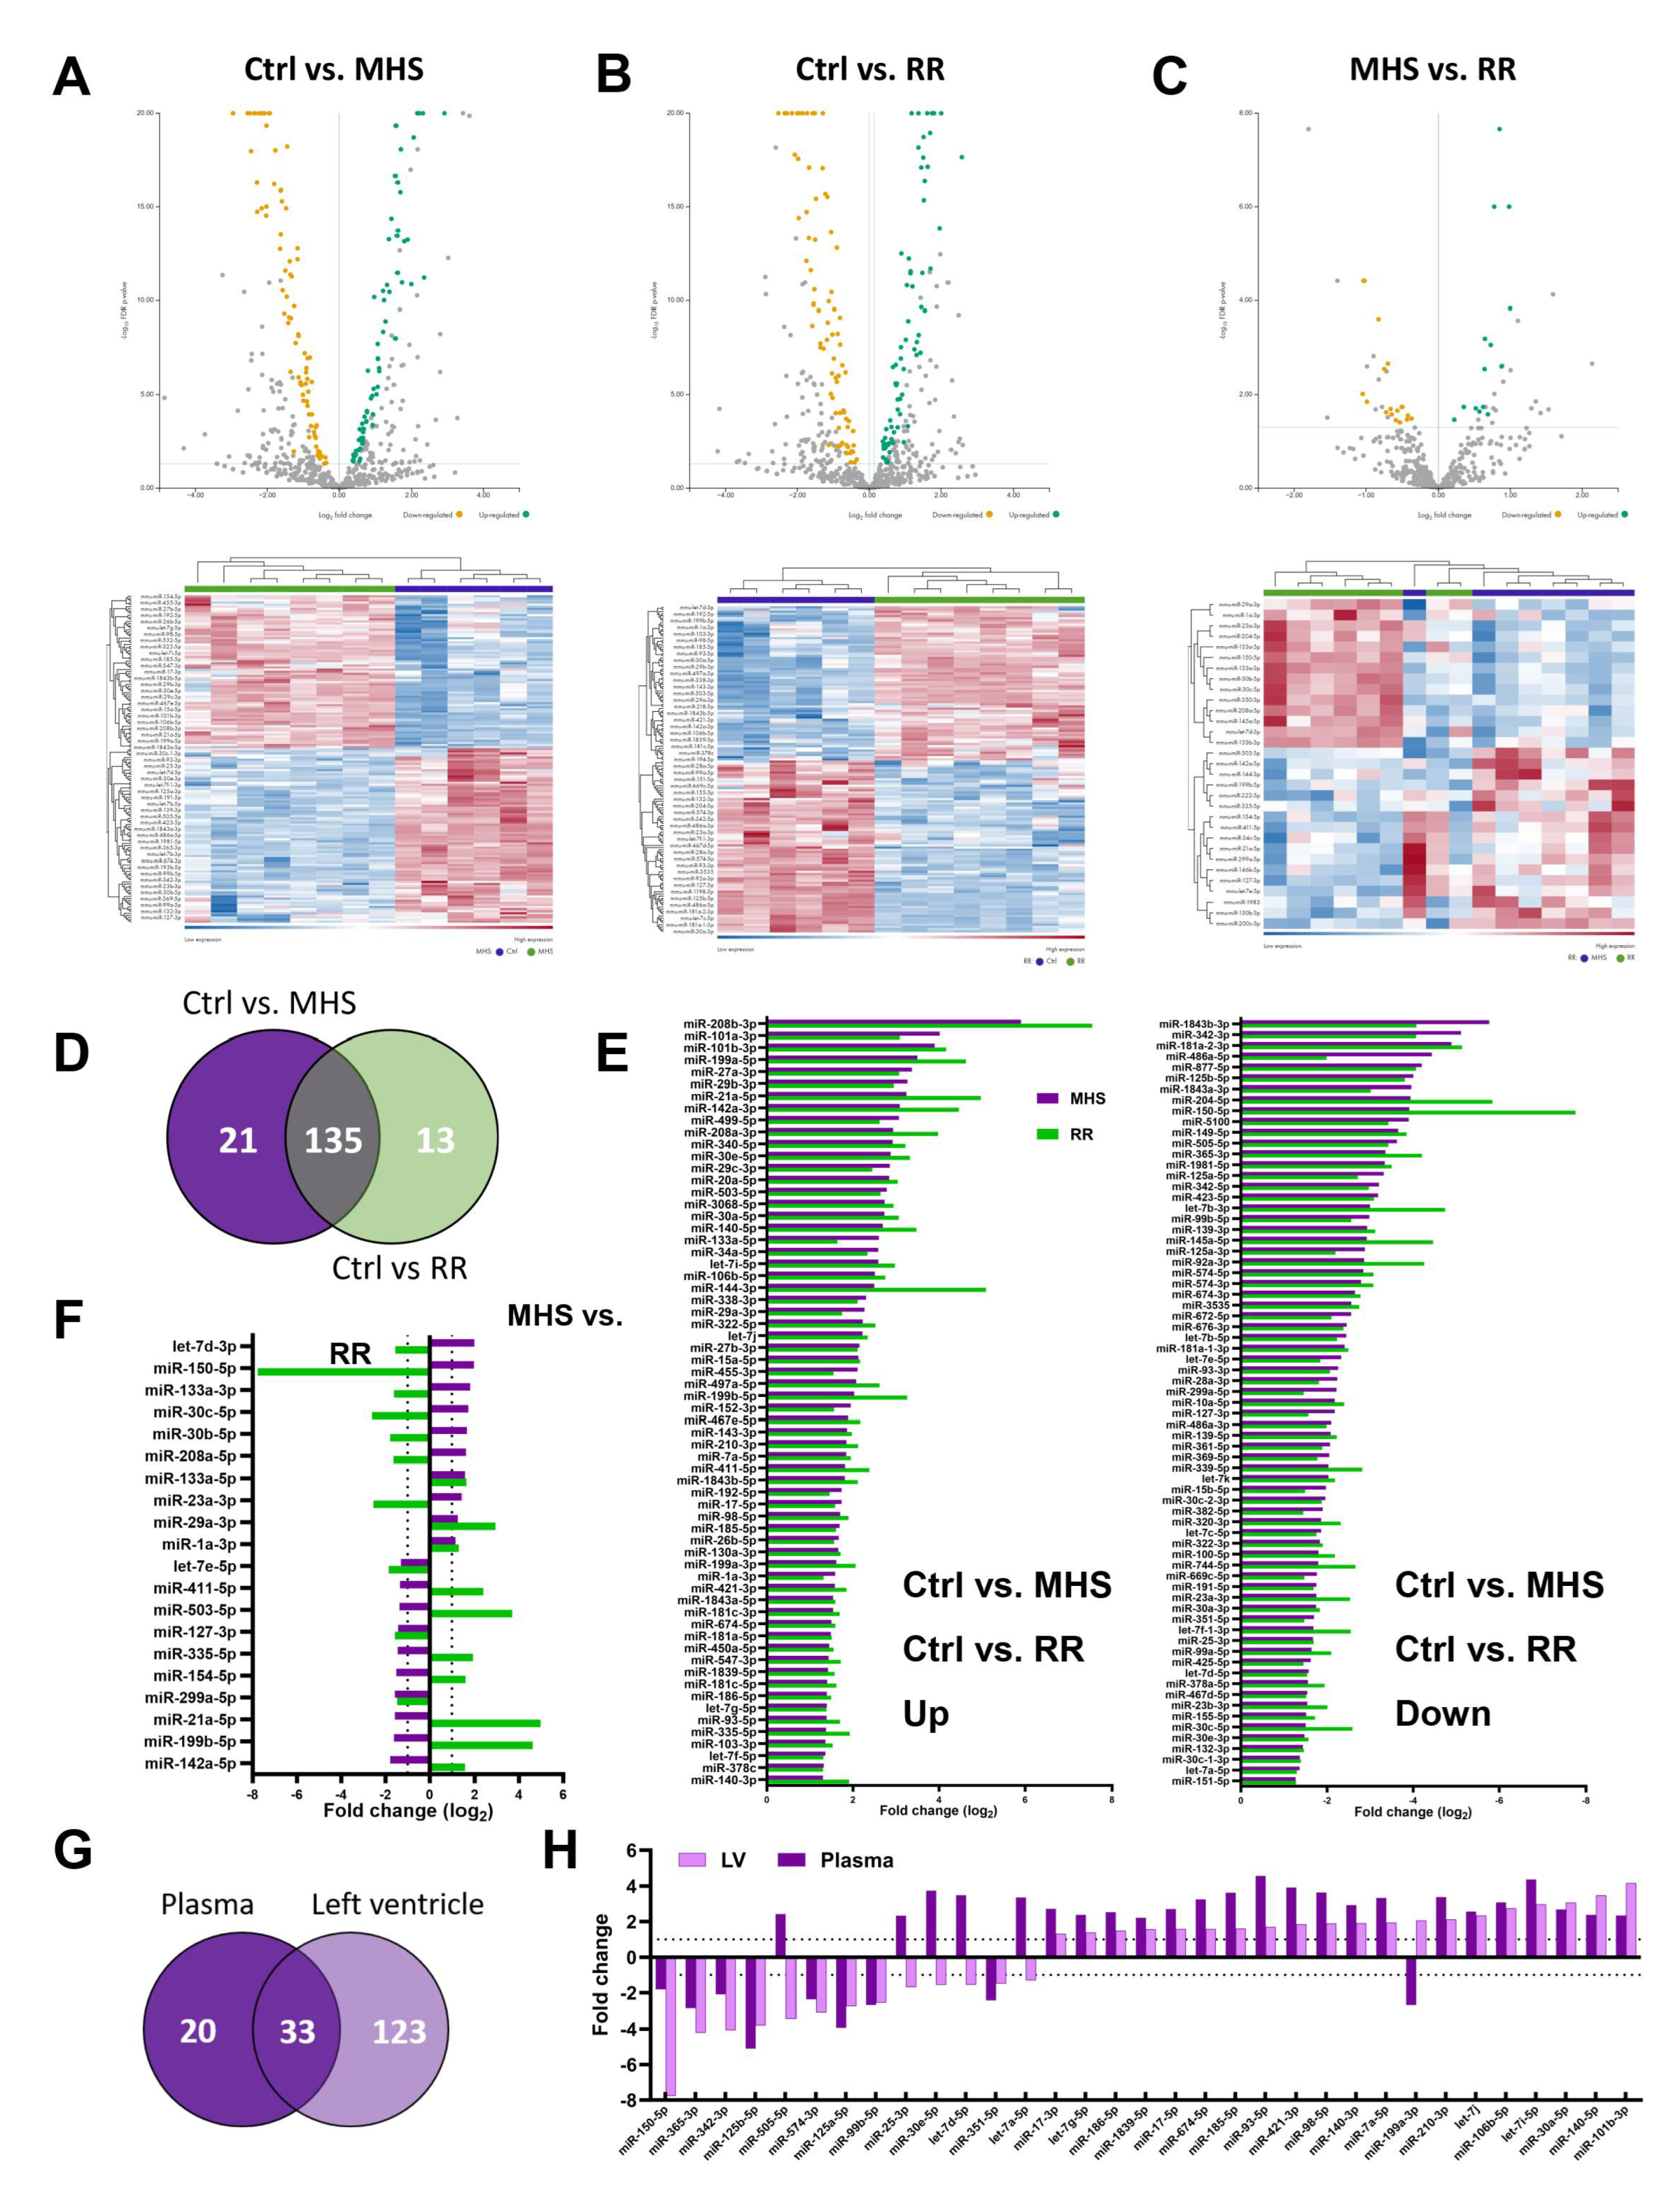
Figure 7.
The circulatory miRNome is completely normalized after RR. A. Heat maps and volcano plots of differently expressed miRs after MHS (up) and RR (bottom). Green dots illustrate upregulated miRs, and yellow dots downregulated ones. Grey dots either had a fold change below ±2 or had a false discovery rate (FDR) over 0.5. B. Venn diagram illustrating the number of modulated miRs between the control group and MHS and between MHS and RR groups. (MHS: purple and RR: Green). C. All miRs upregulated or downregulated between control and MHS (purple) are modulated in the opposite direction in the RR (green) group. F. Changes in the most abundant miRs in the plasma and the LV after MHS. The list of the 25 most abundant miRs was established as the average normalized counts of the control samples from the plasma or the left ventricle. Light and dark green are the miRs upregulated after MHS, and those downregulated in pink and red. In blue, miRs where levels remained stable.
Figure 8.
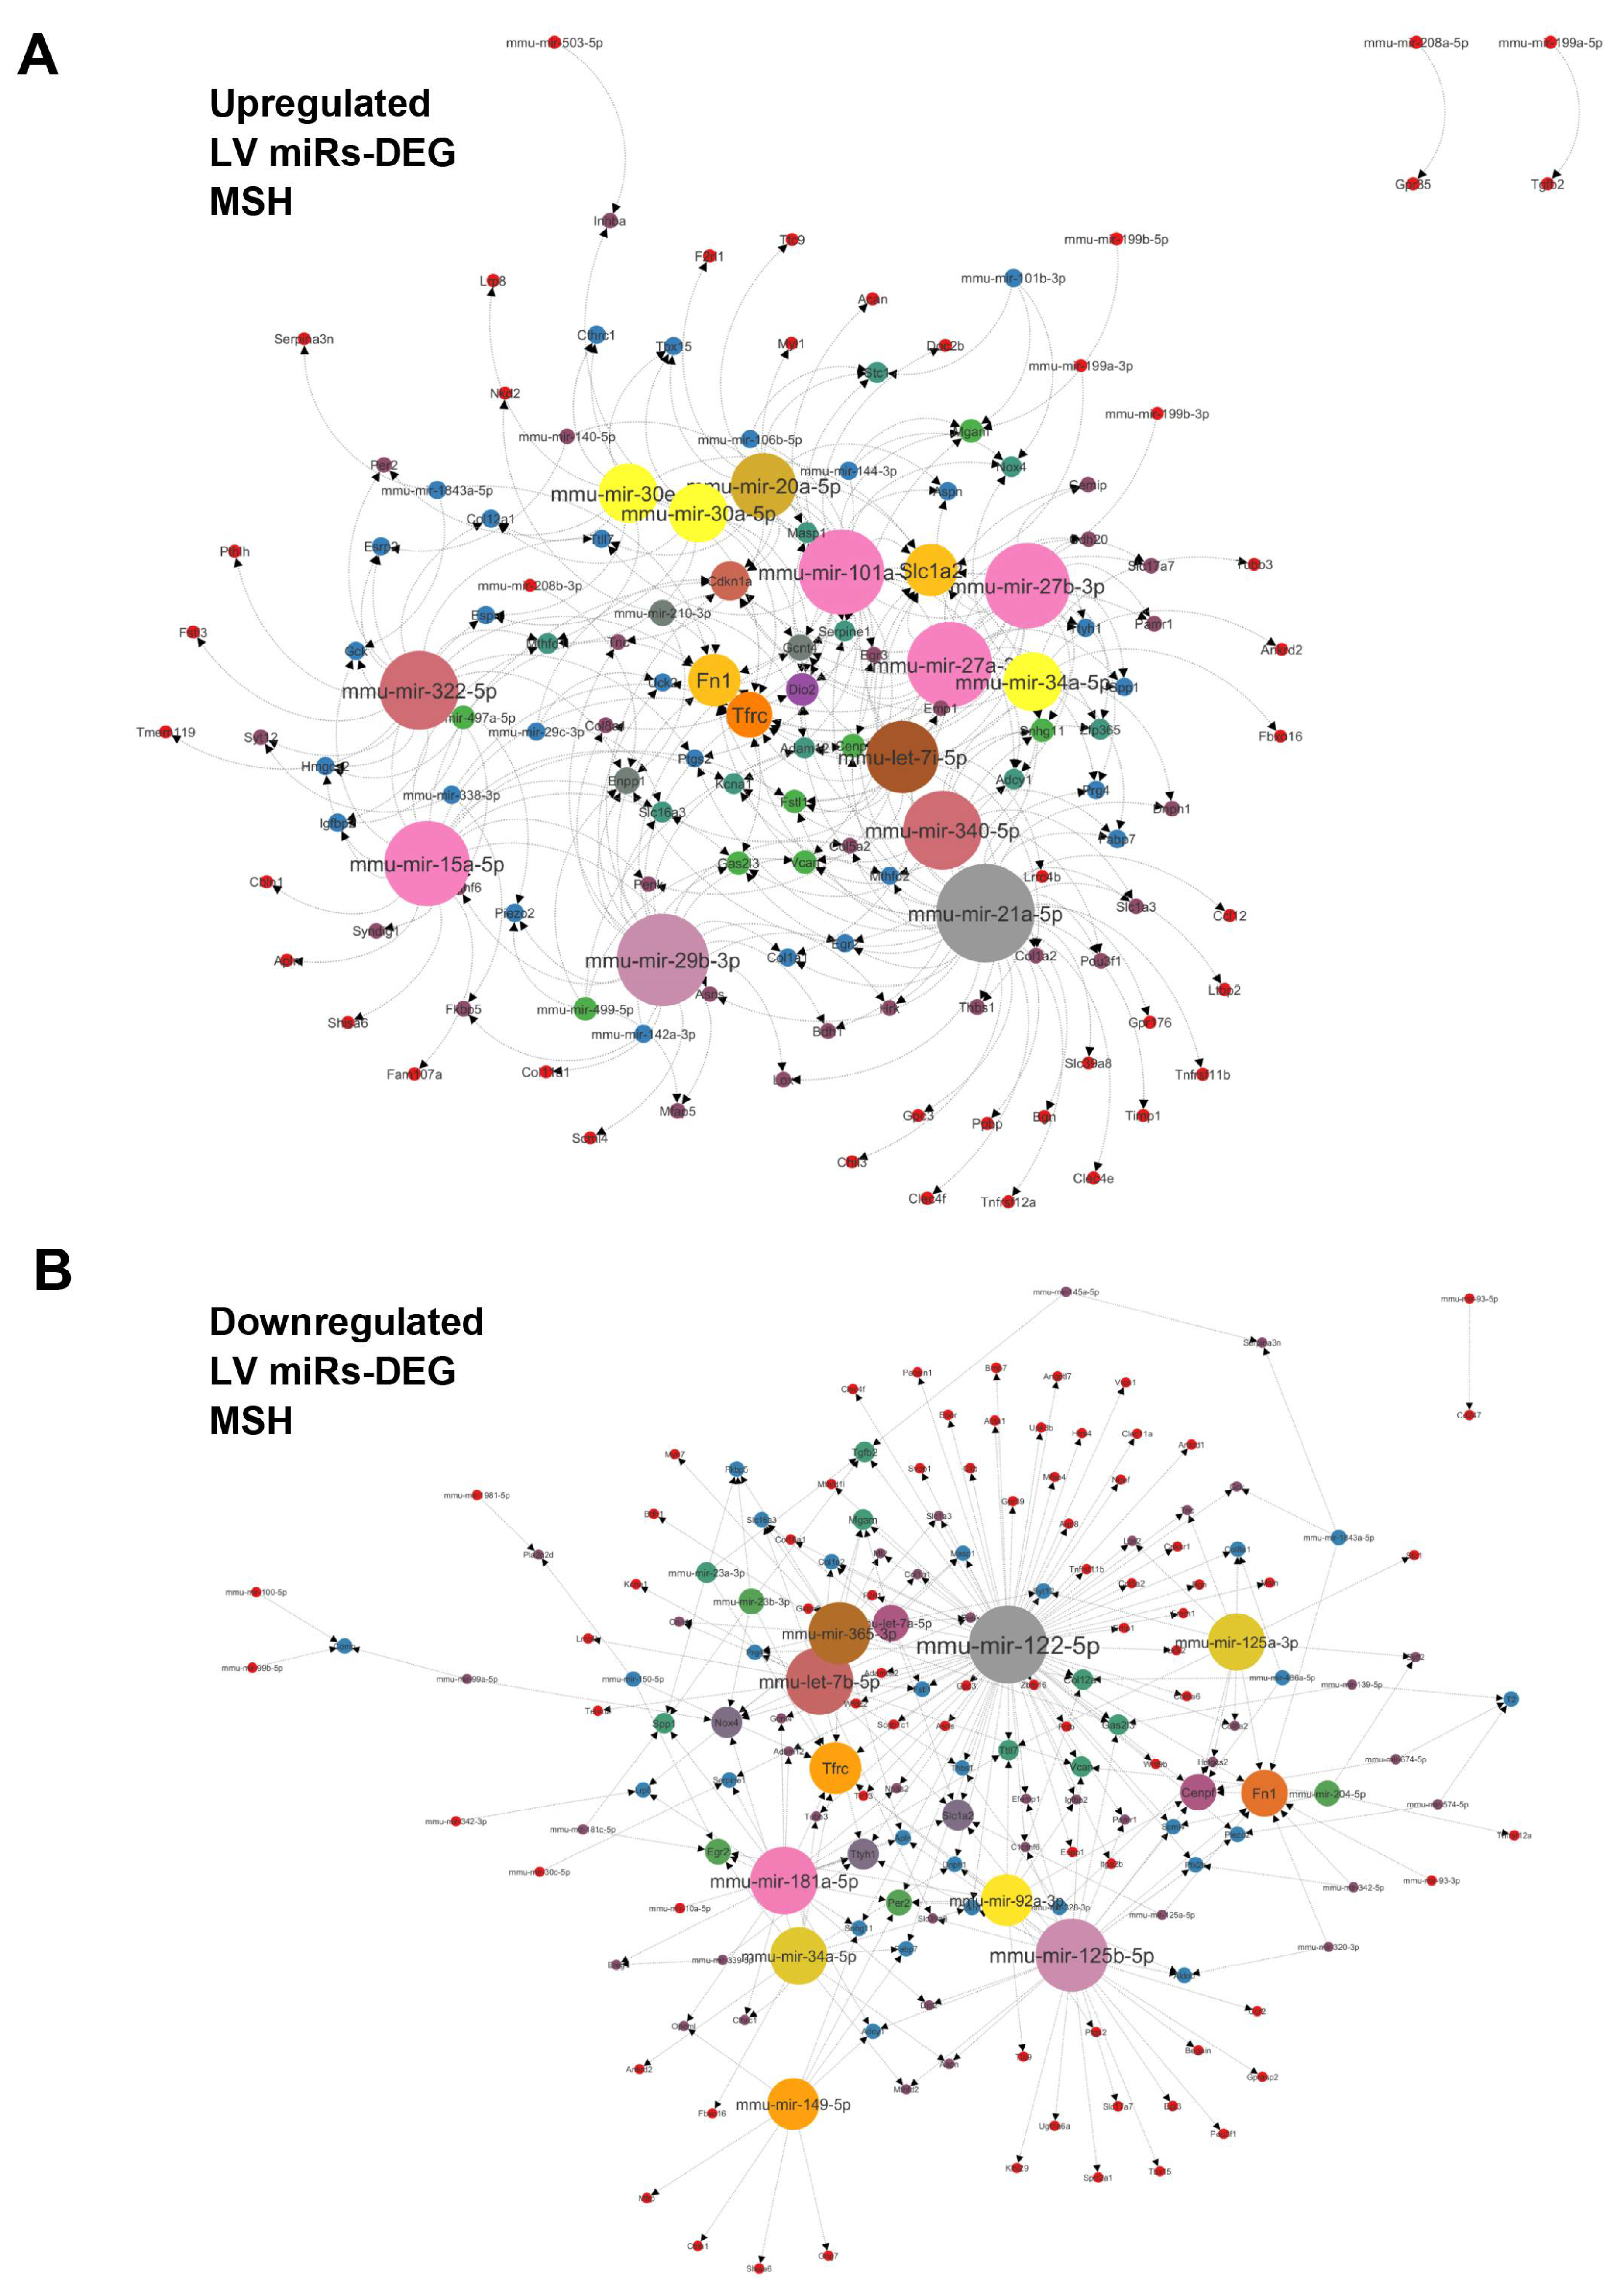
A. Interactome network of 34 strongly upregulated (+log22 FC) LV miRs vs. differentially regulated genes determined after a bulk RNA sequencing of the same LV RNA samples used for determining the miRNome of MHS LV compared to controls. This network was generated using the miRNet 2.0 analytical tool and Cytoscape to build the illustration. The number of possible interactions of miRs and genes determines the sizes of each dot on the network. B. Interactome network of 49 strongly downregulated (-log22 FC) LV miRs vs. LV differentially regulated genes after MHS compared to controls.
