Preprint
Article

Through a Non-uniform Channel; Analysis of a Bifurcation and Stability of Equilibrium Points for Jeffrey Fluid Flow

Altmetrics

Downloads

111

Views

27

Comments

0

A peer-reviewed article of this preprint also exists.

Submitted:

26 June 2024

Posted:

28 June 2024

You are already at the latest version

Alerts
Abstract
This paper aims to study and analyze the effect of the flow rate and amplitude of walling waves on the peristaltic flow of Jeffrey’s fluid through an irregular channel. In addition, it analyses streamlined patterns and their local and global bifurcation flow. The theory of dynamical systems is used to explore the position of critical points and their bifurcation. Numerical and analytical methods are presented to display effective changes in amplitude and rate of the flow on the transport of fluid. Three types of streamline patterns occur backward, trapping and augmented flow in the channel through movement due to changes in the value rate parameters.
Keywords: 
Subject: Physical Sciences  -   Fluids and Plasmas Physics

MSC:  37N10

1. Introduction

Peristaltic is regarded as one of the main mechanisms of fluid moves in physiological systems such as human and mammalian. Peristalsis occurs due to the expansion and contraction of sinusoidal waves across the walls of channel. These mechanisms are important in physiology and industry, for instance, the flow of blood in arterioles, movement of urine from the kidney to the bladder, venules and capillaries, roller and finger pumps, waste management pumps in nuclear industry, hose and domestic pumps. Also, the technique of this transport is used in devices like heart–lung machine to pump blood.
The main researcher on this subject is Latham [1] who introduced an exhaustive analysis of peristaltic transport in the context of mechanical pumping. The theoretical and experimental study for peristalsis and the author derives The mathematical formulation between motion of fluid and the amplitude ratio of the peristaltic transport has been done by [2]. Further extended by Shapiro et al. [3] studied peristaltic movement under the conditions of large wavelength at tiny Reynolds number.
Raju and Devanathan [4] were the first who investigated the peristaltic phenomenon for non-Newtonian fluids in a tube by considering the blood as a model. Many studies discussed different features, such as the velocity and amplitude of the fluid, pumping characteristics, and the conditions for which trapping happens. Trapping refers to the situation when a trapped bolus of fluid is transported in the flow, with the wave speed, under particular values of the parameters [5,6,7].
Subsequently, many academics have presented studies about the mechanism of peristalsis due to the influence analysis of peristaltic flows in engineering and biomedicine. Researchers get different results about peristaltic flows in different types of fluids with varied types of flow channels [8,9,10,22,23,24].
In recent years, interest has begun in studying the bifurcations of stagnation points. Moreover, A bifurcation in a flow refers to the changes in streamline topologies that occurs in the flow due to the variation in involved parameters. Also, the bifurcation which allows inquiring about the state of fluid flow in flow channels, [11,12,13]. We review some of the research in this regard where Jm´enez-Lozano and Sen were interested in analyzing the peristaltic transport of the Newtonian fluid in a symmetric channel and tube. Inaddition, They concentrated on the theory of dynamical systems to analyze the streamline topologies and their bifurcations [14,15,16].
Asghar and Ali both of them presented two separate studies [17,18], respectively. They analyzed the topology of streamlined and bifurcations of the compressible peristaltic flow through asymmetric channels. In addition, They investigated the nature and stability of equilibrium points along with highlighted different streamlined topologies by employing the theory of the dynamical system. Later, Ullah, et al [20] analyzed the stability status of critical points and streamline topologies of different flow and investigated their bifurcations for peristaltic flow of a power-law fluid in an axisymmetric channel. Ali, et al, [9], considered a two-dimensional to study a bifurcation analysis for the peristaltic movement of power-law fluid through an asymmetric channel.
Also, Ullah and Ali [19], analyzed the bifurcation of stagnation points for a peristaltic transport of micropolar fluids through symmetric channel with slip condition. The goal of this research is to investigate the bifurcation analysis and global dynamics of a biomedical drug delivery model that has been designed as an application for peristaltic flow of nanofluids through a two-dimensional channel. Hosham and Sellami provide an effective study for characterizing peristaltic Peristaltic Flow Behavior of thermal nanofluid systems and related phenomena in a biomedical drug delivery model. In addition, it developed as an application for peristaltic flow of thermal nanofluids, based on bifurcation theory [21].
Inspired by previous works and others that we have not listed, we present a mathematical model whose purpose is to study and analyze the effect of flow rate and amplitude of wall waves on the peristaltic flow of Jeffrey fluid. Furthermore, we analyze the streamlined topologies and flow of local and global bifurcations in a 2D asymmetric channel. In the literature, such an analysis of the peristaltic transport of Jeffrey fluid through the asymmetric conduit has not been performed. The research was divided into seven sections, the first was a simple overview of previous work, and the second was the creation of a mathematical model based on the shape of the channel and the type of fluid. The third part includes the solution method using non-dimensional parameters while calculating the flow rate is located in the fourth part of the research. The fifth part includes solving the problem by determining the formula for functions (velocity, stream function, shear stress, and pressure gradient). The main part of the work is located in the sixth section through the use of dynamic systems theory to explore the position of critical points and their ramifications. The last section includes the conclusions.

2. Mathematical Formulations

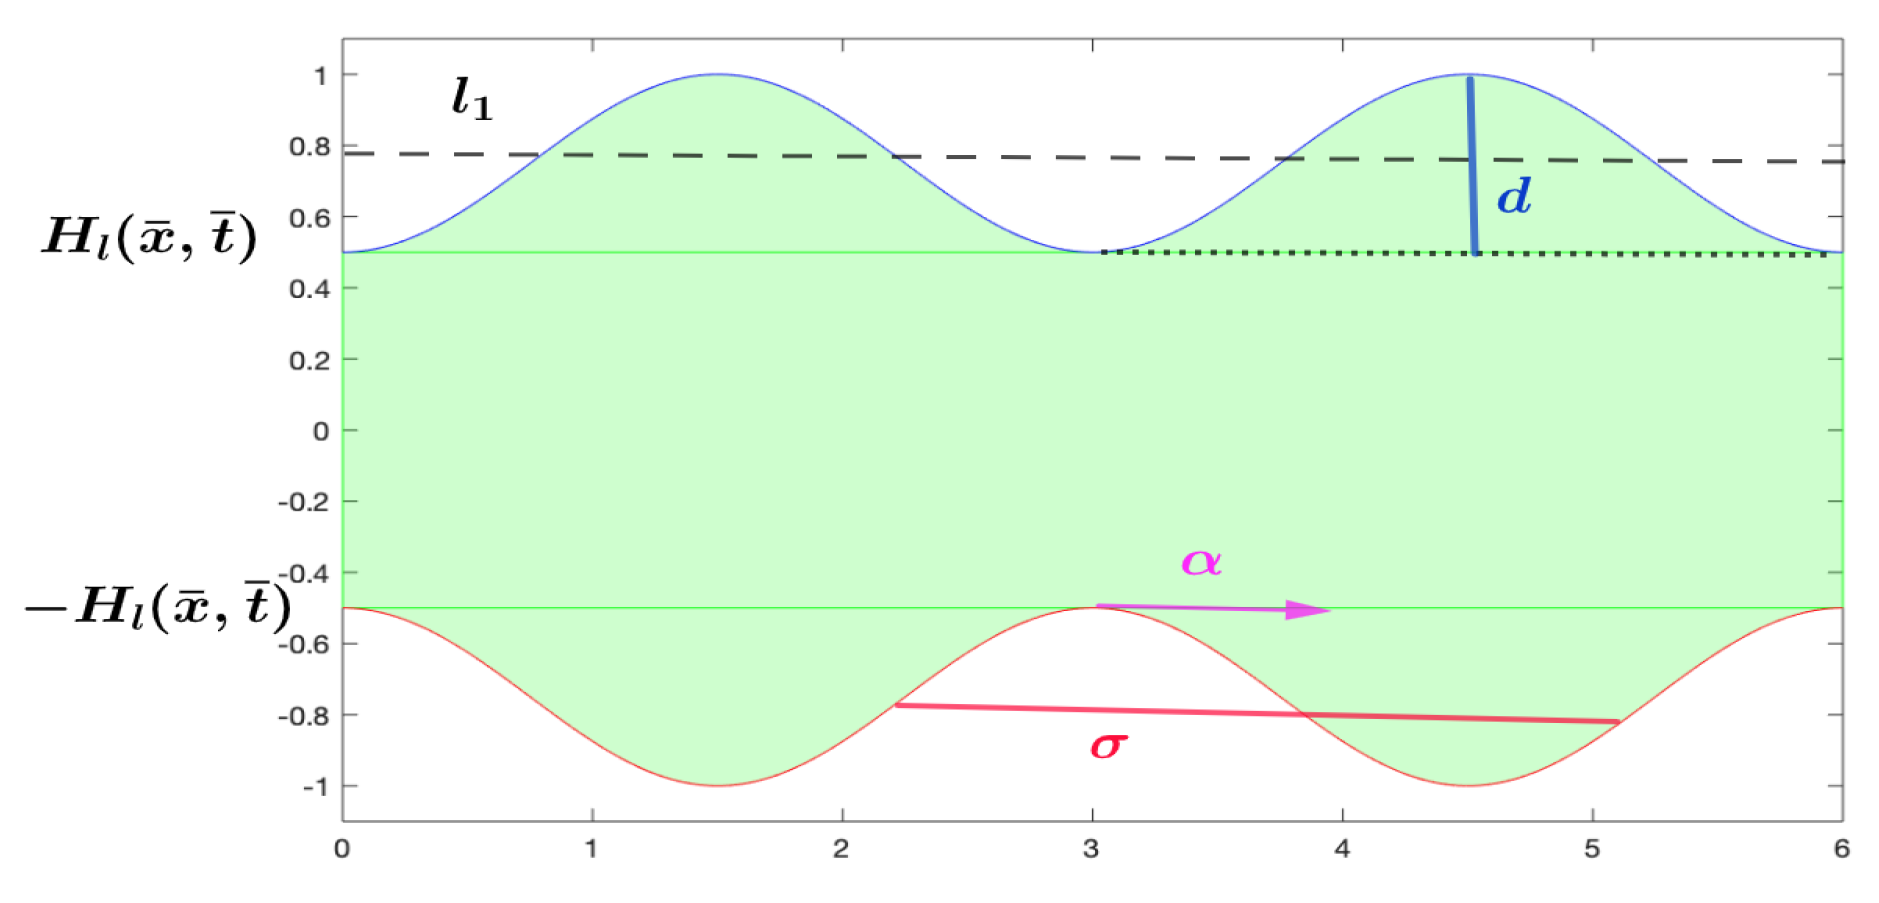
A peristaltic flow of Jeffrey fluid is considered to through in a two-dimensional channel with an irregular wall. In a Cartesian coordinate system ( X * , Y * ) , the channel walls are shown in Figure 1. Which has the upper and lower cosine wave equation H l ( x ¯ , t ¯ ) and H l ( x ¯ , t ¯ ) respectively, and given by
H l ( x ¯ , t ¯ ) = l 1 d cos 2 ( π σ ( X ¯ α t * ) ) .
In the above equation, l 1 is the average radius of the tube, d is the amplitude of a peristaltic wave, σ is a wavelength, α is a wave propagation speed, and t * is a time.
The equations of motion (conservation of mass and momentum) are
. U ¯ = 0 ( continuity equation ) , ρ ( U ¯ . ) U ¯ = P ¯ + d i v S ¯ ( momentum equation ) ,
where U ( U 1 ( X , Y , t ) , U 2 ( X , Y , t ) , 0 ) is a velocity field, ρ is a density, P ¯ is a pressure, S ¯ is an extra stress tensor. The constitutive equation of the extra stress tensor for Jeffrey fluid is given by
S ¯ = κ 1 + λ 1 ( γ ˙ ¯ + λ 2 γ ¨ ¯ ) ,
where κ is a fluid viscosity, λ 1 is the ratio of relaxation to retardation times, λ 2 is the retardation time, γ ˙ ¯ is the shear rate (tensor form).
Peristaltic motion is a normally unsteady phenomenon and has the test form ( X ¯ , Y ¯ ) . It is possible to transfer it to the steady-state by reference assumption of wave frame ( x ¯ , y ¯ ) (by converting constant formulas) with the relations;
X ¯ = x ¯ + α t ¯ , Y ¯ = y ¯ , U ¯ 1 = u ¯ 1 + α , U ¯ 2 = u ¯ 2 , P ¯ = p ¯ .
where ( u ¯ 1 , u ¯ 2 ) and ( U ¯ 1 , U ¯ 2 ) are a velocity elements of the moving and stationary structures respectively. As a sequence for these transformations, the equations of continuity and momentum (1) become,
( u ¯ 1 + α ) x ¯ + u ¯ 2 y ¯ = 0 ,
ρ ( u ¯ 1 + α ) ( u ¯ 1 + α ) x ¯ + ρ u ¯ 2 u ¯ 2 y ¯ δ ¯ x ¯ x x ¯ δ ¯ x ¯ y y ¯ + p ¯ x ¯ = 0 , ρ ( u ¯ 1 + α ) u ¯ 2 x ¯ + ρ u ¯ 2 u ¯ 2 y ¯ δ ¯ x ¯ y x ¯ δ ¯ y ¯ y y ¯ + p ¯ y ¯ = 0 .
The boundary conditions are as follows:
u ¯ 1 = α a t y ¯ = H l ( x ¯ ) = ( l 1 d ¯ cos 2 ( π σ ( x ¯ ) ) ) , u ¯ 2 = α a t y ¯ = H l ( x ¯ ) = l 1 d ¯ cos 2 ( π σ ( x ¯ ) ) .
The stress component are :
S ¯ x ¯ x ¯ = ( 2 κ 1 + λ 1 ) ( 1 + λ 2 [ ( u ¯ 1 + α ) x ¯ + u ¯ 2 y ¯ ] ) ( u ¯ 1 x ¯ ) , S ¯ y ¯ y ¯ = ( 2 κ 1 + λ 1 ) ( 1 + λ 2 [ ( u ¯ 1 + α ) x ¯ + u ¯ 2 y ¯ ] ) ( u ¯ 2 y ¯ ) , S ¯ x ¯ y ¯ = S ¯ y ¯ x ¯ = ( κ 1 + λ 1 ) ( 1 + λ 2 [ ( u ¯ 1 + α ) x ¯ + u ¯ 2 y ¯ ] ) ( u ¯ 1 y ¯ + u ¯ 2 x ¯ ) .
That corresponding stream functions is u ¯ 1 = Ψ ¯ y and u ¯ 2 = Ψ ¯ x

3. Solution Method

In order to simplify the governing equations of the problem, we may introduce the following dimensionless transformations as follows:
x = x ¯ σ , y = y ¯ l 1 , ζ = l 1 σ , u 1 = u ¯ 1 α , u 2 = σ u ¯ 2 α l 1 , p = l 1 2 p ¯ κ σ α , t = α t ¯ σ , Ψ = Ψ ¯ l 1 α , d = d ¯ l 1 , h = H l l 1 , R e = ρ α l 1 κ , Q 1 = Q ¯ 1 l 1 α , q 1 = q ¯ 1 l 1 α , S x x = σ S ¯ x ¯ x ¯ κ α , S x y = l 1 S ¯ x ¯ y ¯ κ α , S y y = σ S ¯ y ¯ y ¯ κ α ,
where R e "Reynolds number", d is an amplitude ratio, ζ is a dimensionless wave number, Ψ "stream function". Substituting equations (8) into equations (4- 7) and under the long-wavelength assumption ζ 1 become the governing equations after simplification
u 1 x + u 2 y = 0
p x = S x y y , and p y = 0
S x y = ( 1 1 + λ 1 ) u 1 y
The boundary conditions become:
u 1 ( y ) = u 1 ( y ) = 1 at y = h = 1 d cos 2 ( π x ) , u 2 ( y ) = 0 at y = h = 1 d cos 2 ( π x ) .

4. Rate of Volume Flow

In fixed coordinate system, the instantaneous volume of flow rate is given by:
Q ^ 1 = W W U ¯ 1 ( X ¯ , Y ¯ , t ¯ ) d Y ¯ .
Substituting equations (3) into (12) and then integrating gets:
Q ^ 1 = q ¯ 1 + 2 α W where q ¯ 1 = W W u ¯ 1 ( x , y ¯ ¯ ) d y ¯
The time-mean flow over a period T = σ α is defined as
Q ¯ 1 = 1 T 0 T Q ^ 1 d t ¯ = 1 T 0 T ( q ¯ 1 + 2 α W ) d t ¯ = q ¯ 1 + 2 α ( l 1 d ¯ 2 ) .
By using equations (8), yields Q 1 = q 1 + 2 ( 1 d 2 ) , so that we have q 1 = Q 1 2 ( 1 d 2 ) , where q 1 is the dimensionless volume flow rate in the wave frame defined by
q 1 = h h u 1 ( x , y ) d y = h h ( Ψ y ) d y = Ψ ( h ( x ) ) Ψ ( h ( x ) ) .
With boundary conditions: Ψ y | y = h = Ψ y | y = h = 1 , Ψ ( h ) = 1 2 Q 1 Ψ ( h ) = 1 2 Q 1 .

5. Solution of the Problem

Substituting equation (11 ) into equation (10) and using the boundary conditions (12) and volume flow rate q 1 , we get the solution to the velocity equation and therefore the formula for the velocity function is
u 1 = ( 1 + λ 1 ) 2 p x ( y 2 h 2 ) 1 .
The corresponding stream functions is Ψ = ( 1 + λ 1 ) 2 p x ( 1 3 y 3 h 2 y ) y . The shear stress S x y = ( 1 + λ 1 ) p x y , where the evaluate pressure gradient is p x = 3 2 ( 1 + λ 1 ) h 3 ( Q 1 + d 2 + 2 h ) .
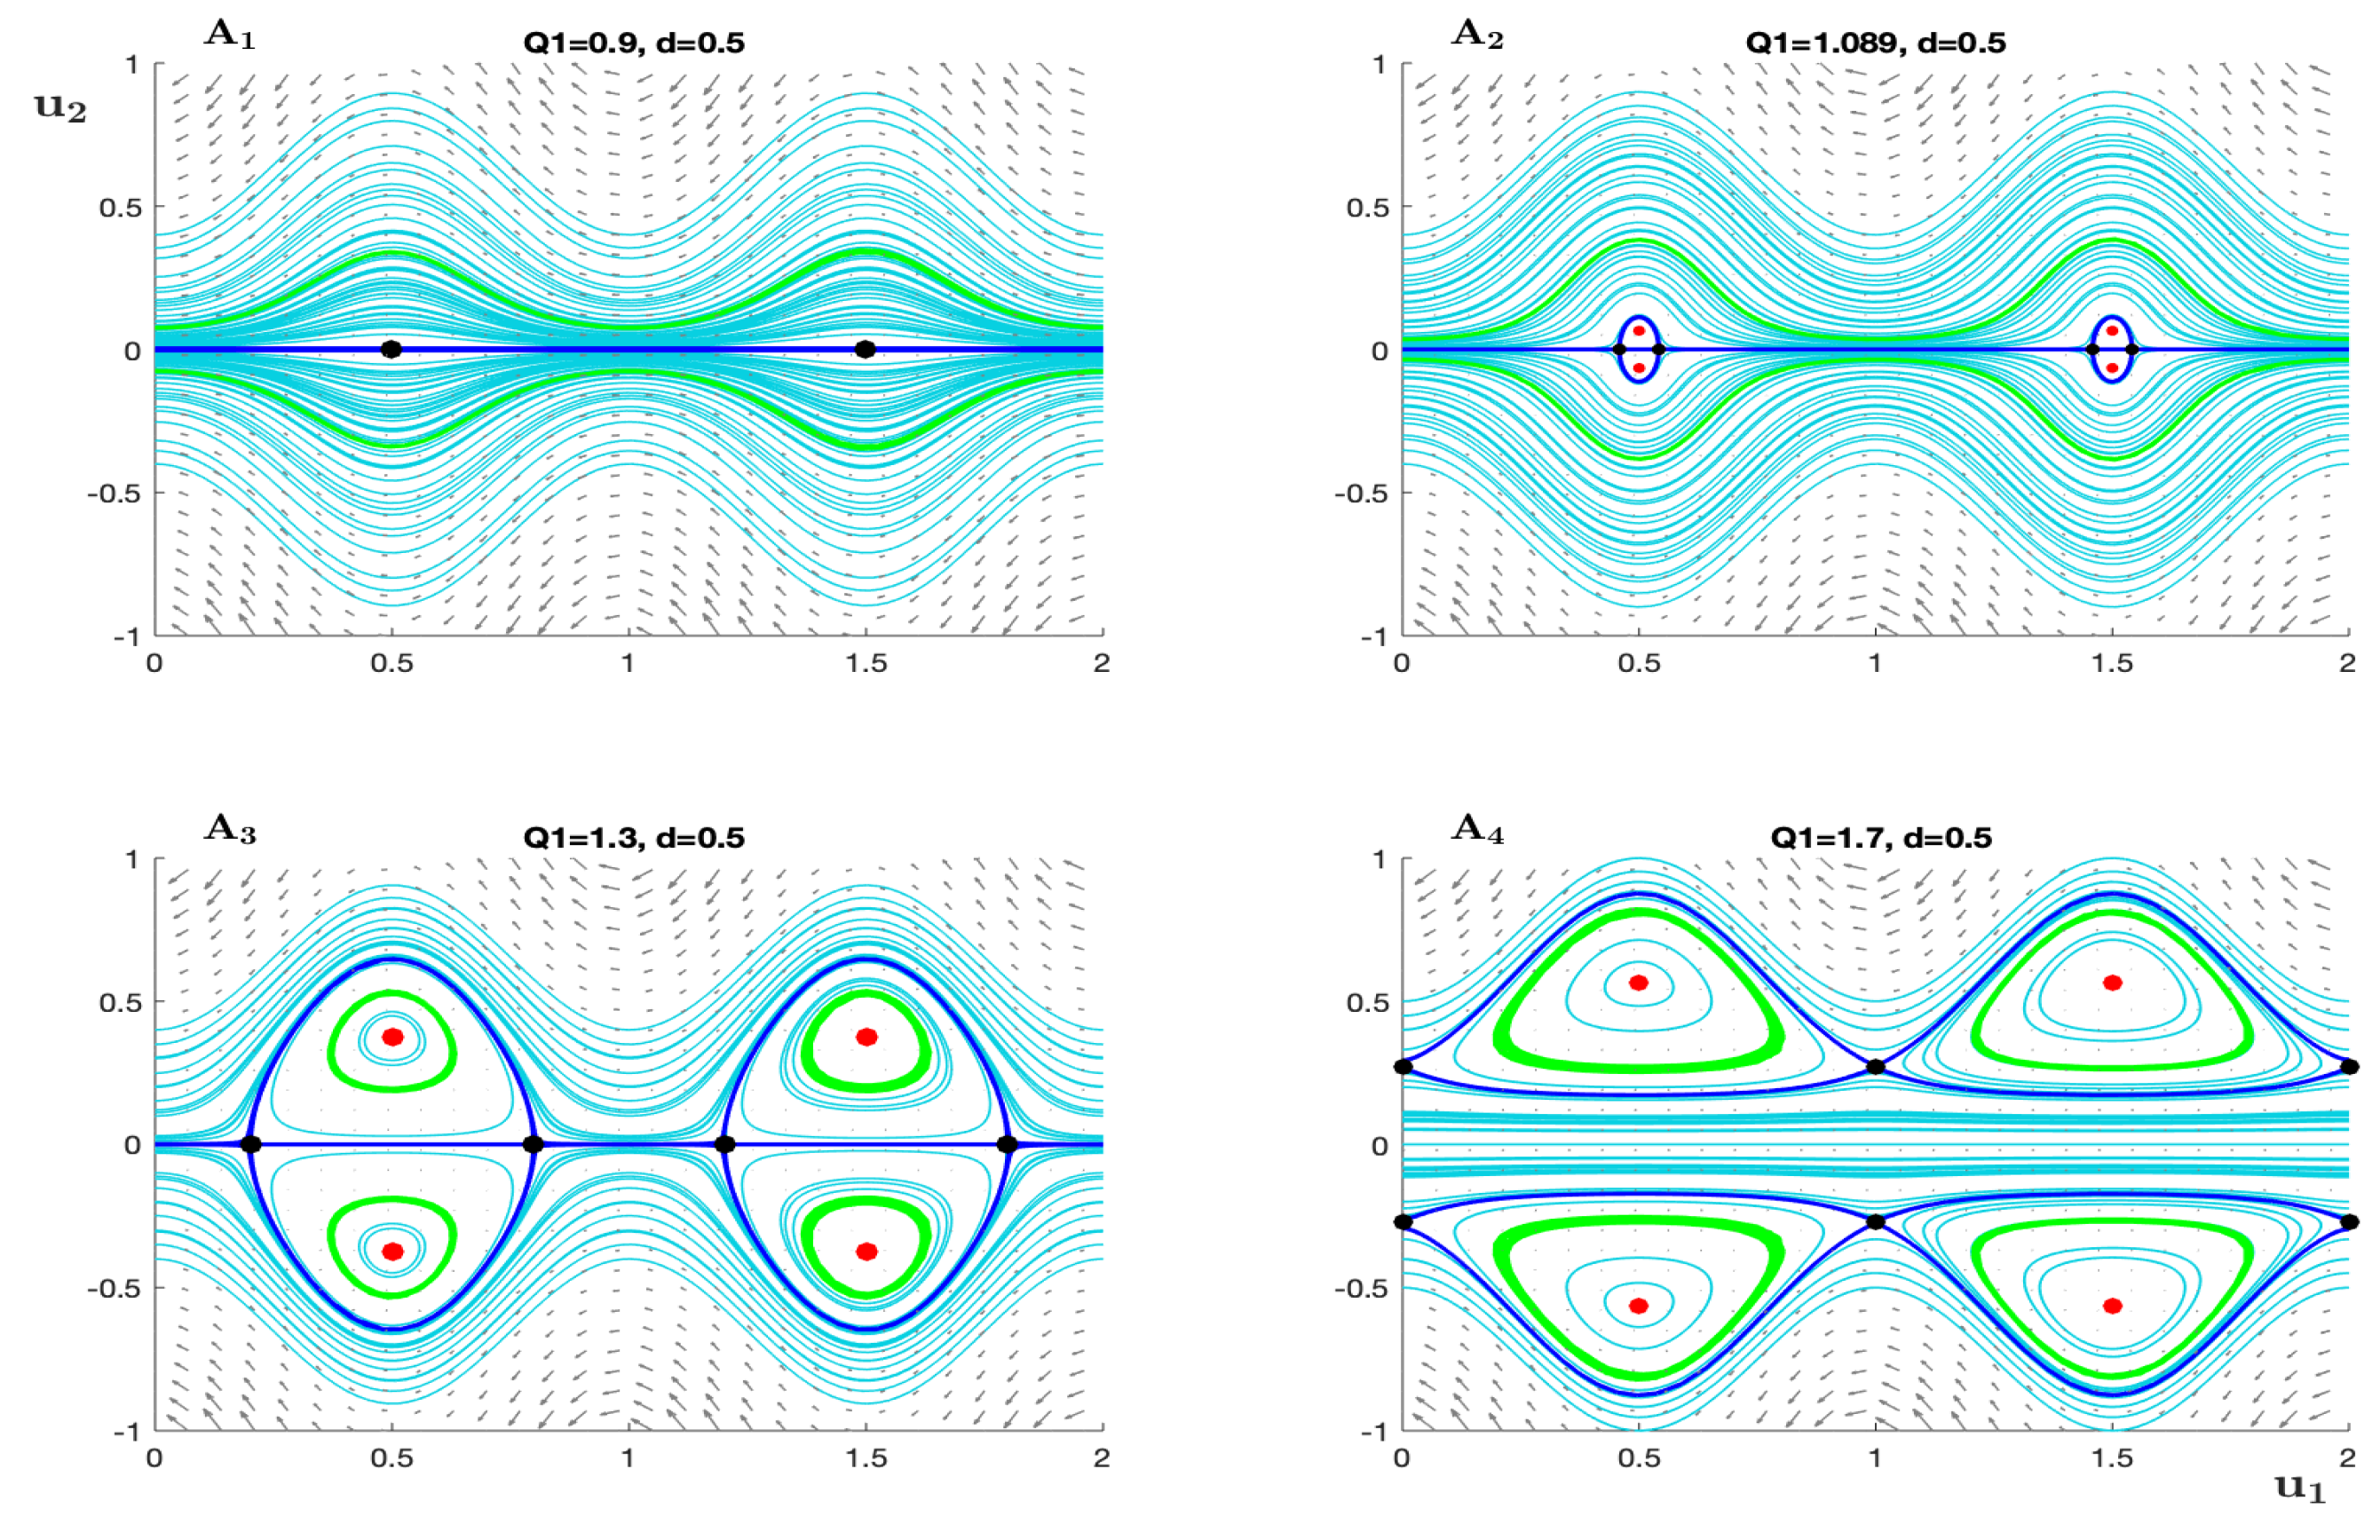
The above solution of the streamline function with specific values of the volume flow rate Q 1 = 0.9 , 1.3 and 1.7 and amplitude d = 0.5 can be analyzed to three different scenarios of the flow field (can seen in Figure 2.). Firstly, backward flow occurs when the entire flow moves with the opposite direction of the wave motion (in the panel A 1 ). Then, panel A 2 shows trapping phenomena that happens when boluses composed of fluid particles appear in the flow motion. Also, it can be described as closed path of streamlines. Finally, remarkable change is known augmented appears when the trapped bolus are under the wave crests and between them there exist some flow transports through the centerline in the wave direction, see panel A 3 .

6. The Nonlinear System and Its Bifurcation

The dynamical system theory is useful to analyze qualitative behaviors the flow of fluid. From equations (9, 16), we get the following coupled nonlinear differential equations system for the original problem with two parameters Q 1 and d:
u 1 = ( 3 / 8 ) ( ( 2 Q 1 + d 4 d ( cos ( π x ) ) 2 ) ( ( 1 d ( cos ( π x ) ) 2 ) 2 + ( y ) 2 ) ) / ( ( 1 d ( cos ( π x ) ) 2 ) 3 ) 1 = f ( x , y ) , u 2 = ( 9 / 4 ) ( ( 2 Q 1 + d 4 d ( cos ( π x ) ) 2 ) ( ( 1 d ( cos ( π x ) ) 2 ) 2 y + ( 1 / 3 ) ( y ) 3 ) d cos ( π x ) sin ( π x ) π ) / ( ( 1 d ( cos ( π x ) ) 2 ) 4 ) + ( 3 d cos ( π x ) sin ( π x ) π ( ( 1 d ( cos ( π x ) ) 2 ) 2 y + ( 1 / 3 ) ( y ) 3 ) ) / ( ( 1 d ( cos ( π x ) ) 2 ) 3 ) ( 3 / 2 ) ( ( 2 Q 1 + d 4 d ( cos ( π x ) ) 2 ) d cos ( π x ) sin ( π x ) π y ) / ( ( 1 d ( cos ( π x ) ) 2 ) 2 ) = g ( x , y ) .
The significant step in studying the above system is found equilibrium points in the flow of fluid. By putting
f ( x , y ) = g ( x , y ) = 0 ,
The system (17) can be solved numerically by using Maple software and getting the below point ( x i , y i ) . It is noted that the nature and stability of the critical points ( x i , y i ) in the flow field of the channel wall are changed due to vary values of two parameters Q 1 and d and have a remarkable effect on the behaviour of streamline, (see Figure 2).
  • ( x 1 , 2 , y 1 , 2 ) = a r c c o s ( ± 6 Q 1 3 d + 8 4 d ) π , 0 ,
  • ( x 3 , 4 , y 3 , 4 ) = 1 2 , ± 6 Q 1 3 d + 8 6 Q 1 + 3 d ,
  • ( x 5 , 6 , y 5 , 6 ) = 1 , ± 6 Q 1 d + 8 6 Q 1 9 d ( 1 d ) ,
  • ( x 7 , 8 , y 7 , 8 ) = 0 , ± 6 Q 1 d + 8 6 Q 1 9 d ( 1 d ) .
The Hartmann-Grobman theorem has been adopted as an effective method for studying local bahaviour and stability in a neighbourhood of the hyperbolic equilibrium point. Also, it is called a nondegenerate point because it has a Jacobian matrix with trace and determinant are not equal to zero. The technique of this theorem is found local linearization close to equilibrium points to investigate the stability status and nature of these equilibrium points. Therefore, the Jacobian matrix A at a critical point ( x , y ) which is a matrix containing the first-order partial derivatives of functions. It is required with its eigenvalues to analyze the stability of the system.
A | { x , y } = f x f y g x g y ,
Where
f x = d f d x = 9 4 B 1 ( ( B 2 ) 2 + y 2 ) d cos ( π x ) sin ( π x ) π ( B 2 ) 4 3 d cos ( π x ) sin ( π x ) π ( ( B 2 ) 2 + y 2 ) ( B 2 ) 3 + 3 2 B 1 d cos ( π x ) sin ( π x ) π ( B 2 ) 2 , f y = f y = 3 4 B 1 y B 2 3 , g x = g x = 18 B 1 d 2 cos ( π x ) 2 sin ( π x ) 2 π 2 ( ( B 2 ) 2 y + 1 3 y 3 ) ( B 2 ) 5 36 d 2 cos ( π x ) 2 sin ( π x ) 2 π 2 ( ( B 2 ) 2 y + 1 3 y 3 ) ( B 2 ) 4 + 9 4 B 1 d sin ( π x ) 2 π 2 ( ( B 2 ) 2 y + 1 3 y 3 ) ( B 2 ) 4 9 4 B 1 d cos ( π x ) 2 π 2 ( ( B 2 ) 2 y + 1 3 y 3 ) ( B 2 ) 4 + 15 B 1 d 2 cos ( π x ) 2 sin ( π x ) 2 π 2 y ( B 2 ) 3 3 d sin ( π x ) 2 π 2 ( ( B 2 ) 2 y + 1 3 y 3 ) ( B 2 ) 3 + 3 d cos ( π x ) 2 π 2 ( ( B 2 ) 2 y + 1 3 y 3 ) ( B 2 ) 3 24 d 2 cos ( π x ) 2 sin ( π x ) 2 π 2 y ( B 2 ) 2 + 3 2 B 1 d sin ( π x ) 2 π 2 y ( B 2 ) 2 3 2 B 1 d cos ( π x ) 2 π 2 y ( B 2 ) 2 ,
g y = g y = 9 4 B 1 ( ( B 2 ) 2 + y 2 ) d cos ( π x ) sin ( π x ) π ( B 2 ) 4 + 3 d cos ( π x ) sin ( π x ) π ( ( B 2 ) 2 + y 2 ) ( B 2 ) 3 3 2 B 1 d cos ( π x ) sin ( π x ) π ( B 2 ) 2 ,
where B 1 = 2 Q 1 + d 4 d cos ( π x ) 2 and B 2 = 1 d cos ( π x ) 2 .
From above matrix, we can get the quadratic function μ 2 + τ μ + δ = 0 , such that τ | { x , y } = f x + g y and δ | { x , y } = d a t ( A ) . The solution of this equation is two eigenvalues μ 1 and μ 2 . The fixed point p * is called hyperbolic (nondegenerate ) if the real part of the eigenvalues μ 1 and μ 2 of the matrix A are n o n z e r o . A hyperbolic fixed point can be classified according to its eigenvalues: a sink, source and center. It is a stable sink or node, if it has eigenvalues with a negative real parts, R e ( μ 1 , 2 < 0 ) . In addition, it is called an unstable sours or node point, if the real parts of all eigenvalues are positive, R e ( μ 1 , 2 > 0 ) . Finally, it is called a saddle if it is neither a sink nor a source; this would be the case if the real part of eigenvalues satisfy R e ( μ 1 ) > 0 and R e ( μ 2 ) < 0 , or vice versa. A nonhyperbolic critical point is said to have a center that has eigenvalues are only conjugate imaginary part.
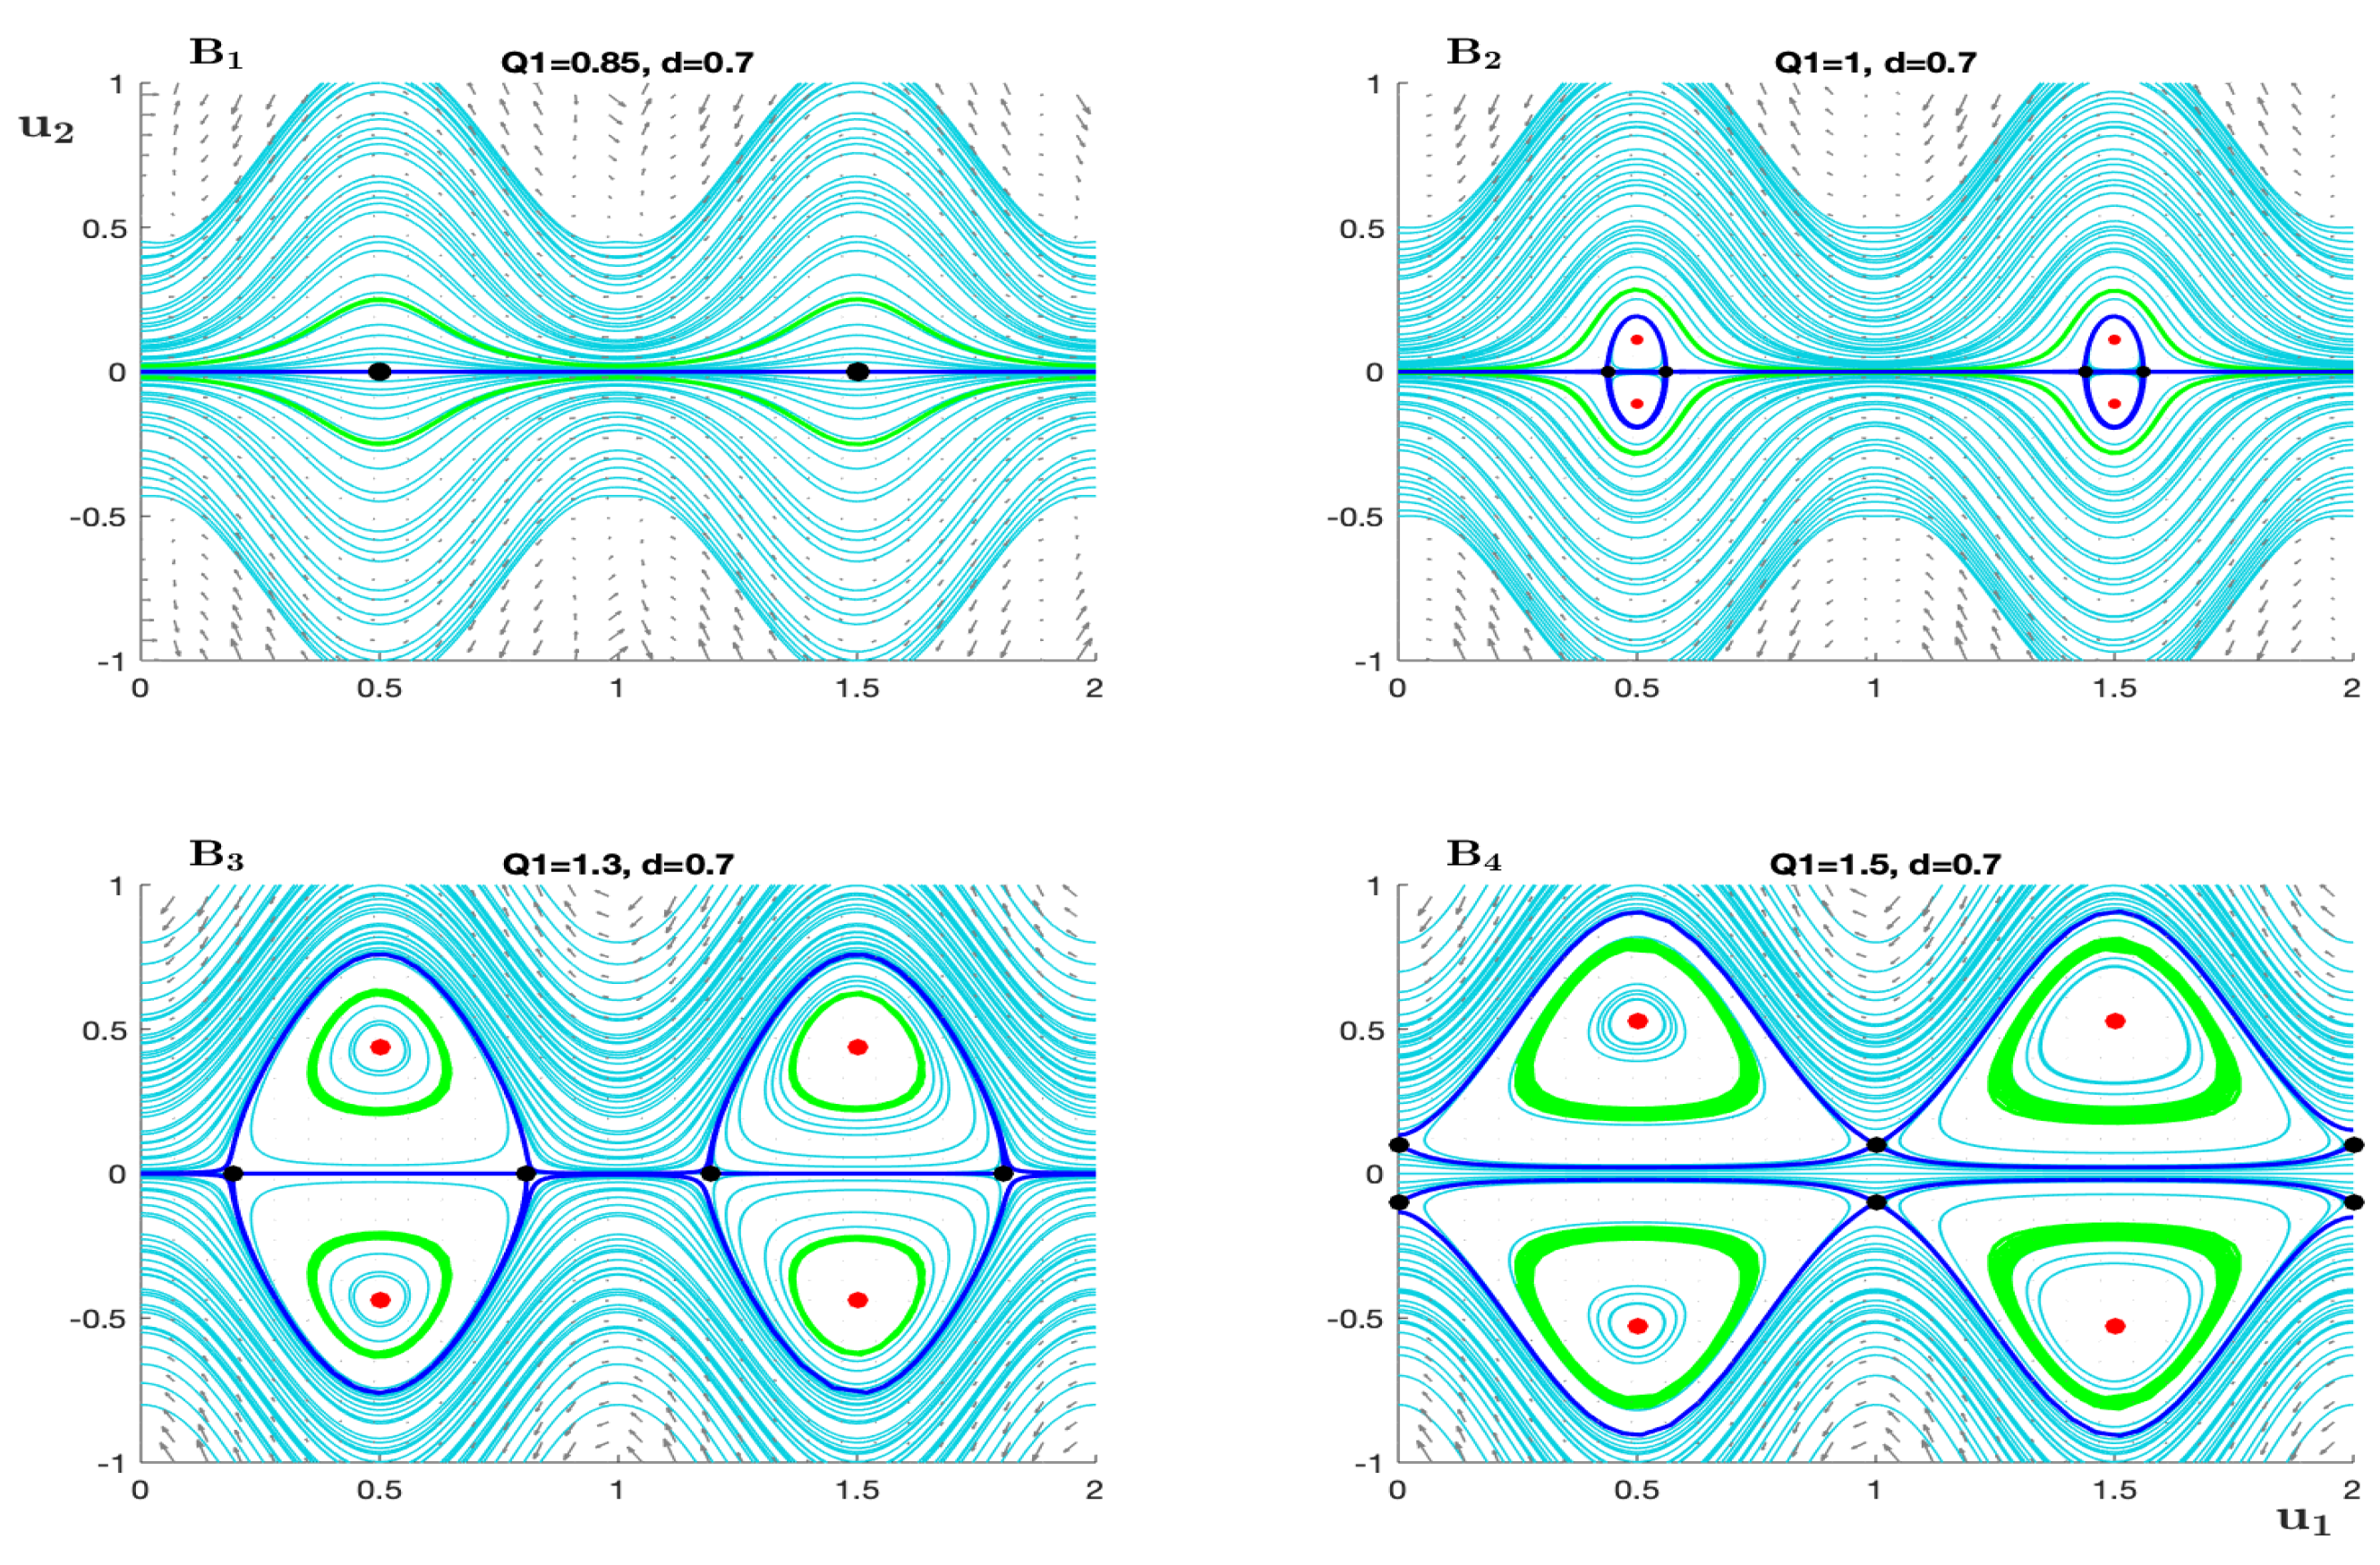
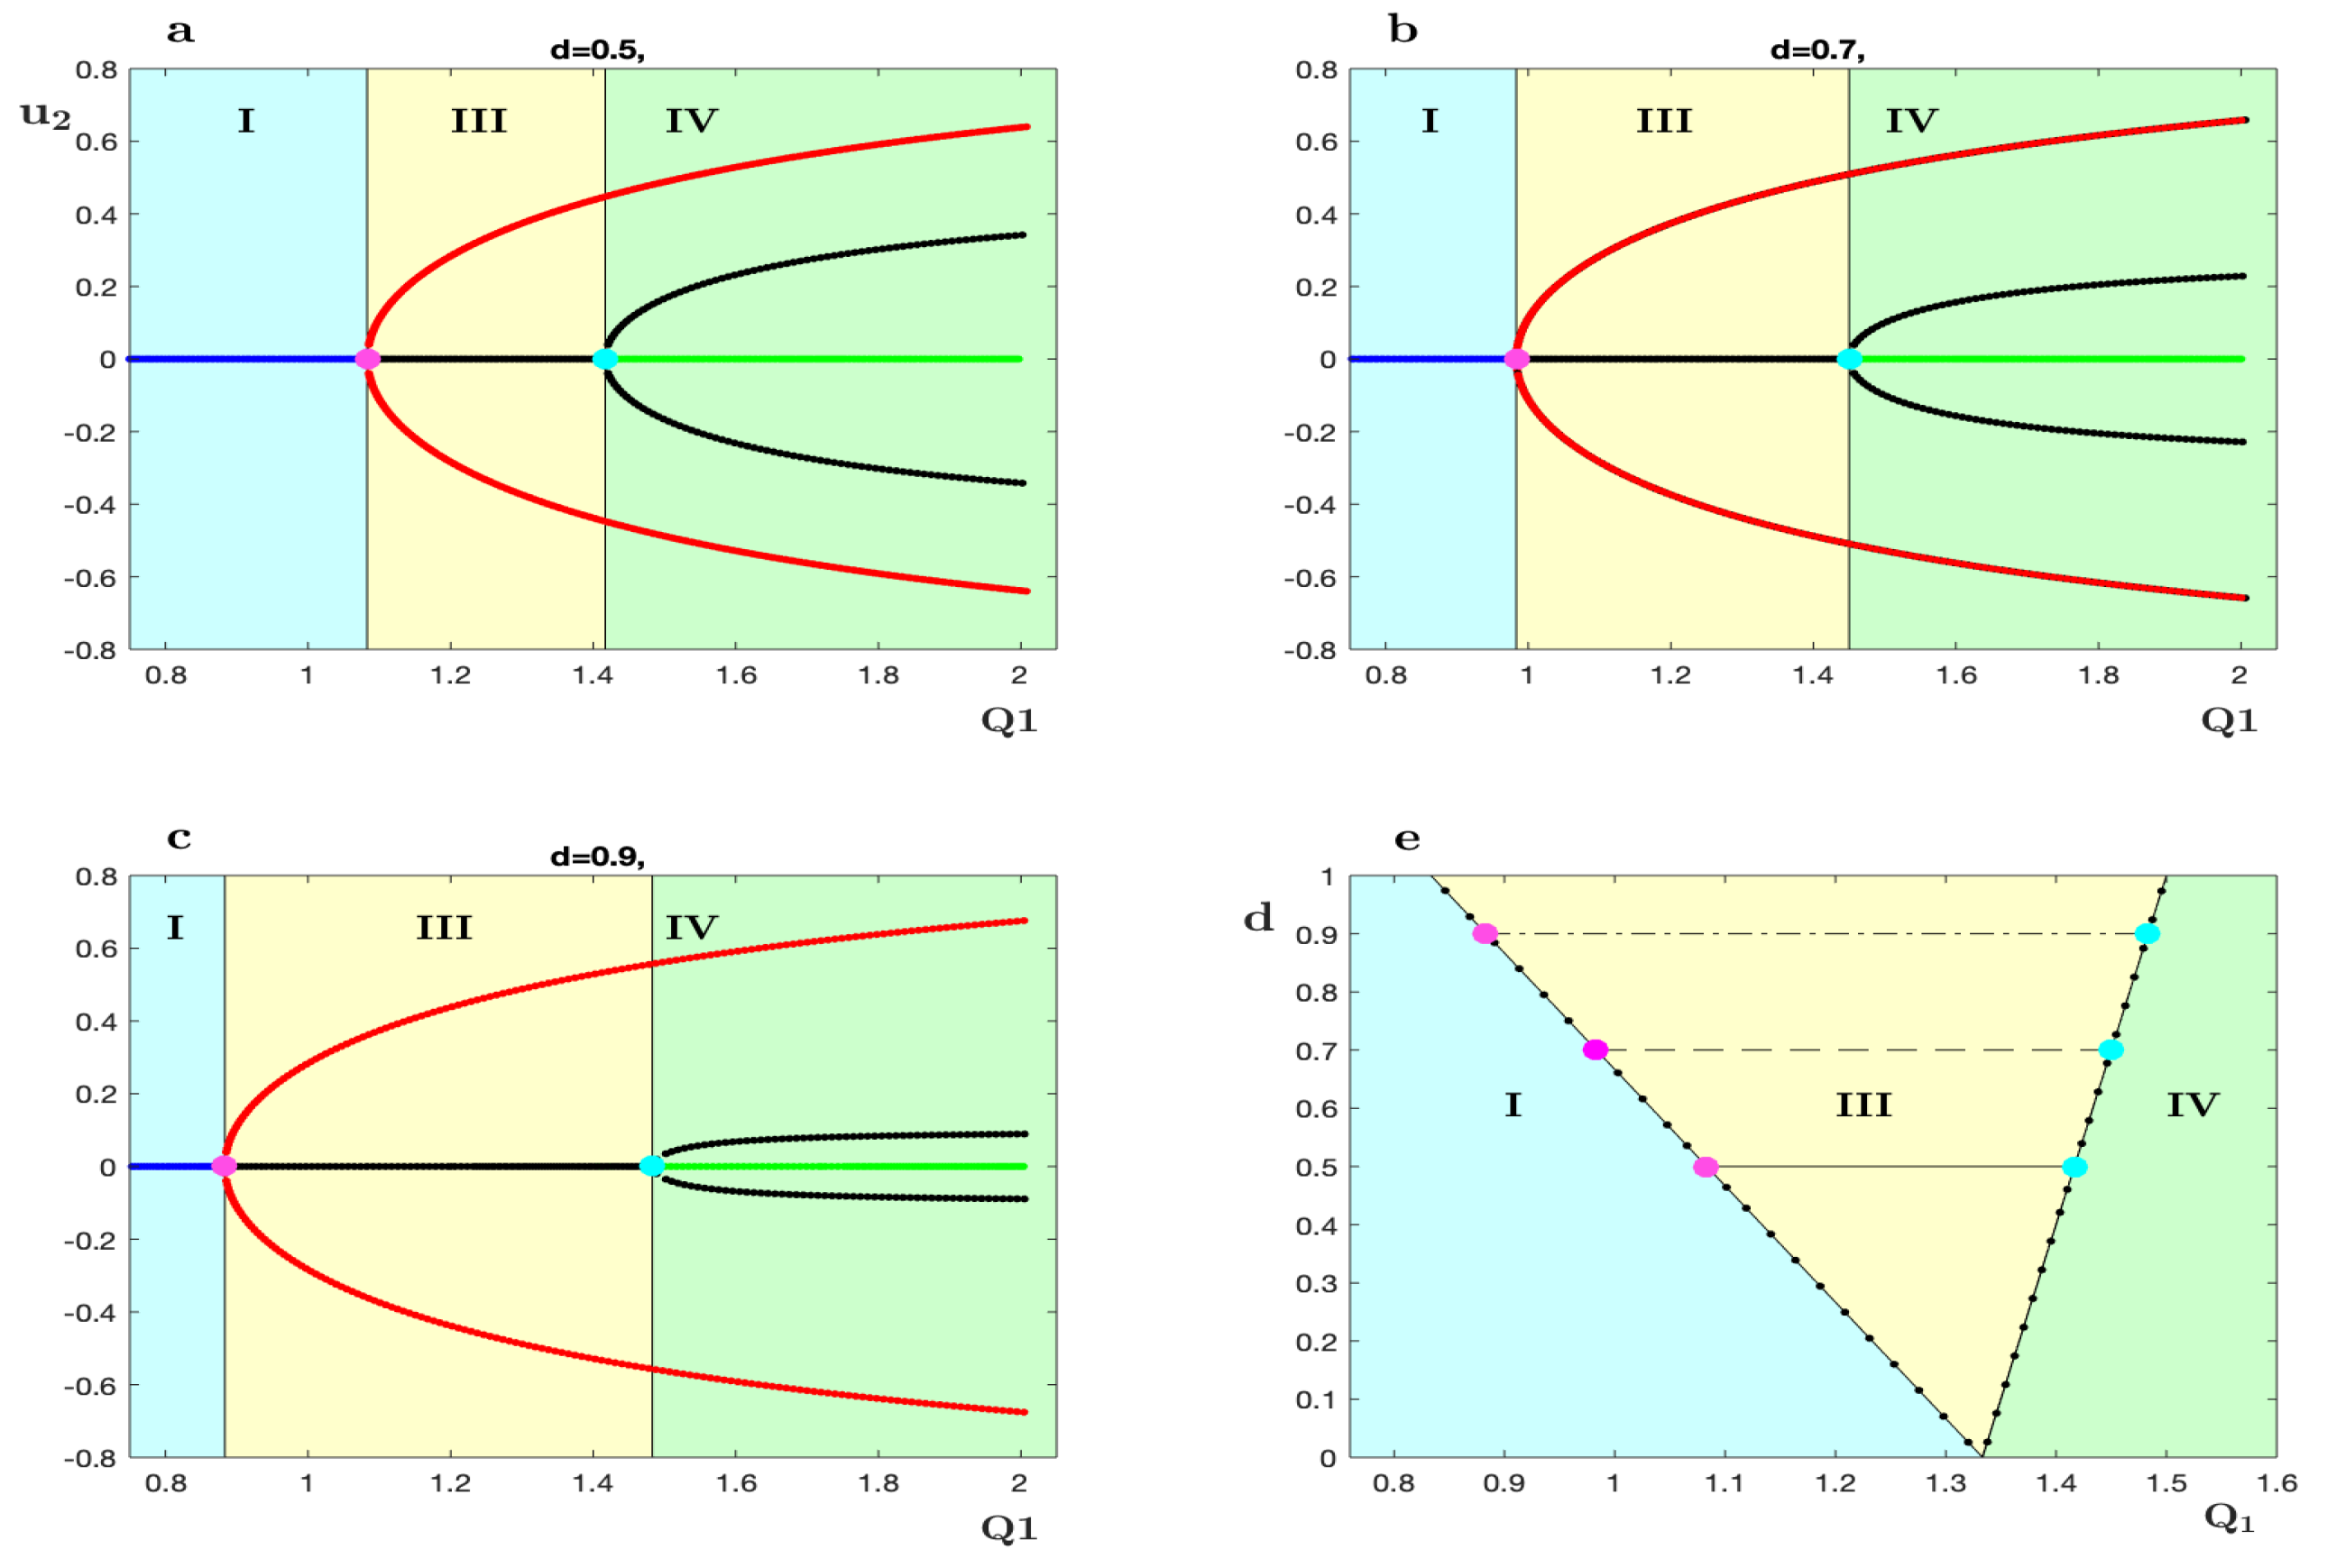
In this section, we describe the changes in the flow patterns for the stream function that are given in equation (17). These changes are shown in Figure 2 and Figure 3 with labels A i , B i ( i = 1 , 2 , 3 , 4 ) at two constant amplitude ratios of the flow channel d = 0.5 , 0.7 respectively, with different values for the rate of flow Q 1 ( 0.5 , 1.9 ) . Also for the system (17), a local bifurcation diagram is plotted in ( Q 1 , u 2 ) planes with different fluid behavior indices according to change values of d, it is displayed in Figure 4a, b, c. Moreover, a parameter space shows bifurcation parameter is numerically estimated for a regular range of d and Q 1 , also at Figure 4e.
The important qualitative observation is in Figure 2 where the value of d = 0.5 . At the panel A 1 , there are saddle points for flow pattern at Q 1 < 1.083 and represent heteroclinic connections between them. This case shows backward flow and corresponds to the blue branch in the bifurcation diagram (Figure 4a).
After the transition from A 1 to A 2 where the Q 1 = 1.089 and cross the pink bifurcation point Q 1 1.083 (Figure 4a), it will appear a small trapping zone and the distance between two centers under the same wave crest is small. With an increased value of the flow rate Q 1 = 1.3 at Figure 2 A 3 , the trapping region will expand and center points will gradually move away from each other.
Moreover, it is remarkably observed that there are black unstable saddle points ( x 3 , 4 , y 3 , 4 ) on the centerline and red center points ( x 1 , 2 , y 1 , 2 ) . The nondegenerate saddle points are plotted as a single black line and red center points represent two red branches of lines in Figure 4a at the light yellow area. There are more consequences when the value of the flow rate crosses the pink bifurcation. Every two saddle points come together to create a heteroclinic connection that it provides a global bifurcation picture of the dynamics. Due to the existence of saddle connections and center points under the wave crest, the streamlines create an enclosed flow zone, which is characterized as a “trapping” bolus phenomenon. The trapping zone appears near the upper and lower centerline of the channel.
This phenomenon will be continuous with growing the value of flow rate until the second cyan bifurcation point Q 1 1.417 will emerge, where the saadle-node bifurcation will occur. With more explanation, a saddle point splits into two black saddle points ( x 5 , 6 , y 5 , 6 ) and ( x 7 , 8 , y 7 , 8 ) under the wave trough. They shift away from u 1 a x i s and create a saddle connection, which is known heteroclinic connection that happens between two different saddle points. Also, these changes are depicted as double black curves indicate unstable critical points in the bifurcation diagram Figure 4a. The new value of the bifurcation parameter Q 1 causes the appearance of augmented flow phenomena. In other words, when the trapped bolus splits and there exist some flow going forward between them, the two remaining eddies being below the wave crests and inside the heteroclinic orbit.
With more clarification, it can be divided bifurcation diagram Figure 4a into three regions: the first one is light blue I, where backward flow occurs; the next region is light yellow, I I I , where the trapping zone is seen; and finally, at light green I V , appearance of augmented flow phenomena. The Roman numbers refer to the number of equilibrium points. These regions and the pink and cyan bifurcation points are also determined in the parameter space ( Q 1 , d ) , see Figure 4e. This figure displays the relationship between effective parameters on the streamline.
The topological appearance of the two Figure 2 and Figure 3 has a similar scenario with different values of the amplitude d = 0.5 , 0.7 , respectively. However, there is a core difference between them. Which is as the fluid amplitude d increases approximately Δ d = 0.2 , the distance between two bifurcation points ( pink at Q 1 1.45 and cyan at Q 1 0.9833 ) also increases. The effect of that change is the trapping zone is lengthened with respect to the flow rate, such that Δ Q 1 ( 0.7 ) Δ Q 1 ( 0.5 ) = 0.1327 , see Figure 4a, b (light yellow region) and Figure 4e solid and dash line.
Parameter space provides techniques for analyzing the stability and qualitative change of the system when parameters are changed, see Figure 4e. Also, the information gained from this space allows us to predict and understand the behaviour of the streamline of the system. For instance by observation, when the amplitude is d = 0.9 , at Figure 4c, it can be investigated the pink/ cyan bifurcation points for Q 1 0.8333 , 1.483 respectively, both of them lay on the branches of saddle−node bifurcation ( black dash-circle lines) in the light yellow (parameter plane). The findings from these notes tell us that there existence a trapping zone that expands more than in previous states, without the need to plot phase portraits. Moreover, it can be predicted what will happen in a complicated behaviour of flow in the future.

7. Conclusions

This paper analyzes the flow of Jeffrey’s fluid through a wave channel that simulates blood flow through arterioles. Dynamic system theory is used to analyze the streamlined topologies. In addition, it is explored the stability of equilibrium points along with their ramifications for peristaltic fluid transport. The critical points are classified by the eigenvalues extracted from the Jacobian matrix of the linearization system. There are two types of equilibrium points: centers and unstable saddles. The center shows the eddying motion in the flow, while the point where separatrices divide the flow corresponds to the saddle. The local bifurcations of the critical point are presented to display effective changes in amplitude and the flow rate parameter on the transport of fluid. Three types of streamline patterns occur: backward, trapping and augmented flow in the channel through movement due to change in value of the rate parameter. These patterns are plotted in phase portraits. The changes in the behavior of fluid through the channel correspond to the bifurcation phenomenon where non-hyperbolic degenerate points change their behavior to form the heteroclinic connection between saddles. The stability and nature of critical points and local topological changes are explained graphically, which are found numerically and analytically.

Author Contributions

Conceptualization, M.G.T., G.S.A., A.K.W., D.B. and L.I.C.; methodology, M.G.T., G.S.A. and A.K.W.; software, G.S.A., A.K.W. and L.I.C.; validation, M.G.T., G.S.A., D.B. and L.I.C.; formal analysis, M.G.T., G.S.A. and A.K.W.; investigation, M.G.T., G.S.A., A.K.W. and D.B.; resources, M.G.T., G.S.A. and L.I.C.; data curation, M.G.T. and G.S.A.; writing—original draft preparation, M.G.T. and G.S.A.; writing—review and editing, A.K.W., D.B. and L.I.C.; visualization, A.K.W.; supervision, A.K.W.; project administration, A.K.W.; funding acquisition, D.B. and L.I.C. All authors have read and agreed to the published version of the manuscript.
Data Availability Statement

Our manuscript has no associated data.

Conflicts of Interest

The authors declare no conflict of interest.

References

  1. T. W. Latham, Fluid motions in a peristaltic pump, PhD thesis, Massachusetts Institute of Technology, 1966.
  2. Fung YC, Yih CS, Peristaltic transport. Trans ASME J Appl Mech 35( 1968), 669–675.
  3. A. H. Shapiro, M. Y. Jaffrin and S. L. Weinberg, Peristaltic pumping with long wavelengths at low reynolds number, Journal of fluid mechanics, 37(4)(1969), 799-825.
  4. Raju KK, Devanathan R, Peristaltic motion of non-Newto- nian, part—I, Rheol Acta 11(1972),170–178.
  5. Usha S, Rao AR, Peristaltic transport of two-layered power- law fluids, J Biomech Eng 119(4)(1997), 483–488.
  6. Hayat T, Ali N, On mechanism of peristaltic flows for power-law fluids. Phys A 371( 2006), 188–194.
  7. Sadeghi K, Talab HJ, Analytical investigation of peristaltic transport of power law fluid through a tube. J Appl Mech Eng 3(136)( 2014.
  8. K. T. Kumar and A. Kavitha, Peristaltic transport of jeffrey fluid in contact with newtonian fluid in an inclined channel with permeablitity, International Journal of Civil Engineering and Technology, 9(3)(2018), 221-231.
  9. N. Ali, K. Ullah and H. Rasool, Bifurcation analysis for a two dimensional peristaltic driven flow of power-law fluid in asymmetric channel, Physics of Fluids, 32(7)(2020), 073104.
  10. D. G. S. Al-Khafajy and N. A. K. AL-Khalidi, The peristaltic flow of jeffrey fluid through a flexible channel, Iraqi Journal of Science, 36(12)(2022), 5476-5486.
  11. Hartnack JN, Streamline topologies near a fixed wall using normal forms, Acta Mech 136(1999),55–75.
  12. Brønse M, Hartnack JN, Streamline topologies near simple degenerate critical points in two-dimensional flow away from the boundaries, Phys Fluids 11(1999),314–324.
  13. Gürcan F, Deliceoglu A, Streamline topologies near non- simple degenerate points in two dimensional flows with double symmetry away from boundaries and an application. Phys Fluids 17 ( 2005), 093106–0931067.
  14. J. J. Lozano and M. Sen, Streamline topologies of two-dimensional peristaltic flow and their bifurcations, Chemical Engineering and Processing: Process Intensification, 49(7)(2010), 704-715.
  15. Thoubaan, Mary and Ashwin, Peter, Existence and stability of chimera states in a minimal system of phase oscillators, Chaos: An Interdisciplinary Journal of Nonlinear Science, 28(10)(2018).
  16. Strogatz, Steven H, Nonlinear dynamics and chaos: with applications to physics, biology, chemistry, and engineering, CRC press, (2028).
  17. Z. Asghar and N. Ali, Slip effects on streamline topologies and their bifurcations for peristaltic flows of a viscous fluid, Chinese Physics B, 23(6)(2014), 064701.
  18. Z. Asghar and N. Ali, Streamline topologies and their bifurcations for mixed convective peristaltic flow, AIP Advances, 5(9) (2015), 097142.
  19. K. Ullah and N. Ali, A study on the bifurcation of stagnation points for a peristaltic transport of micropolar fluids with slip condition, Physica Scripta, 96(2)(2020), 025207.
  20. K. Ullah, N. Ali and M. Sajid, Bifurcation and stability analysis of critical/stagnation points for peristaltic transport of a power-law fluid in a tube, Journal of the Brazilian Society of Mechanical Sciences and Engineering, 41(2019), 1-13.
  21. H. A. Hosham and T. Sellami, New insights into the peristaltic flow behavior of thermal nanofluid systems. International Journal of Applied and Computational Mathematics, 8(4)(2022), 182.
  22. N. Ali and K, Ullah, Bifurcation analysis for peristaltic transport of a power law fluid, Zeitschrift für Naturforschung A, 74(3)(2019), 213-225.
  23. D. G. S. Al-Khafajy, F. A. M. Bribesh and M. G. Thoubaan, Analysis of the effect of peristaltic transport flux on channel wall: Bingham fluid as a model, Iraqi Journal of Science, 65(4)(2024), 213-225.
  24. Hwang, Seong-Guk and Garud, Kunal Sandip and Seo, Jae-Hyeong and Lee, Moo-Yeon, Heat Flow Characteristics of Ferrofluid in Magnetic Field Patterns for Electric Vehicle Power Electronics Cooling, Symmetry, 14(5)(2022), 1063.
Figure 1. The graphical representation of geometry of wall surface.
Preprints 110451 g001
Figure 2. A streamline pattern is for the system (17) with different value flow rates Q 1 ( 0.5 , 1.9 ) with constant amplitude d = 0.5 . The left panel shows the backward flow of fluid with Q 1 = 0.9 and there are just saddle points. The panels A 2 , and A 3 display two significant changes physically and dynamically with Q 1 = 1.089 , 1.3 birth red/ black critical points refer to center and saddle points, respectively. Also, appearance of trapping zone is inside the heteroclinic connection that is created between two different saddle points. The last panel A 4 illustrates augment flow where Q 1 = 1.7 and changes the number of saddle points with a new formation heteroclinic connection.
Preprints 110451 g002
Figure 3. (A description is as in Figure 2 except for the change in the value of the parameter d = 0.7 ) A streamline patterns for different value flow rates Q 1 with constant amplitude d = 0.7 . The left panel shows the backward flow of fluid with Q 1 = 0.85 and there are just saddle points. The panels B 2 , and B 3 display two significant changes physically and dynamically with Q 1 = 1 . , 1.3 birth red/ black critical points refer to center and saddle points, respectively. Also, apperance of trapping zone is inside the heteroclinic connection that is created between two different saddle points. The last panel B 4 illustrates augment flow where Q 1 = 1.5 and changes the number of saddle points with a new formation heteroclinc connection.
Preprints 110451 g003
Figure 4. This figure shows the bifurcation diagram with Q 1 aginst u 2 for the equations (17) with the various values of parameters d = 0.5 , 0.7 , 0.9 in the panals A 1 , 2 , 3 respectively. Red/ black lines refer to stable/unstable points, green indicates periodic orbit and a single saddle−node is represented in a blue line. At A 4 , there are two branch lines of saddle−node bifurcation (dash−circle lines) and three regions have a light color (blue, yellow, green) that indicate the existence of three complicated behaviours (backward, trapping, augment) respectively. The symbols I , I I I , I V is the number of critical points in every zone.
Preprints 110451 g004
Disclaimer/Publisher’s Note: The statements, opinions and data contained in all publications are solely those of the individual author(s) and contributor(s) and not of MDPI and/or the editor(s). MDPI and/or the editor(s) disclaim responsibility for any injury to people or property resulting from any ideas, methods, instructions or products referred to in the content.
Copyright: This open access article is published under a Creative Commons CC BY 4.0 license, which permit the free download, distribution, and reuse, provided that the author and preprint are cited in any reuse.
Prerpints.org logo

Preprints.org is a free preprint server supported by MDPI in Basel, Switzerland.

Subscribe

© 2024 MDPI (Basel, Switzerland) unless otherwise stated