0. Introduction
Structured light three-dimensional topography measurement technology[
1] has been widely used in many fields due to its advantages of non-contact, highly precise, and fast. It has become one of the most widely used non-contact 3D reconstruction measurement methods in engineering[
2]. The
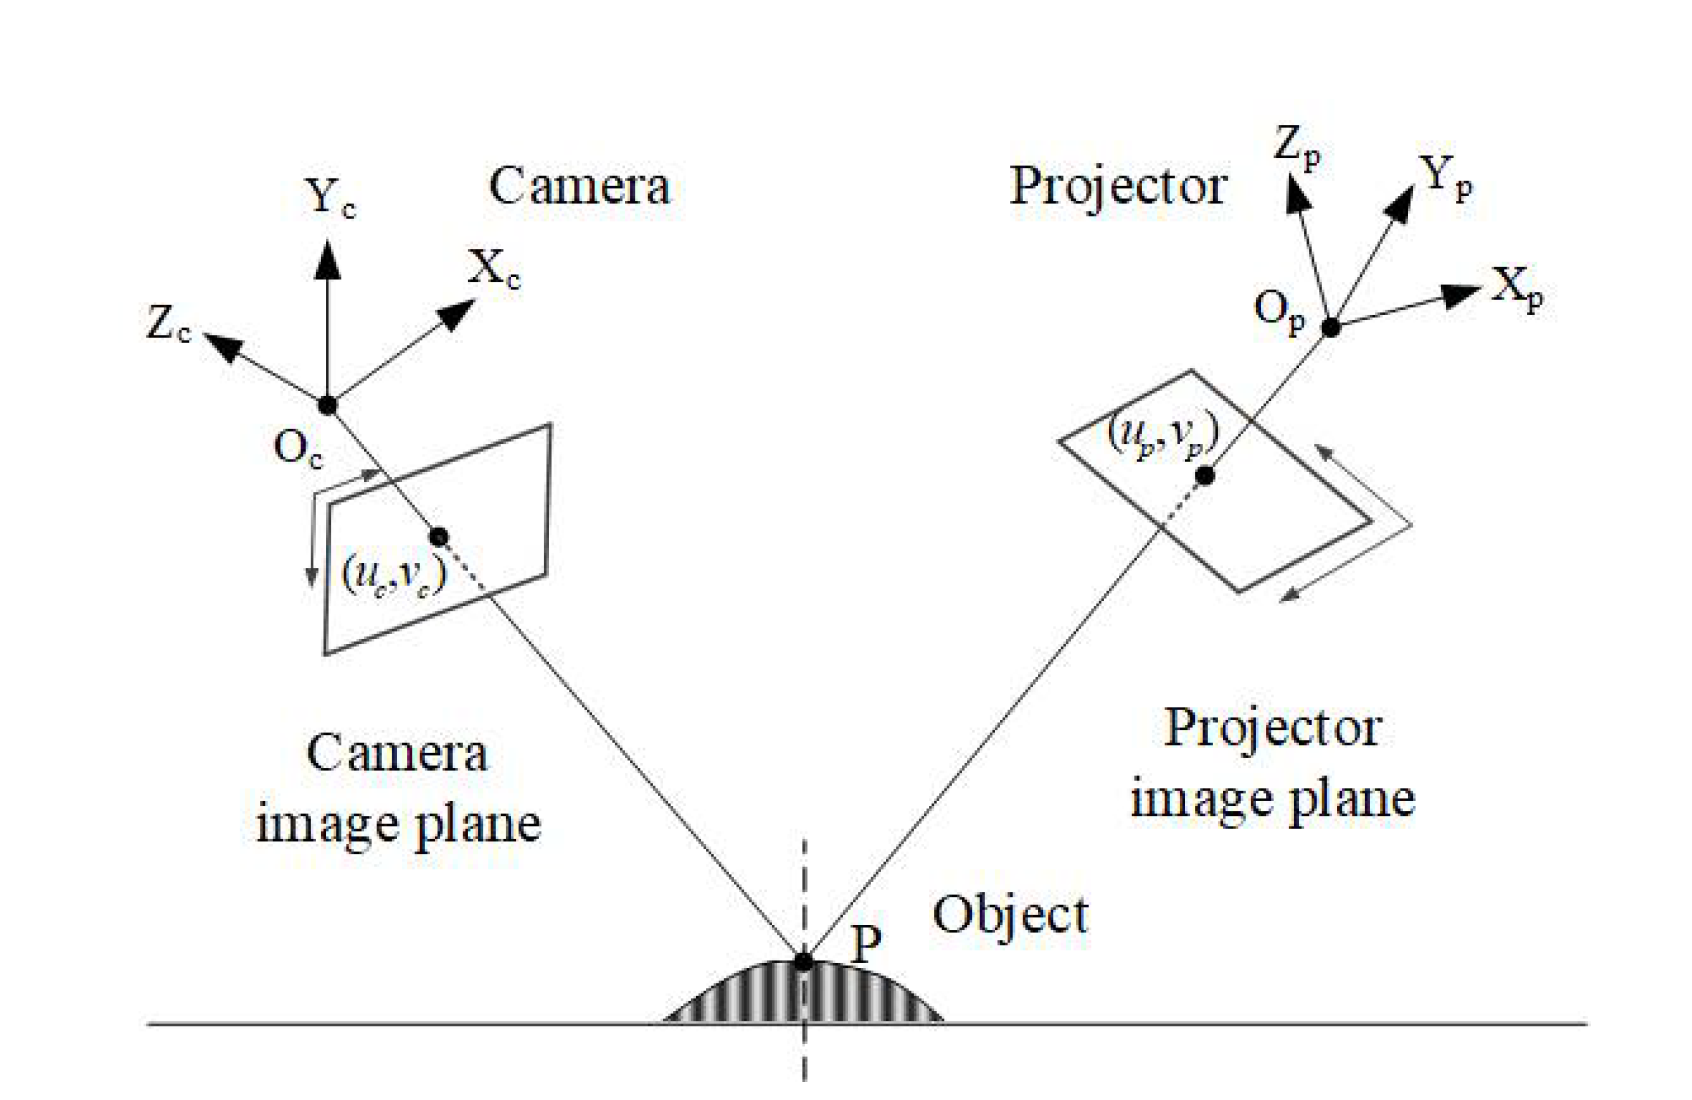
Figure 1 shows a schematic diagram of a structured light 3D measurement system based on Phase Measuring Profilometry (PMP)[
3]. The system mainly consists of three parts: a computer, a digital projector, and a camera. The measurement is primarily accomplished through the following four steps: 1. The projector projects pre-coded grating fringes onto the surface of the object to be measured; 2. The camera captures the modulated grating fringe images; 3. The phase information of the object is calculated based on these images; 4. The true 3D information of the object is determined by the calibrated phase-height relationship.
Obviously, the accuracy of the measured three-dimensional information directly depends on the phase calculation of the captured phase-shift fringe images and the calibration of the measurement system. The main factors typically involved in affecting the phase calculation accuracy include three aspects[
4]: (a) the quality of the phase-shifted image, which mainly depends on the noise level of the image, the intensity of the nonlinear effect, and the reflectivity of the object surface; (b) the number of phase shift steps. (c) the intensity modulation parameter. This parameter is usually affected by the system configuration and the reflectivity of the object to be measured.
Increasing the number of phase shift steps improves accuracy but slows down measurement speed. The intensity modulation parameter is usually affected by the system configuration and the reflectivity of the object to be measured. Noise directly affects phase calculation accuracy, often being the most significant and direct factor leading to errors in phase data. High-frequency noise has a severe impact, significantly reducing the accuracy of phase extraction and resulting in surface detail distortion during reconstruction. The impact of object surface reflectivity, especially on highly reflective or low-reflectivity surfaces, can be mitigated by adjusting the projection pattern, using multiple exposures, and employing polarizers to obtain clearer fringe images. However, these methods may require capturing or projecting more fringe images. Additionally, the reduction in reconstruction accuracy due to gamma mismatch can be effectively controlled through gamma calibration[
5,
6,
7].
Moreover, for the structured light three-dimensional measurement system, the accuracy of phase height calibration determines the upper limit of the system's measurement accuracy. Calibration accuracy is often influenced by factors such as system hardware, environment, software algorithms, and configuration.
Therefore, the most common and effective measure to improve phase calculation accuracy, without projecting additional fringe images, is suppressing image noise. Filtering technology [
8] can effectively reduce or suppress noise components in images, thereby improving image quality. For instance, in [
9], an adaptive filtering method was employed to filter captured images, effectively removing noise while preserving image details. In [
10], a new dual-domain denoising algorithm was proposed, which combines the advantages of traditional spatial and transform domain denoising algorithms. This algorithm can eliminate additive Gaussian white noise in images. In [
11], a method for extracting boundary information based on smooth filtering was proposed to eliminate the influence of uneven lighting in structured light images. This method utilizes a Gaussian filtering mask of appropriate size to process the images. In [
12], captured images were converted to the frequency domain for filtering processing, thereby suppressing the impact of noise and improving phase accuracy.
However, with the increasing application of deep learning in various fields, some scholars have also applied it to denoising phase shifted stripe images. Due to the good generalization and interpolation capabilities of feedforward and backpropagation neural networks, [
13] proposed the application of neural networks to map distorted stripe data to non-distorted data. In [
14], a model was proposed to utilize phase fringes to generate dense marker points and use backpropagation neural networks for sub-pixel calibration. In [
15], a neural network-based color decoupling algorithm was proposed to address complex color coupling effects in color stripe projection systems. They utilized the generalization and interpolation capabilities of feedforward and backpropagation neural networks to map coupled color data to decoupled color data. Moreover, it can effectively compensate for the sinusoidal characteristics and phase quality of fringes. In [
16], a multi-stage convolutional neural network model (FPD-CNN) based on deep learning was proposed for optical fringe pattern denoising. The architecture was designed according to the derivation of regularization theory. The residual learning technique was introduced into the network model through the solution of the regularization model. In some literature [
17], a lightweight residual dense neural network based on the U-net model (LRDU Net) was also proposed for fringe pattern denoising. In [
18], they investigated the application of neural network fringe calibration for a multi-channel approach.
There are primarily two methods for calibrating the correlation between absolute phase and height: implicit calibration[
19] and explicit calibration[
20]. In reference [
21], a polynomial fitting approach was introduced to establish the phase-height relationship. Reference [
22] presents a versatile new technique for calibrating the monocular system in phase-based fringe projection profilometry. This innovative algorithm features a more adaptable phase-to-height conversion model, utilizes a minimum norm solution, and concludes with a nonlinear optimization based on the maximum likelihood criterion. Additionally, an enhanced phase-height mapping approach, which involves the creation of a virtual reference plane of known height adjacent to the original reference plane, is proposed in [
23].
In reference [
24], a novel and flexible technique was introduced to calibrate the monocular system for panoramic 3D shape measurement. This system is based on a turntable setup consisting of a camera, projector, computer, and rotating platform. The presented algorithm primarily relies on the turntable and marker points to accomplish the calibration of the system's geometric parameters. In [
25], a trained three-layer backpropagation neural network was utilized to handle the complex transformation required. Reference [
26] proposed a hybrid approach that integrates geometric analysis with a neural network model. This method initially determines the phase-to-height relationship through geometric analysis for each image pixel, and subsequently employs a neural network model to identify the relevant parameters for this relationship.
Based on the proven success of deep learning in areas such as image segmentation, 3D scene reconstruction, and fringe pattern analysis, it is highly feasible to explore the utilization of deep learning techniques for precise 3D shape reconstruction from structured-light images. This is especially relevant in the denoising of fringe images and the calibration of the relationship between absolute phase and height.
Given that phase-shifting fringes are encoded using sine functions, and inspired by the application of DAE (Denoising Autoencoder) in signal processing, this paper introduces a DAE-based denoising algorithm specifically tailored for phase-shifting fringes. This algorithm aims to reduce noise in phase-shifting fringes, enabling accurate phase calculations. When compared to traditional filtering techniques, our method exhibits superior computational efficiency and is particularly adept at suppressing high-order harmonic distortions within the fringes.
Moreover, in accordance with the principle of general approximation, neural networks can serve as a "universal" function to a certain degree, capable of executing intricate feature transformations or approximating a complex conditional distribution. A multi-layer feedforward neural network (FNN) can be seen as a nonlinear composite function, and theoretically, if the hidden layer of the FNN is sufficiently deep, it can approximate any function. Therefore, by constructing an appropriate calibration model for absolute phase-to-height conversion and feeding the absolute phase as input to the FNN, with height as the output, a precise mapping relationship can be established.
Based on these concepts, this article presents the design of a neural network-based structured light 3D reconstruction measurement system. The system primarily focuses on the processing of phase fringe images and the calibration of the measurement system. The outline of this article is structured as follows: First, the measurement principle is described in
Section 1. In
Section 2, the implementation principles of DAE based phase-shifting fringe denoising algorithm and FNN based absolute phase height calibration algorithm are described. Then, the noise reduction and calibration accuracy verification results are discussed in
Section 3. Finally, the conclusion of this article is presented in Section 4.
2. Algorithm Design
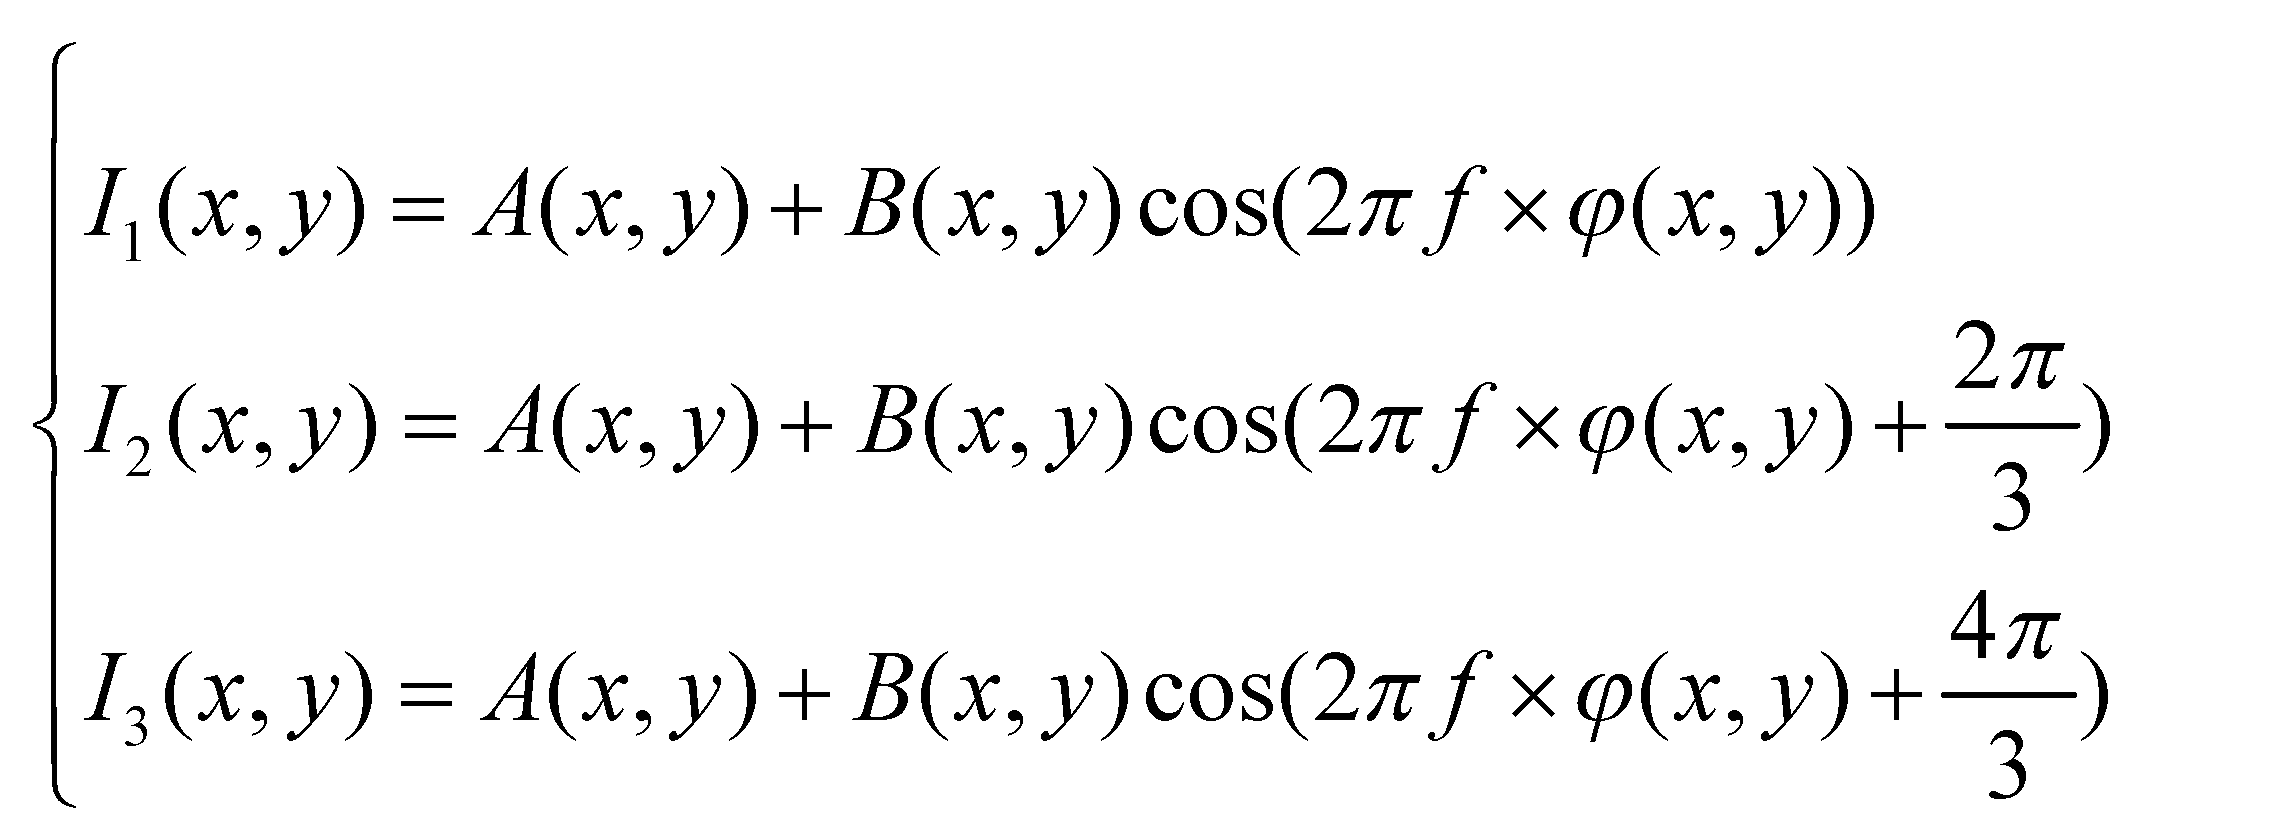
Ideally, the captured phase shift fringes should be linear. However, the measurement system may be affected due to several factors, including environmental noise, non-linear characteristics of cameras and projectors, and the surface materials of the measured object. As a result, the measurement results can no longer be accurately represented by a simple linear formula. The collected raster image is expressed as follows:
For the phase-shift-fringe images, the factors that affect fringe quality are mainly three: image noise noise_n(x,y), the non-linear intensity of the light source gamma and surface reflectivity changes r(x,y).
Although various traditional studies have shown that filtering fringe images can effectively reduce phase errors in the process of wrapping phase recovery, people may intuitively believe that directly filtering the wrapping phase can also suppress phase errors. However, experimental results indicate that directly filtering the wrapped phase is actually not feasible. This article draws inspiration from the application of Auto Encoder in signal denoising, particularly in image denoising. Using the Auto Encoder as a basis, we have designed a denoising correction algorithm tailored for Phase Measuring Profilometry images. Specifically, we train the autoencoder to reconstruct the original, noise-free phase-shifted fringe pattern from a noisy phase fringe image.
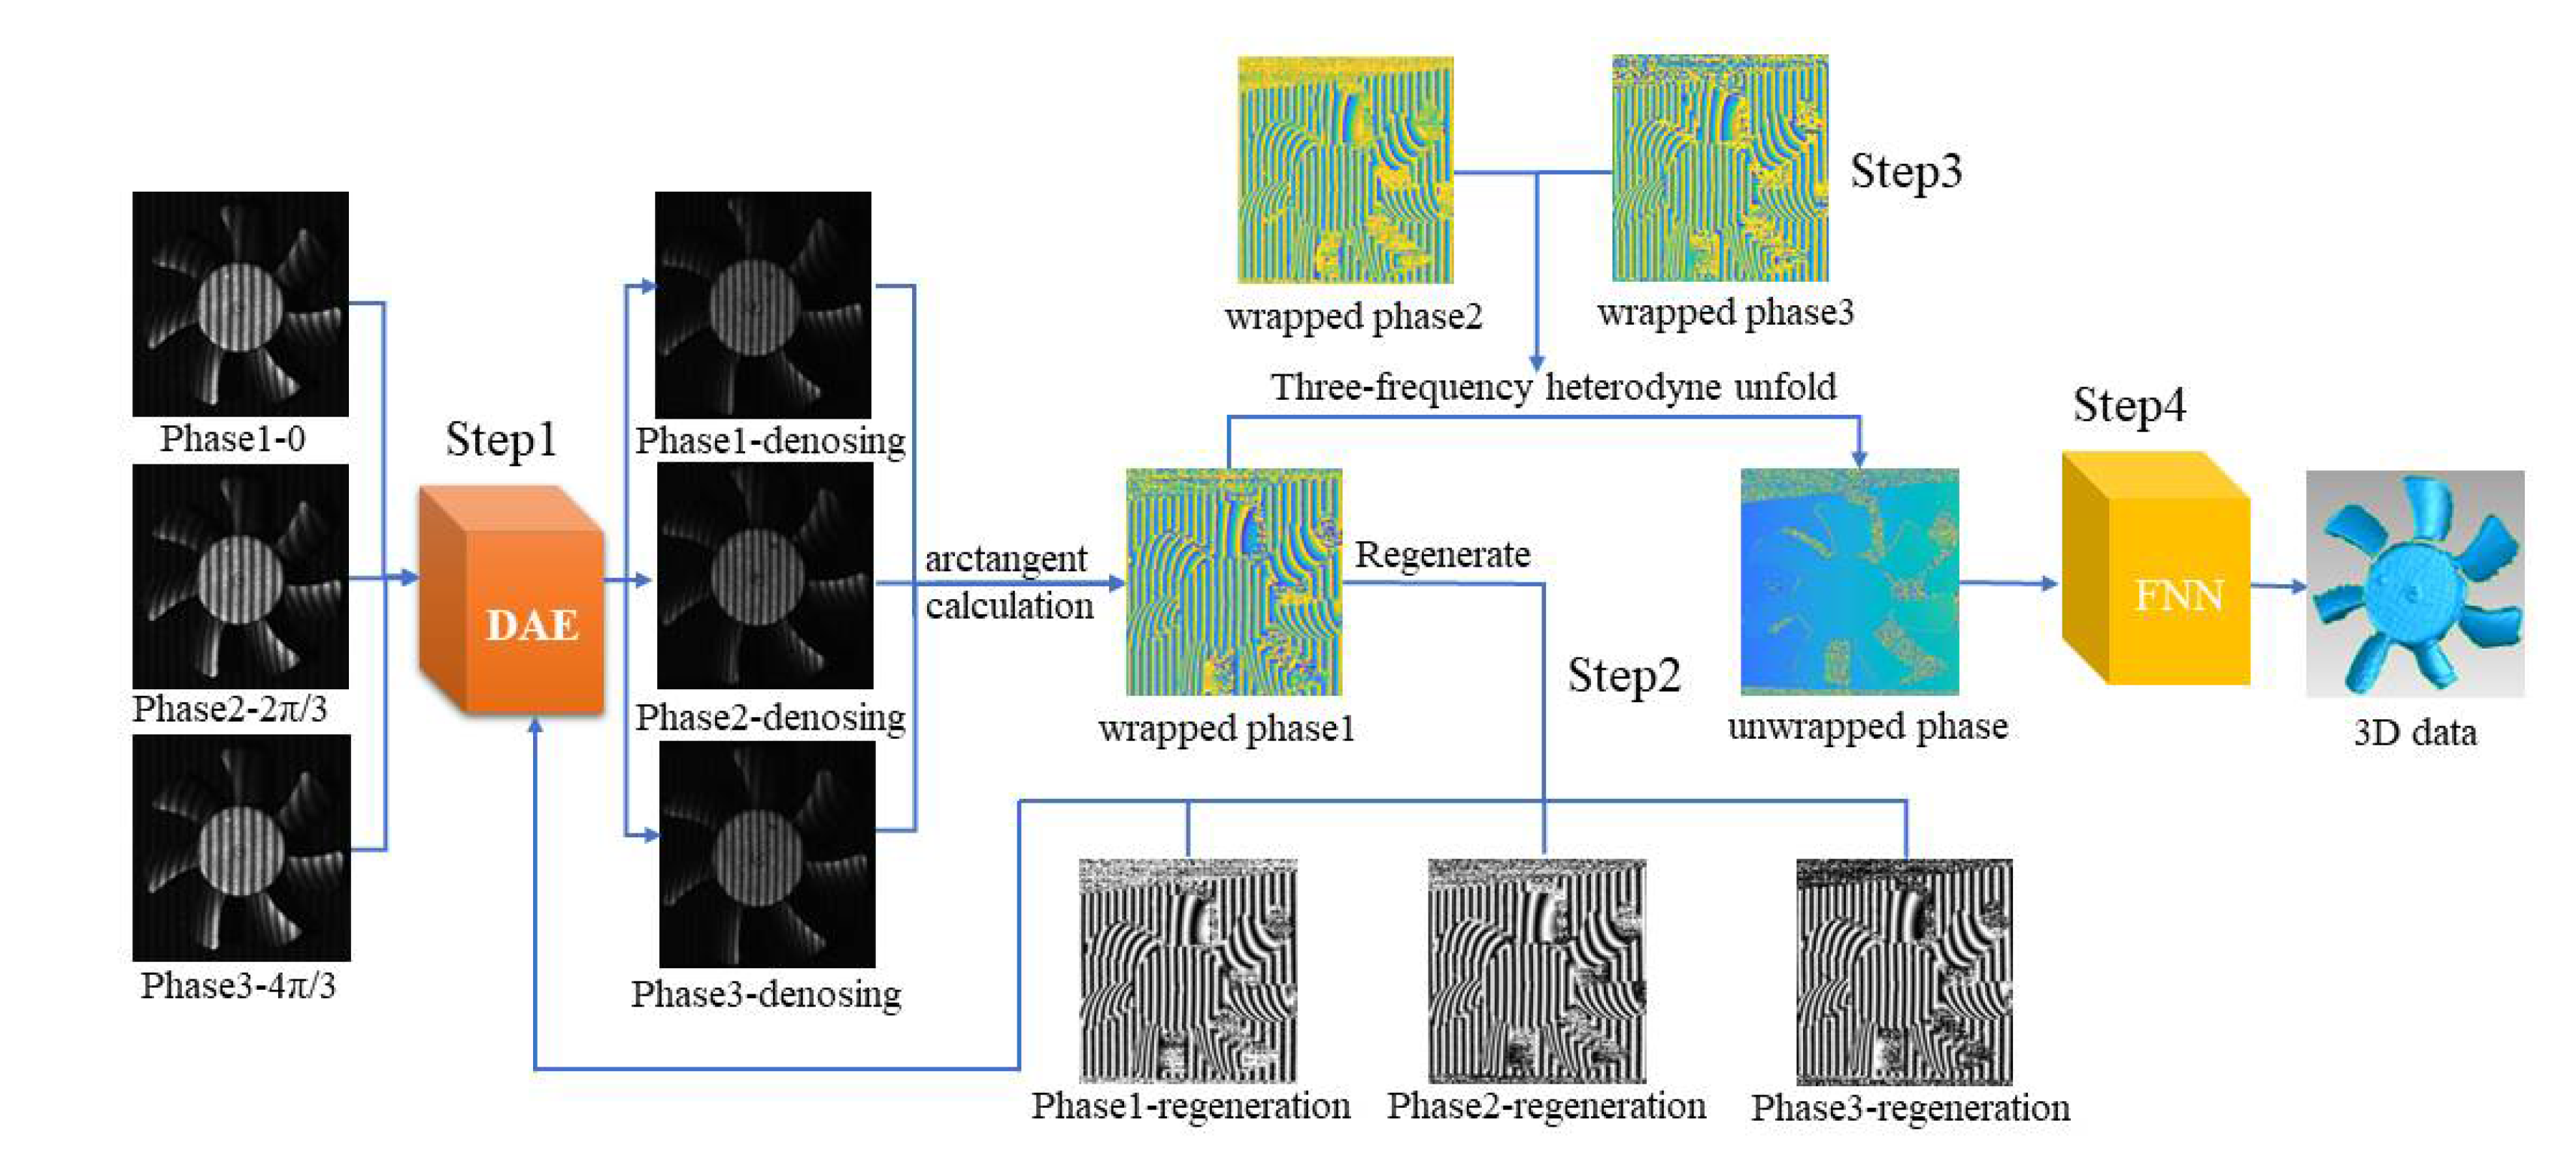
This algorithm is based on the following steps:
Step 1: Feed the noisy phase-shifted stripe image, captured by the camera, into the trained DAE for an initial noise reduction and correction.
Step 2: Compute the wrapping phase using formula (3) for the phase-shifted fringe image that has undergone preliminary noise reduction and correction.
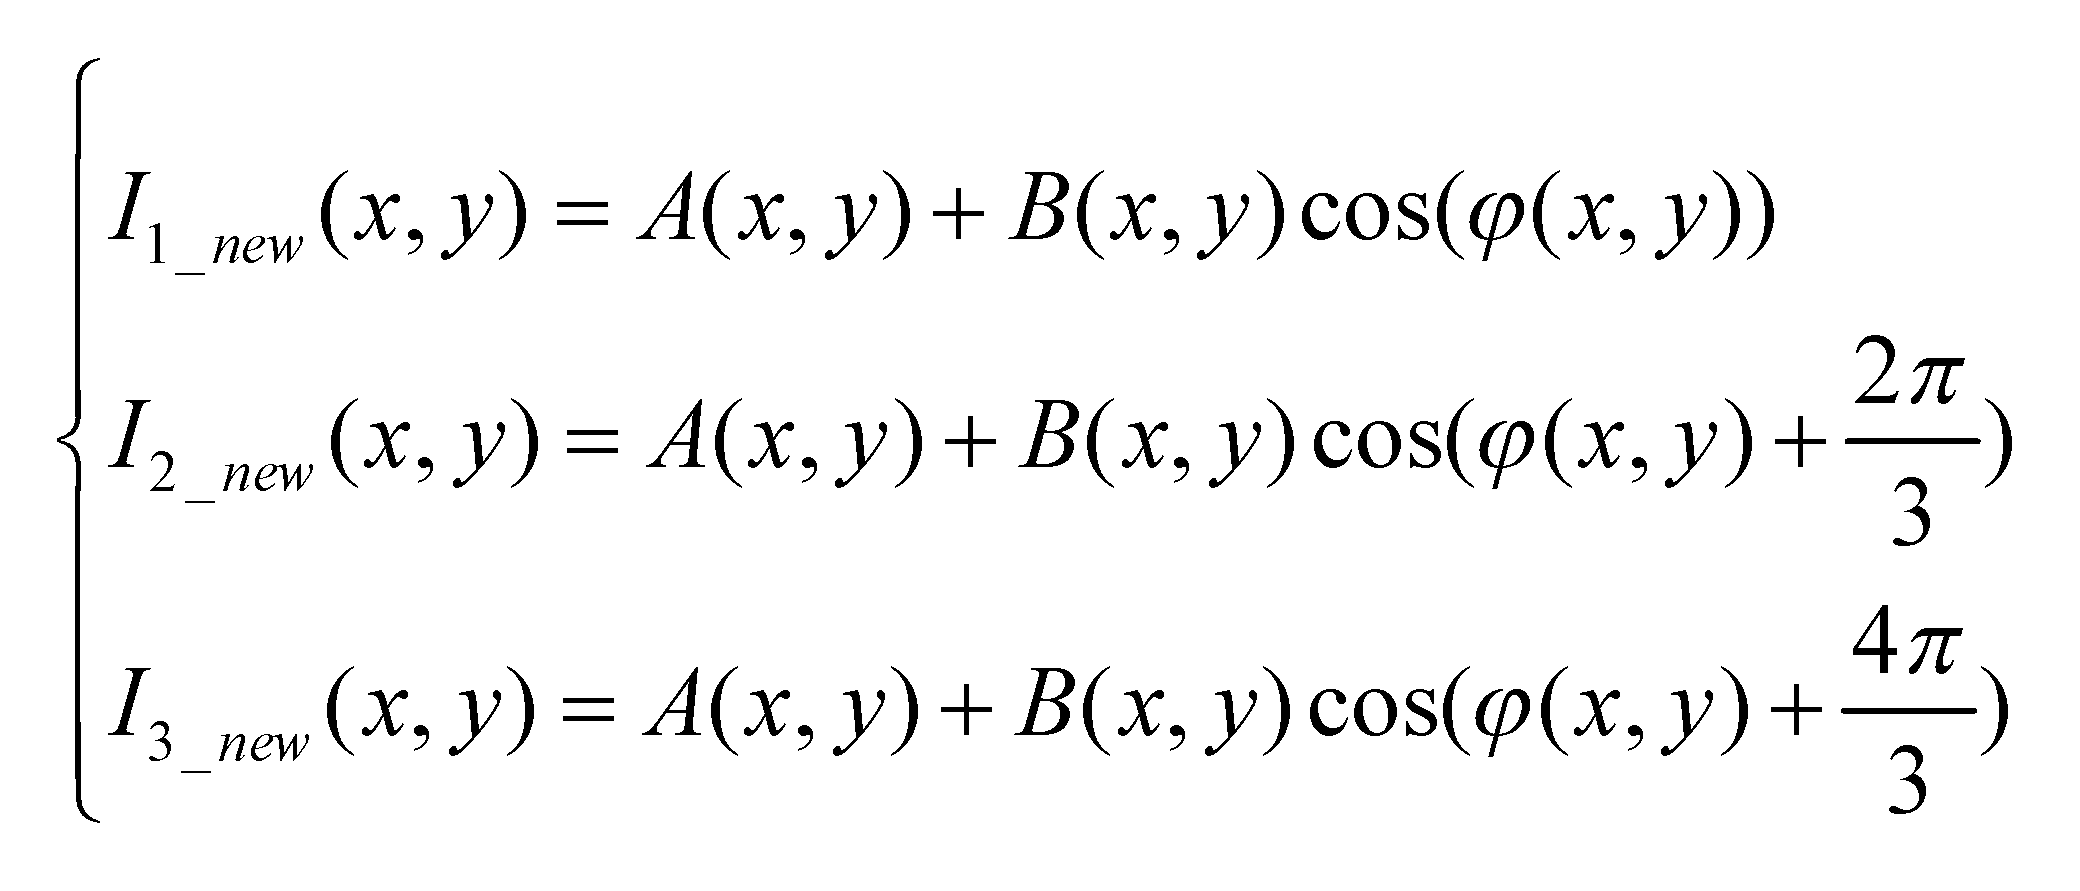
Step 3: Using formula (9), regenerate a fresh three-step phase-shifting fringe pattern based on the wrapped phase. Subsequently, input this pattern into the DAE once again for iterative denoising.
Where A(x,y) and B(x,y)represents the foreground and background encoded in the chapter 1.1, while φ(x,y) is the current calculated phase value of the wrapped phase.
Step 4: Output the iteratively generated phase-shifted stripe images after undergoing noise reduction and correction by the DAE.
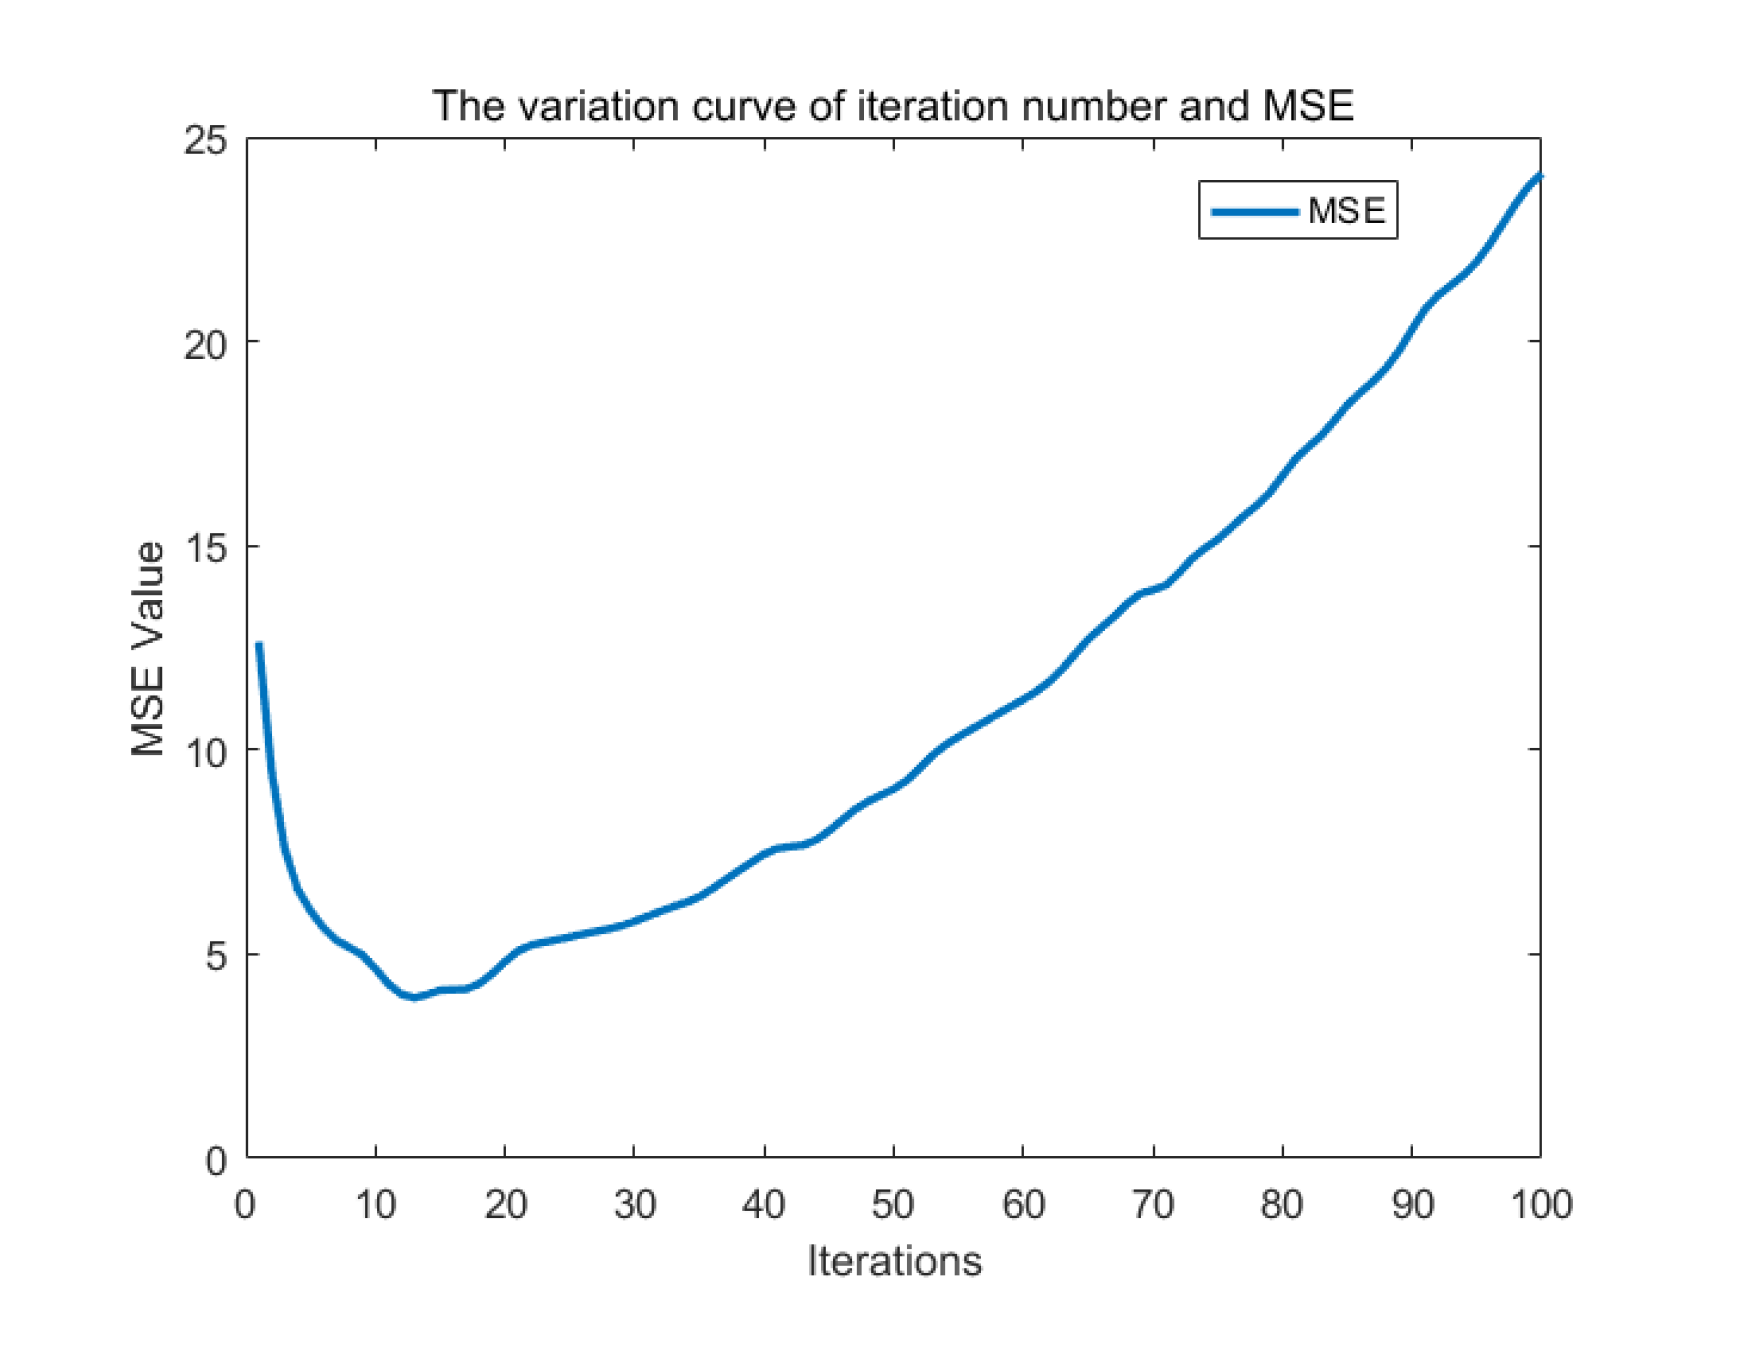
It is worth noting that DAE effectively reconstructs the sine of phase-shifted stripe images without overfitting, thereby improving stripe quality. Moreover, due to the inherent characteristics of the wrapped phase, direct Gaussian filtering of the wrapped phase will result in significant distortion, leading to correction failure. This is a theoretical prerequisite for step 3 to further improve the accuracy of the wrapped phase by regenerating the phase-shifted fringe image from the wrapped phase and iteratively denoising and reconstructing it by re-inputting it into the DAE. Iterative denoising gradually refines the data, enhancing denoising performance and achieving higher accuracy.
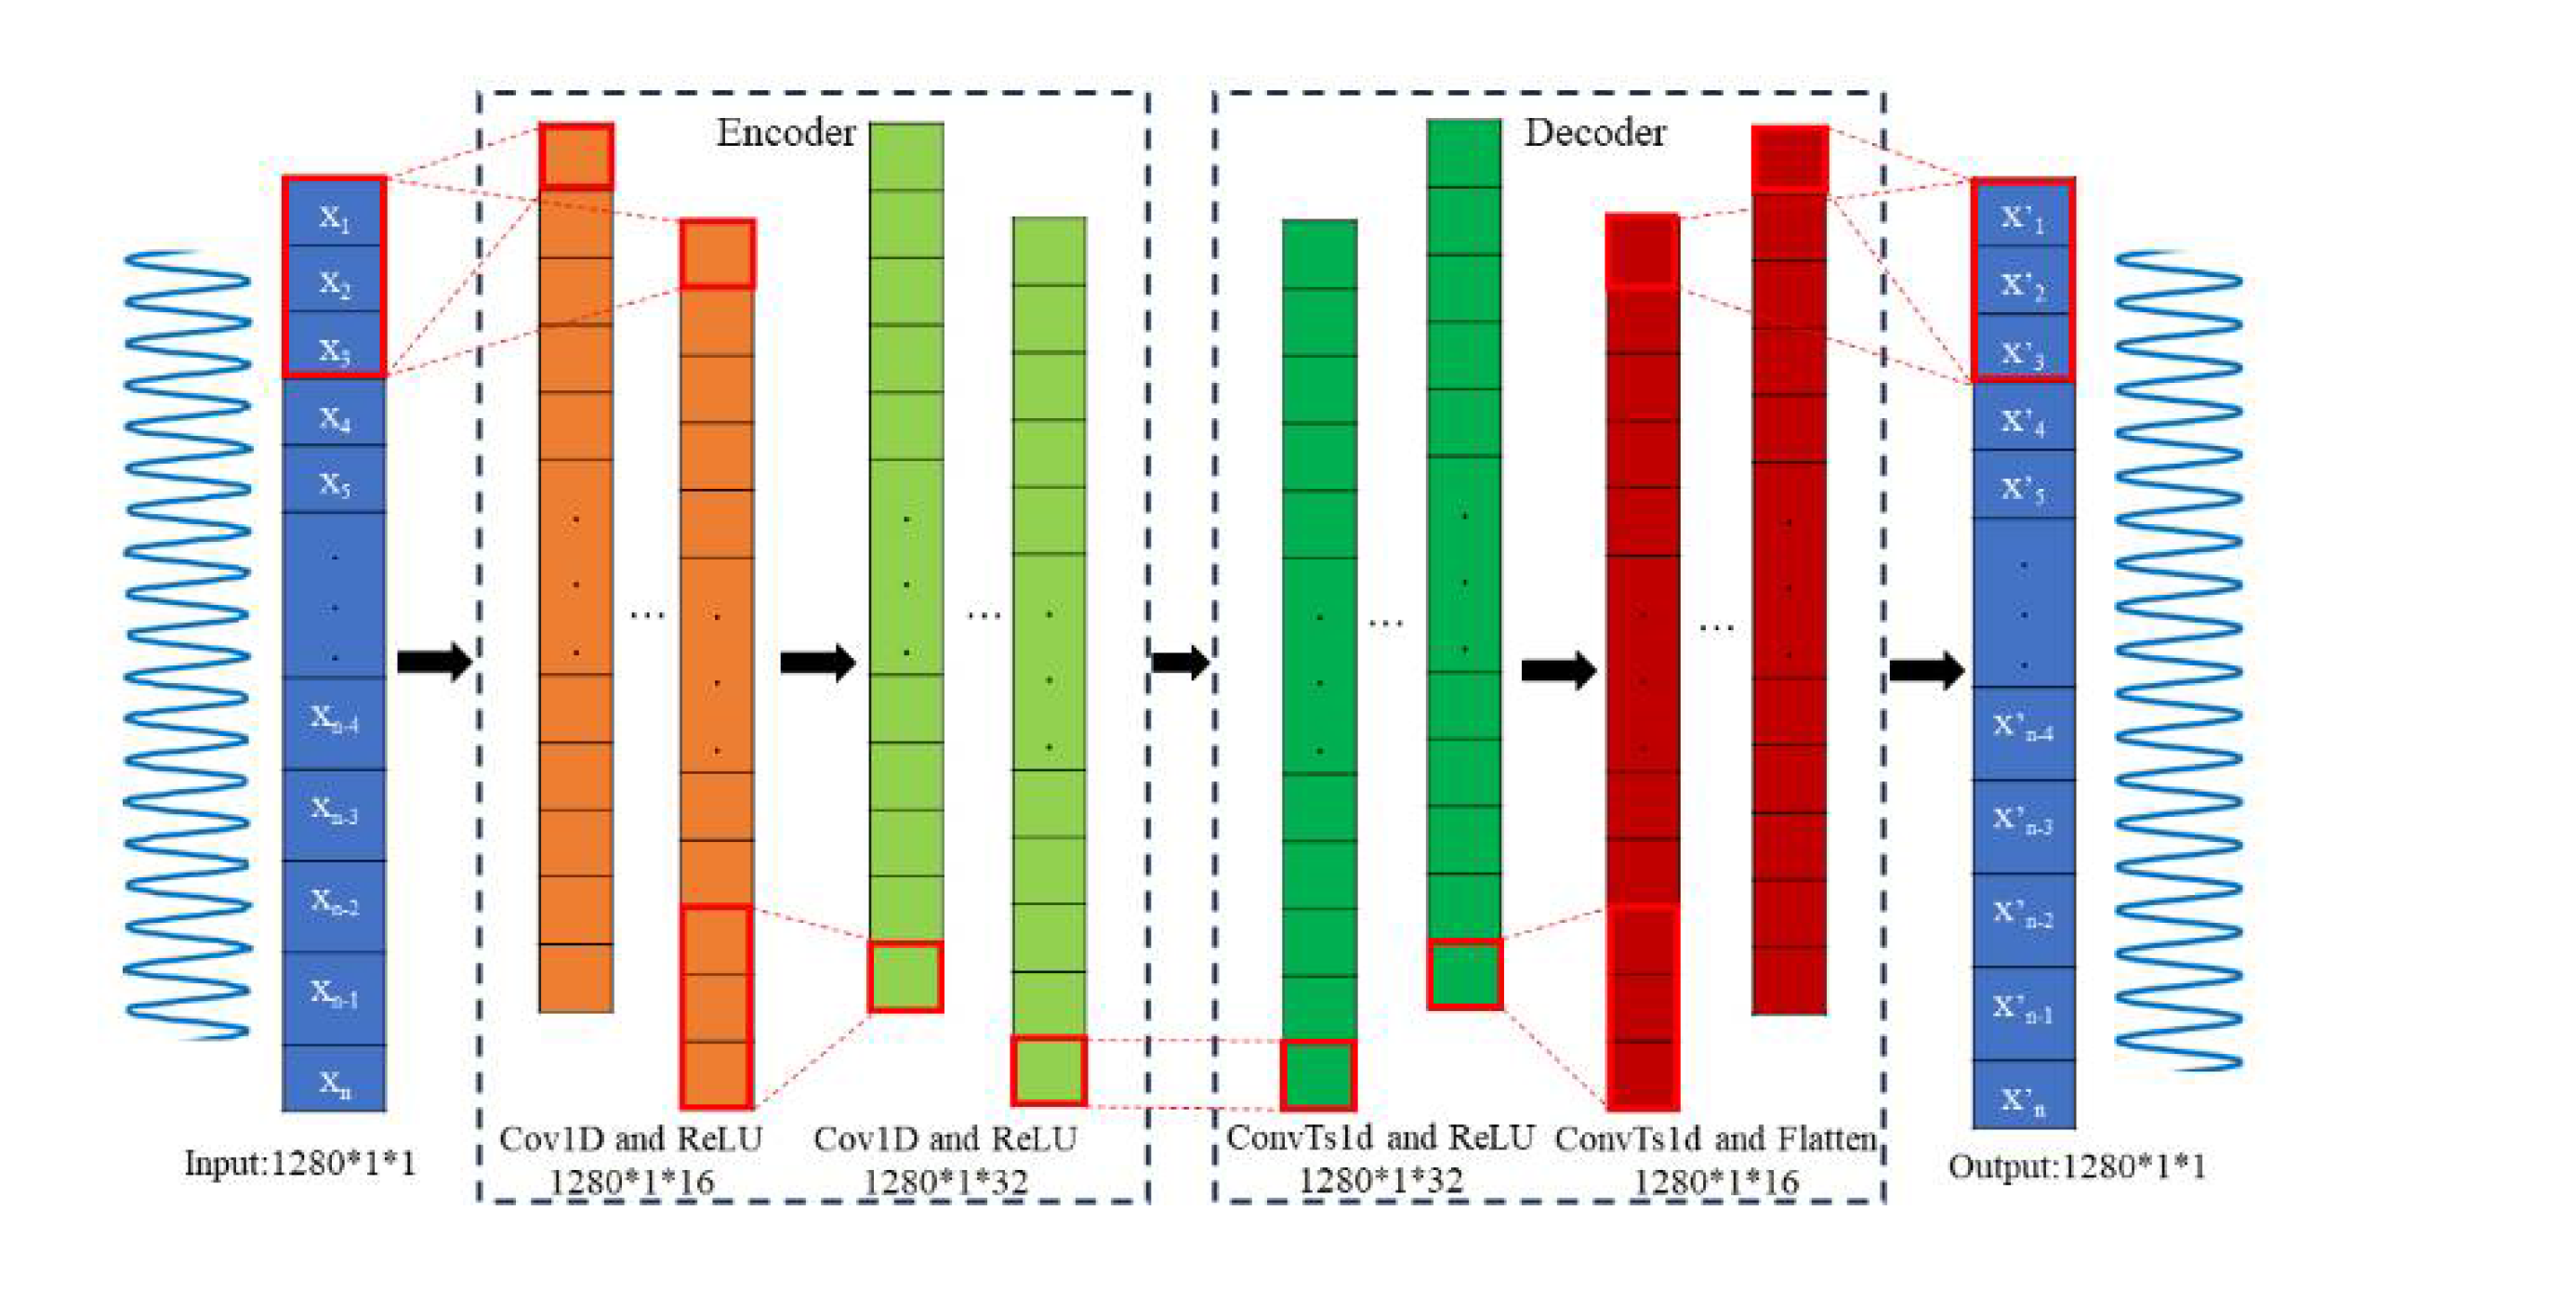
The proposed DAE structure is shown in
Figure 2. In this DAE, the encoder consists of two layers of 1D convolution: one layer has an input channel size of 1, an output channel size of 16, a convolution kernel size of 3, and an activation function of ReLU; the other layer has an input channel size of 16, an output channel size of 32, and a convolution kernel size of 3. The decoder consists of two layers of 1D deconvolution: one layer has an input channel size of 32, an output channel size of 16, a convolution kernel size of 3, and an activation function of ReLU; the other layer has an input channel size of 16, an output channel size of 1, and a convolution kernel size of 3.
After obtaining the high-precision wrapped phase, the multi-frequency heterodyne method described earlier is used to unwrap the phase φ(x,y) and obtain the absolute phase ϕ(x,y).
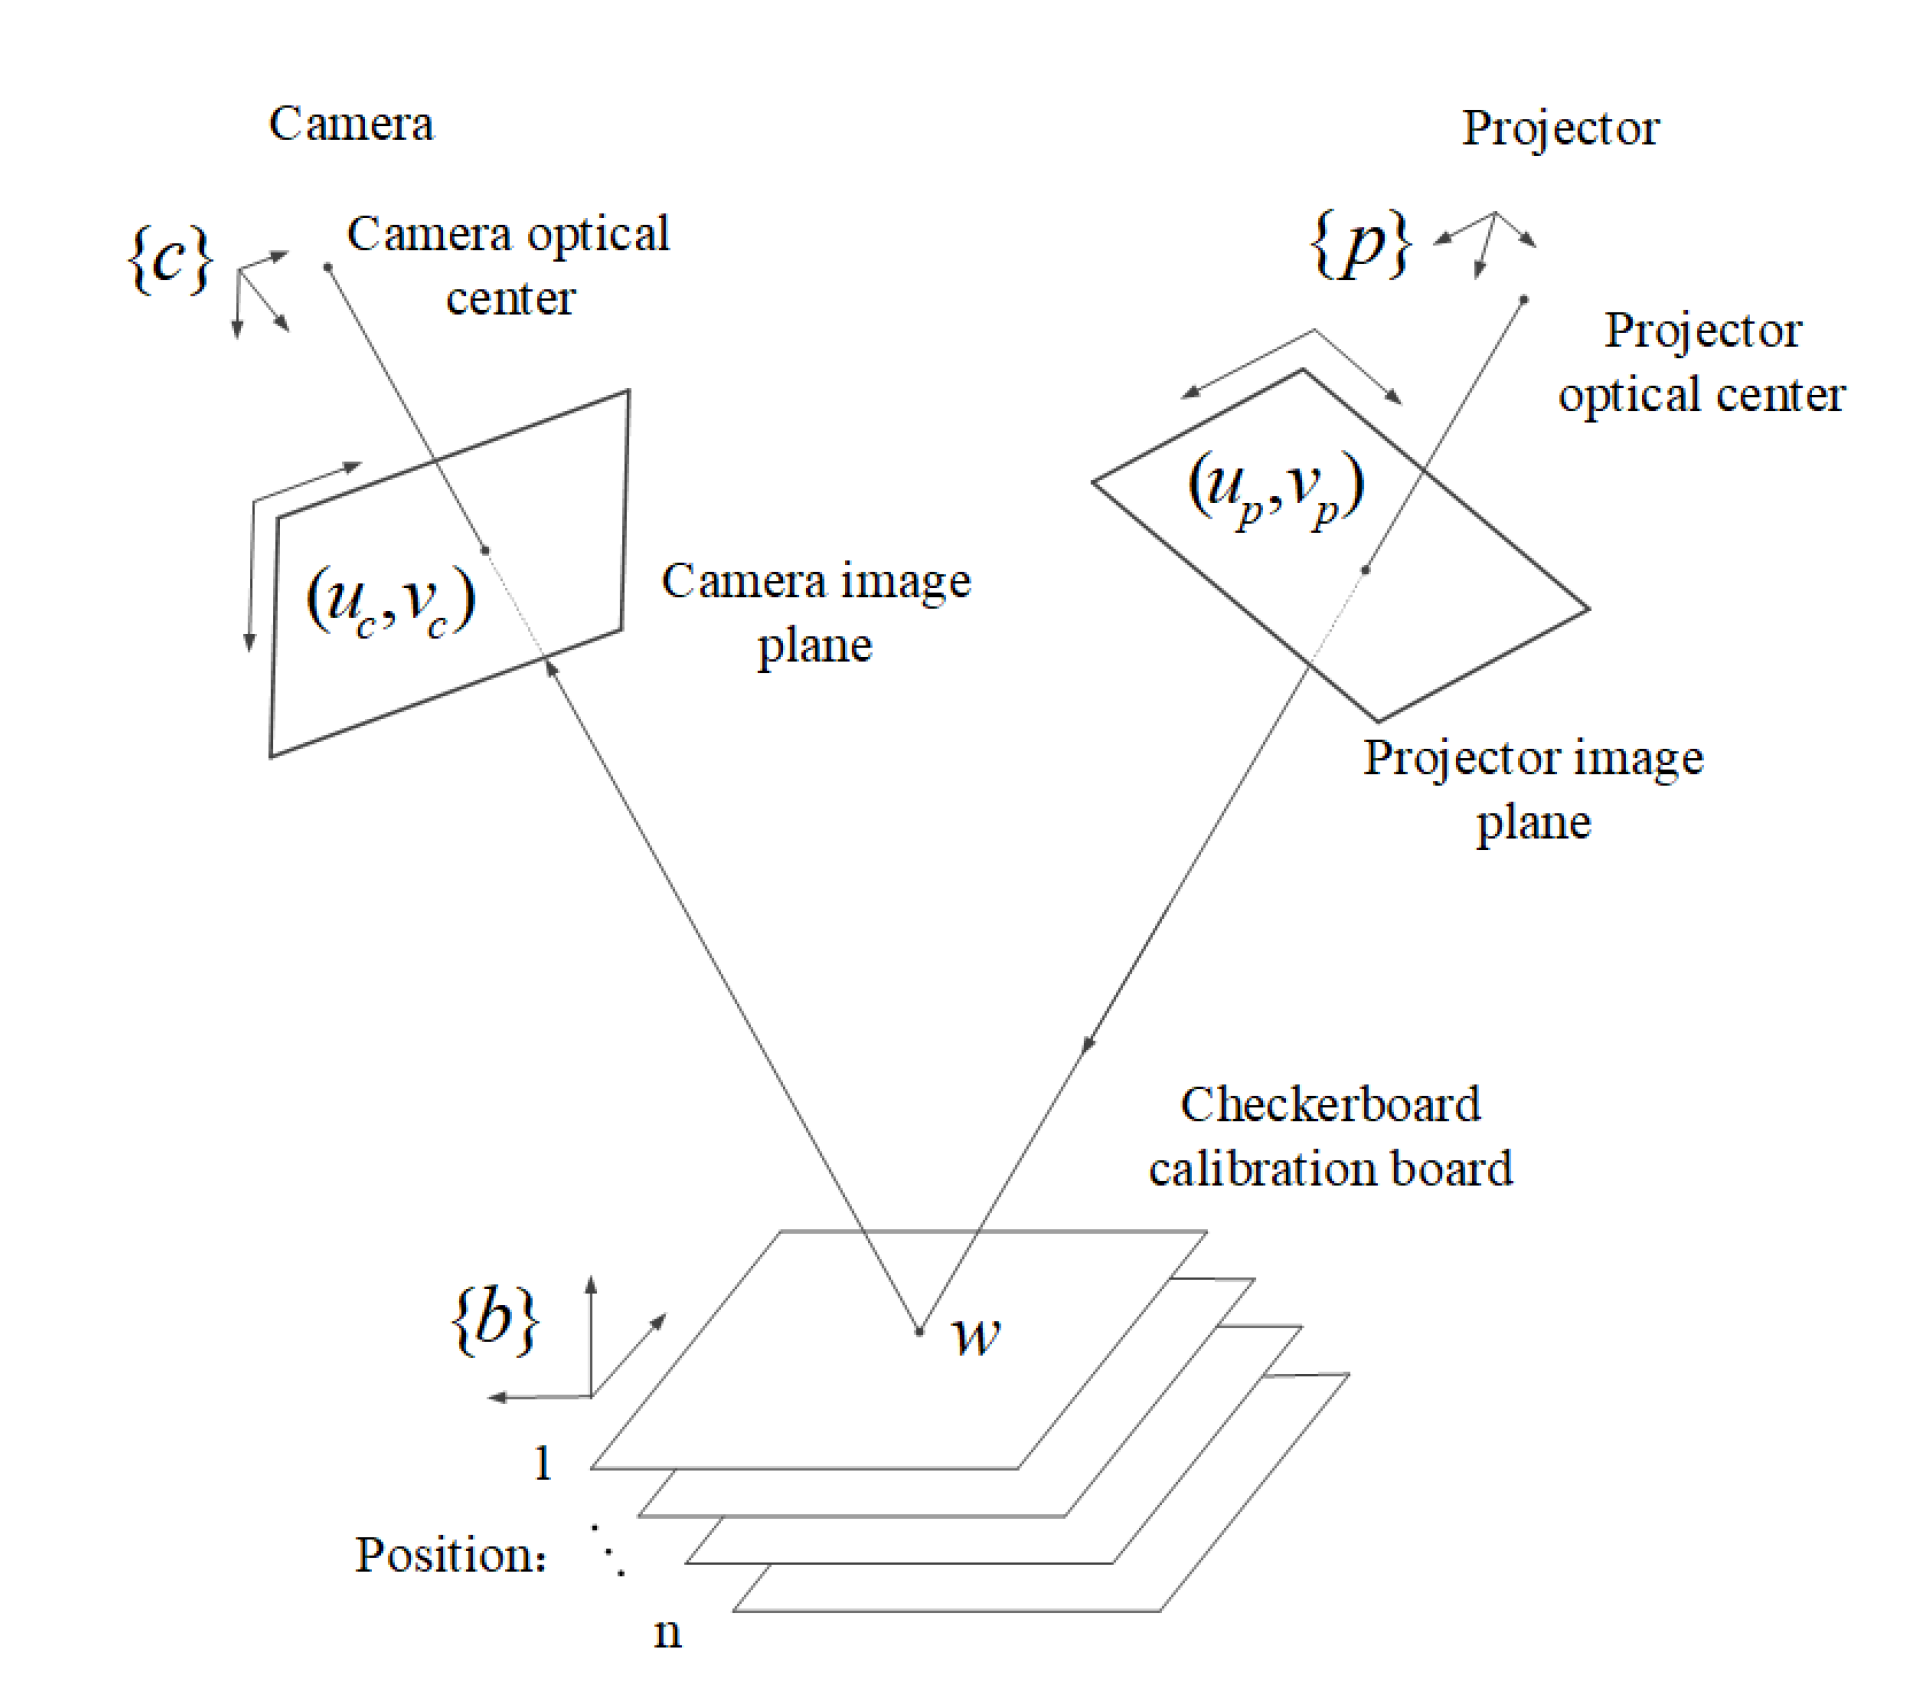
To further acquire the three-dimensional information of the object, calibrating the mapping relationship between the phase
ϕ(x,y) and the coordinates
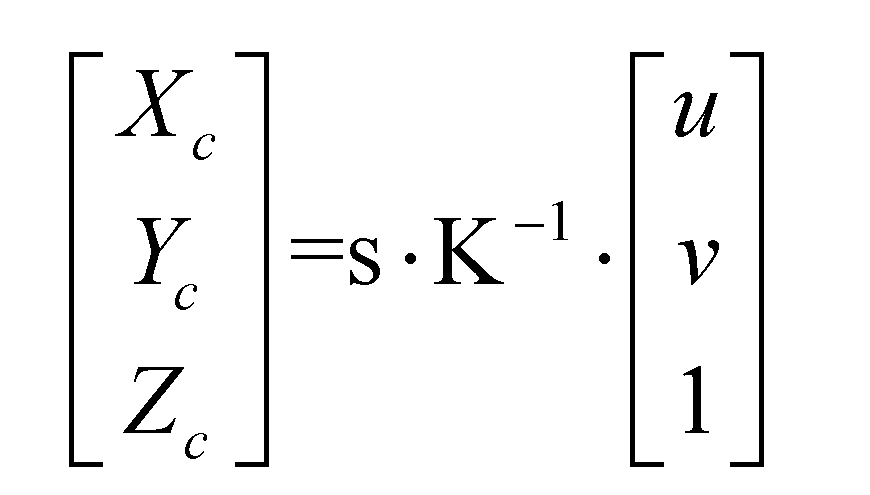
(Xc,Yc,Zc) in the camera coordinate system is essential. In the model shown in
Figure 1, the relationship between the coordinates
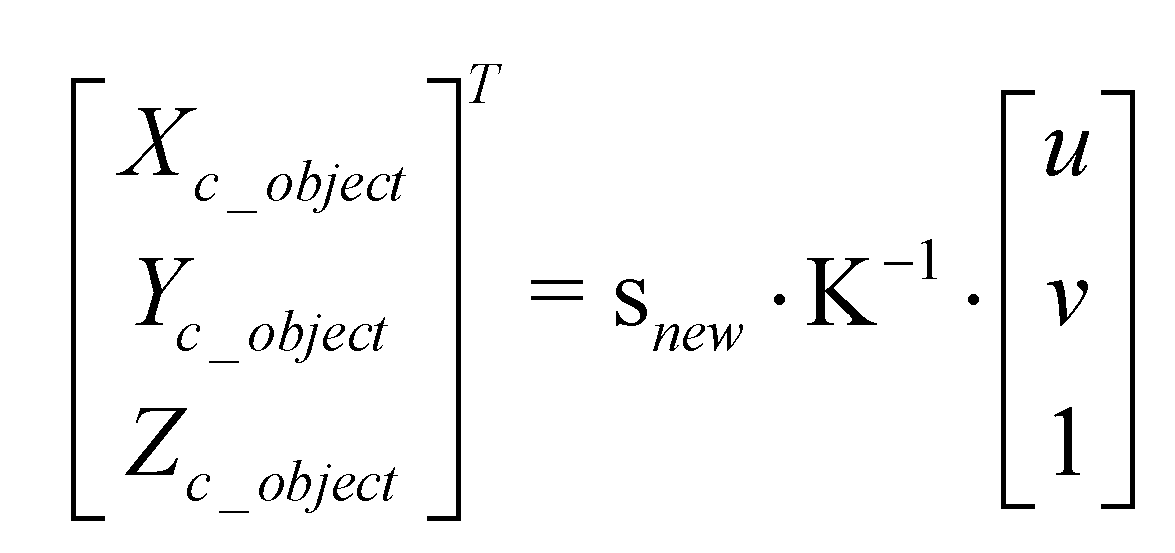
(Xc,Yc,Zc) in the camera coordinate system and the image coordinate system
(u,v) can be expressed by formula (10):
Here,
K represents the camera intrinsic matrix, which can be obtained through camera calibration[
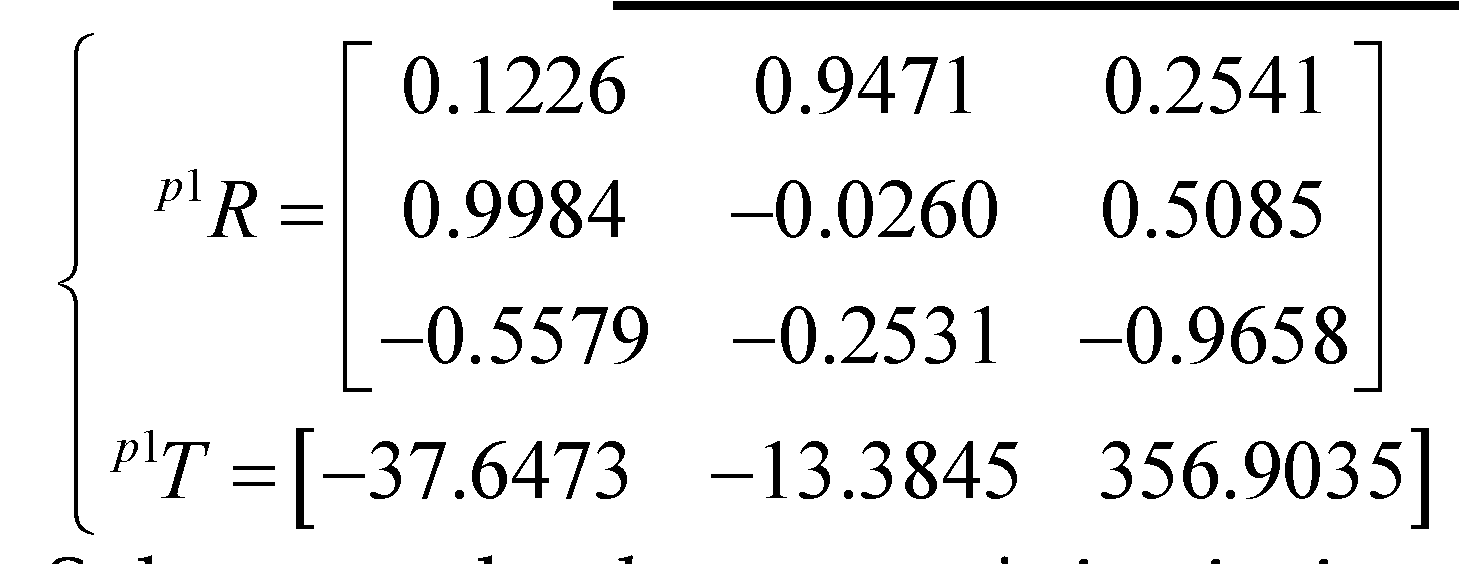
35]. In the camera coordinate system, the plane equation (dot method) that is translated and perpendicular to a point can be expressed by formula (11):
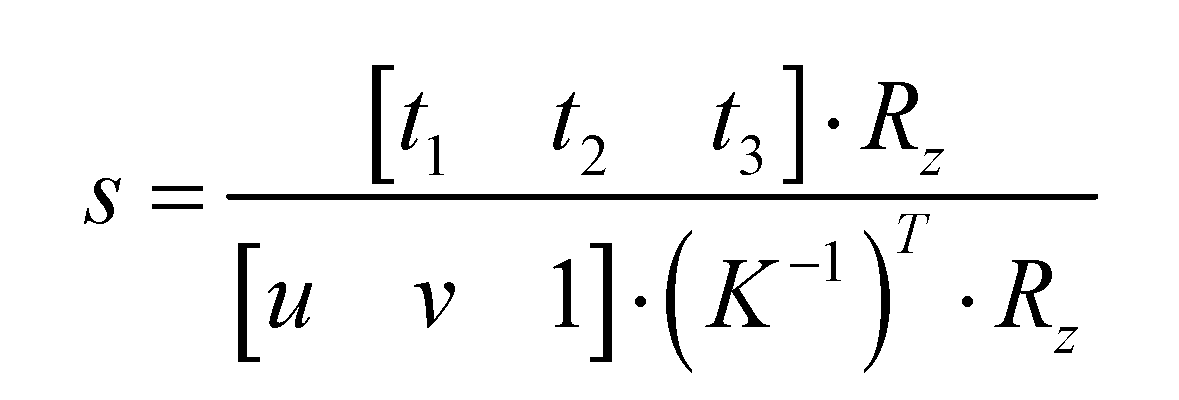
Here,
Rc(3*1) denotes the z-direction component of the rotation matrix. After transformation, the scale factor from the camera coordinate system to the image coordinate system can be expressed by formula (12):
The value of s corresponding to each point (u,v) in the image coordinate system can be calculated using the aforementioned equation.
The absolute phase values corresponding to each point in the image coordinate system
(u,v) can be calculated using the aforementioned method of absolute phase calculation. Based on the above relationship, this paper proposes incorporating camera intrinsic and extrinsic parameters into phase height calibration to achieve high-precision absolute phase height calibration. During the camera calibration process, as the calibration board image is captured, a phase-shifted fringe image is projected onto the surface of the calibration board. The pose of the calibration board is determined by the camera's intrinsic and extrinsic parameters, and the absolute phase value at that position is calculated to calibrate the correspondence between s and phase
ϕ. Upon completing calibration, when the absolute phase information of the object to be measured is inputted, the three-dimensional coordinates of the object can be determined through formula (13):
The calibration process is shown in the
Figure 3.
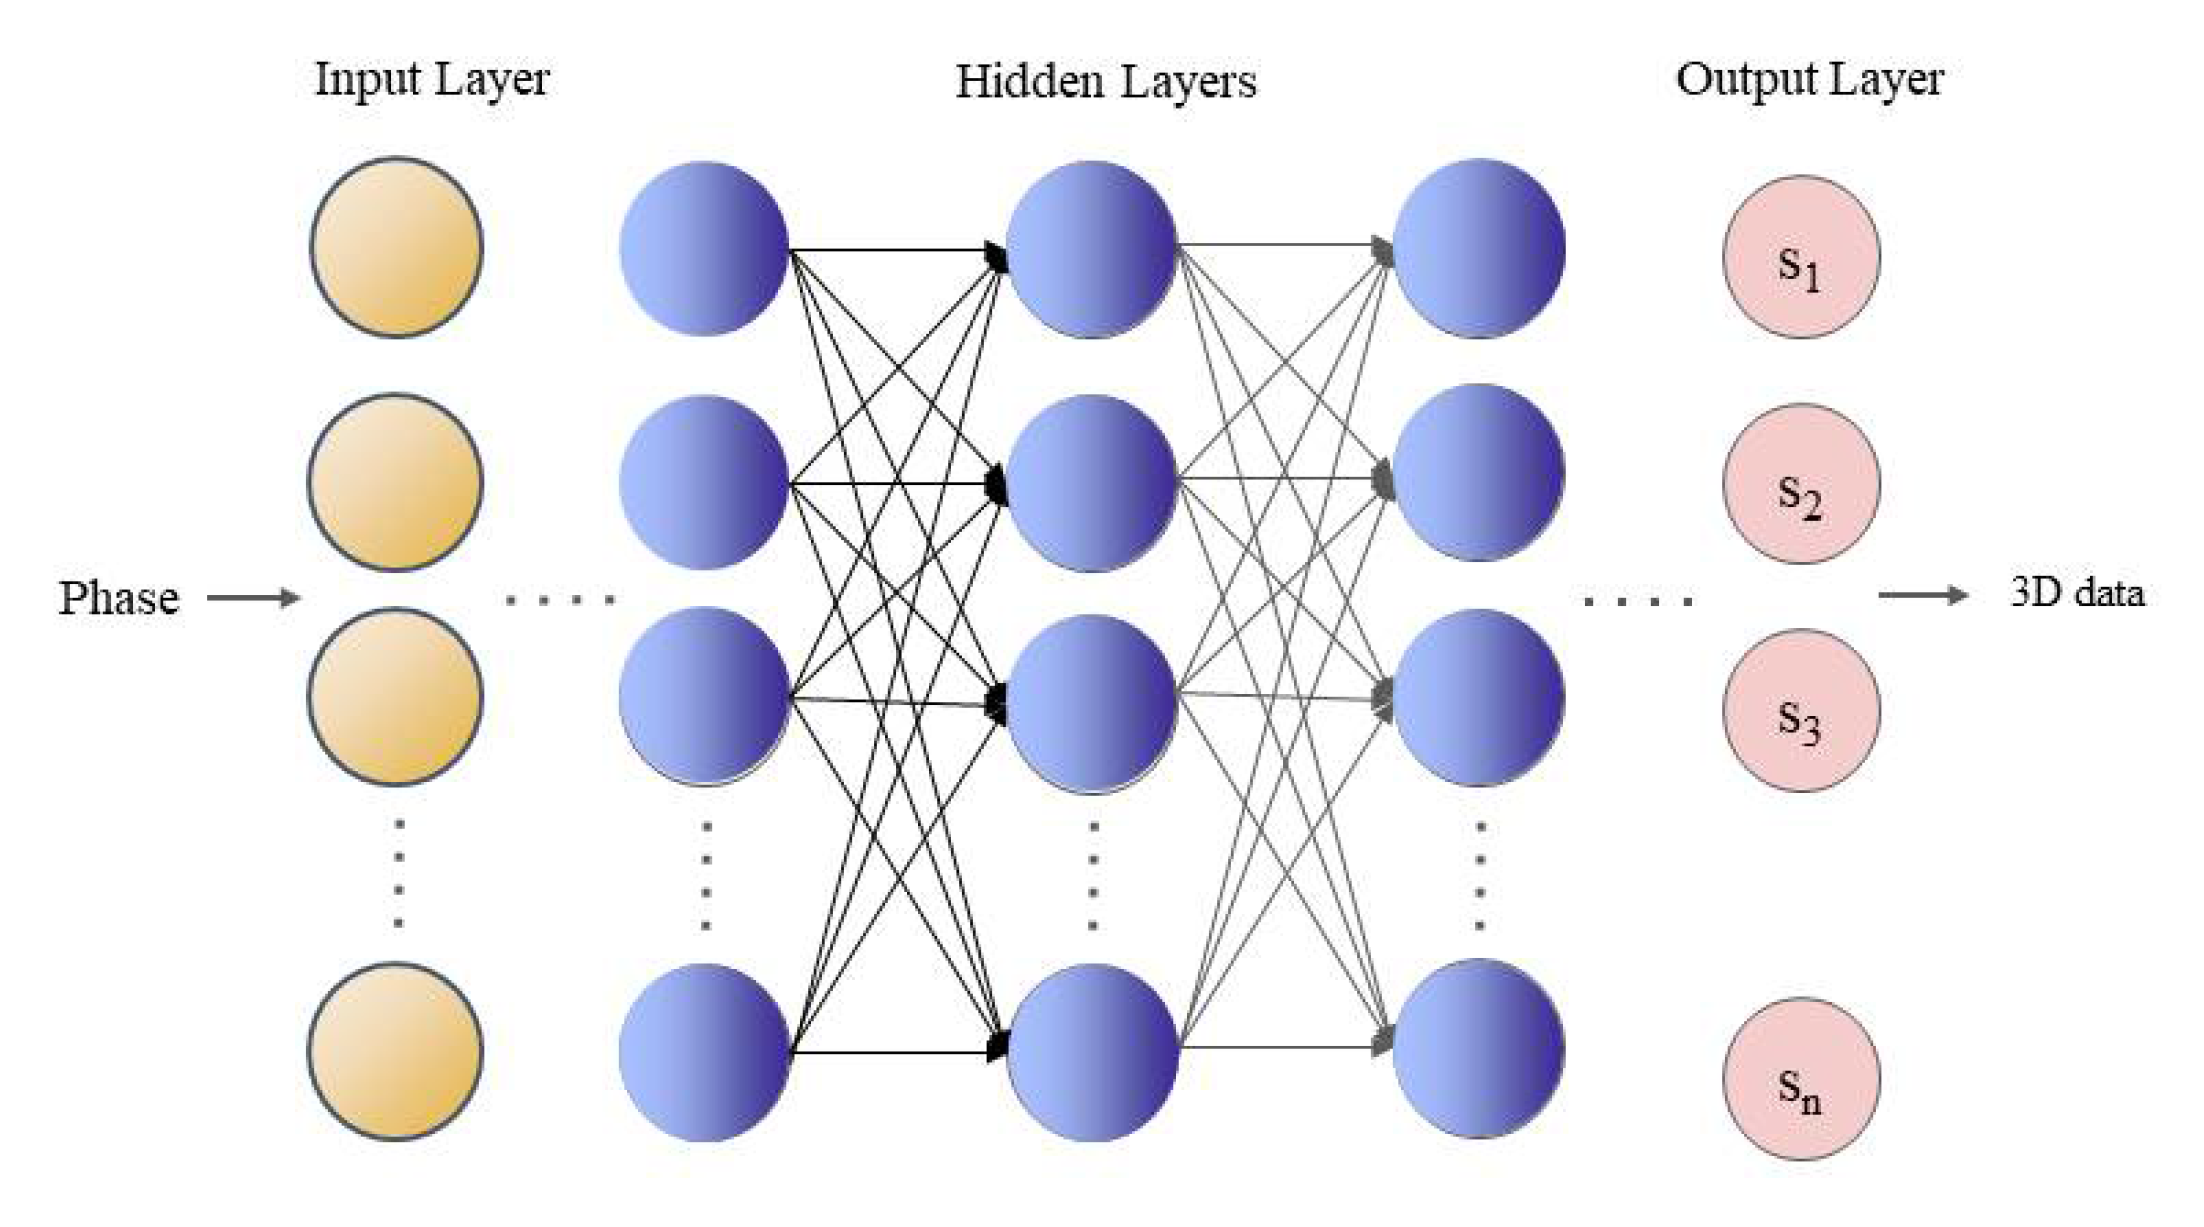
Compared to other commonly used neural network models, the Feedforward Neural Network (FNN) demonstrates superior performance in data mapping, model flexibility, and fault tolerance. Moreover, this model boasts a simple structure, high computational efficiency, and the capability to approximate any continuous function with arbitrary precision. Drawing inspiration from this and based on the aforementioned mathematical relationship, this paper proposes using an FNN to calibrate the correspondence between
s and phase
ϕ. We employ a two-layer feed-forward network with sigmoid hidden neurons and linear-output neurons (fitnet) to establish the relationship between absolute phase and height. The network structure consists of ten hidden layers and one output layer. The proposed FNN structure is illustrated in
Figure 4.
In summary, the overall flowchart of the measurement implementation of the 3D measurement system designed in this article is shown in
Figure 5.
The Materials and Methods should be described with sufficient details to allow others to replicate and build on the published results. Please note that the publication of your manuscript implicates that you must make all materials, data, computer code, and protocols associated with the publication available to readers. Please disclose at the submission stage any restrictions on the availability of materials or information. New methods and protocols should be described in detail while well-established methods can be briefly described and appropriately cited.
Figure 1.
Structure of structured light 3D reconstruction system.
Figure 1.
Structure of structured light 3D reconstruction system.
Figure 2.
The proposed DAE network architecture diagram.
Figure 2.
The proposed DAE network architecture diagram.
Figure 3.
Schematic diagram of phase and height calibration process.
Figure 3.
Schematic diagram of phase and height calibration process.
Figure 4.
The proposed FNN model structure diagram.
Figure 4.
The proposed FNN model structure diagram.
Figure 5.
Figure 5. System implementation measurement general principle diagram
Figure 5.
Figure 5. System implementation measurement general principle diagram
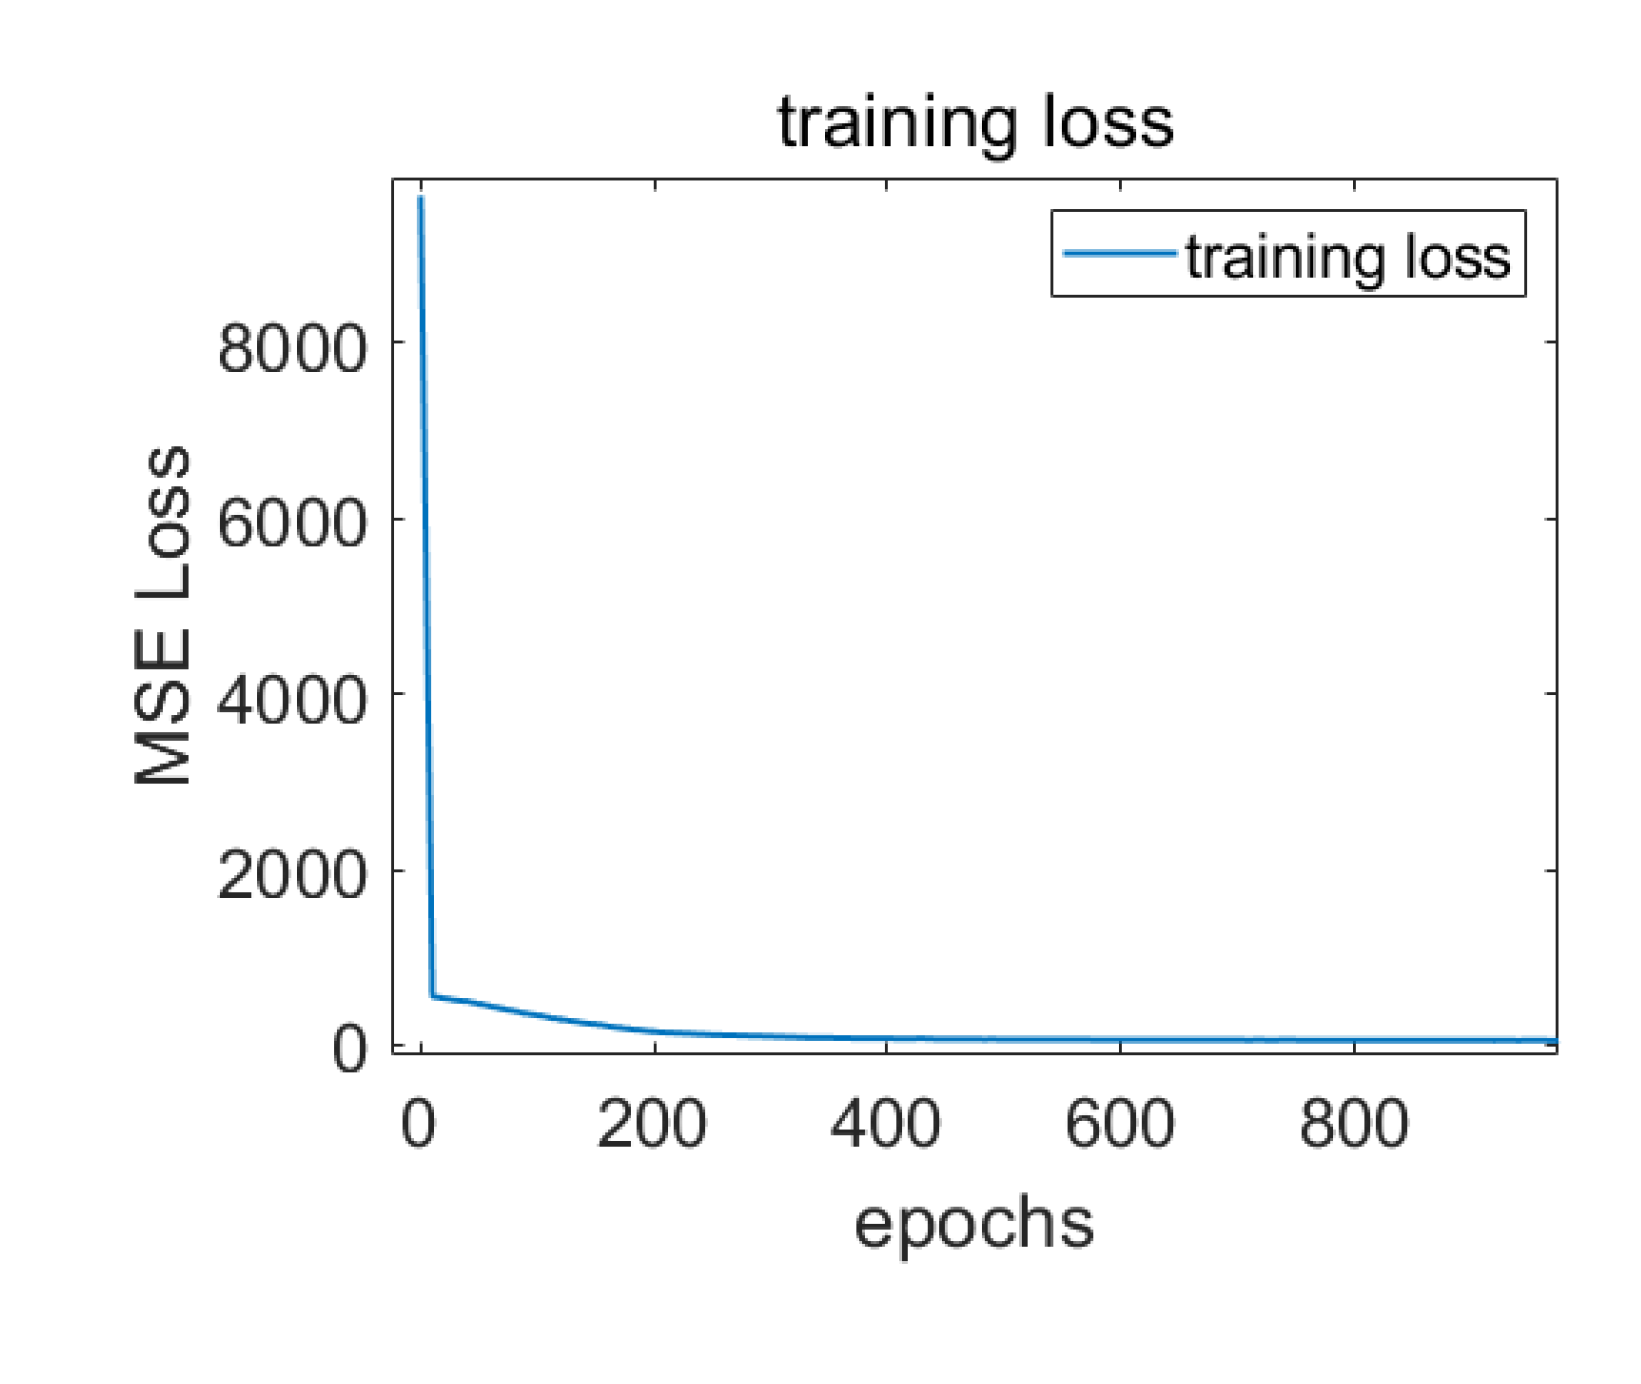
Figure 6.
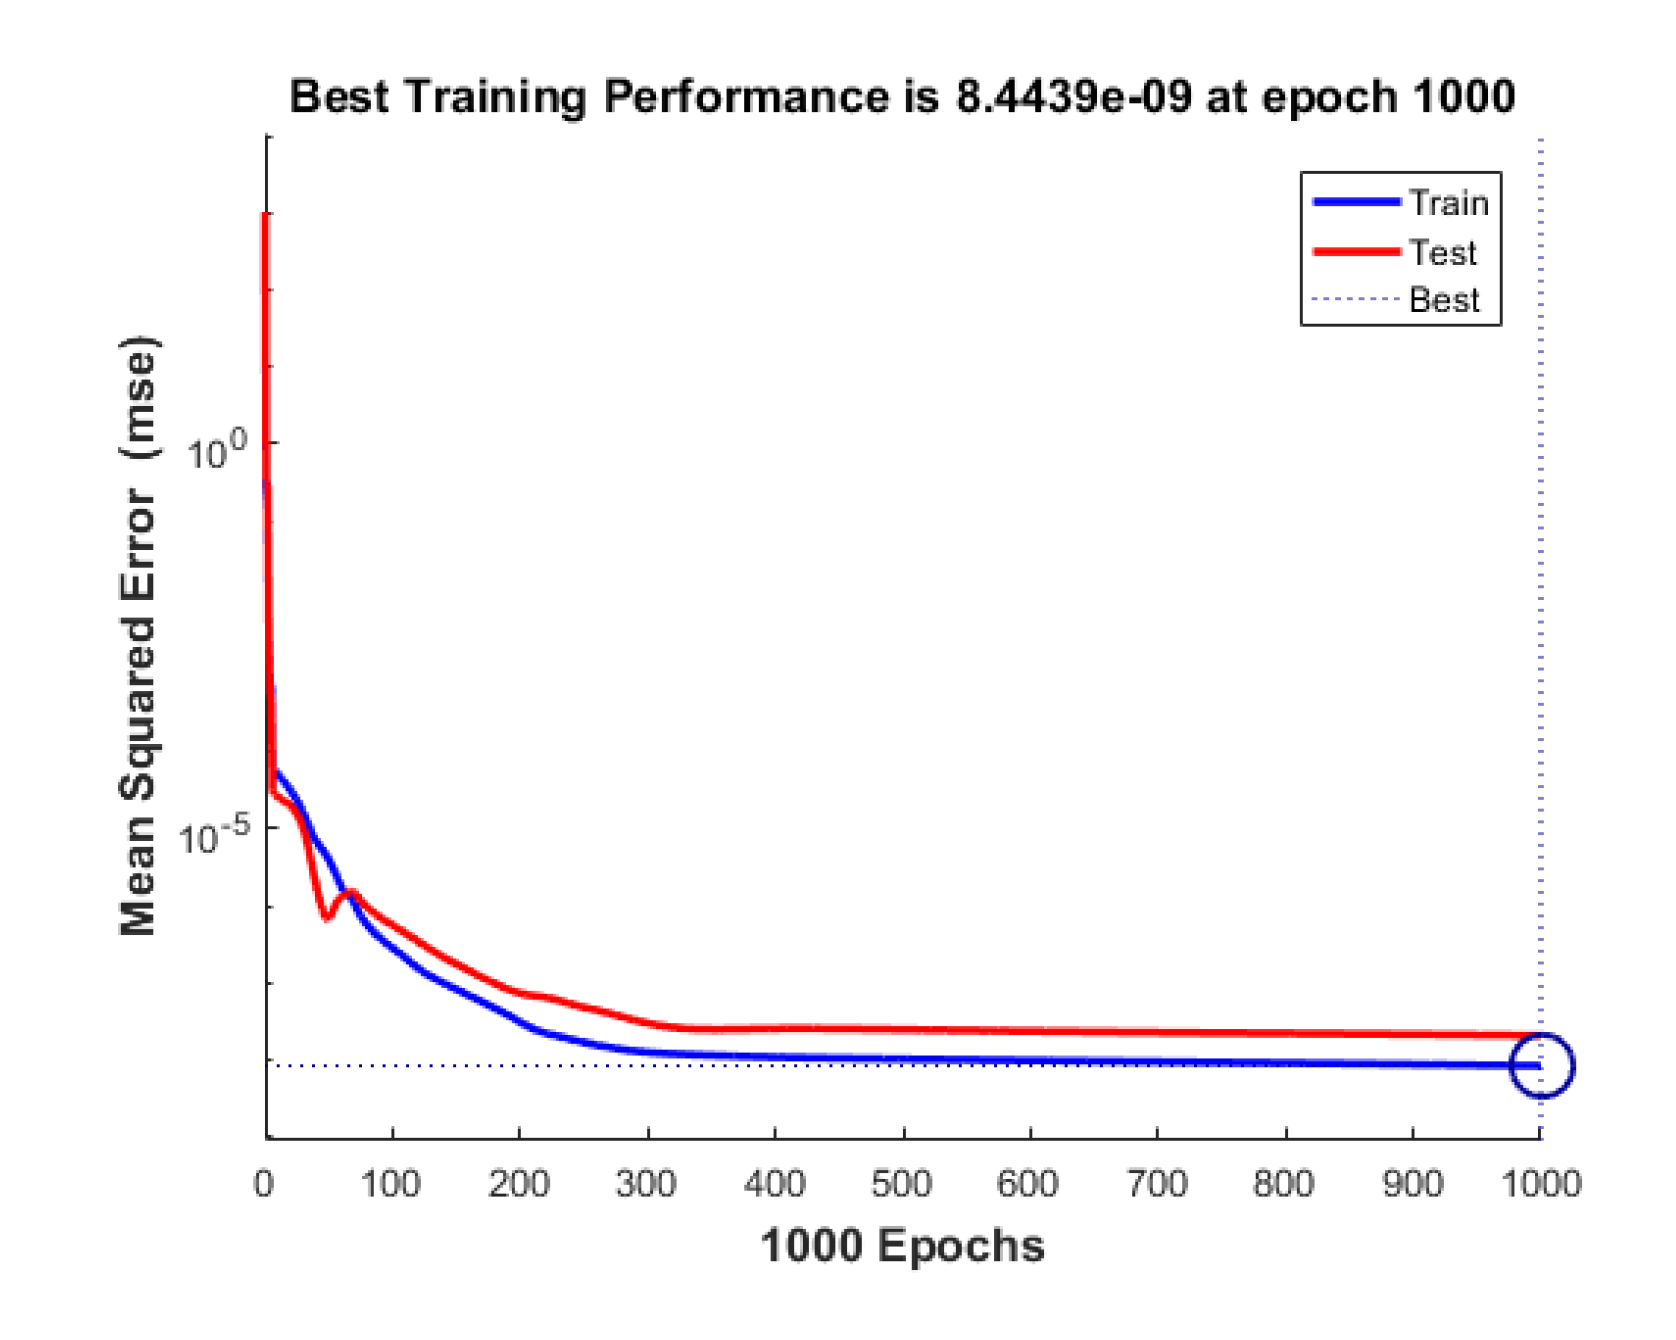
The relationship between the loss values of training datasets and the number of training iterations.
Figure 6.
The relationship between the loss values of training datasets and the number of training iterations.
Figure 7.
Figure 7. The relationship between the number of iterations and MSE
Figure 7.
Figure 7. The relationship between the number of iterations and MSE
Figure 8.
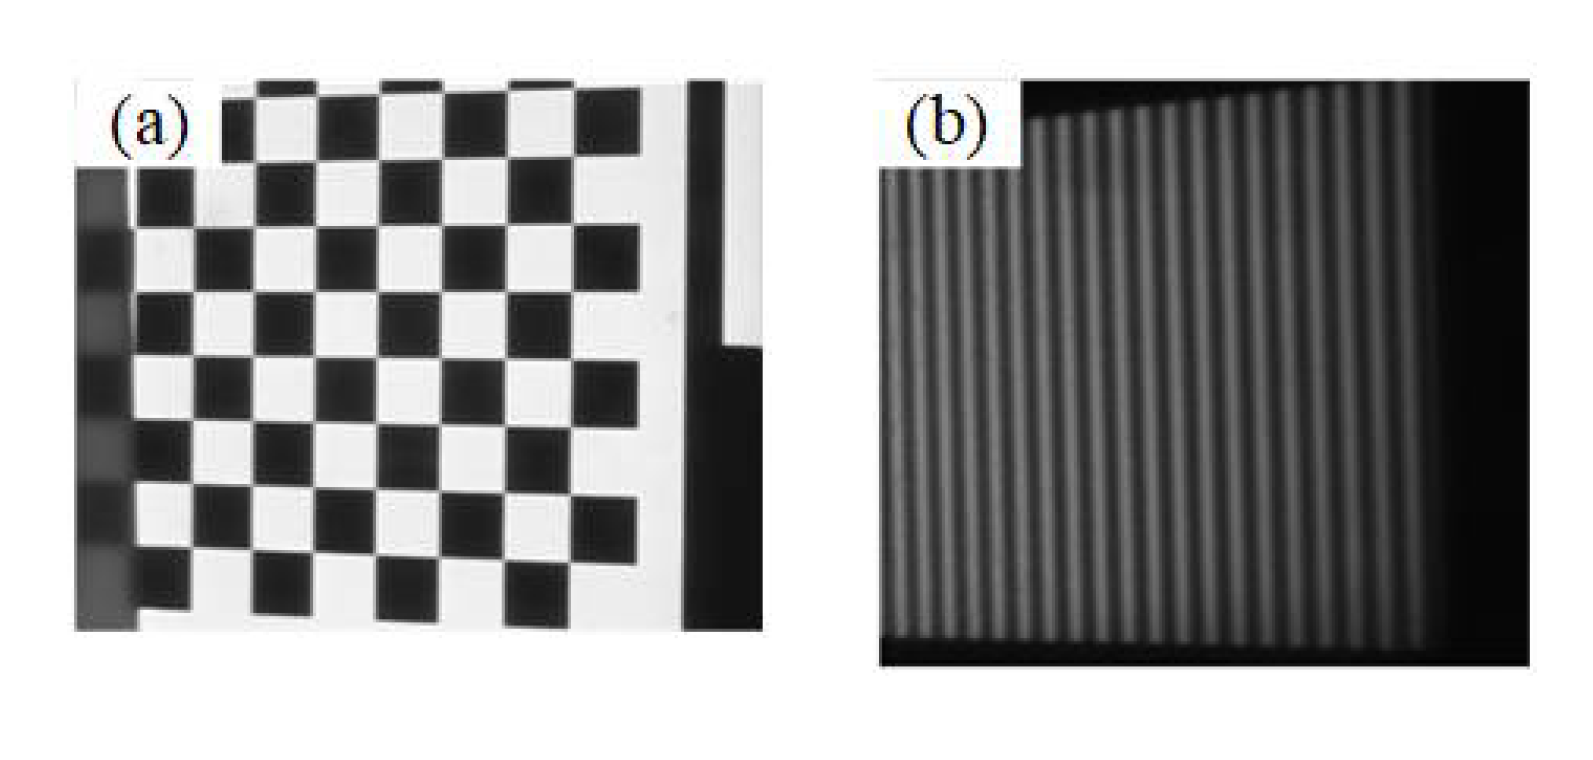
Captured checkerboard camera calibration image and phase-shifting image at the corresponding position.(a)Checkerboard image taken before placing the plane; (b)Phase shift fringe pattern taken after placing the plane.
Figure 8.
Captured checkerboard camera calibration image and phase-shifting image at the corresponding position.(a)Checkerboard image taken before placing the plane; (b)Phase shift fringe pattern taken after placing the plane.
Figure 9.
The changes in accuracy for both the training and testing sets.
Figure 9.
The changes in accuracy for both the training and testing sets.
Figure 10.
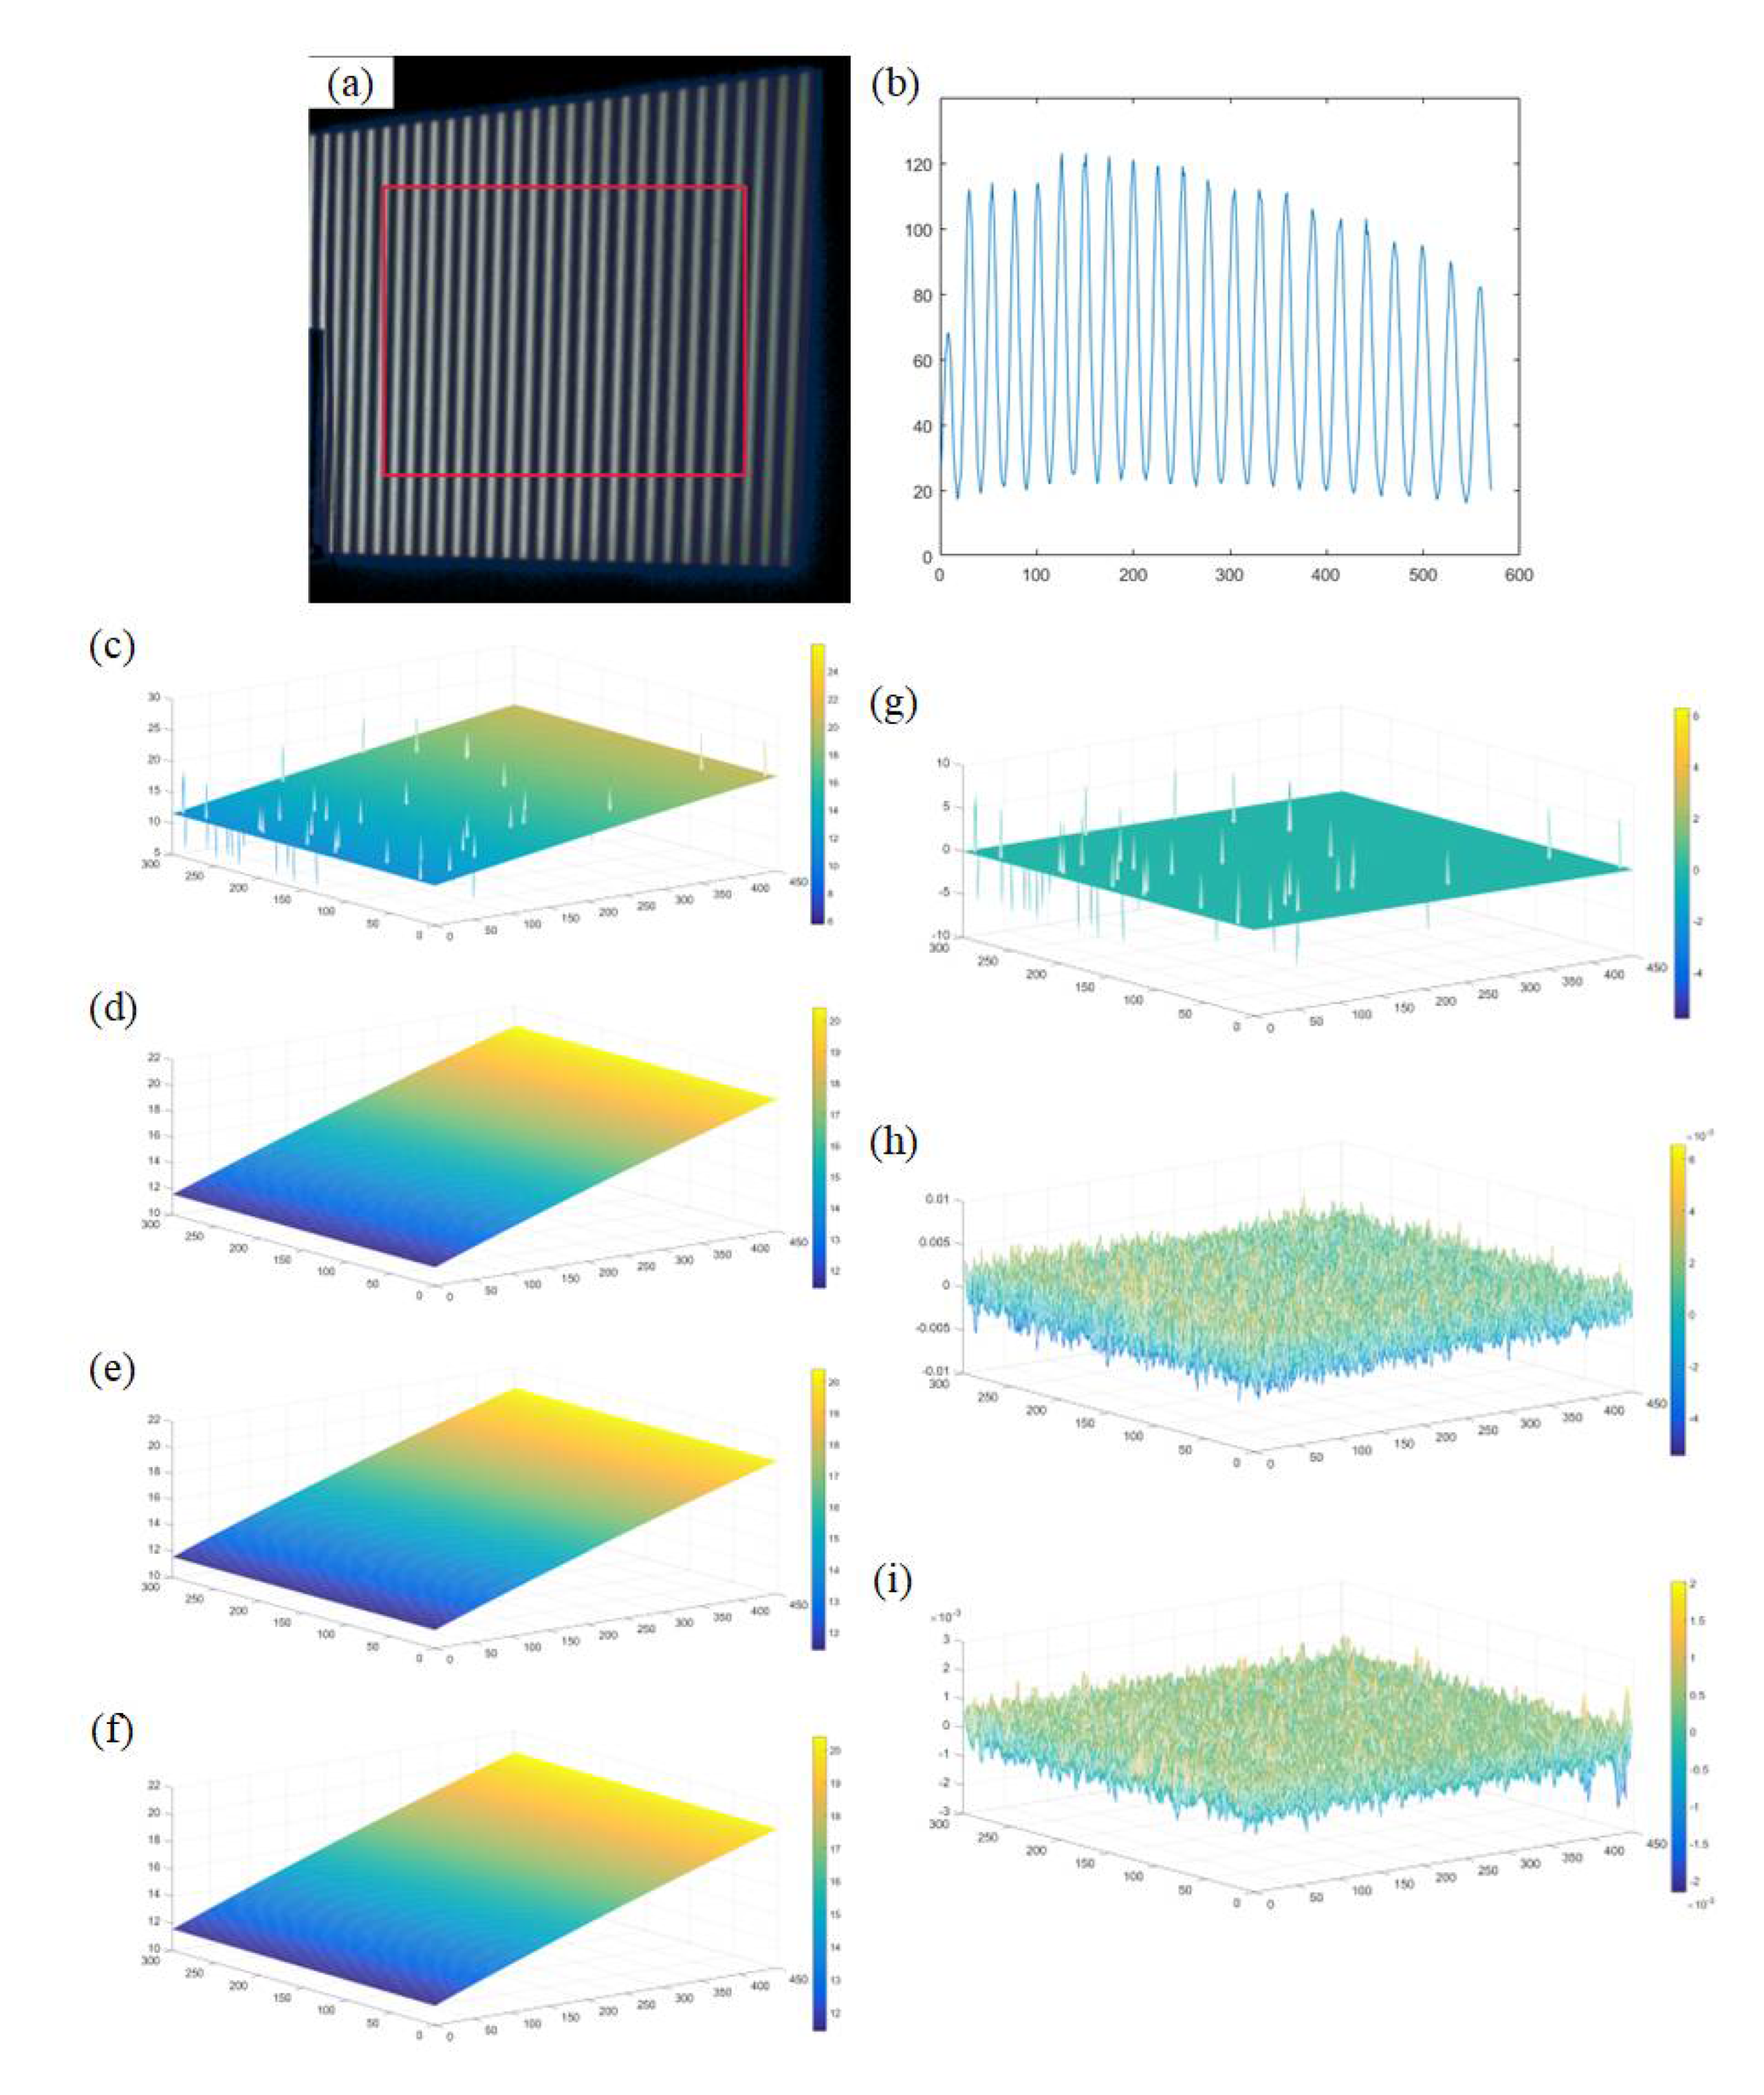
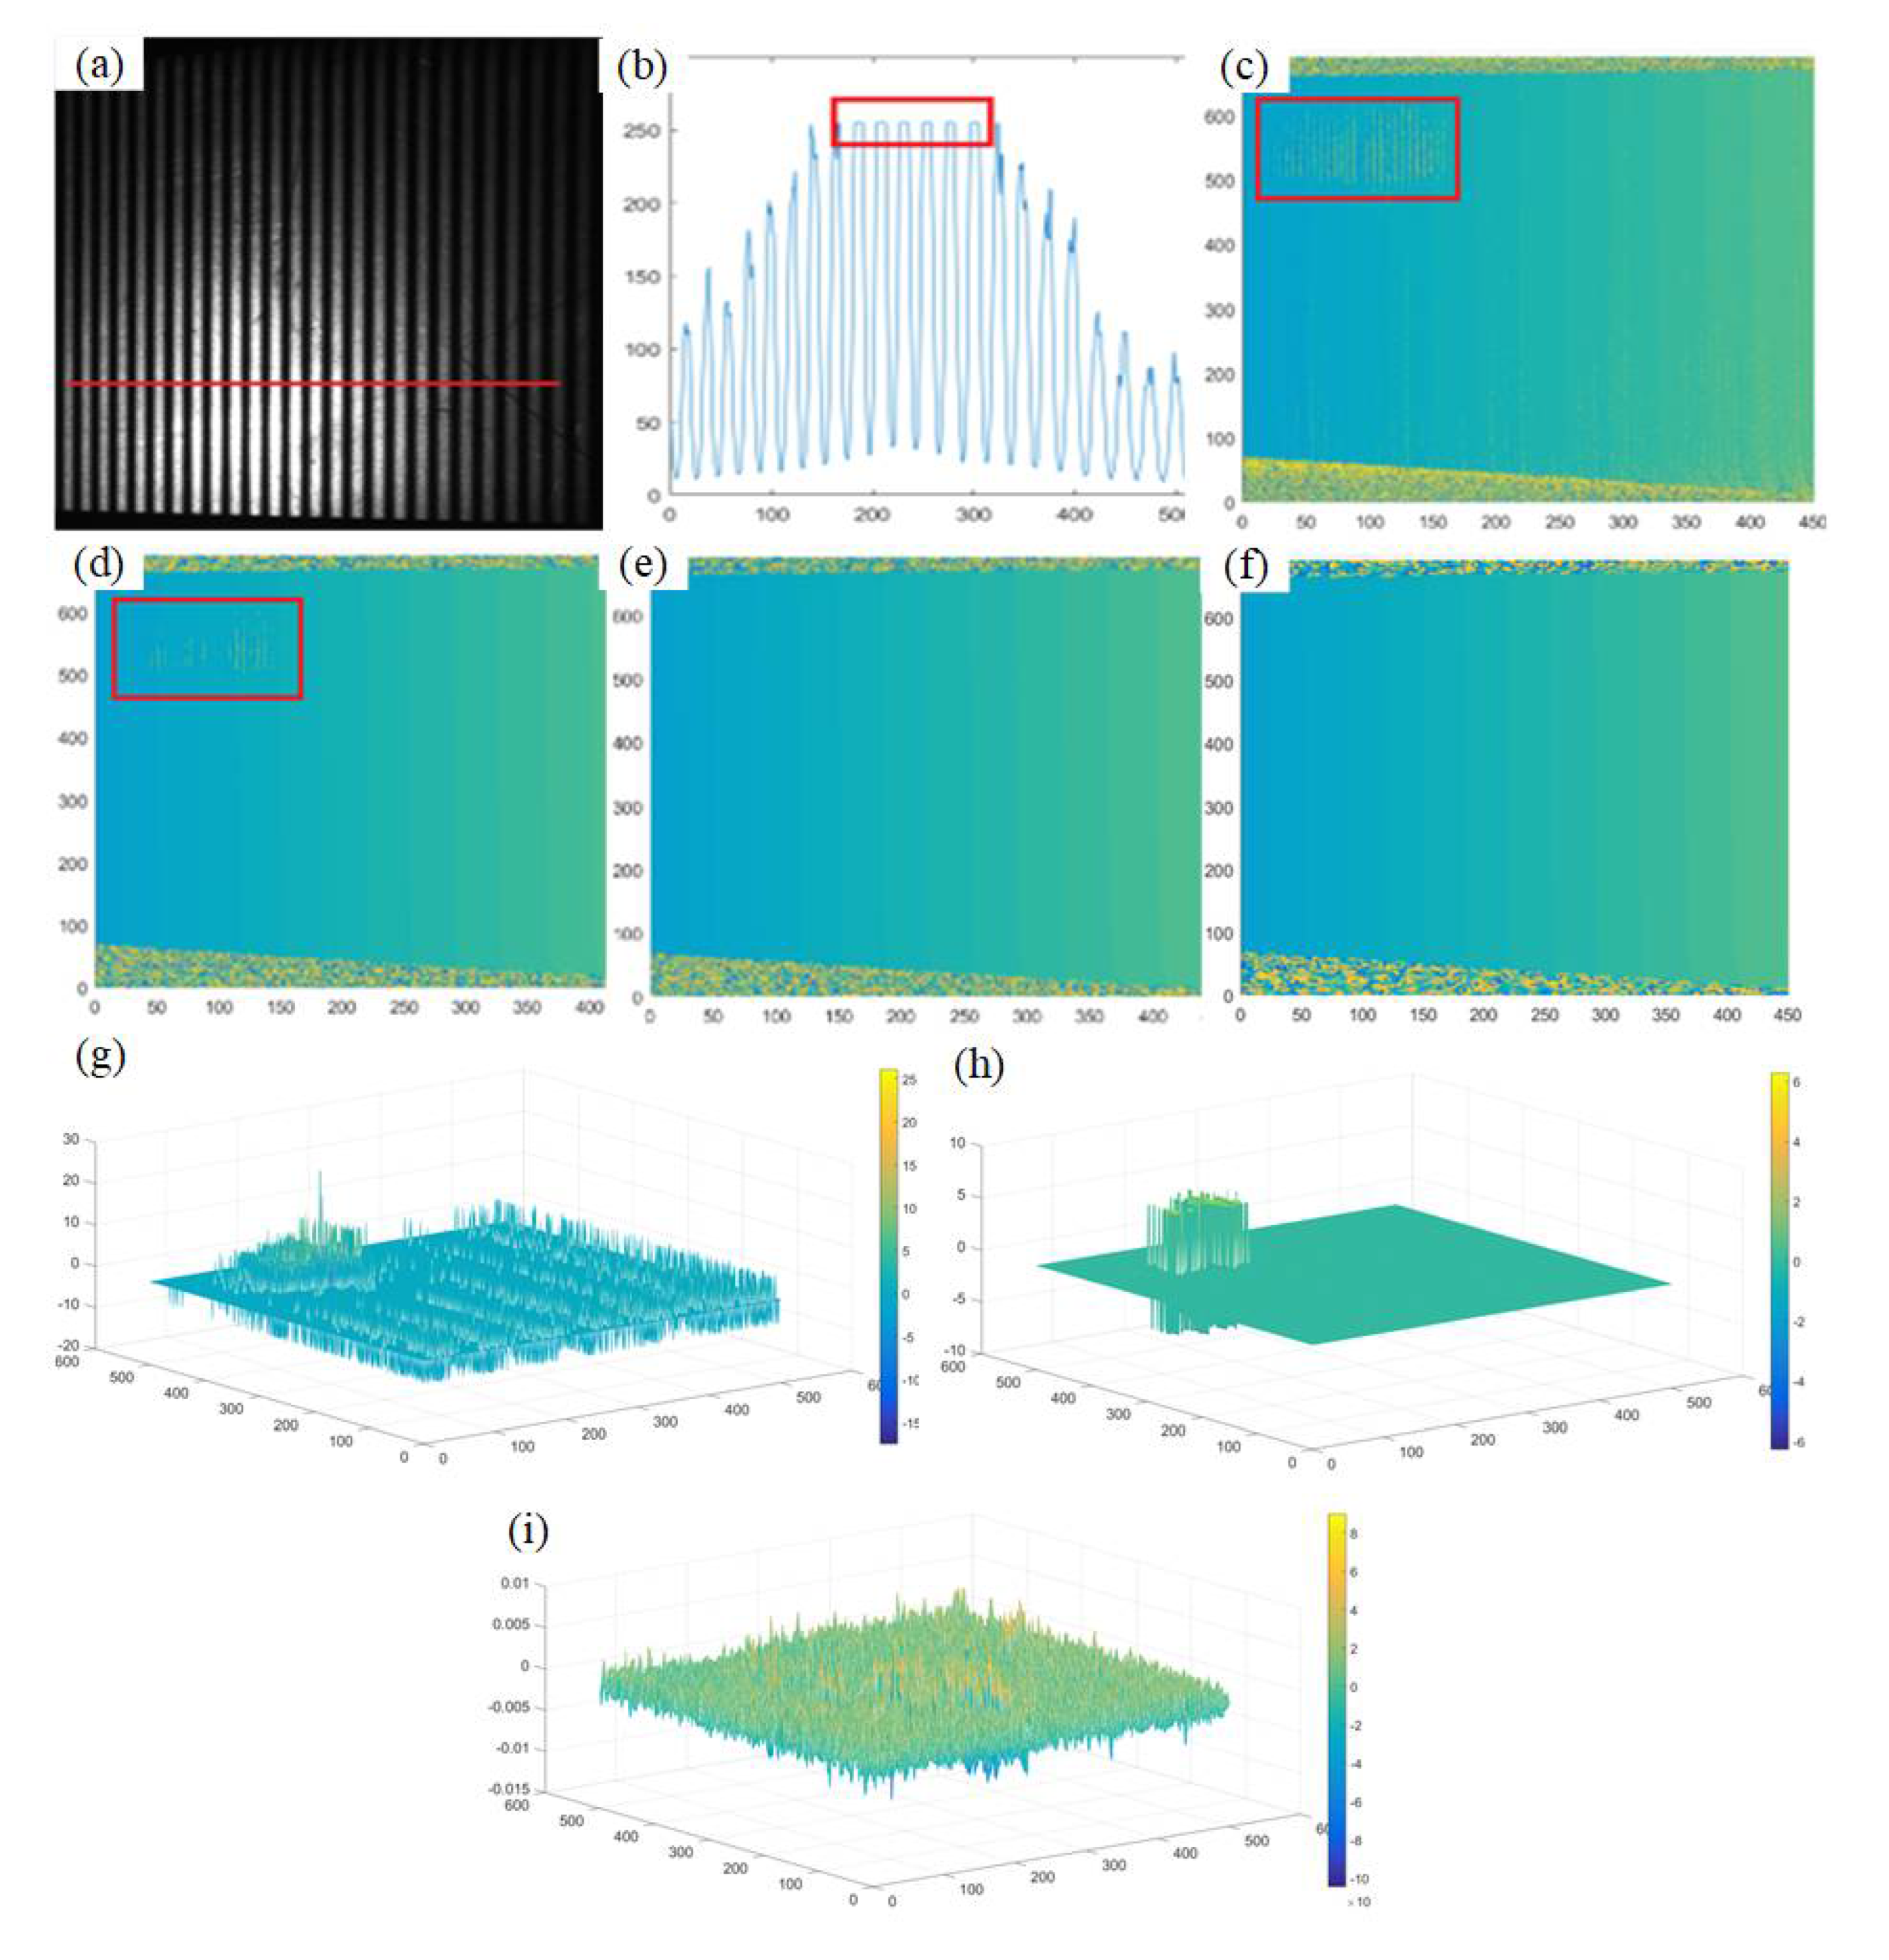
the high-precision diffuse reflective ceramic plate’s absolute phase calculated by different methods and their absolute phase difference compared to the 12 step phase-shifting method. (a) Phase shift image captured; (b) Phase shifted stripe image of a certain row; (c) Absolute phase without calibration by using 3-step phase shift method; (d) Absolute phase calculated after Gaussian filtering; (e) Absolute phase calculated after DAE; (f) Absolute phase calculated by using 12-step phase shift method; (g) Absolute phase difference calculated using 3-step and 12-step phase-shifting methods; (h) Absolute phase difference calculated using gaussian filtering and 12-step phase-shifting methods; (i) Absolute phase difference calculated using DAE and 12-step phase-shifting methods;.
Figure 11.
the highly reflective metal aluminum plane’s absolute phase calculated by different methods and their absolute phase difference compared to the 12 step phase-shifting method. (a) Phase shift image captured; (b) Phase shift stripe pattern at high reflective red lines; (c) Absolute phase without calibration by using 3-step phase shift method; (d) Absolute phase calculated after Gaussian filtering; (e) Absolute phase calculated after DAE; (f) Absolute phase calculated by using 12-step phase shift method;(g) Absolute phase difference calculated using 3-step and 12-step phase-shifting methods; (h) Absolute phase difference calculated using gaussian filtering and 12-step phase-shifting methods; (i) Absolute phase difference calculated using DAE and 12-step phase-shifting methods;.
Figure 12.
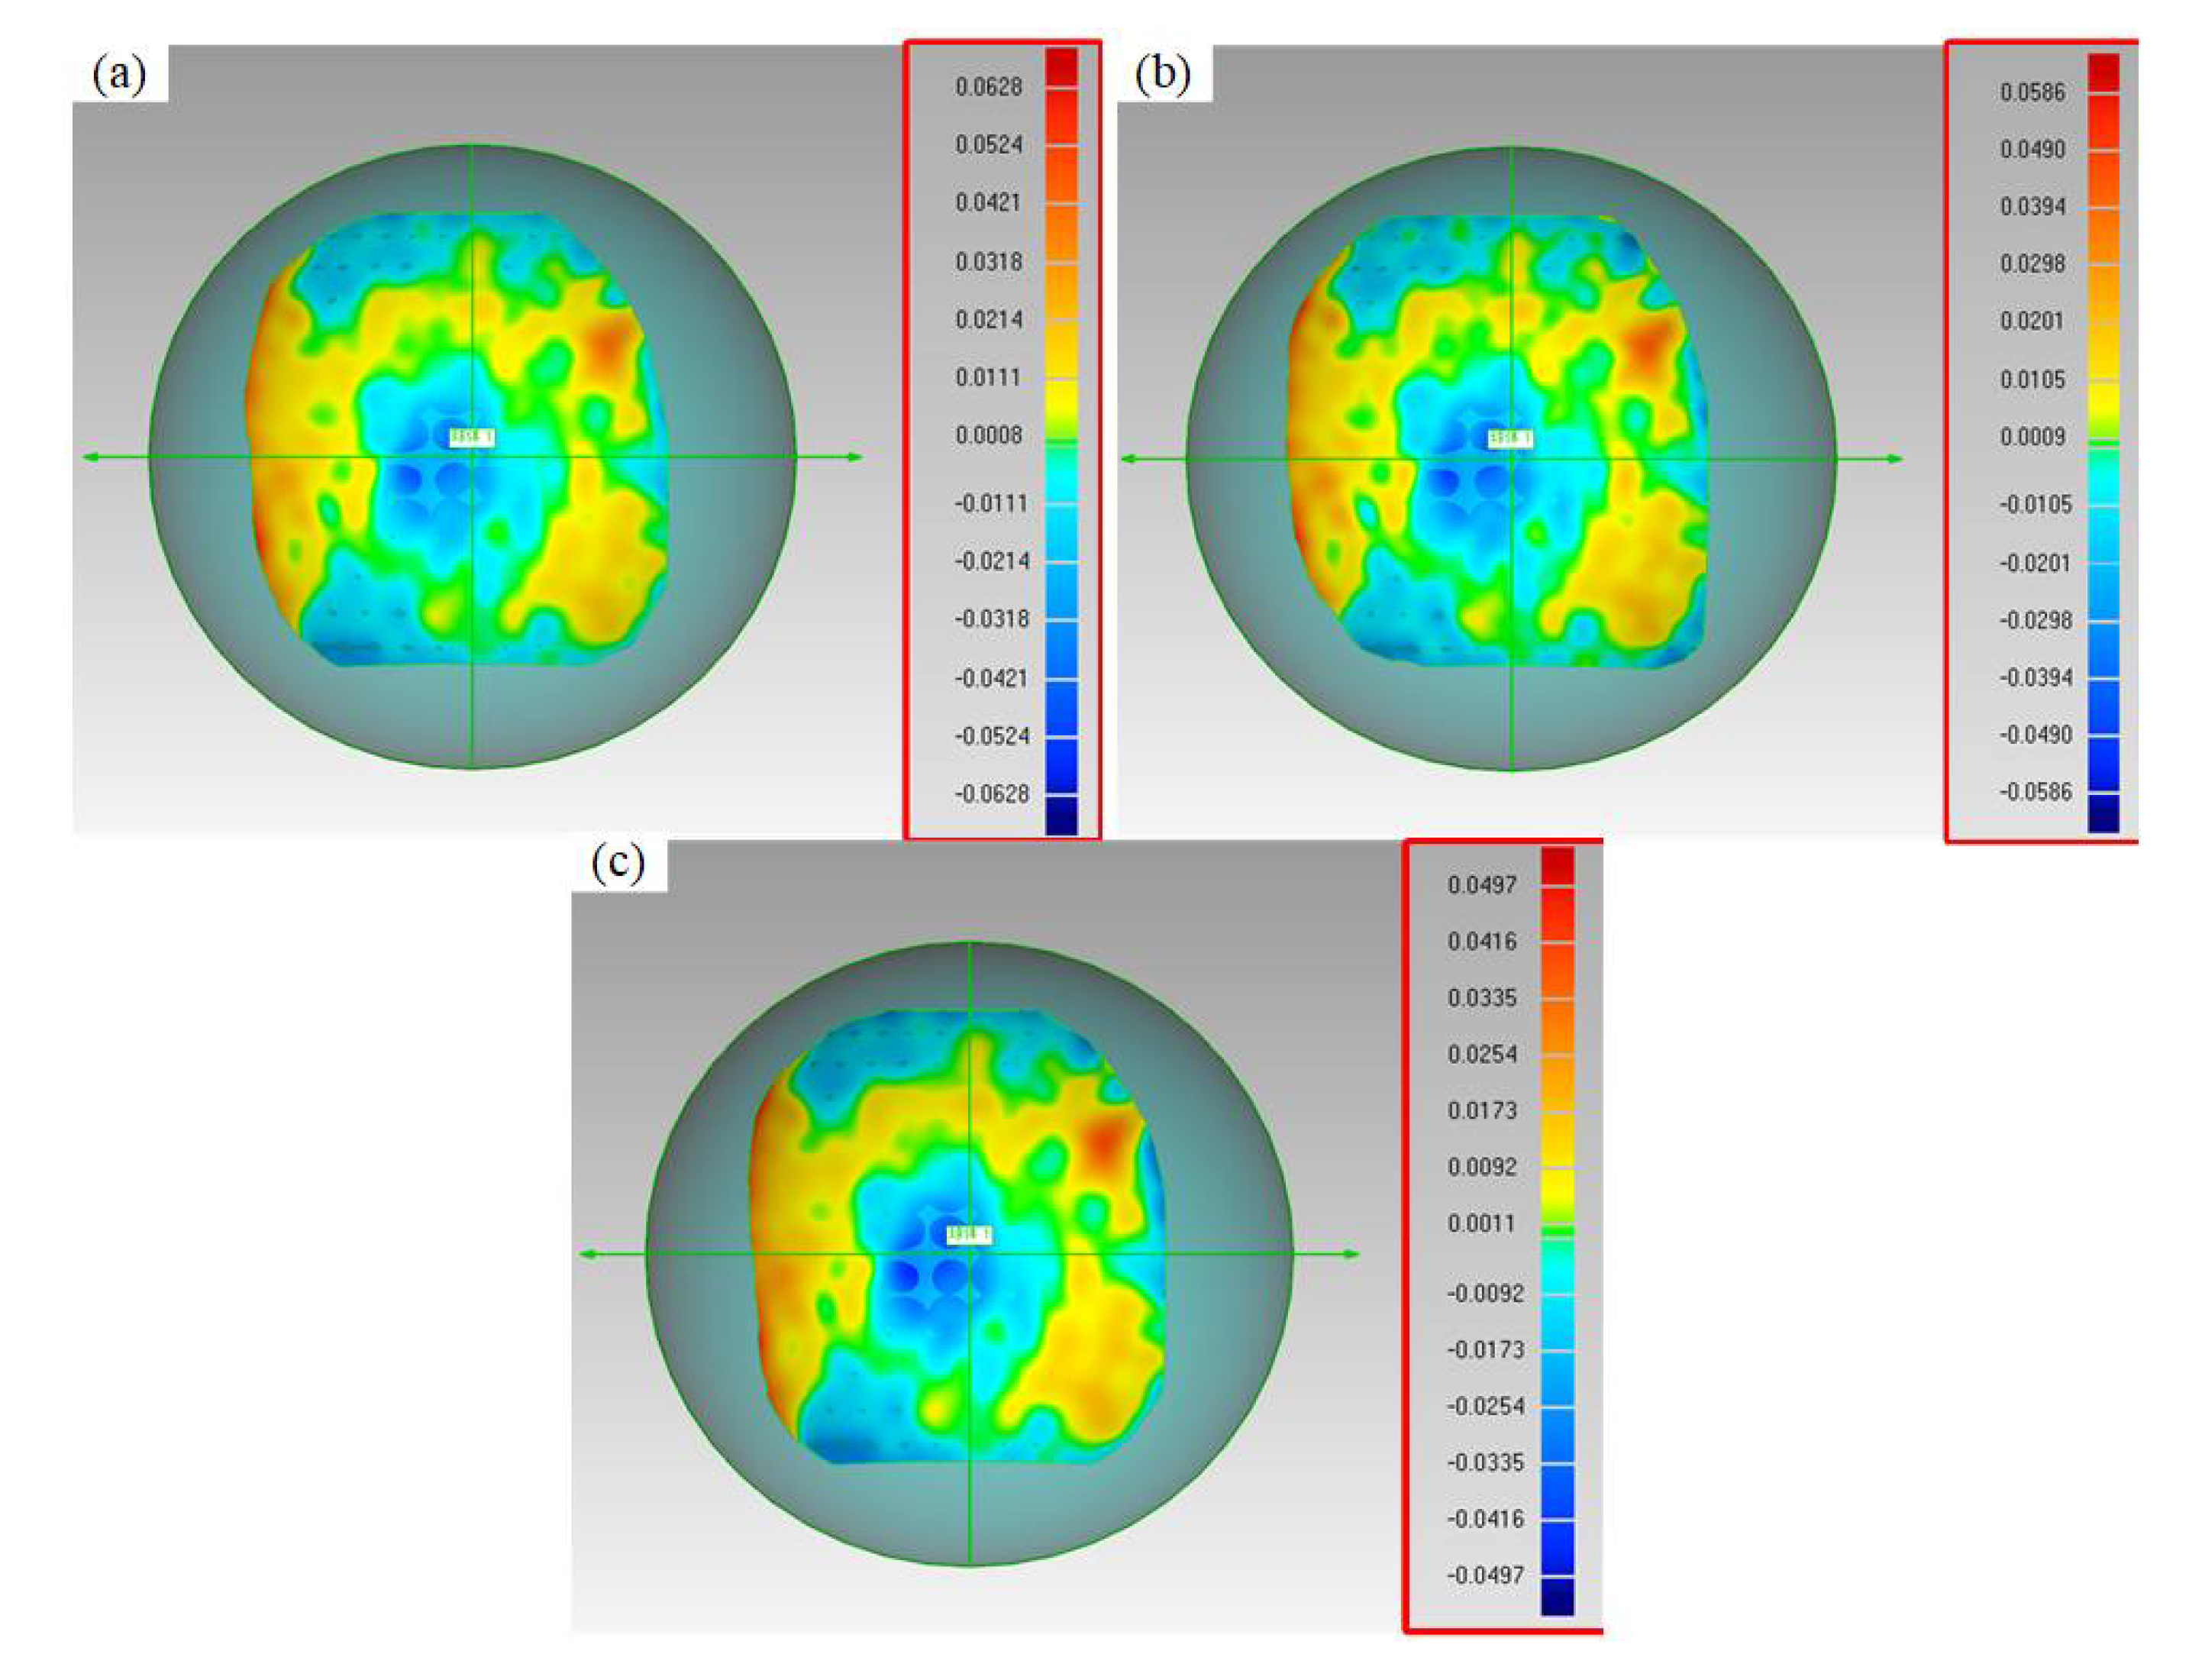
The fitting of standard spherical point clouds calculated using different calibration methods. (a) Point cloud determined by the inverse linear calibration method; (b) Point cloud determined by the polynomial fitting calibration method; (c) Point cloud determined by the FNN fitting calibration method;.
Figure 13.
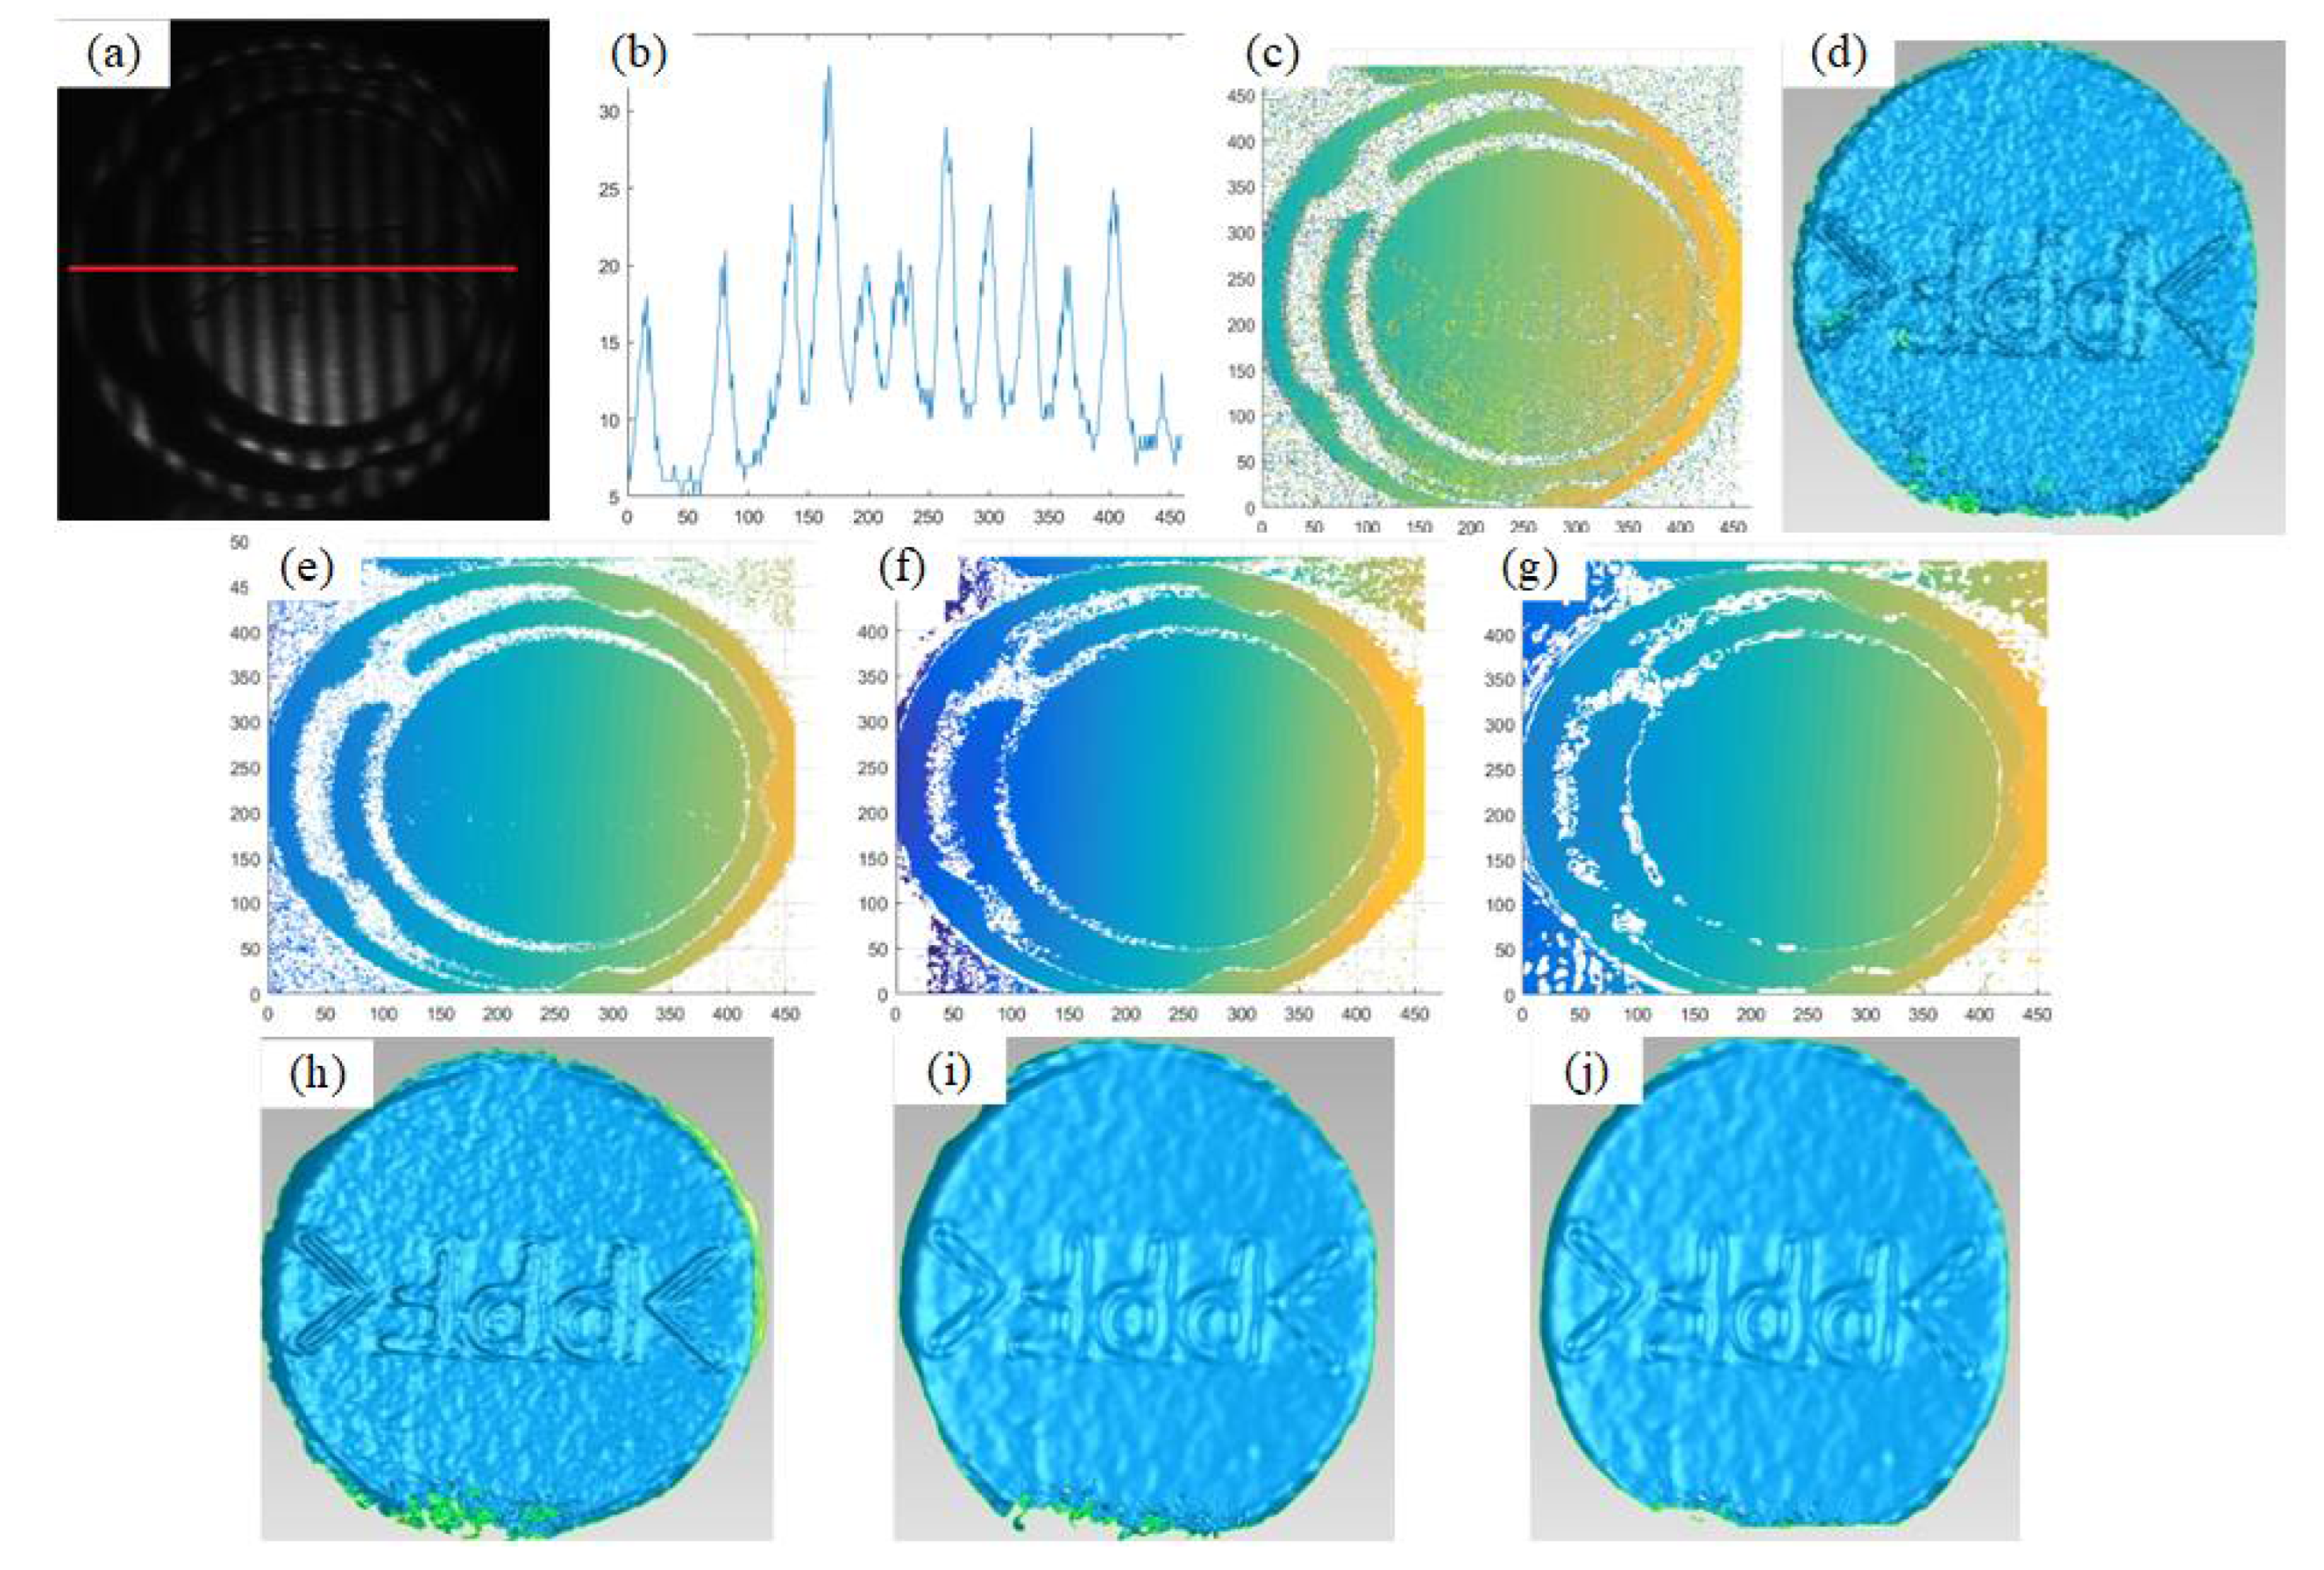
The reconstruction performance of black matte plastic cover. (a)Phase shift image captured; (b) Phase shift stripe pattern at low reflective red lines; (c) Absolute phase without calibration by using 3-step phase shift method; (d) Point cloud fitting result calculated using 3-step phase shift method;(e) Absolute phase calculated after Gaussian filtering; (f) Absolute phase calculated after DAE; (g) Absolute phase calculated by using 12-step phase shift method; (h) Point cloud fitting calculated using gaussian filtering; (i) Point cloud fitting result calculated using DAE; (j) Point cloud fitting result calculated using 12-step phase shift method.
Figure 14.
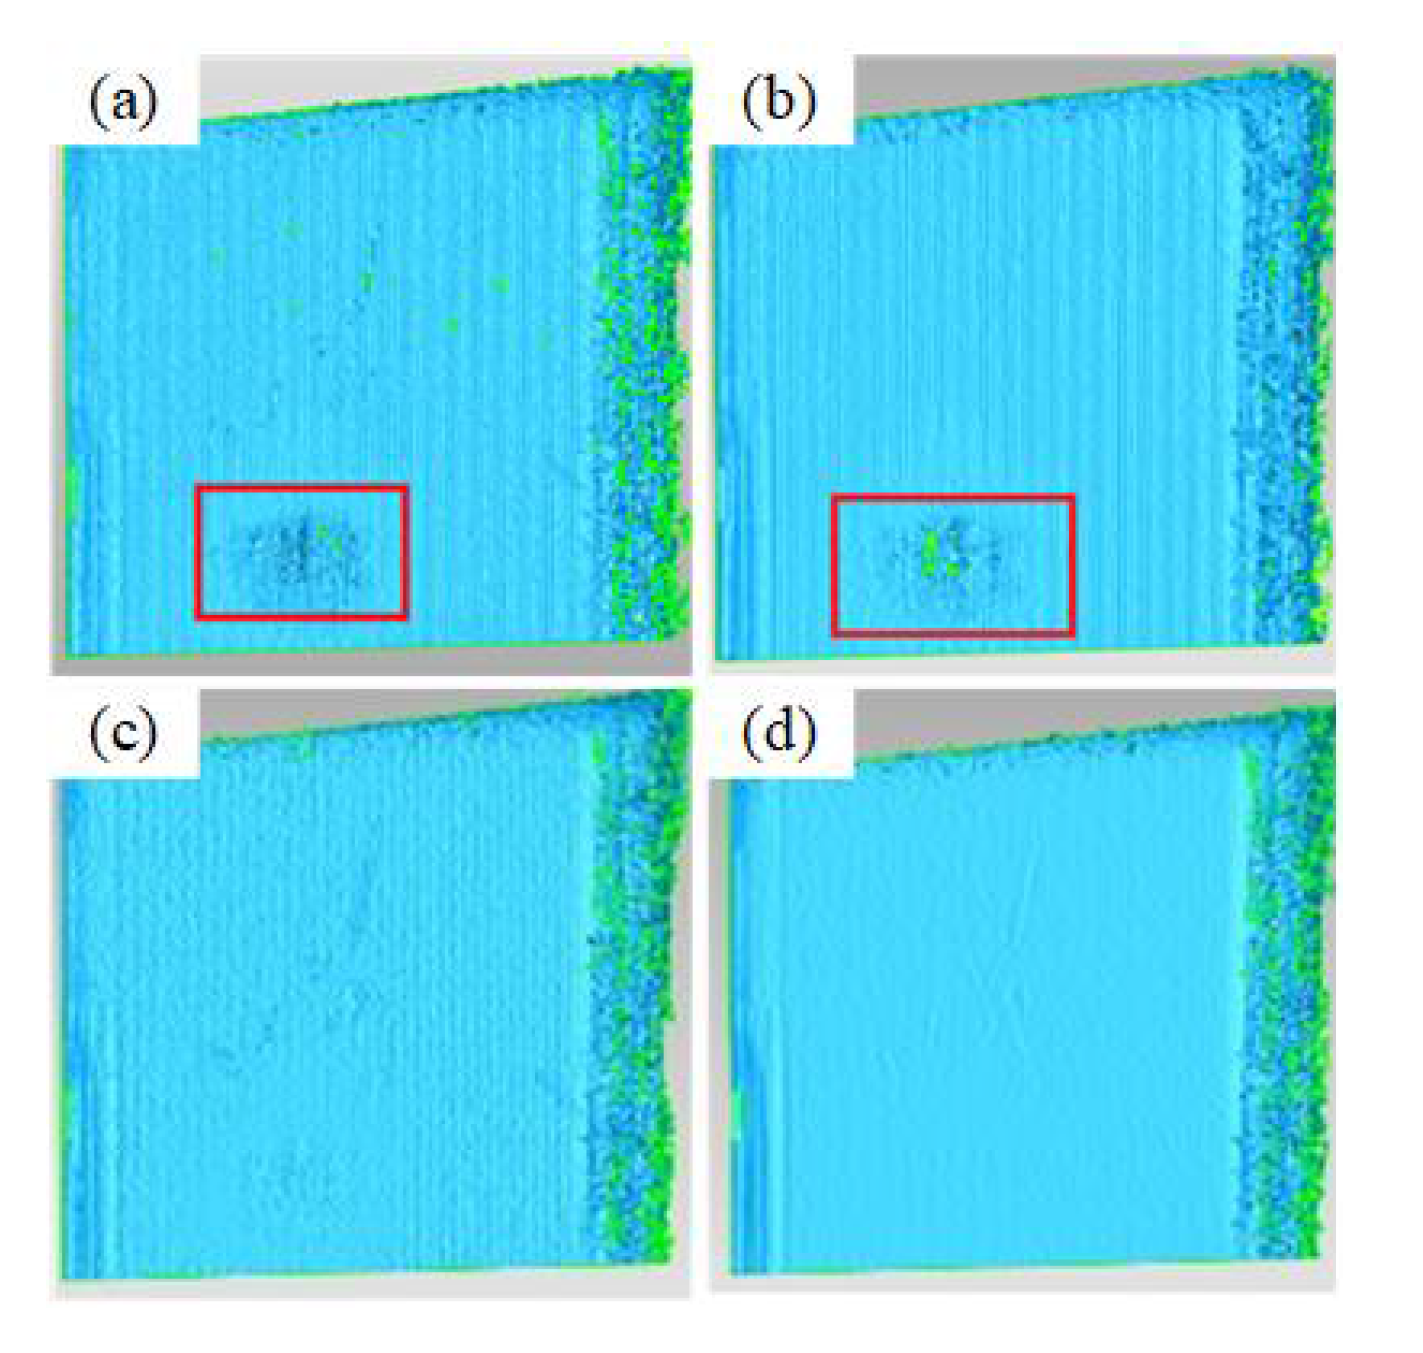
Measurement results of the high reflective metal aluminum plane: (a) Point cloud fitting result calculated using 3-step phase shift method;(b) Point cloud fitting result calculated using 12-step phase shift method;(c) Point cloud fitting result calculated using method described in this article (d) Point cloud fitting result calculated using 12-step phase shift method.
Table 1.
The intrinsic parameters of camera.
Table 1.
The intrinsic parameters of camera.
| Unit/pixel |
Camera |
| Focal length |
[3384.99, 3382.34] |
| Principal point |
[645.45, 512.89] |
| Distortion |
[ -0.10571, 1.46556, -0.00076, 0.00014, 0.00000] |
| Re-projection error |
[ 0.03151, 0.03341 ] |
Table 2.
Measurement results of a standard ball with a diameter of 24.99920 mm.
Table 2.
Measurement results of a standard ball with a diameter of 24.99920 mm.
Method
/Number |
1 |
2 |
3 |
4 |
5 |
MAE
(μm) |
RMSE
(μm) |
| inverse linear |
24.935 |
25.077 |
25.064 |
25.057 |
25.066 |
66 |
66.43 |
| polynomial fitting |
24.944 |
25.061 |
25.057 |
25.05 |
25.059 |
56 |
56.12 |
| FNN |
25.042 |
24.967 |
24.962 |
24.953 |
24.951 |
44 |
44.59 |

