1. Introduction
Water in soils moves and redistributes under the influence of temperature gradient. The water redistribution in soil induces the associated heat transfer and change in soil thermal properties. Therefore, moisture flow in unsaturated soils under non-isothermal conditions is highly coupled with the heat transfer process. Coupled heat transfer and moisture flow in unsaturated soils is critical to the understanding of many thermal geotechnical problems, such as buried electrical cables, ground heat exchangers, energy piles, thermally active embankments, and heat storage in soils (McCartney et al., 2019). For example, buried electrical transmission cables generate heat, causing a rising temperature in the cable sheath, which leads to the migration of moisture away from the cable under the thermal gradient. The soil surrounding the cable dries out, and its thermal conductivity decreases remarkably. As a result, the cable temperature continues to rise, which may lead to cable failure and thermal instability of the soil surrounding the cable (Abdel-Hadi and Mitchell, 1981).
Thermally-induced soil water movement in unsaturated soils is a complex process involving various components in both vapor and liquid phases governed by different physical laws (Abdel-Hadi and Mitchell, 1981). Soil vapor pressure increases with the increase of temperature. Water molecules in the vapor diffuse from a warmer region towards a lower temperature region in the direction of the decreasing temperature gradient. This vapor diffusion process is generally governed by Fick’s first law of diffusion. The vapor condenses to liquid water in the cooler temperature region and creates an extra difference in the soil moisture potential, contributing to the liquid moisture flow. The liquid moisture flow caused by temperature gradient is more complex and governed by several physical phenomena such as thermo-self-diffusion, thermoosmotic flow in fine-textured soil, and thermocapillary film flow. The net liquid moisture flow is a combination of all the above liquid flow phenomena. The most dominant liquid moisture flow is the viscous capillary flow caused by a net differential in soil suction. The dynamic balance of the vapor and liquid water flow determines the net moisture movement of the soil, whether it gets dry or wet.
Thermally-induced moisture migration in unsaturated soil is a complex process influenced by several factors, including temperature gradient, soil type, moisture content, and gravitational effects. Bouyoucos (1915) is among the earliest studies on the paired flux of heat and moisture transfer in a closed soil column. Several soils, including sandy loam, silt loam, and clay, were tested at different moisture content and temperature gradients. The researcher concluded that the soil behavior was influenced by the laws of surface tension and viscosity of water in the soil until the critical moisture content was attained. “Thermal critical moisture content” (TCMC) was defined as the initial moisture content at which water transfer from warmer to colder parts is most efficient under a constant thermal gradient (Crawford 1951; Bouyoucos 1915). The findings are corroborated by various subsequent researchers (Gurr et al., 1952; Jackson et al., 1965; Kuzmak & Sereda, 1957a, 1957b; Maclean & Gwatkin, 1953; Taylor & Cavazza, 1954). They determined that the quantity of water migrating from warm to cool regions was influenced mainly by the initial moisture content and magnitude of temperature gradients. Soil properties and initial moisture conditions determine the extent and direction of the moisture flux. Wang and Su (2010) found that higher gradient and lower soil density cause more pronounced moisture migration. When the initial moisture content is close to dry or near saturation, the thermally-induced moisture is small. However, maximum thermally-induced moisture flow was observed in soils with moderate initial moisture content. Hedayati-Dezfooli (2016) also determined that the temperature gradient is the primary factor causing moisture migration. It is found that a significant moisture migration was observed at a temperature difference of roughly 65ºC between the top and bottom plates. Dang (2017) observed that coarser soils could not hold pore water, and they experienced higher moisture movements than fine and medium soils. Faizal et al. (2021) remarked that changes in volumetric water content continued to fluctuate in a time-dependent, nonlinear, and slower manner after the fluctuations in soil temperature had settled, and soil temperatures and volumetric water content increased the greatest in the areas closest to the heat source. Lately, Kaneza et al. (2023) determined that unsaturated sand with a high moisture content achieved thermal equilibrium faster than one with a lower moisture content. The researcher also noticed that gravity has an impact on the moisture movement in the soil, depending on the direction of the temperature gradient: when the bottom of the soil was heated, and the top cooled, less pore water moved away from the heated end, and the increased thermal conductivity affected the temperature near that end, resulting in a higher steady-state temperature.
Although many studies have been conducted on thermally-induced moisture flow, it is still challenging to accurately measure and predict the coupled moisture-heat flow process in unsaturated soils, particularly sandy soils, due to low moisture migration and temperature effects on soil moisture measurement. In this study, a silty sand at various initial moisture content was tested in a heat cell at a constant temperature gradient. The heat cell was equipped with heat flux, thermocouples, thermal conductivity, and moisture sensors to monitor the thermal and moisture properties under a controlled 1D temperature gradient. This research brings new insight to the analysis of unsaturated soil behavior.
2. Materials and Methods
2.1. Soil Heating Test Cell
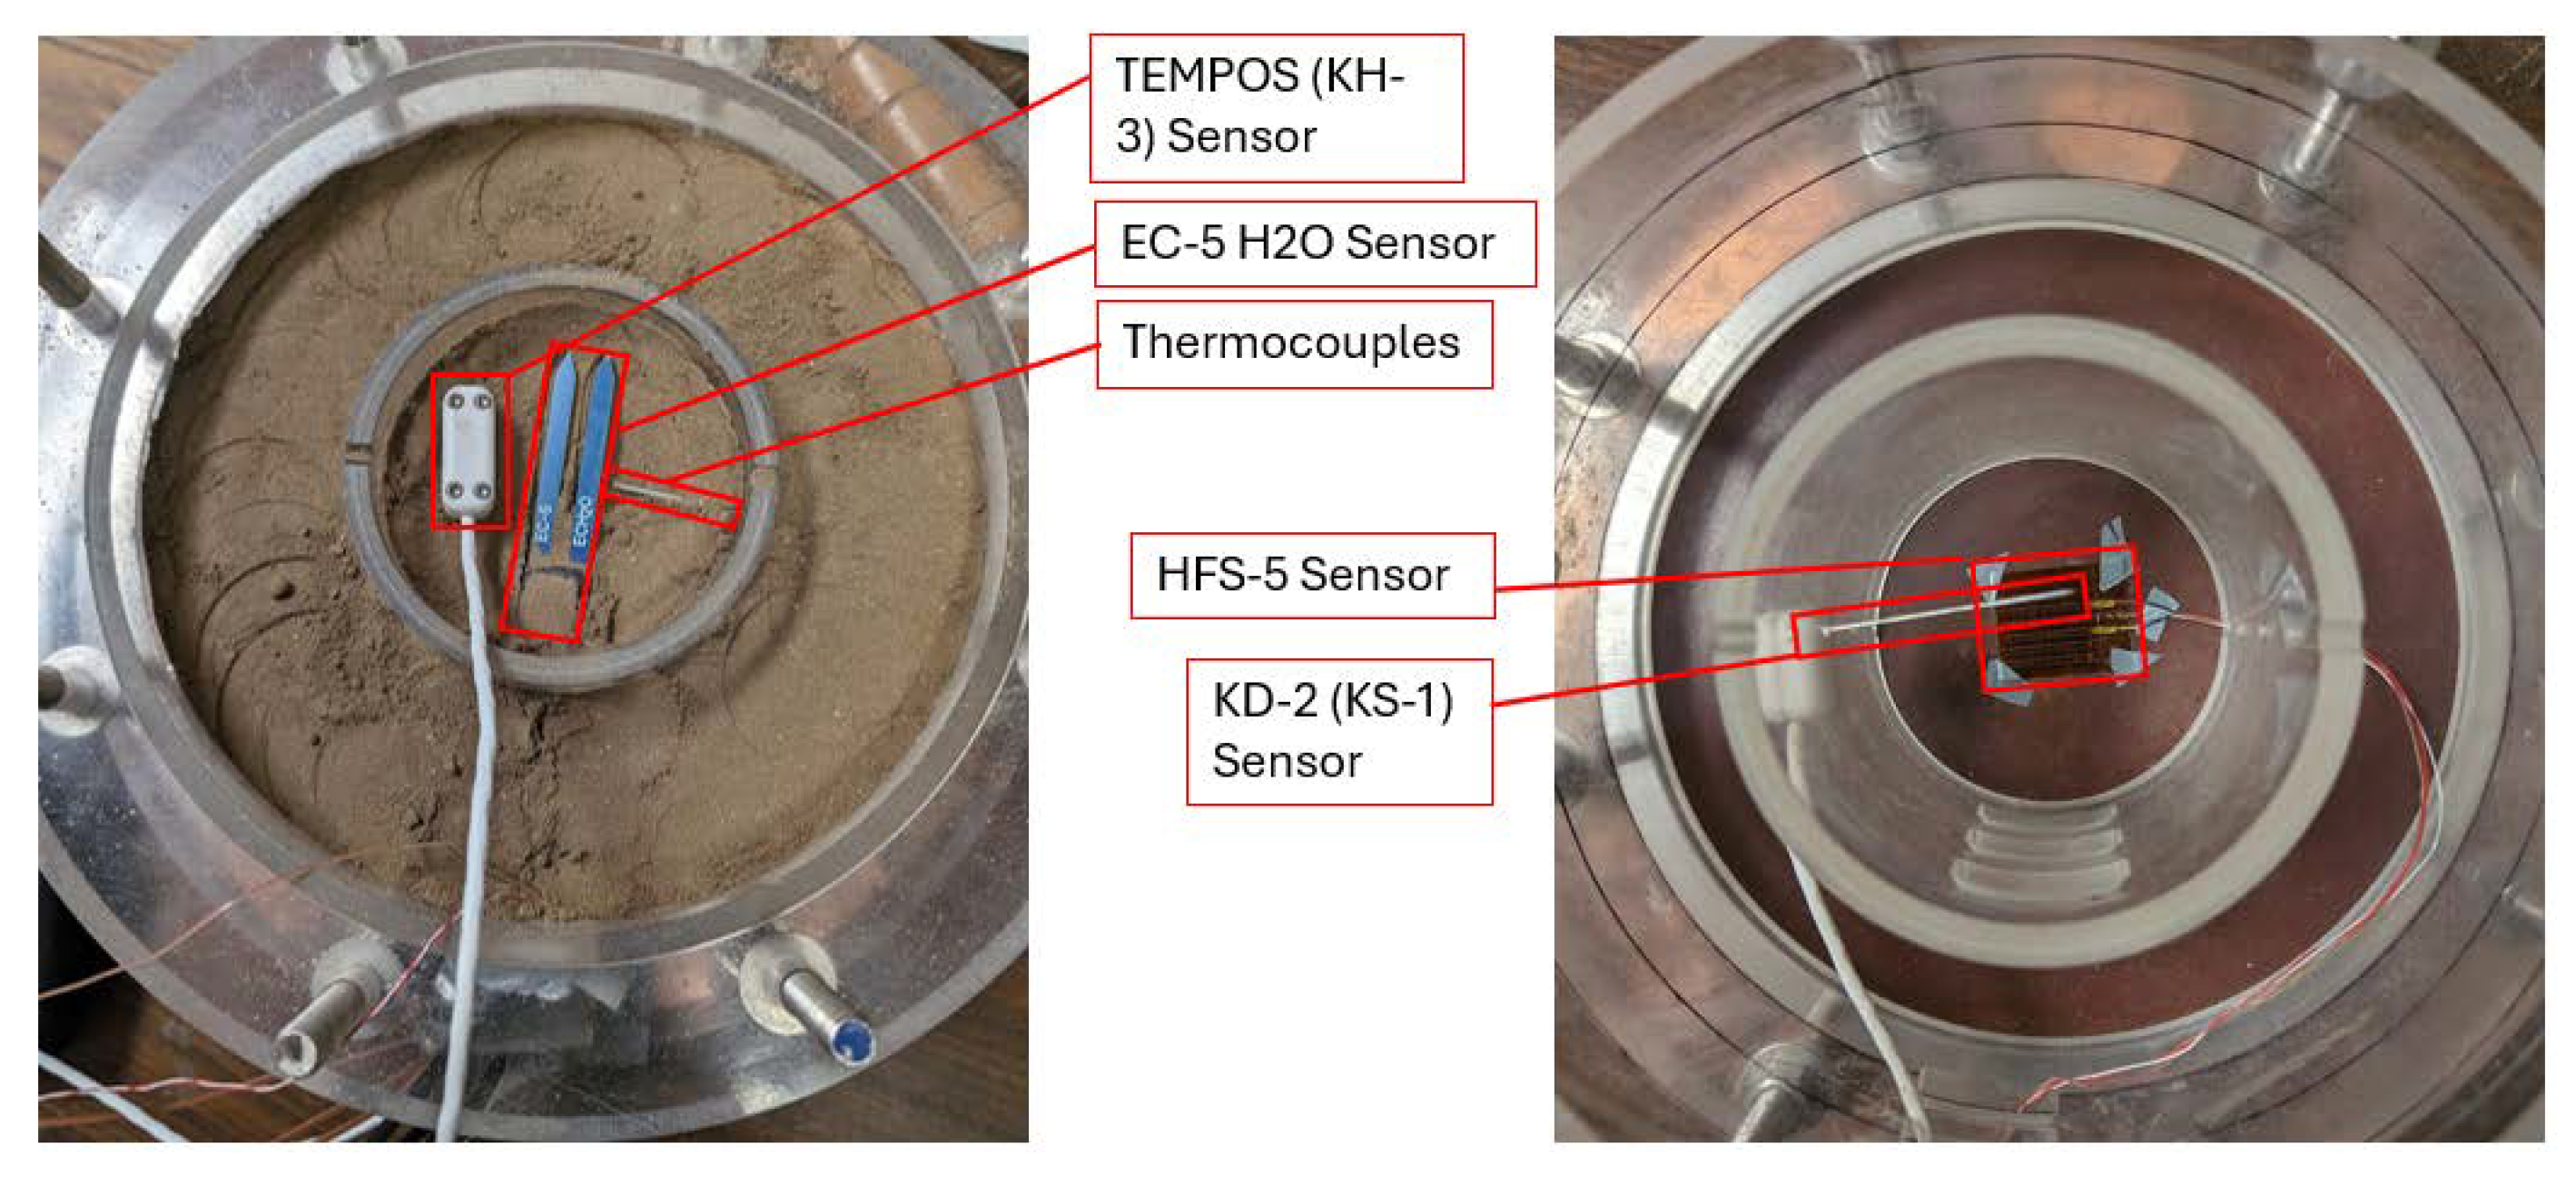
A fabricated soil heating test cell developed by Kaneza et al. (2024) was modified with added sensors for the heating test of the studied soil. The modified heating cell is shown in
Figure 1 and
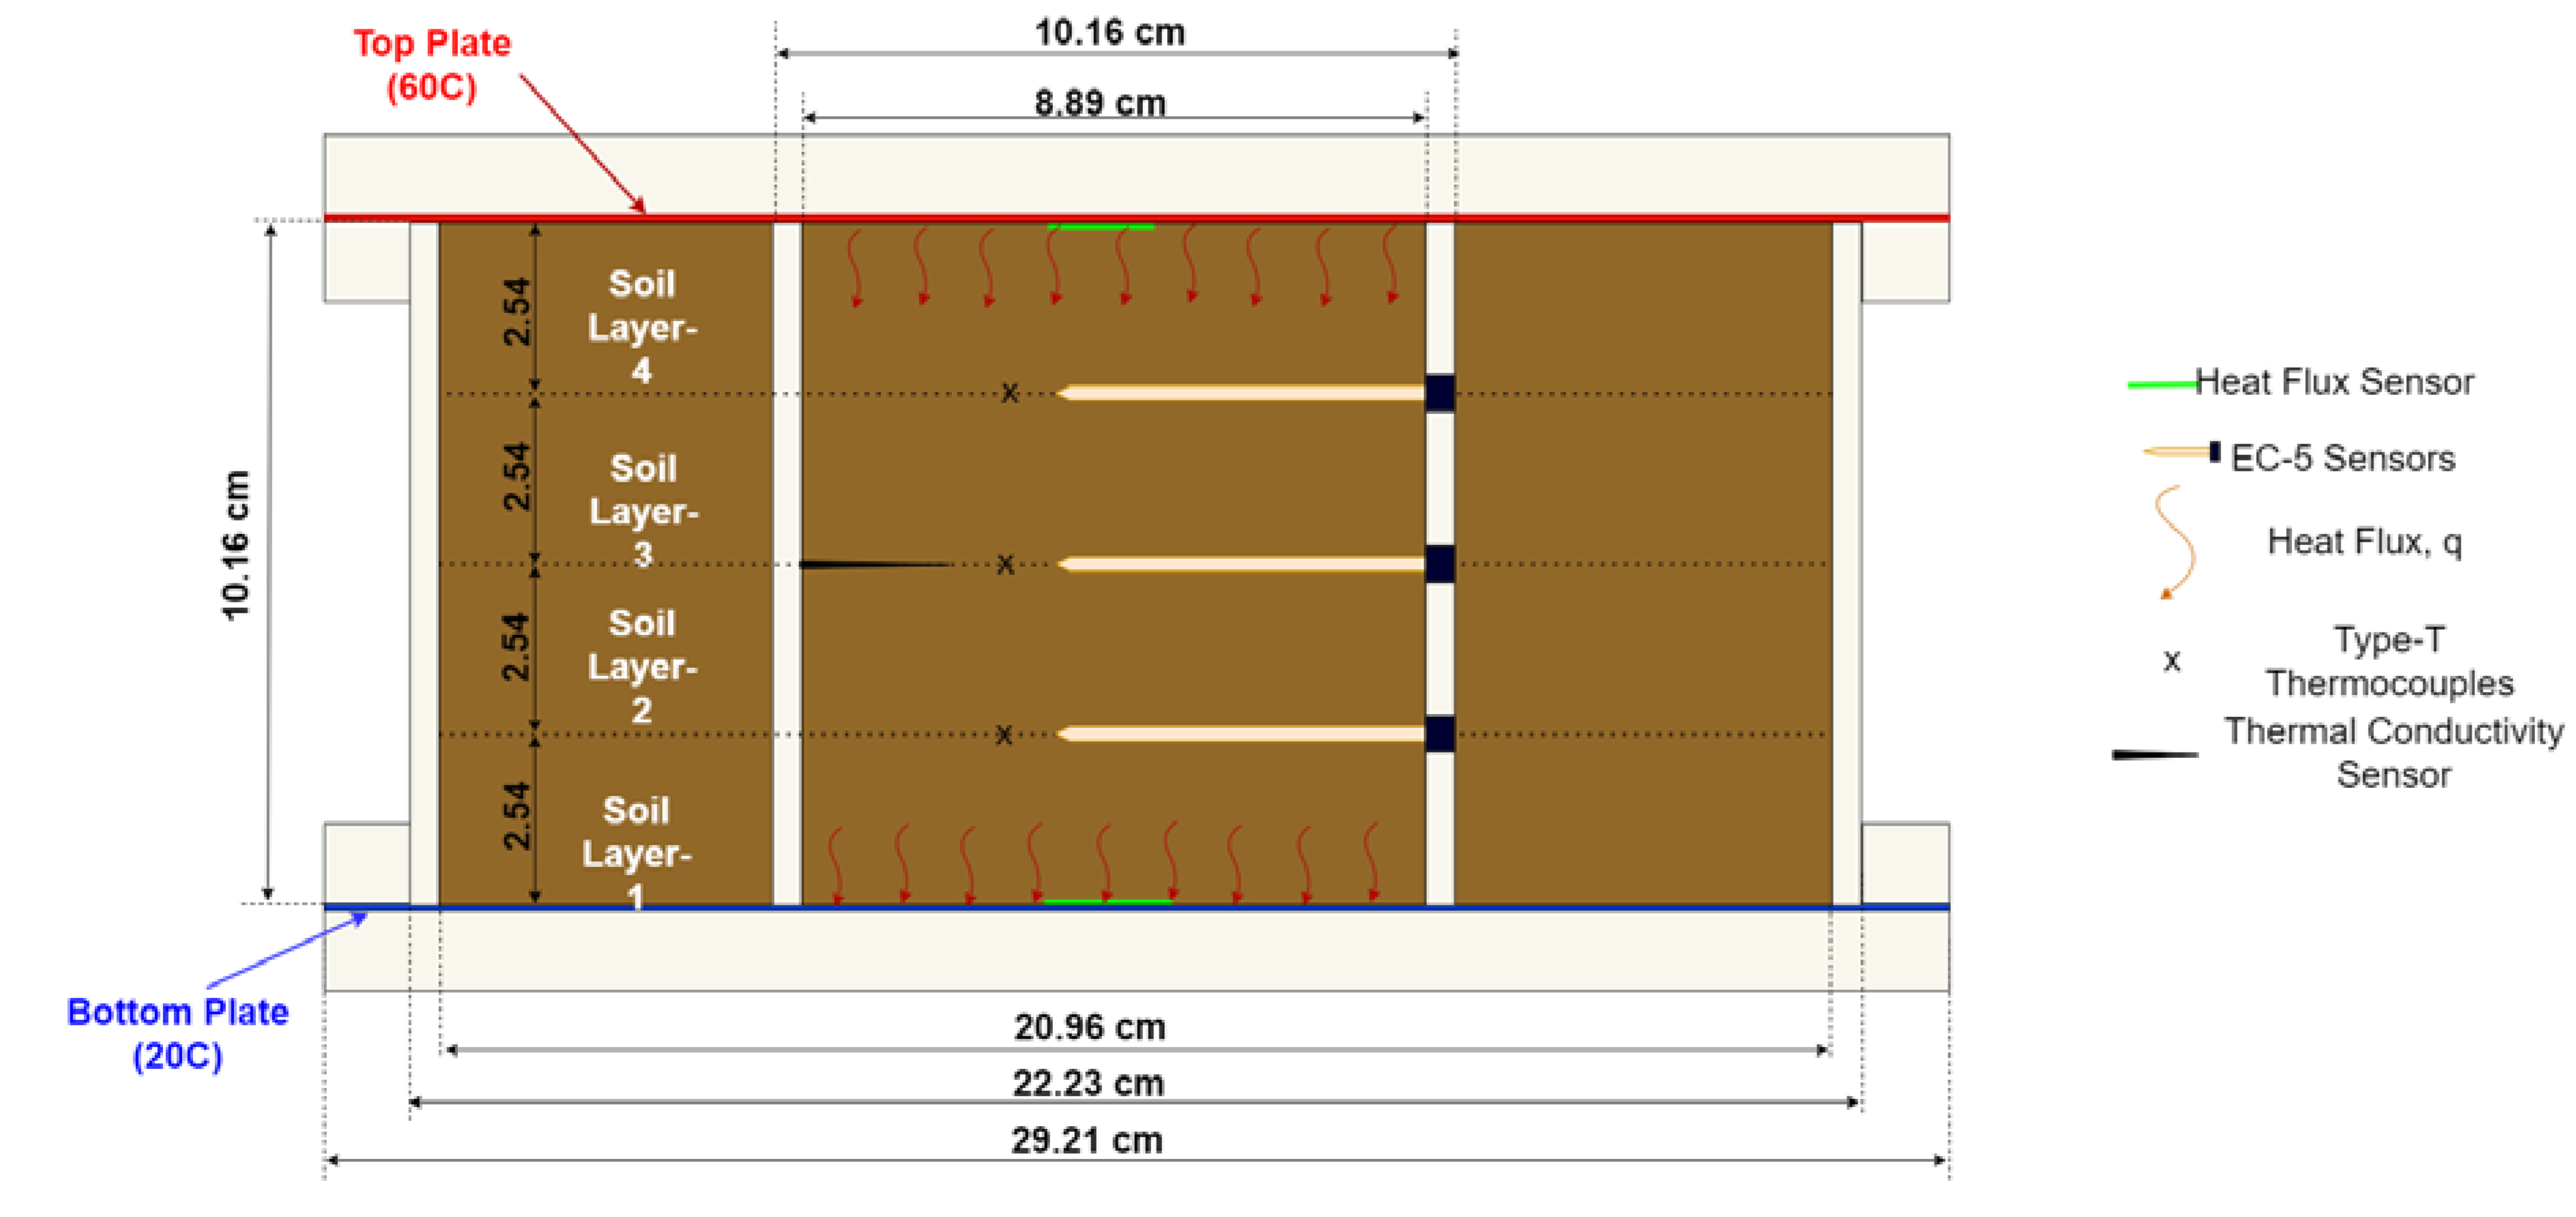
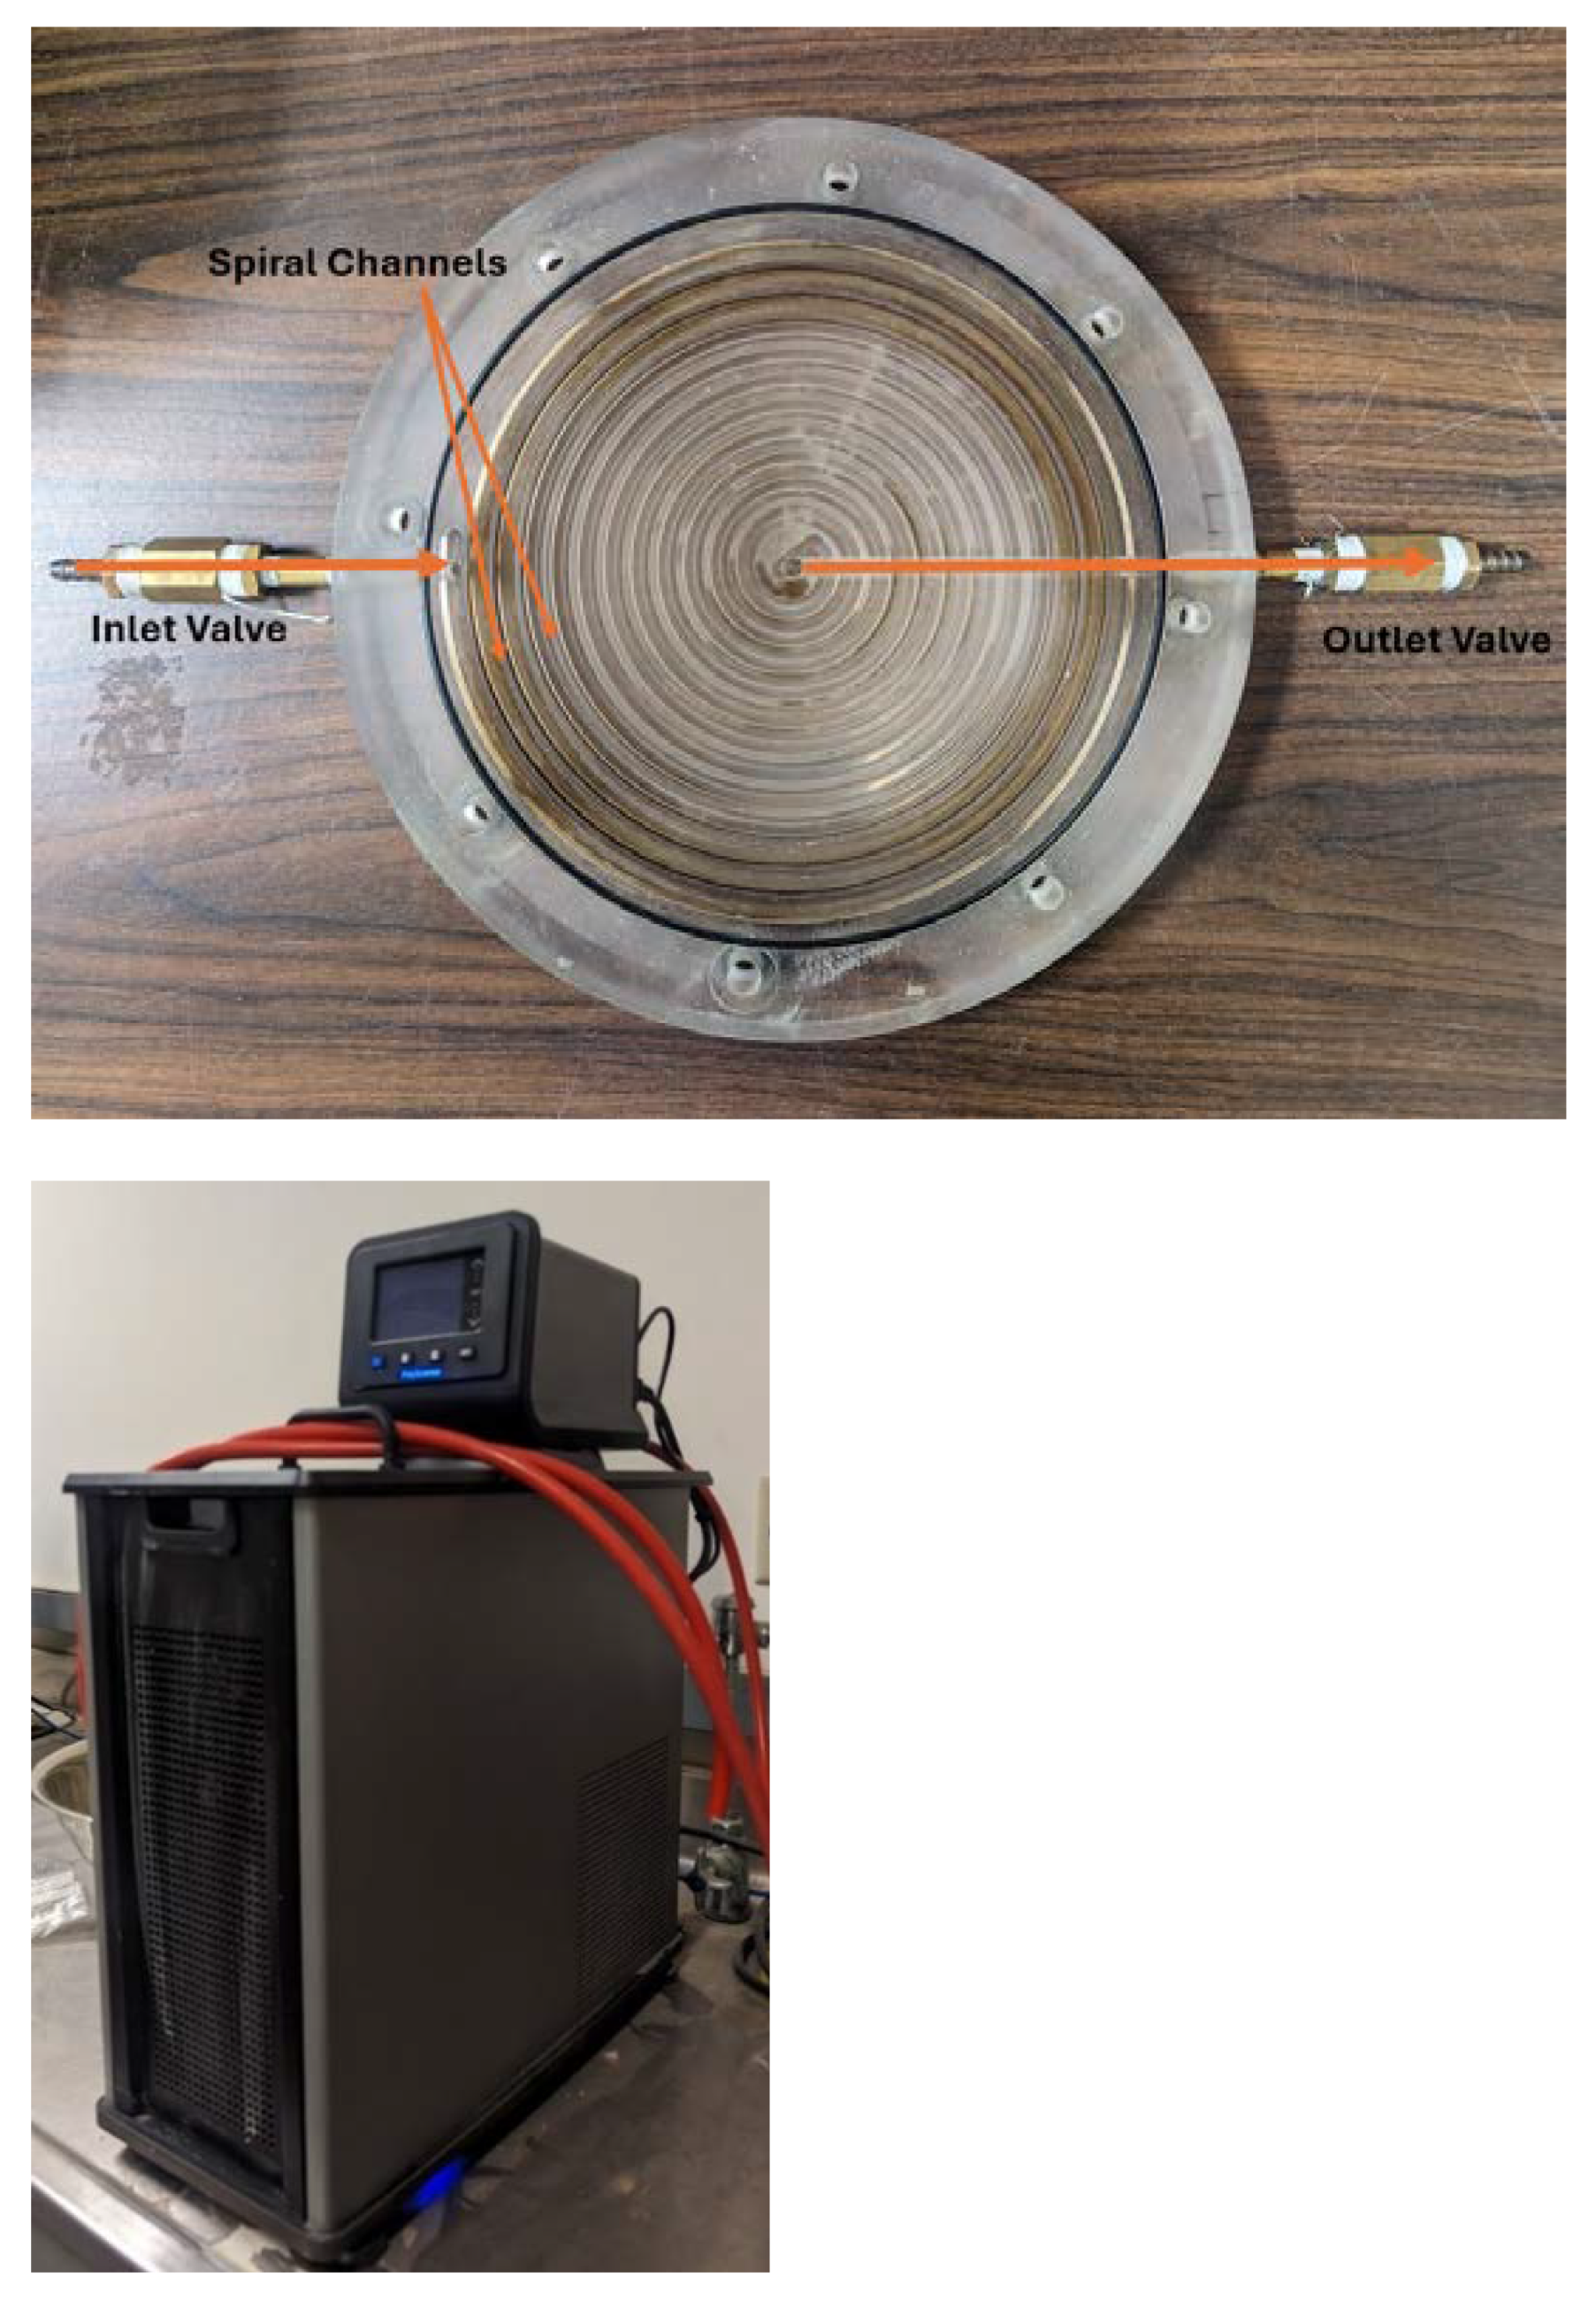
Figure 2, which consists of two concentric acrylic cylinders with a height of 10.16 cm and thickness of 0.635 cm, with inside diameters of 8.89 cm and 20.96 cm, respectively. Two heat exchanger systems consisting of copper plates and supporting rings are placed at the top and bottom of the heating cell. The heat exchanger plates are 29.21 cm in diameter and 2.54 cm thick with an inside spiral channel of 0.65 cm ×0.65 cm, extending up to a radius of 22.22 cm. The inner and outer diameters of the support rings are 22.23 cm and 29.21 cm, respectively, while the copper plates have a diameter of 29.21 cm and a thickness of 0.24 cm. Two O-rings were used to seal the outer column to the heat exchanger plates, and threaded rods were passed to ensure a fixed soil heating system. The tubes, heat exchangers, and rings are made of clear cast acrylic. An illustration of the modified soil cell is provided in
Error! Reference source not found. Via inlet and outlet in the heat exchanger plates, warm and cold water is circulated from and to the temperature-controlled circulator (SD07R-20-A11B from PolyScience) to the heat exchangers. The features of the heat exchanger, such as the water bath circulator and engraved spiral channels with cross sections, are shown in
Figure 3. To facilitate effective and uniform heat transfer from both the hot and cold ends, two copper plates are placed between the heat exchanger and the soil sample.
2.2. Test Soil
A series of geotechnical tests were performed on Benbrook sand, namely the wet sieve analysis (American Society for Testing and Materials 2000), dry sieve (American Society for Testing and Materials 2017), hydrometer analysis (American Society for Testing and Materials 2021), Atterberg limits tests (liquid limit, LL, and plastic limit, PL (American Society for Testing and Materials 2018) and (Texas Department of Transportation 1999), and specific gravity (G
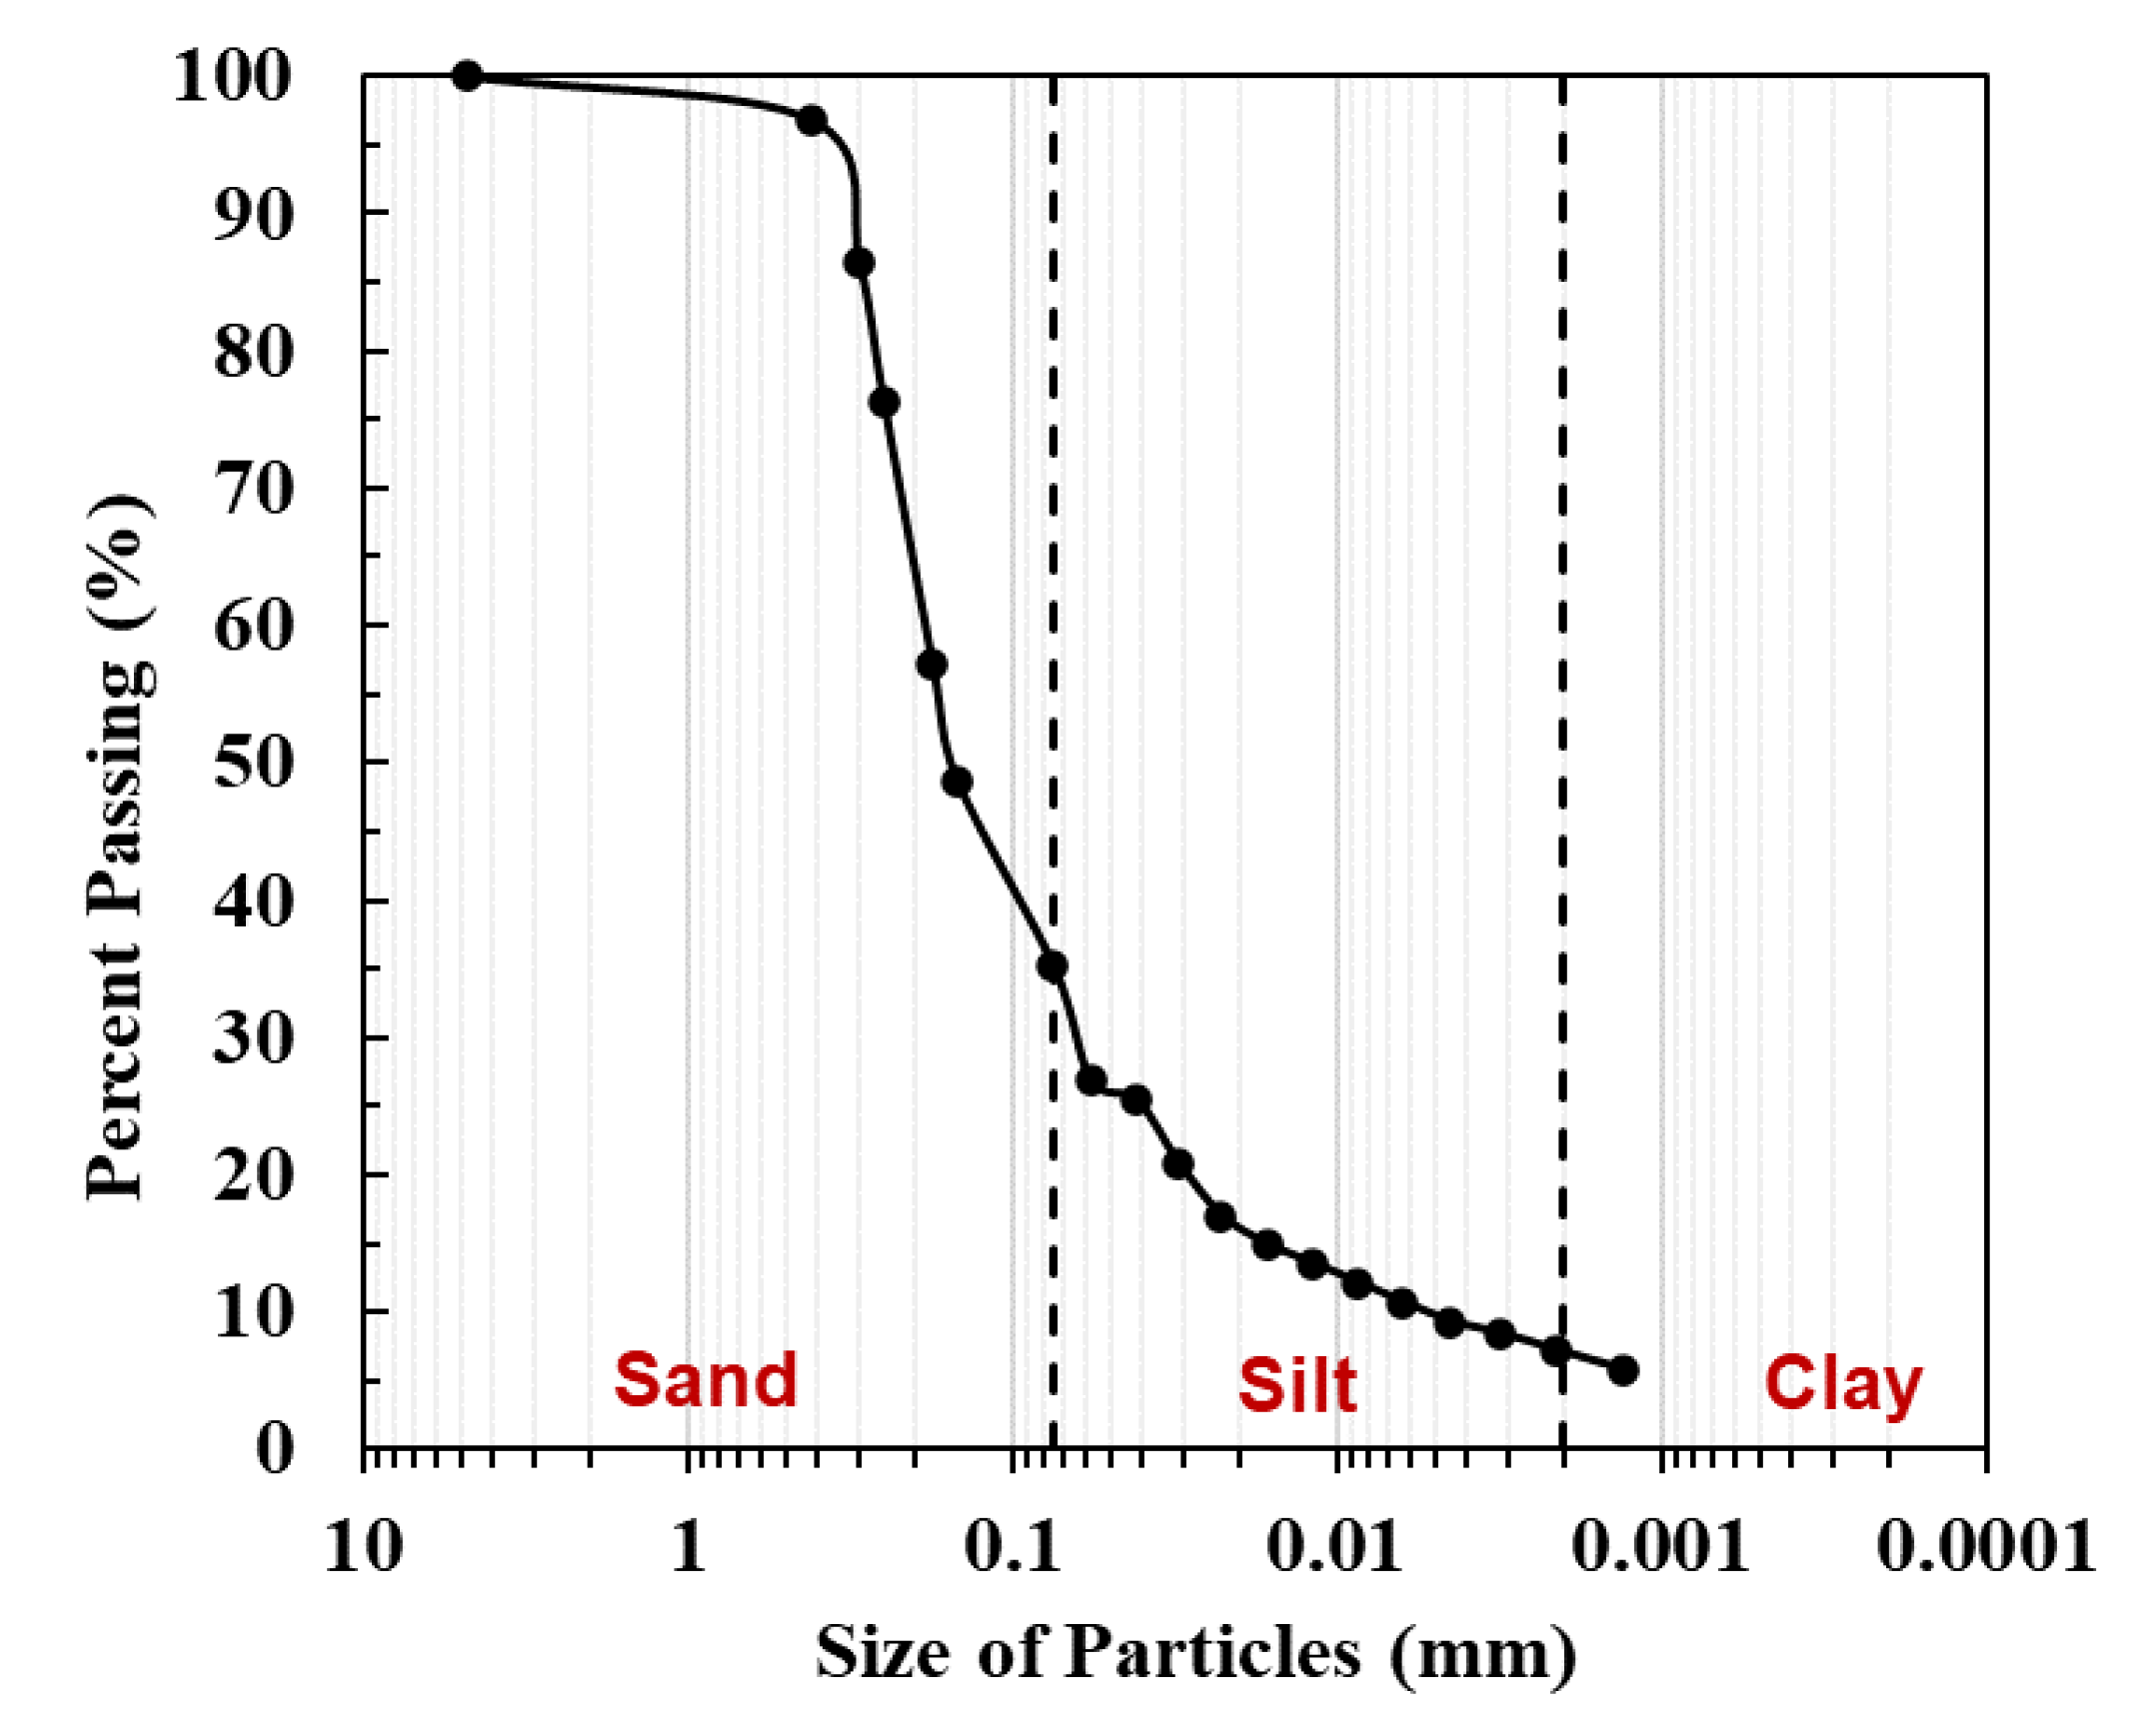
s) test (American Society for Testing and Materials 2014). The sieve analyses and hydrometer analyses established the particle size curves of the soil. The results of the soil index properties, including the percentage of particle sizes and specific gravity, are summarized in
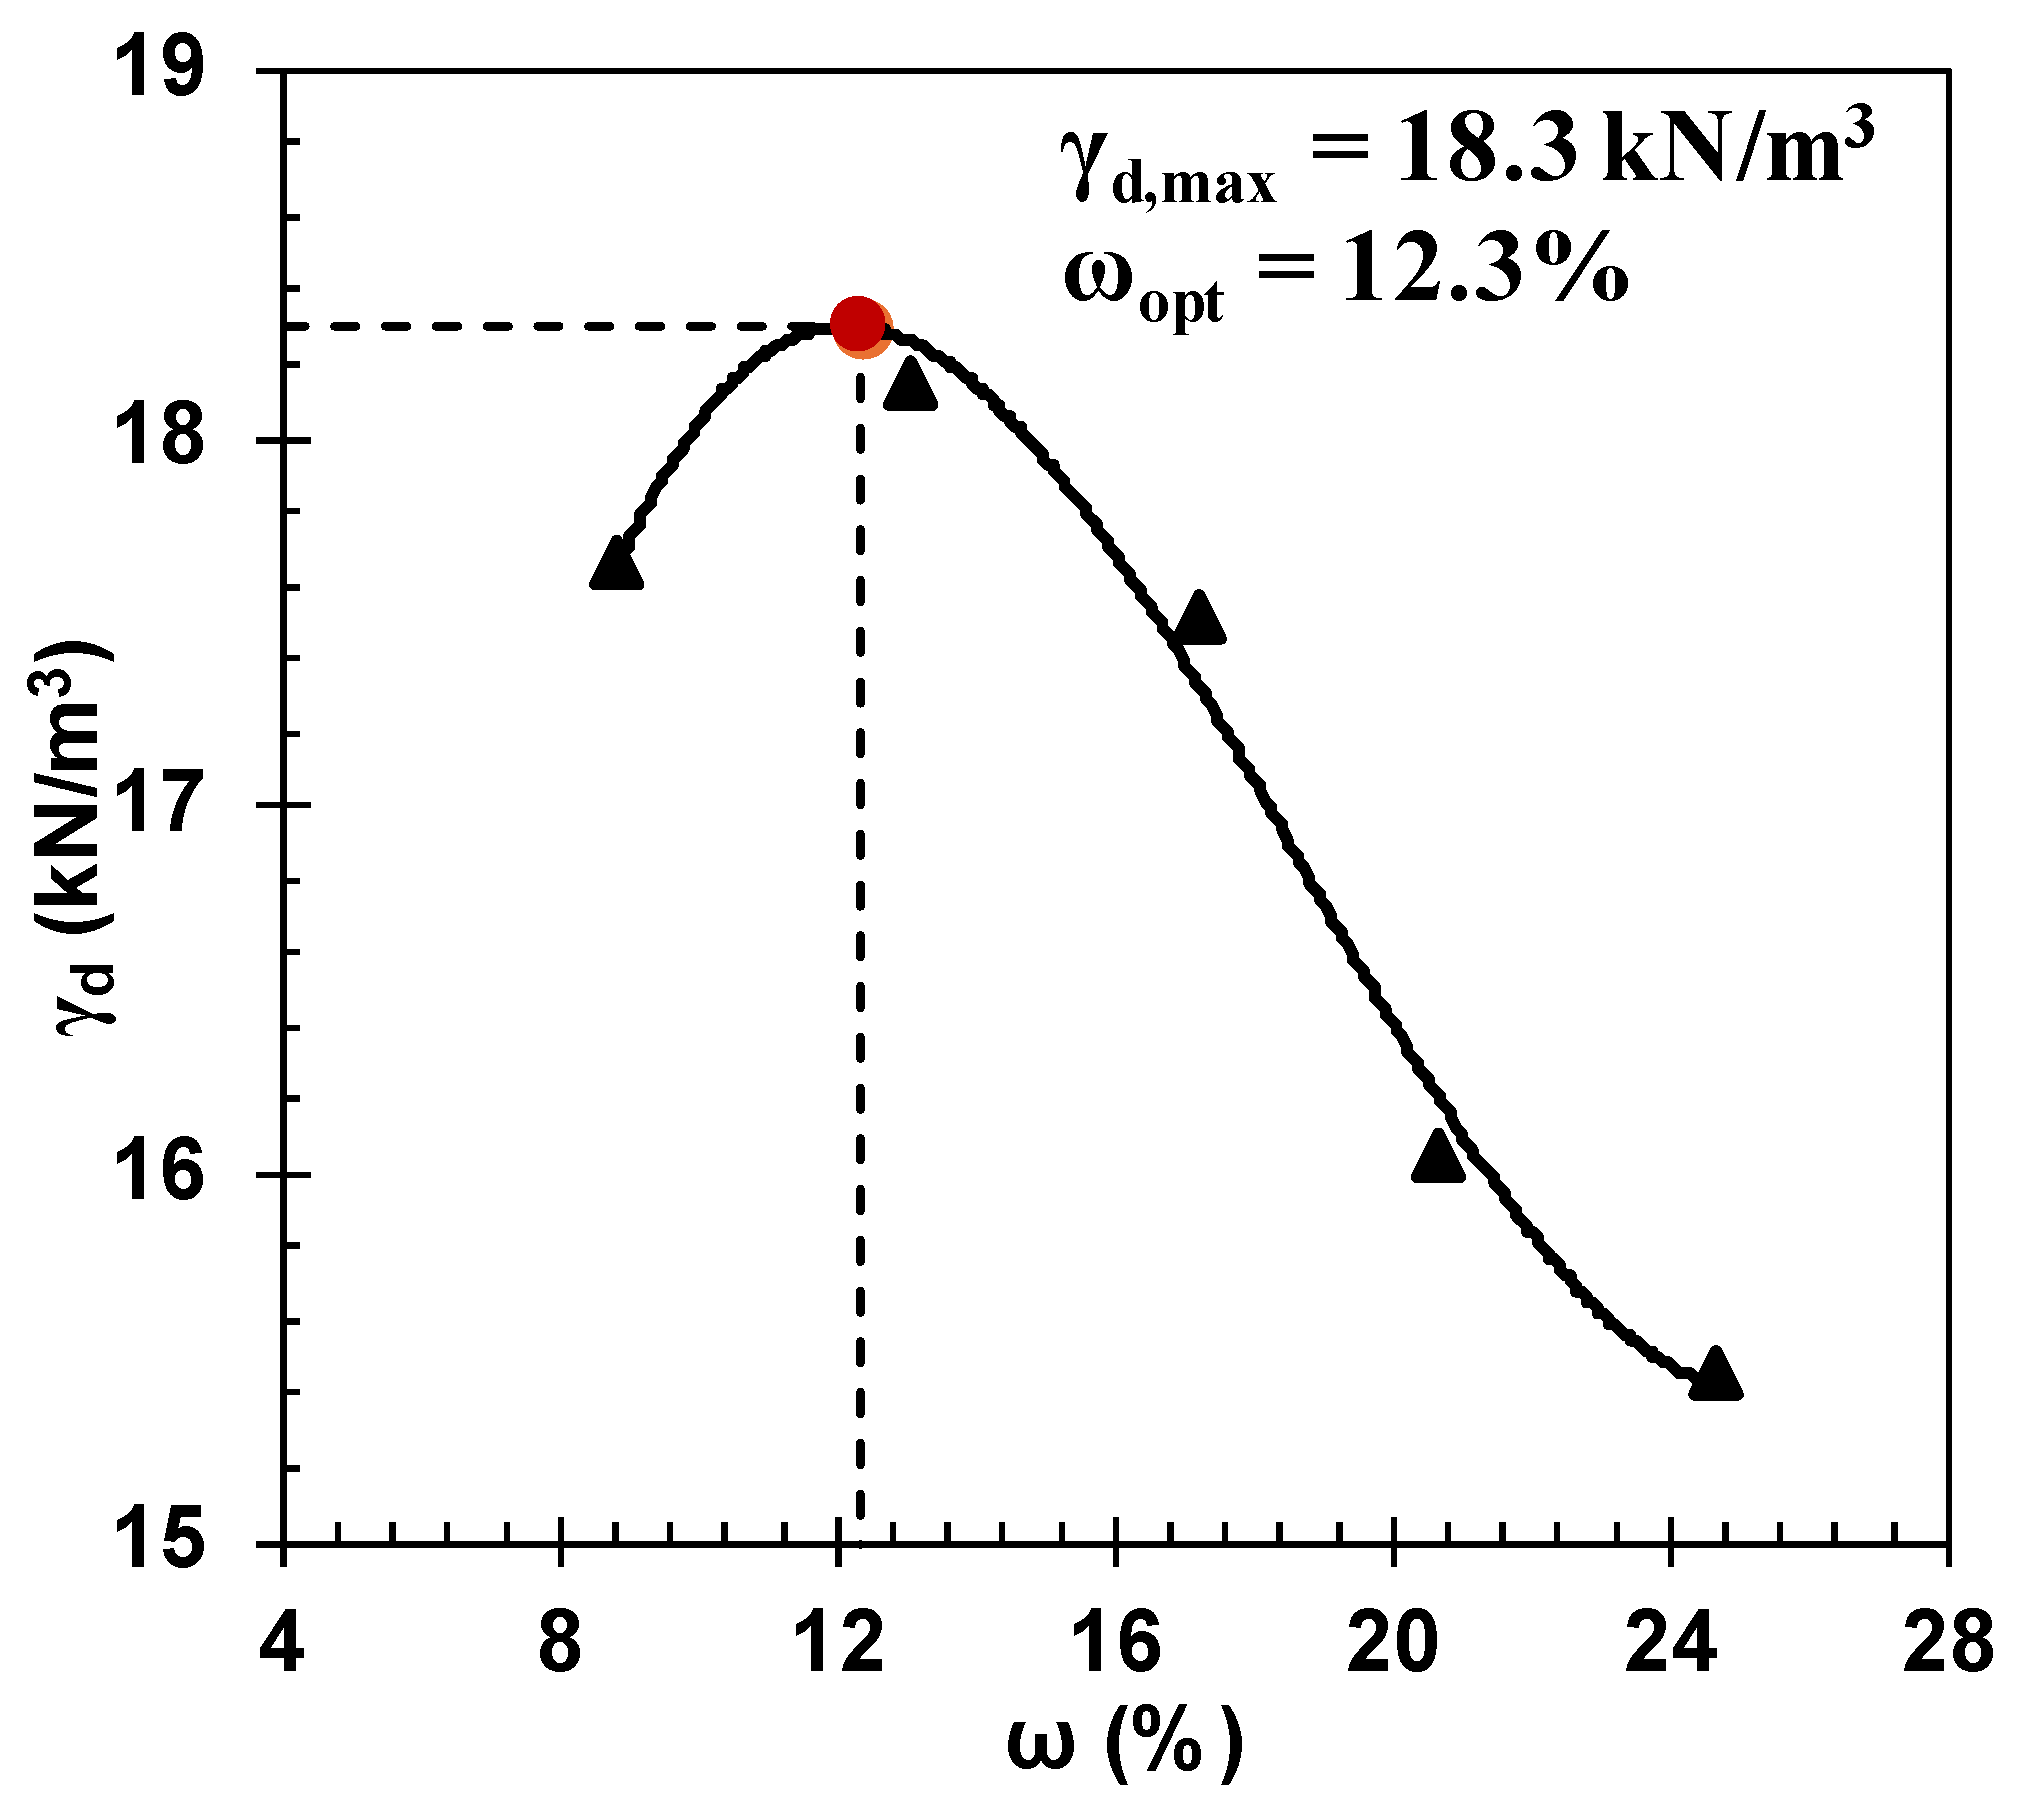
Table 1. The Benbrook sand is classified as silty sand (SM) with 35% non-plastic fine particles. The maximum dry density was determined as 18.3 kN/m
3 (1.865 g/cm
3) at an optimum moisture of 12.3 % (w/w) from the Standard Proctor Test.
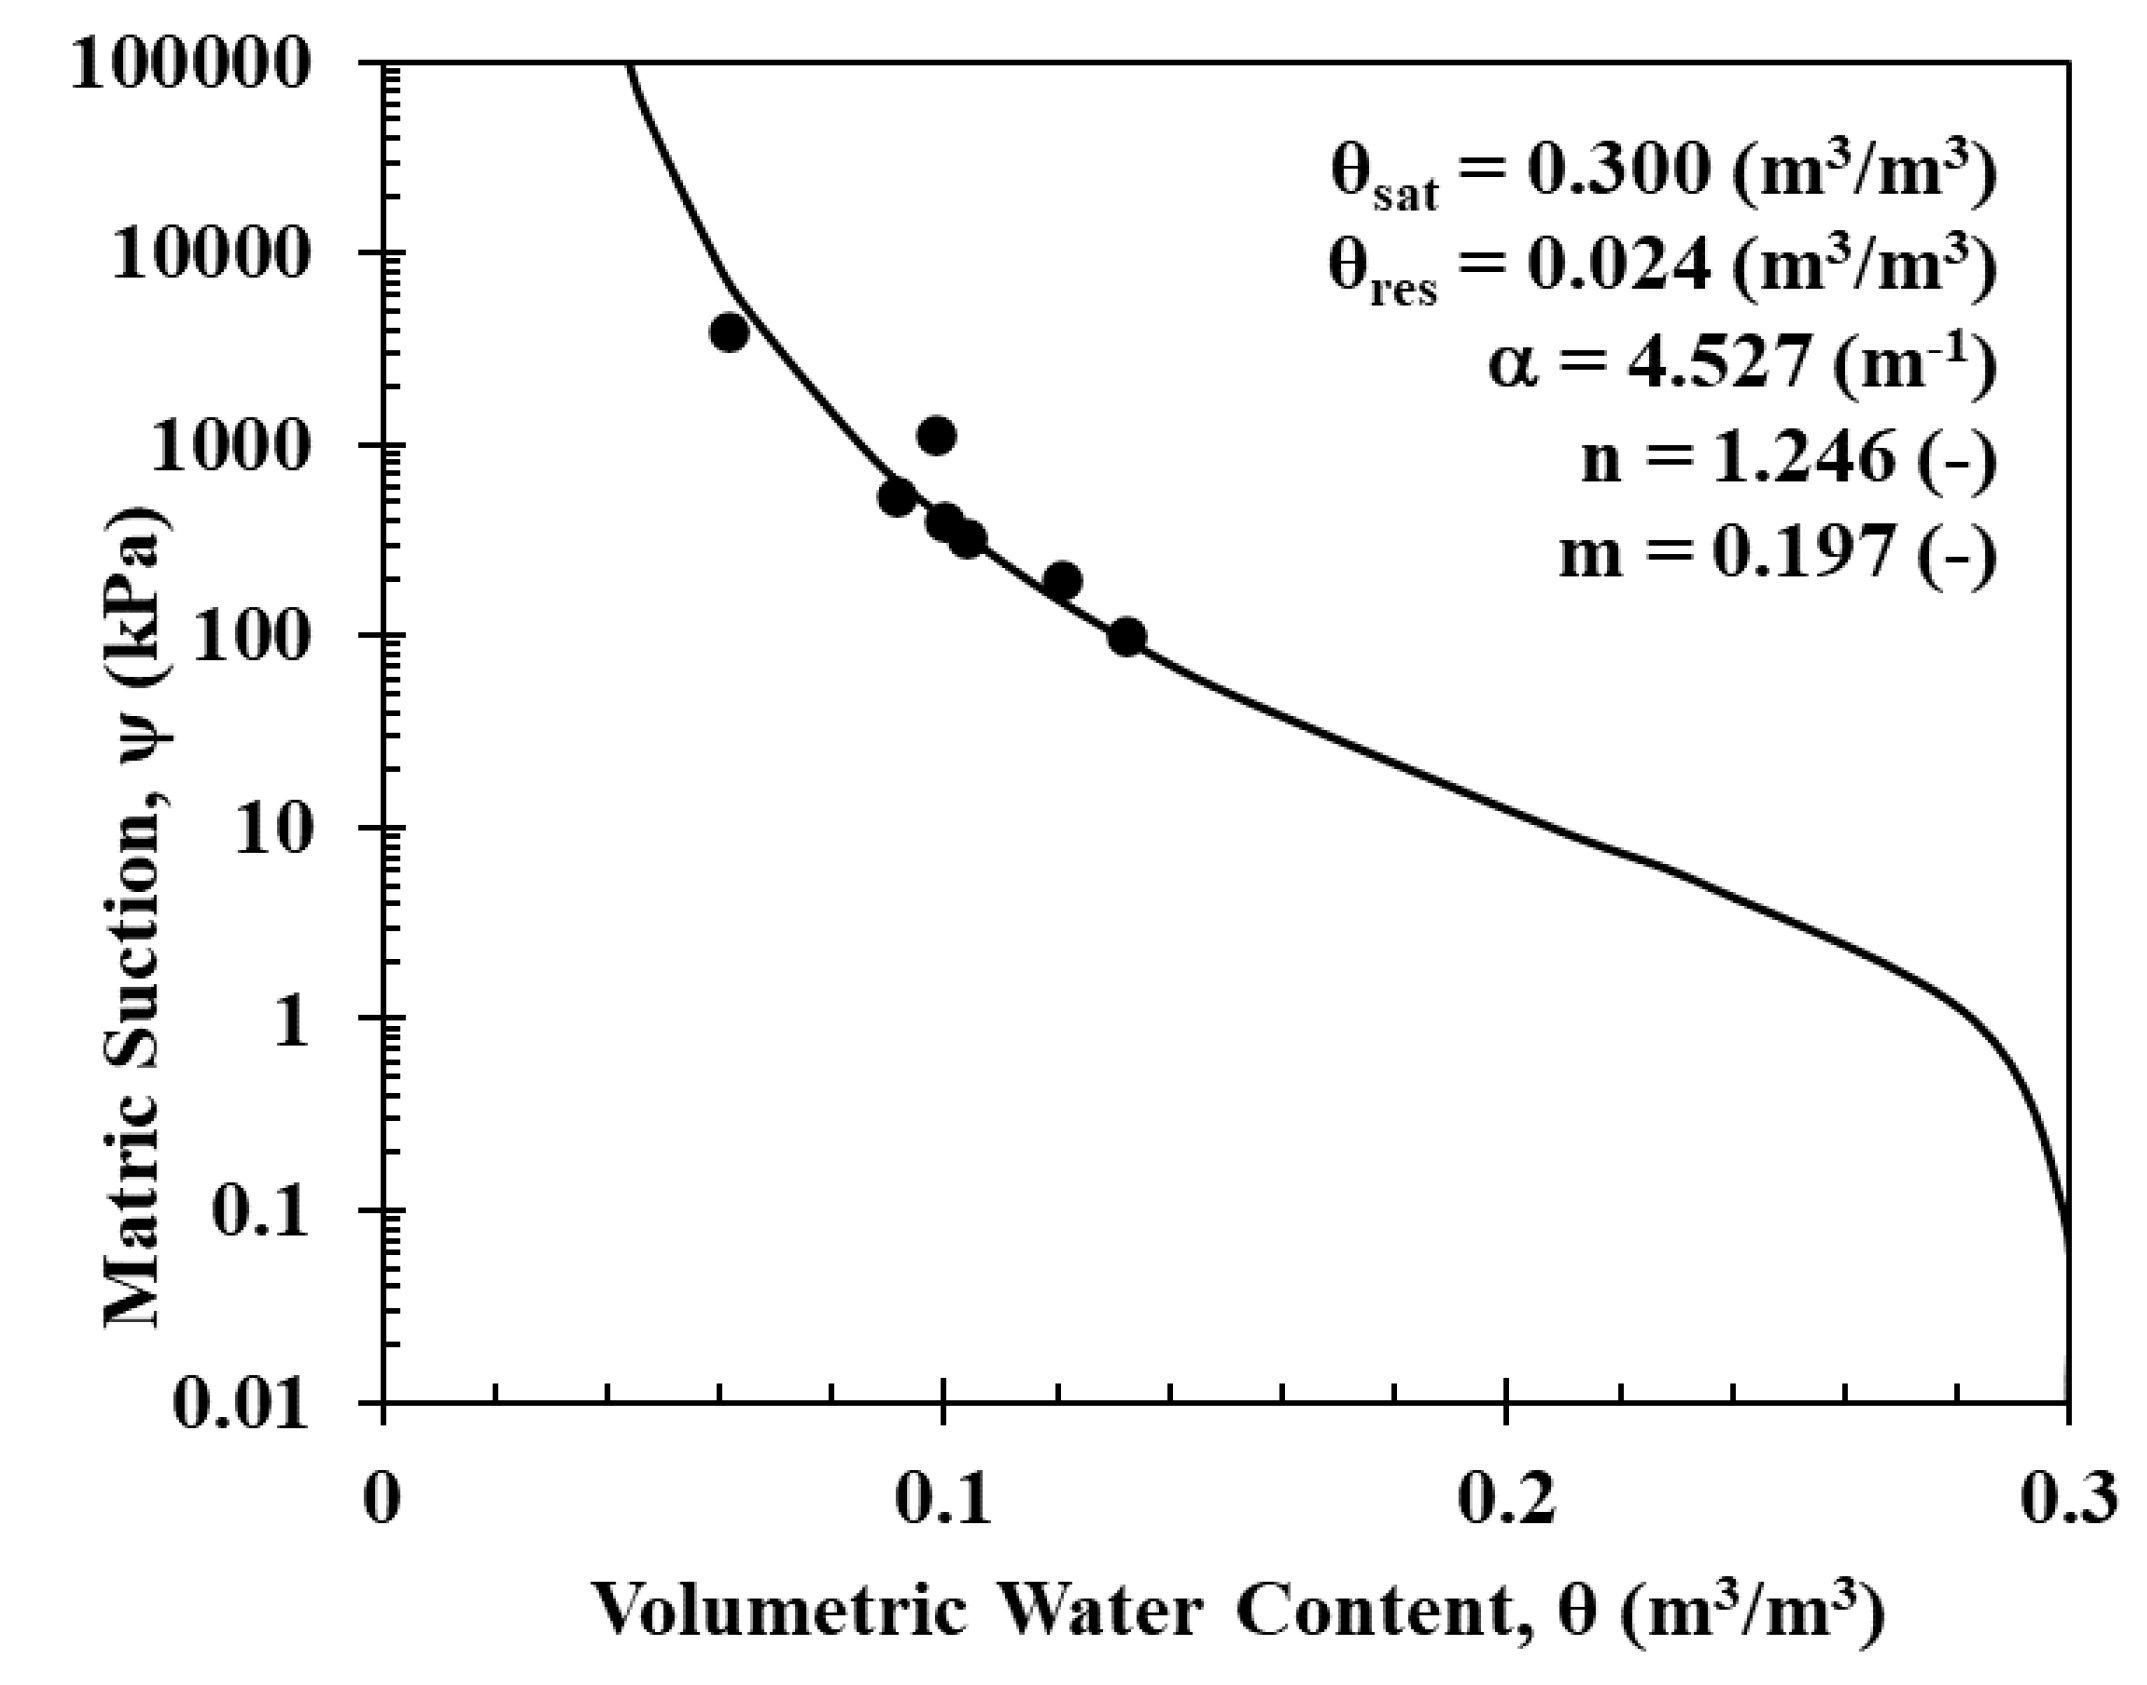
The pressure plate and filter paper methods were adopted to measure low and high suction, respectively, to obtain the SWCC curve, followed by the best curve fitting to find the parameters for the van Genuchten model. The silty sand was compacted at 95% of the maximum dry density (
) and the optimum moisture content (
) determined from the standard proctor test to prepare the soil specimen for the proposed lab testing. The best-fit curve is illustrated in
Figure 6. Ultimately, the residual and saturated volumetric moisture content (
were estimated, and van Genuchten’s empirical parameters were determined. The residual and saturated volumetric moisture content (θ
r and θ
s) of 0.024 and 0.300 m
3/m
3 were estimated, and the van Genuchten empirical parameters of α = 4.527 m
-1, n = 1.246, and m = 0.197 were determined.
Figure 4.
Soil Particle Size Distribution Curves of Silty Sand.
Figure 4.
Soil Particle Size Distribution Curves of Silty Sand.
Figure 5.
Soil Compaction Curve.
Figure 5.
Soil Compaction Curve.
Figure 6.
Soil-water retention characteristics of the silty sand.
Figure 6.
Soil-water retention characteristics of the silty sand.
2.3. Sensors and Calibration
Temperature, moisture content, thermal conductivity, and heat flux measurements were taken during the heating cell test using T-type thermocouples, ECH2O EC-5, KD2 Pro (KS-1), TEMPOS SH-3 Sensor, and Omega HFS-5, respectively. Two Omega HFS heat flux sensors were attached to the top and bottom copper plates, respectively, to measure the temperature of the respective plates and heat flux. A KS-1 sensor was installed at the middle height of the soil, and the thermocouples and moisture sensors were installed at 2.5 cm, 5.0 cm, and 7.5 cm from the bottom heat exchanger plate. The arrangement of the sensors is presented in schematics and lab-test configuration in
Figure 1 and
Figure 2, respectively.
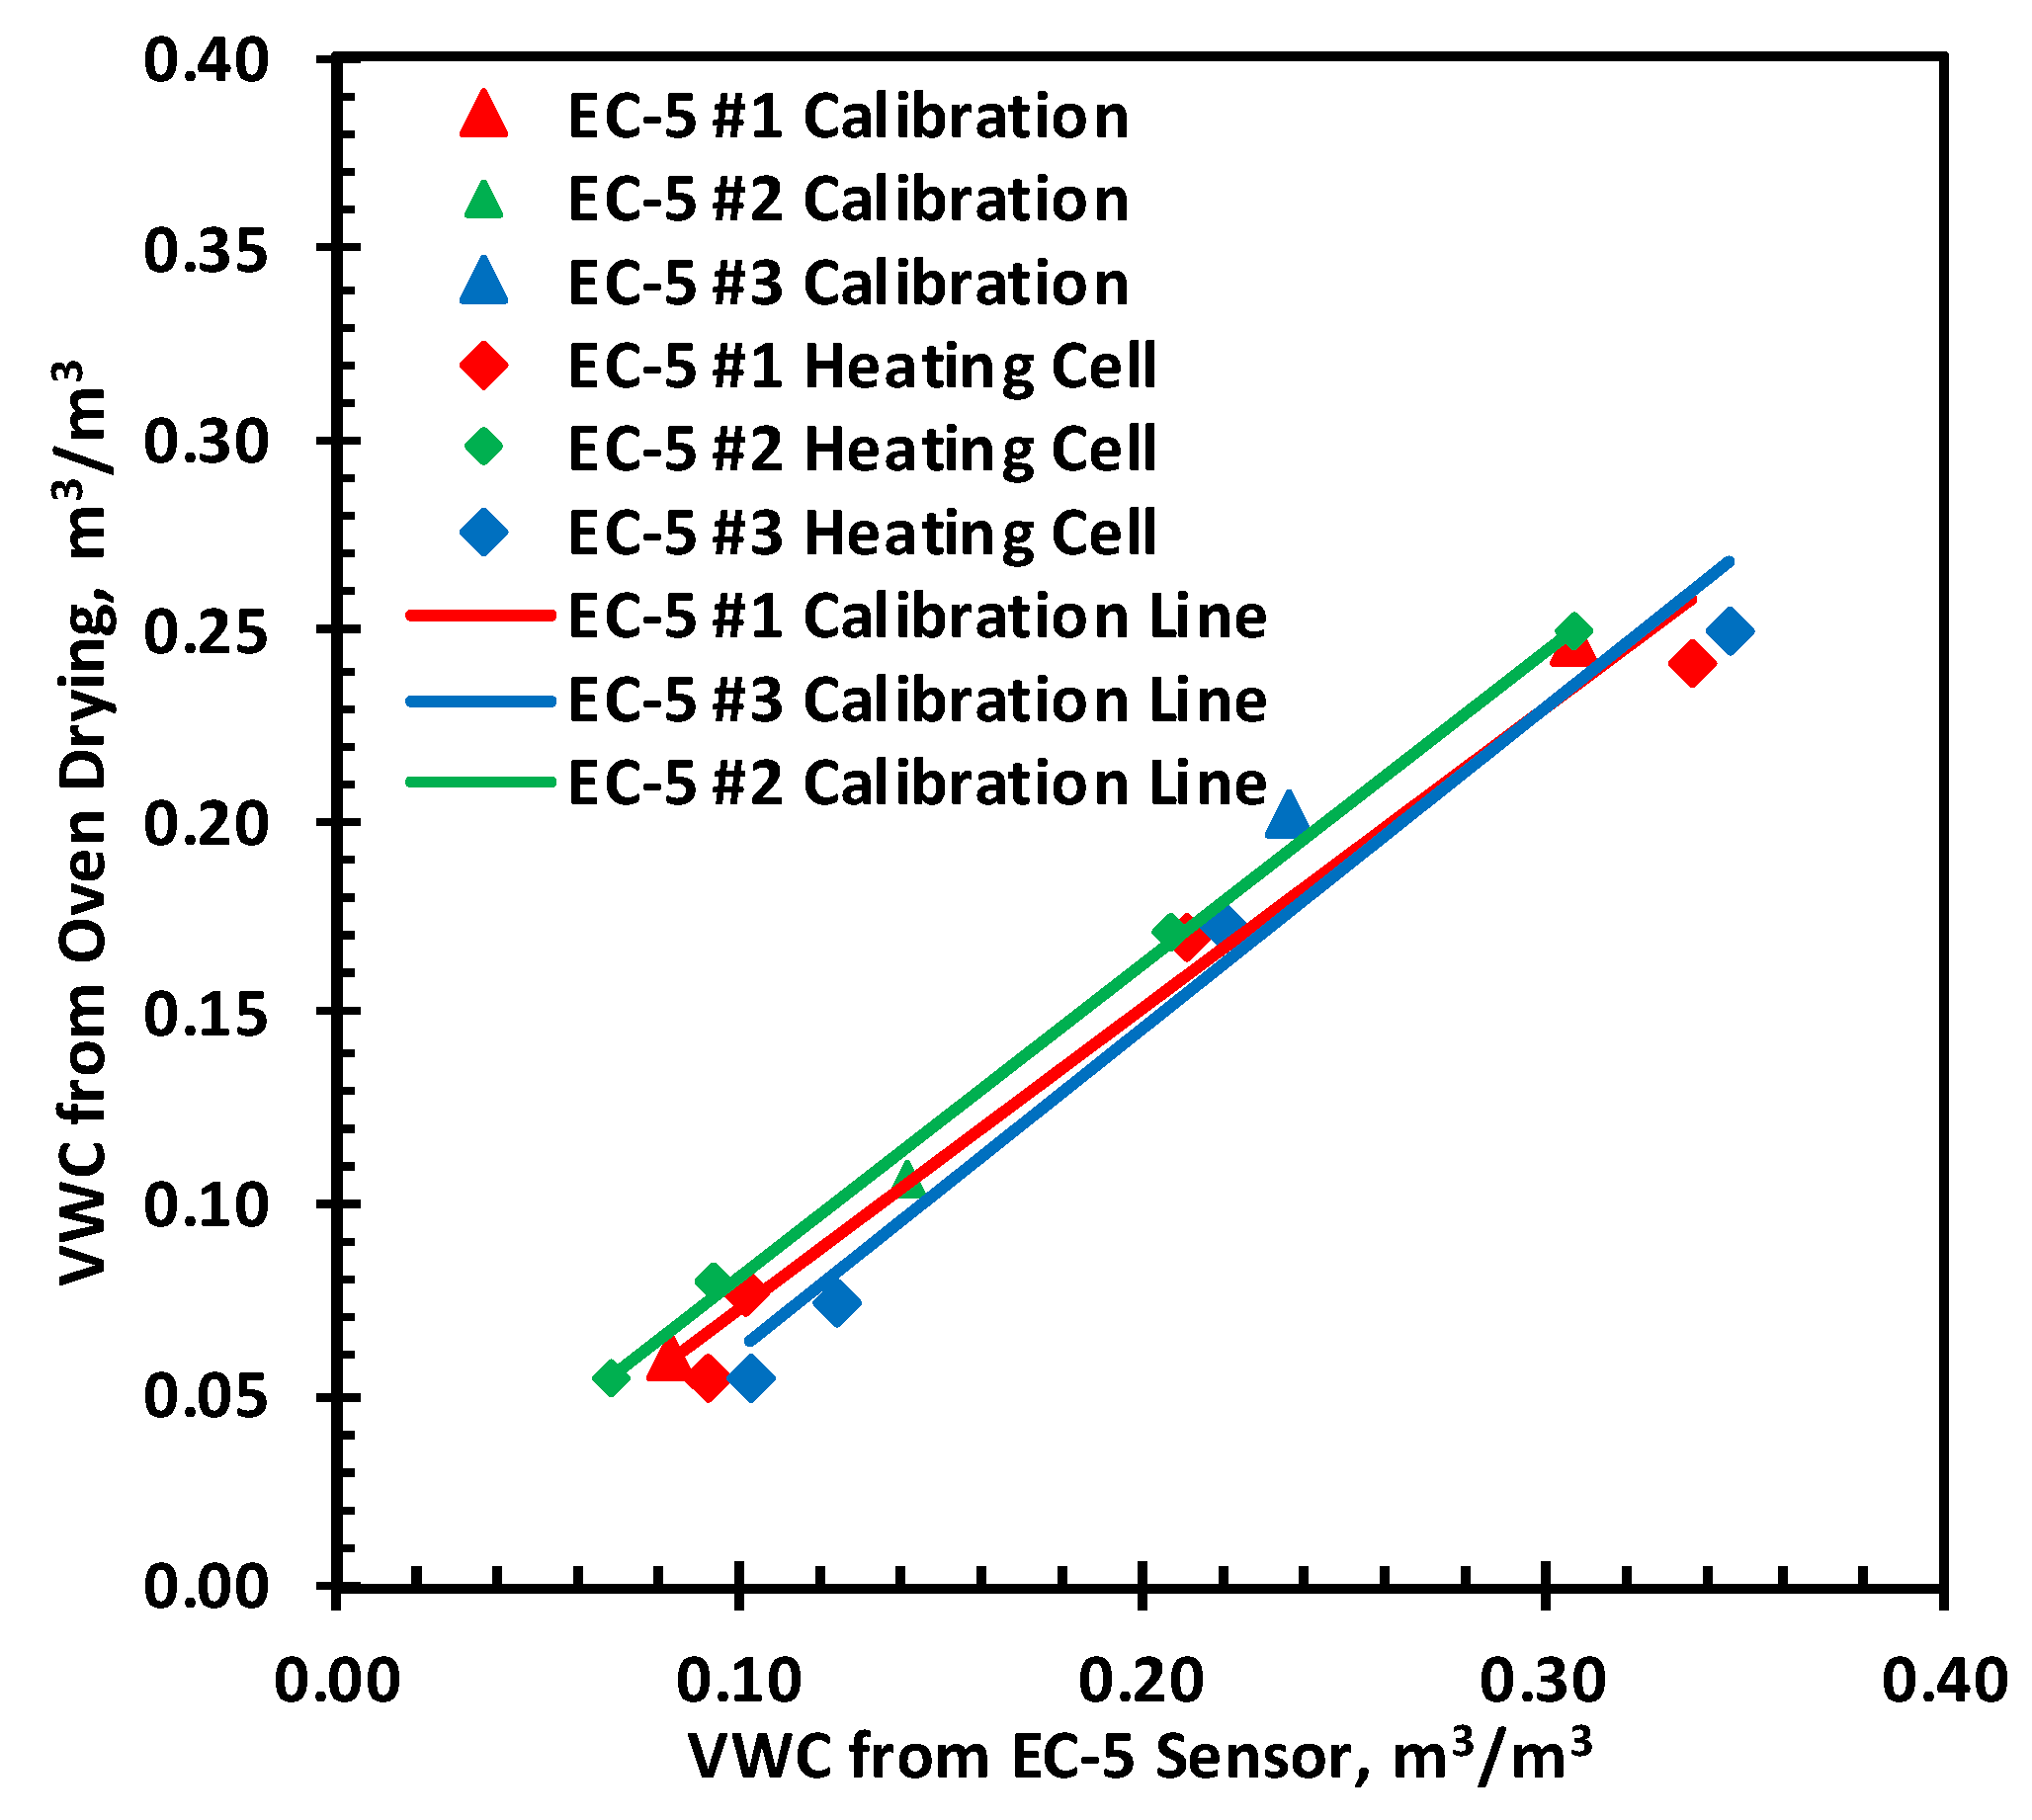
The EC-5 sensors measure the soil dielectric permittivity of the soil, which is affected by mineralogy, texture, density, salinity, moisture content, and soil temperature (Cobos 2013). Sensor-specific calibration needs to be done for accurate soil moisture for sandy soil since the effect of soil properties in EC-5 sensors’ readings is more pronounced (Cobos, 2013; Campbell, 2013). The guidelines provided by Meter Environment have been followed for calibration tests to increase the accuracy of EC-5 sensors to the ±1-2% range. Three EC-5 sensors were calibrated to measure volumetric moisture content at room temperature. Soil samples were prepared at the same target gravimetric water content and dry density to calibrate the EC-5 moisture sensor, which was later used in the heating cell test. The VWC readings from the EC-5 sensor were recorded over an hour at the mean room temperature of 21.69
oC, and the average readings were taken for calibration.
Figure 8 presents the EC-5 sensor average readings vs. the oven-drying moisture content, and
Table 2 explains linear fitting equations for EC-5 VWC correction at room temperature. The calibration equations developed show a close match of EC-5 VWC and correct VWC based on oven drying.
The dielectric permittivity of the soil increases with the increase of soil temperature, resulting in the apparent change of the EC-5 moisture readings (Or 1999). Therefore, the temperature effect on EC-5 was also calibrated using the heat cell. Two heating cell tests were performed to evaluate the effect of temperature on EC-5. In the first heating cell test, the soil was prepared at a VMC of = 0.077 m
3/m
3, and three EC-5 were used to take its moisture readings, as shown in
Figure 1. Two thermocouples were placed in the middle of the soil layers to record the soil temperature. The top and bottom heating plates were supplied with hot water of the same temperature and maintained for at least 6 hours until a steady state temperature was reached. The temperature was increased from 20
oC to 55
oC at an increment of 5
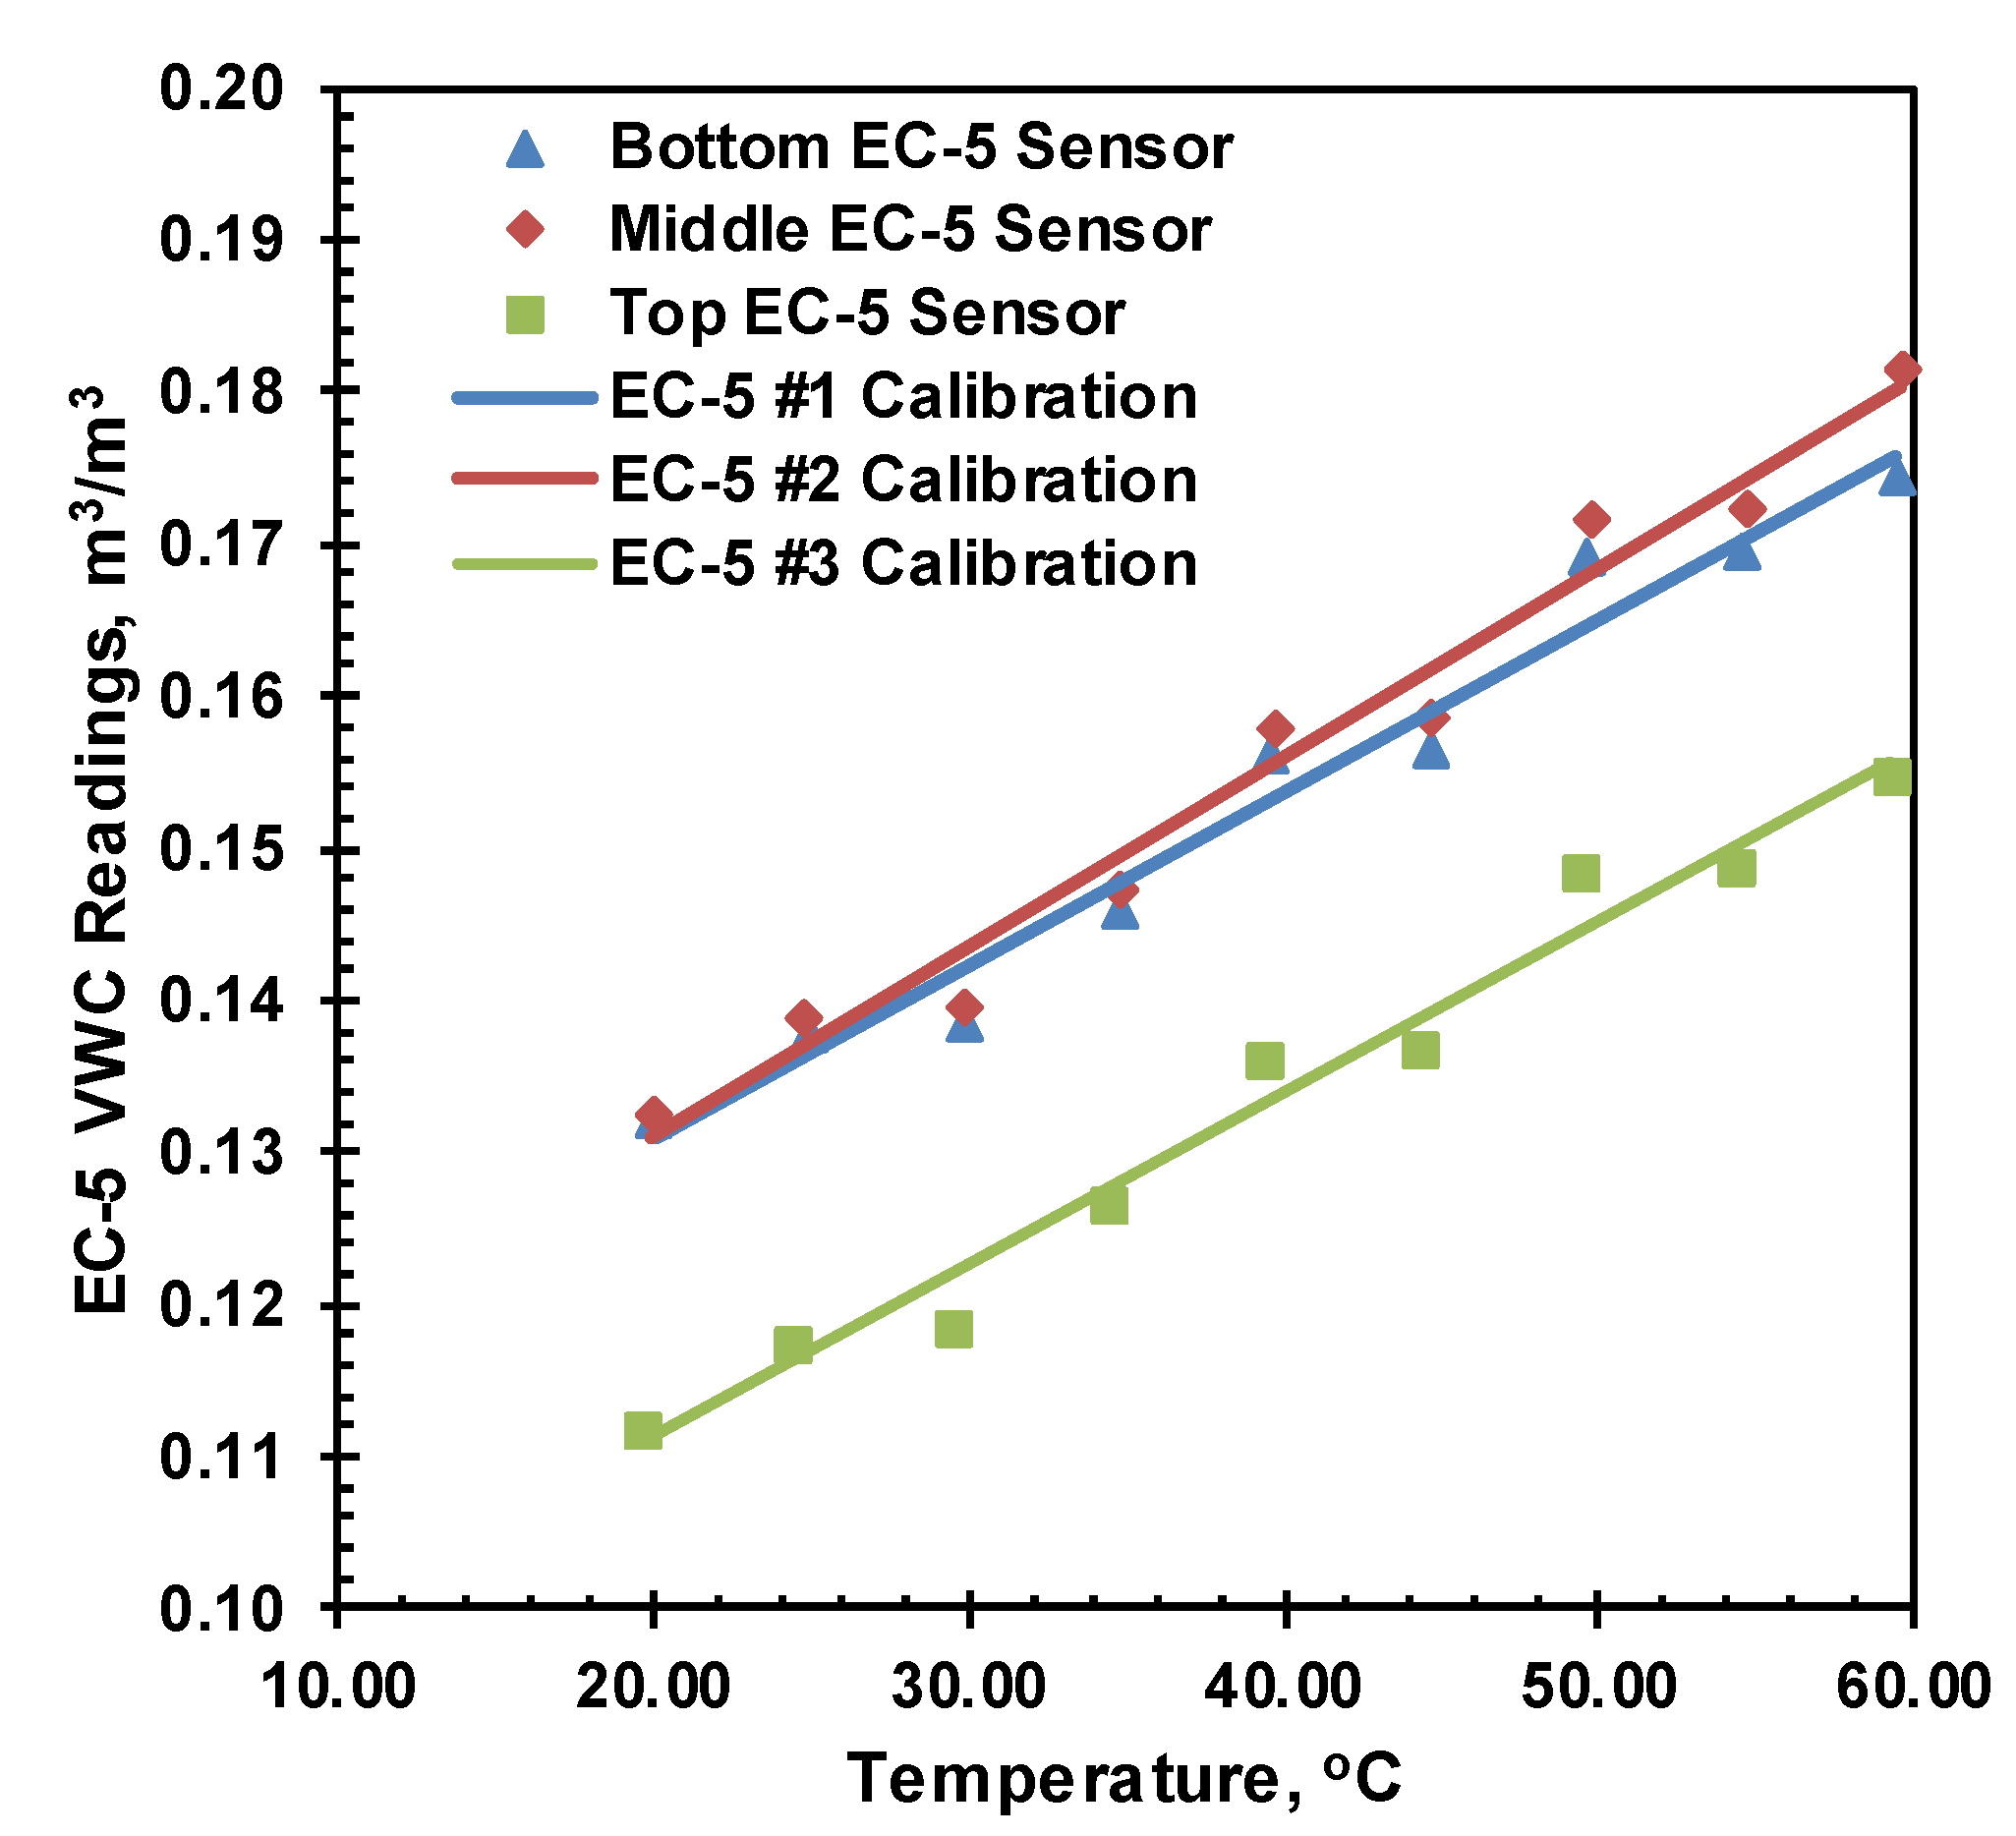
oC. The average temperature and VWC reading over an hour during the steady state were used for the calibration. The first temperature calibration test is shown in
Figure 9, which shows no significant sensor dependency. Therefore, in the second heating cell test, 3 soil layers with different target moisture content (0.055 m
3/m
3, 0.172 m
3/m
3, and 0.249 m
3/m
3) were prepared and separated with a plastic sheet between each layer to calibrate the three sensors simultaneously at different moisture content.
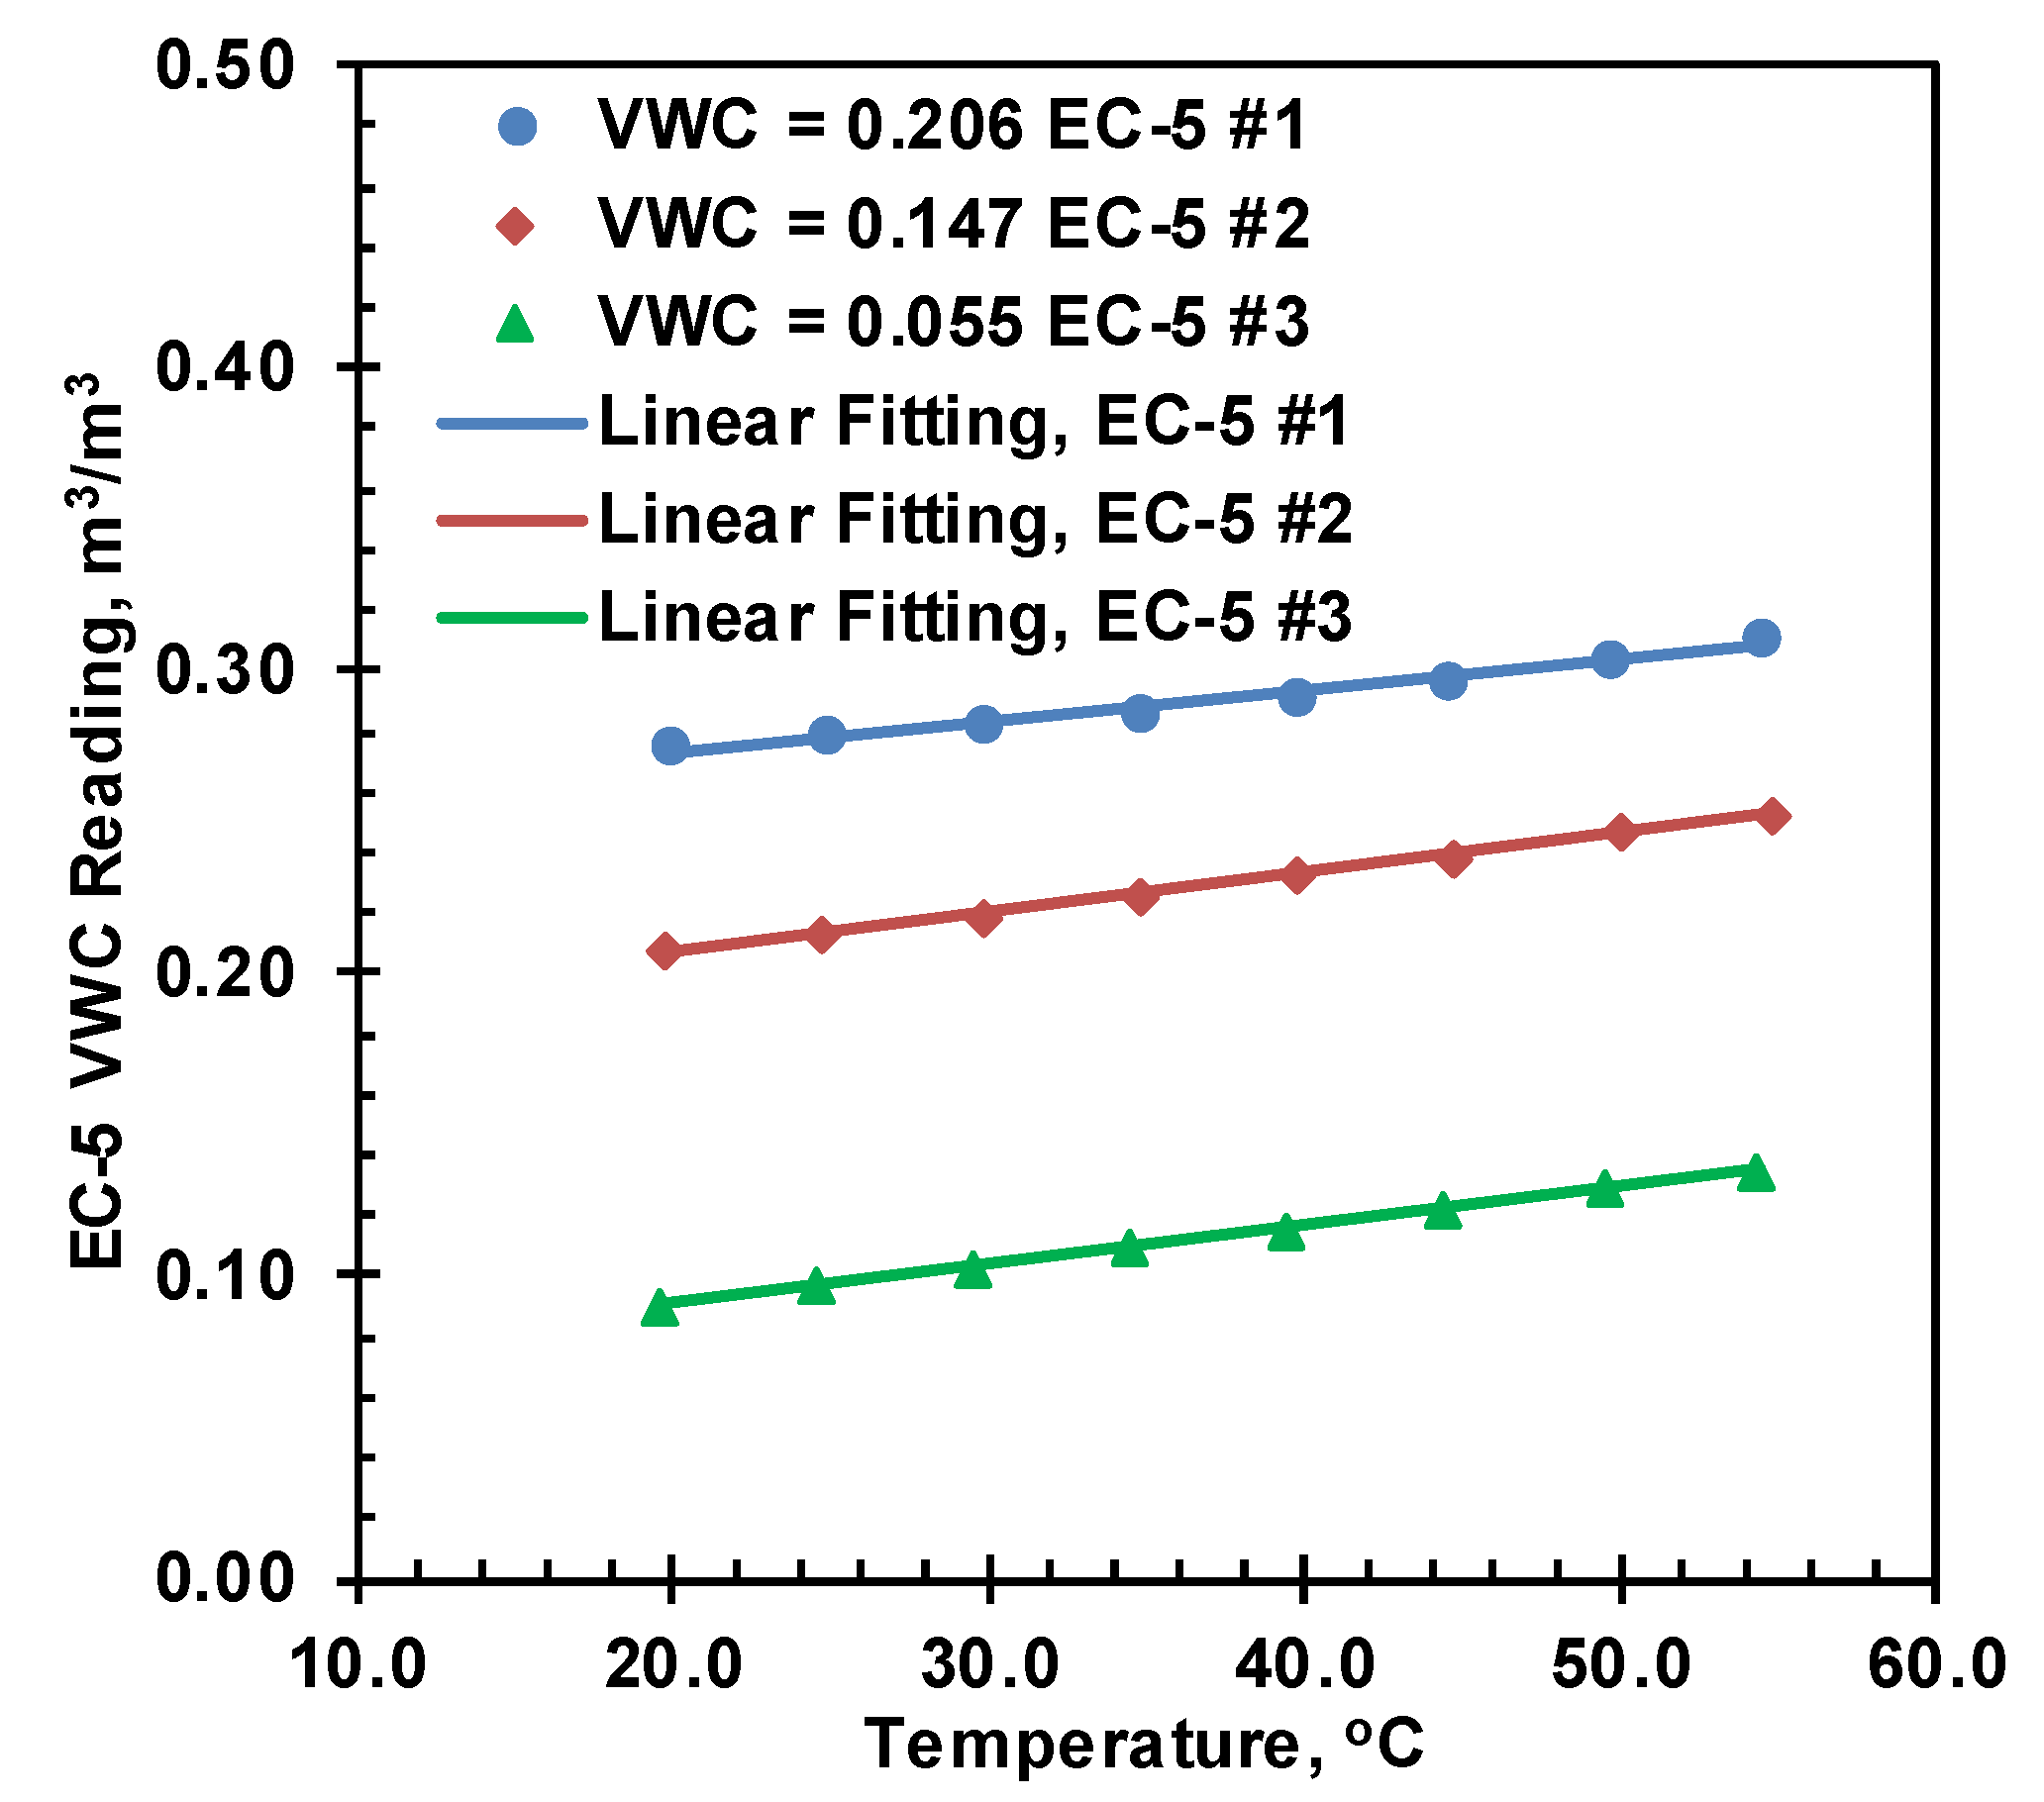
Individual temperature corrections for each sensor at each moisture content were proposed; however, the correction slopes for all EC-5 sensors were very close to each other, and finally, single correction slopes were used for all sensors at a specific moisture content. The temperature calibration chart and table for the same moisture content from different sensors are presented in
Error! Reference source not found.. The calibration results for the remaining volumetric moisture content are presented in
Error! Reference source not found. along with the calibration chart in
Table 3.
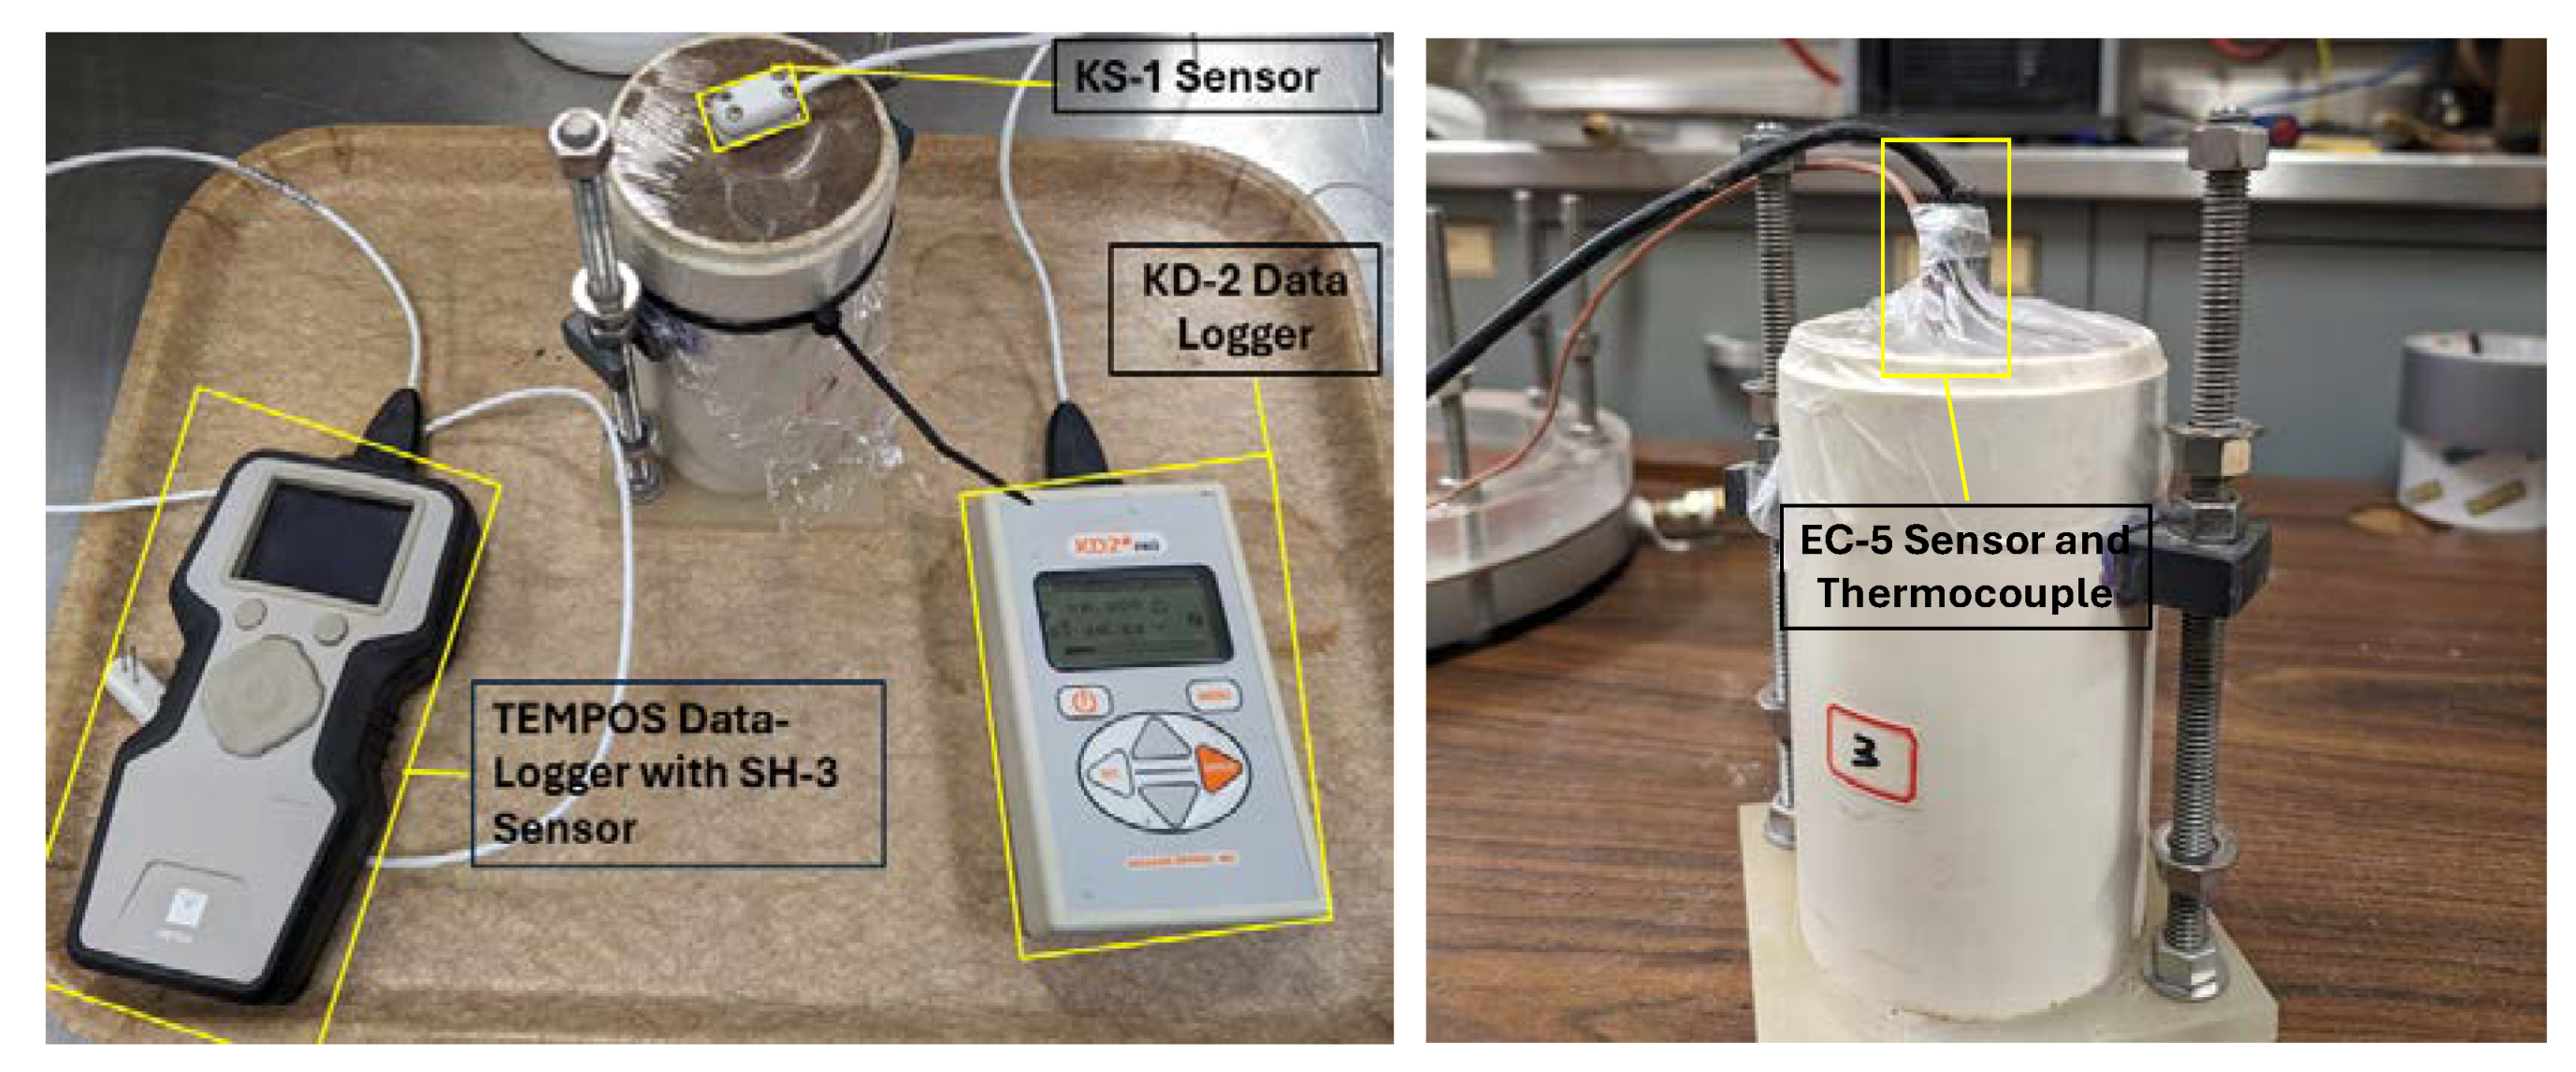
Figure 7.
Setup for Thermal Conductivity (Left) and EC-5 VWC (Right) Measurement at Room Temperature.
Figure 7.
Setup for Thermal Conductivity (Left) and EC-5 VWC (Right) Measurement at Room Temperature.
Figure 8.
VWC Readings for EC-5 Sensor.
Figure 8.
VWC Readings for EC-5 Sensor.
Table 2.
VWC Calibration for Sensors.
Table 2.
VWC Calibration for Sensors.
Sensor
Identification |
Initial VWC Correction Equation |
|
Equation |
| EC-5 #1 |
|
0.9808 |
Eq. 1 |
| EC-5 #2 |
|
0.9992 |
Eq. 2 |
| EC-5 #3 |
|
0.9839 |
Eq. 3 |
Figure 9.
Temperature Correction for EC-5 Sensor for VWC = 0.077 m3/m3, dry density.
Figure 9.
Temperature Correction for EC-5 Sensor for VWC = 0.077 m3/m3, dry density.
Figure 10.
Temperature Correction for VWC 0.055, 0.147 and 0.206.
Figure 10.
Temperature Correction for VWC 0.055, 0.147 and 0.206.
Table 1.
Temperature Dependency of Sensors.
Table 1.
Temperature Dependency of Sensors.
| Initial VWC |
Sensor Identification |
Temperature Correction Equation |
|
Equation |
| 0.055 |
EC-5 #3 |
|
1.0000 |
Eq. 4 |
| 0.077 |
EC-5 #1, 2, 3 |
|
0.9745 |
Eq. 5 |
| 0.147 |
EC-5 #2 |
|
0.9983 |
Eq. 6 |
| 0.206 |
EC-5 #1 |
|
0.9877 |
Eq. 7 |
2.4. Thermal Conductivity of Compacted Soil Samples
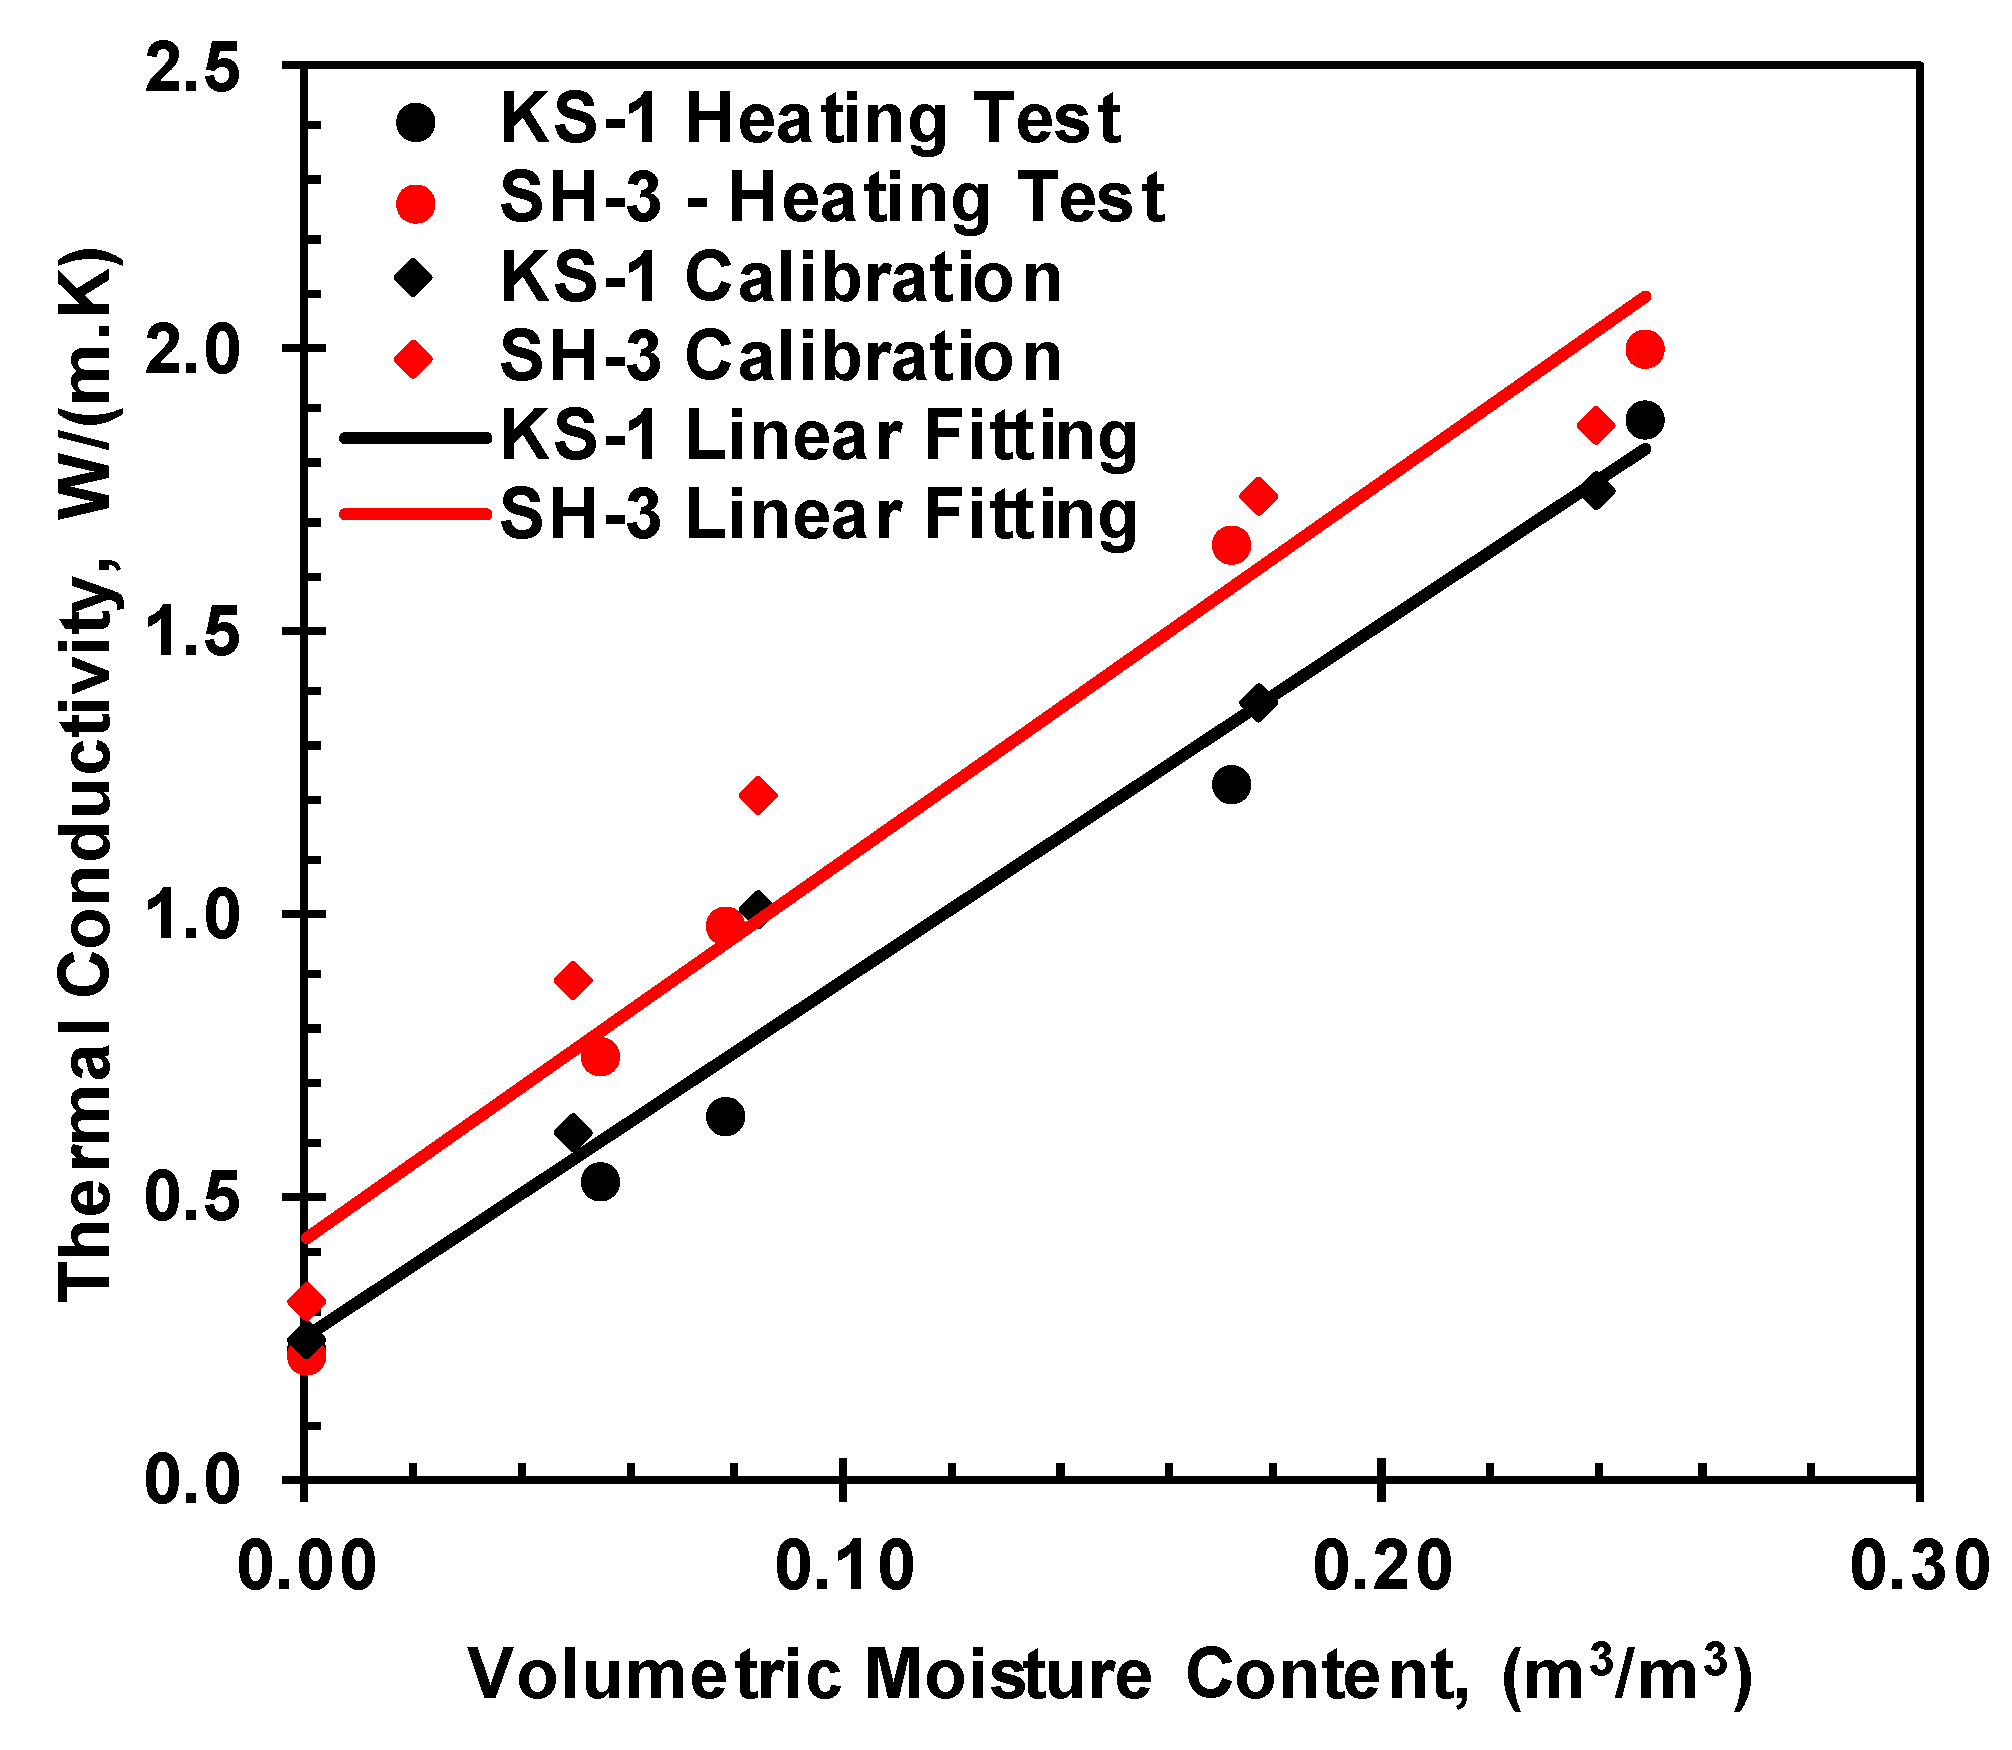
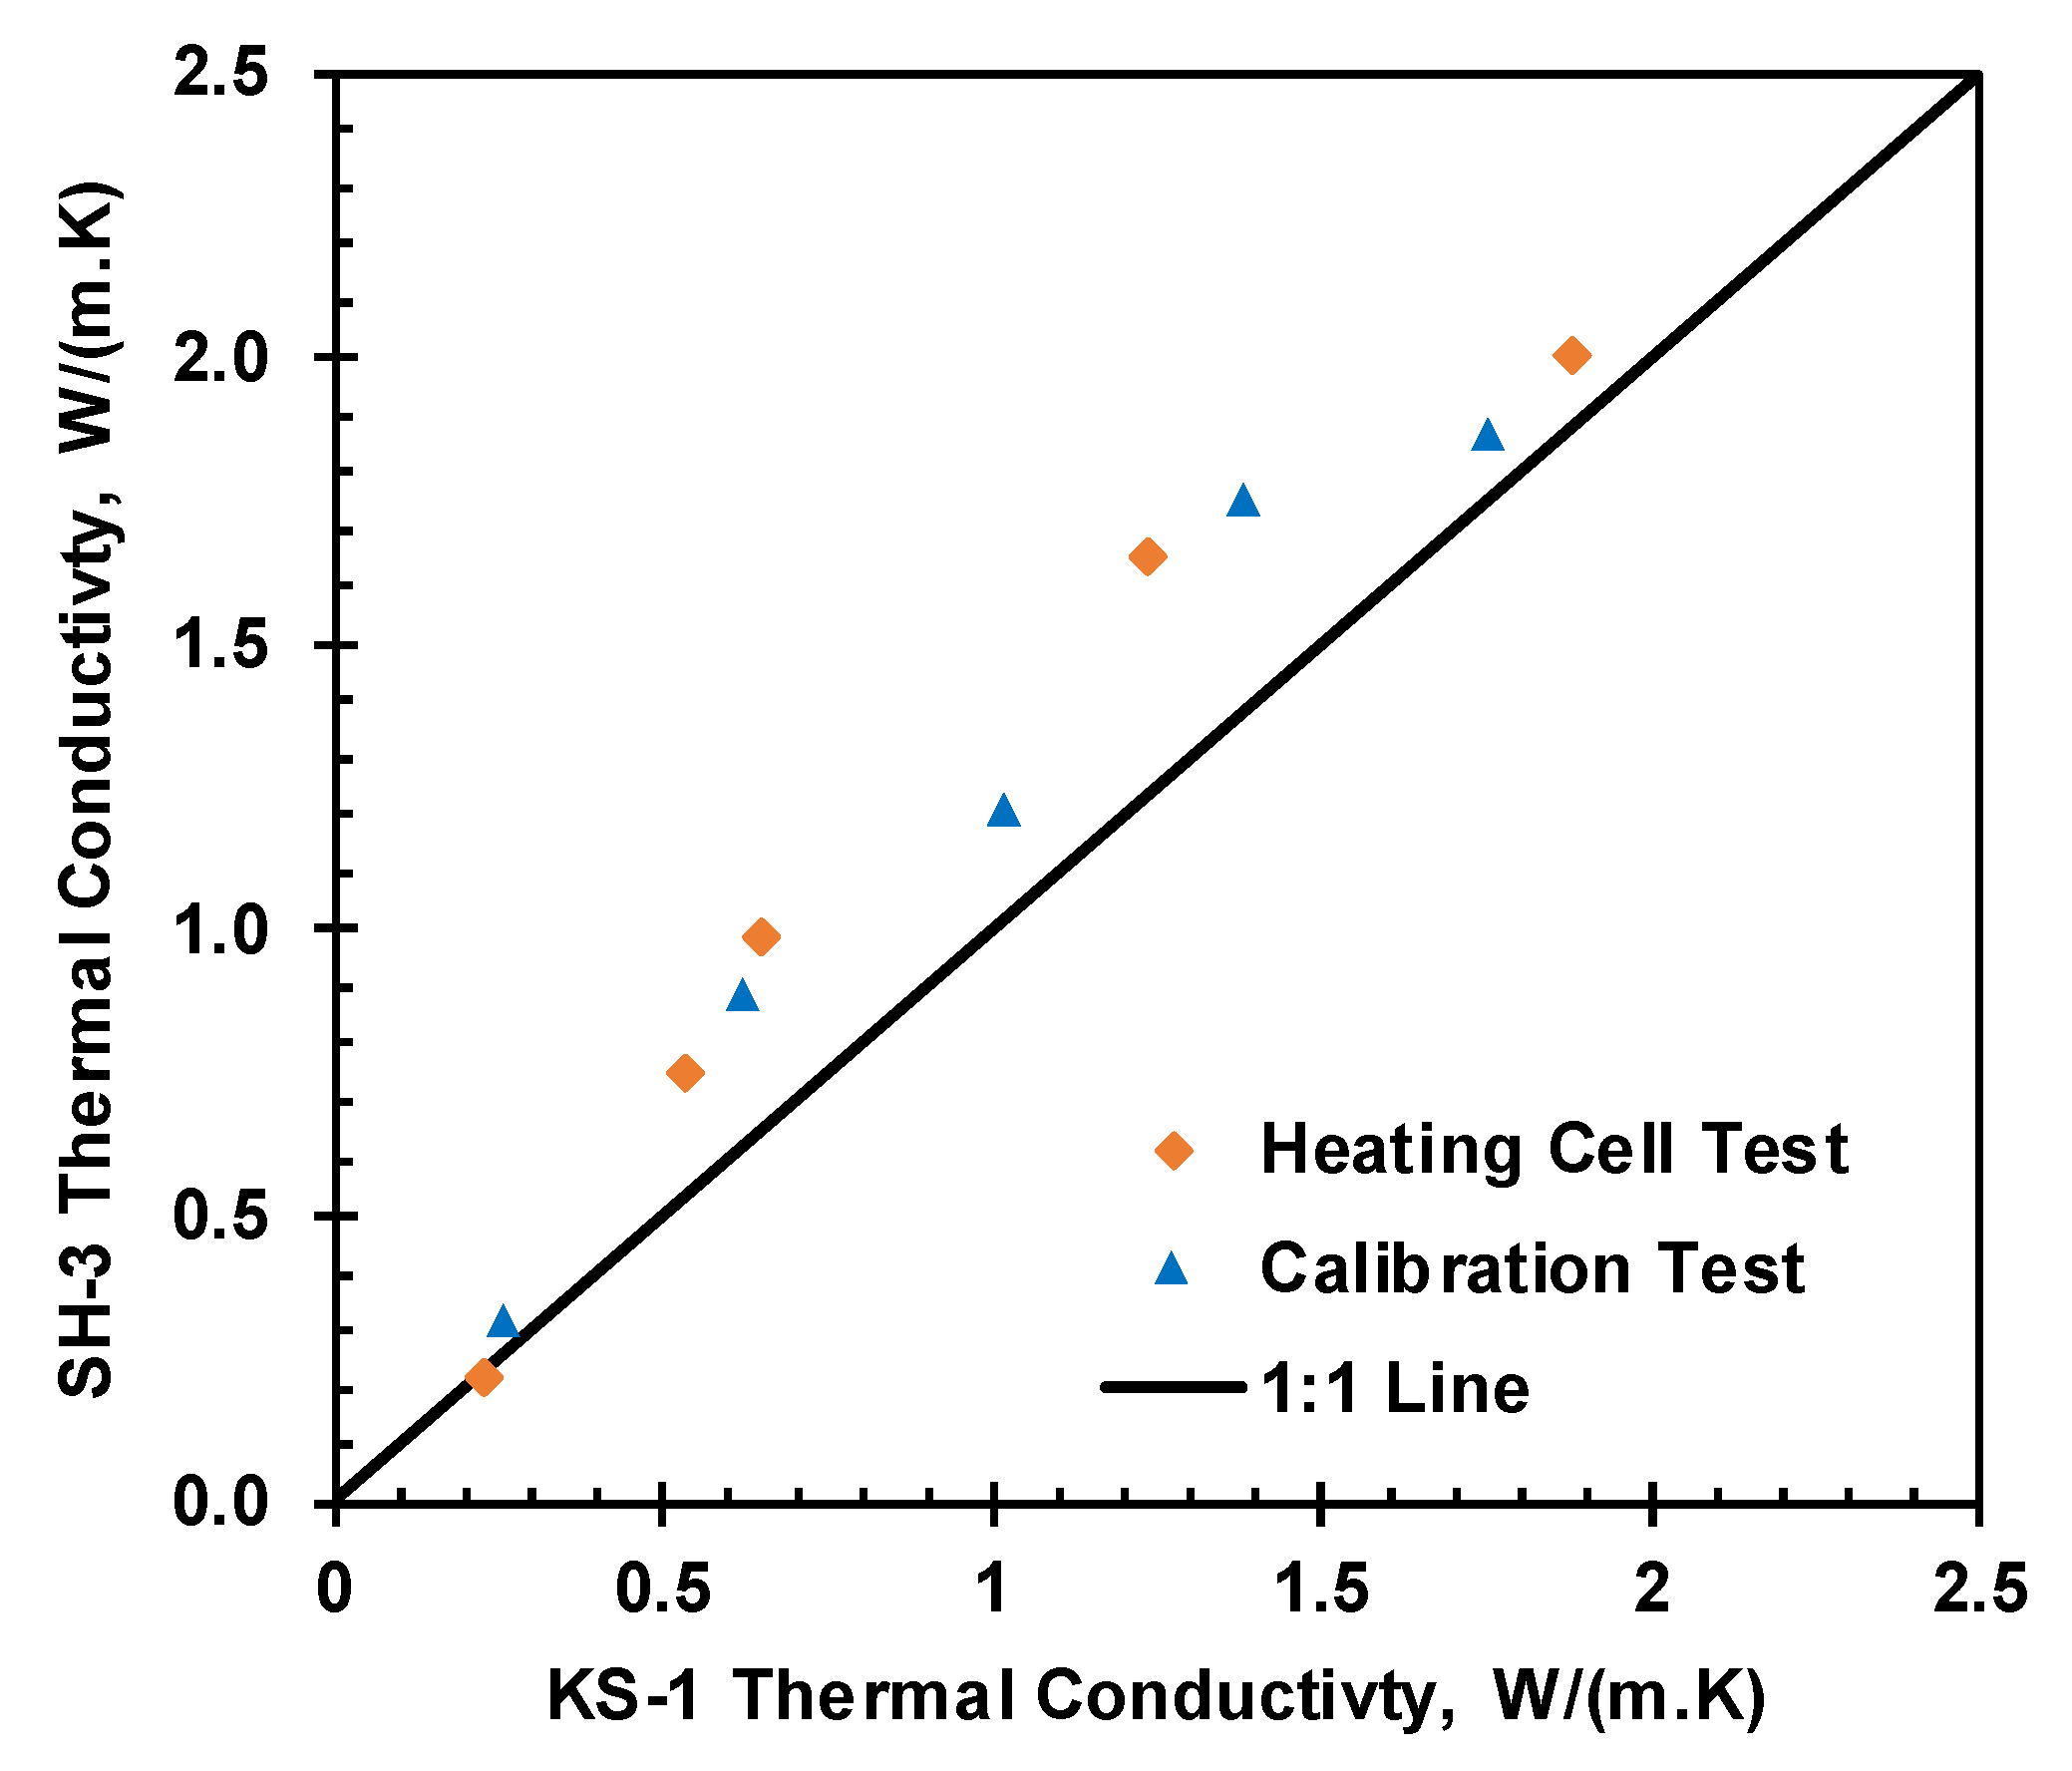
In this study, two thermal conductivity probes, KD-2 Pro (KS-1) and TEMPOS SH-3 were used for thermal conductivity measurement. KS-1 is a single needle sensor with a mean read time of one minute, and SH-3 is a dual-probe sensor with a mean read time of two minutes; however, both sensors have the same thermal conductivity measurement range up to 2.0 W/(m.K). The initial thermal conductivity of the soil was measured with a TEMPOS SH-3 sensor. The KS-1 was used to monitor the thermal conductivity in the heating cell. TEMPOS SH-3 was used for the initial thermal conductivity reading of the heating cell soil before the heating test. A noticeable difference was observed between SH-3 and KS-1 sensors. Therefore, the thermal conductivity of the compacted soil at different moisture was measured by both sensors for comparison.
The thermal conductivity of the soil changes with moisture content (Abu-Hamdeh 2000). A KD-2 Pro (KS-1) was utilized to monitor the thermal conductivity of compacted soil samples at room temperature with varying moisture content and relatively constant dry density. The compacted soil samples were placed in the moisture equilibrium room for more than 12 hours to facilitate further moisture equilibrium before measuring the thermal properties.
Figure 12 represents the variation of thermal conductivity measured for the same soil using KD-2 Pro and TEMPOS sensors, and the 1:1 line represents the line of perfect agreement of both sensors.
Figure 11.
Comparison of the two thermal conductivity sensors.
Figure 11.
Comparison of the two thermal conductivity sensors.
Figure 12.
Thermal conductivity comparison of KS-1 and SH-3 sensor.
Figure 12.
Thermal conductivity comparison of KS-1 and SH-3 sensor.
2.5. Soil Heating Tests
A series of soil heating tests were performed in the heating cell, where the soil was tested under different initial moisture content at the same temperature gradient to measure the change in soil moisture content, temperature profile, and thermal conductivity of the soil. The test chamber’s dual cell design and insulation with fiberglass ensure 1D heat transfer of the tested soil specimen in the inner soil column (Kaneza et al., 2024). Three EC-5 sensors and three thermocouples (TCs) were used to measure water content and temperature variations during the heating process. The testing device, its dimensions, and all its main features are detailed in Kaneza (2020), and the measuring devices are illustrated in
Figure 1.
Moist soil samples with various target moisture content and a constant target dry density were prepared and placed in a moisture room for 24 hours for moisture equilibrium. A constant target dry density of 1.6 g/cm was selected to represent about 86% percent of compaction, which can be achieved at all selected moisture content levels. The prepared moist soil sample was compacted in 4 layers, with each layer thickness of 2.54 cm, for sensor installation and uniform compaction. Proper care was taken to compact the soil around the sensors to achieve uniform compaction without damaging the sensors. Five soil samples, including dry soil with a consistent dry density, were prepared, whose geotechnical and thermal properties are presented in
Table 3. The compacted soil sample in the heating cell set-up was kept at room temperature for 24 hours to facilitate further moisture equilibrium. The temperature-controlled water baths were then started with the temperature of the top and bottom heating plates set to 60
oC and 20
oC, respectively. The volumetric moisture, temperature, thermal conductivity, and heat flux readings were recorded during the heating test until the moisture equilibrium. Two types of steady-state were encountered during the heating test: temperature equilibrium and moisture equilibrium. The test was terminated when the soil sample reached the later equilibrium.
Table 3.
1D Heating Test of the Silty Sand in the Heating Cell.
Table 3.
1D Heating Test of the Silty Sand in the Heating Cell.
| Soil |
|
|
measured
|
woven
|
ρd
|
S |
λ (SH-3) |
| (m3/m3) |
(%) |
(m3/m3) |
(%) |
g/cm3
|
(%) |
W/(m.K) |
| SM_0 |
0.00 |
0.00 |
0.000 |
0.00 |
1.555 |
0.00 |
0.220 |
| SM_3.5 |
0.056 |
3.50 |
0.055 |
3.51 |
1.549 |
13.02 |
0.752 |
| SM_4.5 |
0.080 |
5.00 |
0.078 |
4.69 |
1.655 |
20.51 |
0.984 |
| SM_10.5 |
0.160 |
10.00 |
0.172 |
10.51 |
1.634 |
44.52 |
1.732 |
| SM_15 |
0.240 |
15.00 |
0.249 |
15.05 |
1.654 |
65.82 |
2.007 |
3. Results and Discussions
3.1. Heat Transfer
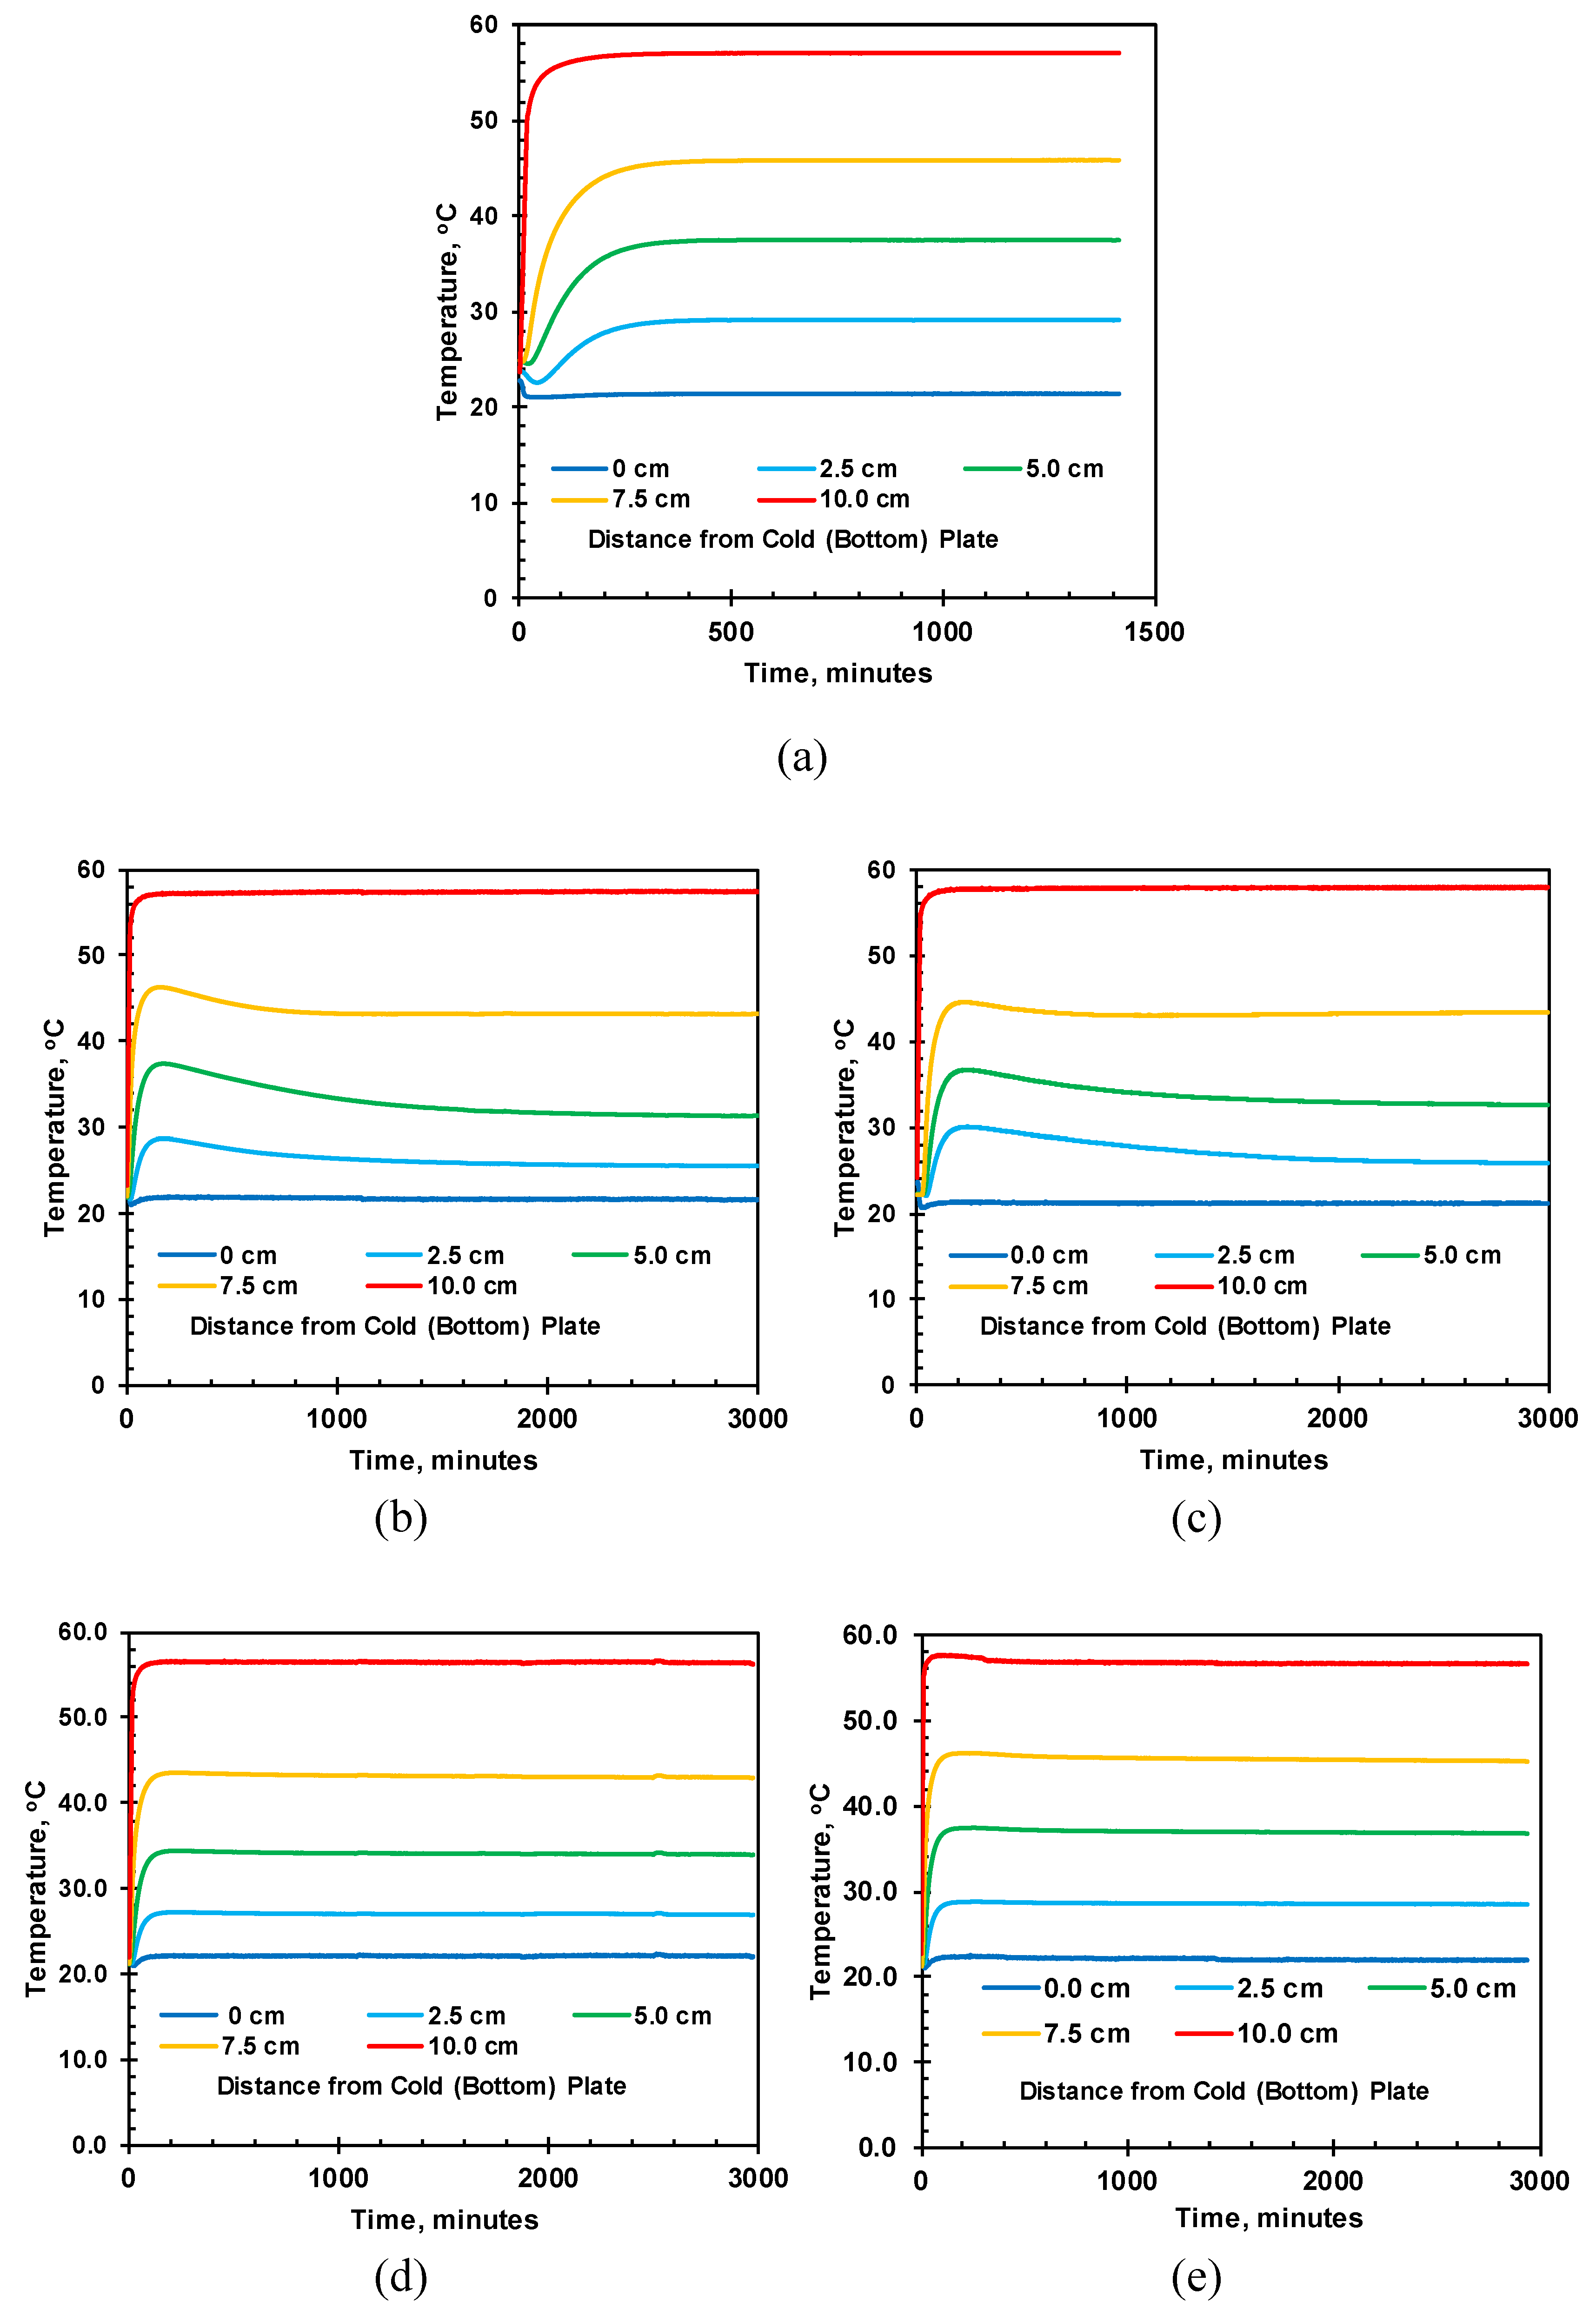
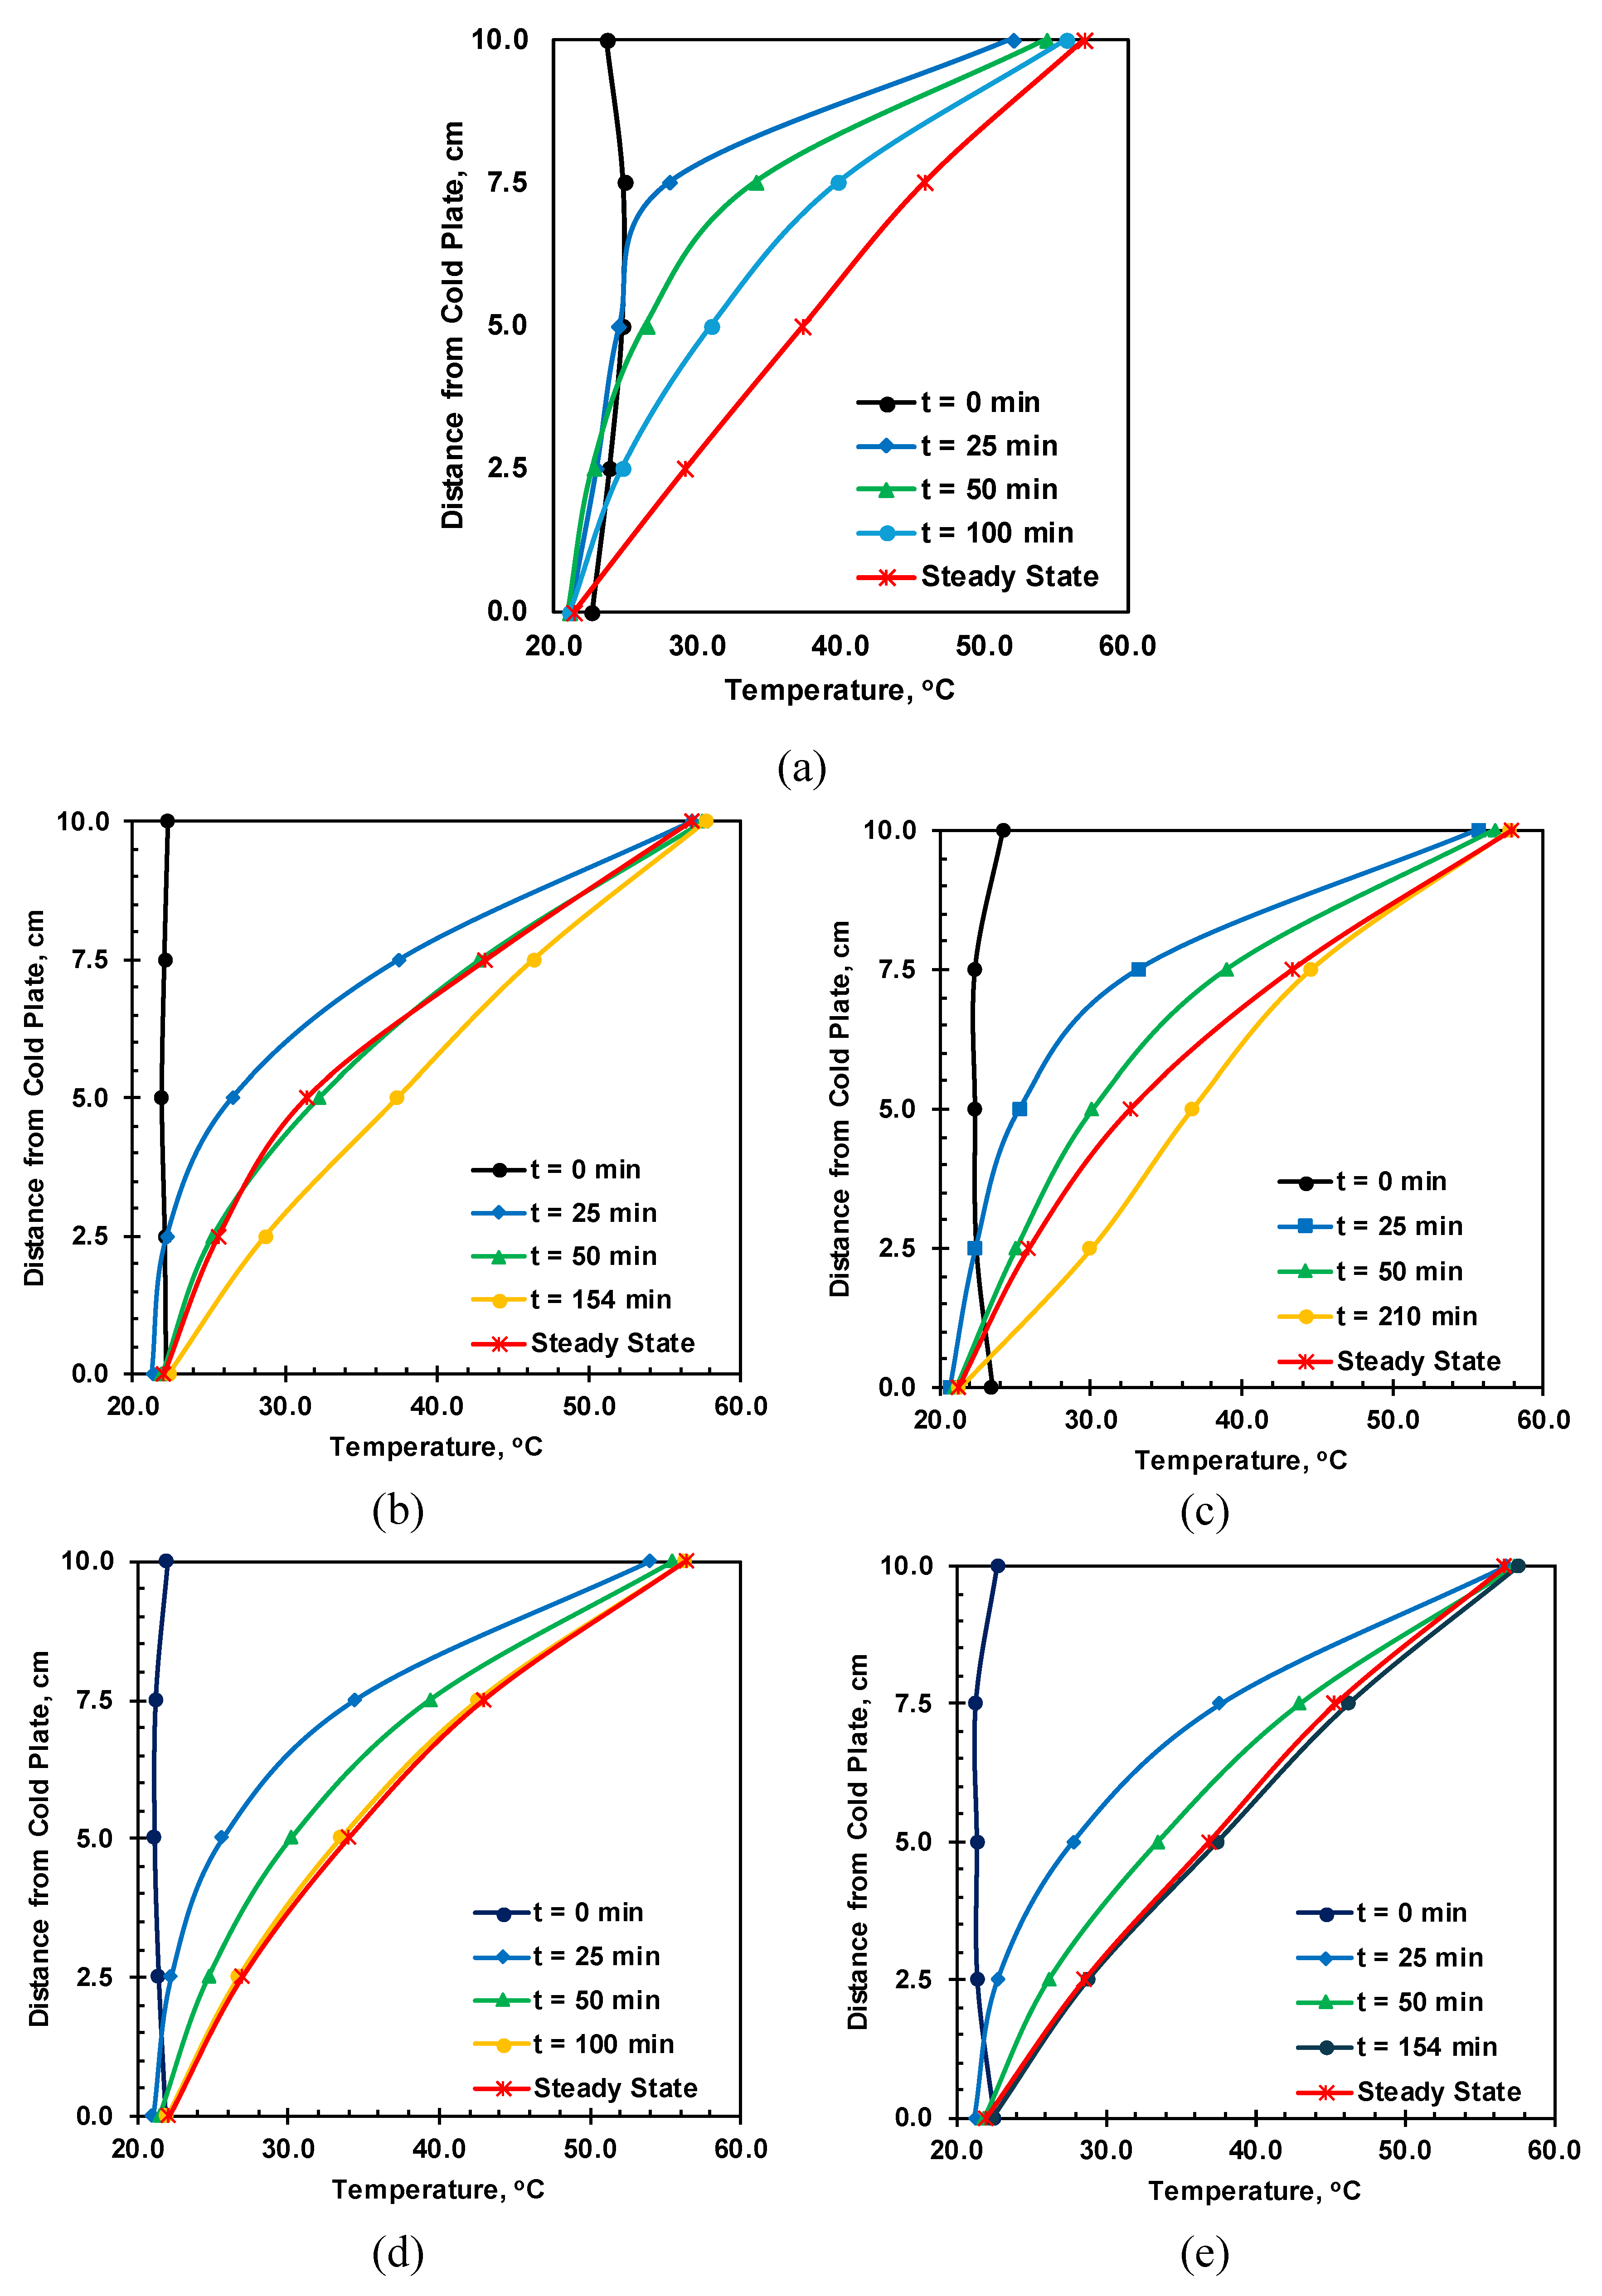
The recorded temperature variations for specimens of different moisture content are shown in
Error! Reference source not found. where (a), (b), (c), (d), and (e) represent the soil with initial volumetric moisture of 0.000, 0.055, 0.078, 0.172, and 0.249 m
3/m
3, respectively. The temperature at the hot end is slightly less than 60
oC, and the cold plate is slightly higher than 20
oC, which can be attributed to the temperature loss from top and bottom copper plates and imperfect contact between the copper plates and soil column. For all moisture content, the temperature reached equilibrium after 1500 minutes. The temperature readings of 0.055 m
3/m
3, and 0.078 m
3/m
3 showed a higher peak, slowly decreasing before reaching thermal equilibrium. The decrease in temperature after the peak is caused by moisture migration induced by the temperature gradient for all moisture soils. However, for the initial volumetric moisture of 0.172 m
3/m
3 and 0.249 m
3/m
3, no significant peak was observed during the heating test, which can be correlated to lower moisture migration.
Figure 14 presents the temperature profile at different time steps, including the steady state. The steady-state temperature profile of the dry soil is almost linear, whereas the soil samples with moisture content show concavity in the temperature profile. A linear temperature profile at 1D heat transfer means uniform thermal properties of the soil. On the contrary, a concaved temperature profile indicates variations of thermal conductivity along the temperature gradient.
Figure 13.
Temperature variations with time for (a) VWC = 0.000 (b) VWC = 0.055 (c) VWC = 0.078 (d) VWC = 0.172 (e) VWC = 0.249 m3/m3.
Figure 13.
Temperature variations with time for (a) VWC = 0.000 (b) VWC = 0.055 (c) VWC = 0.078 (d) VWC = 0.172 (e) VWC = 0.249 m3/m3.
3.2. Moisture Movement
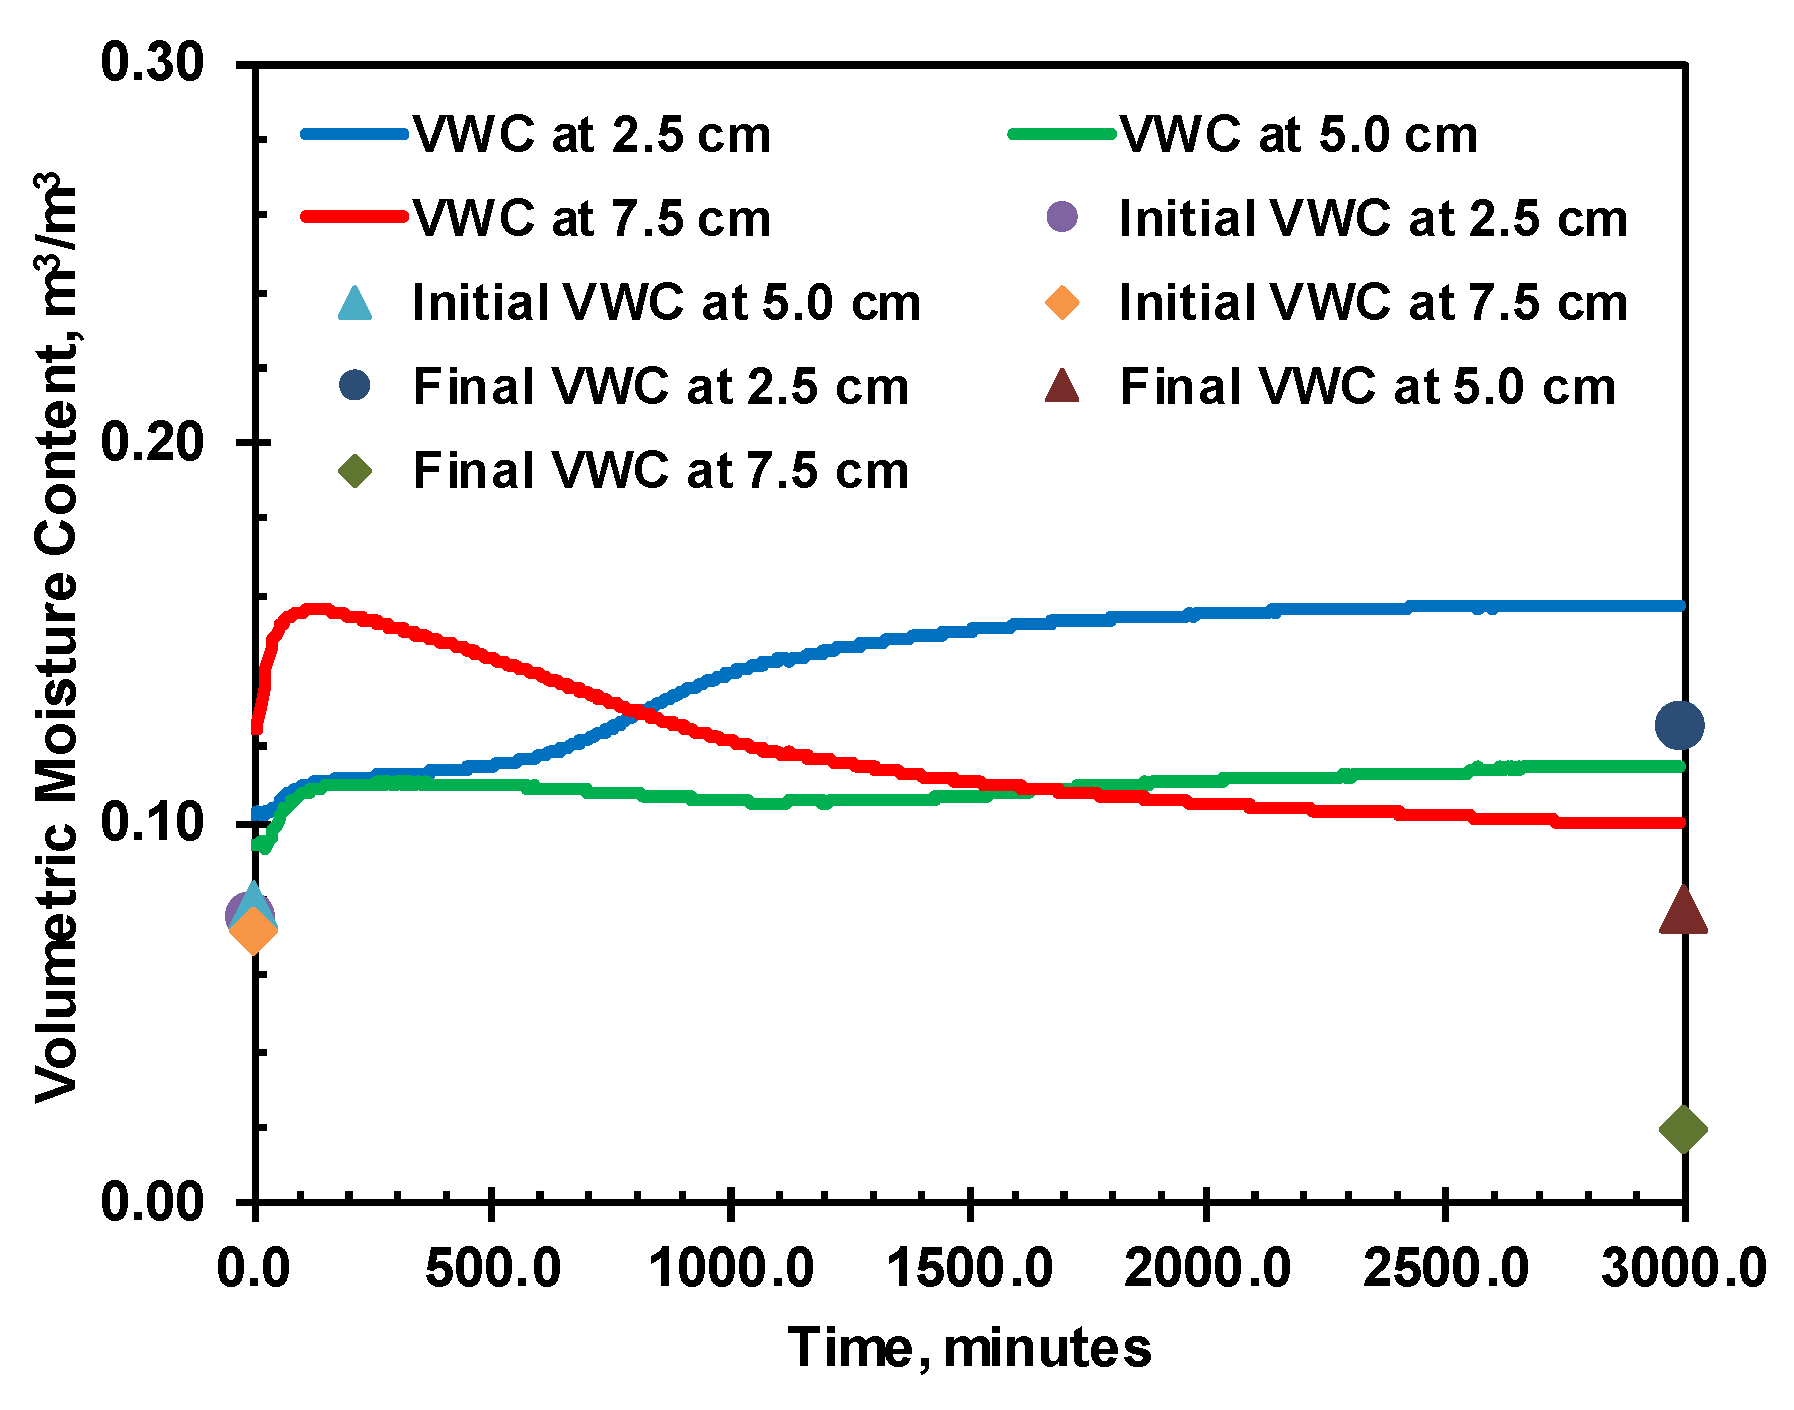
The raw EC-5 moisture reading in the heating cell test for the initial moisture content of 0.078 m
3/m
3 is presented in
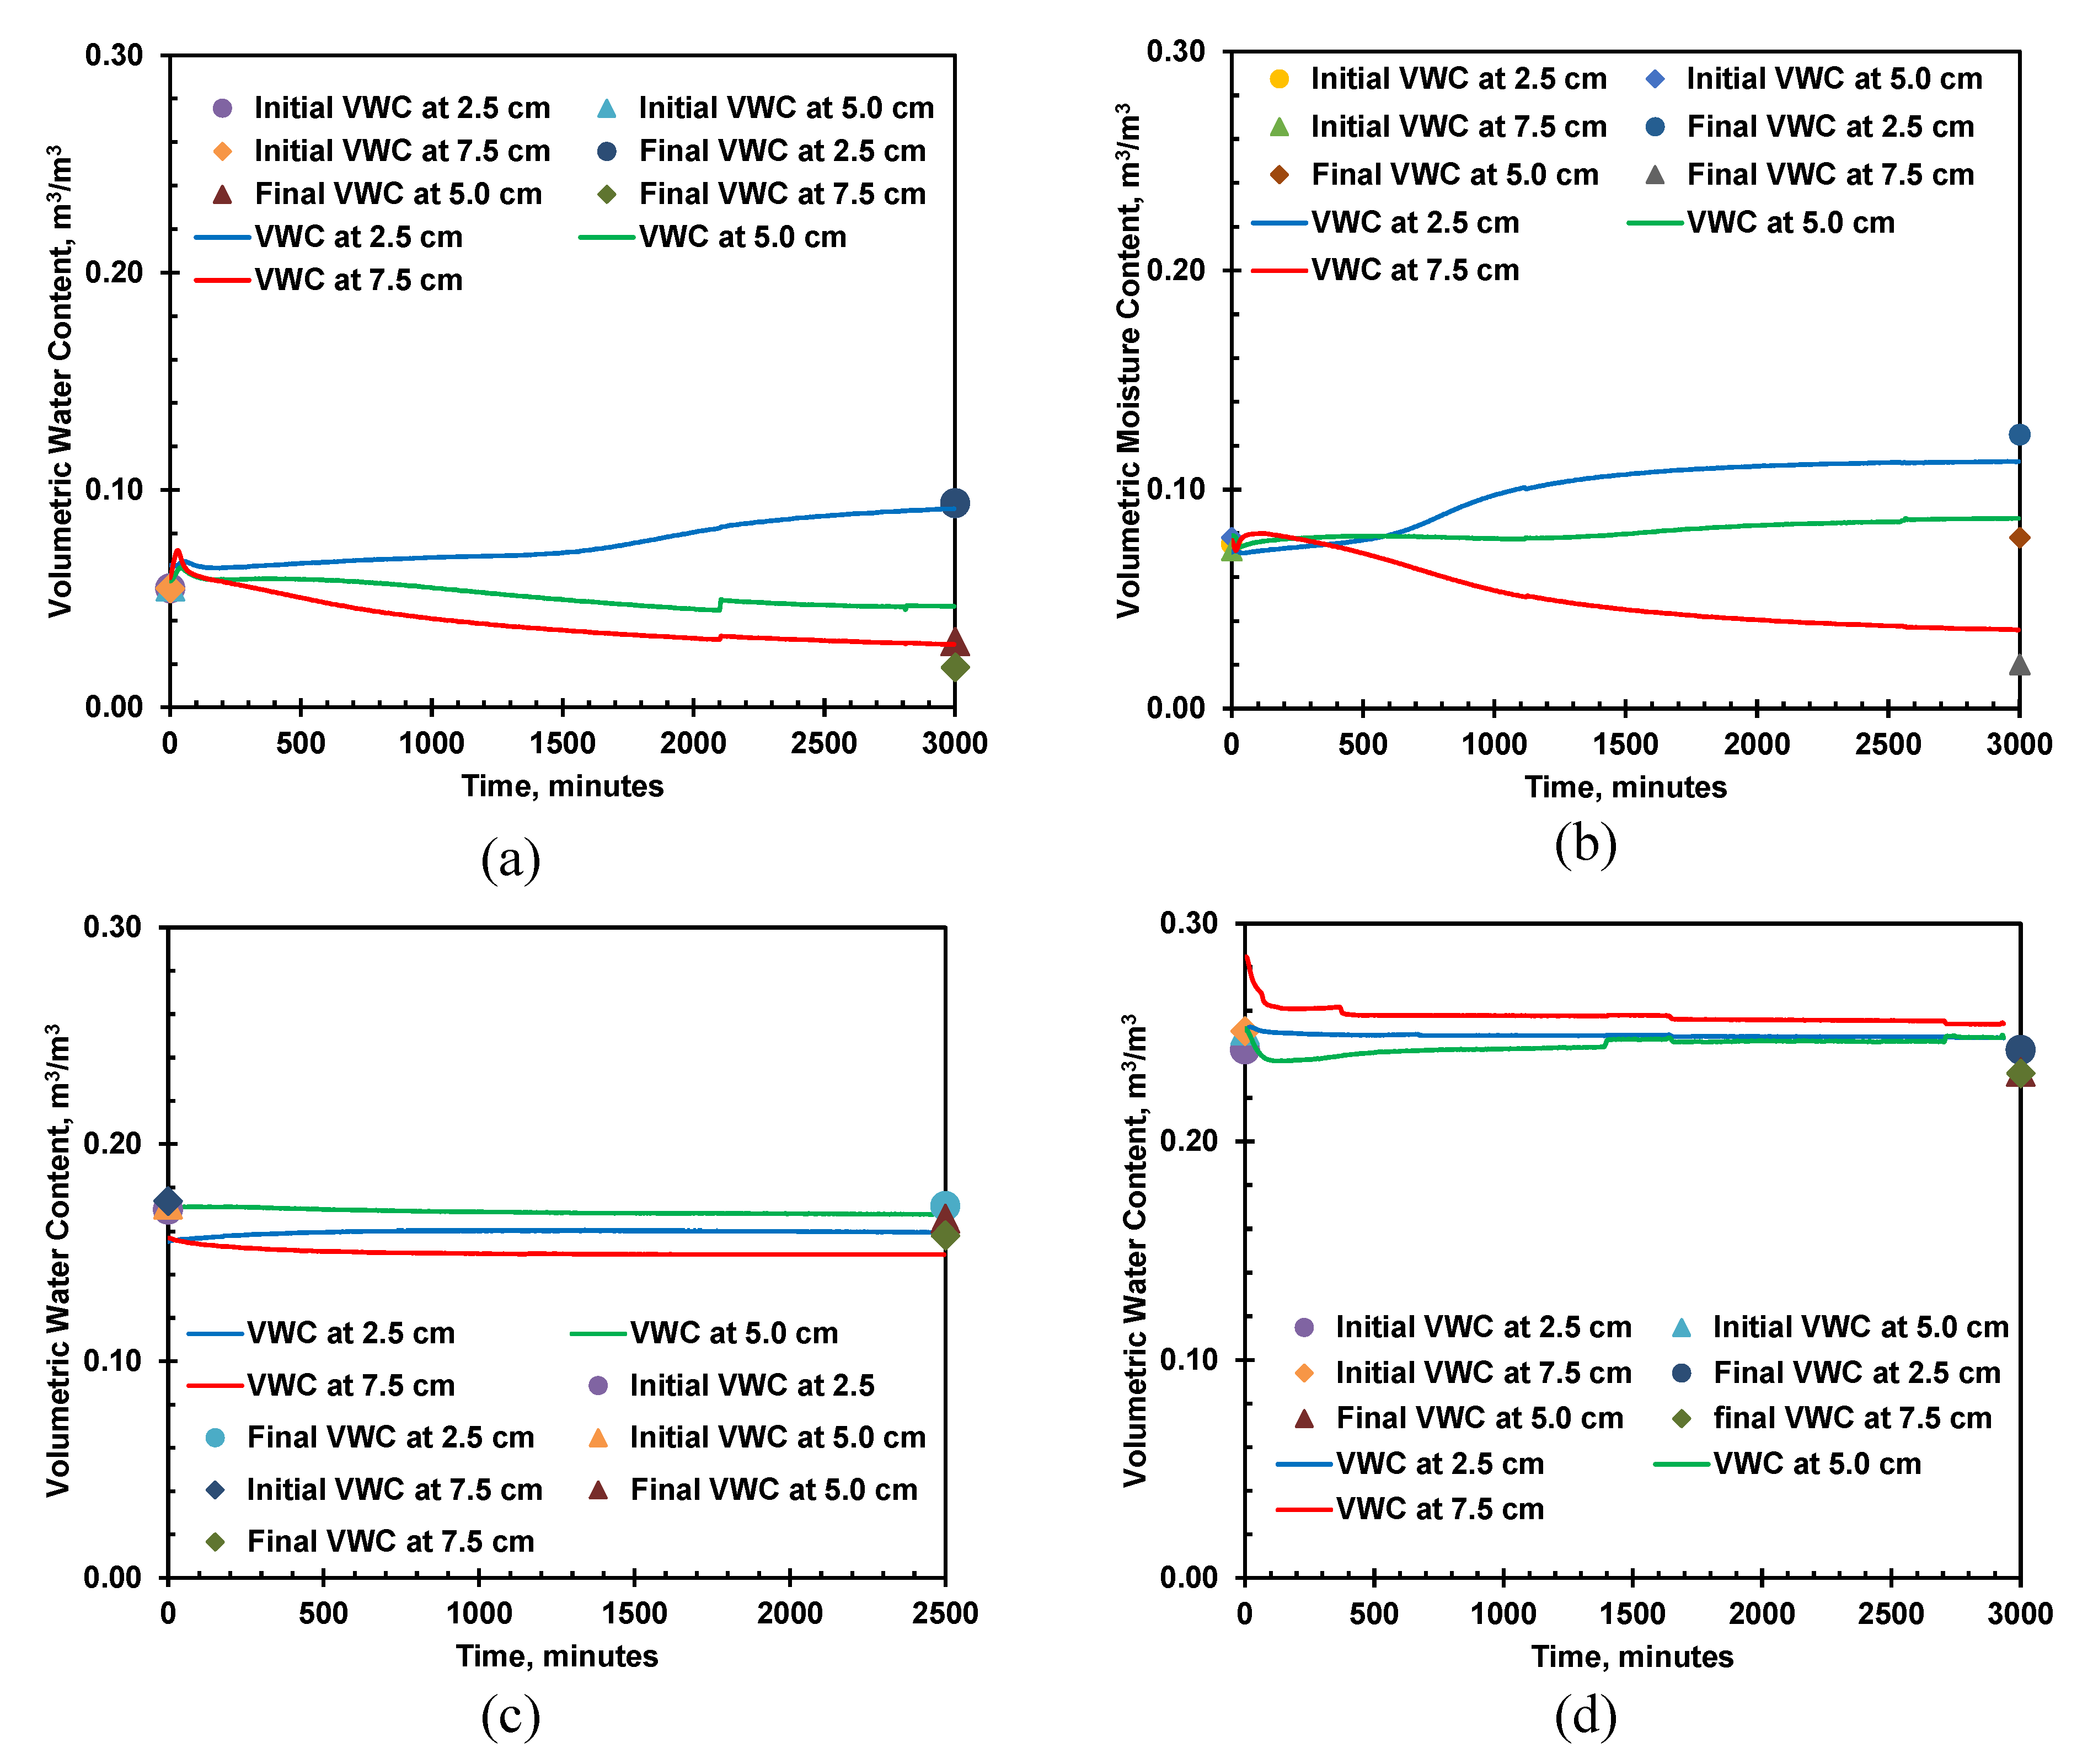
Figure 15 as an example for all the tested specimens. The initial and final moisture content at different cross-sections of the soil column represents the equivalent volumetric moisture content measured by the oven-drying method. The sharp rise in EC-5 VWC readings at the initial stage directly corresponds to the thermal effect on the EC-5 moisture readings. Thus, the VWC readings were first corrected for temperature based on the raw reading and temperature measured by the thermocouple using Eq. 5 for 0.078 m
3/m
3. After the temperature correction, the moisture rise before the peak was close to zero, indicating the temperature effect was correct and nearly no moisture movement during this initial heating stage. Secondly, the temperature-corrected moisture content was corrected for oven-drying moisture content measured before and after the heating cell tests, using correction Eqs 1, 2, and 3, depending on the sensor identification. The corrected VWC during the heating cell test is in
Figure 16 b, where the corrected VWC closely matches the final moisture taken from oven-drying. Similar moisture correction steps were applied to the moisture content data for soils of other moisture content, and the corrected readings along with initial and final oven-drying VWC are presented in
Figure 16.
The moisture variations in the soil column during the heating cell test for all the tested specimens are shown in
Figure 16, which portrays the moisture migration during the heating cell test for initial volumetric moisture content of 0.055, 0.078, 0.172, and 0.249 m
3/m
3 in (a), (b), (c), and (d), respectively. The graph represents the movement of pore water from the heat source, the hot plate, toward the sink, the cold plate. The initial and final volumetric moisture content at different layers based on the oven-drying method is also presented in the graph. The corrected volumetric moisture content closely matches the volumetric moisture reading from the EC-5 sensor.
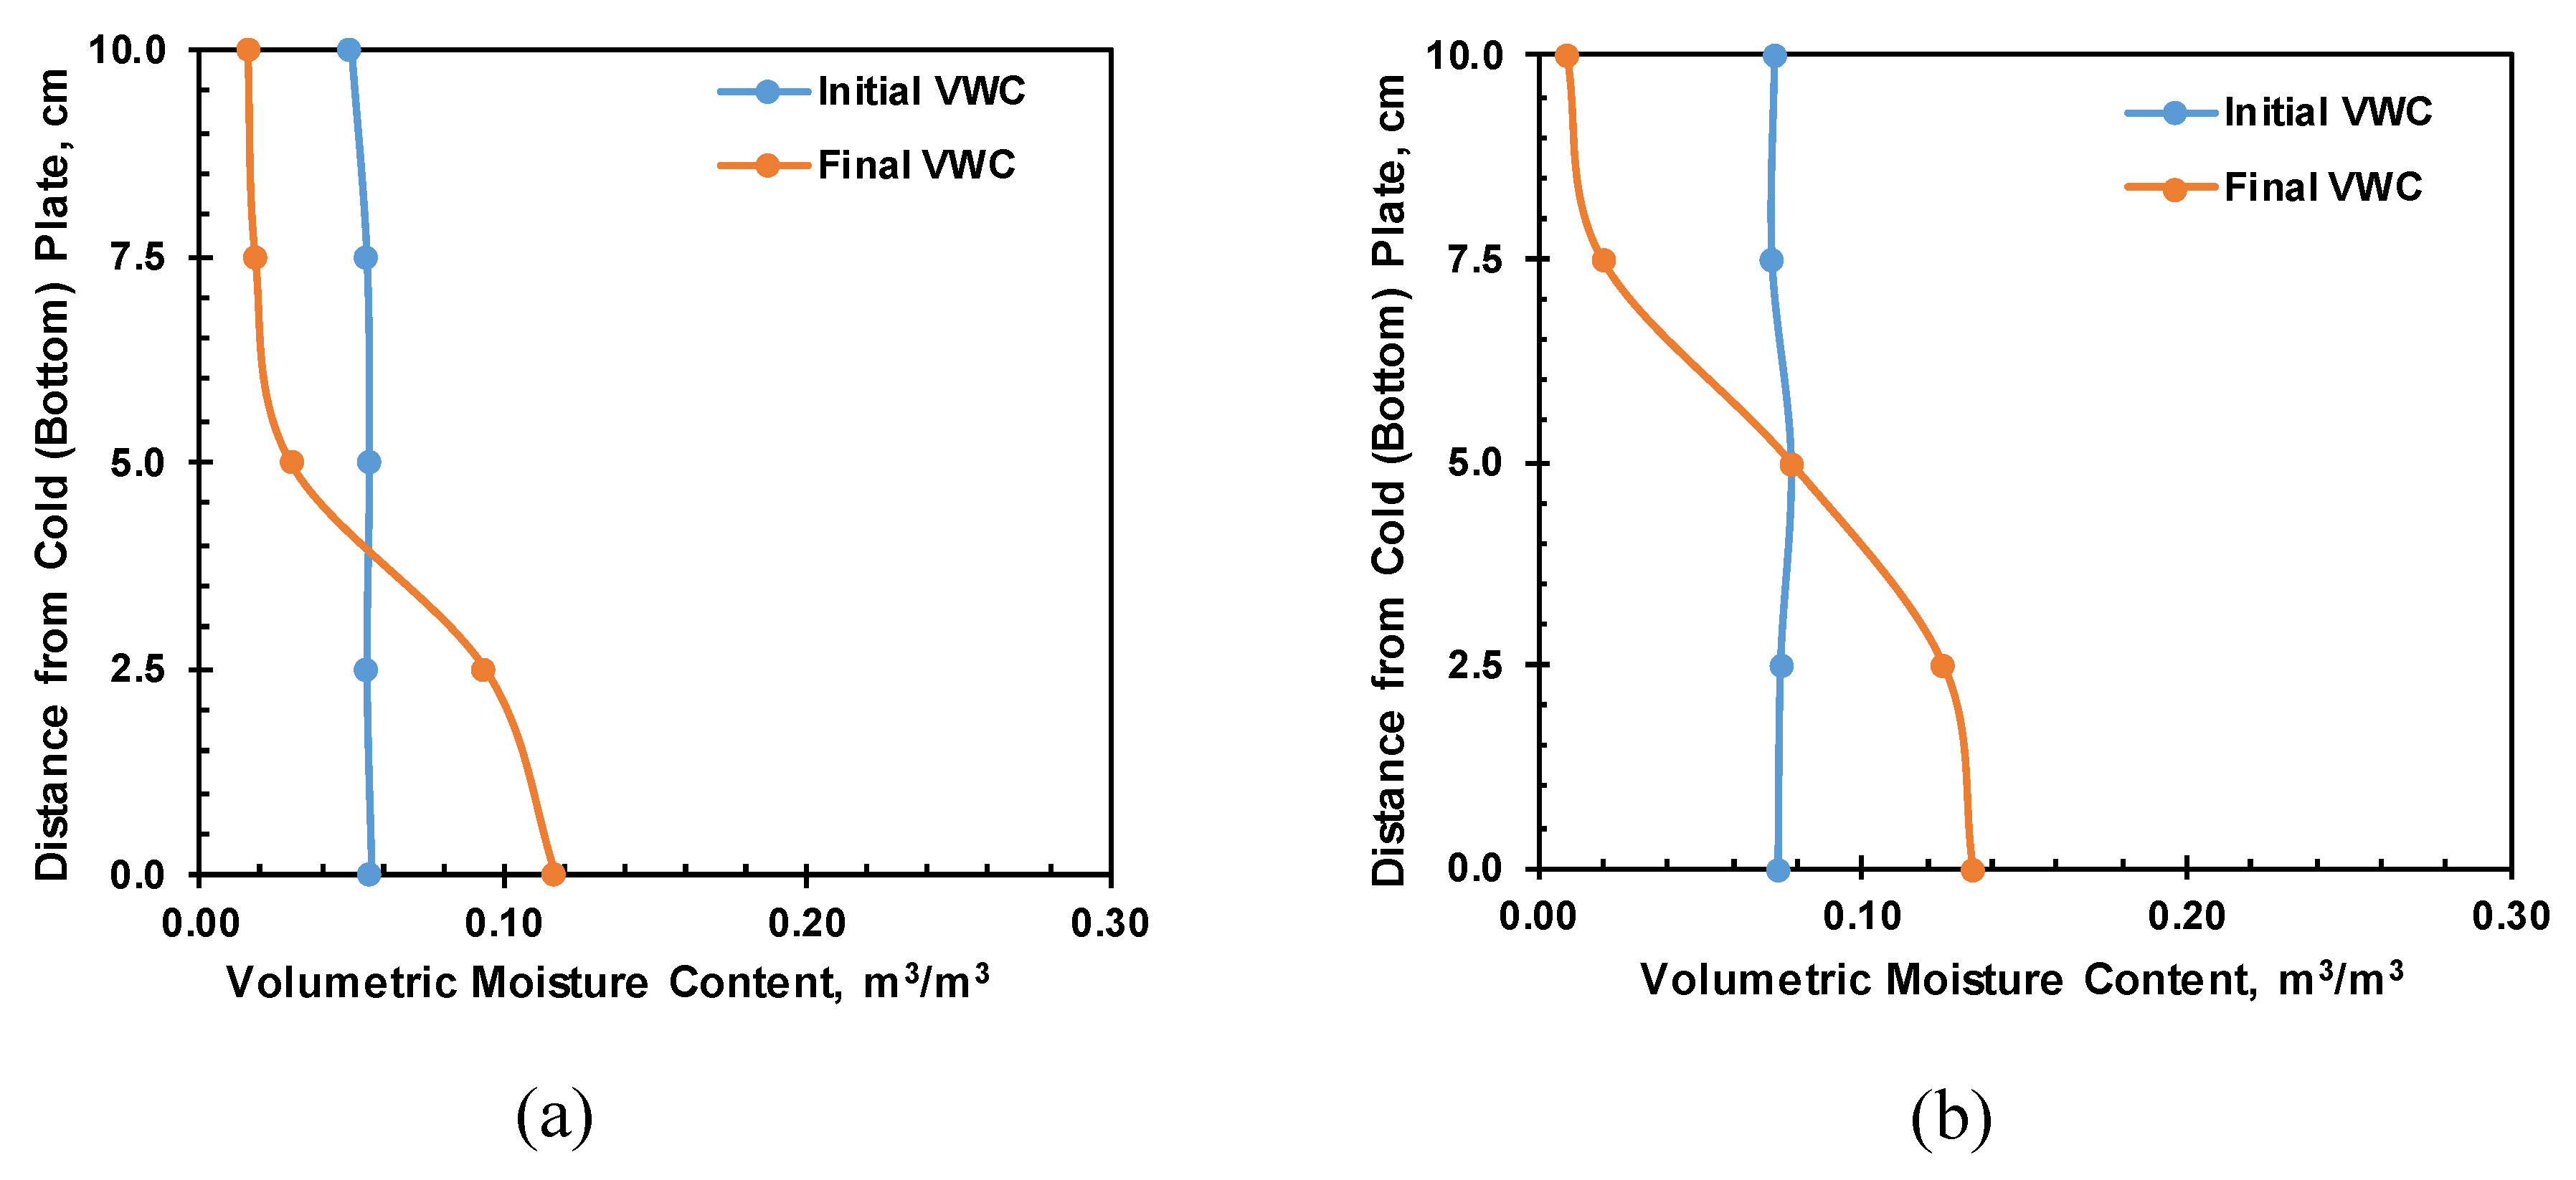
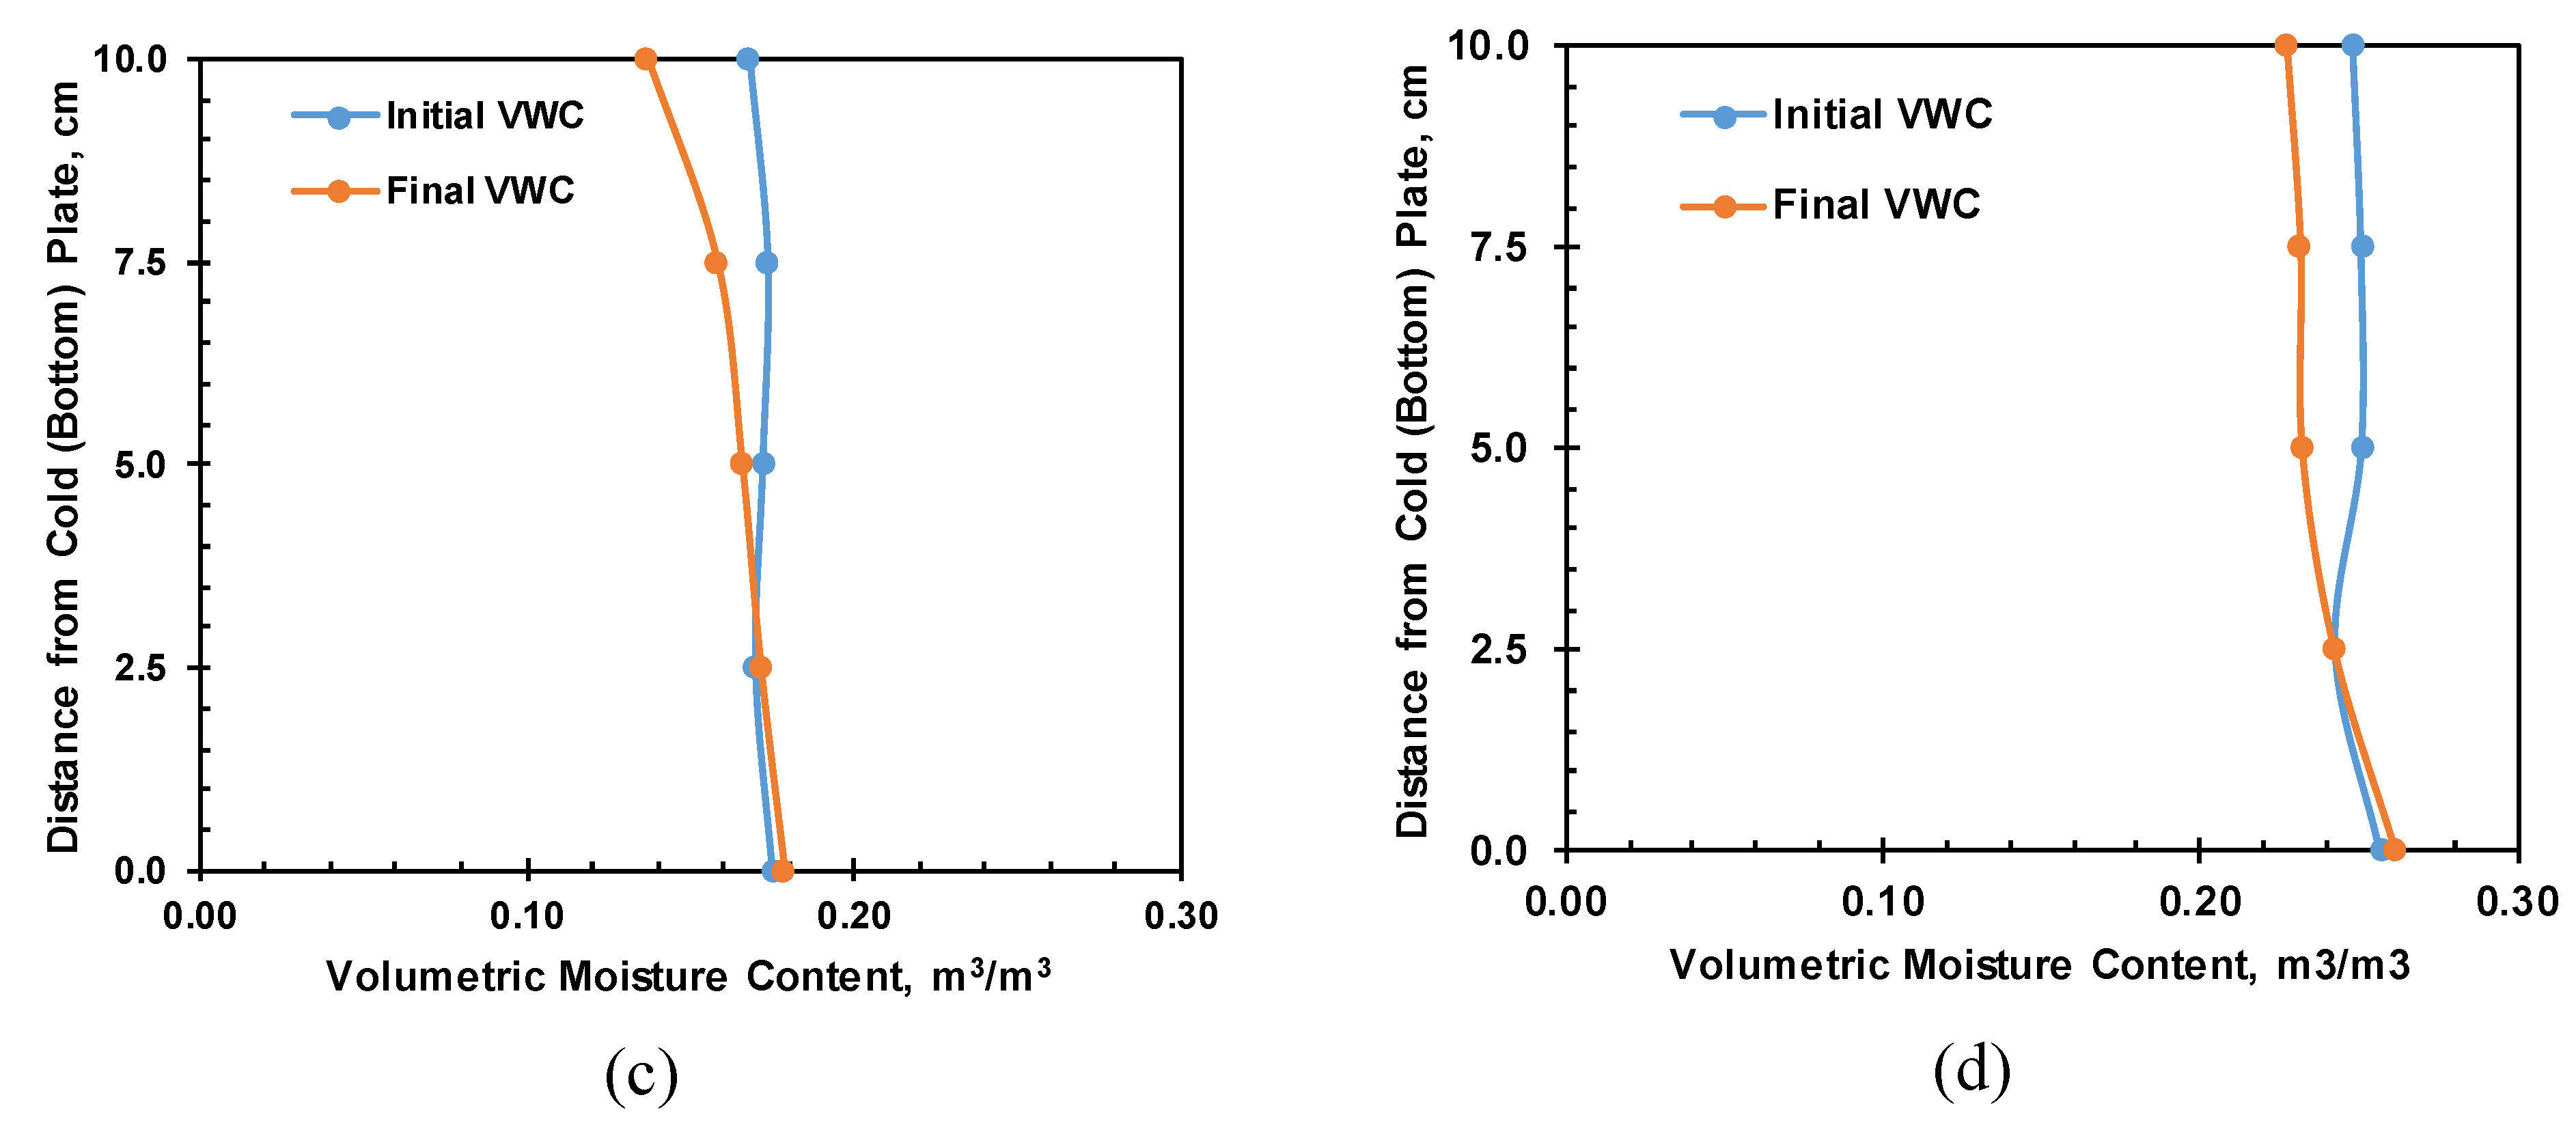
Figure 17 shows the moisture profile of the soil column at different depths during steady state. Very large moisture migration has occurred for 0.055 m
3/m
3 and 0.078 m
3/m
3 initial moisture content. However, very small moisture movement has occurred for 0.172 m
3/m
3 and 0.249 m
3/m
3 initial moisture content. Soil suction plays a critical role in thermally-induced moisture flow. The suction levels for 0.055 m
3/m
3 and 0.078 m
3/m
3 initial moisture content are 19,000 and 2,100 kPa, respectively. However, the suction levels for 0.172 and 0.249 m
3/m
3 are 28 and 3 kPa, respectively. At high soil suction levels, temperature effects on capillary film are significant and thus cause more moisture flow.
3.3. Thermal Conductivity and Heat Flux
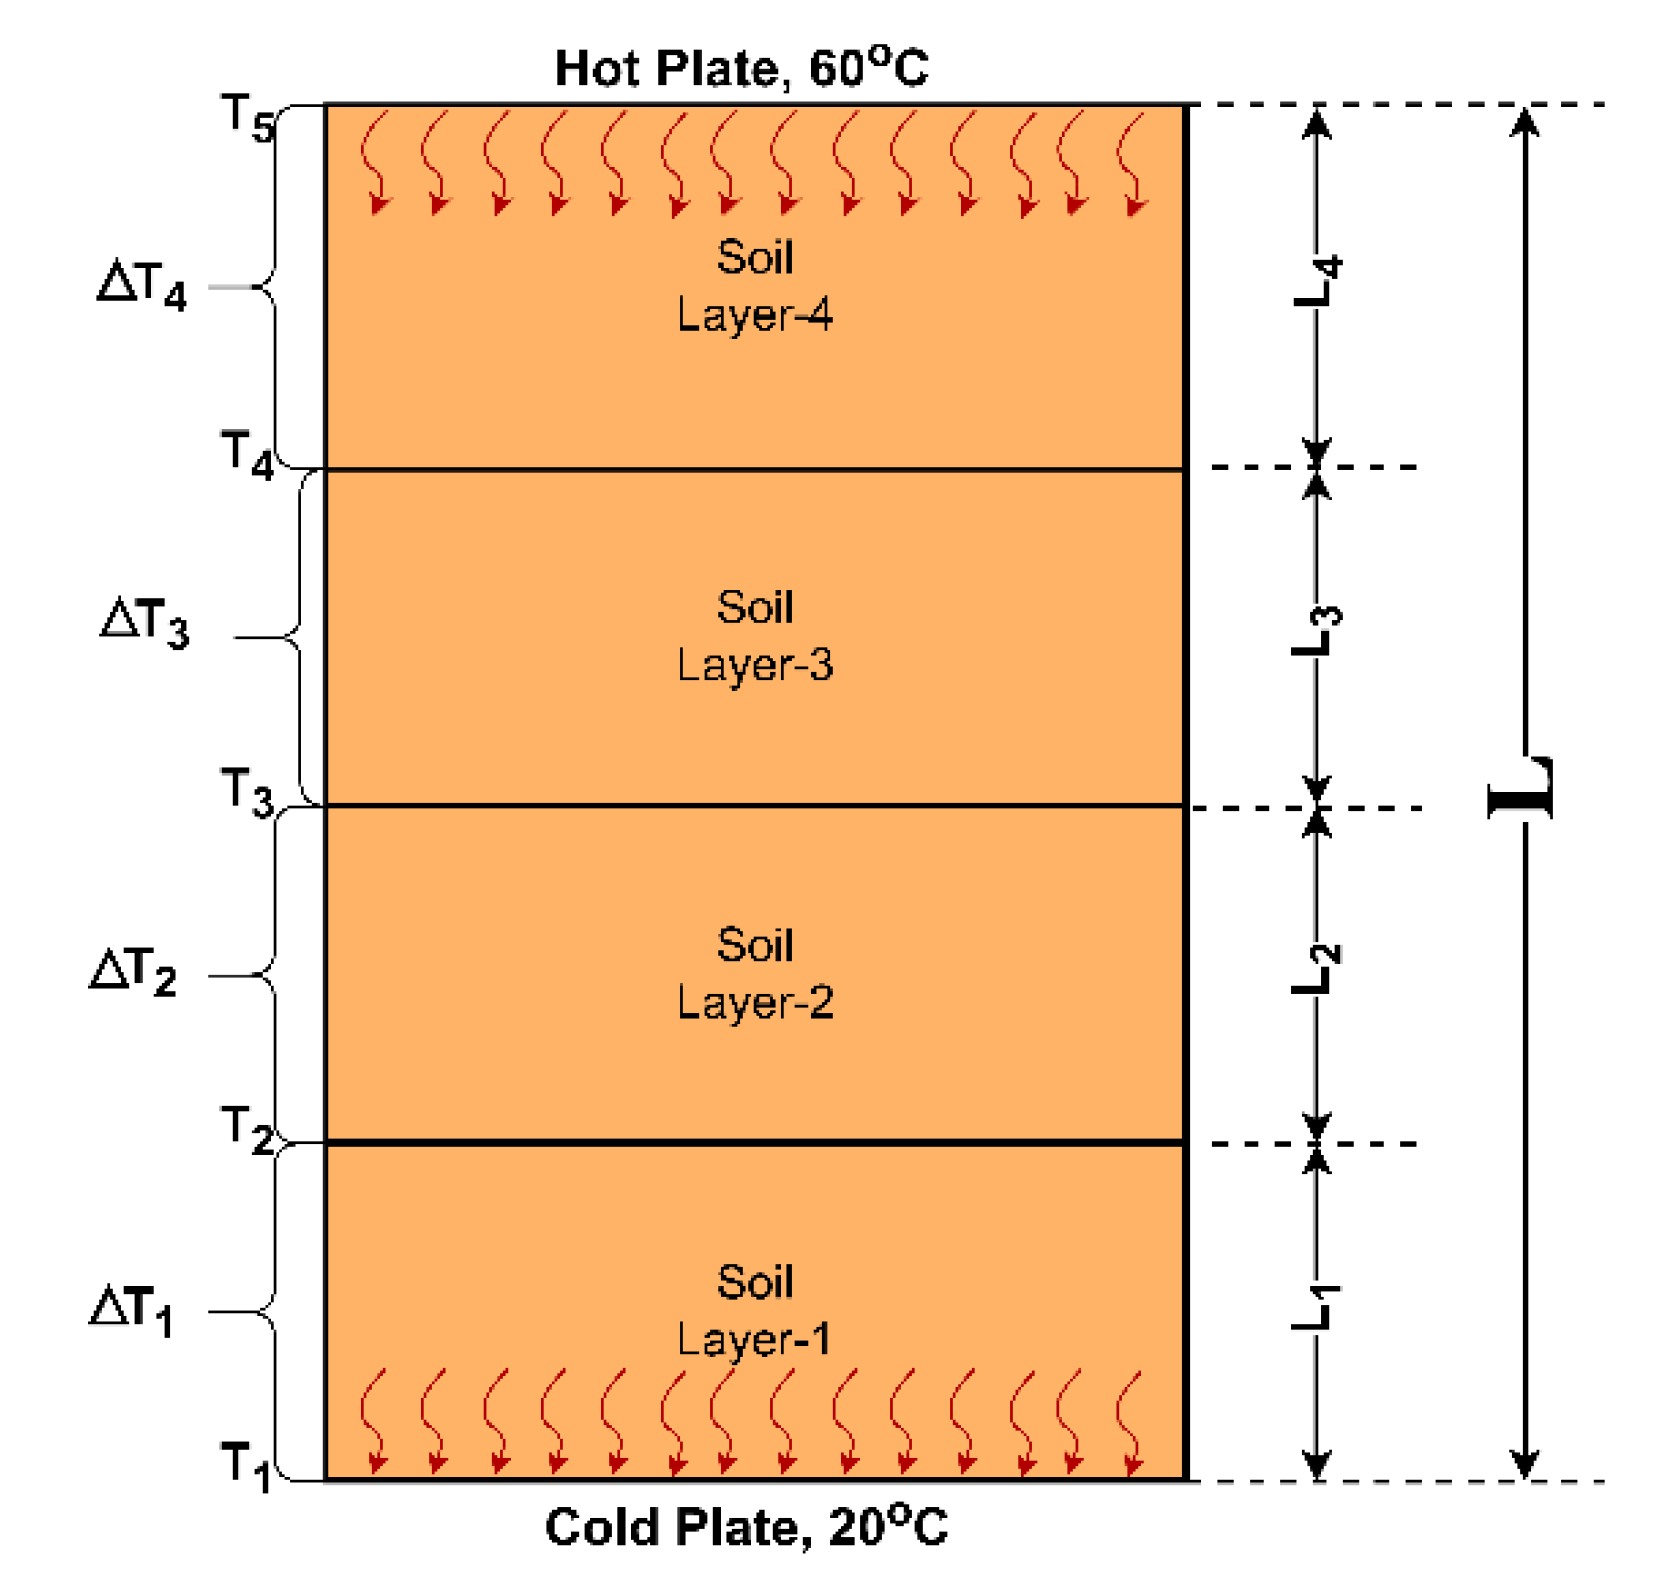
The soil column is depicted in 2D, as shown in
Figure 18. Heat transfer only occurs in the vertical direction as described in the previous section. Temperature measurements were made at each layer boundary (T
1, T
2,…, T5), and heat flux was measured at the top and bottom surfaces.
Thermal conductivity (k) for the soil sample with heat flux
thickness of layer
, represented by L
1¸L
2, L
3, and L
4, and temperature difference of
is given by:
The negative sign represents the heat flux from the higher temperature to the lower temperature zone. The soil column is treated as four layered soils during the heating cell test to calculate the thermal conductivity of soil layers, and the equivalent thermal conductivity of the entire soil column can be calculated based on the thermal resistance relationship for series connection and can be given as:
where,
and
represents the length ratio (
and thermal conductivity of the soil layer, respectively.
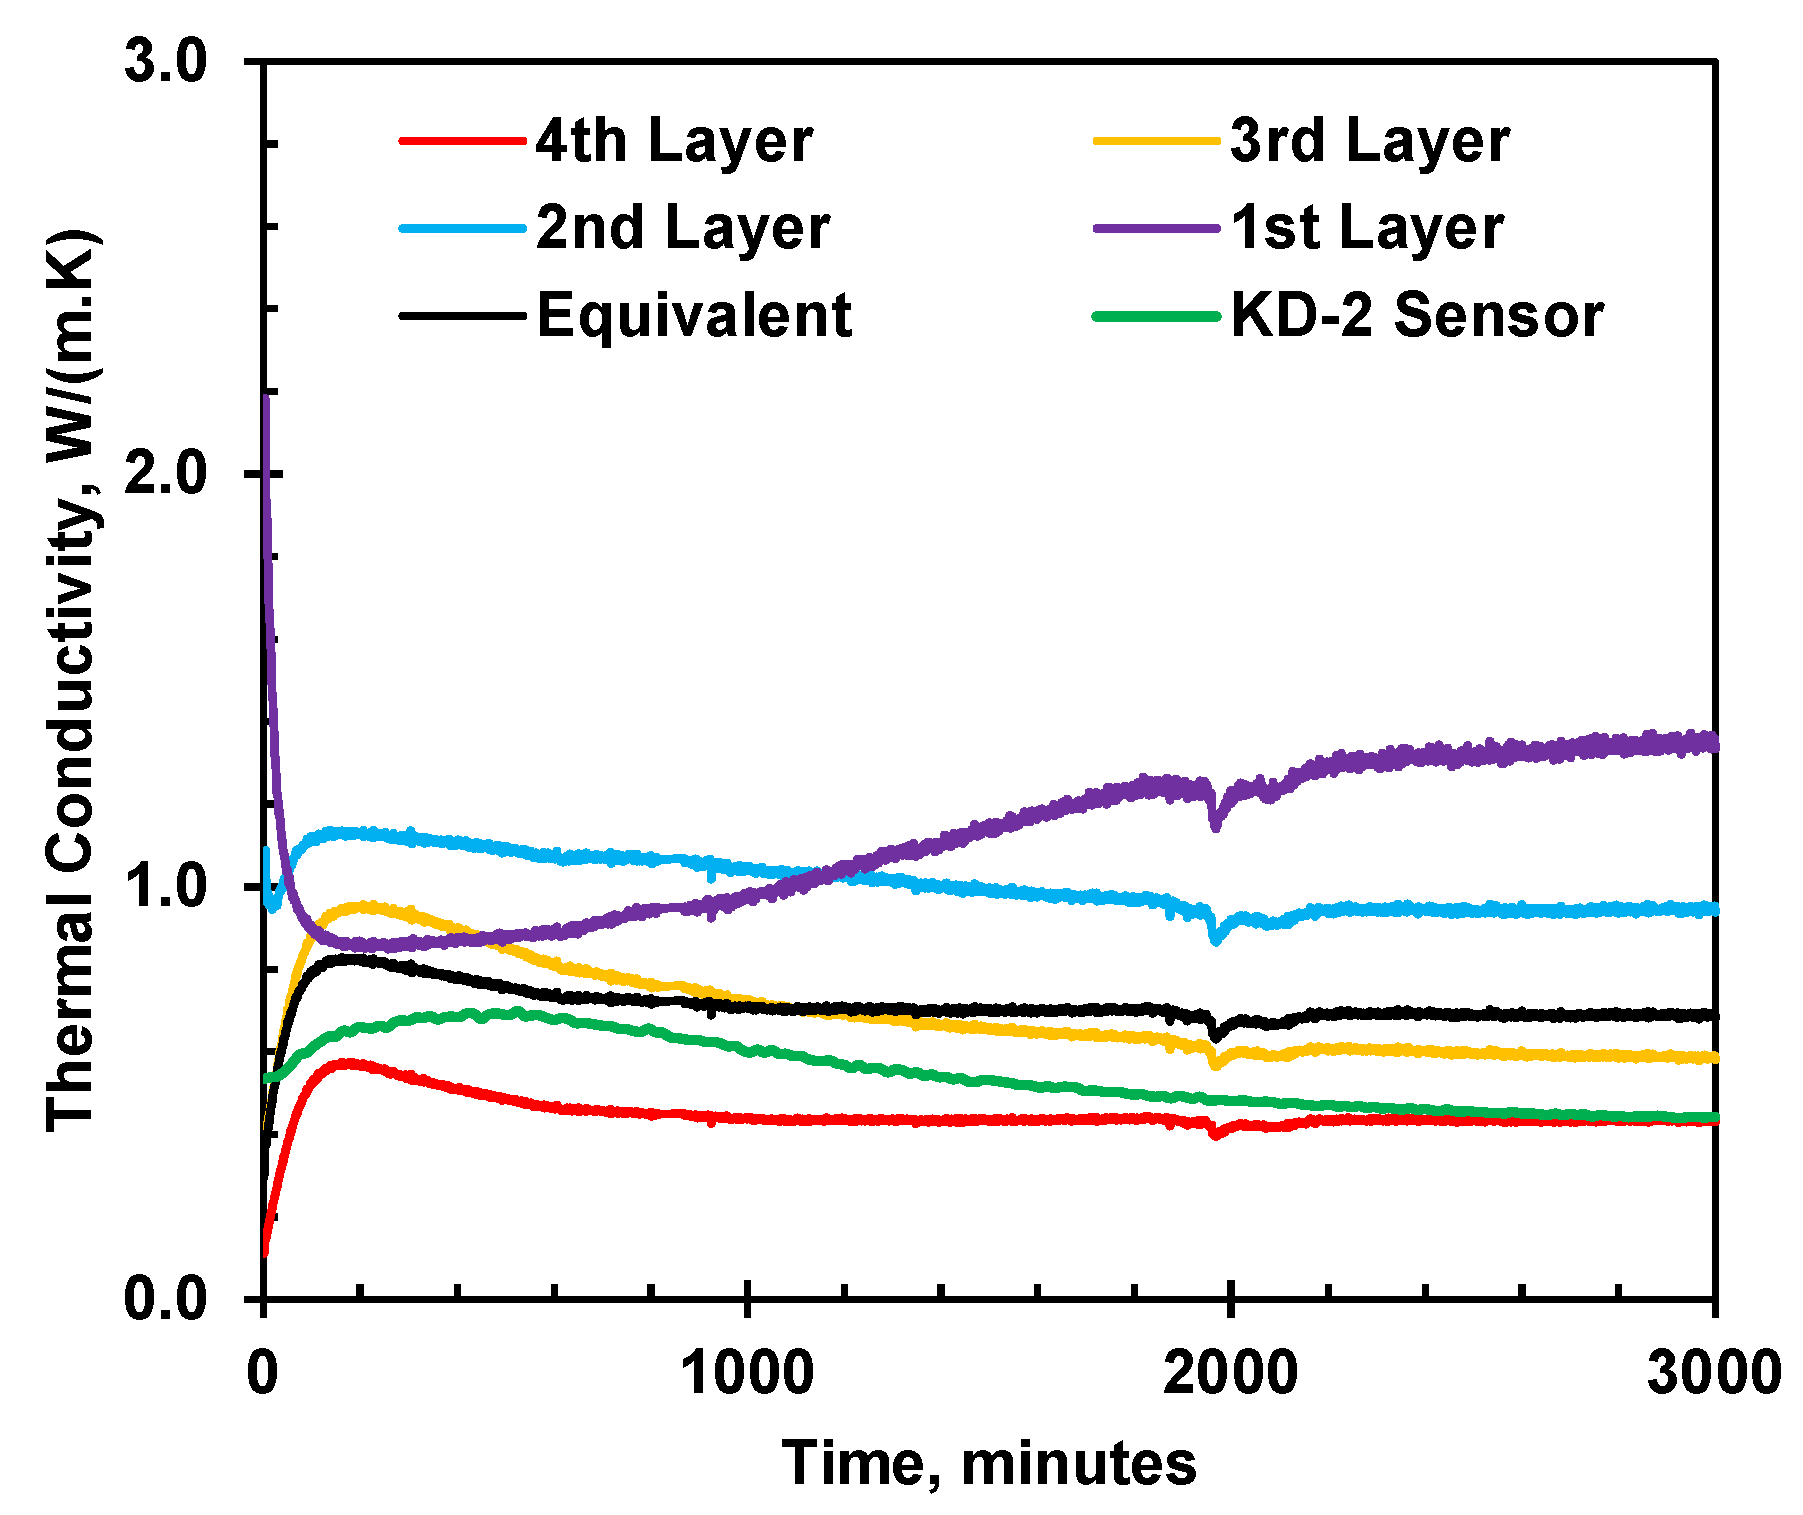
The thermal conductivity of each soil layer and the equivalent thermal conductivity of the soil column were determined using Eqs. 8 and 9, as shown in
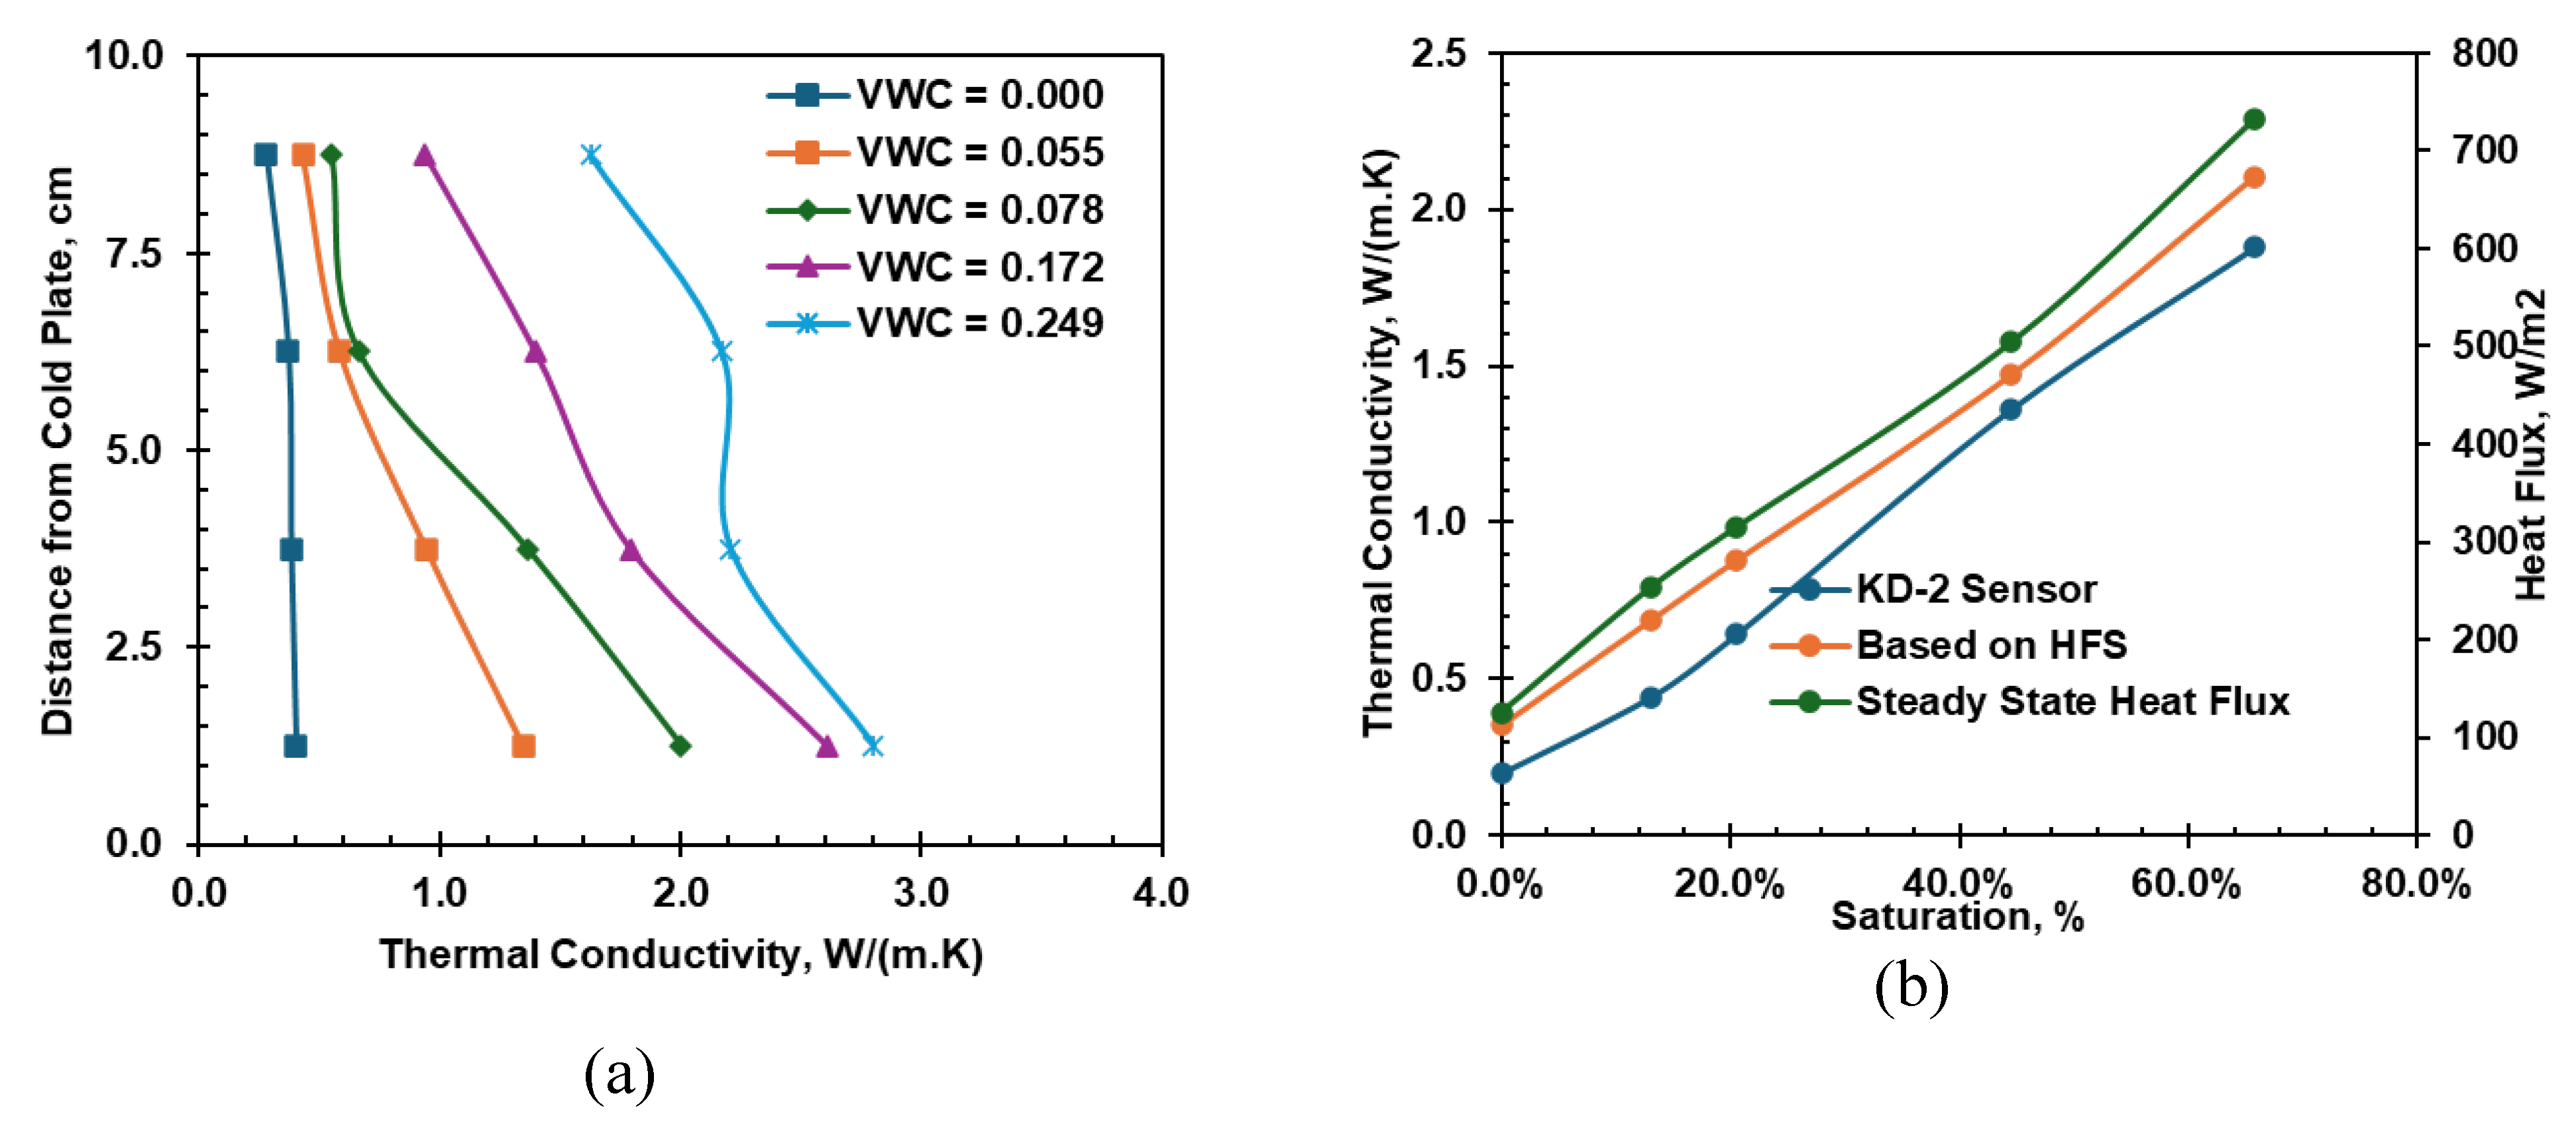
Figure 19. The graph shows the thermal conductivity measured by the KS-1 sensor at the middle height of the soil column. At steady-state, thermal conductivity increases from top to bottom. Thermal conductivity profiles at steady-state for all soil specimens are plotted in
Figure 20. The thermal conductivity measured by the KD-2 (KS-1) sensor, located at the interface of the second and third layers, has also been presented in
Figure 19. Thermal conductivity by KS-1 first increases to a peak at about 200 minutes and decreases until at steady-state reflecting the temperature effect on the rise before the peak and moisture migration after the peak as shown in
Figure 13 b and
Figure 15.
The thermal conductivity and heat flux of different initial moisture soil columns at a steady state during the heating cell test are shown in Error! Reference source not found.. The thermal conductivity profile at equilibrium for different initial moisture content has been presented in
Figure 20 (a), where the thermal conductivity increases with initial moisture content. Soil thermal conductivity increases with the increased distance to the heat source due to thermally induced moisture migration. Thermal conductivity increases with the increase in temperature for the silty sand at constant moisture; Thermal conductivity decreases slightly with the increase in temperature for the dry silty sand. The variation in thermal conductivity along the height of the soil column is due to the combined effect of temperature and moisture content.
Figure 20 (b) shows thermal conductivity against the initial degree of saturation of the soil specimens in the heat cell test from the KS-1 sensor, with equivalent thermal conductivity calculated from the measured heat flux. The equivalent thermal conductivity generally shows a close trend to the thermal conductivity measured by the KS-1 sensor. The measured heat flux increases with the increase in the initial degree of saturation.
3.4. Critical Moisture Content
Maximum reduction or increase in the volumetric moisture in each tested soil specimens occurred at the top and bottom of the soil column after the moisture equilibrium during the heating test.
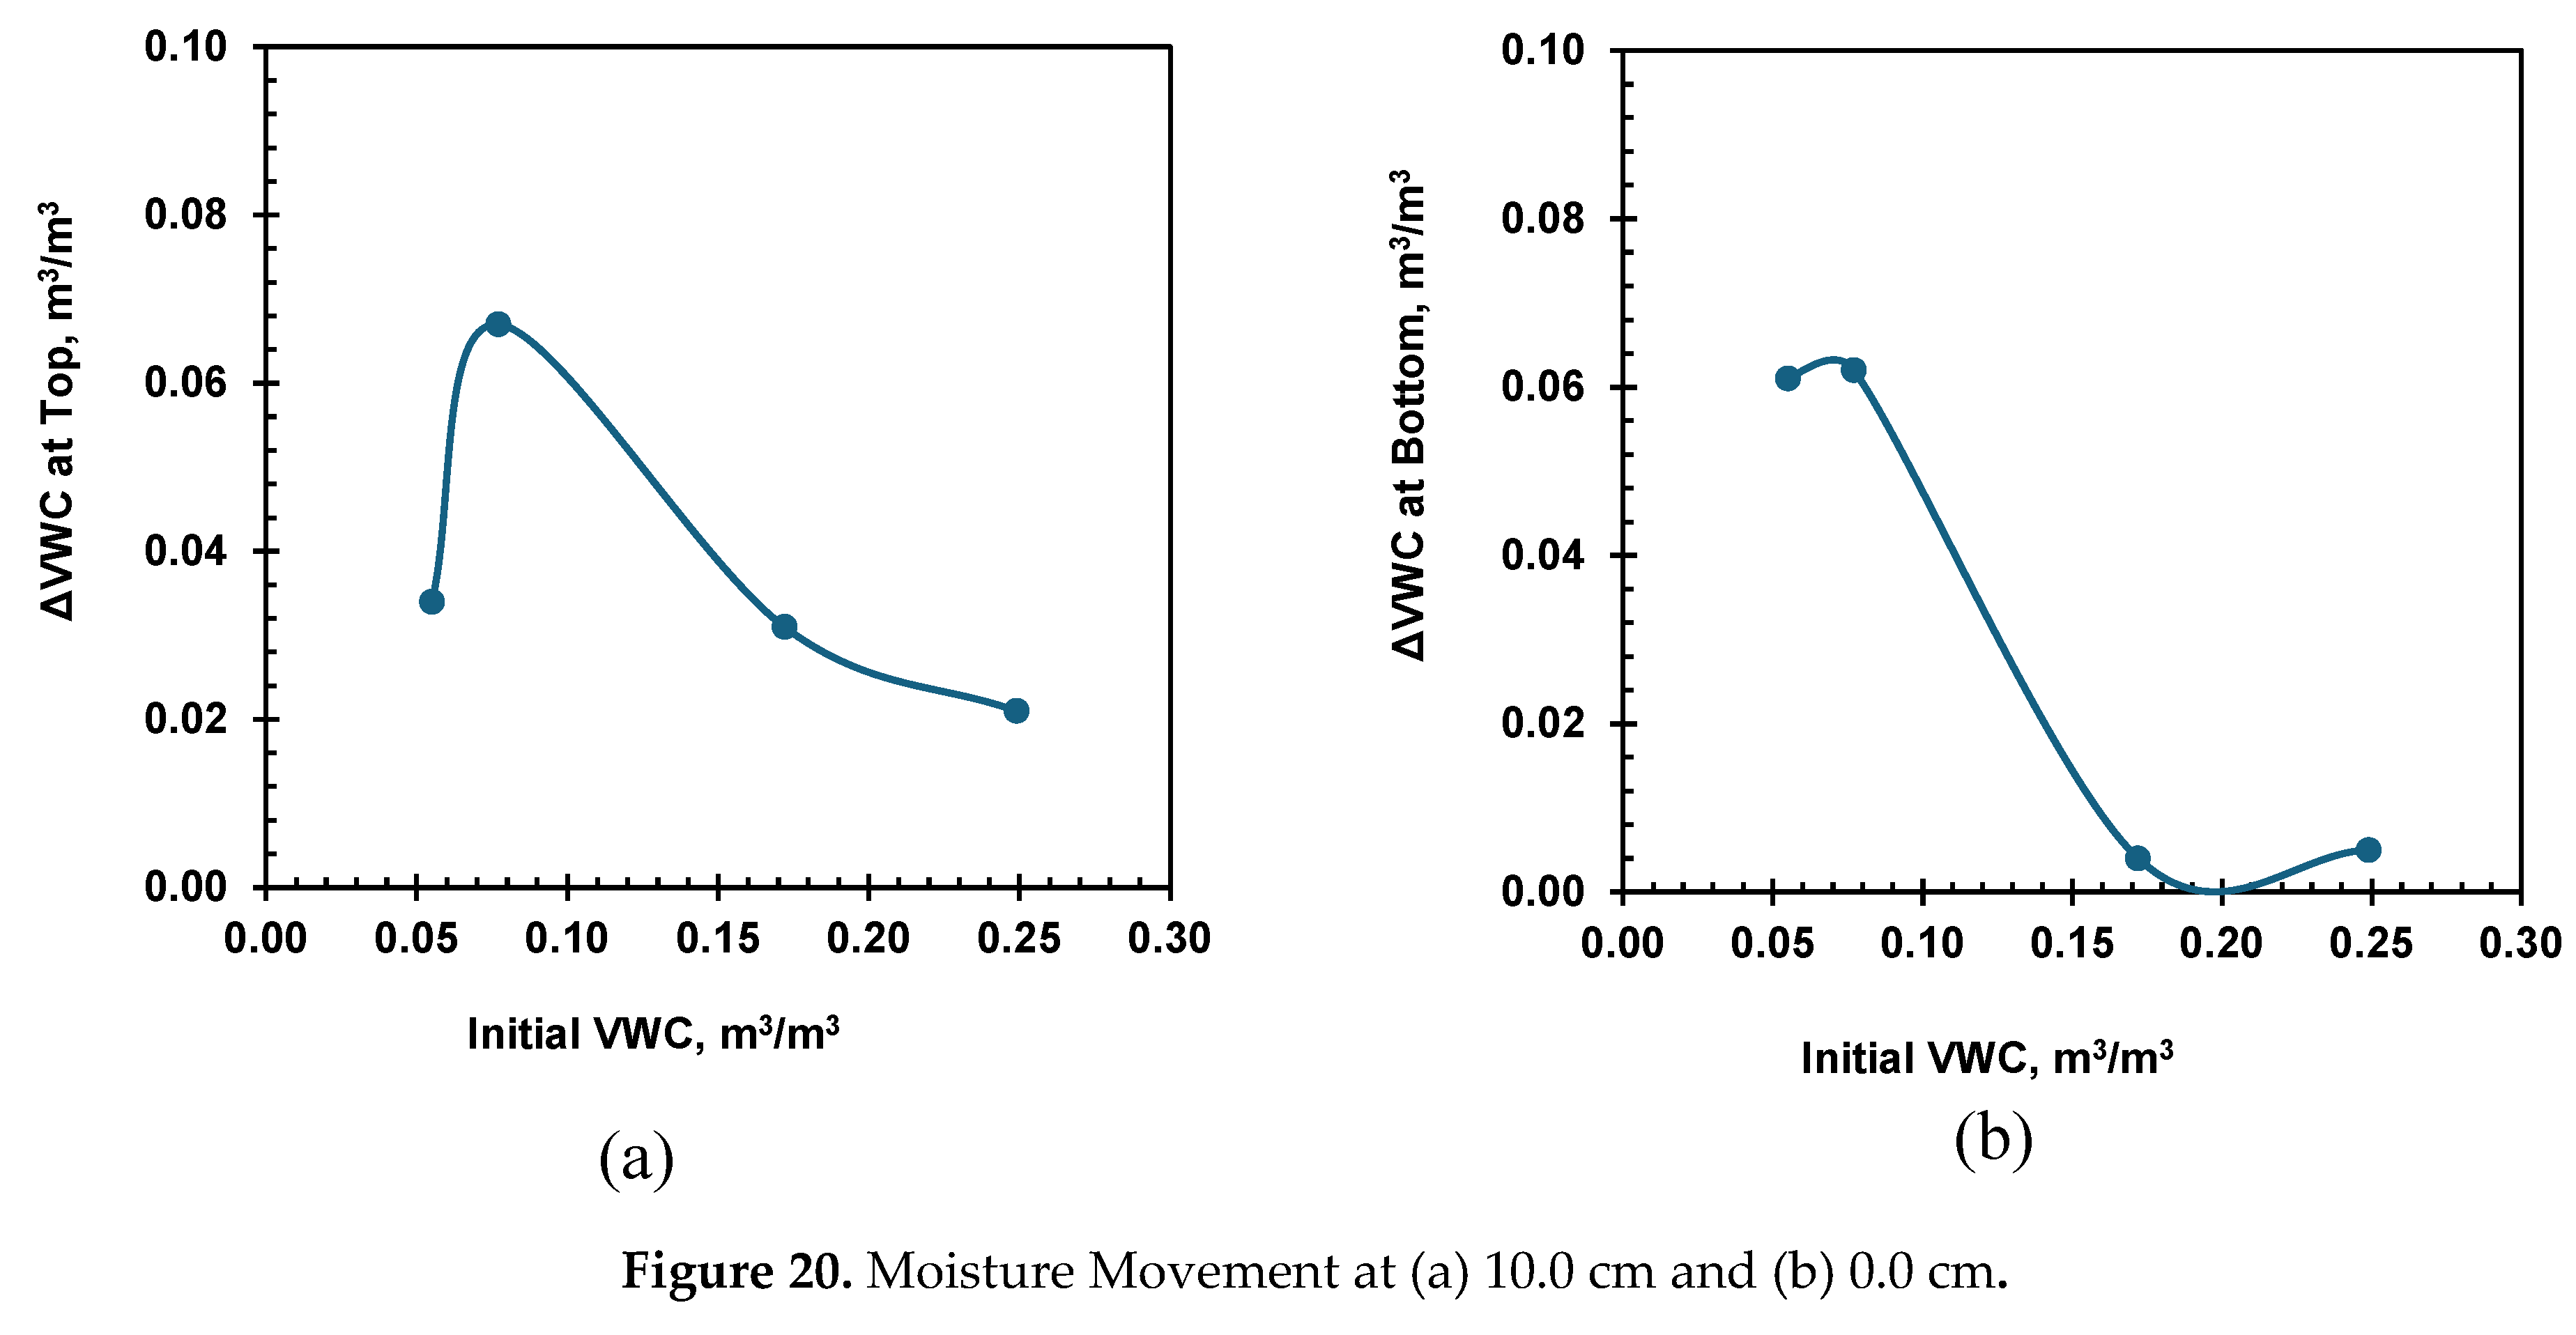
Figure 20 (a) and (b) represent the volumetric moisture loss and gain at the hot and cold end of the soil columns at the end of the heating test for each tested initial moisture content. Among all the tested soil specimens, the maximum moisture migration of 0.067 m
3/m
3 and 0.064 m
3/m
3 occurred at the hot and cold end of the soil column are observed in soil specimen with the initial moisture content of 0.078 m
3/m
3, which is the, the critical moisture content for this sandy soil.
Figure 20.
Moisture Movement at (a) 10.0 cm and (b) 0.0 cm.
Figure 20.
Moisture Movement at (a) 10.0 cm and (b) 0.0 cm.
5. Conclusions
This paper studied the temperature, moisture content, and thermal conductivity of an unsaturated silty sand at varying initial moisture content when subjected to a constant thermal gradient of 400 oC/m. Three EC-5 sensors, two heat flux sensors, three thermocouples, and a KS-1 sensor were used to continuously monitor the soil column’s moisture content, heat flux, temperature, and thermal conductivity at different cross-sections during the heating cell test. Moreover, the thermal conductivity at room temperature was measured and compared based on different sensors. The combined effect of water content and temperature on the thermal conductivity of the soil was studied as well. The following conclusions were made based on the laboratory test conducted on the heating cell tests.
Temperature effect EC-5 moisture sensors was clearly observed within the 20 – 60 oC tested temperature range; Correction of the temperature effect is needed in order to accurately measure thermally-induced moisture migration in transient state.
Significant amount of thermally-induced moisture flow was observed in the specimens of low moisture content corresponding to high suction levels; A critical volumetric moisture content of 0.078 was determined, at which maximum moisture loss of VWC 0.067 was observed.
Steady-state vertical temperature profiles within the moist specimens show clear concavity caused by thermal conductivity variations due to thermally induced moisture flow.
At steady-state, thermal conductivity increases with the increase of distance to the heating source as the result of the moisture migration away from the heat source.
The equivalent thermal conductivity and heat flux of the soil column at a constant thermal gradient increased as the initial moisture content increased. A noticeable difference in equivalent thermal conductivity based on heat flux readings and KD-2 Pro (KS-1) sensor was observed, which could be due to heterogeneity of soil during its compaction, improper contact between soil and sensor, and the effect of temperature on the soil.
References
- Abdel-Hadi, O. N. and Mitchell, J. K. 1981. “Coupled heat and water flows around buried cables.” Journal of the Geotechnical Engineering Division,107(11), 1461-1487.
- American Society for Testing and Materials. 2000. Standard Test Methods for Amount of Material in Soils Finer Than the No. 200 (75-µm) Sieve.
- American Society for Testing and Materials. 2017. Standard Test Methods for Particle-Size Distribution (Gradation) of Soils Using Sieve Analysis.
- American Society for Testing and Materials. 2021. Standard Test Method for Particle-Size Distribution (Gradation) of Fine-Grained Soils Using the Sedimentation (Hydrometer) Analysis 1.
- American Society for Testing and Materials. 2018. “Designation: D4318 − 17’117´1 Standard Test Methods for Liquid Limit, Plastic Limit, and Plasticity Index of Soils 1. [CrossRef]
- Abu-Hamdeh, N. H., & Reeder, R. C. 2000. “Soil thermal conductivity effects of density, moisture, salt concentration, and organic matter.” Soil science society of America Journal, 64(4), 1285-1290.
- American Society for Testing and Materials. 2014. “Standard Test Methods for Specific Gravity of Soil Solids by Water Pycnometer 1. [CrossRef]
- Bouyoucos, G. T. 1915. “Effect of Temperature on the Movement of Water vapor and Capillary Moisture in Soils.” J Agric Res, 5: 141–172.
- Brady, N.C., and Weil, R.R. 2008. “The Nature and Properties of Soils.” 14th Edition.
- Crawford, C. B. 1951. “Soil temperature and thermal properties of soils.” Highway Research Board Special report 2:17-41.
- Campbell, C. S. 2001. “Response of the ECH2O soil moisture probe to variation in water content, soil type, and solution electrical conductivity.” Decagon Devices Inc., Application note, Washington, DC.
- Cobos, D., & Campbell, C. 2013. “Correcting temperature sensitivity of ECH2O soil moisture sensors: Application Note.” Pullman, Wash: Decagon Devices.
- Dang, L. 2017. Experimental and Numerical Studies of Heat and Moisture Transfer in Soils at Various Conditions.
- Faizal, M., A. Bouazza, and J. S. McCartney. 2021. “Thermohydraulic Responses of Unsaturated Sand around a Model Energy Pile.” Journal of Geotechnical and Geoenvironmental Engineering, 147 (10): 04021105. American Society of Civil Engineers (ASCE). [CrossRef]
- Gurr, C. G., T. J. Marshall, and J. T. Hutton. 1952. “Movement of Water in Soil due to a Temperature Gradient.” Soil Sci, 74(5): 335–346.
- Hedayati-Dezfooli, M. 2016. DEVELOPMENT OF AN EXPERIMENTAL APPARATUS FOR STUDYING HIGH-TEMPERATURE HEAT AND MASS TRANSFER IN SOILS.
- Jackson, R. D., D. A. Rose, and H. L. Penman. 1965. “Circulation of Water in Soil under a Temperature Gradient.” Nature, 205: 314–316.
- Kaneza, Nice, Xuelin Wang, and Xinbao Yu. 2024 “Moisture Migration in Unsaturated Sands under Controlled Thsermal Gradient: A Heat Cell Study.” International Journal of Geomechanics 24.5:04024060.
- Kaneza, N. 2020. “An Experimental Study of Coupled Thermo-Hydro Behavior in Unsaturated Soil.” Master’s thesis.
- Kuzmak, J. M., and P. J. Sereda. 1957a. “The Mechanism by which Water Moves Through a Porous Material Subjected to a Temperature Gradient, II: Salt Tracer and Streaming Potential to Defect Flow in the Liquid Phase.” Soil Sci, 84: 419–422.
- Kuzmak, J. M., and P. J. Sereda. 1957b. “The Mechanism by Which Water Moves Through a Porous Material Subjected to a Temperature Gradient, I: Introduction of a Vapor Gap into a Saturated System.” Soil Sci, 84: 291–299.
- Maclean, D. J., and P. M. Gwatkin. 1953. “Moisture Movements Occurring in Soil Due to the Existence of a Temperature Gradient.” Road Research Laboratory.
- McCartney, J.S., Jafari, N.H., Hueckel, T., Sánchez, M., Vahedifard, F. (2019). Emerging Thermal Issues in Geotechnical Engineering. In: Lu, N., Mitchell, J. (eds) Geotechnical Fundamentals for Addressing New World Challenges. Springer Series in Geomechanics and Geoengineering. Springer, Cham. [CrossRef]
- Mitchell, J. K., Abdel-Hadi, O. N., Chan, C. K., Kao, T. C., and McMillan, J. C. 1981. “Backfill materials for underground power cables.” Phase II. Backfill treatments, heat and moisture flow analyses, and field tests. Interim report (No. EPRI-EL-1894). California Univ., Berkeley (USA). Dept. of Civil Engineering.
- Oh, Hyunjun. 2014. “Thermal resistivity dry-out curves for thirteen sandy soils.” PhD dissertation.
- Oh, Hyunjun; Tinjum, James M. (2021): Comparison of Two Laboratory Methods for Measuring Soil Critical Temperature. In Geotech. Test. J. 44 (2), pp. 339–357. [CrossRef]
- Or, D., and J. M. Wraith (1999), Temperature effects on soil bulk dielectric permittivity measured by time domain reflectometry: A physical model, Water Resour. Res. [CrossRef]
- Taylor, S. A., and L. Cavazza. 1954. “The Movement of Soil Moisture in Response to Temperature Gradients.” Soil Science Society of America, 18: 351–358.
- Texas Department of Transportation. 1999. “Test Procedure for Determining Plastic Limit of Soils.
- Wang, T.-H., and L.-J. Su. 2010. “Experimental Study on Moisture Migration in Unsaturated Loess under Effect of Temperature.” Journal of Cold Regions Engineering, 24 (3): 77–86.
|
Disclaimer/Publisher’s Note: The statements, opinions and data contained in all publications are solely those of the individual author(s) and contributor(s) and not of MDPI and/or the editor(s). MDPI and/or the editor(s) disclaim responsibility for any injury to people or property resulting from any ideas, methods, instructions or products referred to in the content. |
© 2024 by the authors. Licensee MDPI, Basel, Switzerland. This article is an open access article distributed under the terms and conditions of the Creative Commons Attribution (CC BY) license (http://creativecommons.org/licenses/by/4.0/).
