1. Introduction
The amount of waste generated by various industrial sectors is steadily increasing, posing a major environmental problem. It is a common objective of sustainable global development goals to fight the climate crisis by recycling waste materials to reduce the volume of solid waste at disposal sites [
1,
2,
3,
4,
5,
6,
7]. Nowadays, about 8.3 billion metric tons of plastic are generated globally and are expected to increase to 12 billion by 2050. However, only 9% were recycled, and 6.3 billion were accumulated in landfills or sloughing off in the natural environment. Moreover, as of 2018, the glass industry reported recycling around 27 million metric tons globally, accounting for about 21% of total glass production [
8]. Therefore, solid waste reuse in the construction industry is gaining attention in developed countries. Currently, scarcity of construction materials and excessive disposal of waste products are the difficulties experienced globally that need a rapid and permanent solution [
9]. Notably, this process led scholars to tackle the issues of finding suitable eco-friendly construction materials and handling environmental matters simultaneously [
10]. Recently, there has been some evidence of waste materials and by-products used in construction materials. However, recycling waste as an alternative construction material is used significantly less in developing countries [
11]. The usage of these materials aids in their integration into cement, concrete, and other construction materials but also assists in lowering the cost of cement production by reducing energy consumption and improving environmental protection from potential carbon emissions [
12,
13].
Recycling waste glass and plastic has always been an issue globally, even though the recycling rate of glass is relatively high compared with plastics [
14]. Several research has been conducted on recycling plastic waste in a mortar [
15,
16,
17,
18,
19] and concrete [
20,
21,
22,
23]. Other studies have been conducted on the recycling of waste glass in concrete as a fine aggregate replacement [
1,
14,
24], coarse ggregates as an additive [
24,
25,
26,
27,
28], partial replacement of cement [
29,
30,
31,
32], and as fine aggregate [
33] in mortar. In other studies, fine aggregates used in concrete mixtures are substituted in proportions by shredded plastics and glass, and the optimal amount is determined at which greater strength is attained [
34,
35,
36]. Concrete from plastic and glass wastes has several benefits including being lightweight, robust, simple to shape, and customized to various customer needs [
37].
The use of glass wastes as fine aggregate improves the physical and mechanical properties of the concrete by reducing the density, and it is good to control the structure’s weight for stability purposes [
38]. On the other hand, crushed glass contains engineering characteristics of an angular and some elongated shape. This situation creates a higher internal friction angle, improving the interlocking between different ingredients of concrete particles. Partial replacement of waste glass does not significantly affect the workability of the concrete [
39]. However, some findings observe a slight reduction in strength [
14,
39].
On the other hand, the addition of waste glass as fine aggregate increases the mechanical properties of mortar [
33]. Replacing the natural sand with recycled high-density polyethylene (HDPE) aggregates increased the axial deformation capability of mortar and reduced the density [
18]. Waste plastic as coarse aggregate in the concrete also increases the workability of concrete [
40]. The rise in slump indicates that more water was available from the mix due to decreased absorption by reducing the percentage volume of natural aggregates and low water absorption by recycled plastics [
41,
42]. Many authors reported a gradual decrease in the compressive strength with increasing the percentage of waste plastic [
43,
44,
45]. Their findings show that the addition or partial replacement of WG and WP has positive and negative effects on the concrete’s fresh and hardened properties. However, limited research is available on the combination of WG and WP in concrete as a partial replacement for fine aggregate. Therefore, the main aim of this research is o investigate the properties of concrete produced from WGs and WPs as a partial replacement for fine aggregate.
2. Materials and Methods
Comprehensive experimental tests were conducted to study the characteristics and strength properties of the partial replacement of fine aggregate with plastics and glass waste on concrete’s fresh and hardened properties. Potential waste glass quantities were collected from empty glass containers and various building and construction remnant materials commonly used for laboratory procedures. The waste glass crushes into fine pieces that resemble the size of sand. On the other hand, samples of the waste granulated plastic particles, mostly soda and water bottles, were collected from a dumpsite. Waste plastics should be cleaned before use to remove debris and impurities that could alter the hydration and bonding of cement water paste. The plastic samples were then selected to fit the limit sieve requirements at the laboratory.
The proportion by weight of all constituents (aggregates, cement, plastics, glass, and water) was kept constant in all the mixes. The ACI mix design method arrived at the right combination of cement, fine aggregate, coarse aggregate, and water for C-25 grade concrete. Finally, different experiments were conducted on concrete properties with various mixing and curing. For this study, the ratios of the weight of waste plastics to glass used were 3:7, 6:14, and 10:20. The optimum mix ratio was determined.
2.1. Cement
Ordinary Portland cement (OPC) with a grade of 42.5N manufactured by the Derba Midroc Cement PLC was selected for this study. The physical and mechanical properties were studied using the requirements specified by ASTM and are presented in
Table 1. Cement pastes with different water-cement ratios generally have other setting times. Therefore, it does not seem apparent at first which setting time to use. The setting time of cement paste with typical consistency is referred to as the setting time of cement paste by convention [
46]. The initial setting time is the duration of cement paste related to 25 mm penetration of the Vicat needle into the paste 30 s after it is released.
In contrast, the final setting time is related to zero penetration of the Vicat needle into the paste [
46]. The standard consistency for hydraulic cement refers to the amount of water required to make a neat paste of satisfactory workability. It is determined using the Vicat apparatus measuring the resistance of the paste to penetration by a plunger of 300 gm related to the surface of the paste.
2.2. Aggregate
Aggregate grain size distribution or gradation is one of the properties of aggregates that influence the quality of concrete. Therefore, fine aggregate and coarse aggregate with gradation satisfy the grading requirement of ASTM [
48] standard, shown in
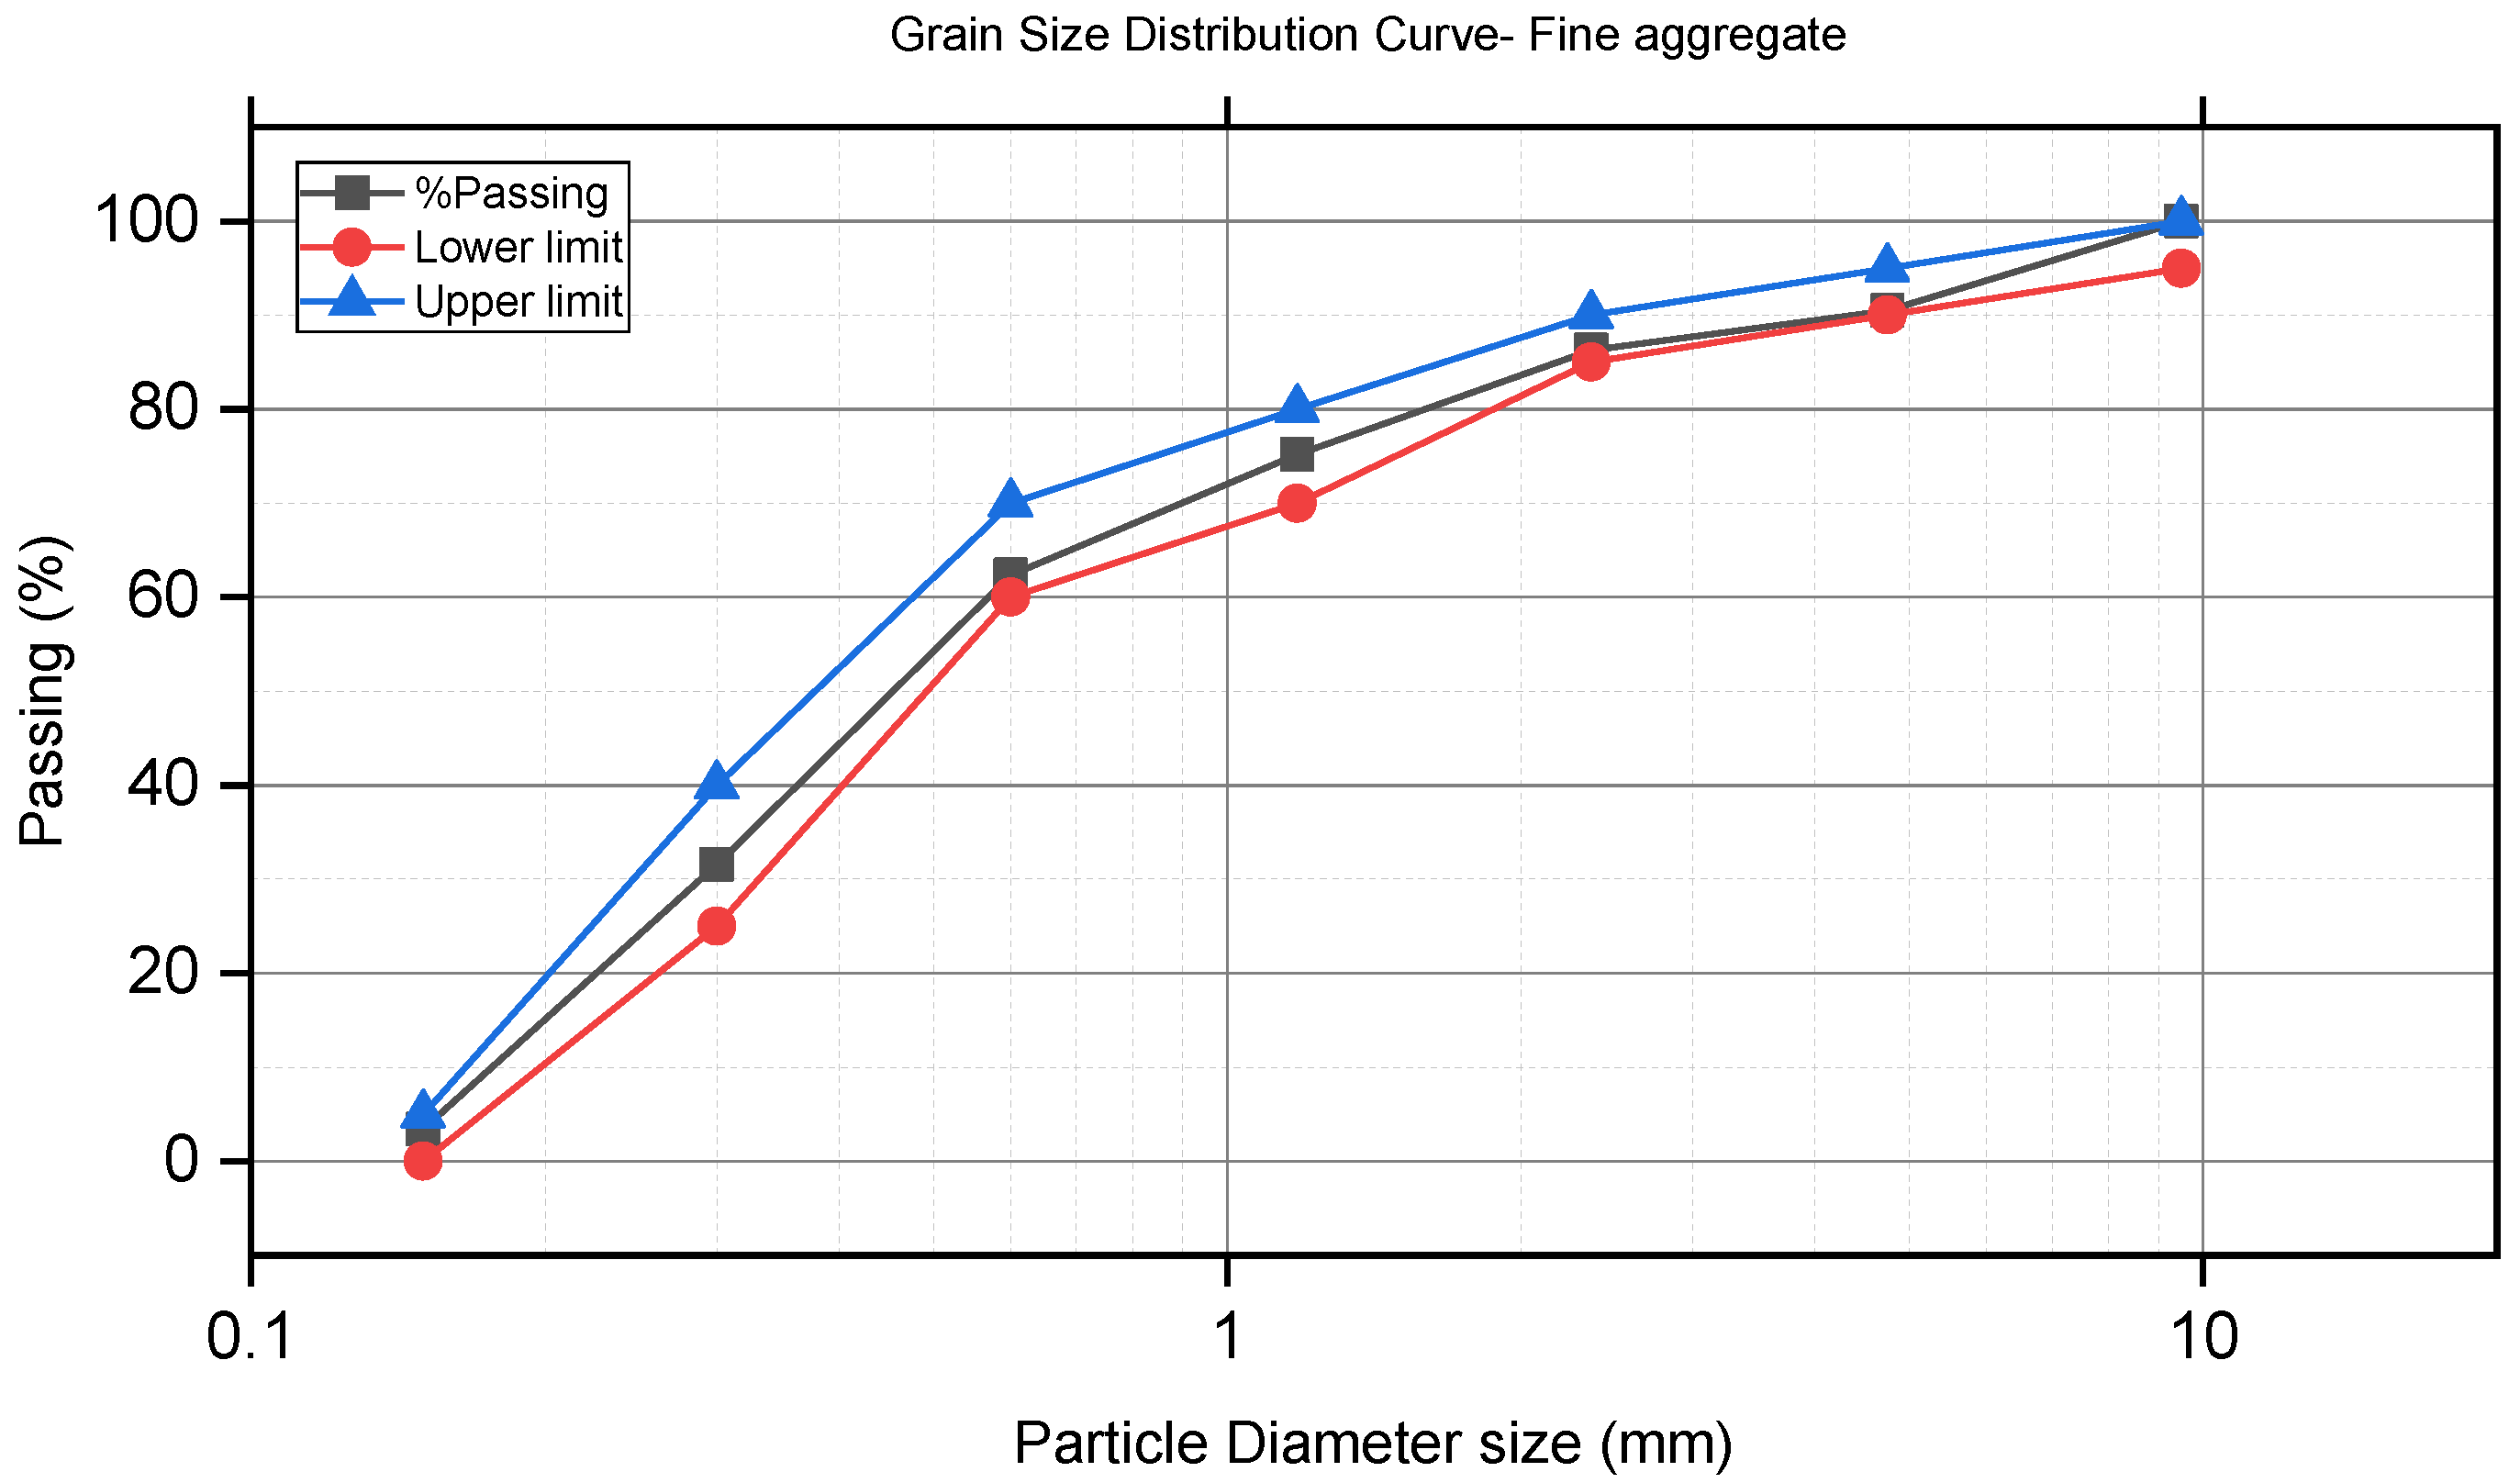
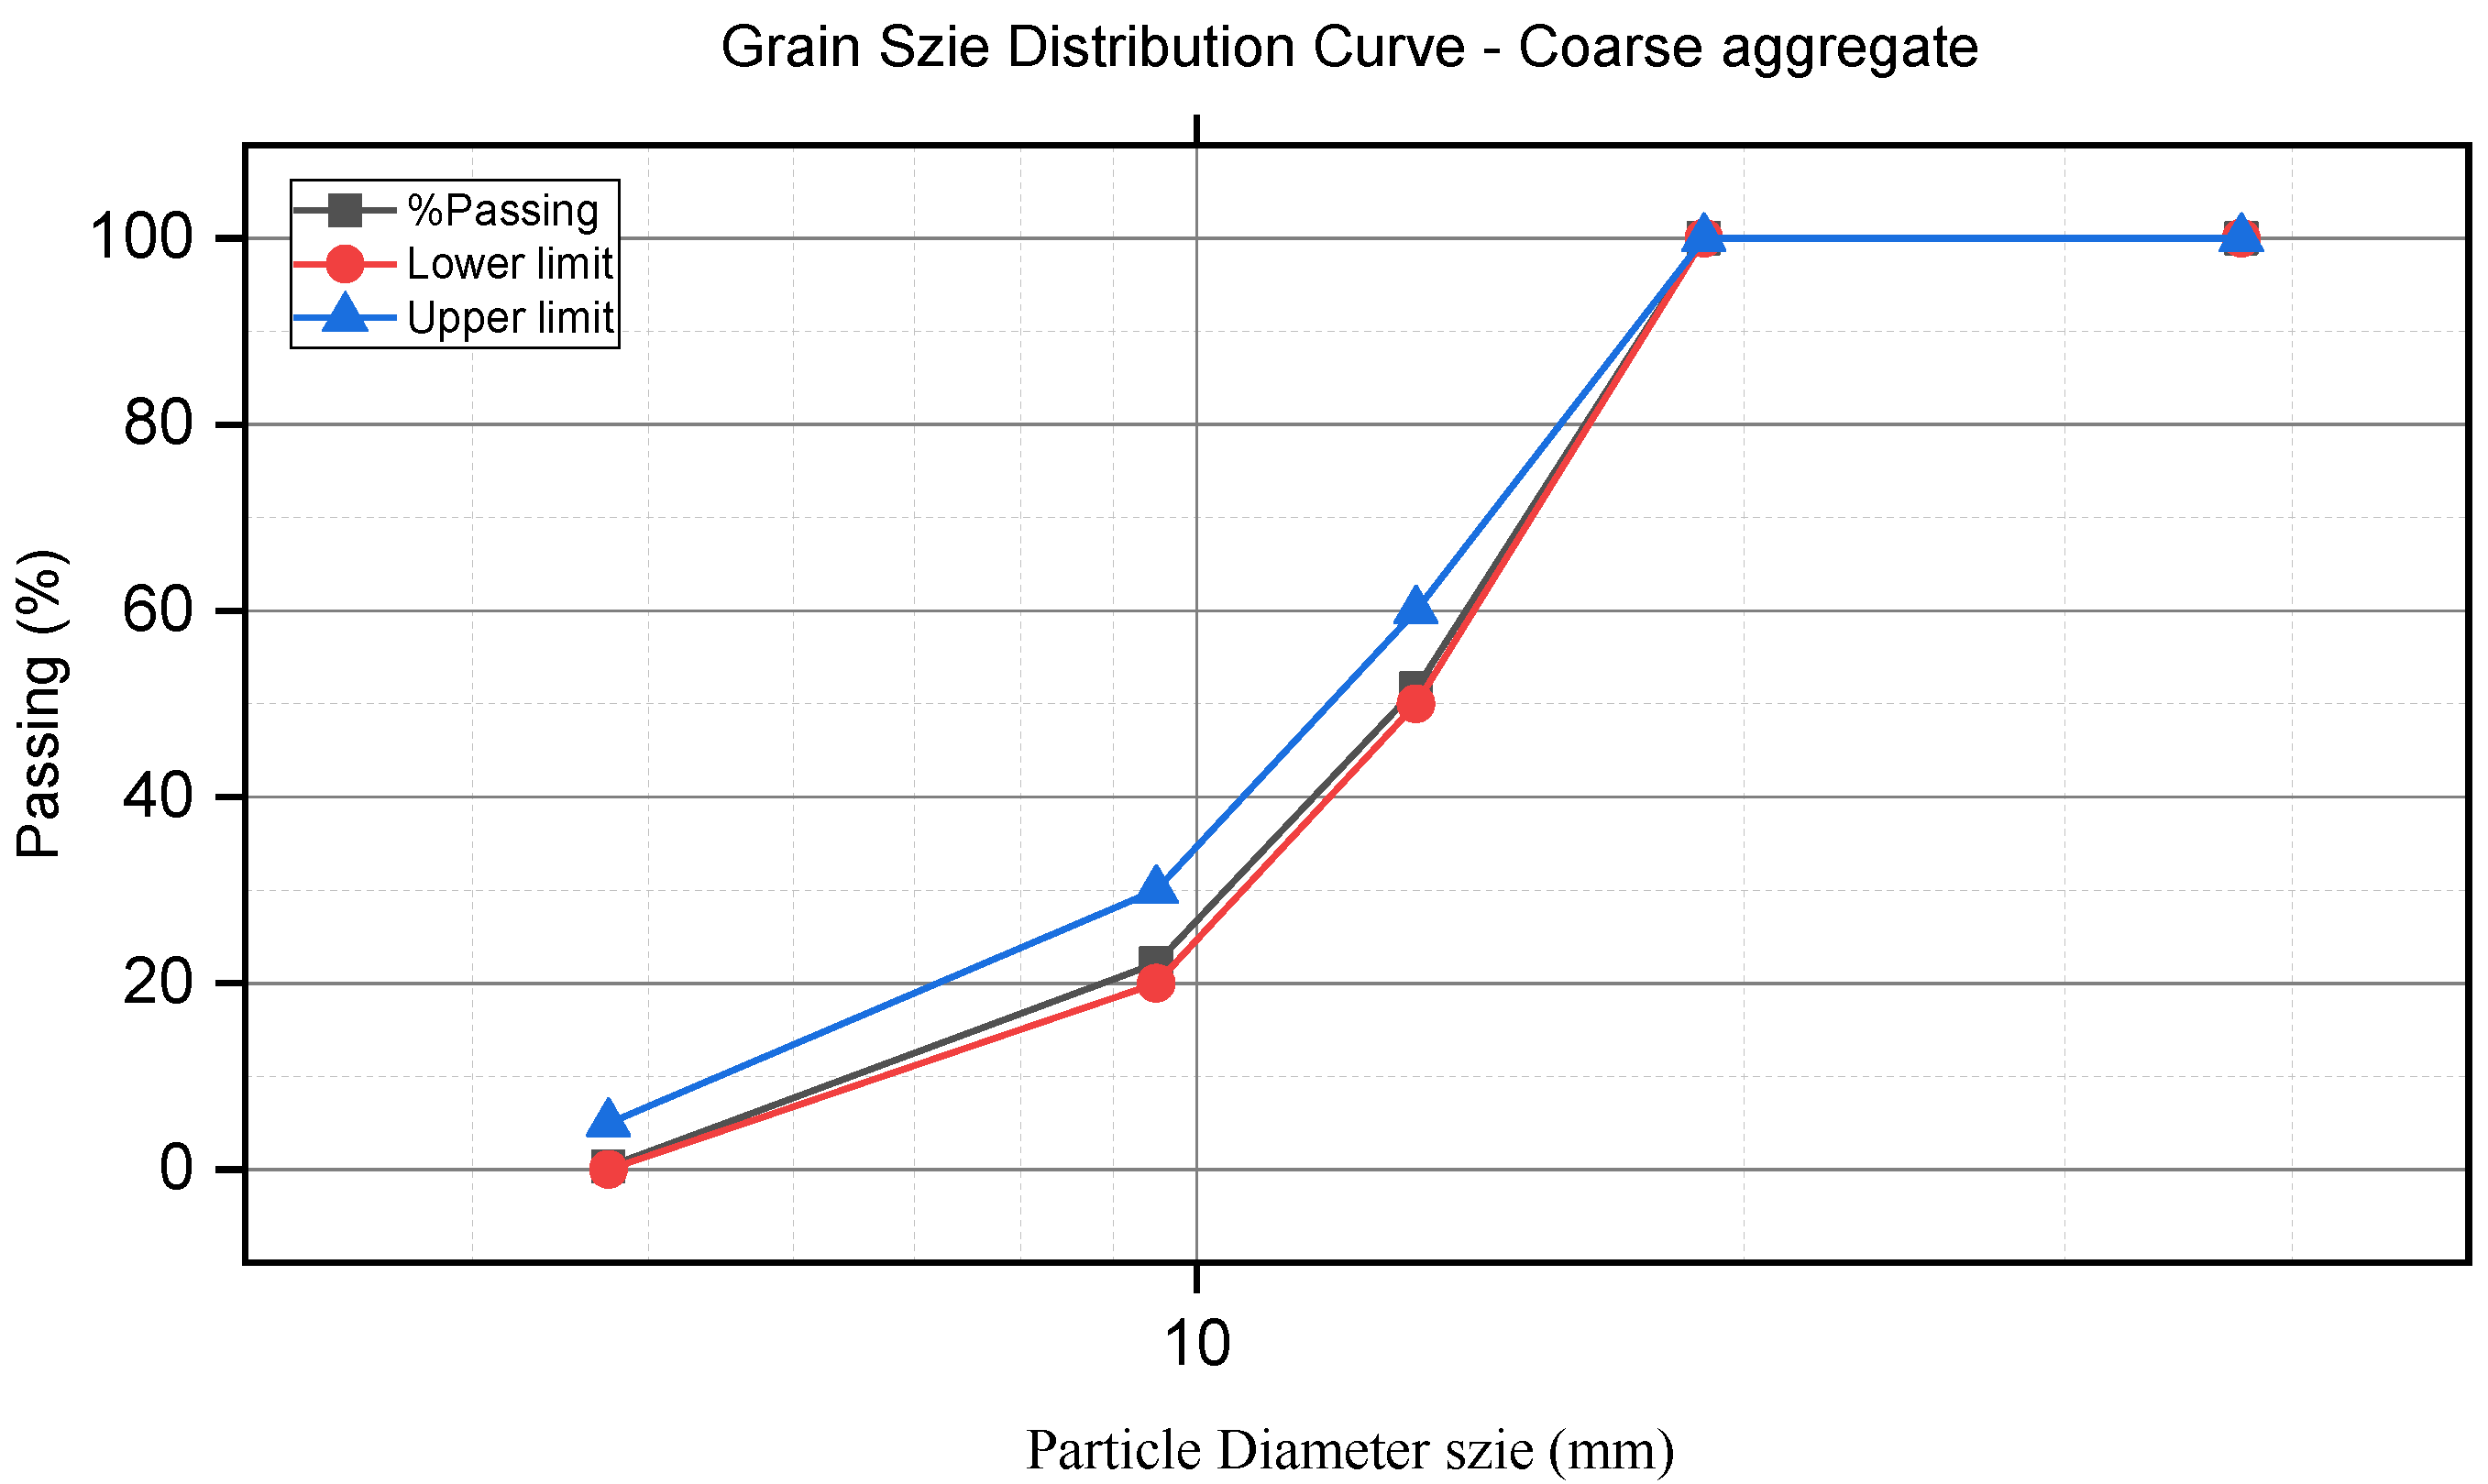
Figure 1 and 2, were used throughout the experiment.
Therefore, the grain size distribution curve exhibits a fine aggregate sample employed for this research task as a well-graded type of aggregate. The percentage passing of fine aggregate runs in the lower and upper limit of the standard requirement gradation curve.
2.3. Waste Plastics
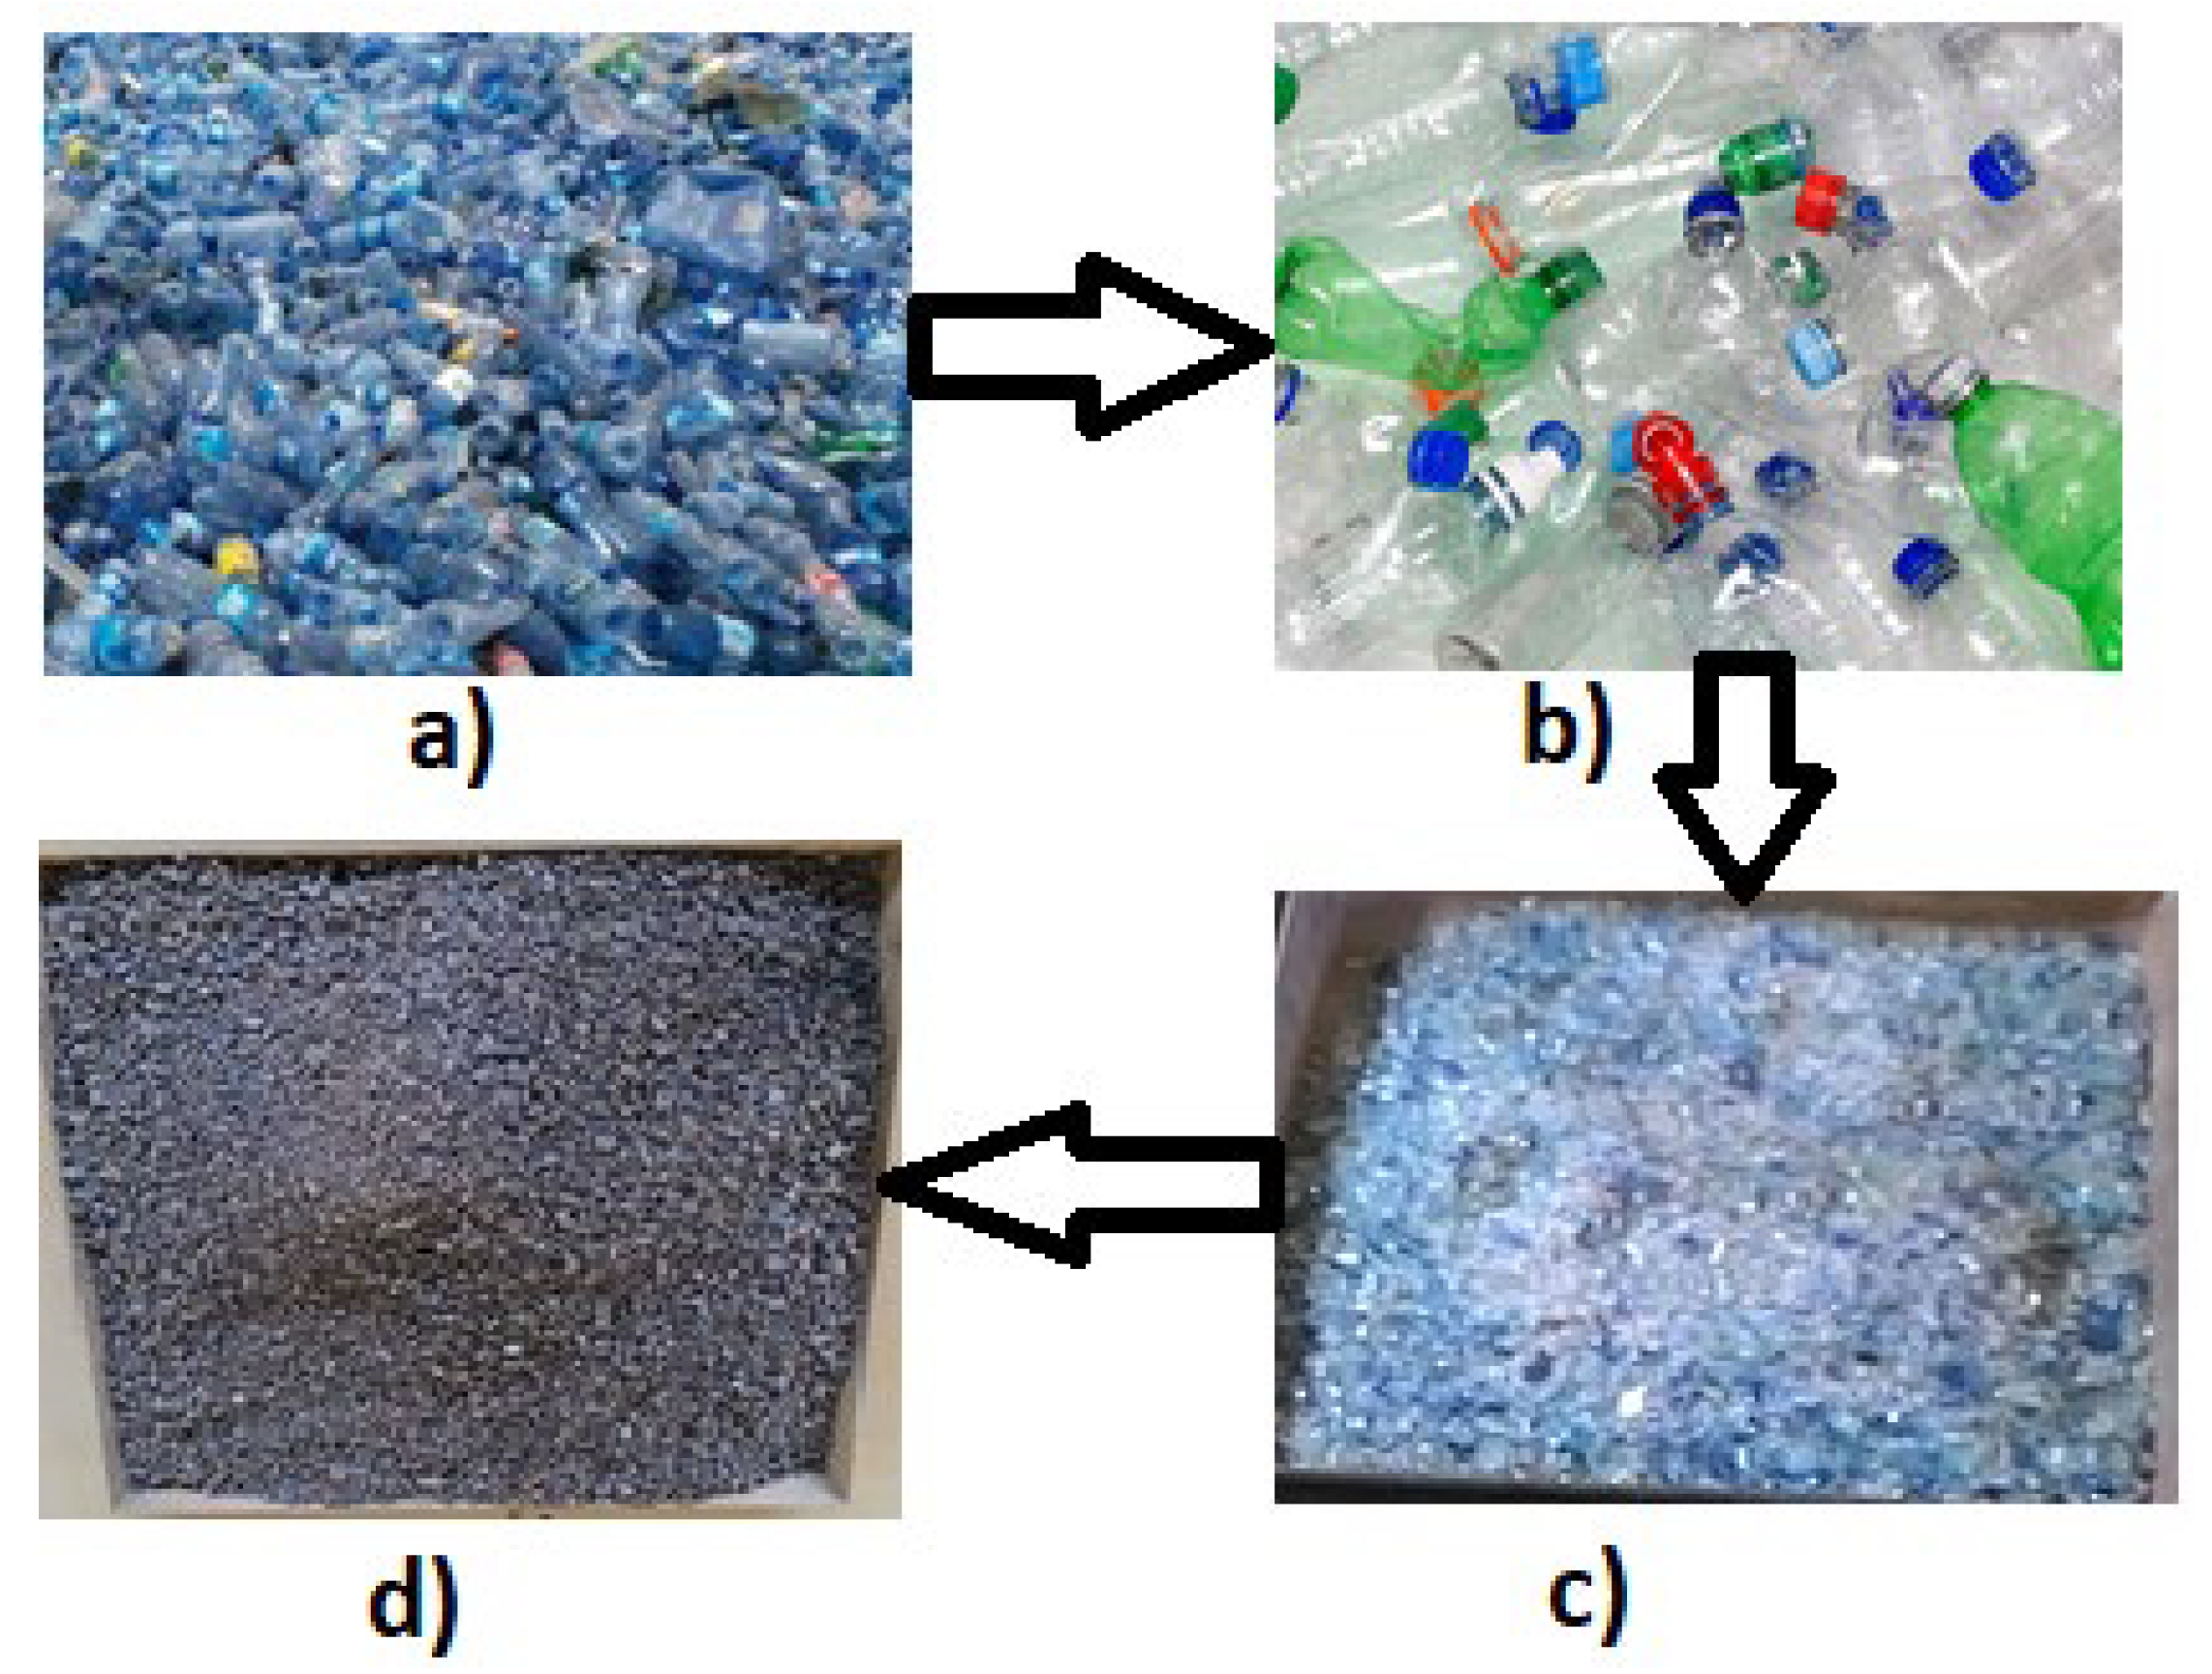
Forty-three (43) kg samples of the waste plastic particles, mostly soda and water bottles, were collected from plastic disposal in the Jimma town dump bore site in Ethiopia. For this study, HDPE types of plastics were selected since they have a high volume in dumpsites relative to others. The collected plastics were cleaned from impurities with tap water and then air-dried. The air-dried sample melted at 130 °C and cooled to make it suited for crushing and converted to a fine-sized aggregate. The production process of the fine waste plastic is illustrated in
Figure 3. Finally, sieve analysis and the required size of plastic aggregate were determined, as illustrated in
Figure 3.
Table 4.
Physical properties of plastic and glass waste.
Table 4.
Physical properties of plastic and glass waste.
| Properties |
Test Results |
ASTM Code Standards [49] |
| |
Plastic waste |
Glass waste |
Recommended |
| Fineness modulus (FM) |
2.52 |
2.56 |
- |
| |
|
|
|
| The nominal maximum size, (mm) |
0.075 –4.00 |
0.075 –4.00 |
- |
| |
|
|
|
| Specific gravity (SSD basis) |
1.09 |
2.62 |
2.3 ‒2.9 |
| |
|
|
|
| Unit weight, (kg/m3) |
65 |
2450 |
1280–1920 |
| |
|
|
|
| Water absorption capacity, (%) |
0.00 |
0.01 |
0.4–4.0 |
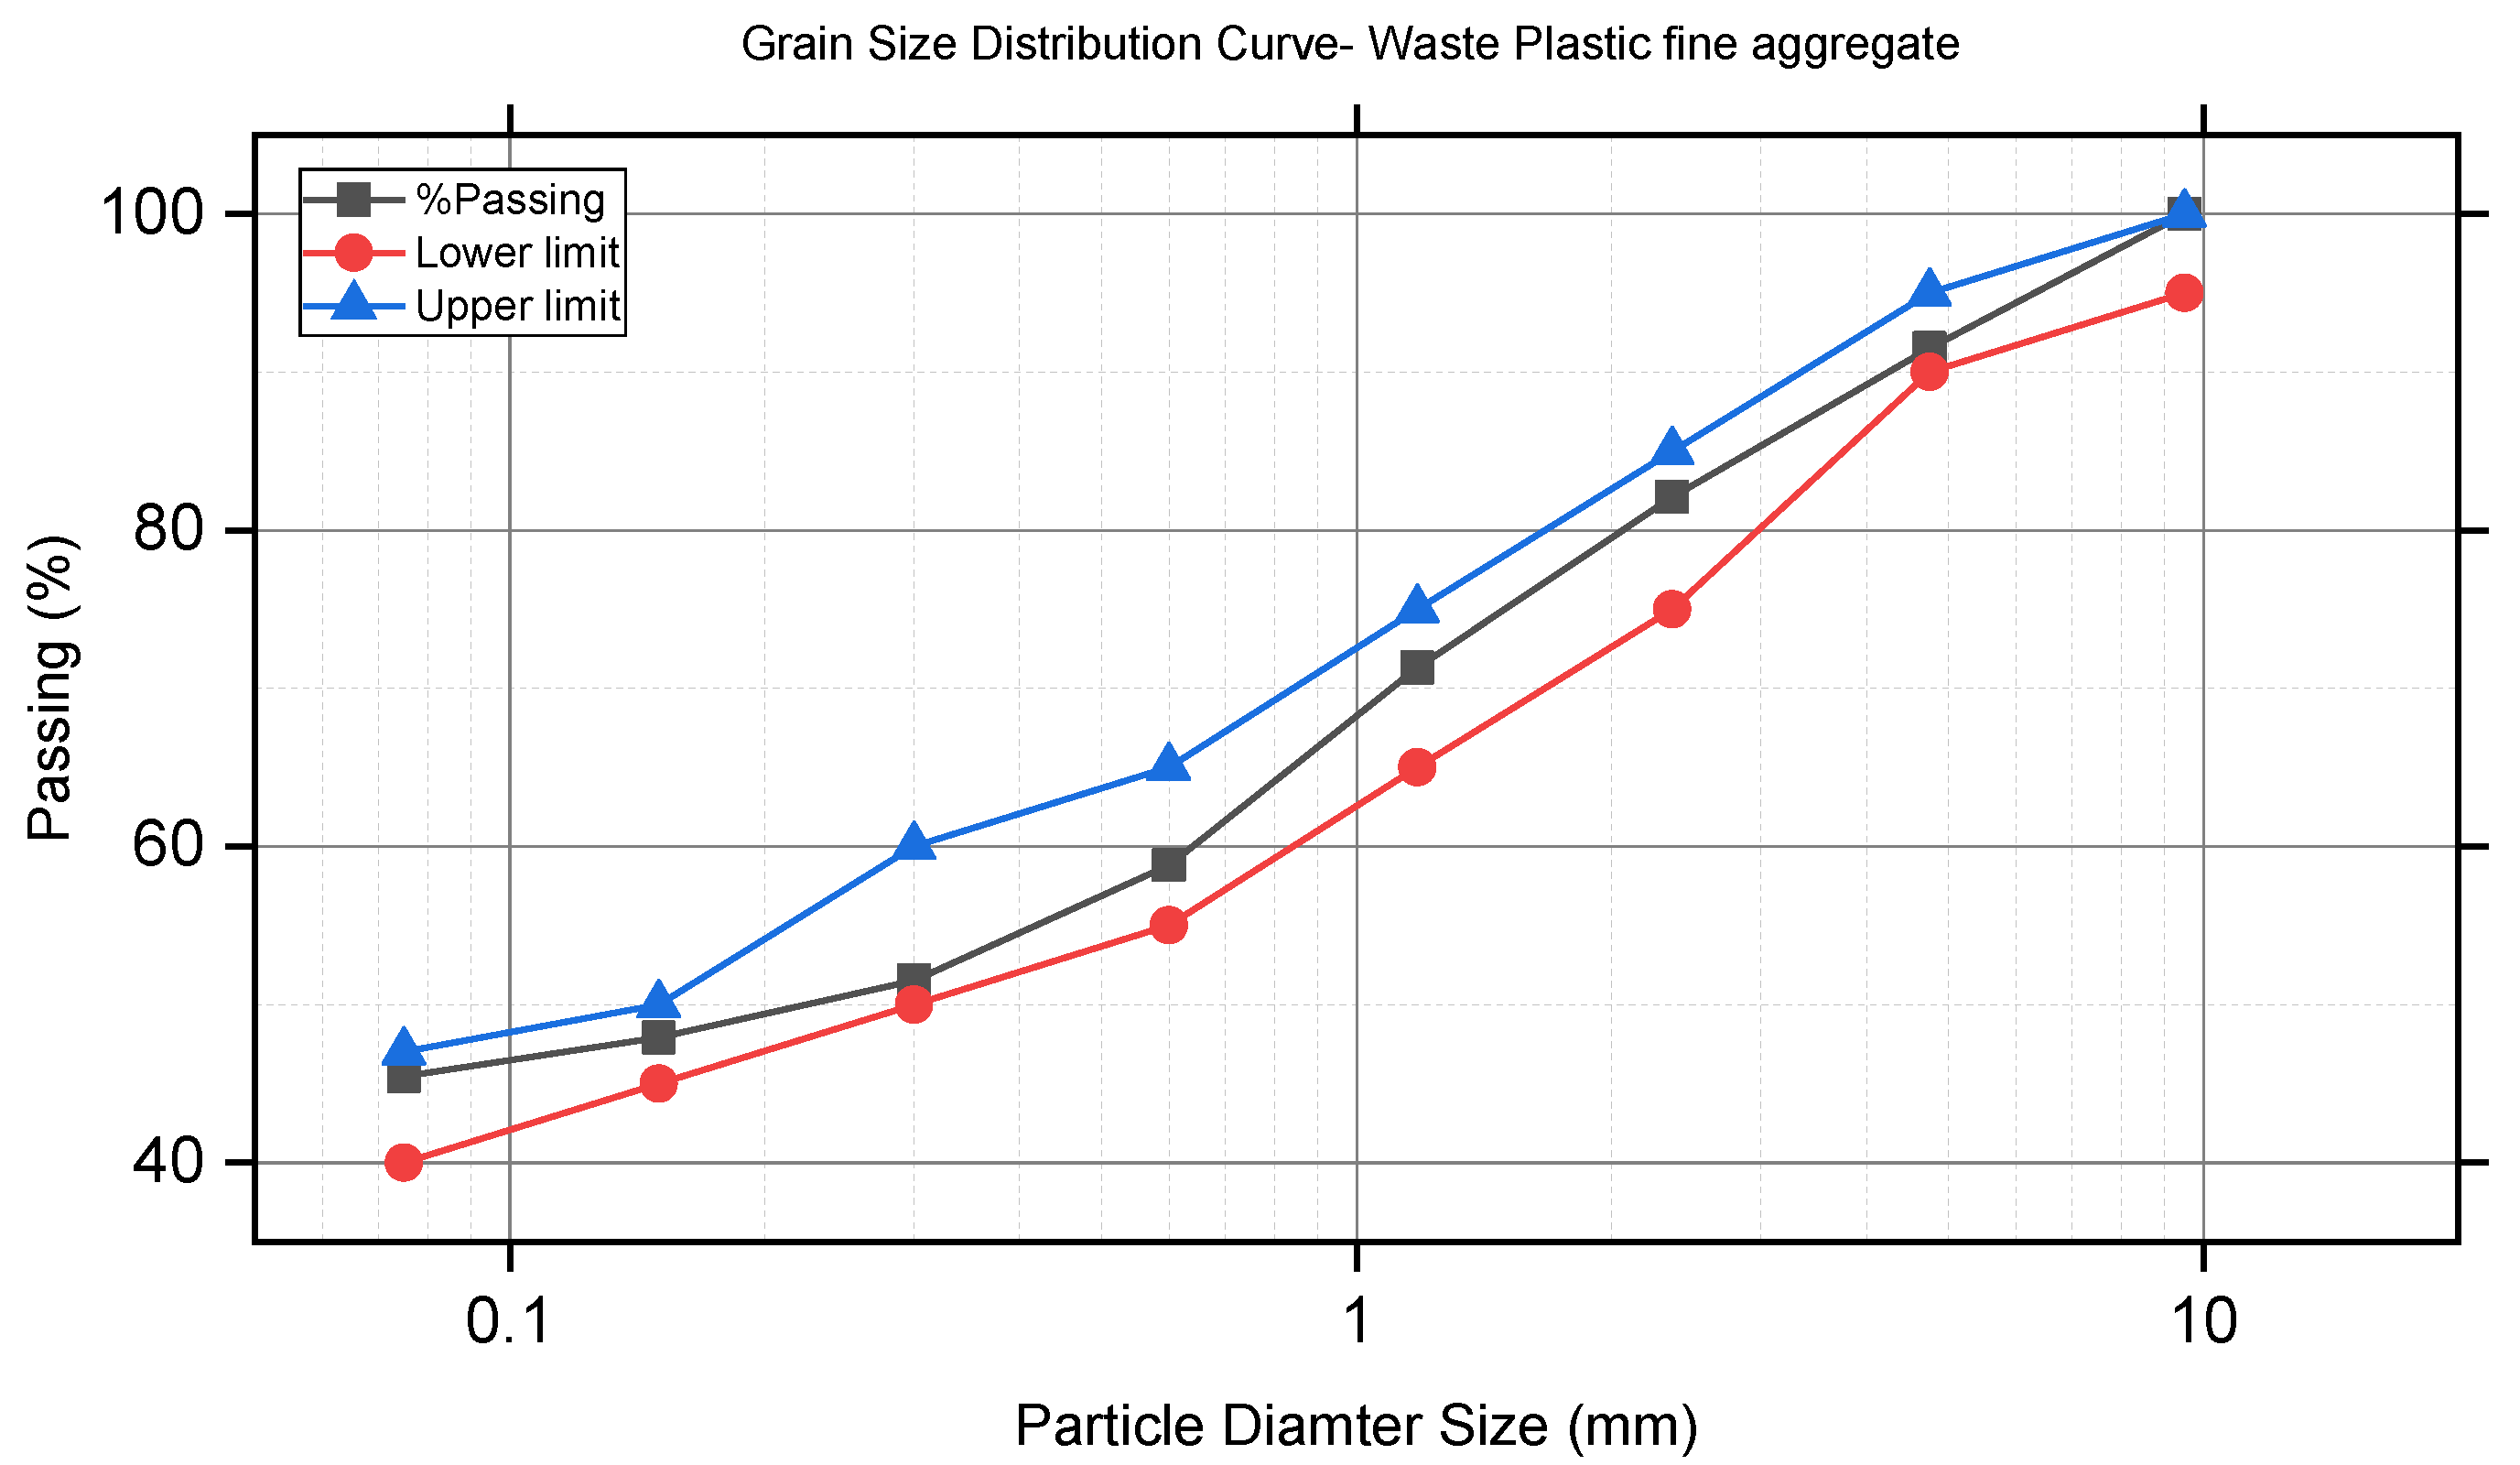
The grain size distribution curve of fine- waste plastics is illustrated in
Figure 4.
2.4. Waste Glass
Seventy-two (72) kg waste glass materials were used throughout this experimental study, gathered from the disposals of reconstruction and building demolishing projects in Jimma town bore solid waste dumping site. Soda-lime type glass is used for investigation throughout this research study among different glasses. Under this task, the collection of waste and glass focuses on a ‘bore’ dumping site in Jimma town. The collected waste glass is contaminated with impurities that may alter the glass’s chemical and physical properties. Therefore, waste glass was cleaned with pure water to remove impurities. Then, the cleaned waste glass was ground into a fine aggregate size manually by using the hammer.
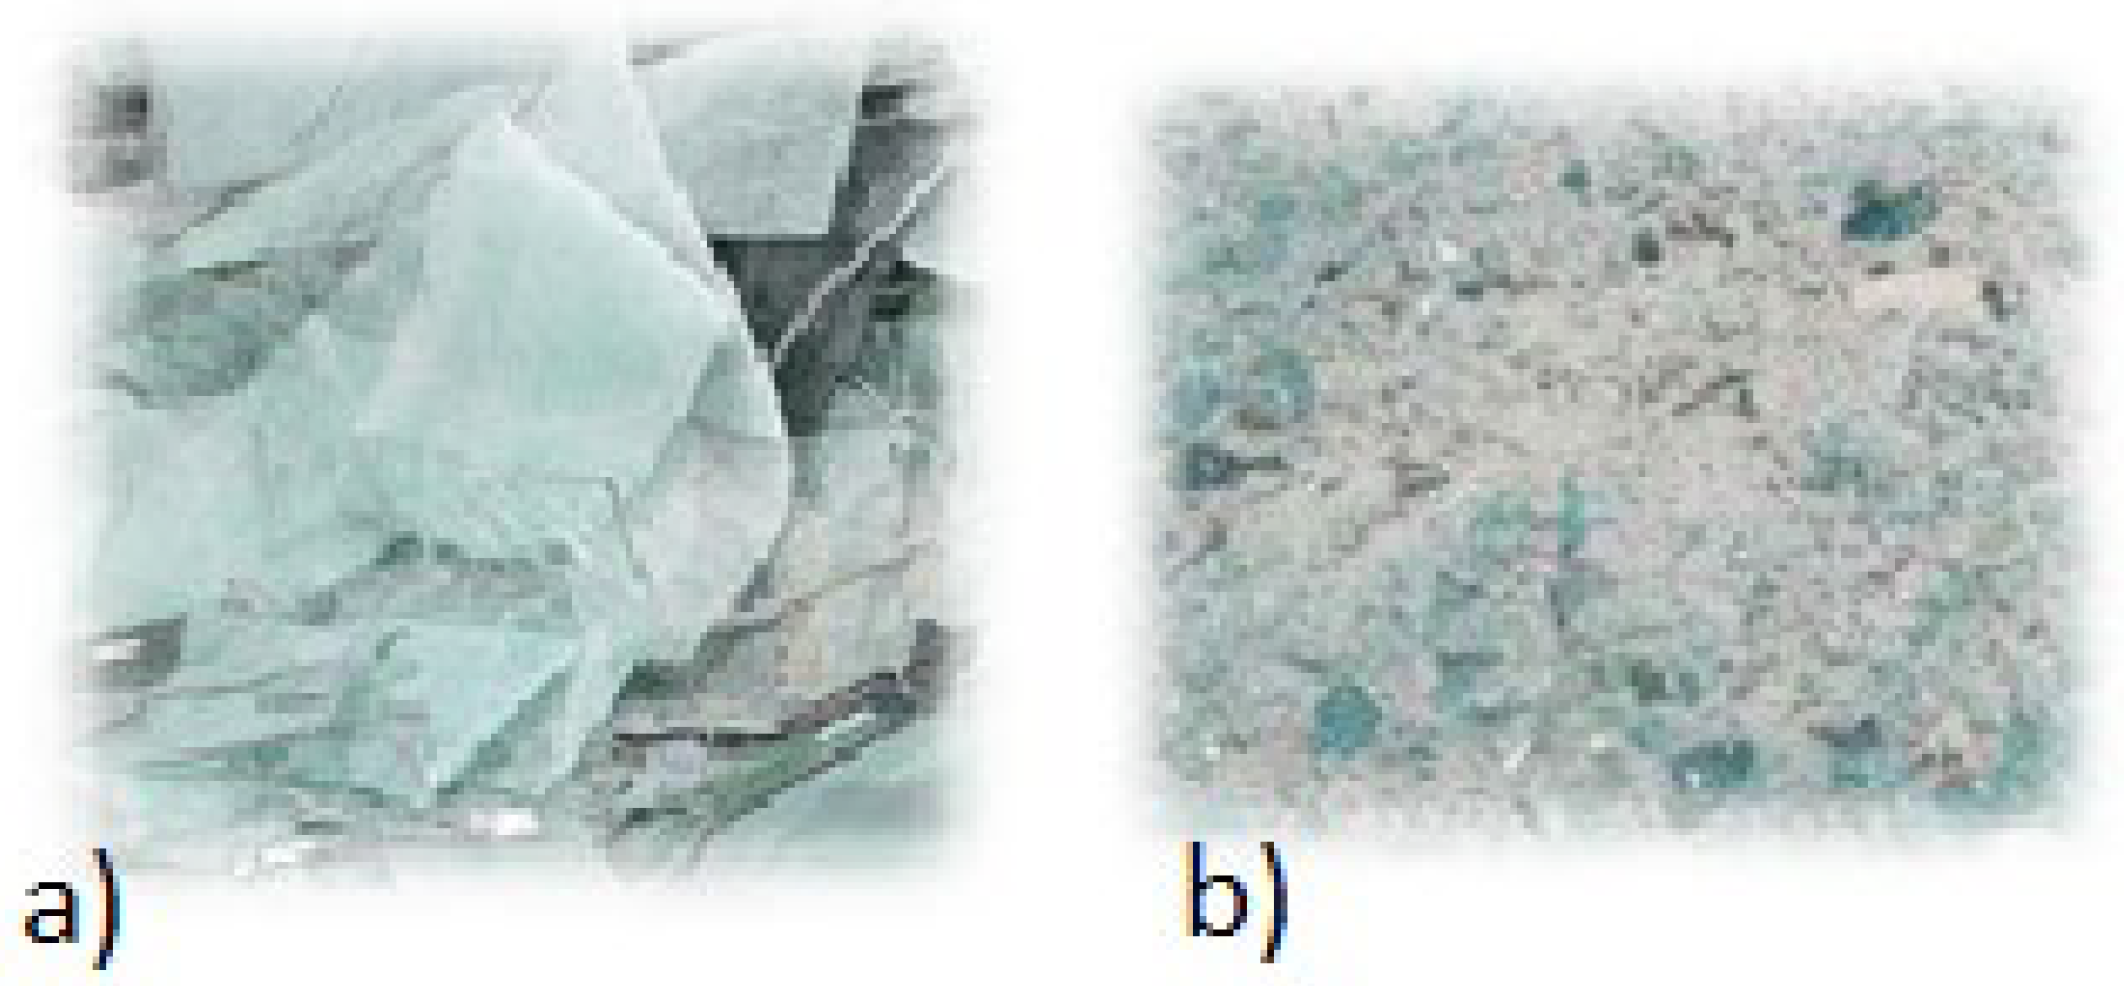
Finally, crushed waste glass was sieved, and a required size was obtained, as shown in
Figure 5.
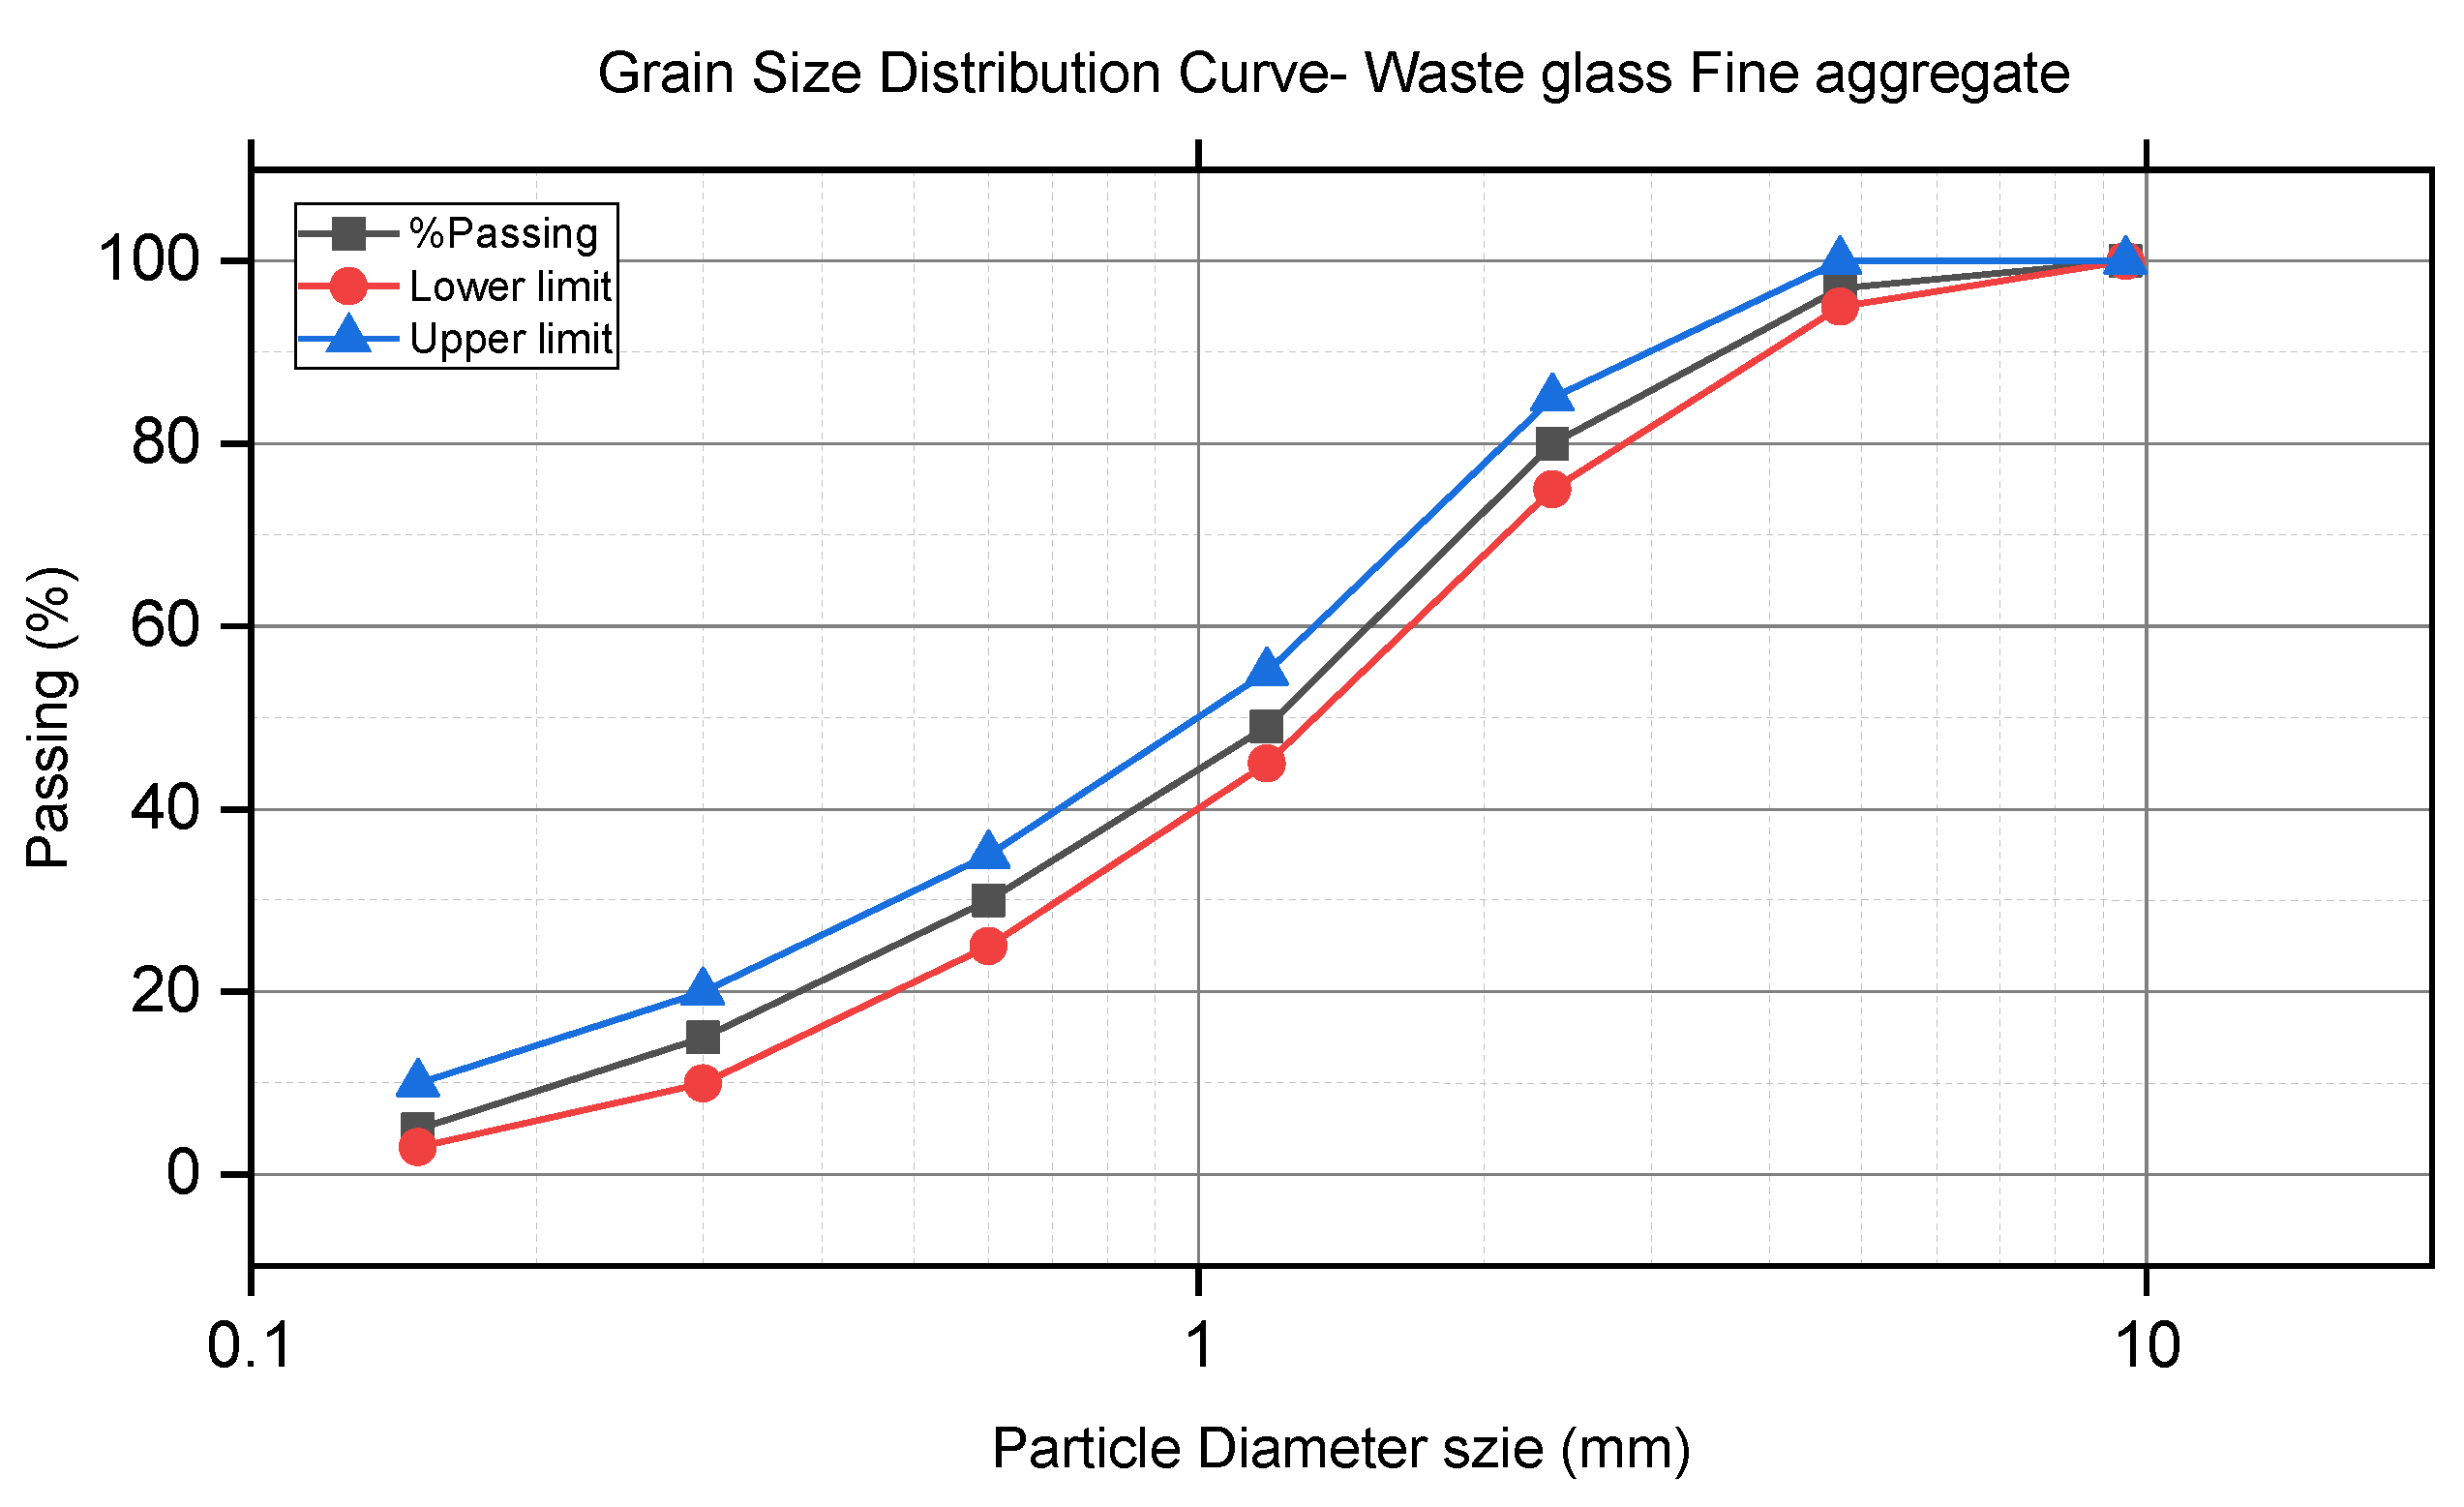
The grain size distribution curve of fine waste glass is illustrated in
Figure 6.
2.5. Mix Designing and Proportioning
The material properties (cement, aggregate, shredded plastics, and waste glass) and concrete characteristics containing the waste glass and plastic were examined. In addition, the mathematical approach to the volume-based analysis of materials is considered for concrete mix production to evaluate physical and mechanical properties (workability, compressive strength, flexural strength, and splitting tensile strength).
The appropriate quantities of cement, sand, aggregates, waste plastics, and glass were used to create a concrete mix. The main purpose here was to find the most cost-effective and practical mixture of waste plastics and glass replacements that could be utilized to manufacture concrete that met the performance standards of concrete under loads and in diverse environments.
2.5.1. Mix Design for Waste Plastics to Glass
Different trial mixes were proportioned by observing concrete’s workability and compressive strength to obtain the appropriate waste plastic and glass ratio. As a result, the optimum ratio of WP to WG was determined.
With different controlling factors, such as water-cement ratio, waste plastics, and glass proportions, four mixes and 72 standard compressive sample specimens were used in the experiments. For comparison purposes, the reference testing samples were plain concrete with no WG and WP content.
Table 5 summarizes the complete experimental plan.
2.5.2. Mix Design for Fine Aggregate, Waste Plastic and Glass
The testing program continued focusing only on the two mixes with optimal output results, i.e., sample WPG-0 at a water-cement ratio of 0.4 and 19% of the fine aggregate replaced by WG and WP. Based on these results, an extra series of 12 tests were conducted to determine the flexural strength and the splitting resistance of the two optimal concrete mixes.
Table 6 summarizes the mix properties of the concrete mix without any waste glass and plastics content for three various water-cement ratios. These ratios cover the most widely applicable engineering practice, from 0.4 to 0.6. The mixes conform to the standards and specifications of ASTM C136 and ASTM C 33-03. Finally, the mix proportion for C-25 concrete grade was tabulated in
Table 6 with different water-cement ratios and in
Table 7 with 0.4 water-cement ratios.
The mixed proportion for compressive strength at the 7th and 28th days with different water cement ratio are summarized in
Table 8.
Second, the mix proportion was tabulated to determine concrete’s flexural and splitting tensile strength in
Table 9 and
Table 10.
2.6. Concrete Specimens Preparation
Initially, a certain amount of water was added to the aggregates and left for a short while to bring the aggregates to the saturated surface dry condition (SSD). Next, the fine aggregate, coarse aggregate, and cement were dry mixed for about a minute. Next, the waste fine glass and plastics were carefully added during the dry mix to avoid segregation and then followed by adding two-thirds of the total mixing water.
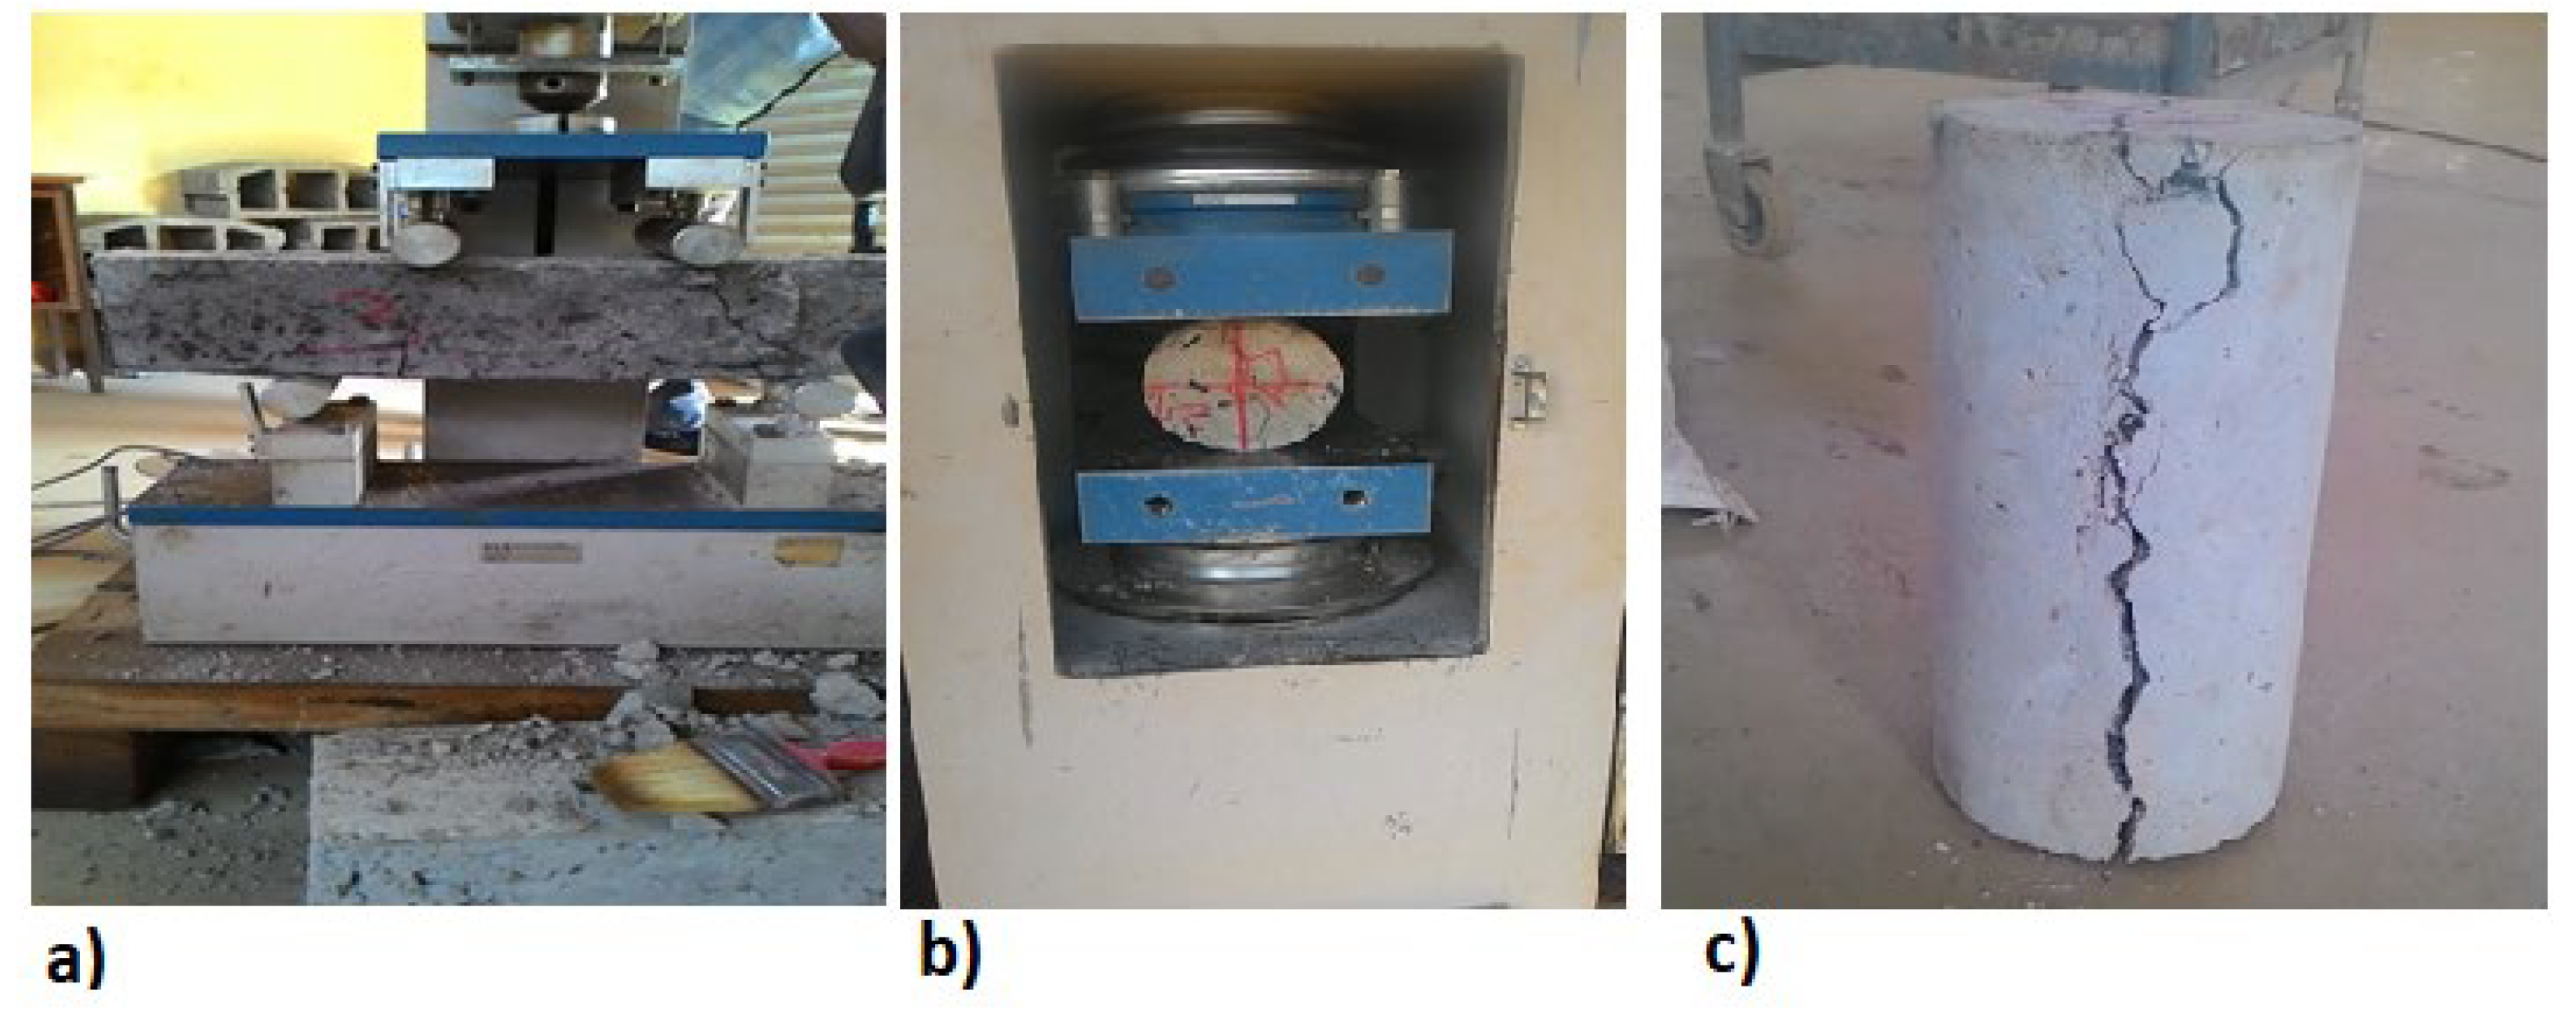
Twelve 150 mm cubes, three 150 x 300 mm cylinders, and three 100 x 100 x 500 mm beams were cast for each mix. Cubes were used to measure the compressive strength on the 7th and 28th days. In addition, the 28th day’s tensile strength and flexural tensile strength were evaluated using cylinder specimens and beam specimens, as shown in
Figure 7.
3. Results and Discussions
3.1. Setting Time and Consistency of Cement
Referring to
Table 11, the initial setting time of cement (Derba Cement) used in the investigation was 52 min. According to ASTM C 150, the setting time of cement must not be less than 45 min. Therefore, the experiment results are acceptable. Additionally, the final setting time of Derba cement obtained from the experiment result was 320 min. According to ASTM C 150, the final setting time of cement must not be greater than 375 min. Therefore, the final setting time of cement obtained from the experiment satisfied the standard requirements. On the other hand, the Ethiopian standard recommends that the initial setting time for cement be 45 min and the final setting time be 10 h [
43]. Therefore, the initial and final setting time obtained from the test results agrees with the Ethiopian standard of testing setting time of cement.
The usual range of water-cement ratios for normal consistency is between 26 and 33%. From the experiment, the percentage by weight of dry using 112 mL of the water is 28% with a penetration of 9.25 mm. Hence, it is concluded that the amount of water required for the normal consistency of Debra Portland cement in the experiment was approximately 112 mL.
3.2. The Test Program for Concrete Mix-Design
The mechanical behavior of concrete test with standard cubes specimens’ dimensions (150 x 15 x 150 mm) was carried out to analyze the behavior of concrete subjected to uniaxial loads according to ACI 544.2R-89. For laboratory producers, the concrete grade C-25 compressive strength was used to understand the effect of compressive strength.
Using the estimated quantity of wastes in the mix at the water-cement ratio of 0.4 and observing the effect of waste on the 7th day of compressive strength of concrete from
Table 13, ratios of plastics to glass in the mix were determined.
As shown in
Table 13, the compressive strength increases as the number of plastics in the mix decreases and the combination’s glass increases. It shows that the addition glass has more effect for the compressive strength of concrete than that of plastics.
The concrete compressive strength on the 7th day for the ratio of WP to WG (1:1,1:1.5, 1:2,1:2.5, and 1:3) was compared with concrete compressive strength with no wastes in the mix. From the proportions of the plastics to glass, a ratio of (1:2) is selected because, in the first two ratios, compressive strength decreased while in the (1:2.5) ratio and (1:3) ratio, the amount of glass is high and plastics was low, but the strength met the standard. However, these ratios were not selected since the quantity of glass in the mix was more significantly higher than the combined plastics. However, in the Jimma disposal area, the quantity of plastics was 7%, and glass was 2% of solid wastes.
In the ratio of plastic to glass (1:2), the compressive strength 27 MPa was higher compared to plain concrete (20.6 MPa), and the amount of waste was equivalent without affecting the compressive concrete Strength.
Thus, it is inferred that the replacement of sand with plastic waste up to 15% can be adopted so that disposal of used plastic can be reduced, and deficiency of natural aggregate can be managed effectively [
50].
When 30% of the fine aggregate was replaced by waste glass, the strength was only about 1 % lower than that of the control, which is a promising result [
32]. Therefore, the (1:2) ratio was selected as the optimum ratio of plastics to glass in the mix during the investigation.
3.3. Effect of Waste Plastics and Glass on the Workability of Concrete
As shown in
Table 14, the fresh concrete workability is inversely affected by the increase in water-cement ratio and decreases as the percentage of fine WP and WG was increased.
Clearly, fine WP and WG in concrete significantly decreased workability. Specifically, for w/c of 0.4 replacing 10% of fine aggregate with fine WP and WG increment, the change is negligible. However, it significantly decreases workability for w/c of 0.5 and above the fine WP and WG introduced to the concrete.
Generally, the water to cement ratio affected concrete workability rather than the introduction of waste plastics and glass to the mix.
3.4. Unit Weight Test Results
The results for different sample groups regarding unit weight for hardened concrete are listed in
Table 15.
It was shown that the concrete unit weight decreased as the water-cement ratio increased. For example, at a water-cement ratio of 0.4, the maximum reduction was 1.7%; at a water-cement ratio of 0.5, the maximum reduction in unit weight was 5.5%; and at a water-cement ratio of 0.6, the maximum reduction was 8.67%. According to ASTM C 33, the concrete unit weight at w/c=0.4 fulfills the requirements of normal weight concrete: it must be between (2.2-2.4) (gm./cm³). Therefore, a water-cement ratio of 0.4 was selected for the investigation since the percentage of reduction in unit weight was minimal.
3.5. Effect of Waste Plastics and Glass on Compressive Strength of Concrete
At water-cement ratios of 0.4 and 10% WP and WG, compressive strength at the 7th and 28th days was increased by 12.55% and 6.44%, respectively. Nevertheless, at w/c=0.5 and 0.6 and all introductions of WP to WG, the compressive strength at 7 and 28 days was decreased. On the other hand, at 20% replacement, a reduction was observed by 14.35% and 0.73% on the 7th and 28th day, respectively. In this case, the concrete designs for C-25, and on the 28th day, the compressive strength was 26.9 MPa. Therefore, if the impact of the WG and WP on the environment was considered a primary issue, it is possible to use up to 20% replacement for fine aggregate for simple structures where lightweight concrete is required.
Table 16.
shows the 7th and 28th day’s compressive strength of concrete with several fine waste plastic to glass content at different water-cement ratios.
Table 16.
shows the 7th and 28th day’s compressive strength of concrete with several fine waste plastic to glass content at different water-cement ratios.
| Samples |
w/c |
WP and WG (%) |
WP: WG |
Compressive Strength (MPa) |
Strength change (%) |
| 7 days |
28 days |
7 days |
28 days |
| PG-0 |
0.4 |
0 |
0 |
22.3 |
27.1 |
0.00 |
0.00 |
| PG-1 |
10 |
3:7 |
25.1 |
28.9 |
+12.55 |
+6.64 |
| PG-2 |
20 |
6:14 |
19.1 |
26.9 |
-14.35 |
-0.73 |
| PG-3 |
30 |
10:20 |
15.0 |
25.4 |
-32.74 |
-6.27 |
| PG-0 |
0.5 |
0 |
0 |
20.7 |
27.3 |
0.00 |
0.00 |
| PG-1 |
10 |
3:7 |
19.1 |
26.8 |
-7.73 |
-1.83 |
| PG-2 |
20 |
6:14 |
18.3 |
25.2 |
-11.59 |
-7.70 |
| PG-3 |
30 |
10:20 |
16.8 |
25.0 |
-18.84 |
-8.82 |
| PG-0 |
0.6 |
0 |
0 |
20.5 |
27.0 |
0.00 |
0.00 |
| PG-1 |
10 |
3:7 |
15.5 |
22.5 |
-24.39 |
-16.67 |
| PG-2 |
20 |
6:14 |
16.2 |
21.5 |
-20.97 |
-20.37 |
| PG-3 |
30 |
10:20 |
14.3 |
19.2 |
-30.92 |
-28.89 |
3.6. Optimal Waste Plastics and Glass Contents in Concrete Mixes
The optimum compressive strength was obtained at 20% of WG and WP replacement for fine aggregate.
Table 17.
shows the7th and 28th days’ compressive strength of concrete at w/c=0.4.
Table 17.
shows the7th and 28th days’ compressive strength of concrete at w/c=0.4.
| Group no. |
WP and WG (%) |
7-Days Compressive Strength (MPa) |
28-Days Compressive Strength (MPa) |
| PG-0 |
0 |
22.3 |
27.1 |
| PG-1 |
10 |
25.1 |
28.9 |
| PG-2 |
20 |
19.1 |
24.9 |
| PG-3 |
30 |
15.0 |
24.4 |
3.7. Effect of Waste Plastics and Glass on Flexural Strength
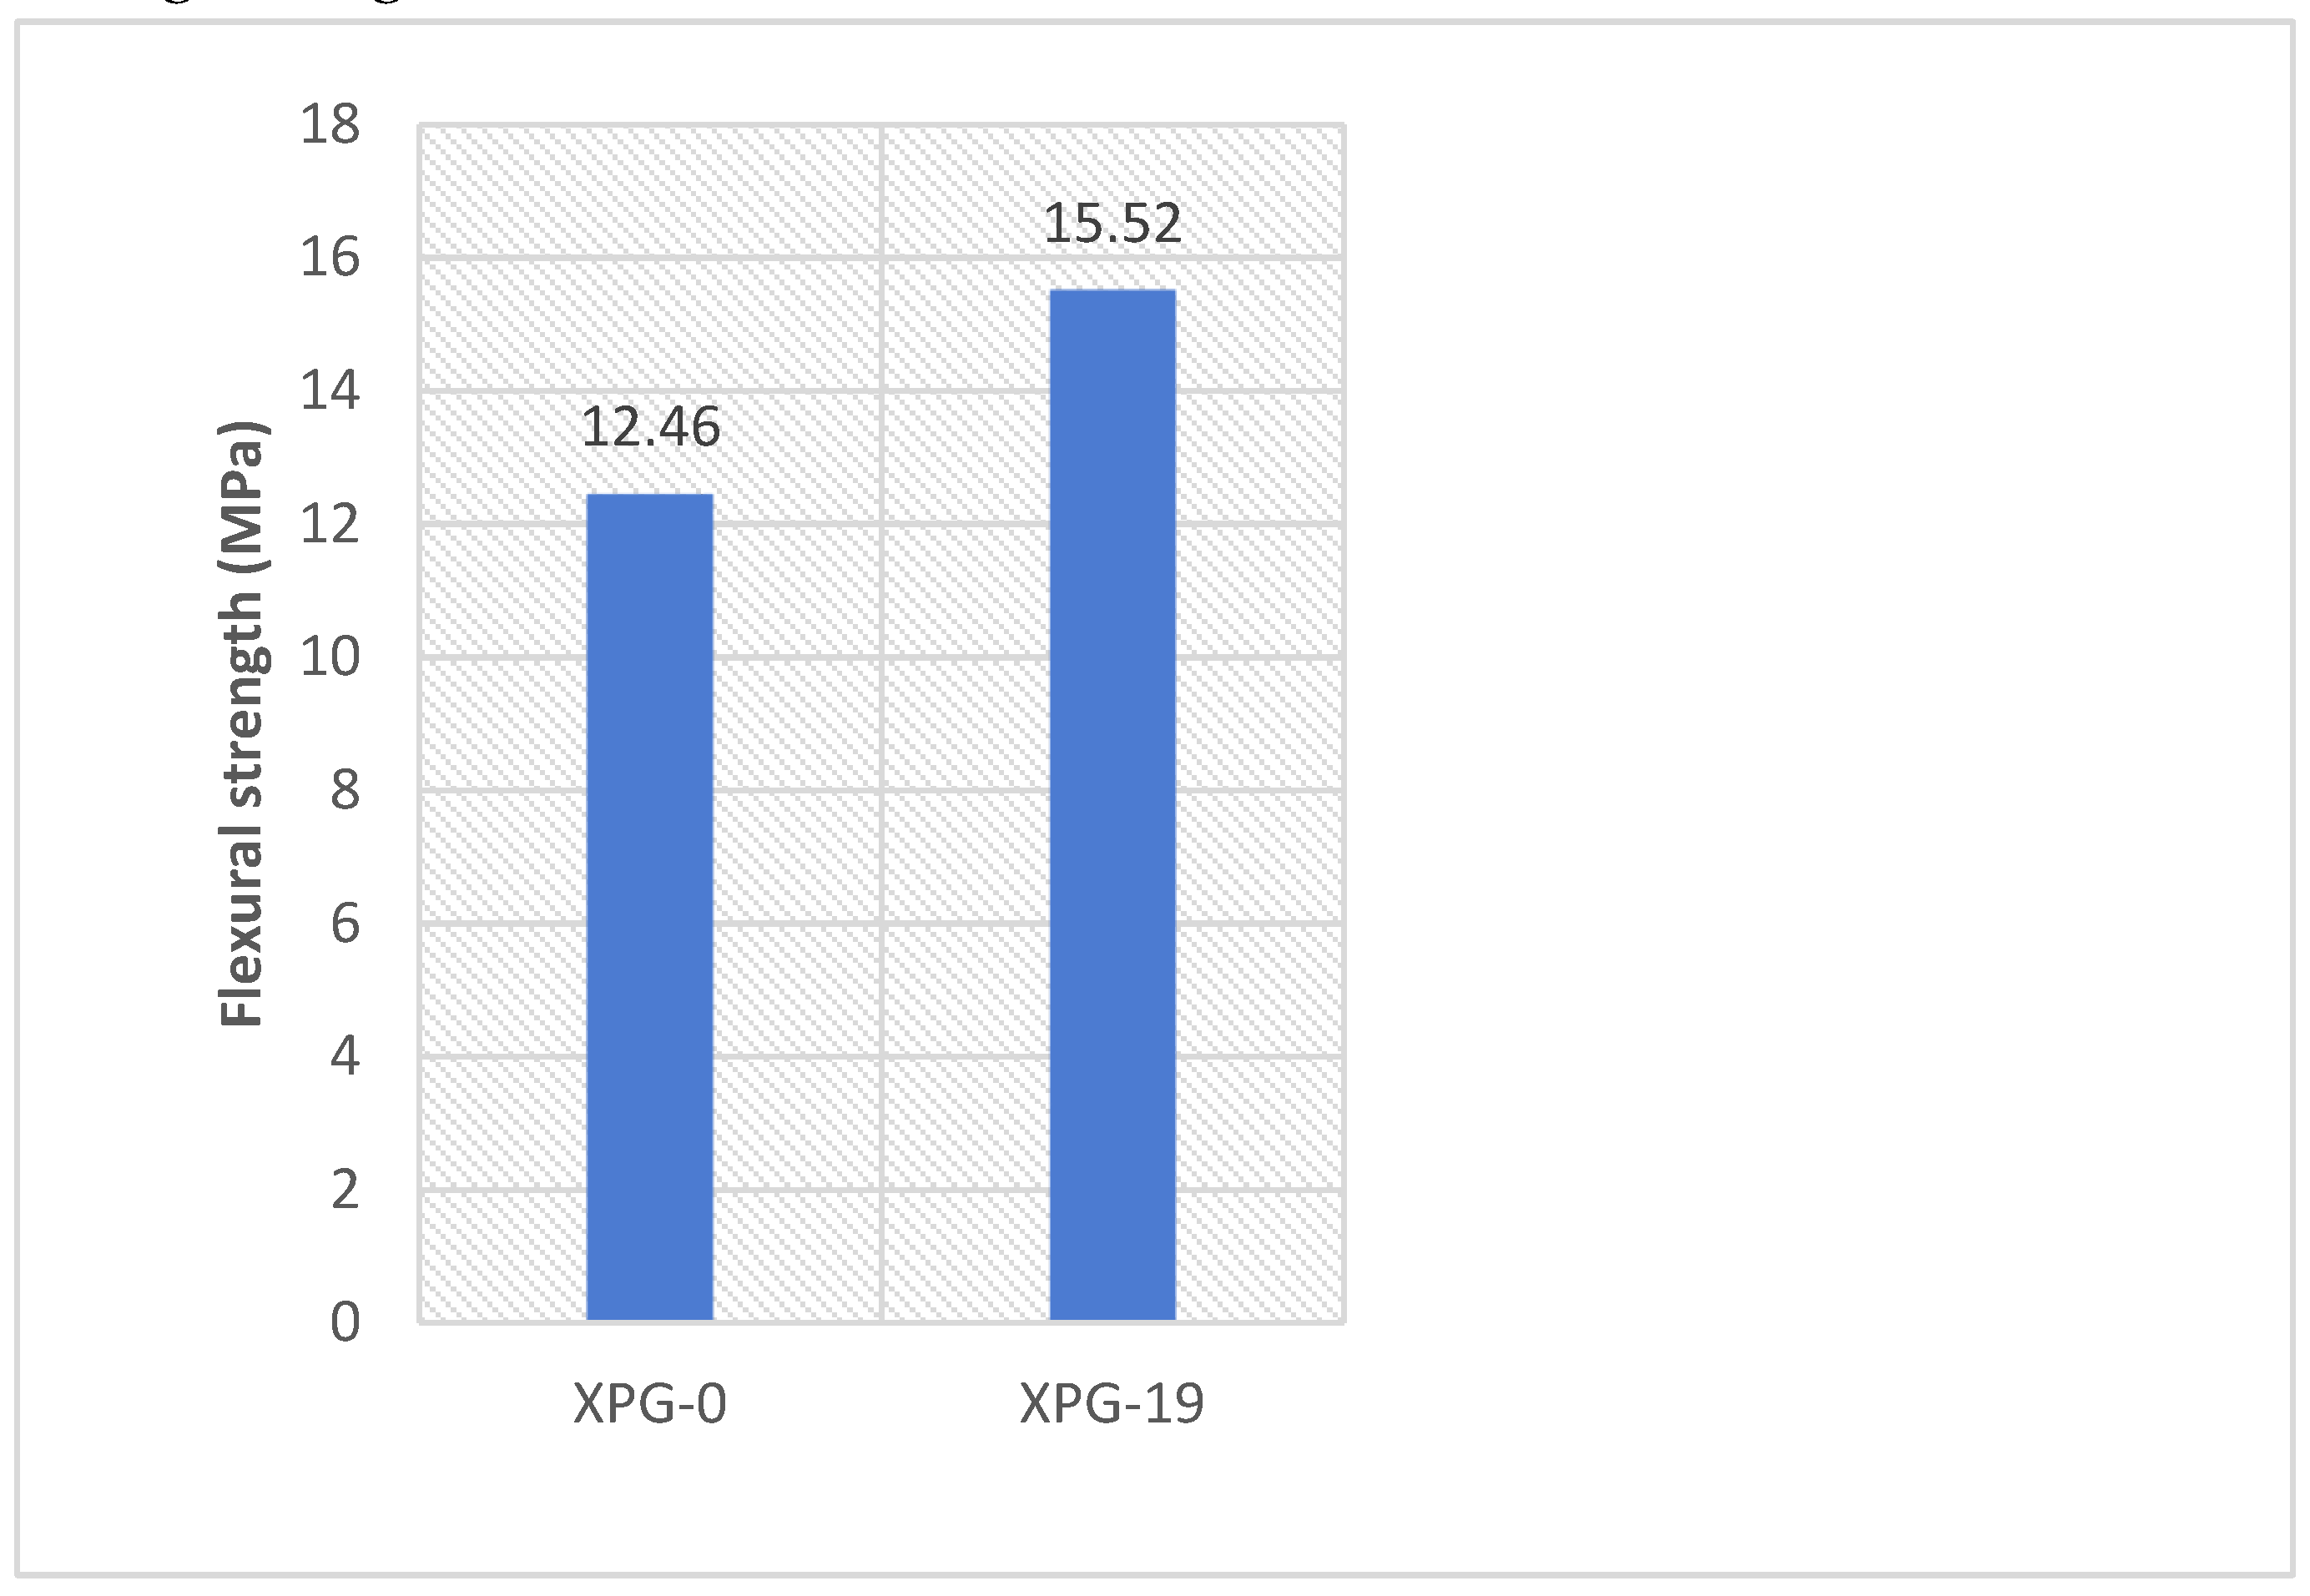
The prepared beam samples were tested after 28th days of standard curing, and the results of flexural strength tests for the control concrete and the waste plastics and glass concretes are illustrated in
Figure 8. The bending strength of the concrete (σ) in MPa was obtained based on Equation 1.
Where: σ- bending strength, M- maximum moment, I- moment of inertia and C-centroid depth
The results show that optimal fine-aggregate WP and WG content in the concrete mix increased the flexural strength by 19.7% from 12.46 MPa to 15.52 MPa.
3.8. Effect of Waste Plastics and Glass on Splitting Tensile Strength of Strength
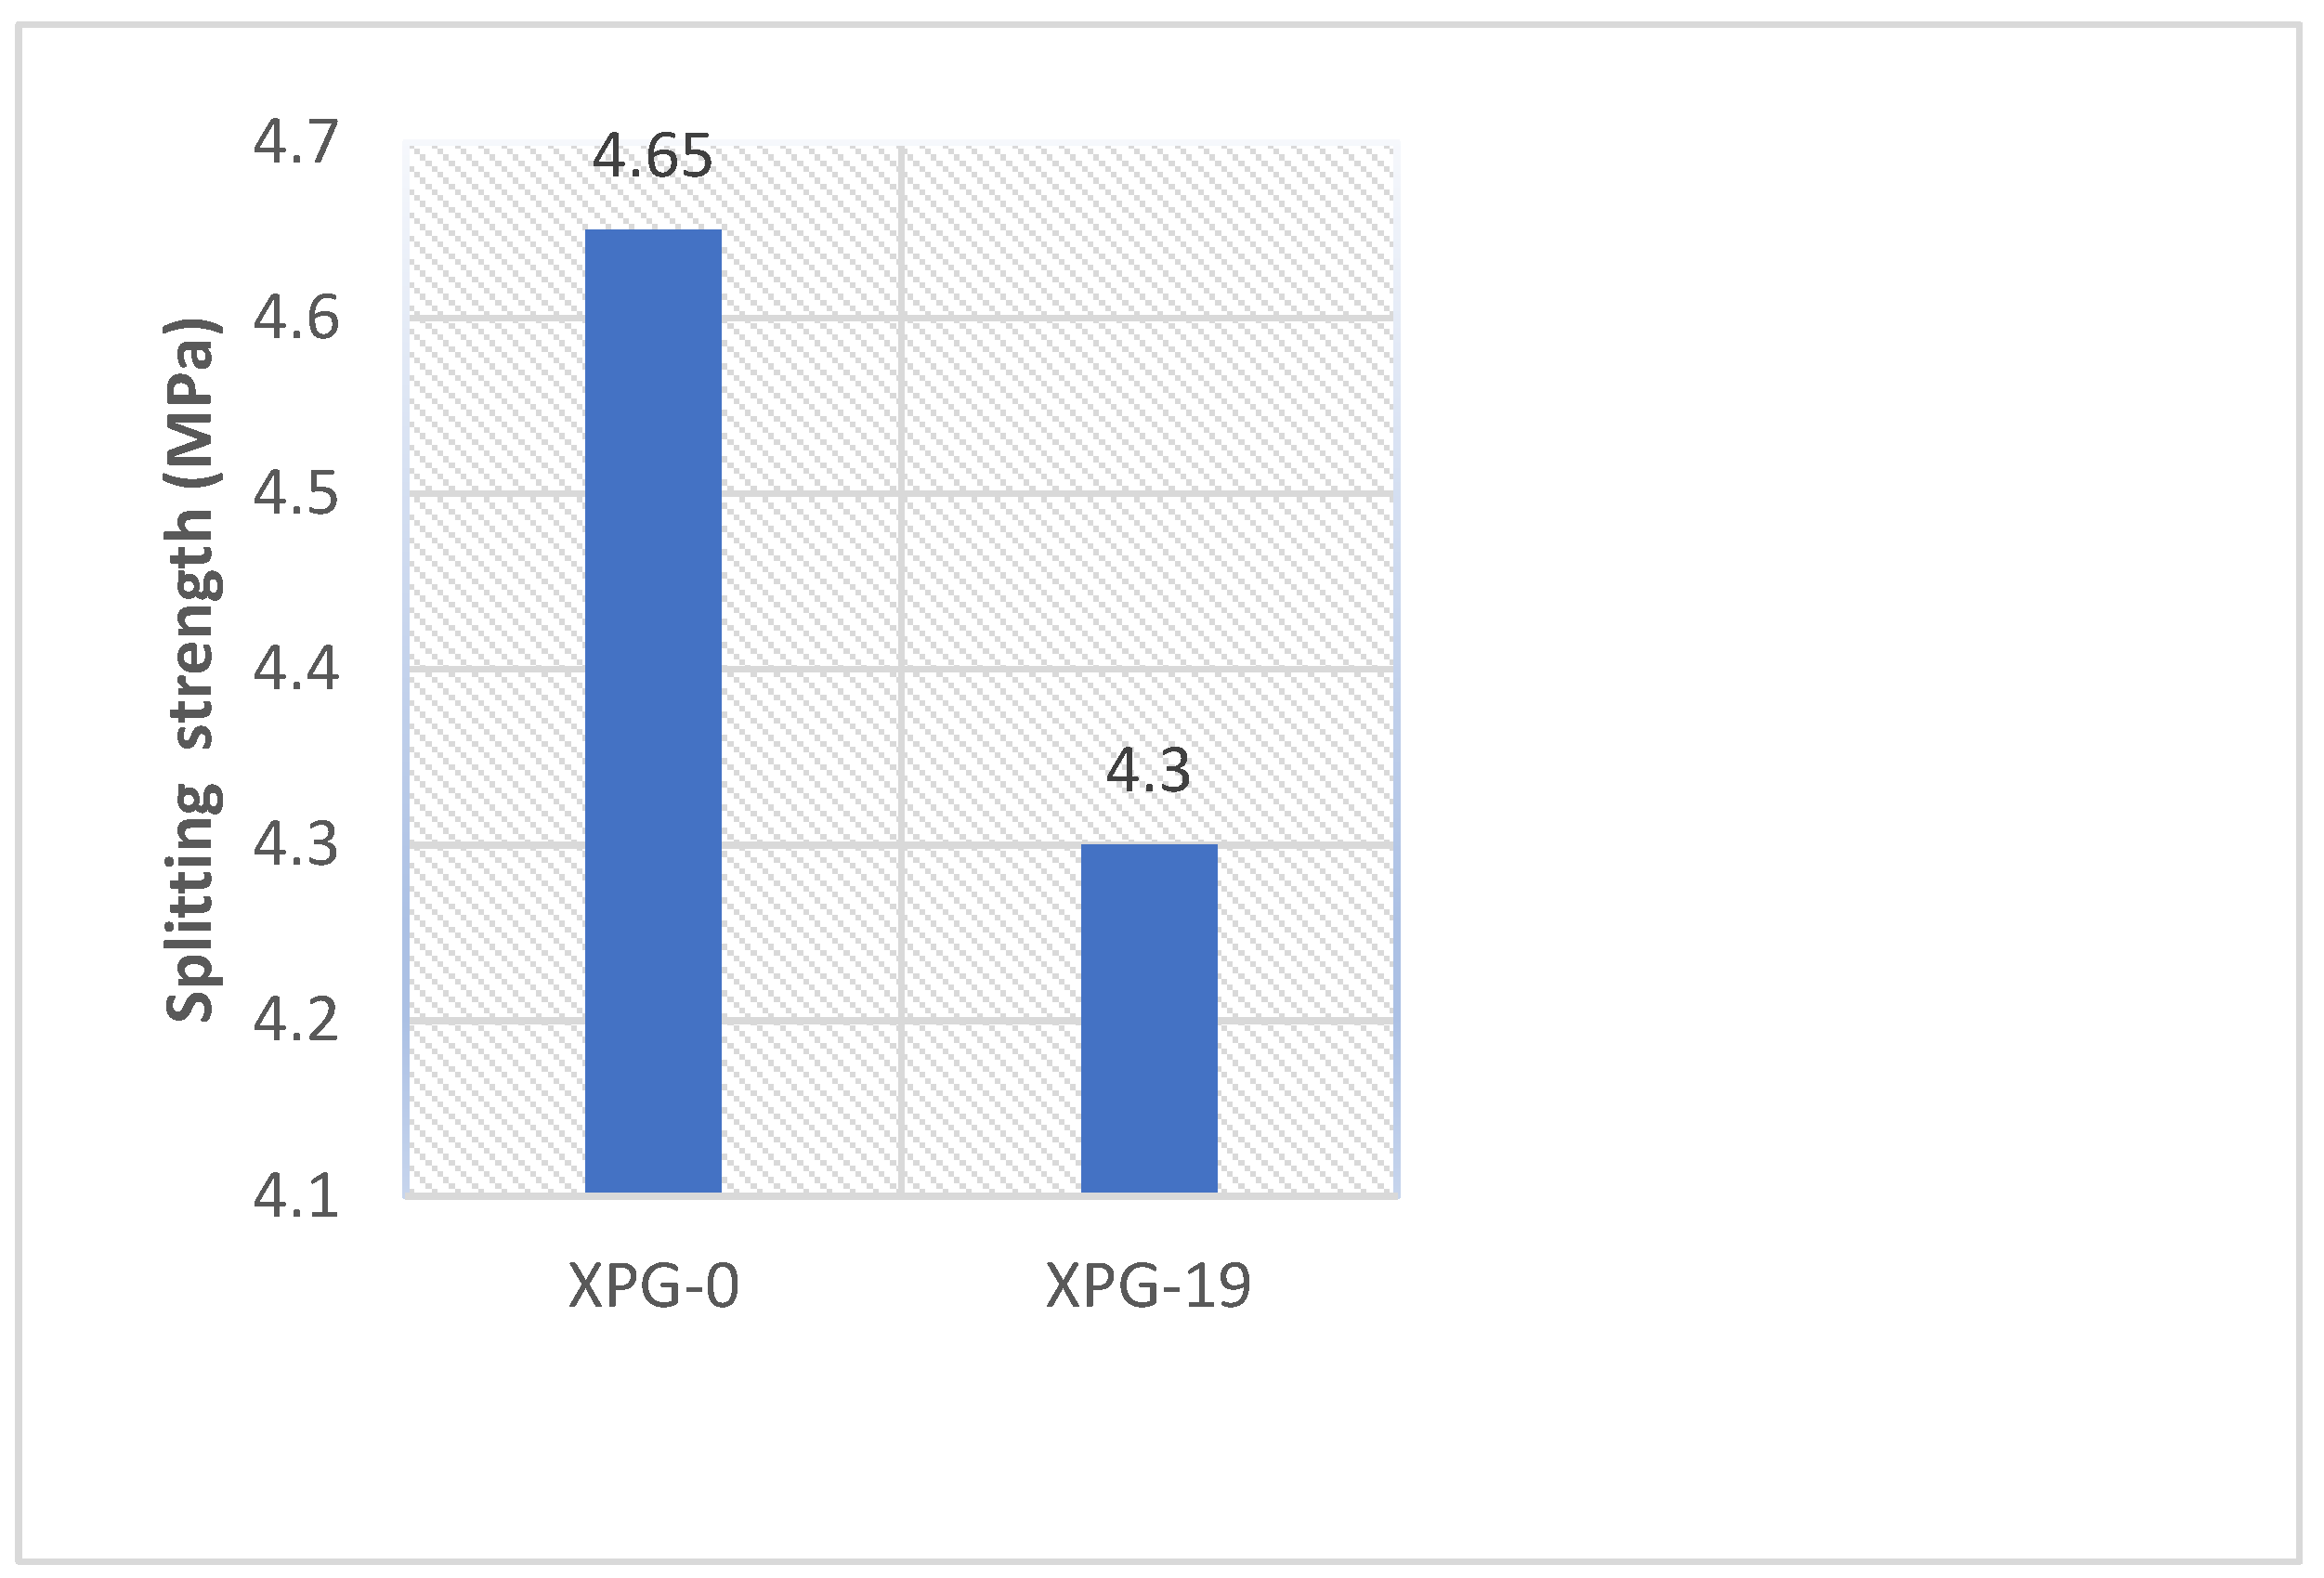
The results show that the use of optimal fine-aggregate WP and WG content in the concrete mix reduced the splitting tensile strength of the mixture slightly. Equation 2 gives the horizontal stress to which the element is subjected.
Where: P—The applied compressive load, L- The cylinder length, and D- The cylinder diameter.
Figure 9.
Graphical representation of the relationship between waste content and tensile strength.
Figure 9.
Graphical representation of the relationship between waste content and tensile strength.
The split tensile strength of the control mix was 4.7 MPa, and the inclusion of waste plastics and glass into the concrete resulted in a 4.3 MPa splitting tensile strength on the 28th day of curing. Therefore, the introduction of WP and WG slightly decreased splitting tensile strength compared to a plain concrete mix. The study conducted by [
51] conclude that, concrete mortar could be made completely sustainable by using recycled materials like glass, plastic, and recycled concrete, as well as micro-silica and fly-ash, and that only 20% of the weight of cement could be used without lowering the compressive and flexural strength of the concrete.
4. Conclusions
The main findings of the experimental study of concrete samples made from plastic and glass wastes as partial replacement of fine aggregate. Based on the findings of the study, the following conclusions are drawn:
The optimal mix ratio of plastics to glass waste was determined to be 1:2. This ratio was found to provide the best balance between the structural integrity and recyclability of the resulting material. Using this specific proportion ensures that the composite material benefits from the desirable properties of both plastics and glass, making it suitable for various practical applications.
Incorporating waste plastics and glass into the concrete mix slightly reduced workability at water-cement ratios of 0.5 and 0.6. However, the workability remained unaffected when the water-cement ratio was 0.4.
The investigation determined that the optimal replacement of fine aggregate with waste materials was 20%, comprising 14% waste glass and 6% waste plastic. This finding highlights a balanced approach to enhancing the sustainability of concrete production.
The compressive strength of concrete increases as the proportion of plastics in the mix decreases and the amount of glass increases. This indicates that glass exerts a more significant influence on the compressive strength compared to plastics.
In concrete mixes containing the optimal proportion of fine waste plastics and glass, there was a significant enhancement observed in flexural strength. However, there was a slight decrease noted in splitting tensile strength.
Overall, these findings highlight the potential for sustainable construction practices by effectively integrating waste materials into concrete production processes.
Author Contributions
Conceptualization, A.L; Formal analysis, A.L and D.M; Investigation, A.L, D.M and F.F; Methodology, A.L and D.M; Writing—original draft, A.L, D.M, F.F, G.U and Y.B; Writing—review & editing, A.L, F.F, G.U and Y.B.
Funding
This research received no external funding
Data Availability Statement
Not applicable.
Conflicts of Interest
The authors declare no conflict of interest.
References
- M. Seddik Meddah, “Use of waste window glass as substitute of natural sand in concrete production,” IOP Conf. Ser. Mater. Sci. Eng., vol. 603, no. 3, 2019. [CrossRef]
- M. M. Muda, A. M. Legese, G. Urgessa, and T. Boja, “Strength, porosity and permeability properties of porous concrete made from recycled concrete aggregates,” Constr. Mater., vol. 3, no. 1, pp. 81–92, 2023. [CrossRef]
- M. Legese, T. G. Kenate, and F. F. Feyessa, “Termite Mound Soils for Sustainable Production of Bricks,” Stud. Geotech. Mech., vol. 43, no. 2, pp. 142–154, 2021. [CrossRef]
- G. T. Abegaz, I. Khan, and A. M. Legese, “Investigating the Effects of Coarse Aggregate Physical Properties on Strength of C-25 Concrete,” Am. J. Eng. Technol. Manag., vol. 5, no. 5, pp. 84–90, Nov. 2020. [CrossRef]
- F. F. Eshetu Tsega, Alemu Mosisa, “Effects of Firing Time and Temperature on Physical Properties of Fired Clay Bricks,” Am. J. Civ. Eng., 2017. [CrossRef]
- G. Etefa and A. Mosisa, “Waste rubber tires: A partial replacement for coarse aggregate in concrete floor tile production,” Am. J. Civ. Eng., vol. 8, no. 3, pp. 57–63, 2020. [CrossRef]
- K. G. and A. M. Legese, “Laboratory Investigation of Locally Produced Clay Brick Quality and Suitability for Load Bearing Element in Jimma Area, Ethiopia,” Int. J. Eng. Res. Technol, vol. 6, no. 5, pp. 809–817, 2017.
- Statista, “Global plastic waste volume 1950-2050,” statista, 2021. https://www.statista.com/statistics/1019774/plastic-waste-volume-globally/ (accessed Mar. 31, 2022).
- Dinku, “The need for standardization of aggregates for concrete production in Ethiopian construction industry,” in International Conference on African development archives, 2005, pp. 1–15.
- S. Agyeman, N. K. Obeng-Ahenkora, S. Assiamah, and G. Twumasi, “Exploiting recycled plastic waste as an alternative binder for paving blocks production,” Case Stud. Constr. Mater., vol. 11, p. e00246, 2019. [CrossRef]
- C. J. Liebenberg, “Waste recycling in developing countries in Africa: Barriers to improving reclamation rates,” in Proceedings of the Eleventh International Waste Management and Landfill Symposium, 2007, pp. 1–5.
- S. A. Miller, G. Habert, R. J. Myers, and J. T. Harvey, “Achieving net zero greenhouse gas emissions in the cement industry via value chain mitigation strategies,” One Earth, vol. 4, no. 10, pp. 1398–1411, 2021. [CrossRef]
- R. Latawiec, P. Woyciechowski, and K. J. Kowalski, “Sustainable concrete performance—CO2-emission,” Environ. - MDPI, vol. 5, no. 2, pp. 1–14, 2018. [CrossRef]
- T. Wang, R. S. Nicolas, A. Kashani, and T. Ngo, “Sustainable utilisation of low-grade and contaminated waste glass fines as a partial sand replacement in structural concrete,” Case Stud. Constr. Mater., vol. 16, p. e00794, 2022. [CrossRef]
- M. Thiam, M. Fall, and M. S. Diarra, “Mechanical properties of a mortar with melted plastic waste as the only binder: Influence of material composition and curing regime, and application in Bamako,” Case Stud. Constr. Mater., vol. 15, p. e00634, 2021. [CrossRef]
- N. Saikia and J. de Brito, “Use of plastic waste as aggregate in cement mortar and concrete preparation: A review,” Constr. Build. Mater., vol. 34, pp. 385–401, 2012. [CrossRef]
- Merlo, L. Lavagna, D. Suarez-Riera, and M. Pavese, “Mechanical properties of mortar containing waste plastic (PVC) as aggregate partial replacement,” Case Stud. Constr. Mater., vol. 13, p. e00467, 2020. [CrossRef]
- Y. Aocharoen and P. Chotickai, “Compressive mechanical properties of cement mortar containing recycled high-density polyethylene aggregates: Stress–strain relationship,” Case Stud. Constr. Mater., vol. 15, p. e00752, 2021. [CrossRef]
- S. Kane et al., “Biomineralization of Plastic Waste to Improve the Strength of Plastic-Reinforced Cement Mortar,” Mater. (Basel, Switzerland), vol. 14, no. 8, p. 1949, Apr. 2021. [CrossRef]
- P. O. Awoyera, O. B. Olalusi, S. Ibia, and K. Prakash A., “Water absorption, strength and microscale properties of interlocking concrete blocks made with plastic fibre and ceramic aggregates,” Case Stud. Constr. Mater., vol. 15, p. e00677, 2021. [CrossRef]
- S. Bahij, S. Omary, F. Feugeas, and A. Faqiri, “Fresh and hardened properties of concrete containing different forms of plastic waste – A review,” Waste Manag., vol. 113, pp. 157–175, 2020. [CrossRef]
- Almeshal, B. A. Tayeh, R. Alyousef, H. Alabduljabbar, and A. M. Mohamed, “Eco-friendly concrete containing recycled plastic as partial replacement for sand,” J. Mater. Res. Technol., vol. 9, no. 3, pp. 4631–4643, 2020. [CrossRef]
- S. Al-Luhybi and D. N. Qader, “Mechanical Properties of Concrete with Recycled Plastic Waste,” Civ. Environ. Eng., vol. 17, no. 2, pp. 629–643, 2021. [CrossRef]
- Y. Sharifi, M. Houshiar, and B. Aghebati, “Recycled glass replacement as fine aggregate in self-compacting concrete,” Front. Struct. Civ. Eng., vol. 7, no. 4, pp. 419–428, 2013. [CrossRef]
- M. Rashad, “Recycled waste glass as fine aggregate replacement in cementitious materials based on Portland cement,” Constr. Build. Mater., vol. 72, pp. 340–357, 2014. [CrossRef]
- Y. Lan-lan and L. Jiong-Feng, “Use of waste glass as coarse aggregate in concrete: Mechanical properties,” Adv. Concr. Constr., vol. 8, no. 1, pp. 1–7, Aug. 2019. [CrossRef]
- Ahmad et al., “Concrete with Partial Substitution of Waste Glass and Recycled Concrete Aggregate,” Materials (Basel)., vol. 15, no. 2, 2022. [CrossRef]
- S. Z. Ashiq, A. Akbar, K. Farooq, and H. Mujtaba, “Sustainable improvement in engineering behavior of Siwalik Clay using industrial waste glass powder as additive,” Case Stud. Constr. Mater., vol. 16, p. e00883, 2022. [CrossRef]
- M. Ibrahim, “Recycled waste glass powder as a partial replacement of cement in concrete containing silica fume and fly ash,” Case Stud. Constr. Mater., vol. 15, p. e00630, 2021. [CrossRef]
- R.-U.-D. Nassar, P. Soroushian, and M. Sufyan-Ud-Din, “Long-term field performance of concrete produced with powder waste glass as partial replacement of cement,” Case Stud. Constr. Mater., vol. 15, p. e00745, 2021. [CrossRef]
- H. Zhi-hai, Y. Ying, Z. Hao, C. Jing-yu, S. Jin-yan, and L. Bao-ju, “Waste glass powder and its effect on the fresh and mechanical properties of concrete: A state of the art review,” Adv. Concr. Constr., vol. 10, no. 5, pp. 417–429, Nov. 2020. [CrossRef]
- G. M. S. Islam, M. H. Rahman, and N. Kazi, “Waste glass powder as partial replacement of cement for sustainable concrete practice,” Int. J. Sustain. Built Environ., vol. 6, no. 1, pp. 37–44, 2017. [CrossRef]
- Małek, W. Łasica, M. Jackowski, and M. Kadela, “Effect of waste glass addition as a replacement for fine aggregate on properties of mortar,” Materials (Basel)., vol. 13, no. 14, pp. 1–19, 2020. [CrossRef]
- W. Team, “Pollution caused by solid waste, rubble, and construction debris is a serious threat to the sea and the shore of the Gaza Strip,” Palest. Ocha, 2009.
- K. G. Babu and D. S. Babu, “Behaviour of lightweight expanded polystyrene concrete containing silica fume,” Cem. Concr. Res., vol. 33, no. 5, pp. 755–762, 2003. [CrossRef]
- Olofinnade, A. Morawo, O. Okedairo, and B. Kim, “Solid waste management in developing countries: Reusing of steel slag aggregate in eco-friendly interlocking concrete paving blocks production,” Case Stud. Constr. Mater., vol. 14, p. e00532, 2021. [CrossRef]
- L. Bjerkli, “The cycle of plastic waste: An analysis on the informal plastic recovery system in Addis Ababa, Ethiopia,” Geografisk institutt, 2005.
- Shi and K. Zheng, “A review on the use of waste glasses in the production of cement and concrete,” Resour. Conserv. Recycl., vol. 52, no. 2, pp. 234–247, 2007. [CrossRef]
- İ. B. Topçu and M. Canbaz, “Properties of concrete containing waste glass,” Cem. Concr. Res., vol. 34, no. 2, pp. 267–274, 2004. [CrossRef]
- G. V Dhanani and M. P. D. Bhimani, “Effect of Use Plastic Aggregates as partial replacement of natural aggregates in concrete with plastic fibres,” Int. Res. J. Eng. Technol, vol. 3, pp. 2569–2573, 2016.
- K. G. Babu and D. S. Babu, “Performance of fly ash concretes containing lightweight EPS aggregates,” Cem. Concr. Compos., vol. 26, no. 6, pp. 605–611, 2004. [CrossRef]
- D. Y. Osei, “Experimental investigation on recycled plastics as aggregate in concrete,” Int. J. Struct. Civ. Eng. Res, vol. 3, no. 2, pp. 168–174, 2014.
- J. Premalatha and S. A. Ahmed, “Experimental study on concrete with plastic aggregates,” SSRG Int. J. Civ. Eng., pp. 358–363, 2017.
- P. Mathew, S. Varghese, T. Paul, and E. Varghese, “Recycled plastics as coarse aggregate for structural concrete,” Int. J. Innov. Res. Sci. Eng. Technol., vol. 2, no. 3, pp. 687–690, 2013.
- L. W. T. Tamang, T. Wangmo, K. T. Darjay, K. S. Phuntsho, P. Namgyal, and U. Wangchuk, “Use of plastics in concrete as coarse aggregate,” Int. J. Educ. Appl. Res, vol. 7, pp. 9–13, 2017.
- Dinku, “Construction materials laboratory manual,” Addis Ababa Univ. Print. Press. Addis Ababa, 2002.
- P. Cement, “ASTM C 150, Type I or II, except Type III may be used for cold-weather construction,” Provid. Nat. Color or white Cem. as required to Prod. mortar Color Indic., vol. 1, 1993.
- ASTM, “ASTM C136-06; Standard Test Method for Sieve Analysis of Fine and Coarse Aggregates,” in Hrvat. Vode, vol. 13, no. 50, 2005, pp. 85–86.
- ASTM C33 Aggregate Testing Standards, “Standard Specifications for Concrete Aggregates,” Annu. B. ASTM Stand., vol. 4, no. 2, 2001.
- S. Mindess, F. J. Young, and D. Darwin, Concrete, 2nd ed. Prentice Hall, Pearson Education, 2003.
- E. Najaf and H. Abbasi, “Using recycled concrete powder, waste glass powder, and plastic powder to improve the mechanical properties of compacted concrete: Cement elimination approach,” Adv. Civ. Eng., vol. 2022, no. 1, p. 9481466, 2022. [CrossRef]
Figure 1.
Grain size distribution curve of fine aggregate.
Figure 1.
Grain size distribution curve of fine aggregate.
Figure 2.
Grain size distribution curve of fine aggregate.
Figure 2.
Grain size distribution curve of fine aggregate.
Figure 3.
Fine waste plastic preparation process a) collection b) cleaning c) crashing d) melted and grinded.
Figure 3.
Fine waste plastic preparation process a) collection b) cleaning c) crashing d) melted and grinded.
Figure 4.
Grain size distribution curve of fine- waste plastics.
Figure 4.
Grain size distribution curve of fine- waste plastics.
Figure 5.
Granulated glass particles used for testing a) collected sample b) cleaned, crushed, and sieved waste glass was.
Figure 5.
Granulated glass particles used for testing a) collected sample b) cleaned, crushed, and sieved waste glass was.
Figure 6.
Grain size distribution curve of fine-waste glass.
Figure 6.
Grain size distribution curve of fine-waste glass.
Figure 7.
Sample under test a) flexural strength b) tensile strength c) failure under tensile test.
Figure 7.
Sample under test a) flexural strength b) tensile strength c) failure under tensile test.
Figure 8.
Flexural strength of C-25 concretes at 28 days with a water-cement ratio of 0.4.
Figure 8.
Flexural strength of C-25 concretes at 28 days with a water-cement ratio of 0.4.
Table 1.
Physical properties of Derba cement.
Table 1.
Physical properties of Derba cement.
| Physical properties |
Test Results |
Recommended value |
| Consistency (%) |
31 |
26–33 |
| Initial Setting Time (min) |
52 |
more than 45 min [47] |
| Final Setting Time (min) |
320 |
not more than 375 [47] |
Table 2.
Mechanical property of Derba cement.
Table 2.
Mechanical property of Derba cement.
| Mechanical property |
Test Results |
| 3rd day compressive strength (MPa) |
15.40 |
| 7th day compressive strength (MPa) |
20.75 |
| 28th day compressive strength (MPa) |
32.70 |
Table 5.
Experimental testing of compressive strength for concrete with fine-aggregate waste plastics to waste glass.
Table 5.
Experimental testing of compressive strength for concrete with fine-aggregate waste plastics to waste glass.
| Group No |
w/c ratio |
WP and WG with fine aggregate (%) |
WP: WG ratio |
Compressive strength tests |
| 7th day |
28th day |
| WPG-0 |
0.4 |
0 |
0:0 |
3 |
3 |
| WPG- 1 |
10 |
3:7 |
3 |
3 |
| WPG-2 |
20 |
6:14 |
3 |
3 |
| WPG-3 |
30 |
10:20 |
3 |
3 |
| WPG-0 |
0.5 |
0 |
0:0 |
3 |
3 |
| WPG- 1 |
10 |
3:7 |
3 |
3 |
| WPG-2 |
20 |
6:14 |
3 |
3 |
| WPG-3 |
30 |
10:20 |
3 |
3 |
| WPG-0 |
0.6 |
0 |
0:0 |
3 |
3 |
| WPG- 1 |
10 |
3:7 |
3 |
3 |
| WPG-2 |
20 |
6:14 |
3 |
3 |
| WPG-3 |
30 |
10:20 |
3 |
3 |
Table 6.
Mix proportioning for one m³ of concrete.
Table 6.
Mix proportioning for one m³ of concrete.
| Type of mix |
w/c |
Cement
(kg/ m³) |
Water
(kg/ m³) |
Fine agg.
(kg/ m³) |
Coarse Agg.
(kg/ m³) |
Plastic waste.
(kg/ m³) |
Glass waste.
(kg/ m³) |
| Control |
0.4 |
475 |
165 |
768 |
1007 |
0.0 |
0.0 |
| Control |
0.5 |
380 |
162 |
850 |
1007 |
0.0 |
0.0 |
| Control |
0.6 |
316.67 |
160 |
905 |
1007 |
0.0 |
0.0 |
Table 7.
Trial mix for waste plastic and glass ratio for water-cement ratio 0.4.
Table 7.
Trial mix for waste plastic and glass ratio for water-cement ratio 0.4.
| Mix ratio of WP to WG |
Cement
(kg/ m³) |
Water
(kg/ m³) |
Fine agg.
(kg/ m³) |
Coarse Agg.
(kg/ m³) |
Plastic waste.
(kg/ m³) |
Glass waste.
(kg/ m³) |
| Plain (PG-0) |
38.475 |
13.65 |
62.20 |
81.57 |
0.00 |
0.0 |
| M1-PG-1:1 |
38.475 |
13.65 |
49.76 |
81.57 |
6.22 |
6.22 |
| M2-PG-1:1.5 |
38.475 |
13.65 |
49.7664 |
81.57 |
4.976 |
7.46 |
| M3-PG-1:2 |
38.475 |
13.65 |
49.76 |
81.57 |
4.15 |
8.29 |
| M4-PG-1:2.5 |
38.475 |
13.65 |
49.76 |
81.57 |
3.55 |
8.88 |
| M5-PG-1:3 |
38.475 |
13.65 |
49.76 |
81.57 |
3.11 |
9.33 |
Table 8.
Mix Proportioning for 0.081 m³ of concrete.
Table 8.
Mix Proportioning for 0.081 m³ of concrete.
| Type of mix |
w/c |
Cement
(kg/ m³) |
Water
(kg/ m³) |
Fine agg.
(kg/ m³) |
Coarse Agg.
(kg/ m³) |
Plastic agg.
(kg/ m³) |
Glass agg.
(kg/ m³) |
| Plain (PG-0) |
0.4
0.4
0.4
0.4 |
38.475 |
13.65 |
62.20 |
81.57 |
0.00 |
0.0 |
| PG-1 |
38.475 |
13.65 |
55.9872 |
81.57 |
2.0736 |
4.1472 |
| PG-2 |
38.475 |
13.65 |
49.7664 |
81.57 |
4.1472 |
8.2944 |
| PG-3 |
38.475 |
13.65 |
43.5456 |
81.57 |
6.2208 |
12.4416 |
| Plain (PG-0) |
0.5
0.5
0.5
0.5 |
30.78 |
13.12 |
68.85 |
81.57 |
0.0 |
0.0 |
| PG-1 |
30.78 |
13.12 |
61.965 |
81.57 |
2.295 |
4.59 |
| PG-2 |
30.78 |
13.12 |
55.08 |
81.57 |
4.59 |
9.18 |
| PG-3 |
30.78 |
13.12 |
48.195 |
81.57 |
6.885 |
13.77 |
| Plain (XPG-0) |
0.6
0.6
0.6
0.6 |
32.7 |
25.65 |
73.305 |
81.57 |
0.0 |
0.0 |
| PG-1 |
32.7 |
25.65 |
65.9745 |
81.57 |
2.4435 |
4.887 |
| PG-2 |
32.7 |
25.65 |
58.644 |
81.57 |
4.887 |
9.774 |
| PG-3 |
32.7 |
25.65 |
51.3135 |
81.57 |
7.3305 |
14.661 |
Table 9.
Mix Proportioning for 0.0315 m³ of Concrete flexural strength.
Table 9.
Mix Proportioning for 0.0315 m³ of Concrete flexural strength.
| Type of mix |
w/c |
Cement
(kg/ m³) |
Water
(kg/ m³) |
Fine agg.
(kg/ m³) |
Coarse Agg.
(kg/ m³) |
Waste plastic.
(kg/ m³) |
Waste glass
(kg/ m³) |
| Control |
0.4 |
14.963 |
5.20 |
24.00 |
31.725 |
0.0 |
0.0 |
| (PG-19) |
0.4 |
14.963 |
5.20 |
21.00 |
31.725 |
1.00 |
2.00 |
Table 10.
Mix Proportioning for 0.024 m³ of Concrete splitting tensile strength.
Table 10.
Mix Proportioning for 0.024 m³ of Concrete splitting tensile strength.
| Type |
w/c |
Cement
(kg/ m³) |
Water
(kg/ m³) |
Fine agg.
(kg/ m³) |
Coarse Agg.
(kg/ m³) |
Wate plastic.
(kg/ m |
Waste glass.
(kg/ m³) |
| Control |
0.4 |
11.40 |
3.96 |
23.00 |
24.16 |
0.0 |
0.0 |
| PG-19 |
0.4 |
11.40 |
3.96 |
20.00 |
24.16 |
1.00 |
2.00 |
Table 11.
setting time test result.
Table 11.
setting time test result.
| |
Setting type |
results (minute) |
ASTM C 150 |
| Vicat apparatus |
Initial |
52 |
Not less than 45 min |
| Final |
320 |
Not greater than 375 min |
Table 12.
Typical consistency cement test result.
Table 12.
Typical consistency cement test result.
| No. |
Water, in ml |
Cement, in gm |
Penetration, in mm |
Water (%) |
| 1 |
132 |
400 |
34 |
33 |
| 2 |
112 |
400 |
9.25 |
28 |
| 3 |
101 |
400 |
7.5 |
25.25 |
Table 13.
7th days concrete compressive strength at different plastics to glass ratios (WP: WG).
Table 13.
7th days concrete compressive strength at different plastics to glass ratios (WP: WG).
| Group Number |
WP: WG |
Sample number |
7th -day compressive Strength (MPa) |
M0-WPG-0
|
0:0
|
|
20.4
20.8
20.6
20.6
|
|
| 1 |
|
| 2 |
|
| 3 |
|
| Mean |
|
| M1-PG-1 |
1:1 |
1 |
16.5
16.2
15.9
16.2
|
|
| 2 |
|
| 3 |
|
| Mean |
|
| |
|
| M2-PG-2 |
1:1.5 |
1 |
17.20
16.9
16.7
16.933
|
|
| 2 |
|
| 3 |
|
| Mean |
|
| |
|
| M3-PG-3 |
1:20 |
1 |
19.30
19.4
19.1
19.27
|
|
| 2 |
|
| 3 |
|
| Mean |
|
| |
|
| M4-PG-4 |
1:2.5 |
1 |
20.30
20.61
20.47
20.46
|
|
| 2 |
|
| 3 |
|
| Mean |
|
| |
|
| M5-PG-5 |
1:3 |
1 |
20.9
20.8
20.7
20.8
|
|
| 2 |
|
| 3 |
|
| Mean |
|
| |
|
Table 14.
Slump test results. .
Table 14.
Slump test results. .
| Grade |
w/c |
Sample |
Slump |
Grade |
w/c |
sample |
Slump |
Grade |
w/c |
Sample |
Slump |
C-25 |
0.4 |
PG-0 |
10 |
C-25 |
0.5 |
PG-0 |
95 |
C-25 |
0.6 |
PG-0 |
240 |
| 0.4 |
PG-1 |
9.5 |
0.5 |
PG-1 |
90 |
0.6 |
PG-1 |
230 |
| 0.4 |
PG-2 |
7 |
0.5 |
PG-2 |
80 |
0.6 |
PG-2 |
220 |
| 0.4 |
PG-3 |
7 |
0.5 |
PG-3 |
30 |
0.6 |
PG-3 |
210 |
Table 15.
Unit weight of concrete with series of percentage proportion of fine waste plastics and glass contents.
Table 15.
Unit weight of concrete with series of percentage proportion of fine waste plastics and glass contents.
| Specimen |
w/c |
Waste (%) |
P: G |
Unit wt.(gm./cm³) |
Reduction (%) |
| PG-0 |
0.4
0.4
0.4
0.4 |
0 |
0 |
2.35 |
0.00 |
| PG-1 |
10 |
3:7 |
2.39 |
1.70 |
| PG-2 |
20 |
6:14 |
2.33 |
0.85 |
| PG-3 |
30 |
10:20 |
2.37 |
0.85 |
| PG-0 |
0.5
0.5
0.5
0.5 |
0 |
0 |
2.36 |
0.00 |
| PG-1 |
10 |
3:7 |
2.49 |
5.5 |
| PG-2 |
20 |
6:14 |
2.24 |
5.08 |
| PG-3 |
30 |
10:20 |
2.29 |
2.97 |
| PG-0 |
0.6
0.6
0.6
0.6 |
0 |
0 |
2.19 |
0.00 |
| PG-1 |
10 |
3:7 |
2.05 |
6.40 |
| PG-2 |
20 |
6:14 |
2.01 |
8.22 |
| PG-3 |
30 |
10:20 |
2.0 |
8.67 |
|
Disclaimer/Publisher’s Note: The statements, opinions and data contained in all publications are solely those of the individual author(s) and contributor(s) and not of MDPI and/or the editor(s). MDPI and/or the editor(s) disclaim responsibility for any injury to people or property resulting from any ideas, methods, instructions or products referred to in the content. |
© 2024 by the authors. Licensee MDPI, Basel, Switzerland. This article is an open access article distributed under the terms and conditions of the Creative Commons Attribution (CC BY) license (http://creativecommons.org/licenses/by/4.0/).
