Preprint
Article

Age-Variant Configurations of Emotional Episodic Memory Evaluated by Natural Language Processing, Machine Learning and Network Graph Analysis

Altmetrics

Downloads

145

Views

226

Comments

0

This version is not peer-reviewed

Submitted:

28 June 2024

Posted:

28 June 2024

You are already at the latest version

Alerts
Abstract
Considering that emotional events diversify as one ages, this study formulates the Salient Episodic Memory Aggregation Hypothesis, which claims that aging induces homogenization of episodic memory and consequently increases the salience of emotional episodes. To test this hypothesis, the study focused on sadness episodic memory and conducted a web-based survey and a combined analysis consisting of natural language processing, machine learning, and network graph analysis. A sample of 2,954 adults aged between their 20s and over 70s participated in this study. They were asked to describe a sad event they had experienced and assess the psychological properties of the recalled episodes. After isolating and lemmatizing episodic words using natural language processing, vocabulary frequency was counted for each generation, and network graph analysis based on machine learning was performed to compare the structures of sadness episodes between generations. As a result, there were mainly two types of episodic words for which frequencies either declined or increased with age. The network structures of episodic words for the older generations possessed higher proximity (shortest path length) to higher concentrations of episodic words. These findings support the current hypothesis, indicating that the nature of sadness episodes differ between generations, and that older people have more aggregated episodic memory structures.
Keywords: 
Subject: Social Sciences  -   Behavior Sciences

1. Introduction

Sadness is a prevalent emotional experience in our daily lives and encompasses a wide range of events such as the loss of loved ones, failure to achieve goals, separation, and isolation [1]. With advancing age, experiences of sadness, including the loss of significant others and decline in physical well-being, cognitive functioning, and social connections, become frequent and accumulate [2]. Therefore, it is plausible that the characteristics of sadness episodic memories, such as event types, places, timeframes, and members, change with age. This study aimed to elucidate how sadness episodic memory changes with age using a multifaceted methodology combining natural language processing, machine learning, and network graph analysis.
Initially, age-related changes in sadness episodic memories are characterized by the types of events encountered and the persons involved in these events. According to the Socioemotional Selectivity Theory (SST) [3,4], people prioritize different values and goals depending on whether or not their perception of time is limited. Not feeling limited future time, people tend to prioritize novel partnerships over existing social connections, believing that they have ample time to develop new relationships with long-term benefits. In contrast, when time is perceived to be, people tend to place greater value on emotionally-meaningful goals, focusing on fostering social connectedness and seeking social support [3,4,5]. Considering that advancing age prompts the contemplation of life’s finite nature, people are likely to prioritize distinct loss events. It is expected that older adults influenced by emotional values recall a higher frequency of loss in close social relationships such as with parents and spouses. Conversely, younger people are expected to report a higher occurrence of episodes related to goals and romantic breakups as well as loss of friendship, reflecting their inclination toward valuing their future or broader social relations. Considering the heterogeneity of life events experienced at various stages of life, including employment, marriage, childbirth, and retirement, sadness-related events are unlikely to be immune to diversity among generations.
Another age-related change in sadness episodic memory pertains to salience, reflecting the intensity of emotional experiences. According to the Discrete Emotion Theory of Affective Aging, the salience and adaptive value of different emotions evolve through an individual’s lifespan [6]. Compared with younger people, older individuals experience more loss events and have been found to report a greater intensity of sadness in response to typical loss events, such as the loss of loved ones [2,7,8]. Despite some inconsistencies among previous studies [9,10], accumulated exposure to loss events with aging likely modifies memory structures concerning sadness episodes and enhances salience and reactivity to loss episodes. However, it remains unclear how memory structures of sadness episodes differ between older and younger individuals.
This study integrates these theoretical ideas to form “the Salient Episodic Memory Aggregation Hypothesis” (SEMAH). This hypothesis posits that aging leads to the homogenization of saliently-recalled episodic memories and results in increased emotional salience for specific emotional events. Given that sadness experiences in older individuals typically span a longer temporal distance from initial events, it is conceivable that older adults engage in more extensive processes of elaboration and generalization when encoding memory content [11]. This temporal characteristic contributes to an aggregated memory structure in older individuals: Thus, the homogenization and intensified saliency of episodic memory with age is considered to be defined as follows: typical sadness episodes (e.g., loss of a loved one) appear similar across individuals with aging (i.e., aggregation of episodic memory), leading to heightened reactivity to specific contexts associated with sadness (i.e., amplified salience of sadness-related events).
The present study, grounded in SEMAH, explores disparities in memory structures of sadness episodes between older and younger individuals. Although older individuals tend to show impaired episodic memory performance [12], strong emotional activation leads to long-durable episodic memories [13]. The experience of loss, provoking sadness, is apt for comparison as a memory content due to its capacity to evoke strong emotions in life. The study has two primary purposes. The first is to examine the commonalities and differences in sadness episodes among generations. We hypothesize that older people would mention loss episodes, such as bereavement and disease, more frequently than their younger counterparts because of elaboration and generalization of such experiences with aging. Furthermore, we expect that the persons involved in sadness episodes differ across generations; older individuals are more likely to report significant and close relatives, such as parents, spouses, and children, whereas younger individuals are more likely to report persons from broader social relationships, such as friends and co-workers. The second purpose is to compare the structural characteristics of sadness episodes across generations using network graph analysis [14]. Based on SEMAH, we anticipate a greater degree of close and confined interconnectedness among sadness episode words in older individuals, which is indicative of a more aggregated memory structure.
Additionally, existing studies primarily focus on the younger (≤ 20s) and older (≥ 60s) with limited consideration for middle-aged populations. Middle age represents a transitional phase between youth and old age and is often characterized by significant life events and stressors [15]. Midlife crisis, a phenomenon occurring around the age of 40, is marked by changes in basic personality, manifest behavior, and sense of identity that accompany aging [16], for example, changing careers or reassessing relationships. Being conscious of the passage of time has been considered one of the causes of midlife crisis [15]. Accordingly, middle-aged individuals may possess different emotional attitudes than both younger and older individuals. It is crucial to include diverse generational cohorts in investigation of sadness episodes.
To test these predictions, we conducted a series of analyses: (i) natural language processing to extract words related to sadness episodes; (ii) machine learning to form correlational structures of words in sadness episodes; (iii) network graph analysis to compare the structures of sadness episodic memories between generations. The aggregated memory structure for older adults is expected to be characterized by both the proximity (shortest path length) between and the concentration of sadness episodic words in network structures.

2. Materials and Methods

2.1. Participants

Participants aged between their 20s and over 70s were initially recruited nationwide via a web research company in Japan (Freeasy Co., Ltd., Japan; https://freeasy24.research-plus.net/). Individuals (n = 2,954) from 47 prefectures in Japan responded, as summarized in Figure 1. All participants provided informed consent online before the questionnaire was administered. They received rewards for their participation from the web research company. We eliminated 413 persons from data analyses based on the exclusion criterion of answers: (i) no experience of sadness events: “no experience” or “nothing”; (ii) no content of sadness events (e.g., “I felt sad”); (iii) insincere or inappropriate answers (e.g., citation from a famous tale); (iv) ambiguity in specifying emotional properties of events (e.g., “I ate tuna”); (v) future events (e.g., “my father died in 2025”); (vi) no answer or blank responses; (vii) response refusal. This study was conducted in accordance with the Declaration of Helsinki for Ethical Principles for Research Using Human Subjects and was approved by the local ethics committee of the university to which the first author is affiliated.

2.2. Procedure

2.2.1. Data Collection

We collected five sociodemographic profiles of the participants (age, sex, marriage, parenthood, and employment) through a web survey. We did not collect or receive any personal information, such as the participants’ names, addresses, and telephone numbers.
We created a sadness episode questionnaire comprising four questions for the present study. The participants were asked to describe an actual event in their life that made them the saddest: (i) When did you experience the saddest event?; (ii) Where did the sadness event take place?; (iii) Who had the sadness experience?; (iv) What happened to the given person? The participants were required to answer these questions in free writing using their own smartphone, tablet, or PC.
The participants additionally rated four psychological properties [17] about their own episodes: (i) vividness (“I have vivid memories of this event” and “Overall, I remember this event”); (ii) importance (“This event is important for me” and “This event touched me”); (iii) re-experience (“I feel as if I am experiencing this event all over again when I recall it” and “I feel like I am re-experiencing the emotions from this event again when I recall it”); (iv) memory rehearsal (“I have recalled and thought about this event several times” and “I have told others about this event several times”). Two sub-items were included in each question type and were evaluated using a seven-point Likert Scale (1 = “not at all,” 7 = “absolutely right”). It took approximately five minutes to complete the survey.

2.2.2. Data Analysis

Regarding psychological assessment data, we conducted a Pearson’s correlation analysis for each property concerning the psychological saliency of episodic memories to confirm internal consistency. The three properties showed high correlation coefficients (vividness: r = 0.84; importance: r = 0.73; re-experience: r = 0.77). Therefore, two sub-items for each property were averaged for the statistical tests. Given that the memory rehearsal property showed low correlation coefficients (r = 0.34), the sub-items were not averaged and were used separately in the analysis. To compare the psychological properties between generations, a one-way analysis of variance (ANOVA) with generation as an independent variable was conducted for each psychological property. When significant generational effects appeared in the ANOVA, we examined the relationships between psychological assessment and generation using a function approximation. The criterion for significant approximation (p < 0.05) was that the order of the function should be a minimum below the third order to satisfy the fitting accuracy of root square (R2) > 0.9, or a maximum R2 if not reaching this value to avoid overfitting.
Participants’ freewriting data consisted of “when,” “where,” and “who-does-what” information about a sadness episode. These reports were preprocessed using a natural language processing method. First, we checked typographical errors in all 2,541 reports and rectified errors if valid spelling could be unambiguously detected contextually. Subsequently, raw propositional or phrasal reports were isolated into a token, a minimum meaningful morphological unit (e.g., “/私/の/チーム/は/全て/の/サッカー/の/試合/で/完璧/に/負け/た/” (My team was completely defeated in all soccer games)), using the Japanese text segmentation library MeCab (https://taku910.github.io/mecab/) with our optional lexicon of unsegmented words (e.g., “脳卒中” (stroke)). Tokens in Japanese unique letters (hiragana) were converted into those in Chinese characters (Kanji) (e.g., “わたし” → “私”(I)). Each token was lemmatized to a root form (e.g., “負け-” → “負ける” (loose)) and underwent part-of-speech tagging. Several types of words and punctuation symbols were excluded as follows: parts of stop words (e.g., post-position (e.g., “で” (at))), suffix (e.g., “た” (past tense)), pronoun (e.g., “あの” (that)), quantifier (e.g., “全て” (all)), particle (e.g., “の” (possessive)), adverb (e.g., “とても” (very)), and adjective (e.g., “美しい” (beautiful)). Subsequently, the root words were transformed or excluded based on this criterion (Appendix A). Frequency of each word was calculated across 2,541 participants based on the bag-of-words model: Words used by more than ten participants were introduced to the following analyses; the number of “when,” “where,” and “who-does-what” words were 53, 19, and 58, respectively. The natural language processing was conducted using the MATLAB R2022b (The MathWorks, Inc. US).
With regard to vocabulary frequency analysis, we first conducted χ2 tests to extract words demonstrating frequency differences between generations. The statistical significance criterion was an uncorrected α level p < 0.05 to comprise larger volume of words with potential difference. Subsequently, the surviving words were used in a hierarchical clustering analysis (Euclidean distance for similarity, Ward’s method for clustering) to specify vocabulary groups showing intergenerational differences.
The purpose of this study was to compare the relational structures of “who-does-what” words between generations using network-graph analysis. This analysis uses the notions of node and edge [18,19]: A node indicates each “who-does-what” word and an edge is a connection between words in this analysis. A graph visualizes the adjacency between words using the edges in a network representation. We first extracted 40 words appearing commonly across all generations from the 58 words obtained during preprocessing to equalize the number of words in the network representation. An adjacency matrix (40 words × 40 words), which is a basis for a network-graph analysis, was produced for each generation based on machine learning: Since the number of participants in ≥ 70s (n = 277) were smaller than other generations (20s: n = 407; 30s: n = 431; 40s: n = 409; 50s: n = 415; 60s: n = 602), it is believed that adjacency strength between words is affected statistically by numbers of samples. Therefore, 280 participants were randomly resampled for each generation in their 20s to 60s. We created ten data subsets for each of the five generations; the data of the participants in their 70s were used repeatedly ten times. We adopted Least Absolute Shrinkage and Selection Operator (Lasso) regularization [20] and a multiple logistic regression model for machine learning. Lasso regularization is the method to learn parameters (weights or β coefficients for explanatory variables x) for the Least Squares objective function as a cost function (the first part of the equation) with a penalty function using a hyper parameter (λ) and an L1-norm penalty on parameters (the second part of the equation) as in the following equation: i = 1 m ( y i j = 1 n β j x i j ) 2 + λ j = 1 n β j (m = number of samples; n = number of explanatory variables). Lasso regression machine learning attempts to minimize the output values of the equation by assigning a zero coefficient to an explanatory variable that is not effective for classification or prediction. This variable selection operation is advantageous for specifying the edges (i.e., non-zero coefficients) between words under the suppressing effects of other words in a model. A further explanation of the procedure is provided in Appendix B. The machine learning analysis was conducted using the MATLAB R2022b (The MathWorks, Inc., US).
With regard to comparisons of network configurations between generations, the aim of the first comparison was to examine the structural similarity of the network representations of the 40 words between generations; accordingly, we conducted a Spearman’s correlation analysis. The adjacency matrix for each generation was reshaped into single-row data and correlated. The correlation coefficients of the six generations were approximated to linear or non-linear functions with reference to the coefficients of the youngest in their 20s and the oldest in their over 70s. The criterion for function approximation was the same (≤ 3rd-order, R2 > 0.9 or a maximum R2, p < 0.05).
Second, we compared the degree of concentration of edges between generations to test the first SEMAH-based prediction that the degree of concentration is higher in older than in younger individuals. In general, this index is calculated by the following equation: i = 1 n ( m a x D e g D e g i ) / j = 1 n m a x S t a r D e g s t a r D e g i (n = number of words). The maxDeg is the maximal degree in the given graph (here, the graph of each generation) and Degi is the degree of each node in the given graph. The maxStarDeg is the maximum degree in a star graph (edges from other nodes are concentrated in a single node). The starDegi is the degree of each node in the star graph. The factor that yields a difference in concentration is a part of the above equation: m a x D e g D e g i . To statistically test the difference in the degrees of concentration between generations, we calculated the part score of each word in each generation and compared the scores of the 40 words between generations using ANOVA. When this test yielded a significant generational effect, the average scores of the six generations were approximated as linear or non-linear function. The criterion for function approximation was the same (≤ 3rd-order, a maximum R2, p < 0.05).
Third, we compared the shortest path lengths of the 40 words between generations to examine the second SEMAH-based prediction: the relationship between the components of sadness episodes or words would converge in older generations. We calculated the average shortest path length for each generation and compared the scores between generations using ANOVA. When this test yielded a significant generation effect, the scores of the six generations were approximated as linear or non-linear functions. The criterion for function approximation was the same (≤ 3rd-order, a maximum R2, p < 0.05). The network graph analysis was conducted by R ver.4.0.4 (The R Foundation).

3. Results

3.1. Socio-Demographic Profiles of Participants

Following the exclusion criteria, 2,541 participants from their 20s to ≥ 70s remained in the analysis (Table 1).

3.2. Psychological Assessment of Sadness Episodic Memory

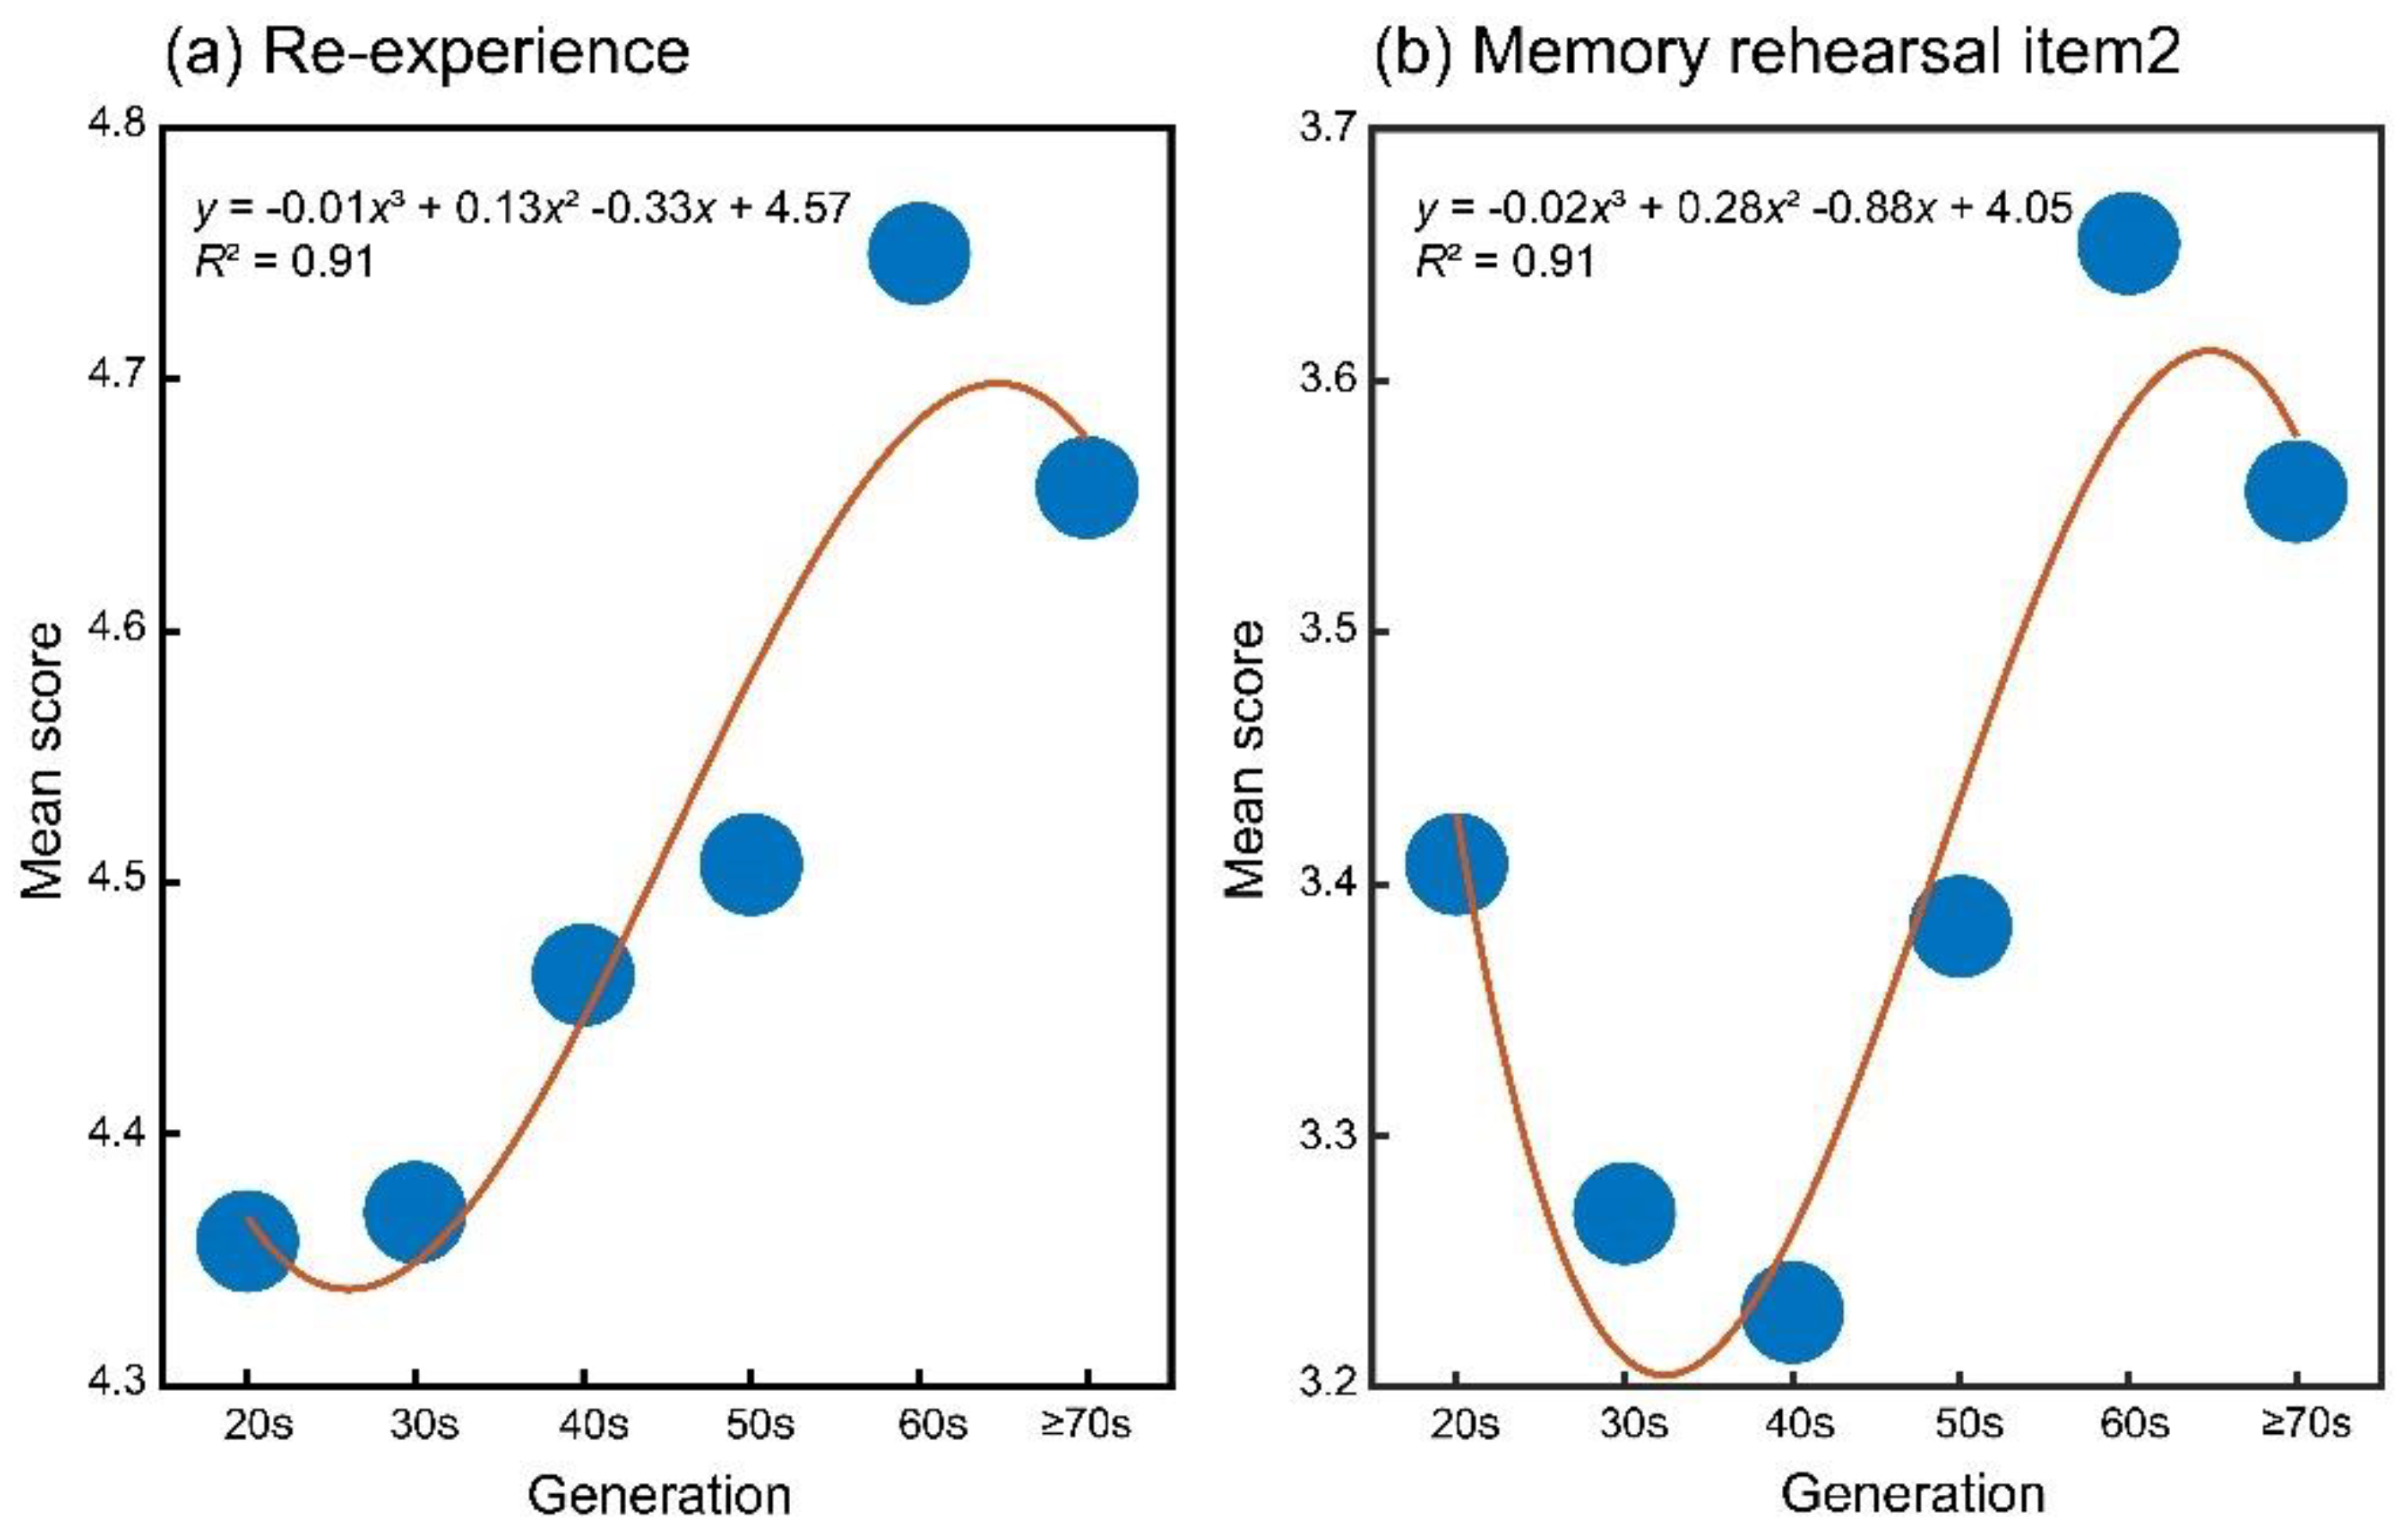
The psychological assessment ratings for sadness episodes are summarized in Table 2. The one-way ANOVA indicated that the main effect of generation was significant for properties other than importance (vividness: F(5, 2535) = 2.34, p = 0.04, ηp2 = 0.005; re-experience: F(5, 2535) = 3.69, p < 0.01, ηp2 = 0.007; memory rehearsal item 1: F(5, 2535) = 2.41, p = 0.03, ηp2 = 0.005; memory rehearsal item 2: F(5, 2535) = 3.23, p = 0.01, ηp2 = 0.006; importance: F(5, 2535) = 2.10, p = 0.06, ηp2 = 0.004). Subsequently, we employed linear or non-linear approximation methods to model the generational changes in scores concerning significant generational effects. Following the criterion for optimal approximation, the model was applied to re-experiencing and memory rehearsal in Item 2 (episode revealing). The mean scores for the re-experience and memory rehearsal Item 2 demonstrated a non-linear increase with age (Figure 2a and 2b), suggesting a general rise in mean scores with advancing age.

3.3. Comparisons of Vocabulary Frequency among Generations

Words used by more than ten participants were obtained for “when” (53 words), “where” (19 words), and “who-does-what” (58 words) components in the sadness episodic writing. We compared word frequency (%) among the six generations and obtained words with significant overall differences among generations for each component (“when”: 26 words; “where”: 12 words; “who-does-what”: 32 words). To examine the patterns of changes in word frequencies with age, word frequencies (%) were converted into Z-scores across six generations and classified using a hierarchical clustering method (Ward method based on Euclidean distance). As observed in Figure 3, two clusters tended to be obtained for each component: word frequencies in Cluster 1 declined with age for all three components, whereas those in Cluster 2 increased with age in general. Concerning a “when” episodic component, words representing longer past years, such as “10 years ago” and “40 years ago” tended to increase with age; relatively near past days represented by school ages, such as “in a high school” tended to increase in younger generations (Table S1). For a “where” episodic component, “medical institutions” (e.g., “hospital”), “elderly facility” and “birthplace” appeared more in older generations; “schools,” “one’s home,” and “lover’s house” appeared more in younger generations (Table S2). Upon a “who-does-what” component, persons, such as “parents,” “brother/sister,” “spouse,” and “one’s own child” and life events, such as “death,” “illness/impairment,” and “surgery” more frequently appeared in older generations; in the younger generations, “self” and close persons outside a family, such as “friends,” “lovers,” and “teachers,” and events, such as “defeat,” “break-up,” “failure, “harassment,” and “abortion” were picked up (Table S3).

3.4. Network Graph Analysis for Memory Structures of Sadness Episodes

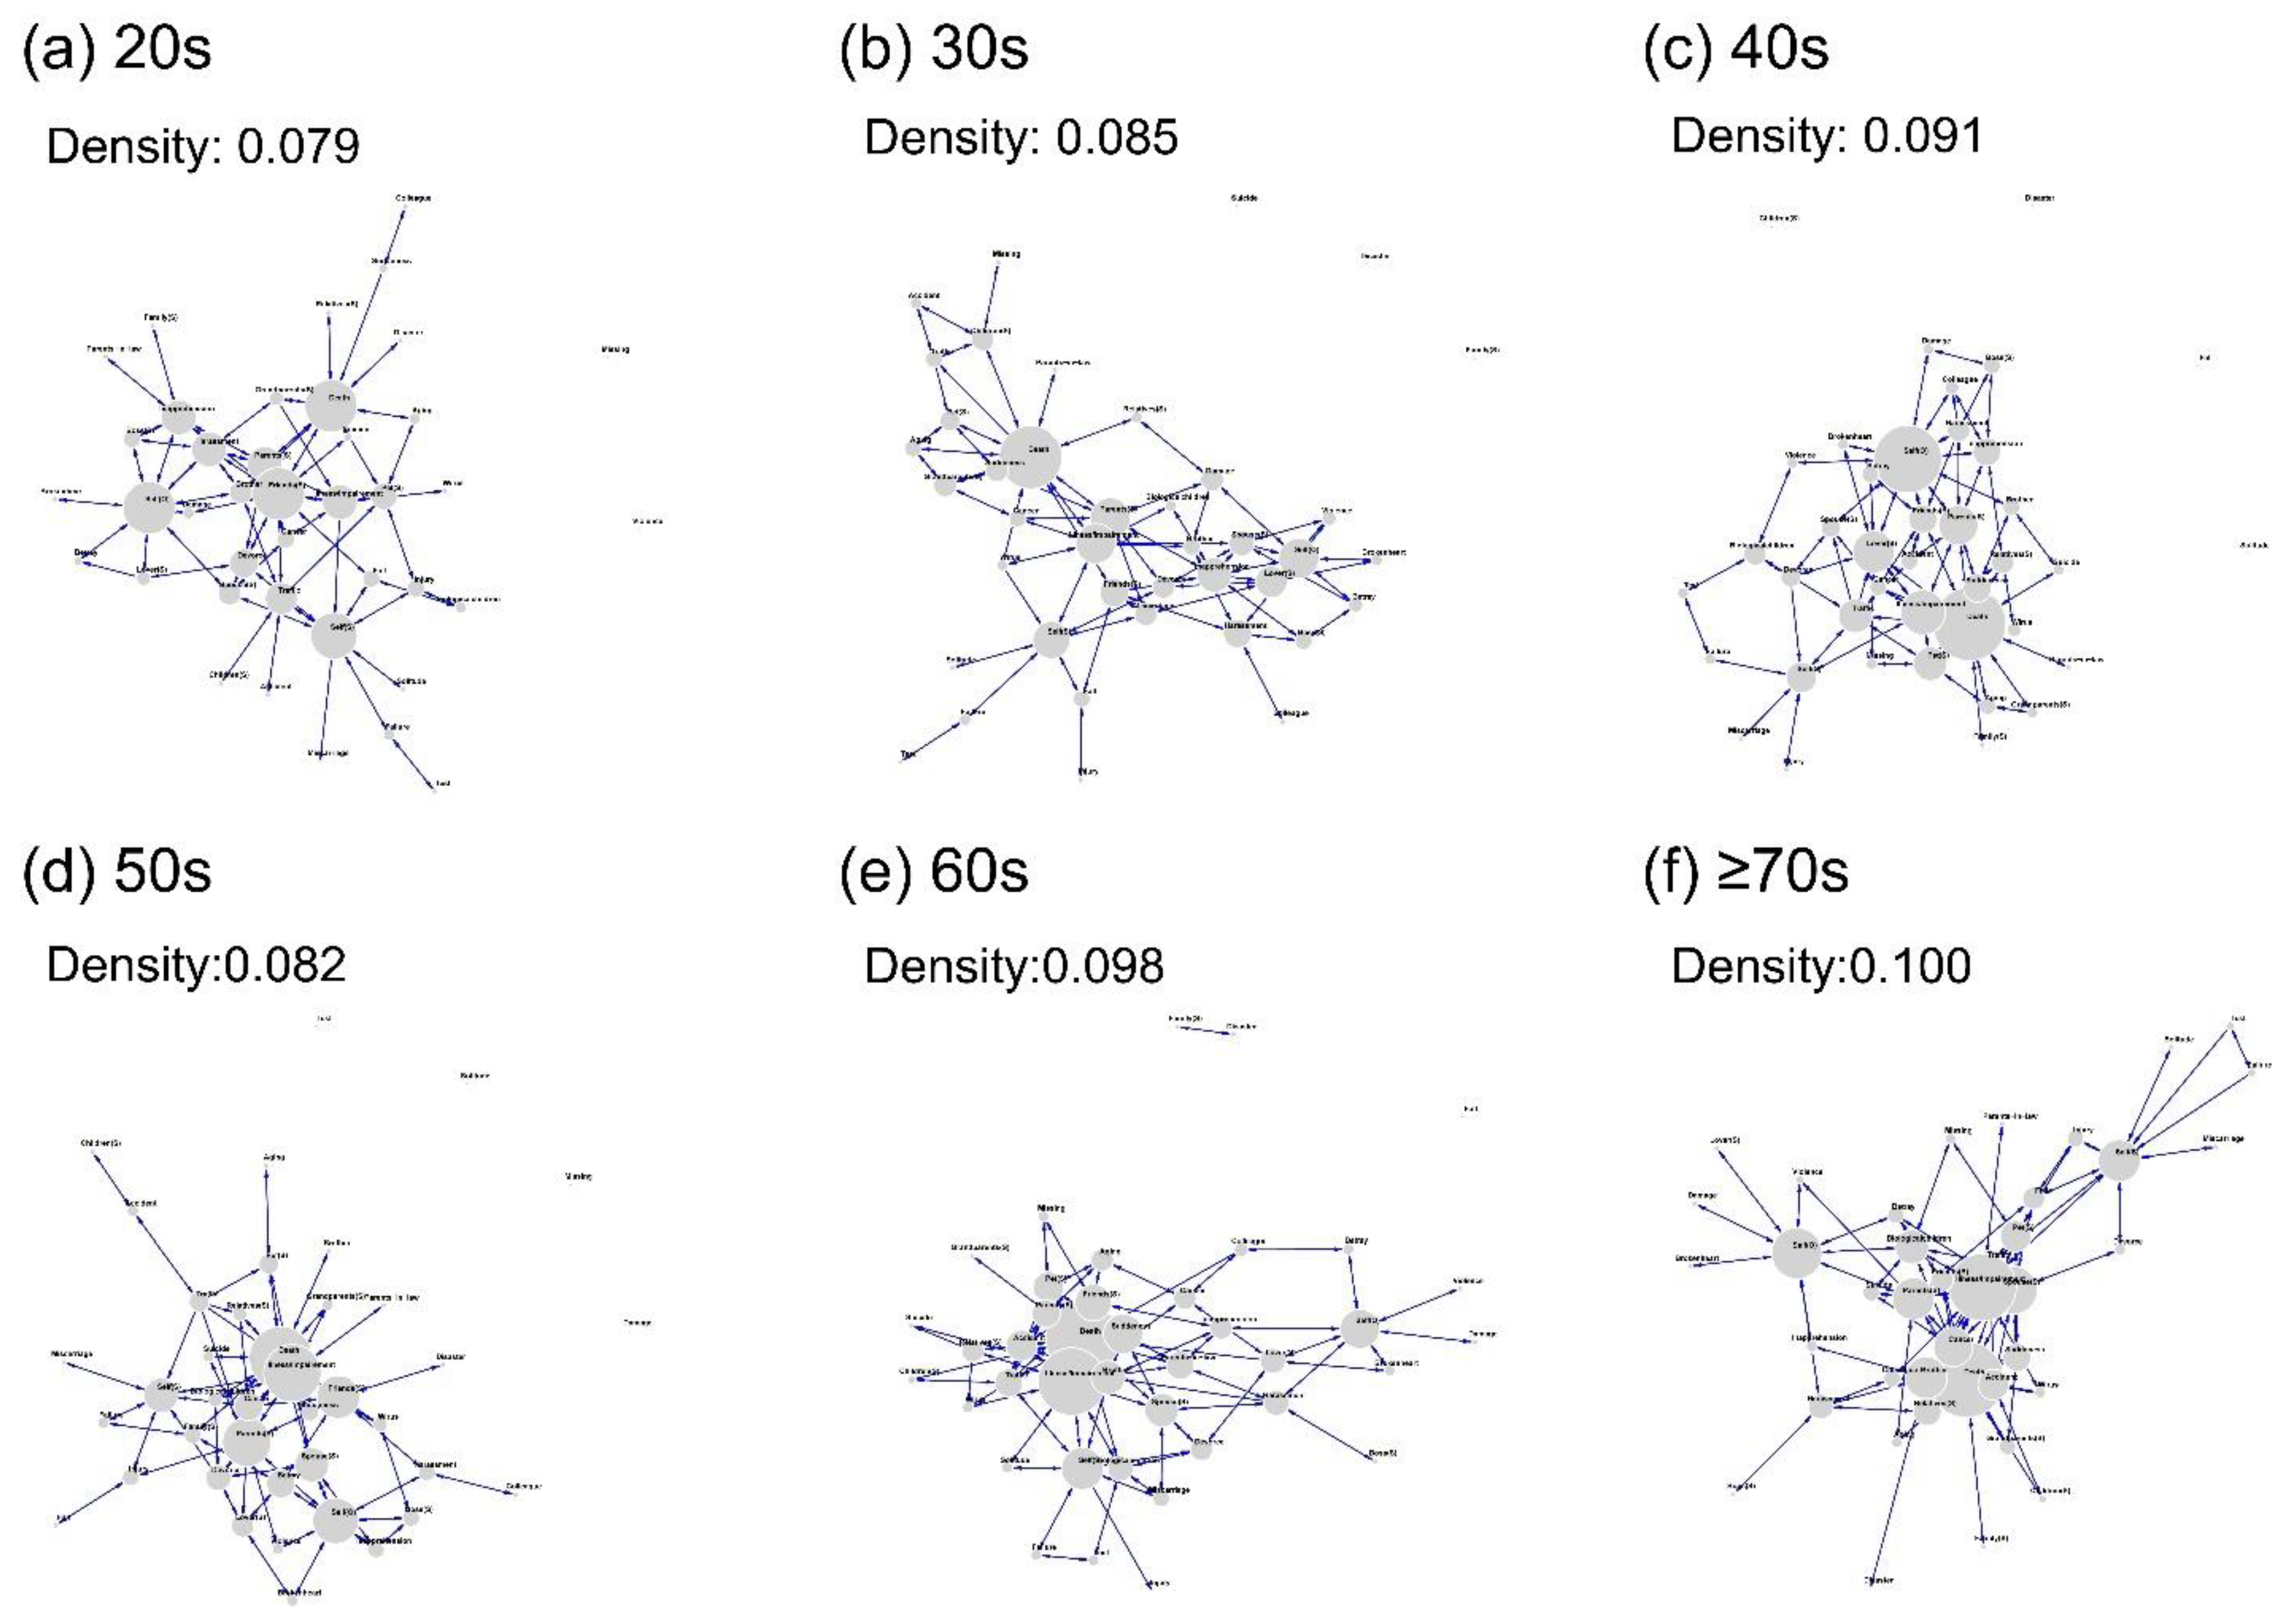
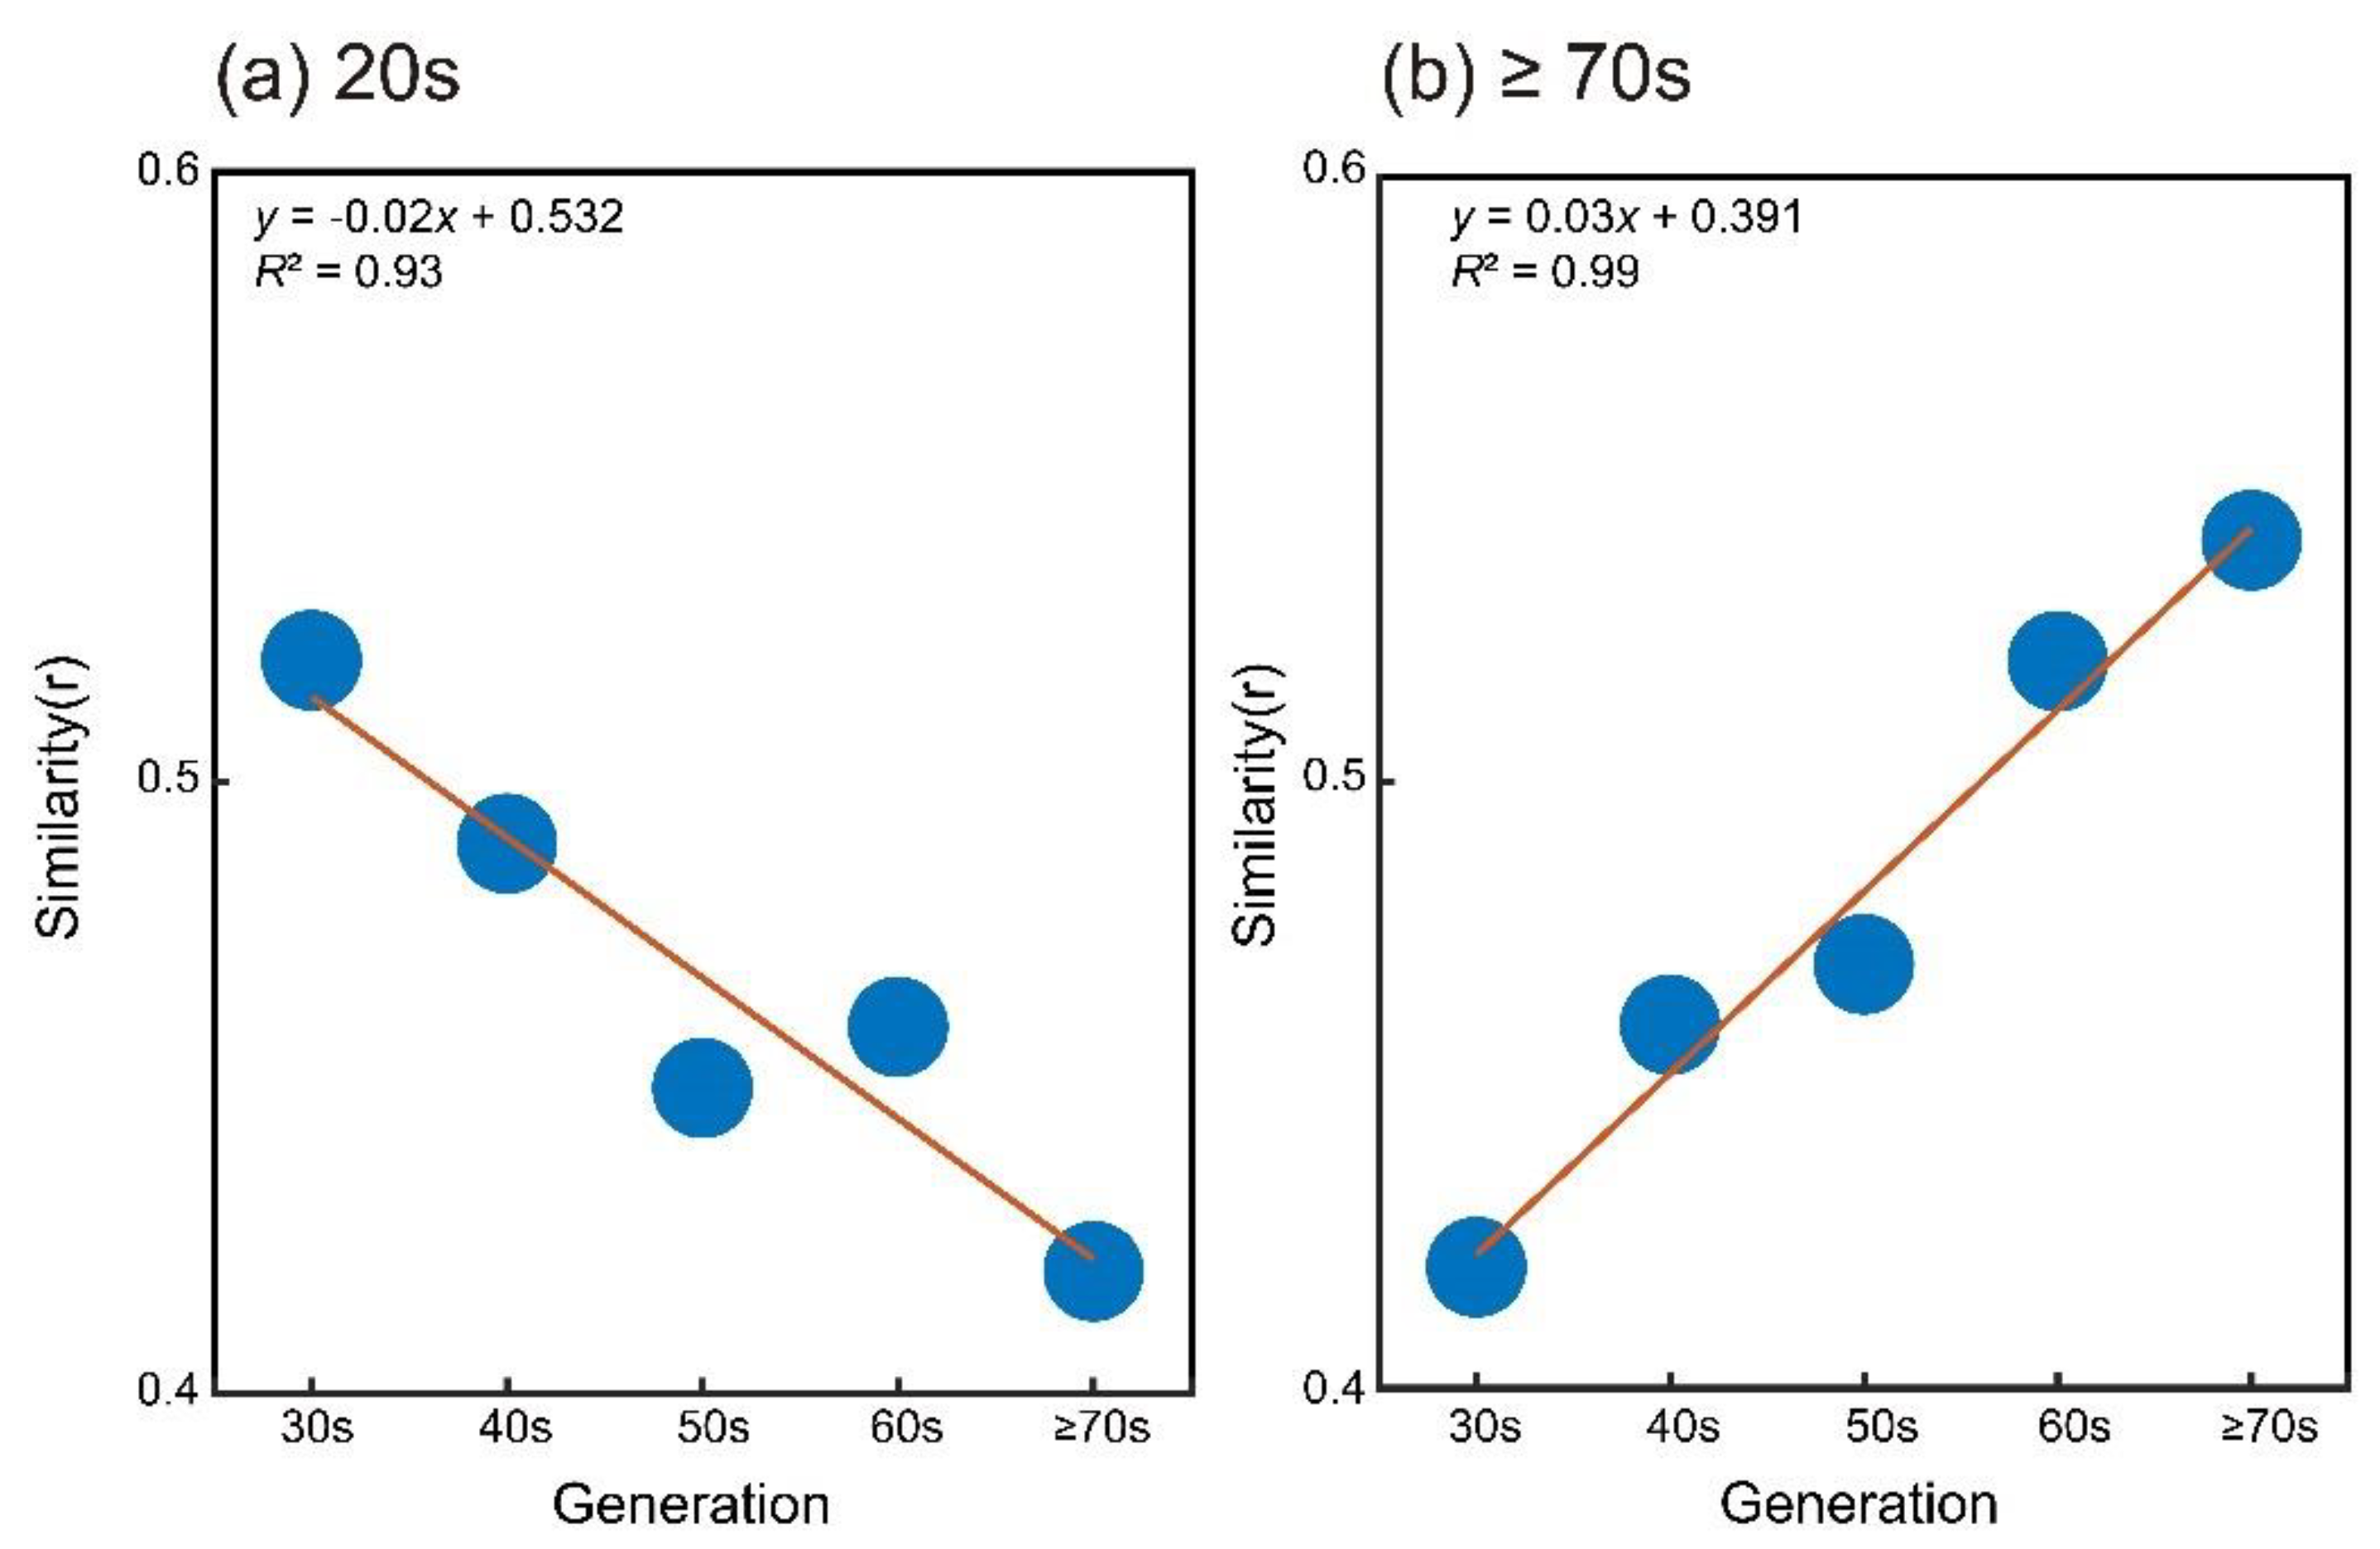
To compare network configurations of “who-does-what” words between the six generations, this analysis used the 40 words that appeared commonly for all generations (Table S4). Based on a threshold of 30% to form an edge between two words (Appendix B), a network graph was created for each generation (Figure 4). Similarity or coefficient changes as a function of generations were approximated linearly, showing that configurational similarity increased as generational distance decreased (Figure 5).
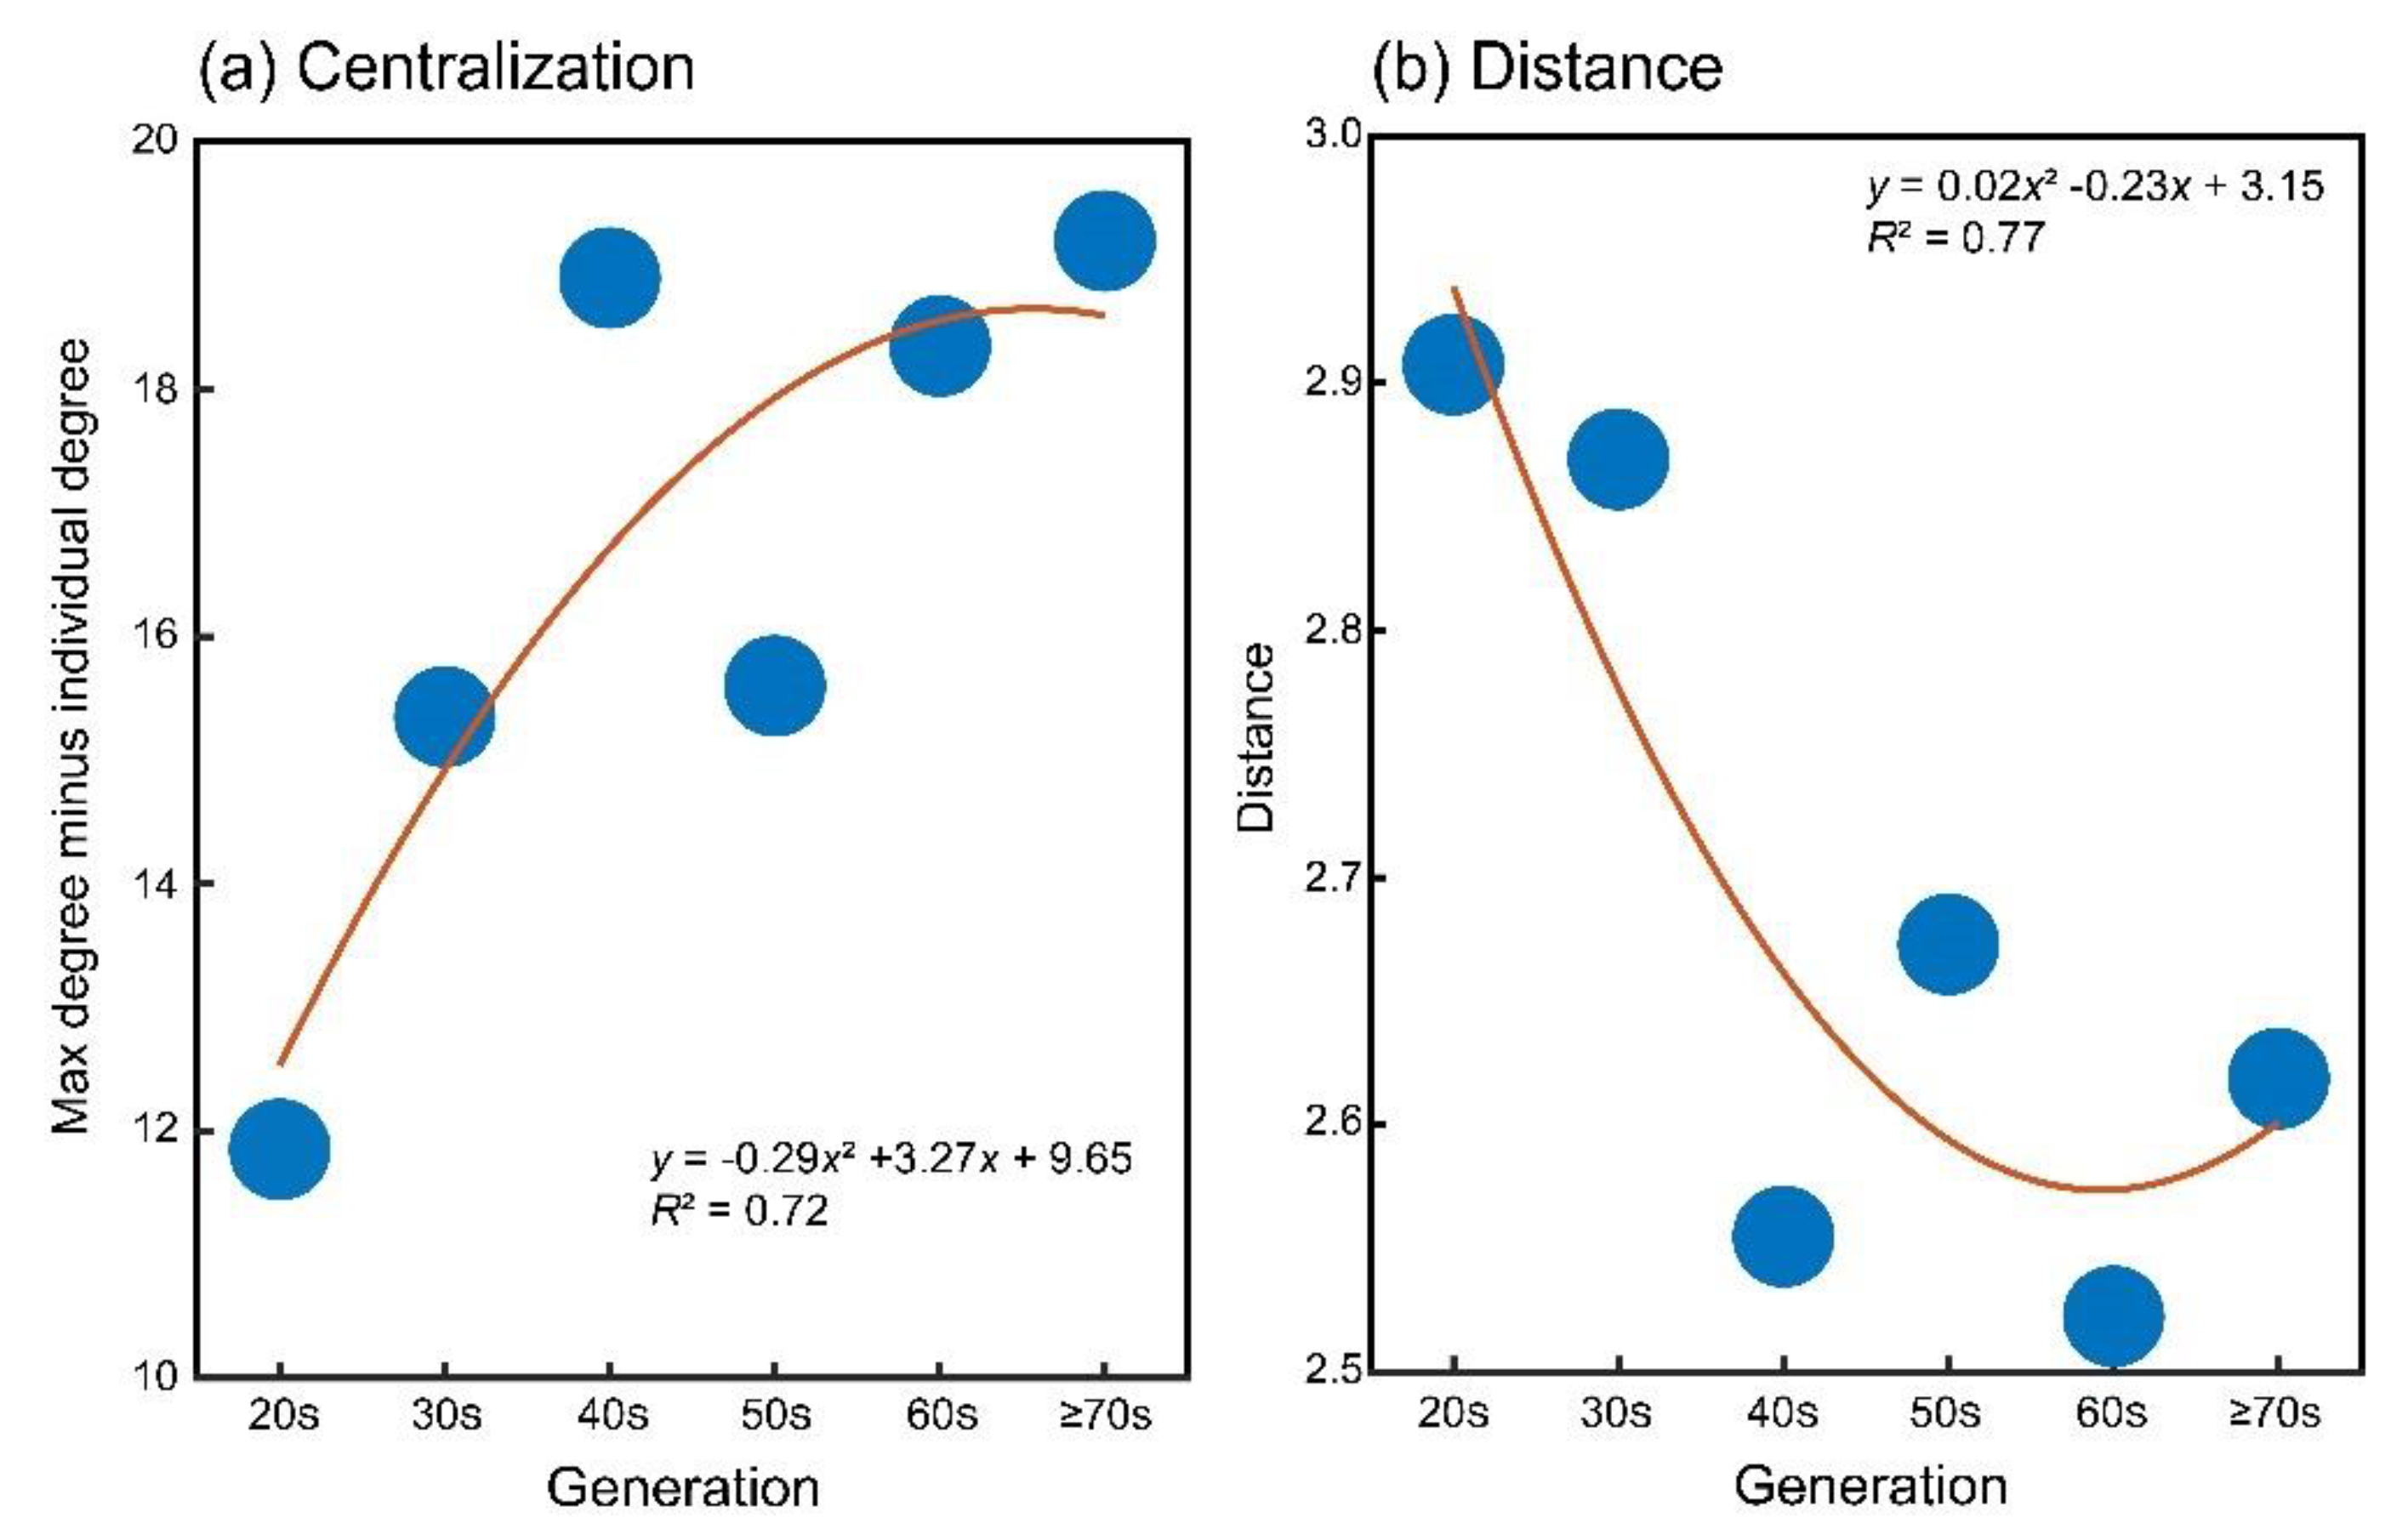
To test the SEMAH, we tested age-related changes in the network structures of sadness episodic memory. Initially, we calculated the centralization scores for the six generations (20s = 0.16; 30s = 0.21; 40s = 0.26; 50s = 0.21; 60s = 0.25; ≥ 70s = 0.26). The scores exhibited an increasing trend as generations advanced. To assess the disparities among generations, we performed ANOVA using max degree minus individual degree as independent variables and observed a significant generation effect (F(5, 195) = 42.25, p < 0.01, ηp2 = 0.52). Age-related scores changed non-linearly, indicating that words or nodes were more centralized as the generation aged (Figure 6a). Concerning averaged shortest pathlength between connected words (20s = 2.91 ± 1.11; 30s = 2.87 ± 1.13; 40s = 2.55 ± 0.93; 50s = 2.67 ± 0.98; 60s = 2.52 ± 0.93; ≥ 70s = 0.62 ± 0.96), the overall generation effect was also significant (F(5, 4066) = 17.50, p < 0.01, ηp2 = 0.02). Age-related score changes were approximated non-linearly, indicating that the distance between connected word pairs was shorter as the generation was older (Figure 6b).

4. Discussion

The present study, based on SEMAH, postulates two predictions. First, we predicted that older people would mention loss events more frequently than younger people, and the types of members involved in sadness events would differ among generations. As predicted, vocabulary frequency analysis indicated that the sadness episodic words possessed two age-related patterns: The frequencies of words decreased or increased with age. The appearances of “death” and “illness / impairment” notably augmented with advancing age, implying that the accrual of such experiences contributes to the amplified emotional salience toward sadness in the older population. Second, we predicted that the structure of sadness episodic memory would be more aggregated in older generations. Network graph analysis revealed that the centralization of connections of episodic words increased, and the distance between connected words decreased with aging. These findings support SEMAH, indicating that older individuals have more aggregated memory structures for sadness episodes.

4.1. Generational Differences of Psychological Assessment of Sadness Episodic Memory

The assessment of re-experiencing and sharing sadness episodes increased non-linearly with age, demonstrating that these psychological properties of the episodes increased sharply among older individuals. Although the intensity of negative emotions fades more rapidly than that of positive emotions [21], significant negative episodes can be vividly recalled even after many years [22]. We identified participants’ experiences of being extremely sad in their lives. Long-span recurrent rehearsals of such significant episodes by, for example, engaging in conversations are assumed to promote the re-experiencing and consolidation of autobiographical memories, which serve to form a core identity [23].

4.2. Nature of Sadness Episodic Memory among Generations

Two major patterns of frequency change were observed in the three types of episodic words (“who-does-what,” “when,” and “where”): An increase and a decrease with age. For “who-does-what” words, people with close relationships (e.g., “parents”) and life events (e.g., “loss”) appeared more frequently in older generations, while persons with broader social relationships (e.g., “friends”) and life events (e.g., “breakup”) were more frequently observed in younger generations. Upon “where” words, medical institution and elderly facility featured prominently in the older generations, because these places are associated with events (e.g., “death”) reported frequently in the older generation. In the younger generations, school or workplace was mentioned predominantly, which is also consistent with the characteristics of event types (e.g., “breakup”) and members (e.g., “friends”). The “when” words mentioned longer past years with aging, while occurrence of near-past words (e.g., “yesterday”) decreased with aging. Such differences in sadness episodic words between the older and younger generations indicate that the content of salient sadness episodes changes with age.
Another cluster of characteristics revealed a unique episodic property for the middle-aged generation. Words referring to several years ago from the strong present perspective showed a high frequency in the 30s–50s. This dominance, compared to the dominance of long-span words referring to several decades ago in the 60s–70s, suggests that events evoking salient sadness are more likely to occur during the 40s–50s. Middle age corresponds to the life-event phase that brings about strong changes (e.g., loss of parents, childbirth, or employment conditions) [15], implying that the timescales of sadness episodic memory are not homogeneous between generations.

4.3. Memory Structure of Sadness Episode among Generations

The results of network analysis revealed that the closer the generations, the higher the degree of configurational similarity. Additionally, in examining the properties of memory structure among generations based on SEMAH, the centralization scores increased with age, and the path length between connected word pairs decreased with age. These findings suggest that older and younger generations possess distinct memory structures for sadness episodes and that the older generation has an aggregation of memory structures. Aggregated memory structures may contribute to an increased intensity of sadness for specific events related to loss in older individuals [2,7,8].
Various factors are believed to contribute to the manifestation of aggregated memory structures in older individuals. As individuals age, a longer temporal distance from an event leads to a tendency for older adults to intensify and generalize their memory representations [11]. This temporal characteristic is considered to result in the homogenization of memory. Additionally, the accumulation of loss-related episodic memories such as social experiences related to the passage of parents and spouses occurs with age, leading to an increase in the similarities of experiences. Considering that such loss-related events signify the absence of valued object, it is imperative to heighten our awareness of the importance of “what we have” [24,25]. Individuals’ memory of such significant social events is believed to contribute to the construction of their personal identity [23], situating it at the core of their memory structures.
Moreover, disparities in the neural functional aspects of memory structures, such as alterations in memory architecture owing to brain aging, are conceivable [26]. Regarding long-term memory, older individuals exhibit a brain network system characterized by reduced functional segregation [27], which may be associated with organizing aggregated memory structures. Our future mission is to elucidate neural foundations for the structural aggregation of episodic memory in older generations.

4.4. Limitations

This study has several limitations. First, as this was a cross-sectional study, longitudinal changes in episodic memory structures cannot be examined in individuals. Confounding factors could not be adequately excluded to yield generational effects. The second limitation concerns the generalizability of the findings. The present study focused on sadness episodic memory. The results showed the distinct nature of memory and memory structures across generations. In contrast, it is necessary to examine whether the nature of memory and memory structures of other emotional episodes, such as happiness and anger, align with or deviate from what is observed in the memory structure for sadness. The third limitation pertains to the level of analysis. This study examined data from each generation to elucidate the overarching trends within each group. Nonetheless, it is anticipated that word associations during emotional episodes may vary, even within individuals. Therefore, in the future, memory structure should be delineated not only at the group level but also at the individual level. Finally, the results may have been influenced by language and culture. It is anticipated that the extracted words and relationships vary depending on the linguistic form. Furthermore, perceptions of emotional episodes are likely to vary across cultures, as the meaning of emotions, their expressions, and regulatory processes differ between cultures [28,29,30]. Future research is needed to investigate the intergenerational differences in memory structures exhibited across various cultures.

5. Conclusions

The present study found that older adults had more aggregated episodic memory structures. Distinctions in memory structure likely contribute to the heightened intensity of recalled sadness episodes in older individuals. Future research should aim to elucidate whether disparities in memory structures between generations extend to other emotional episodes.

Supplementary Materials

The following supporting information can be downloaded at the website of this paper posted on Preprints.org, Table S1: “Who-does-what” sadness-episodic words with significantly different frequency among the generations; Table S2: “When” sadness-episodic words with significantly different frequency among generations; Table S3: “Where” sadness-episodic words with significantly different frequency among generations; Table S4: The 40 words that commonly appeared across all generations.

Author Contributions

Conceptualization, M.S. and T.S.; methodology, M.S. and T.S.; formal analysis, M.S. and T.S.; data curation, M.S. and T.S.; writing—original draft preparation, M.S.; writing—review and editing, M.S. and T.S.; visualization, M.S. and T.S.; supervision, M.S.; project administration, M.S.; funding acquisition, M.S. All authors have read and agreed to the published version of the manuscript.

Funding

This research was funded by JSPS KAKENHI, grant number JP 20 K14143.

Institutional Review Board Statement

The study was conducted in accordance with the Declaration of Helsinki, and approved by the local ethics committee of Shinshu University (protocol code 21001 and 28th June, 2021).

Informed Consent Statement

Informed consent was obtained from all subjects involved in the study.

Data Availability Statement

Requests to access the datasets should be directed to the authors.

Acknowledgments

We gratefully acknowledge the financial support of the above funds.

Conflicts of Interest

The authors declare no conflicts of interest.

Appendix A

Root words were transformed or excluded based on the following criterion:
Synonymous words were transformed into the same categorical nouns (e.g., “死ぬ” (die), “亡くなる” (pass away), “他界” (enter the kingdom of heaven), “臨終” (mortal moment) → “死” (death); “彼” (he), “恋人” (lover), “彼氏” (boyfriend) → “恋人” (lover)).
Complex words were decomposed into categorial and modifying nouns (e.g., “急死” (sudden death) → “死” (death), “突然” (sudden); “脳卒中” (brain stroke) → “病気・障害” (disease/disorder), “脳” (brain); “小学校の庭” (schoolyard) → “学校” (school), “小学校” (primary school), “庭” (yard)).
Subcategorical words were grouped into superior categorical nouns with subdivisions (e.g., “津波” (tsunami) → “災害” (disaster), “自然” (natural), “津波” (tsunami); “火災” → “災害” (disaster), “火災” (fire));
The first-person subject (Subj) and object (Obj) were differentiated using the following indices (e.g., “私が” → “私-Subj” (I-Subj), “私を” → “私-Obj” (I-Obj)).
Implicit subject and object were supplemented if omitted (e.g., “(私が) 試合に負けた” → “私が(I-Subj)”, “敗北” (lose), “試合” (game); “恋人と別れた” ((I) and my lover broke up) → “私” (I-subj), “恋人” (lover-Subj), “別れ・失恋” (separation)).
Biological and another person’s children were distinguished from each other (e.g., “子ども” (child) → “実子” (biological child) or “子ども” (another person’s child)).
Japanese calendar was converted into western calendar.
Similar types of words, irrespective of parts of speech, were subcategorized into the same superior categorical noun (e.g., “いじめ” (bullying), “罵倒” (decrial), “暴言” (verbal abuse), “罵り” (cursing) → “ハラスメント・いじめ” (harassment / bullying); “転倒” (falling down), “転ぶ” (slip), “転落” (falling) → “転倒・転落” (falling down); “田舎” (country side), “生地” (birthplace), “故郷” (homeland) → “田舎・故郷” (birthplace / homeland); “病院” (hospital), “医療センター” (clinic center), “入院先” (hospitalized institution) → “医療機関” (medical institution); “自宅” (one’s home), “我が家” (my home), “家” (house), “住屋” (residence) → “自宅” (one’s home / house); “お店” (store), “カフェ” (cafe), “コンビニ” (convenient store), “酒屋” (liquor store), “本屋” (book store) → “店舗” (restaurant / store)).
Accidental events were subcategorized into the same superior categorical noun with a subcategorical division (e.g., “交通事故” (traffic accident) → “事故” (accident), “交通” (traffic); “溺れる” (drown) → “事故” (accident), “水難” (water)).
Relative year expressions were converted into numeral year expressions (e.g., “昨年” (last year) → “一年前” (one year ago)).
Prefecture and city names were excluded from the word list (e.g., “神奈川県” (Kanagawa prefecture)).
The specific names of places and institutions were converted into common names as follows (e.g., “羽田空港” (Haneda airport) → “空港” (airport)).
Perceptual verbs such as “hear” and “see” were excluded from reports (e.g., “子供が川で流されるのを (私は) 見た” ((I) saw that a child was washed away in a river) → “子供が川で流された” (A child was washed away in a river) → “子供” (child-Subj), “事故” (accident), “水難” (water), “川” (river)).

Appendix B

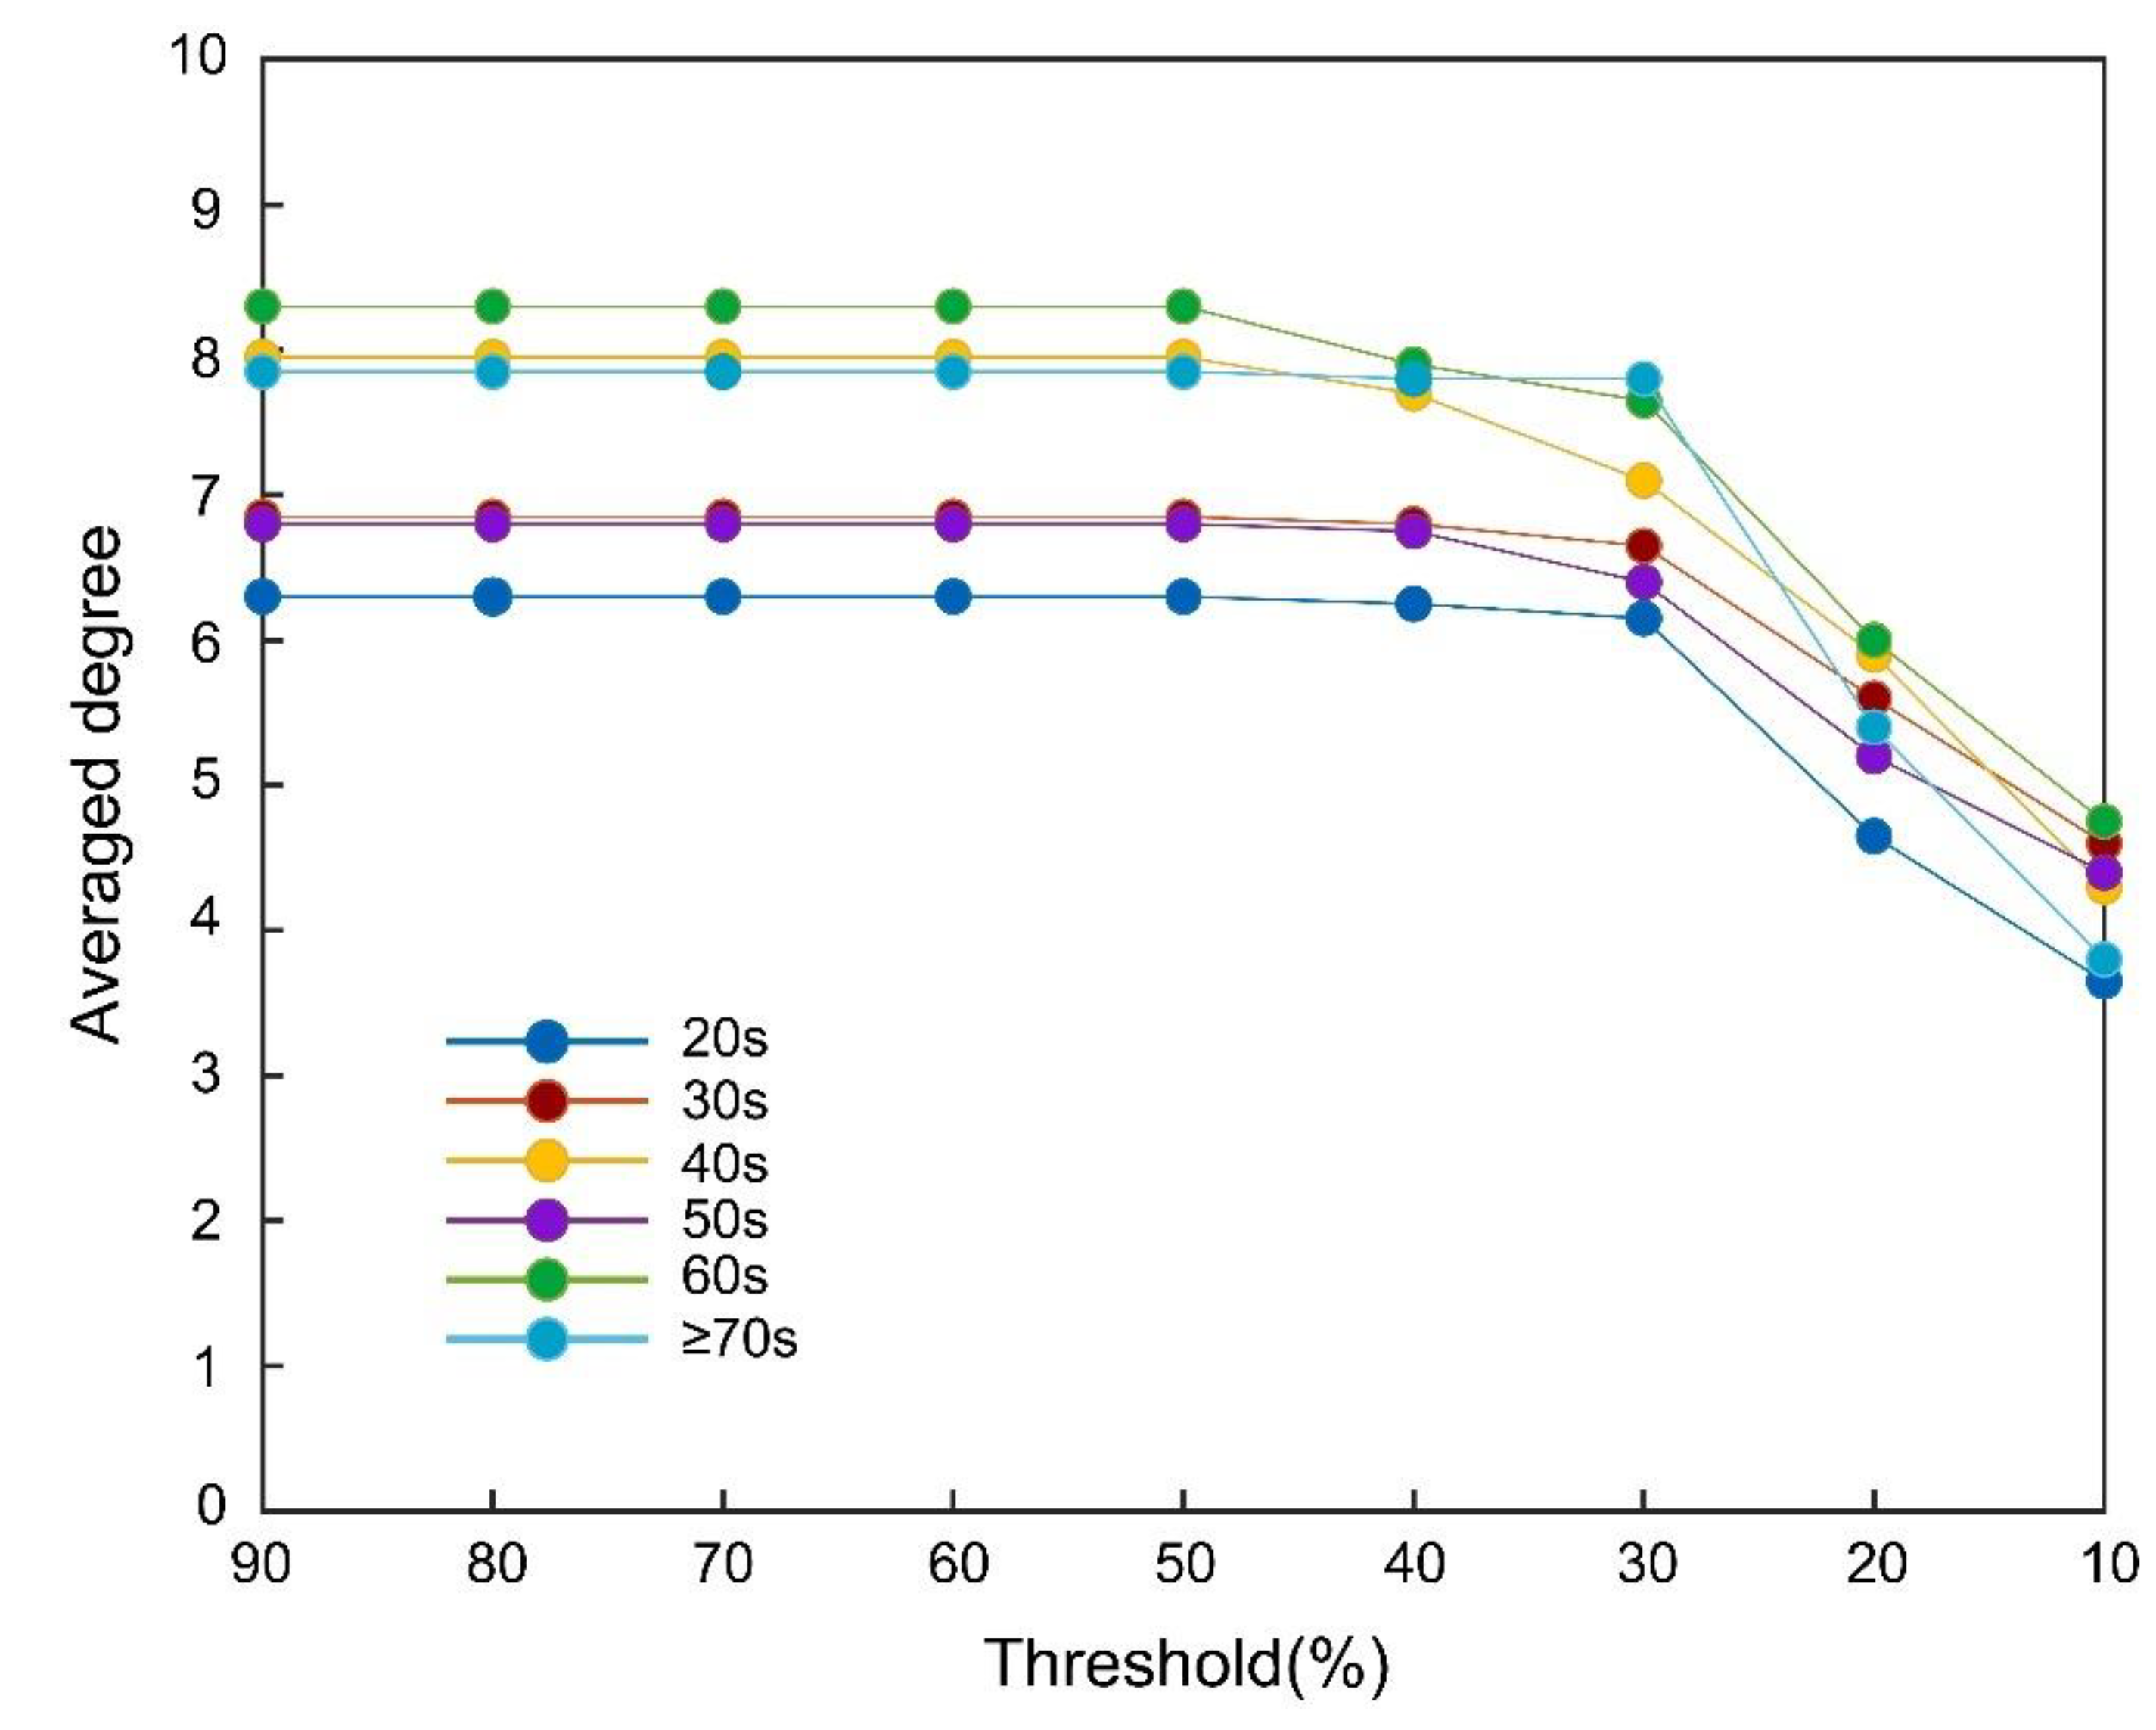
Concretely describing the current Lasso regression, occurrence (Yes = 1; No = 0) of each word in each participant was used as the target variable (y), and the remaining 39 words were used as explanatory variables (x). When Lasso regression assigned coefficients (βs) with both non-zero and positive values, edges between words were set to 1, which produced a directed unweighted adjacency matrix (40 words × 40 words) with binominal values (1 and 0). This series of procedures were conducted in a double recursive manner to attenuate resampling bias: For each of the ten data subsets in each generation (280 samples for 20s–60s, 277 samples for ≥ 70s), we randomly resampled 220 participants (about 80%) and conducted the Lasso regression 100 times. We obtained a summary adjacency matrix by summing 1,000 matrices (100 re-samplings × 10 subsets) for each generation. The maximum value in a single matrix cell is 1,000, which means that an edge is always established between given word pairs. Finally, we statistically examined how the average number of edges (degrees) of the 40 words changed with changes in the threshold of the frequency of non-zero coefficients. As shown in Figure S1, average degrees significantly changed between the thresholds of 30% and 20% in all generations: Consequently, adjacency matrix data for each generation were created based on a threshold of 30%. The network graph configuration of the 40 words was represented using the Fruchterman-Reingold method [31]. The directed network density for each generation was calculated with the equation: Density = total numbers of edges (indegrees + outdegrees) / total numbers of possible edges (n (n-1); n = 40 words).
Figure S1. Changes in averaged degree depending on threshold across generations.
Preprints 110638 g0a1

References

  1. Nesse, R.M. Evolutionary explanations of emotions. Hum Nat 1990, 1, 261–289. [Google Scholar] [CrossRef] [PubMed]
  2. Seider, B.H.; Shiota, M.N.; Whalen, P.; Levenson, R.W. Greater sadness reactivity in late life. Soc Cogn Affect Neurosci 2011, 6, 186–194. [Google Scholar] [CrossRef] [PubMed]
  3. Carstensen, L.L. The influence of a sense of time on human development. Science 2006, 312, 1913–1915. [Google Scholar] [CrossRef] [PubMed]
  4. Carstensen, L.L.; Isaacowitz, D.M.; Charles, S.T. Taking time seriously: A theory of socioemotional selectivity. Am Psychol 1999, 54, 165–181. [Google Scholar] [CrossRef] [PubMed]
  5. Carstensen, L.L.; Mikels, J.A. At the intersection of emotion and cognition: Aging and the positivity effect. Curr Dir Psychol Sci 2005, 14, 117–121. [Google Scholar] [CrossRef]
  6. Kunzmann, U.; Kappes, C.; Wrosch, C. Emotional aging: A discrete emotions perspective. Front Psychol 2014, 5, 380. [Google Scholar] [CrossRef] [PubMed]
  7. Katzorreck, M.; Kunzmann, U. Greater empathic accuracy and emotional reactivity in old age: The sample case of death and dying. Psychol Aging 2018, 33, 1202–1214. [Google Scholar] [CrossRef] [PubMed]
  8. Kunzmann, U.; Grühn, D. Age differences in emotional reactivity: The Sample Case of sadness. Psychol Aging 2005, 20, 47–59. [Google Scholar] [CrossRef] [PubMed]
  9. Katzorreck, M.; Nestler, S.; Wrosch, C.; Kunzmann, U. Age differences in sadness reactivity and variability. Psychol Aging 2022, 37, 163–174. [Google Scholar] [CrossRef] [PubMed]
  10. Tsai, J.L.; Levenson, R.W.; Carstensen, L.L. Autonomic, subjective, and expressive responses to emotional films in older and younger Chinese Americans and European Americans. Psychol Aging 2000, 15, 684–693. [Google Scholar] [CrossRef] [PubMed]
  11. Greene, N.R.; Naveh-Benjamin, M. Adult age-related changes in the specificity of episodic memory representations: A review and theoretical framework. Psychol Aging 2023, 38, 67–86. [Google Scholar] [CrossRef] [PubMed]
  12. Kinugawa, K.; Schumm, S.; Pollina, M.; Depre, M.; Jungbluth, C.; Doulazmi, M.; Sebban, C.; Zlomuzica, A.; Pietrowsky, R.; Pause, B.M.; Mariani, J.; Dere, E. Aging-related episodic memory decline: are emotions the key? Front Behav Neurosci 2013, 7, 2. [Google Scholar] [CrossRef] [PubMed]
  13. Dere, E.; Pause, B.M.; Pietrowsky, R. Emotion and episodic memory in neuropsychiatric disorders. Behav Brain Res 2010, 215, 162–171. [Google Scholar] [CrossRef] [PubMed]
  14. Borsboom, D.; Deserno, M.K.; Rhemtulla, M.; Epskamp, S.; Fried, E.I.; McNally, R.J.; Robinaugh, D.J.; Perugini, M.; Dalege, J.; Costantini, G.; Isvoranu, A.M.; Wysocki, A.C.; van Borkulo, C.D.; van Bork, R.; Waldorp, L.J. Network analysis of multivariate data in psychological science. Nat Rev Methods Primers 2021, 1, 58. [Google Scholar] [CrossRef]
  15. Wethington, E. Expecting stress: Americans and the “midlife crisis. ” Motiv Emotion 2000, 24, 85–103. [Google Scholar] [CrossRef]
  16. Brim, O.G. Theories of the male mid-life crisis. Couns Psychol 1976, 6, 2–9. [Google Scholar] [CrossRef]
  17. Sato, K. Structure and function of autobiographical memory. Kazama Shobo: Tokyo, Japan, 2008.
  18. Armour, C.; Fried, E.I.; Deserno, M.K.; Tsai, J.; Pietrzak, R.H. A network analysis of DSM-5 posttraumatic stress disorder symptoms and correlates in U.S. military veterans. J Anxiety Disord 2017, 45, 49–59. [Google Scholar] [CrossRef] [PubMed]
  19. Barabási, A.L. Network science. Cambridge University Press: Cambridge, United Kingdom, 2016.
  20. Tibshirani, R. Regression shrinkage and selection via the Lasso. J R Stat Soc B 1996, 58, 267–288. [Google Scholar] [CrossRef]
  21. Walker, W.R.; Skowronski, J.J.; Thompson, C.P. Life is pleasant—And memory helps to keep it that way! Rev Gen Psychol 2003, 7, 203–210. [Google Scholar] [CrossRef]
  22. Pillemer, D.B. Momentous events and the life story. Rev Gen Psychol 2001, 5, 123–134. [Google Scholar] [CrossRef]
  23. Bluck, S. Autobiographical memory: Exploring its functions in everyday life. Mem 2003, 11, 113–123. [Google Scholar] [CrossRef]
  24. Adler, M.G.; Fagley, N.S. Appreciation: Individual differences in finding value and meaning as a unique predictor of subjective well-being. J Pers 2005, 73, 79–114. [Google Scholar] [CrossRef] [PubMed]
  25. Lomas, T. The quiet virtues of sadness: A selective theoretical and interpretative appreciation of its potential contribution to wellbeing. New Ideas Psychol 2018, 49, 18–26. [Google Scholar] [CrossRef]
  26. Oschwald, J.; Guye, S.; Liem, F.; Rast, P.; Willis, S.; Röcke, C.; Jäncke, L.; Martin, M.; Mérillat, S. Brain structure and cognitive ability in healthy aging: A review on longitudinal correlated change. Rev Neurosci 2019, 31, 1–57. [Google Scholar] [CrossRef] [PubMed]
  27. Martin, S.; Williams, K.A.; Saur, D.; Hartwigsen, G. Age-related reorganization of functional network architecture in semantic cognition. Cereb Cortex 2023, 33, 4886–4903. [Google Scholar] [CrossRef] [PubMed]
  28. Keltner, D.; Sauter, D.; Tracy, J.L.; Wetchler, E.; Cowen, A.S. How emotions, relationships, and culture constitute each other: Advances in social functionalist theory. Cogn Emotion 2022, 36, 388–401. [Google Scholar] [CrossRef] [PubMed]
  29. Miyamoto, Y.; Ma, X.; Wilken, B. Cultural variation in pro-positive versus balanced systems of emotions. Curr Opin Behav Sci 2017, 15, 27–32. [Google Scholar] [CrossRef]
  30. Park, J.; Kitayama, S. Interdependent selves show face-induced facilitation of error processing: Cultural neuroscience of self-threat. Soc Cogn Affect Neurosci 2014, 9, 201–208. [Google Scholar] [CrossRef] [PubMed]
  31. Fruchterman, J.; Reingold, M. Graph Drawing by Force-Directed Placement. Software Pract Exper 1991, 21, 1129–1164. [Google Scholar] [CrossRef]
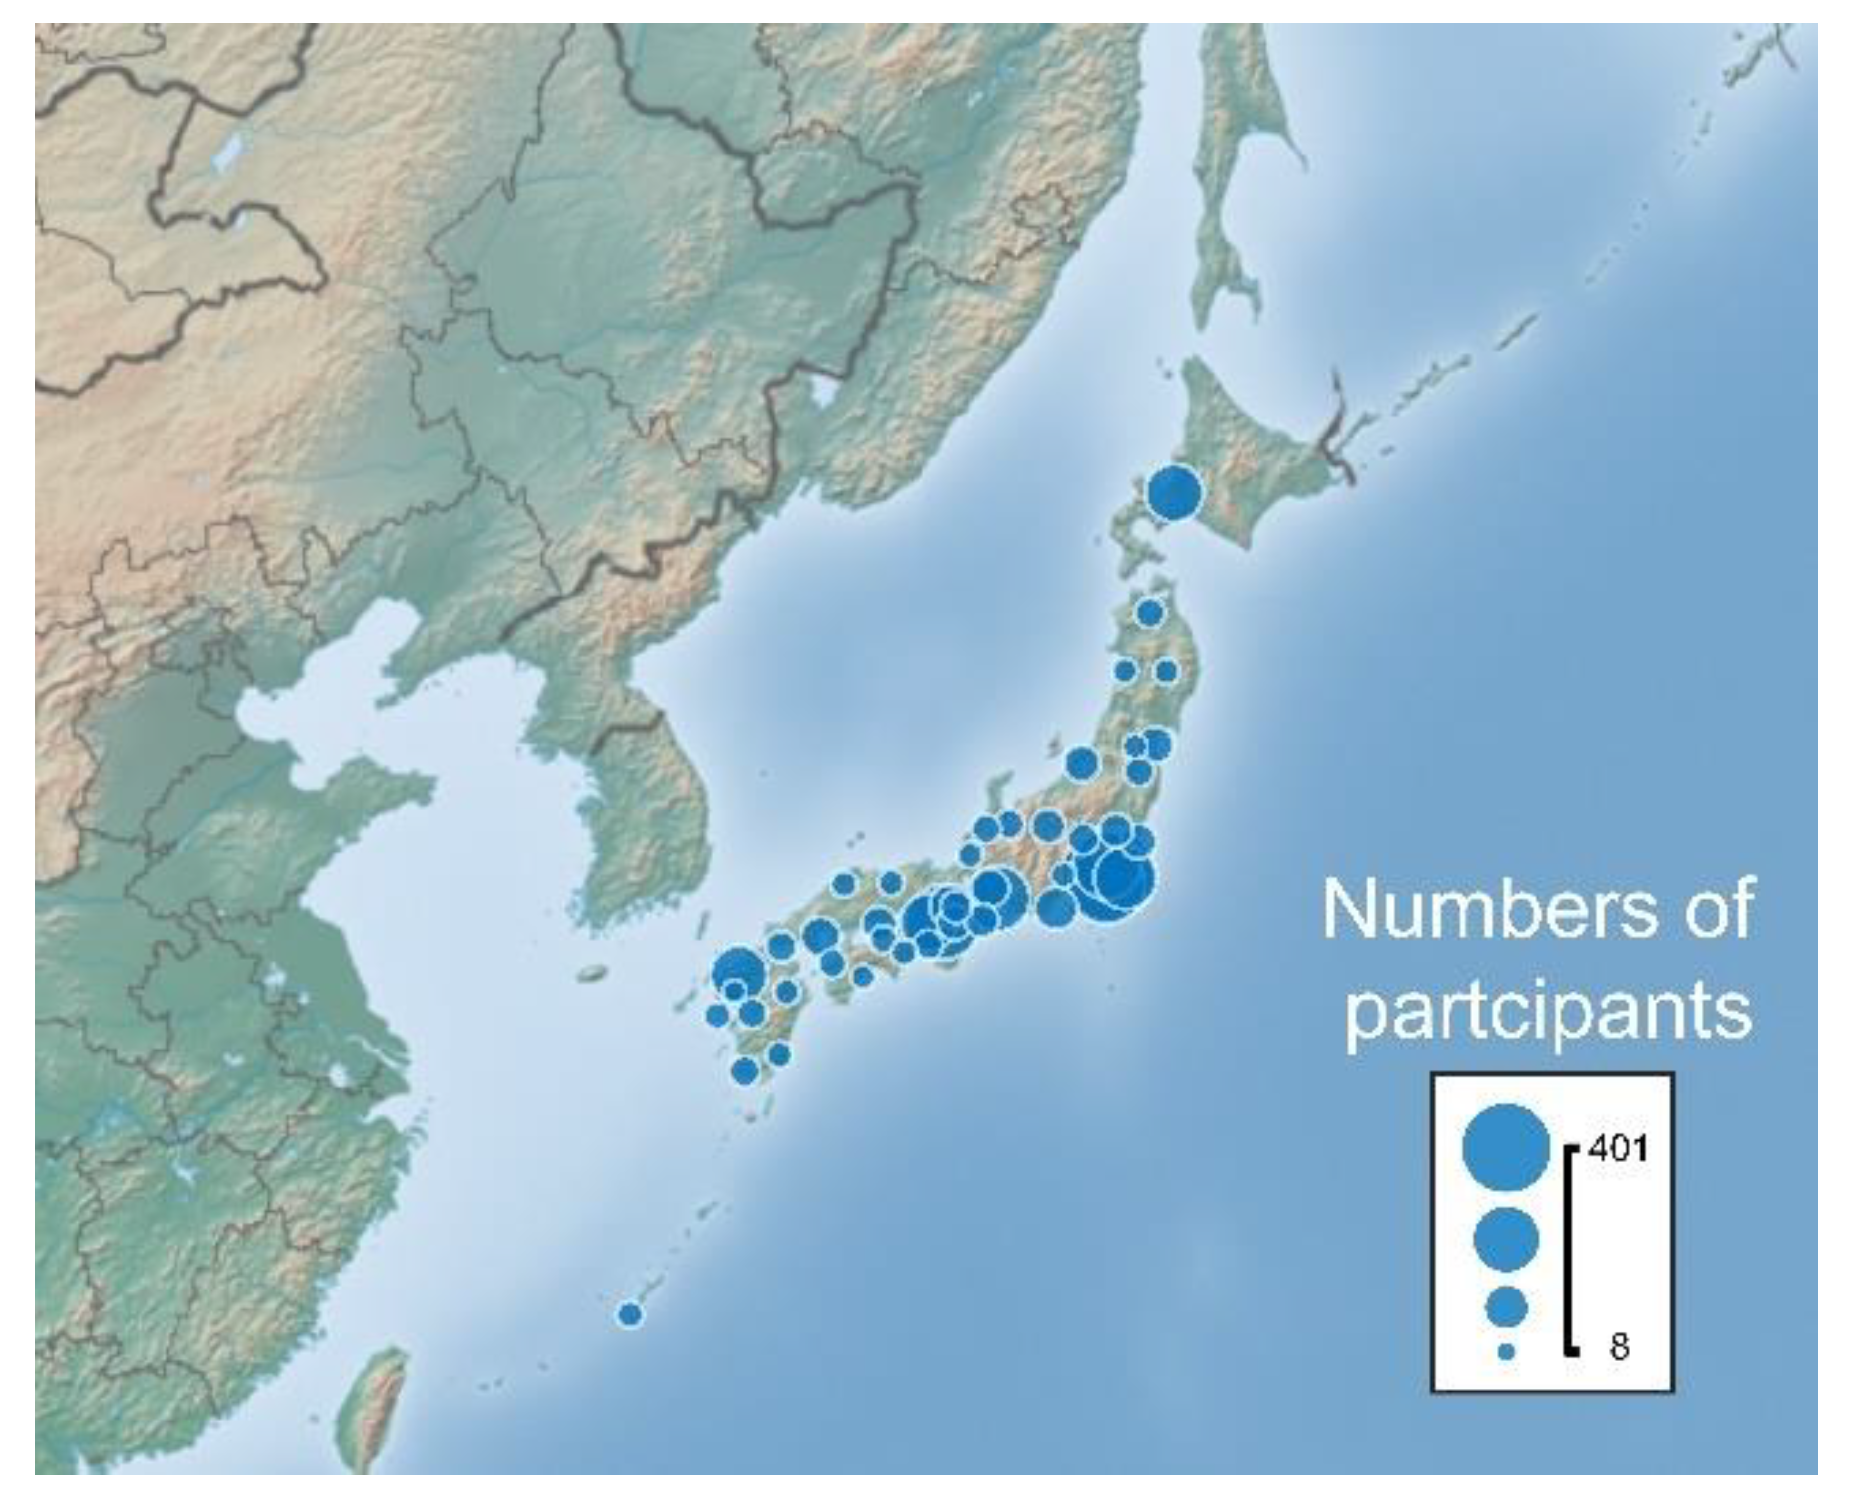
Figure 1. Nationwide distribution of participants from 47 prefectures in Japan (n = 2,541). Larger circles indicate that more people participated in the research.
Preprints 110638 g001
Figure 2. Age-related change of the two psychological assessment properties of sadness episodic memory. Each change is approximated by non-linear function. The memory rehearsal item 2 is associated with revealing of sadness episode to others.
Preprints 110638 g002
Figure 3. Classification of words for each component (“when,” “where,” “who-does-what”) of sadness episodes. Words in Cluster 1 are used more in younger generations, while words in Cluster 2 are used more in older generations.
Preprints 110638 g003
Figure 4. Network configurations of the 40 words for “who-does-what” component in sadness episodes for six generations. Density represents a percentage score of actual numbers of connections divided by the maximum number of edges.
Preprints 110638 g004
Figure 5. Similarity of network configurations between referential edge generations of 20s (a) or ≥ 70s (b) and other generations. Similarity (r) is calculated by Spearman’s correlation analysis. The two fitting linear functions show opposite patterns, which indicates that similarity of the configurations decreases as gaps of generations become larger.
Preprints 110638 g005
Figure 6. Changes of network configurations with aging. Centralization of connections to individual words non-linearly progresses with aging (a). Distance between connected words non-linearly becomes smaller with aging (b).
Preprints 110638 g006
Table 1. Summary of socio-demographic profiles of the participants belonging to six generations (n = 2,541).
Generation n Age Sex Marriage Parenthood Employment
M SD woman man no yes no yes no yes
20s 407 24.8 2.9 53 47 79 21 86 14 9 91
30s 431 34.7 2.9 51 49 48 52 62 38 14 86
40s 409 44.8 2.8 56 44 41 59 53 47 23 77
50s 415 54.3 2.9 53 47 30 70 41 59 27 73
60s 602 63.5 2.8 58 42 21 79 20 80 39 61
≥ 70s 277 73.7 3.3 38 62 12 88 13 87 81 19
Table 2. Psychological assessment ratings for sadness episodes among six generations.
Psychological Property 20s 30s 40s 50s 60s ≥ 70s
M SD M SD M SD M SD M SD M SD
Vividness 5.71 1.47 5.64 1.63 5.53 1.58 5.58 1.59 5.82 1.45 5.61 1.63
Importance 5.44 1.67 5.64 1.56 5.46 1.59 5.40 1.61 5.58 1.56 5.32 1.66
Re-experience 4.36 1.84 4.37 1.81 4.46 1.78 4.51 1.77 4.75 1.77 4.66 1.76
Memory rehearsal item1 5.29 1.82 5.34 1.77 5.09 1.80 5.16 1.75 5.35 1.69 5.01 1.80
Memory rehearsal item2 3.41 2.08 3.27 1.93 3.23 1.83 3.38 2.01 3.65 2.02 3.56 2.01
Disclaimer/Publisher’s Note: The statements, opinions and data contained in all publications are solely those of the individual author(s) and contributor(s) and not of MDPI and/or the editor(s). MDPI and/or the editor(s) disclaim responsibility for any injury to people or property resulting from any ideas, methods, instructions or products referred to in the content.
Copyright: This open access article is published under a Creative Commons CC BY 4.0 license, which permit the free download, distribution, and reuse, provided that the author and preprint are cited in any reuse.
Prerpints.org logo

Preprints.org is a free preprint server supported by MDPI in Basel, Switzerland.

Subscribe

© 2024 MDPI (Basel, Switzerland) unless otherwise stated