
Submitted:
27 June 2024
Posted:
02 July 2024
You are already at the latest version
Abstract
This study explores the evolution of price-to-book (P/B) ratios among European banks from 2005 to 2020, period where the majority of banks in different countries had a P/B ratio below 1. By dissecting banks' accounting equity into investor contributions and earnings-derived components, the research aims to evaluate how each component of equity affects these ratios and investigates whether their dynamics shifted during the period. We address a gap in prior research that has not extensively examined how individual equity components affect the overall P/B ratio. This aspect is crucial, especially in scenarios where the increase of specific components compensates for declines in others, thereby stabilizing total equity values. Our methodology involves regression analyses using a panel data model with random effects. The findings reveal that earnings-related equity components significantly influence P/B ratios. In contrast, investor contributions; which strengthen the solvency of the entity, appear to have a minimal impact. Additionally, our analysis highlights a significant quadratic relationship between the P/B ratios and both the profit or loss reported on Income Statements and distributed dividends.
Keywords:
Price-to-Book Ratios
; Equity Components
; Regulatory capital
1. Introduction
The 2008 financial crisis significantly impacted global banking stocks, a trend that persisted without rectification into the initial phase of the COVID-19 pandemic. This crisis led to substantial declines in the price-to-book (P/B) ratios of banks, often falling below the critical threshold of 1.0.
Understanding a bank’s market value involves analyzing investor expectations regarding future cash flows and associated risks1, shaped by a complex array of factors including accessible financial data. The Conceptual Framework for Financial Reporting (IASB, 2018) stipulates that while general-purpose financial reports do not determine an entity’s value directly, they provide essential information that aids investors and creditors in valuing the entity. Equity, defined as the residual interest in an entity’s assets after liabilities are deducted, consists of various components including proceeds from shareholders and retained earnings.
In our study, we categorize bank equity into two main types:
- Investor contributions:
- SC (Share Capital): Original purchase price or par value of common shares.
- SP (Share Premium): Amount paid over par value by investors at issuance.
- TS (Treasury Stock): Repurchased shares held by the company.
- EHS (Equity Hybrid Securities): Contracts combining a non-derivative (host) component with an embedded derivative as defined by IFRS 92.
- MI (Minority Interest): Portion of net assets in subsidiaries not owned by the parent company.
- 2.
- Earnings-derived components:
- YNI (Year Net Income): Annual profit or loss after taxes reported on the Income Statement.
- RE (Reserves): Mainly retained earnings excluding Year Net Income.
- YOCI (Year Other Comprehensive Income): Annual profit or loss after taxes reported in Comprehensive Income, excluding Year Net Income.
- AOCI (Accumulated Other Comprehensive Income): Cumulative Other Comprehensive Income, excluding Year Net Income.
Our research contributes to the literature by analyzing the influence of each equity component on bank P/B ratios throughout different economic cycles. Previous studies have not extensively explored how individual components affect the overall P/B ratio, particularly in contexts where some values may rise to offset declines in others, thus stabilizing total equity. Our findings enhance understanding of how investors value different types of financial data.
To strengthen our analysis, we cross-check the results with information on the different components of regulatory capital. Within the Basel Framework, banks are obligated to maintain a minimum regulatory capital. This imperative serves the fundamental goal of ensuring the financial solvency and stability of these institutions. The value of the bank’s regulatory capital is intended to cover unexpected losses. We chose to corroborate with the information about regulatory capital, similar to other studies (Sharma et al. 2023; Jordan et al. 2011), due to the distinction between expected losses, used to calculate equity, and unexpected losses, used to calculate regulatory capital, emphasizing the complementary nature of regulatory and financial data.
In our study, we consider different components of regulatory capital, in contrast to previous studies that only consider one component. This is especially relevant when we observe that over the years some components have grown, compensating for the decrease in others.. We consider the following components:
- CET1 (Common Equity Tier 1) Accounting equity less deductions for intangible assets, shortfall of provisions on expected loss, deferred tax assets that depend on future returns, etc.
- AT1 (Additional Tier 1): Instruments that combine debt and equity characteristics, having loss-absorbing capacity according to their contractual terms, when the issuing bank’s capital falls below a certain level, e.g., contingent convertible bonds (CoCos).
- T2 (Tier 2): Subordinated debt instruments.
- DP (Dividend Perspective): The value of distributed dividends, to analyze the effects of the reduction in regulatory capital.
Our study indicates that earnings-related components significantly influence the P/B ratio, whether reported in the Income Statement, Other Comprehensive Income, or previous years’ Balance Sheets. In contrast, investor contributions, which strengthen the solvency of the entity which strengthen the solvency of the entit,y have minimal impact on the P/B ratios. Our analysis reveals a high quadratic influence of the profit or loss reported in the Income Statement and the distributed dividends. Importantly, these influential factors remain consistent over the years, even as regulators intensified their efforts to enhance banks’ solvency in response to crises. These results are confirmed by using the information on regulatory capital. This research contributes to a deeper understanding of how investors interpret financial information and whether all types of financial data are valued equally by investors.
Our study analyses the periods between 2005 and 2020, as this was a time when the P/B ratio of banks was below 1 in most countries. A P/B ratio below 1 signals potential challenges in raising additional equity, possibly imposing operational constraints. Our study considers various economies and bank sizes, employs regression models to interpret these influences, specifically using a panel data model with random effects. This model is suited for datasets from different groups, accounting for potential commonalities.
If we review the current state of the research field and our hypotheses, we have to start by saying that accounting information has traditionally been considered pivotal in estimating market prices, a sentiment echoed by seminal works such as Edwards and Bell (1961) and Lindenberg and Ross (1981). Bernard (1994) defended accounting as an essential foundation for fundamental analysis, a view further substantiated by Ohlson (1995) who introduced the value relevance theory. This theory established a linear correlation between accounting variables and share pricing models, specifically for non-financial companies.
Originally, Ohlson’s model did not include financial companies due to their unique characteristics, such as the obligation to maintain predetermined regulatory capital—a requirement not typical in other sectors. Financial institutions also uniquely maintain their balance sheets with a high proportion of financial instruments, valued either at fair value or amortized cost, and are characterized by high leverage and significant credit risk. It was not until later developments that Ohlson’s model was adapted to financial firms, acknowledging the significance of accounting information in valuing these entities (Barth et al., 1996; Barber and Lyon, 1997; Anandarajan et al., 2011).
The significant impact of accounting for variations in bank prices is well-documented (Leong et al., 2023). Numerous studies have observed a decline in the market prices of banks in recent years. This trend is indicative of reduced profitability and the increased financial strain from higher regulatory capital requirements and a more rigorous supervisory approach, while essential during crises, tends to raise long-term operational costs (Handorf, 2011; Demirguc-Kunt, 2013; García-Olalla and Luna, 2021). The widening gap between the accounting and market values of financial institutions has been linked to several factors: unrecognized assets (Zéghal and Maaloul, 2011), bank efficiency (Abuzayed et al., 2009; Yao and Liang, 2005), non-performing assets (Jordan et al., 2011), and differing regulatory frameworks (Park, 2002).
The price-to-book (P/B) ratio is commonly used as an indicator of a bank’s future prospects (Richardson, 2006), with various studies examining its predictive capabilities regarding growth, profitability, or risk factors (Brief and Lawson, 1992; Fairfield, 1993; Penman, 1998; Welch, 2004). In the aftermath of the 2008 financial crisis, a sustained decline in banks’ P/B ratios prompted further investigation. Some studies suggested this decline was due to the undervaluation of intangible assets not reflected on balance sheets (Calomiris and Nissim, 2014; Bogdanova et al., 2018; Grodzicki et al., 2019), while others pointed to diminished profitability (Balasubramnian et al., 2019; Ranti et al., 2016; Bertsatos and Sakellaris 2016; Jordan eat al 2011, Soewarno, N.,Utami, S.R.;2010) or the impact of increased regulatory capital, which, while bolstering stability, proved insufficient in stress scenarios (He, L et al.; 2024; Sarin and Summers, 2016; Chousokos and Gordon, 2017; Ferretti et al., 2018; Shekhar et al., 2015; Vickers, 2019). Macroeconomic factors also play a significant role in shaping future earnings expectations (Ercegovac et al., 2020). Controversies around the book value of banks, particularly underestimations of financial asset losses during crises due to imperfect accounting standards and banks’ reluctance to reduce their book values, have been noted (Goh et al., 2009; Knaup and Wagner, 2009; Kolev, 2009; Huizinga and Laeven, 2012). The European Central Bank (2012) has emphasized the need for recognizing losses from non-performing assets and enhancing transparency to improve P/B ratios.
Post-2008 crisis observations revealed a decrease in equity components related to retained earnings, countered by an increase in shareholder proceeds (Handorf, W.C.,2011). The drop in annual profitability-related equity components has been associated with a low-interest-rate environment, suggesting that enhanced industry consolidation could improve profitability (Borio et al., Hoffman, 2017; Claessens et al., 2018; Altavilla et al., 2018). Furthermore, the increase in external contribution components is largely due to regulatory capital increments mandated by European legislation in response to the crisis, leading to amendments in Basel II and the introduction of Basel III. Considering the decrease and increase of various equity components, we posit our primary hypothesis for empirical examination: H1: The market does not uniformly value all disclosed information regarding the distinct components of a bank’s equity. This hypothesis is grounded in the observation that some components of equity may increase and offset others that decrease, leading to fluctuations in the price-to-book ratio even when total equity remains relatively stable. Our aim is to investigate the extent to which these variations influence market valuations and whether certain equity components are weighted more heavily by investors in their assessment of a bank.
Research indicates a relationship between P/B ratio and regulatory capital (Chousokos and Gordon 2017; Baker and Wurgler, 2015; Jordan et al. 2011). While some researchers, such as Aiyar et al. (2015), argue that raising minimum capital requirements entails significant social costs—potentially reducing bank profitability, depressing share prices, and constricting loan supply—they also contend that these measures are justified by their ability to mitigate the severe impacts of banking crises. Conversely, other scholars, such as Vickers (2019), criticize the economic justification for the capital levels mandated by Basel III, especially when current low P/B ratios for some major banks cast doubt on the effectiveness of these regulatory capital measures.
At the onset of the COVID-19 crisis, regulators recommended restrictions on dividends to preserve regulatory capital and ensure systemic stability. However, these restrictions led to further declines in bank share prices. In Europe, Andreeva et al. (2023) documented a causal negative impact on bank share prices, with a decrease of approximately 7% during the two weeks following the announcement. This finding aligns with previous research demonstrating a relation between dividend reductions and P/B ratio (Agrawal et al., 1996; Burdekin and Yang, 2013; Marangu and Jagongo, 2014; Calomiris, 2014; Bertsatos and Sakellaris, 2016; Duke et al., 2015). Additionally, Gambacorta et al. (2023) discovered that banks with a low P/B ratio are more likely to pay out dividends, particularly those with a P/B ratio below the threshold of 0.7.
In the aftermath of the 2008 crisis, enhanced solvency regulations led to an uneven increase in some capital components. Despite these increased capital reserves intended to strengthen financial stability, there has not been a corresponding rise in price-to-book ratios for many banks. This discrepancy suggests that higher solvency levels do not automatically translate into higher market valuations. This situation highlights the inherent tension in banking between dividends and profitability, versus minimizing risk and enhancing stability. Against this backdrop, we propose a hypothesis to explore how European markets weigh these competing factors. We hypothesize that H2: European financial markets place greater value on information pertaining to bank profitability and dividend distributions than on data related to their solvency. This hypothesis aims to investigate the relative importance of profitability indicators compared to solvency metrics in influencing market valuations of banks.
Bank heterogeneity arises from their country’s cultural context and size differences. Studies highlight diverse applications of financial regulations across countries (Guermazi and Halioui, 2020), the significance of considering bank size in regulatory analyses (Saunders and Willisen, 2021; Gharaibeh and Jaradat, 2021), and the correlation between more capital in banks and higher dividends (Belloni et al., 2021). We intend to investigate whether the market valuation of banks’ equity and capital components is uniform across all countries and if the valuation depends on the bank’s size.
Finally, due to the high randomness in values, studies suggest that nonlinear models sometimes fit better than linear models (Das and Lev, 1994; Pesaran and Timmermann, 1995). Our study will test its hypotheses with linear and non-linear models.
2. Materials and Methods
Our study commenced with a dataset comprising 67 European banking groups enlisted in the banking index compiled by Standard & Poor’s (S&P Europe BMI Banks - Industry Group - Index). These banks represent 14 European countries, and their financial data spans from 2005 to 2020. We chose this period to try to cover the years where the P/B ratio was below 1 for most European banks. We chose this period to try to cover the years where the P/B ratio went from being greater than 1 to being less than 1 and maintained this value over the years for most Europeans banks.
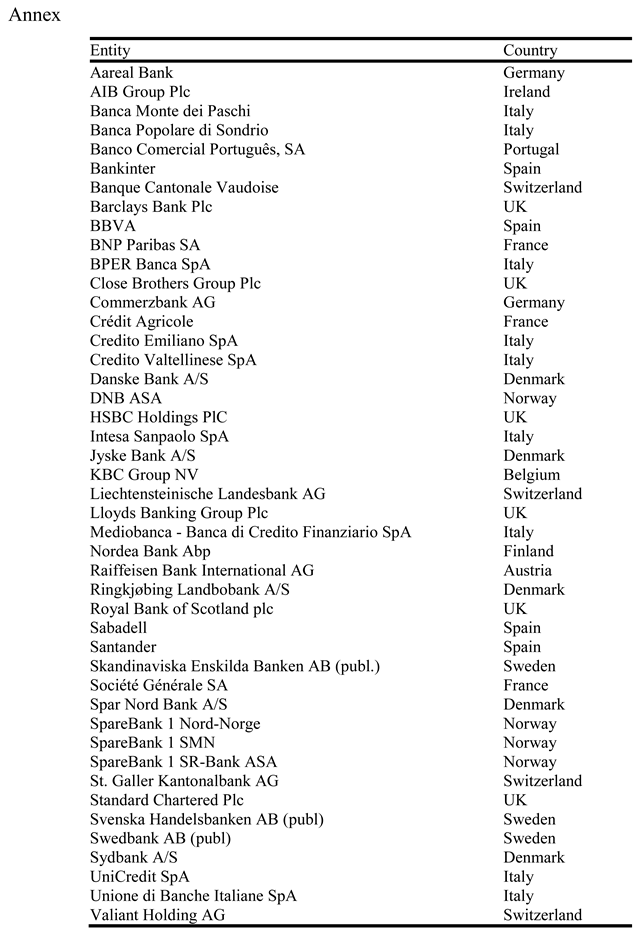
The financial data is annual and it was sourced from SNL Financial, curated by S&P Capital IQ Pro. To maintain consistency, banks not listed throughout the entire analysis period were excluded, resulting in a reduced sample of 46 banking groups. The breakdown of these groups by country is provided in the Appendix A.
We specifically utilized consolidated information for this analysis, deviating from the methodologies employed in prior studies (DeYoung and Rolland, 2001; Chiorazzo et al., 2008; Macit and Topaloglu, 2012). This decision was driven by the fact that banks conduct a substantial portion of their operations in other group entities, and the assessment of their contributions is more accurately reflected in the consolidated accounting and regulatory information of the group. Furthermore, individual accounting information is subject to varying standards across different countries, posing challenges for meaningful comparisons.
Our study did not expand the sample by including US banks or widening the scope to encompass additional European countries. This decision was made to maintain homogeneity within the dataset, as US banks operate under a distinct accounting framework, which would introduce heterogeneity and complicate comparative analyses.
Research extensively documents the influence of financial information on capital market indicators (Kothari, 2001). Past studies have primarily aimed to identify information that impacts market prices, often measured by the coefficient of determination (adjusted R2) in regressions linking market prices and relevant information (Collins et al., 1997; Dontoh et al., 2004). Initially, our observations were treated as time series due to the varying years in the dataset. The dependent variable selected for analysis is denoted as P/Bj, representing the price-to-book ratio: the price-per-share as a multiple of the book value per share. Book value is calculated using financial period data and values for common equity and outstanding common shares. Four categories of independent variables were utilized: those related to equity, regulatory capital, historical price-to-book ratios, and dummy variables.
Variables linked to reported equity include: SCj (Share Capital to Equity), SPj (Share Premium to Equity), YNIj (Year Net Income to Equity), REj (Retained Earnings to Equity), YOCIt (Year Other Comprehensive Income to Equity), AOCIj (Accumulated Other Comprehensive Income to Equity), TSj (Treasury Stock to Equity), EHSj (Equity Hybrid Securities to Equity), and MIj (Minority Interest to Equity). These variables were constructed using book values from Balance Sheets and the Statement of Comprehensive Income of banks, without any adjustments. We believe unadjusted values are prevalent in the market and easily accessible to investors, contrary to adjusted values found in financial statement notes. Some studies replace book values with fair values, which have been found to impact banks’ share prices (Giner and Mora, 2020; Liao et al., 2020; Fiechter and Novaty-Farkas, 2017; Siekkinen, 2016; Drago et al., 2013).
Variables related to regulatory capital are defined as: CET1j (Common Equity Tier 1 to Total regulatory capital), AT1j (Additional Tier 1 to Total regulatory capital), T2j (Tier 2 to Total regulatory capital), DPj (Dividend distributions from the last period). Studies suggest that listed banks often maintain stable dividends, irrespective of economic cycles (Belloni et al., 2021). The last variable is employed to analyze the regulatory capital reduction.
Another variable, LagPBj, representing the bank’s price-to-book ratio in the previous year, is included to examine whether past ratios contribute to explaining current ratios.
These variables are supplemented by two sets of dummy variables: “Country,” indicating the bank’s listing country, and “Quartile,” classifying banks based on asset volume quartiles.
The P/B used in analysis are taken 30 days post-financial year-end, coinciding with when banks typically provide market information on their financial and prudential status. Independent variable values are measured at financial year-end, except for DPj and LagPBj, which incorporate figures from the preceding financial year.
3. Results
3.1. Descriptive Statistics and Other Considerations
Descriptive statistics in Table 1 confirm the minimal variability of the Dividend Perspective when not restricted in distribution, supporting our choice to estimate future dividends based on the previous year’s distribution. Moreover, annual earnings exhibit stability, with Income Statement figures surpassing those from Other Comprehensive Income. Notably, the mean P/B ratio slightly exceeds 1, while the median falls below, indicating variations across countries and years.
Figure 1 depicts the correlation among the independent variables and the dependent variable. Notably, two variables stand out for their significant positive correlation with the price-to-book ratio: earnings for the financial year, as recorded in the Income Statement, and the Dividend Perspective. Conversely, investor contributions, whether through share purchases or hybrid instruments, exhibit the most notable negative correlation with the price-to-book ratio.
The low correlations between variables, as depicted in the Figure 2, indicate a minimal risk of multicollinearity.
The study aims to explore the factors influencing P/B ratio by considering the outlined independent variables. Initially, we attempted to integrate equity and regulatory capital variables into a unified regression model. However, due to concerns regarding multicollinearity, such integration was unfeasible. Issues arose such as the equivalence between the sums of certain variables and the linear relationships among them, like CET1 being a linear combination of equity variables.
Consequently, we adopted two distinct regression models. The first model elucidates the P/B ratio using equity-related variables. The second model focuses on the relationship of the P/B ratio with the regulatory variables, aiming to confirm the results obtained with the first model.
Table 2 presents the performance of the price-to-book ratio across different years. Notably, the ratio dipped below 1 in 2008 and has remained below that threshold since. The onset of the COVID crisis mirrored values akin to those witnessed during the 2008 crisis.
Table 3 shows country-by-country breakdown of the P/B ratio and showcases the diverse financial landscapes within which financial institutions operate. This variance likely reflects the differing economic conditions, and market sentiments prevalent in each country. Such a detailed analysis can provide insights into how regional factors influence financial metrics.
3.2. Modeling the Price-to-Book Ratio with the Equity
To examine the hypotheses, we conducted an analysis by modeling the P/B ratio utilizing variables associated with the equity components. Our approach, labeled as Model 1, aimed to gauge the relationships between the P/B ratio and each individual equity component. This analysis employed linear regression techniques using cross-sectional data spanning the 2005-2020 period. The dependent variable in this model is the P/B ratio, while the independent variables comprise the relationships between each equity component and total equity, the preceding year’s P/B ratio, and selected dummy variables.
The sum of all equity component variables equated to 1. As the model has a constant, we opted to exclude the variable MIj, which exhibited minimal significance based on Table 1. Additionally, we excluded a dummy variable pertaining to the country Austria and another dummy variable representing size, specifically the first quartile. Model 1 is:
[1]
The results obtained from Model 1 are summarised in Table 4.
Table 4 summarizes the regression analysis outcomes for the P/B ratio across financial institutions, highlighting several key findings. Notably, Yearly Net Income (YNI) and Other Comprehensive Income (YOCI) significantly positively affect the price-to-book ratio, indicating that higher earnings and comprehensive income are associated with higher market valuation. The presence of country dummies and the significant impact of certain quartiles suggest that geographic and size-based factors also play crucial roles in determining the price-to-book ratio. The linear regression, based on cross-sectional data, encompassed observations from 45 banks across a span of 16 years, totaling 720 data points. Upon the exclusion of one year’s data (lag(Price_book)), the dataset was reduced to 675 observations.
However, this regression exhibited a notably poor goodness of fit, a trend that significantly improved upon the inclusion of the previous year’s P/B ratio. This enhancement, coupled with the observed evolution of the P/B ratio over the years as outlined in Table 3, underscores dynamic behavior within the dataset, prompting a comprehensive analysis combining time series and cross-sectional approaches.
Recognizing the necessity to incorporate information on each variable across each year, we advocate for the inclusion of time series analysis alongside the cross-sectional approach, necessitating the use of an econometric panel data model. This methodology enables the delineation of distinct banking behaviors across different years. To address concerns regarding endogeneity and control for within-bank dynamics, we employ panel data estimations with fixed effects.
Figure 3 visually illustrates the behavior of independent variables concerning the dependent variable, with the primary objective being the identification of potential outliers within the linear models that may have contributed to the diminished goodness of fit observed in Model 1.
Figure 3 shows outliers among the independent variables. The literature indicates that the incidence of outliers can be reduced with non-linear adjustments to the linear models (MacMillan, 2004 and Ogwang, 2021).
If we apply panel data to Model 1, in addition to adding quadratic adjustments to the independent variables, we obtain the following Model 2:
[2]
j=1 to 46
t= 2005 to 2020
The results of Model 2 are summarised in Table 5. We estimate a robust covariance matrix of parameters for a fixed effects or random effects panel model according to Arellano (1987).
Model 2 improves the goodness of fit compared to Model 13. In Model 2, we observed several significant linear coefficients. Year Net Income, Other Comprehensive Income, Accumulated Other Comprehensive Income, Treasury Stock, Share Premium, and the price-to-book ratio from the previous year displayed substantial positive linear coefficients. Notably, Year Net Income also exhibited a significant positive quadratic coefficient. Year Net Income has a direct relationship but this relationship is not just linear but also bends upwards, indicating that the increase in the dependent variable accelerates as Year Net Income grows, illustrating a more complex, non-linear relationship between the two. The economic impact is really high if we consider the size of this last coefficient and their practical implications: changes in Year Net Income affect the bank P/P ratio significantly.
Our analysis confirms that profitability significantly explains variations in the price-to-book ratio. However, investor contributions as guarantees for third parties do not display a similar explanatory power. Both financial year variables related to earnings, documented in both the Income Statement and Other Comprehensive Income, were statistically significant. Additionally, earnings from Other Comprehensive Income in prior years also showed significance. This finding may be attributed to the accounting practice under IFRS 9, where certain earnings recorded in Other Comprehensive Income from previous financial periods recycled in the Income Statement in subsequent financial years.
Among variables related to shareholders’ contributions, only Treasury Stock and Share Premium held significance. The market positively views shareholder remuneration through the repurchase of own shares, indicating a favorable perception. Share Premium’s positive perception could be due to its status as a reserve available for dividend distribution. Notably, major banks chose to make substantial payments by reimbursing share premiums.
The analysis categorized countries based on their impact on the P/B ratio: some, like Austria, had no significant effect, while others significantly affected it, showing diverse economic behaviors. Additionally, the size of a bank’s assets influenced its P/B ratio, with larger banks and those in the second quartile facing more penalties, suggesting that larger asset volumes might not always be favorable in valuation metrics.
Models 2 was run without data from the 2020 year, to analyse whether the beginning of COVID crises altered the results. The conclusions obtained were the same, confirming the robustness of the proposed model.
3.3. Modeling the Price-to-Book Ratio with the Regulatory Capital
With the aim of validating our model, we turn to different data: those provided on the regulatory capital of banks.
In Model 3, utilizing panel data, the P/B ratio serves as the dependent variable, while the ratio of each capital component over total capital is considered an independent variable. To avoid multicollinearity, the least relevant variable, AT1, was excluded based on Table 1. Expected dividend, combining solvency-related variables and a factor reducing bank solvency, was also included as an independent variable. Additionally, we incorporated the P/B ratio from the previous year, the same dummy variables from Model 2, and quadratic adjustments as independent variables in this regression analysis. To address concerns regarding endogeneity and control for within-bank dynamics, we employ panel data estimations with fixed effects. Model 3 can be summarised as:
[3]
j=1 to 46
t= 2005 to 2020
Table 6 summarises the results of Model 3.
As illustrated in Table 6, the explanatory power of the data in relation to the P/B ratio based on various capital components exhibited notably low goodness of fit. However, this improved considerably upon the inclusion of anticipated dividends, which contribute to a reduction in regulatory capital, and the consideration of the previous year’s P/B ratio. Notably, performance variations were observed across different countries but remained consistent across banks of varying sizes.
CET1 displayed a significant non-linear relationship with the price-to-book ratio, while TIER 2 exhibited no significant relationship. The impact of dividends demonstrated a concave quadratic influence. The economic impact is high if we evaluate the size of this coefficient and their practical implications; changes in dividends affect the P/B ratio significantly. We suggest a maximal effect around approximately 0.3, as visualized more explicitly in Figure 4. Notably, an increase in dividends did not linearly affect the P/B ratio; for instance, an increase from 0.10 to 0.11 in the dividend percentage did not have an equivalent impact compared to an increase from 0.15 to 0.16. The linear estimation tended to underestimate the effect of dividends, as evidenced by the disparity between the red curve and the blue line.
Model 3 was run without data from the 2020 year, to analyse whether the beginning of COVID crises altered the results. The conclusions obtained were the same, confirming the robustness of the proposed model.
4. Discussion
The P/B ratio dipped below 1 during the 2008 crisis and has maintained relative stability, even at the beginning of the 2020 crisis. The persistent sub-1 ratio post-2008 suggests a long-term adjustment in investor valuation frameworks, possibly reflecting a reassessment of risk or a shift in investment strategies.
We find a consistent stability in annual earnings reported. Furthermore, when dividend distribution faces no restrictions, there is a parallel stability in the proportion of dividends disbursed each year. There is a tendency for higher earnings in the Income Statement compared to Other Comprehensive Income. This could be justified by considering that profits recorded in the Income Statement can be distributed as dividends, unlike profits recorded in Other Comprehensive Income.
Our analysis underscores the pivotal role of profitability-related variables and their distribution in driving a positive correlation with the P/B ratio. Conversely, variables associated with investor contributions aimed at safeguarding creditors exhibit a significant negative correlation.
Studies have established a significant relationship between the results of the Income Statement and the P/B ratio (Balasubramnian et al., 2019). Our research expands on these findings by demonstrating that this positive relationship extends to all components of equity that are linked to the entity’s profitability, not just the outcomes reported in the Income Statement. Specifically, our analysis reveals a nuanced, non-linear relationship between the performance figures reported in the Income Statement and the P/B ratio. This indicates that as the Year Net Income increases, the growth in the P/B ratios not only continues but accelerates, suggesting a progressive intensification in the valuation impact of rising profits.
Previous research has consistently not identified a significant relationship between share capital and bank market value, attributed to factors such as increased cost of capital, declining profitability, etc. (Handorf, 2011; Bertsatos and Sakellaris, 2016; He et al., 2024). Our study finds that most components related to investor contributions intended as safeguards for third parties do not significantly explain share price movements—with two notable exceptions: treasury stock and share premium. Treasury stock is indicative of shareholder return on investment and equity reduction, while share premium accounts facilitates the distribution of dividends with fewer regulatory obstacles. Our findings suggest that the market does not value investor contributions that protect creditors; instead, it appears to reward strategies that diminish these safeguards.
The findings from our analysis of the entities’ financial data are further corroborated by regulatory information. Initially, we confirm a significant relationship between the P/B ratio and the Common Equity Tier 1 (CET1), aligning with earlier research by Jordan et al. (2011). Notably, we identify a significant non-linear relationship in this context. This is justified by our discovery of a non-linear relationship between the Income Statement and the P/B ratio, particularly since the Income Statement factors into the calculation of CET1. Furthermore, consistent with prior studies by Andreeva et al. (2023), our research establishes a significant relationship between dividends paid and the P/B ratio. Specifically, our findings reveal a pronounced concave quadratic effect, suggesting that the impact of dividends on the P/B ratio increases at a decreasing rate as dividend payments rise.
Investors do not value banks for boosting their minimum required regulatory capital in compliance with Basel III guidelines, as has already been highlighted by Ercegovac et al. (2020). This reaction occurs despite findings by some researchers, such as Song (2023) and Adelopo et al. (2022), who argue that this increased capital requirement does not directly contribute to the observed reduction in profitability and increase stability bank. Our analysis suggests that the limitations imposed on dividend distributions, intended to strengthen banks’ capital bases and enhance their intermediation capabilities, do not inherently bolster the sustainability of their market prices. This implies a disconnect between regulatory intentions and market perceptions, highlighting a complex interplay where increased regulatory capital requirements may be viewed unfavorably by investors, regardless of their potential benefits for financial stability.
The observed dominance of profitability and dividend policies, as opposed to direct investor contributions, in influencing market valuations necessitates a critical reevaluation of the impacts of Basel III, as highlighted by Vickers (2019). Specifically, it is essential to examine how increases in regulatory capital adversely affect market value. The implementation of Basel III, which leads to a decline in the P/B ratio, may prompt banks to increase their dividend payouts, as posited by Gambacorta et al. (2023). However, such actions could further deteriorate the financial condition of these entities, potentially creating a feedback loop that depresses market confidence and valuations even further.
There is a strong dynamic behavior in the P/B ratio, with past values exerting a significant influence on future values. This underscores the importance of historical trends in understanding the trajectory of this crucial metric.
There are differences between countries and additionally, a bank’s asset volume played a role in the P/B ratio, with larger banks and those in the second quartile experiencing greater penalization, in line with previous researches (Gharaibeh and Jaradat 2021). This situation suggests a complex interplay of factors influencing this metric.
While our study sheds light on the behavior of market prices, future research avenues beckon. An intriguing direction involves examining potential divergences in investor behavior, particularly between institutional investors and individual shareholders when trading bank shares. Additionally, other studies considering data from other regions, such as the United States, can help mitigate concerns regarding the external validity of our study.
Ultimately, our work invites further exploration into the intricate dynamics governing the P/B ratio, highlighting its significance as a barometer of investor sentiment and bank performance. In addition, if a sample extending up to 2024 is considered, the effects of the COVID crisis that began in 2020 could be taken into account.
Appendix A
| 1 | Higher risk taking will likely increase the cash flows, but during crisis they likely result in huge loan losses due to large bad debts particularly in high-risk category loans. |
| 2 | In accordance with IFRS 9, hybrid contracts will be equity when they evidence a residual interest in the assets of an entity after deducting all its liabilities. That´s why in EHS (Equity Hybrid Securities) component, we are only including the amount corresponding to hybrid instruments with a net equity nature and we do not include instruments classified as liabilities, for example senior liabilities. |
| 3 | The cross-sectional analysis in Table 4 has the same number of observations as the panel one in subsequent tables, because the cross-sectional analysis uses only banks that had data for all years within the period 2005 to 2020. |
References
- Abuzayed B., Molyneux P, Al-Fayoumi N (2009): “Market Value, Book Value and Earnings: Is Bank Efficiency a Missing Link?” Managerial Finance, vol. 35, n.o 2, pp. 156-79. DOI.org (Crossref). [CrossRef]
- Adelopo I.; Vichou N., Cheung K (2022): “Capital, liquidity and profitability in Europeans Banks” Journal of Corporate Accounting and Finance. vol. 33, n.o 1, pp. 23-35. DOI.org (Crossref). [CrossRef]
- Agrawal S, Monemr R, Ariffsurendra (1996): “Price to Book Ratio as a valuation model: An Empirical Investigation” Finance India Vol. X 2, June pp.333–344.
- Aiyar, S.; Calomiris, CW.; Wieladek, T.(2015): “Bank Capital Regulation: Theory, Empirics, and Policy” IMF Economic Review. vol. 63, n.o 4, pp. 955-83. DOI.org (Crossref). [CrossRef]
- Altavilla C., Boucinha M, Peydro J.L. (2018): “Monetary Policy and Bank Profitability in a Low Interest Rate Environment”, Economic Policy. Vol. 33, Issue 96, pp. 531-586.
- Anandarajan, A., Francis, B., Hasan, I., John, K. (2011):”Value relevance of banks: Global evidence”. Review of Quantitative Finance and Accounting, vol. 36, n.o 1, enero de 2011, pp. 33-55. DOI.org (Crossref). [CrossRef]
- Andreeva D, Bochmann P., Schneider J. (2023):” Evaluating the impact of dividend restrictions on euro area bank market values” Working Paper Series European Central Bank No 2787 / February DOI.org (Crossref). [CrossRef]
- Arellano M (1987): “Computing Robust Standard Errors for Within-groups Estimators”. Oxford bulletin of Economics and Statistics, vol. 49, n.o 4, pp. 431-34. DOI.org (Crossref). [CrossRef]
- Balasubramnian B, Palvia A, Patro D (2019): “Can the Book-to-Market Ratio Signal Banks’ Earnings and Default Risk? Evidence Around the Great Recession” Journal of Financial Services Research, vol. 56, n.o 2, pp. 119-43. DOI.org (Crossref). [CrossRef]
- Baker M & Wurgler J (2015): “Would stricter capital requirements raise the cost of capital? Bank capital regulation and the low-risk anomaly”. American Economic Review vol. 105, pp. 315-320. DOI.org (Crossref). [CrossRef]
- Barber B.M.& Lyon, J.D. (1997): “Firm size, book-to-market ratio, and security returns: A holdout sample of financial firms”. The Journal of Finance, vol. 52, n.o 2, p. 875. DOI.org (Crossref). [CrossRef]
- Barth M. E., Beaver, W. H.& Landsman, W. R. (1996):” Value-relevance of banks fair value disclosures under SFAS 107”. The Accounting Review, 71(4), pp. 513-537.
- Belloni M., Grodzicki M., Jarmuzek M. (2021):” What makes banks adjust dividend pay-outs?” Macroprudential Bulletin, Issue 13, European Central Bank, Frankfurt am Main.
- Bernard, V. L. (1994):” Accounting-based valuation methods, determinants of market-to-book ratios, and implications for financial statement analysis”. Working paper (University of Michigan. Business School. Faculty Research) Nº9401.
- Bertsatos, G; Sakellaris, P.(2016): “A dynamic model of bank valuation” Economics Letters vol. 145, pp. 15-18. DOI.org (Crossref). [CrossRef]
- Bogdanova B., Fender I, Takáts E. (2018):”The ABCs of bank PBRs” BIS Quarterly Review, March pp.81-95.
- Borio, C., Gambacorta L-, Hoffman B.(2017):” The Influence of Monetary Policy on Bank Profitability”, International Finance, vol. 20, n.o 1, pp. 48-63. DOI.org (Crossref). [CrossRef]
- Brief R.P., Lawson R. A. (1992): “The role of the accounting rate of return in financial statement analysis”. The Accounting Review, April, pp. 411-426.
- Burdekin R, Yang Y (2013): “Book-to-Market Equity, Asset Correlations and the Basel Capital Requirement: Cross market trading in China’s large state-owned commercial banks 2006-2011” Contemporary economic policy, Vol.31 nº2,pp, 366-377.
- Calomiris, C.W., Nissim, D. (2014):”Crisis-related shifts in the market valuation of banking activities” Journal of Financial Intermediation, vol. 23, n.o 3, pp. 400-35. DOI.org (Crossref). [CrossRef]
- Chiorazzo V., Milani C. & Salvini F. (2008): “Income diversification and bank performance: Evidence from Italian banks”. Journal of Financial Services Research vol. 33, n.o 3, junio de 2008, pp. 181-203. DOI.org (Crossref). [CrossRef]
- Chousakos K, Gorton G. (2017): “Bank Health Post-Crisis. Banque of France”. Financial Stability Review, 21 pp. 55-67. DOI.org (Crossref).
- Claessens S., Coleman N Donnelly M. (2018): “Low-For-Long’ Interest Rates and Banks’ Interest Margins and Profitability: Cross-country Evidence”, Journal of Financial Intermediation, vol. 35, pp. 1-16. DOI.org (Crossref). [CrossRef]
- Collins, D., Maydew, E. Weiss, I. (1997): “Changes in the value-relevance of earnings and book values over the past forty years”, Journal of Accounting and Economics, vol. 24, n.o 1, pp. 39-67. DOI.org (Crossref). [CrossRef]
- Das, S., Lev, B. (1994): “Nonlinearity in the returns earnings relation: Tests of alternative specifications and explanations”. Contemporary Accounting Research, vol. 11, n.o 1, 0pp. 353-79. DOI.org (Crossref). [CrossRef]
- Demirguc-Kunt A, Detragiache E, Merrocuhe O (2013): “Bank Capital: Lessons from the Financial Crisis” Journal of money, credit and banking, vol. 45, n.o 6, pp. 1147-64. DOI.org (Crossref). [CrossRef]
- DeYoung R.,Roland K.P (2001); “Product mix and earnings volatility at commercial banks. Evidence from a degree of total leverage model”. Journal of Financial Intermediation vol. 10, n.o 1, pp. 54-84. DOI.org (Crossref). [CrossRef]
- Dontoh A., Ronen, J. Radhakrishnan, J. (2007): “Is stock price a good measure for assessing value- relevance of earnings? An empirical test”, Review of Managerial Science, vol. 1, n.o 1, pp. 3-45. DOI.org (Crossref). [CrossRef]
- Drago, D., Mazzuca, M. and Trina, R. (2013): “Do loans fair value affect market value? Evidence from European banks”. Journal of Financial Regulation and Compliance, vol. 21, n.o 2, pp. 108-20. DOI.org (Crossref). [CrossRef]
- Duke, S. B., Nneji, I. D., & S. E., N. (2015)” Impact of Dividend Policy on Share Price. Valuation in Nigerian Banks”. Archives of Business Research, vol. 3, n.o 1, DOI.org (Crossref). [CrossRef]
- Edwards E.O., Bell, P.W. (1961): “The theory and measurement of business income”. Berkeley: University of California Press.
- Ercegovac R, Pecaric M, Klinac I (2020): “What Determines the Price to Book Ratio in the European Banking Sector?” Journal of Economics and Finance 70 (3) pp. 62-280.
- European Central Bank (2012): !Developments in the price-to-book ratios of large and complex banking groups Box 4”. Financial Stability Review December 63-65.
- Fairfield M, Harris TS (1993):”Price-Earnings and Price-To-Book Anamolies: Tests of an Intrinsic Value Explanation”. Contemporary Accounting Research, vol. 9, n.o 2, pp. 590-611. DOI.org (Crossref). [CrossRef]
- Ferretti R, Gallo G, Andi A,Venturelli V (2018): “Market-book ratios of European Banks: What does explain the structural fall?” CEFIN Working Papers Nº 65.
- Fiechter, P.,Novotny-Farkas, Z. (2017):” The impact of the institutional environment on the value relevance of fair values”. Review of Accounting Studies, vol. 22, n.o 1, pp. 392-429. DOI.org (Crossref). [CrossRef]
- Gabrieli S., Mariannet B., Sammeth F. (2021): “Is there a need for greater banking consolidation in France or Europe”. Buletin de la Banque de France 325/2 May June; 1-4.
- Gharaibeh, O.K.; Jaradat, M.A.(2021):”Determinants of Stock Prices in Jordanian Banks: An Empirical Study of 2006-2018” The Journal of Asian Finance, Economics and Business (JAFEB) Vol. 8 nª7 pp. 349-356 DOI.org (Crossref) . [CrossRef]
- Gambacorta, L., Oliviero, T., Shin, H.S. (2023): “Low price-to-book ratios and bank dividend payouts: economic policy implications” Economic Policy p. eiad028. DOI.org (Crossref). [CrossRef]
- García-Olalla, M.; Luna, M. (2021):” Market reaction to supranational banking supervision in Europe: Do firm- and country-specific factors matter?” Empírica vol. 48, n.o 4,pp. 947-75. DOI.org (Crossref). [CrossRef]
- Giner B., Mora A. (2020); “The value relevance of risk disclosure: An analysis of the banking secto”. Accounting in Europe. vol. 17, n.o 2, pp. 129-57. DOI.org (Crossref). [CrossRef]
- Goh B, Lib N, Young K (2009);” Market Pricing of banks´ fair value assets reported under SFAS 157 during the 2008 economic crisis”. Working Paper MIT.
- Grodzicki M., Rodriguez C, Vioto D. (2019): “Recent developments in banks’ price-to-book ratios and their determinants” Financial Stability Review, Box 5 May pp. 66-69.
- Guermazi, W., Halioui, K. (2020): “Do differences in national cultures affect cross country conditional conservatism behavior under IFRS?” Research in International Business and Finance, vol. 52, p. 101171. DOI.org (Crossref). [CrossRef]
- Handorf, W (2011); “Capital management and bank value”. Journal of banking regulation, vol. 12, n.o 4, pp. 331-41. DOI.org (Crossref). [CrossRef]
- Huizinga H.,Laeven L (2012):” Bank valuation and accounting discretion during a financial crisis”. Journal of Financial Economy vol. 106, n.o 3, pp. 614-34. DOI.org (Crossref). [CrossRef]
- He, L.; Li, H.; Liu, H.; Vu, T.N. (2024): ”Why do banks issue equity?” Research in International Business and Finance , vol. 69, p. 102256. DOI.org (Crossref). [CrossRef]
- IASB (2018): “Conceptual framework for financial reporting”. March.
- IASB (2011):” Financial Instruments”. November.
- Jordan D.J., Rice D, Sanchez J, Wort D (2011):” Explaining Bank Market-to-Book Ratios: Evidence From 2006 to 2009”. Journal of Banking and Finance, 35,pp. 2047-2055.
- Knaup M & Wagner W (2009):” A market-based measure of credit quality and banks´ performance during the subprime crisis”. Working Paper. Tilburg University.
- Kolev K (2009):” Do investor perceive marking-to-model as marking to myth? Early evidence from SFAS 157 Disclosure.” Working Paper. NYV Stern School of Business.
- Kothari S. (2001): “Capital market research in accounting”, Journal of Accounting and Economics, Vol. 31, pp.105-231.
- Leong, K.-Y.; Ariff, M.; Alireza, Z.; Bhatti, M.I.(2023):”Bank stock valuation theories: do they explain prices based on theories?” International Journal of Managerial Finance, vol. 19, n.o 2, pp. 331-50. DOI.org (Crossref). [CrossRef]
- Liao L., Kang H., Morris, R.D. (2020): “The Value Relevance of Fair Value and Historical Cost Measurements During the Financial Crisis”. Accounting and Finance. vol. 61, n.o S1, pp. 2069-107. DOI.org (Crossref). [CrossRef]
- Lindenberg E., Ross S. (1981):”Tobin’s q ratio and Industrial Organization”. Journal of Business vol. 54, n.o 1, p. 1. DOI.org (Crossref). [CrossRef]
- Macit F, Topaloglu Z. (2012): “Why bank market value to book value ratios so different: Evidence from Turkish banking sector”. Economic and Business Review vol. 14, n.o 2, DOI.org (Crossref). [CrossRef]
- Marangu K. & Jagongo A (2014):” Price to book value ratio and financial statement variables (An empirical study of companies quoted at Nairobi Securities Exchange, Kenya)” Global Journal of Commerce & Management Perspective Vol.3(6) pp. 50-56.
- McMillan D. G. (2004):” Non-Linear Error Correction: Evidence for UK Interest Rates.” The Manchester School, vol. 72, n.o 5, pp. 626-40. DOI.org (Crossref). [CrossRef]
- Ohlson J.A. (1995):” Earnings, book values and dividends in equity valuation”. Contemporary Accounting Research vol. 11, n.o 2, pp. 661-87. DOI.org (Crossref). [CrossRef]
- Ogwang J. (2021):”Some Non-Linear Problems in Accounting and Finance: Can We Apply Regression?” International Journal of Business, Economics and Management, vol. 8, n.o 2, pp. 81-99. DOI.org (Crossref). [CrossRef]
- Park, S. (2002):” Put option value of thrifts in the 1980s: Evidence from thrift stock reactions to the FIRREA”. Journal of Financial and Quantitative Analysis, Vol. 37 nº1, pp. 157-176.
- Penman SH (1998):” Combining Earnings and Book Value in Equity Valuation”, Contemporary Accounting Research, vol. 15, n.o 3, pp. 291-324. DOI.org (Crossref). [CrossRef]
- Penman, S. H., Richardson, S. A., Tuna, I. (2007):”The book to price effect in stock returns: accounting for leverage”. Journal of Accounting Research, vol. 45, n.o 2, pp. 427-67. DOI.org (Crossref). [CrossRef]
- Pesaran, M. H., Timmermann, A. (1995):”Predictability of stock returns: Robustness and economic significance”. The Journal of Finance, vol. 50, n.o 4, pp. 1201-28. DOI.org (Crossref). [CrossRef]
- Ranti O, Uwuigbe U, Jafaru J, Adebayo O, Oladipo O (2016): “Value relevance of financial statements and share price: a study of listed banks in Nigeria”. Banks and bank systems, pp.135-143.
- Richardson, S. (2006):”Over-investment of free cash flow”. Review of Accounting Studies, vol. 11, n.o 2-3, pp. 159-89. DOI.org (Crossref). [CrossRef]
- Sakellaris, P. ; Bertsatos, G.(2016): “A dynamic model of bank valuation” Economics Letters, vol. 145, pp. 15-18. DOI.org (Crossref). [CrossRef]
- Saunders A., Willisen M (2021): “Measure for measure: evidence on the relative performance of regulatory requirements for small and large banks”. Staff Working Paper. Nº 922. Bank of England.
- Sarin N.,Summers L. (2016):” Understanding Bank Risk through Market Measures” Brookings papers on economic activity, Vol. 2016, n.o 2, pp. 57-127. DOI.org (Crossref). [CrossRef]
- Sharma, S.; Bhardwaj, I.; Kishore, K.(2023): “Capturing the impact of accounting and regulatory variables on stock prices of banks – an empirical study of Indian banks in panel data modeling” Asian Journal of Accounting Research, Vol. nº(2, pp.184–193.
- Siekkinen, J. (2016):”Value relevance of fair values in different investor protection environments”. Accounting Forum, vol. 40, n.o 1, marzo de 2016, pp. 1-15. DOI.org (Crossref). [CrossRef]
- Shekhar A, Calomiris C., Wieladek T (2015):” Bank Capital Regulation: Theory, Empirics, and Policy” IMF Economic Review, vol. 63, n.o 4,, pp. 955-83. DOI.org (Crossref). [CrossRef]
- Soewarno, N.,Utami, S.R. (2010):”Significance of accounting information in explaining market and book values: The case of Indonesian Banks” International Research Journal of Finance and Economics, Vol.55, pp. 146–157.
- Song, G. (2023): “Evaluating Large Bank Risk Using Stock Market Measures in the Basel III Period” Journal of Corporate Accounting and Finance, vol. 34, n.o 1, pp. 21-32. DOI.org (Crossref). [CrossRef]
- Vickers, J(2019):”Safer, but Not Safe Enough” Journal of Risk and Financial Management, vol. 12, n.o 3, p. 152. DOI.org (Crossref). [CrossRef]
- Welch I (2004):” Capital Structure and Stock Returns”. Journal of Political Economy, Vol 112 nº1 pp.106-131.
- Yao, M., Liang, C. (2005):”An investigation into the differences between the book value and market value of commercial banks: An empirical study”. International Journal of Management, Vol.22 nº1, pp. 89-100.
- Zéghal, D., Maaloul, A. (2011):” The accounting treatment of intangibles–A critical review of the literature”. Accounting Forum, . vol. 35, n.o 4, pp. 262-74. DOI.org (Crossref). [CrossRef]
Figure 1.
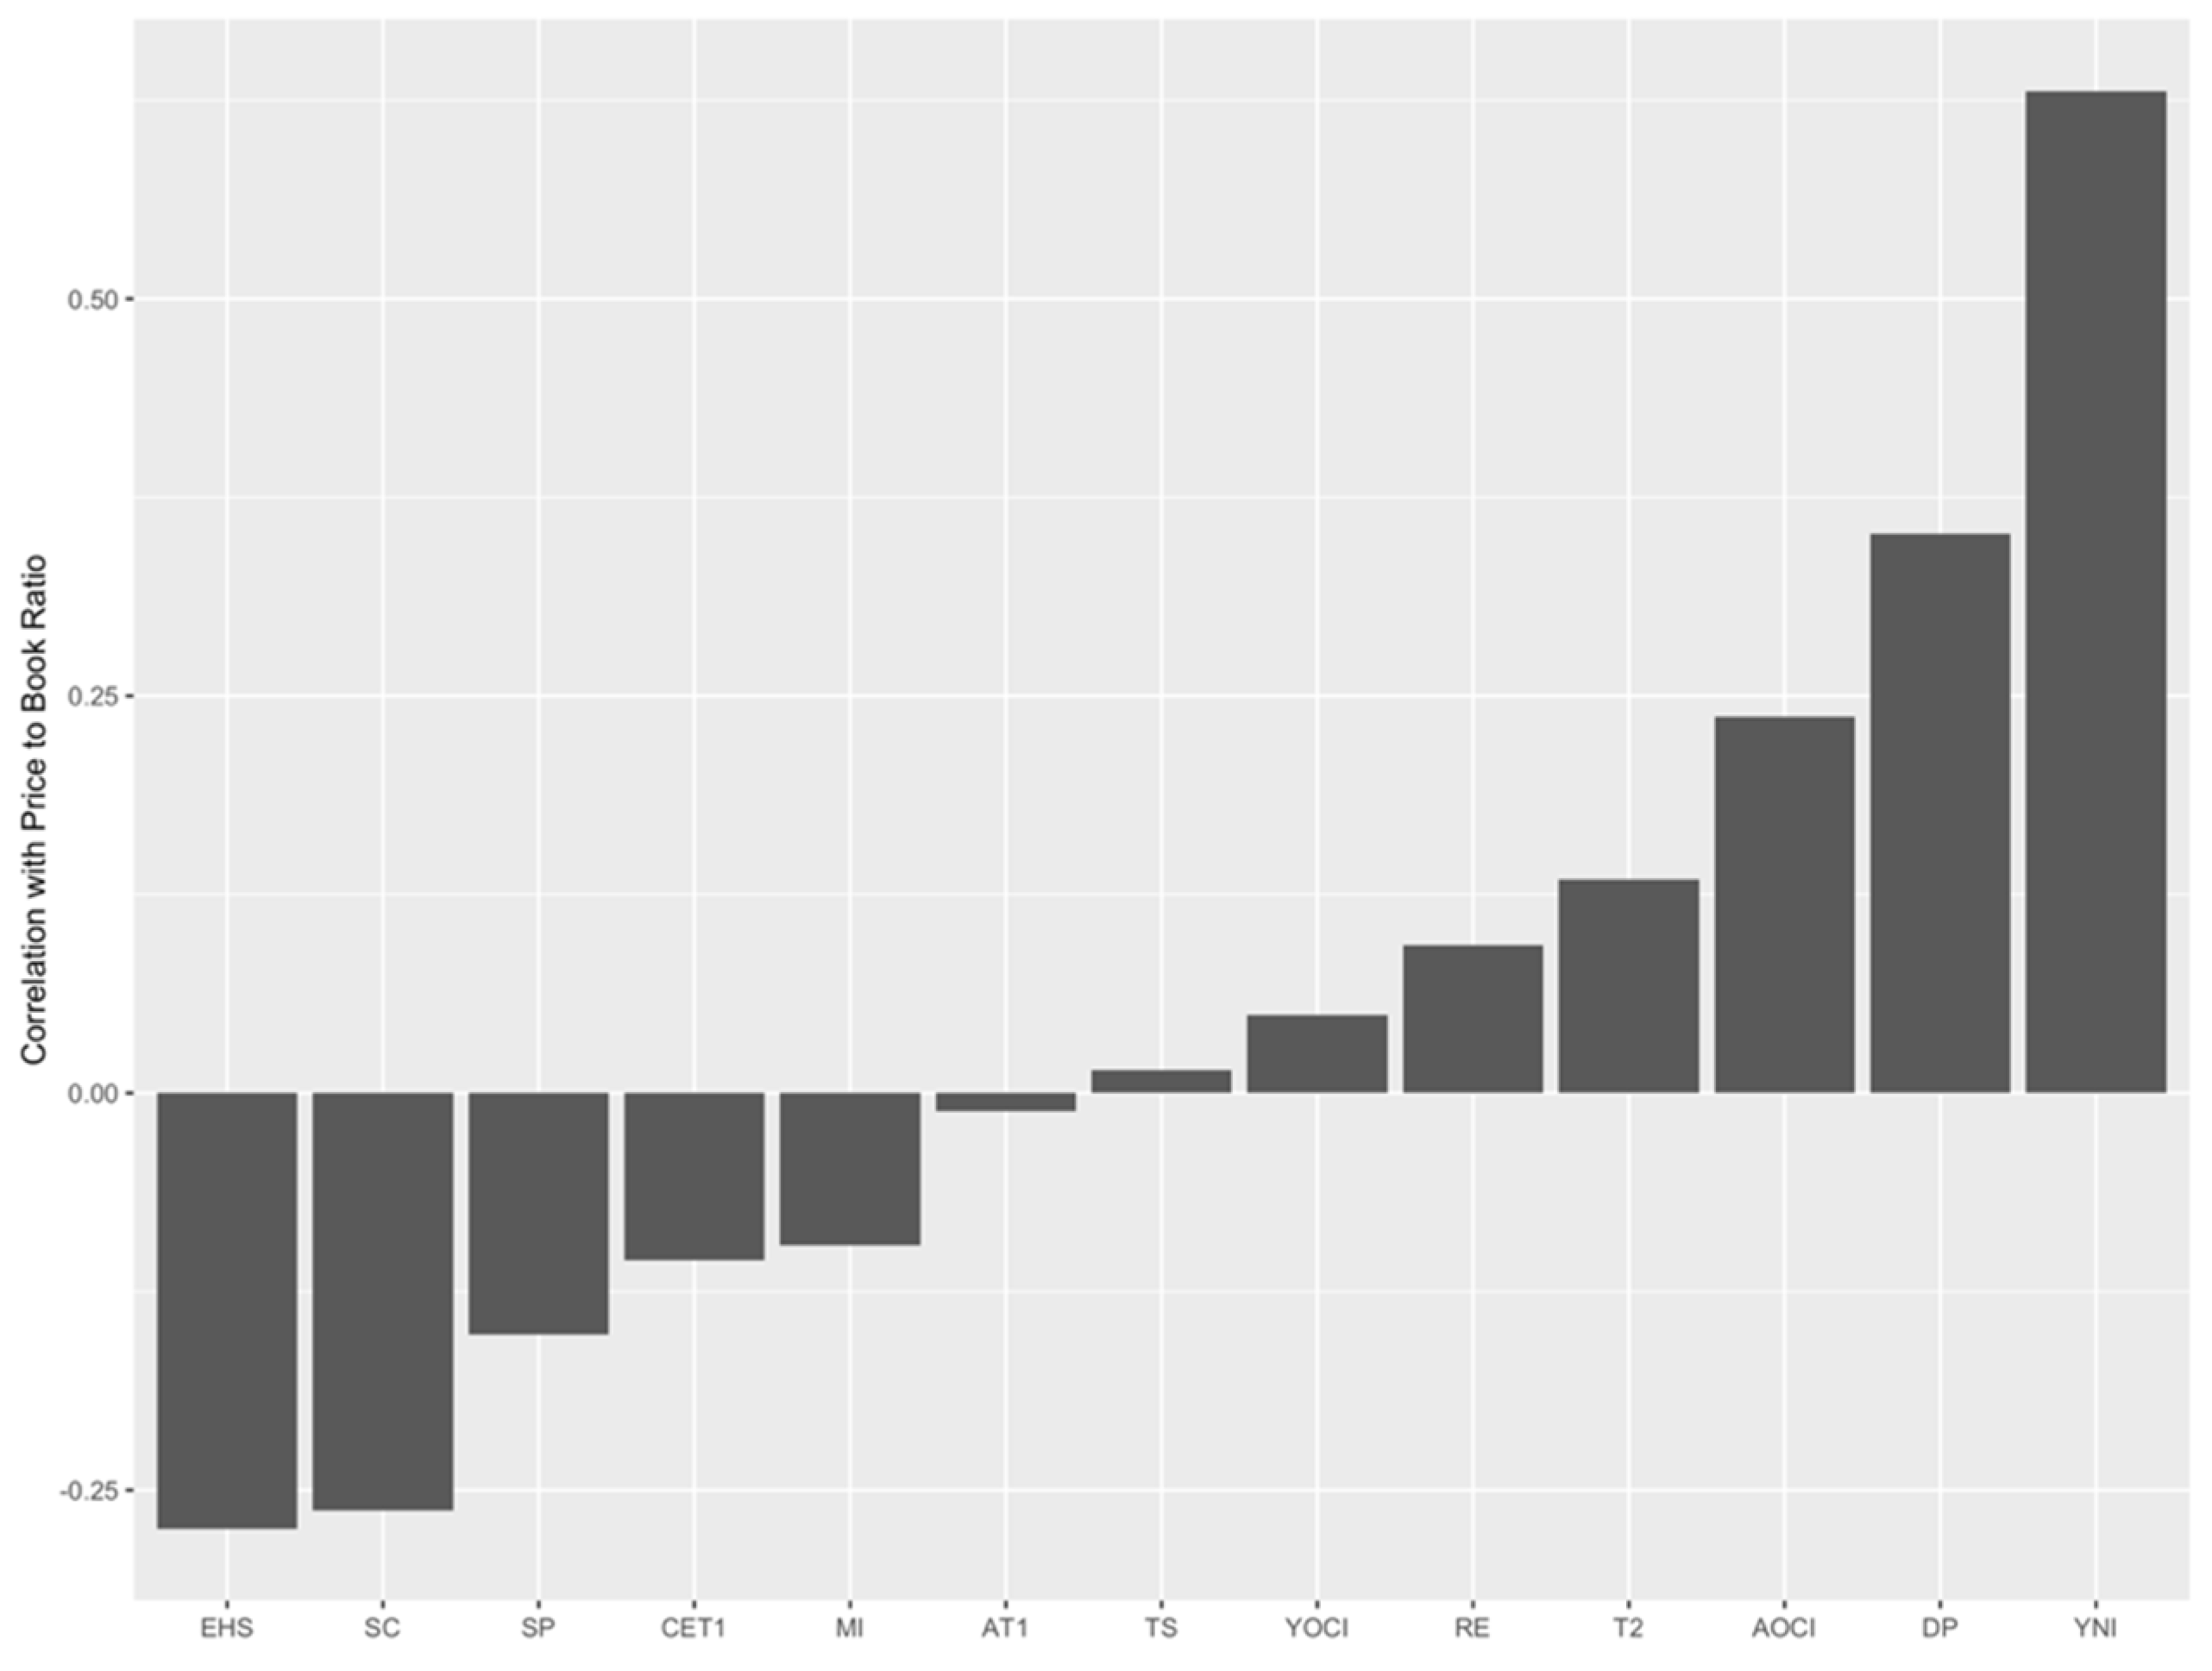
Figure 2.
Correlation of all variables.
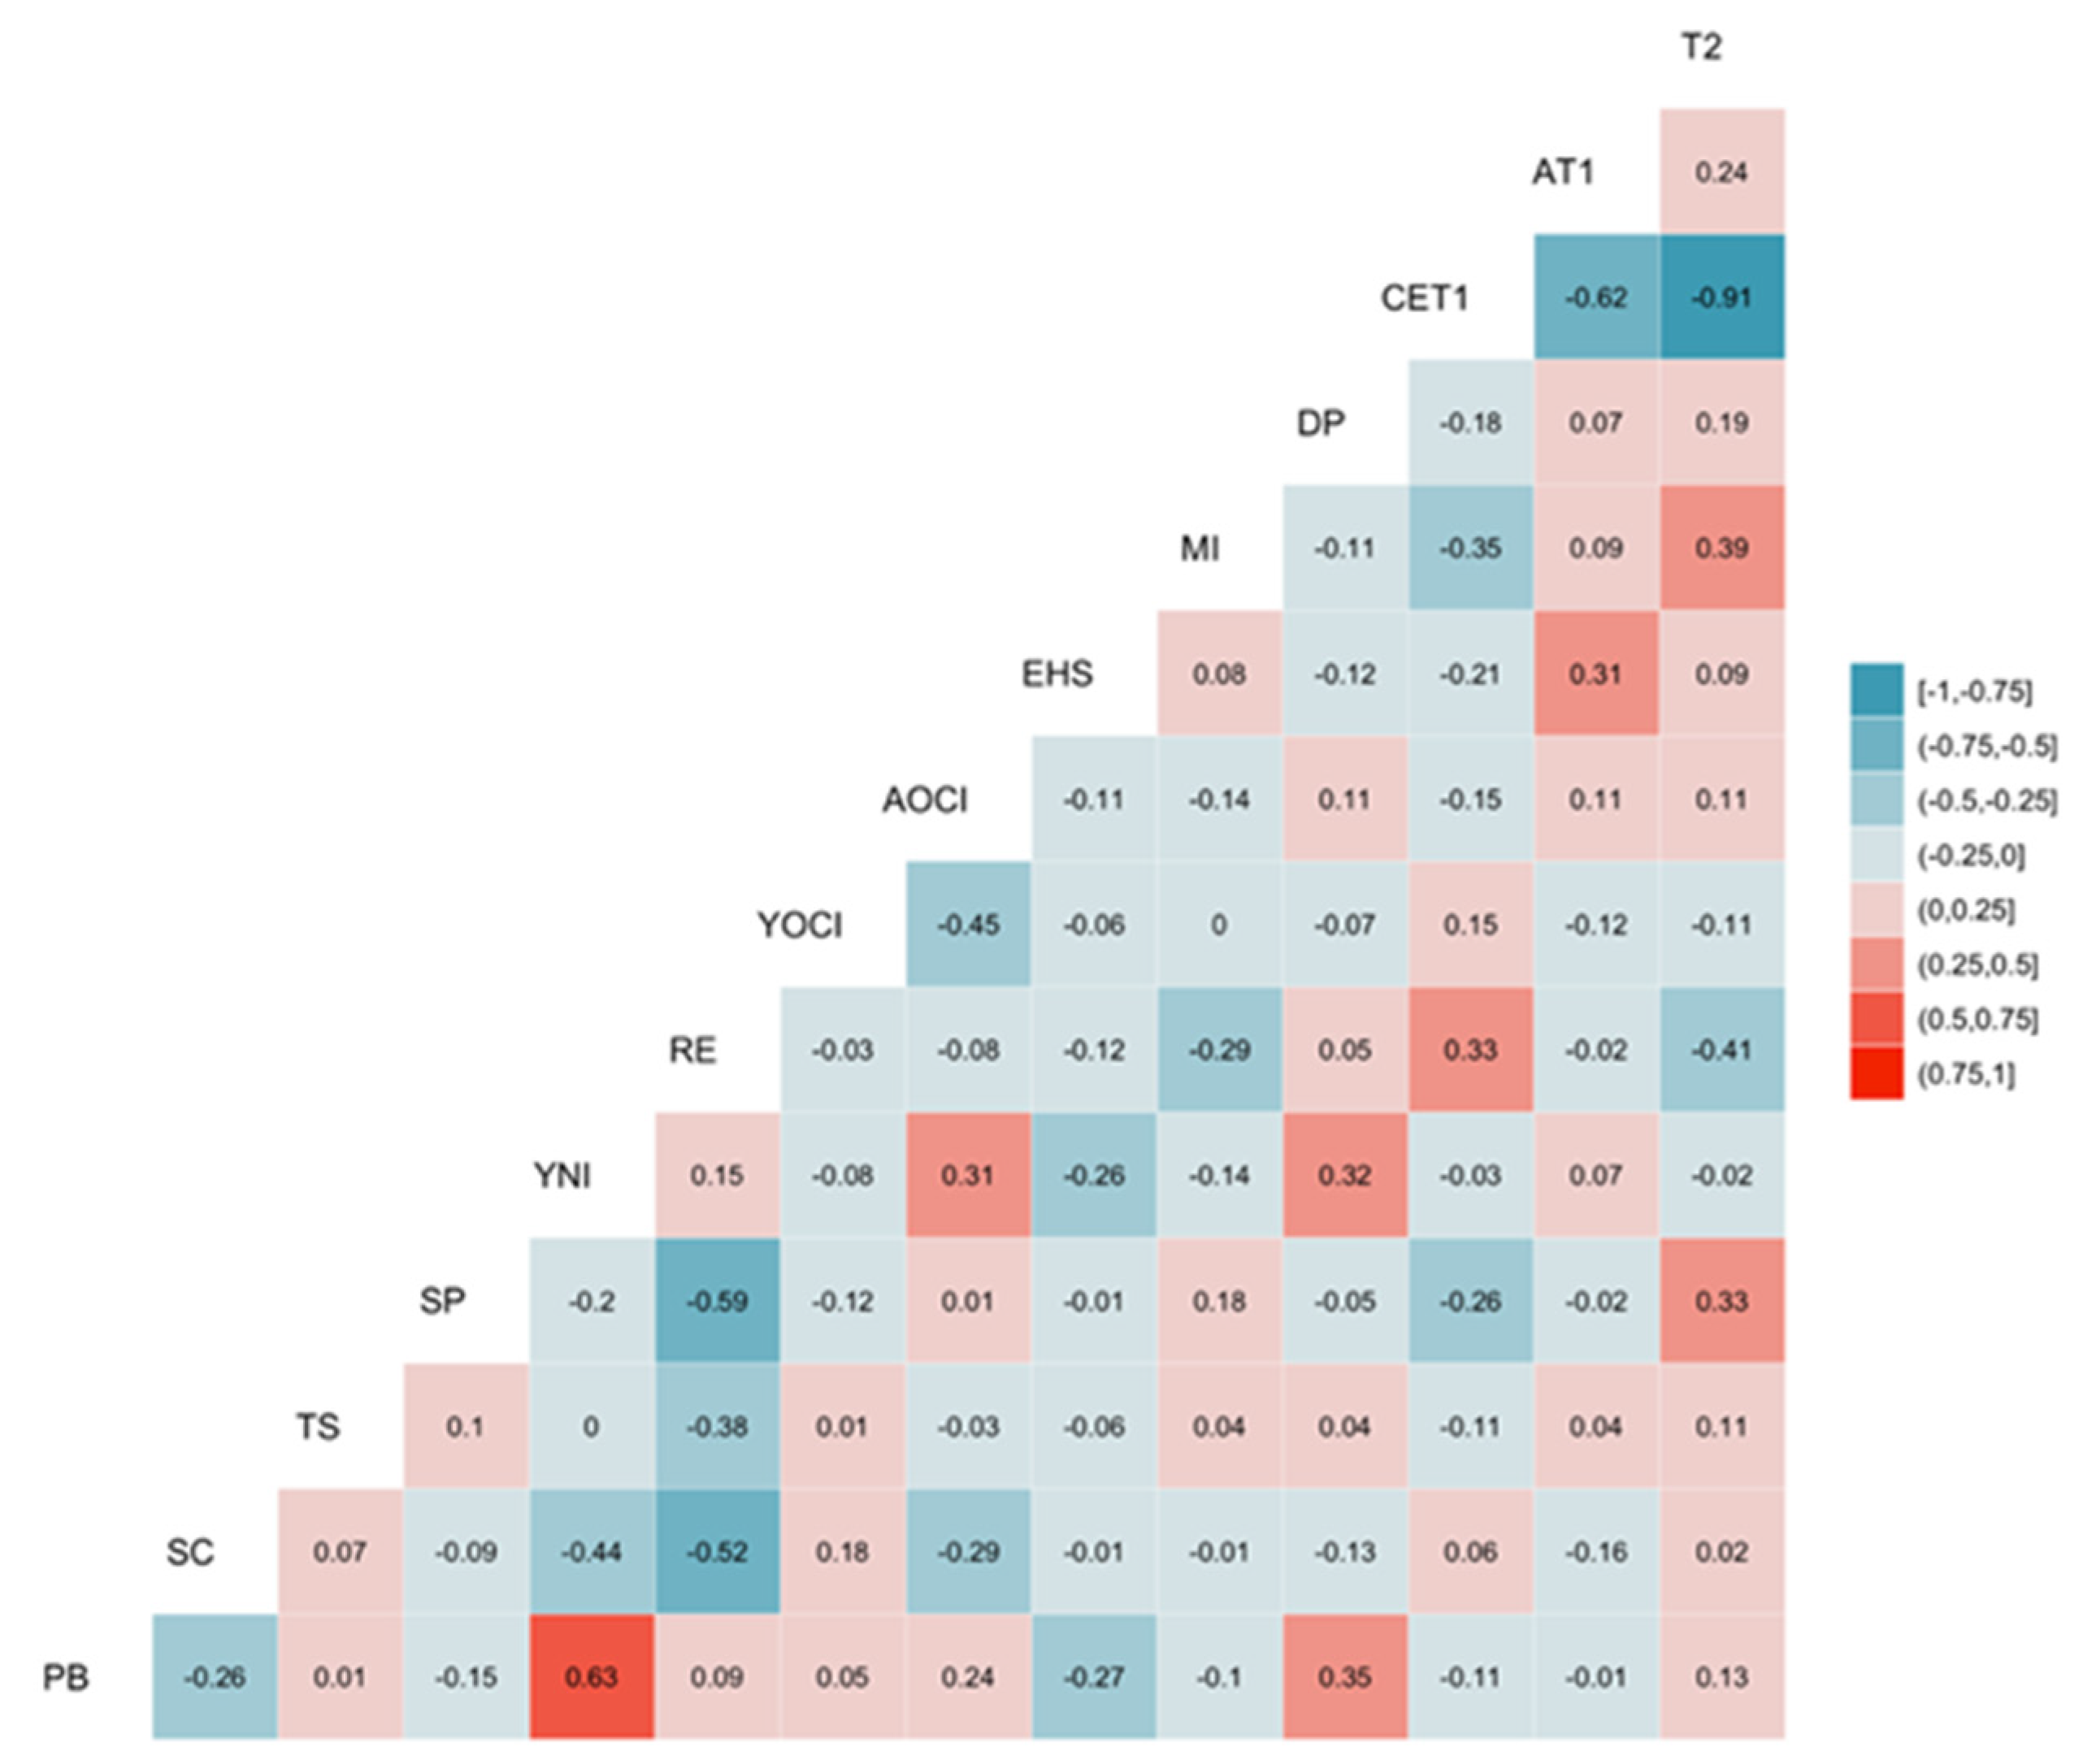
Figure 3.
Behavior of independent variables with respect to the dependent variable.
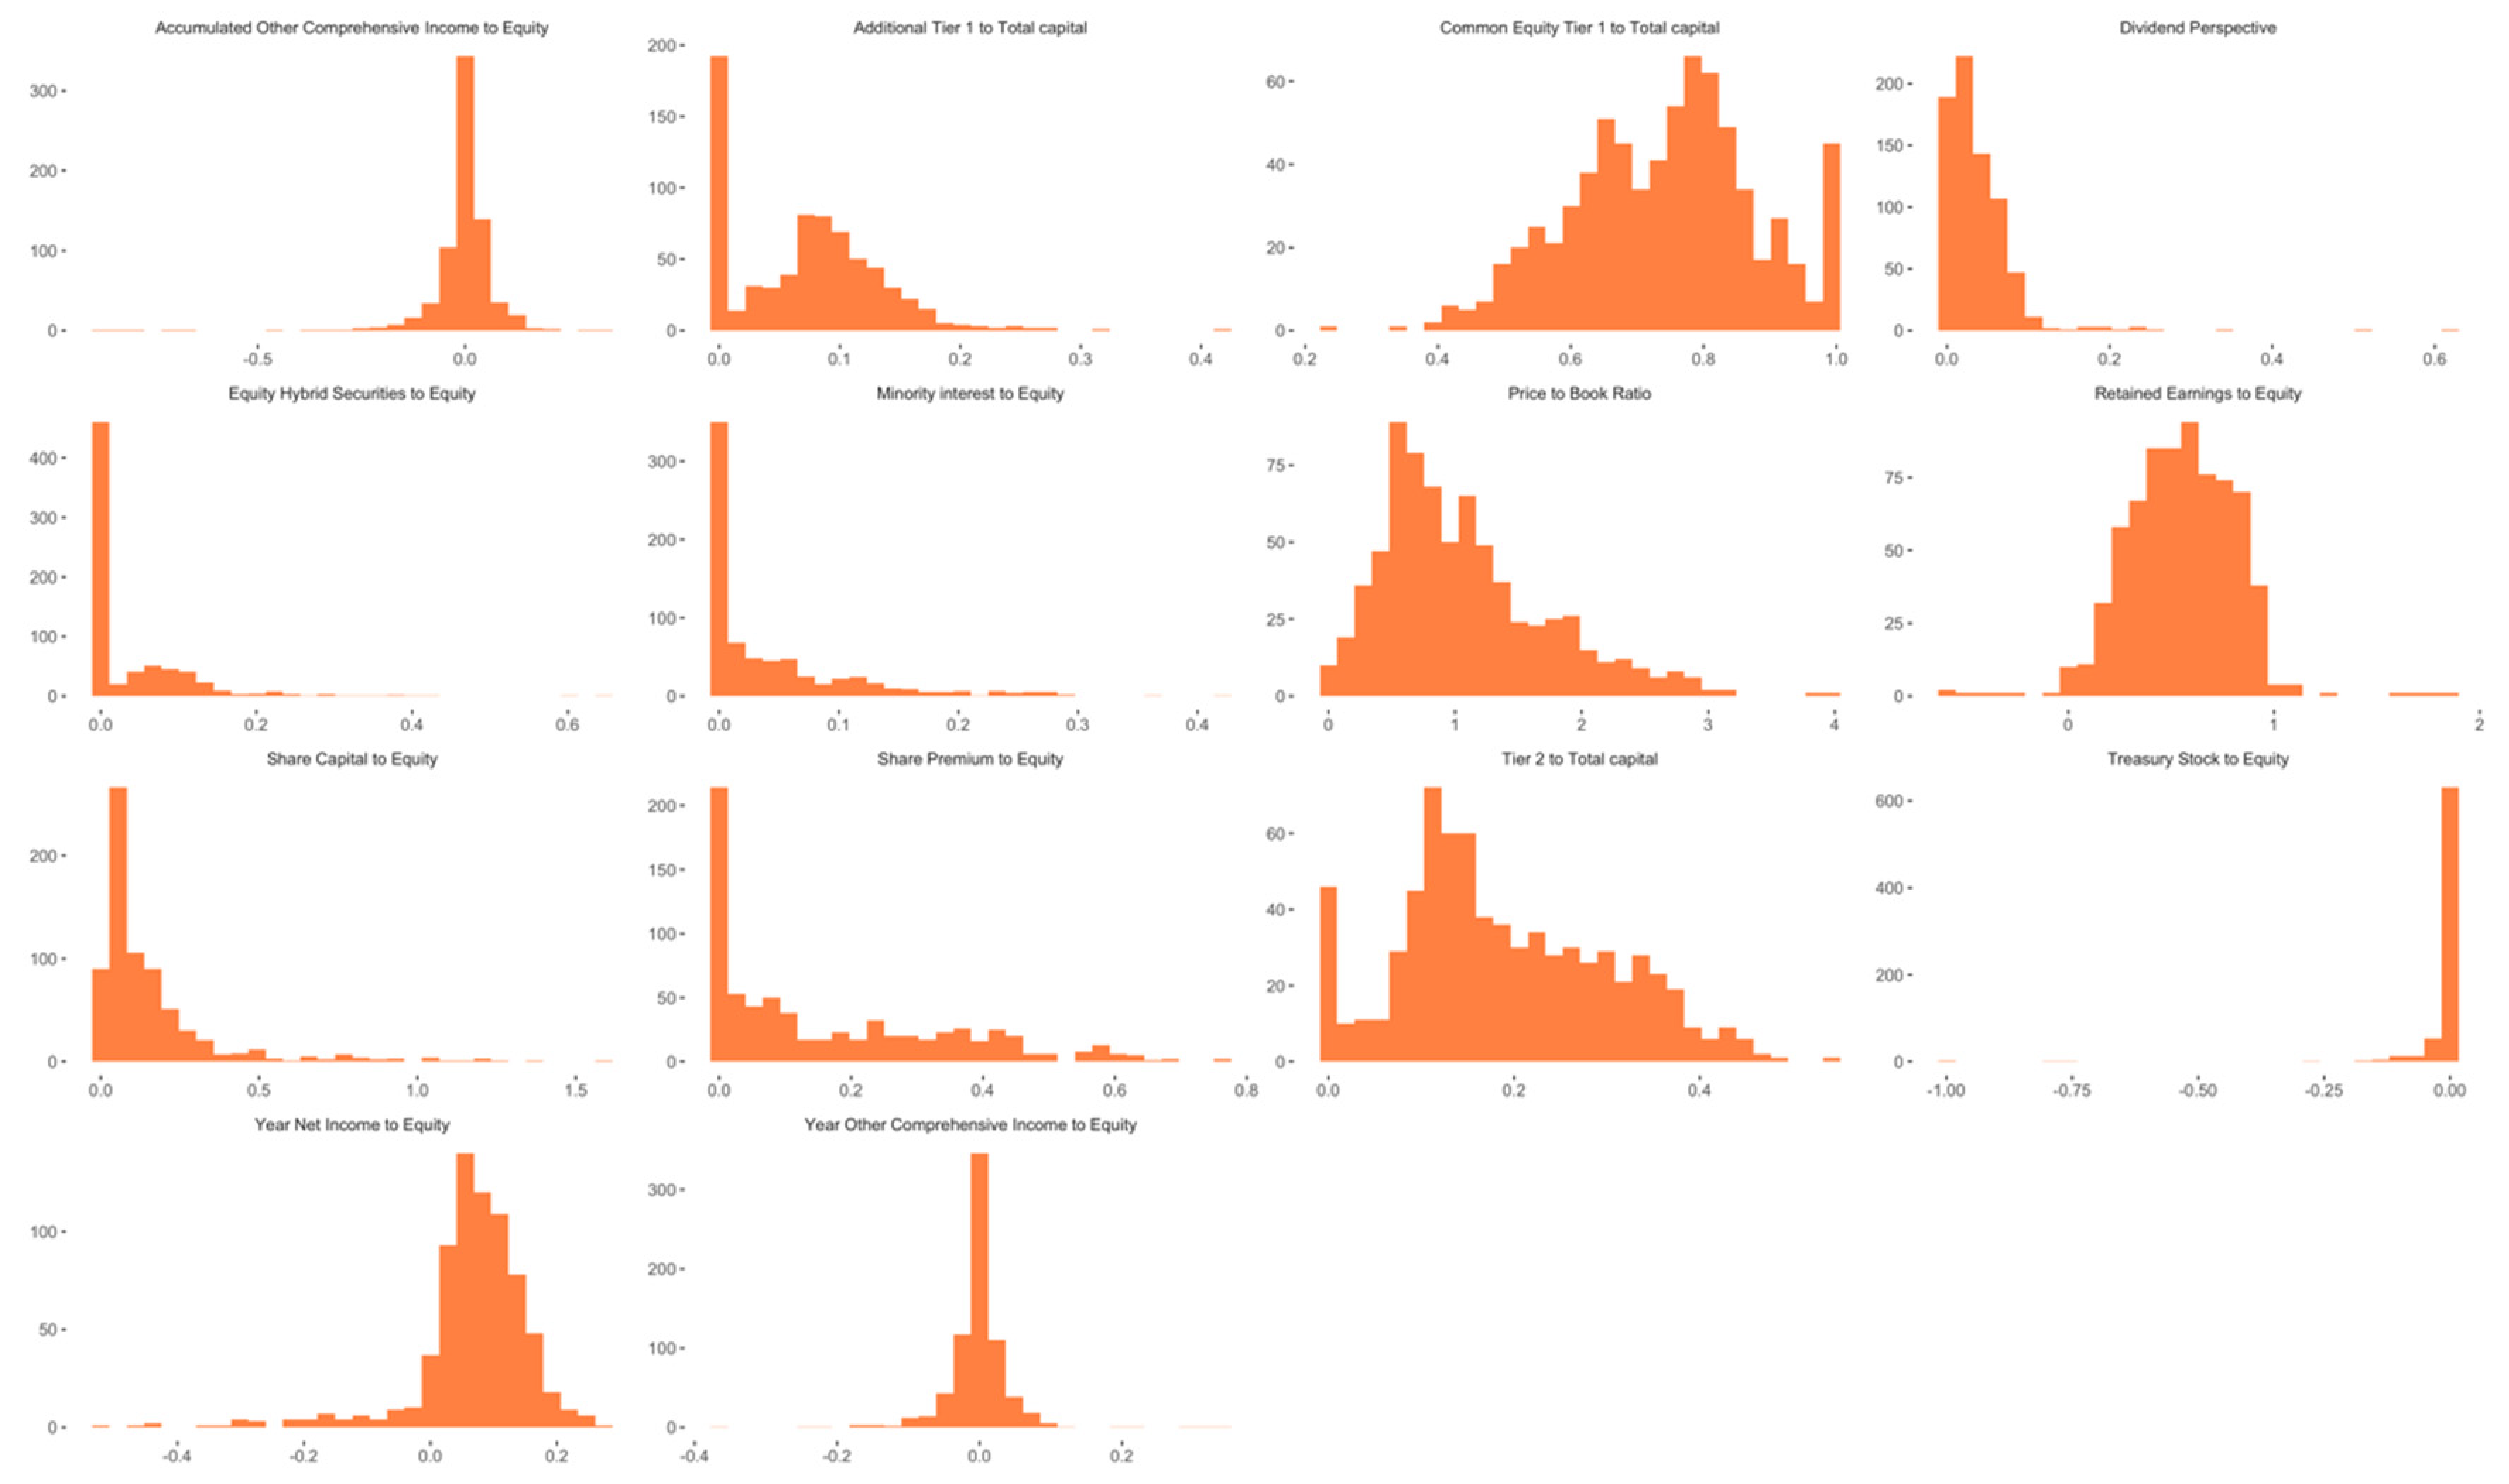
Figure 4.
Non-linear effect of the dividend.
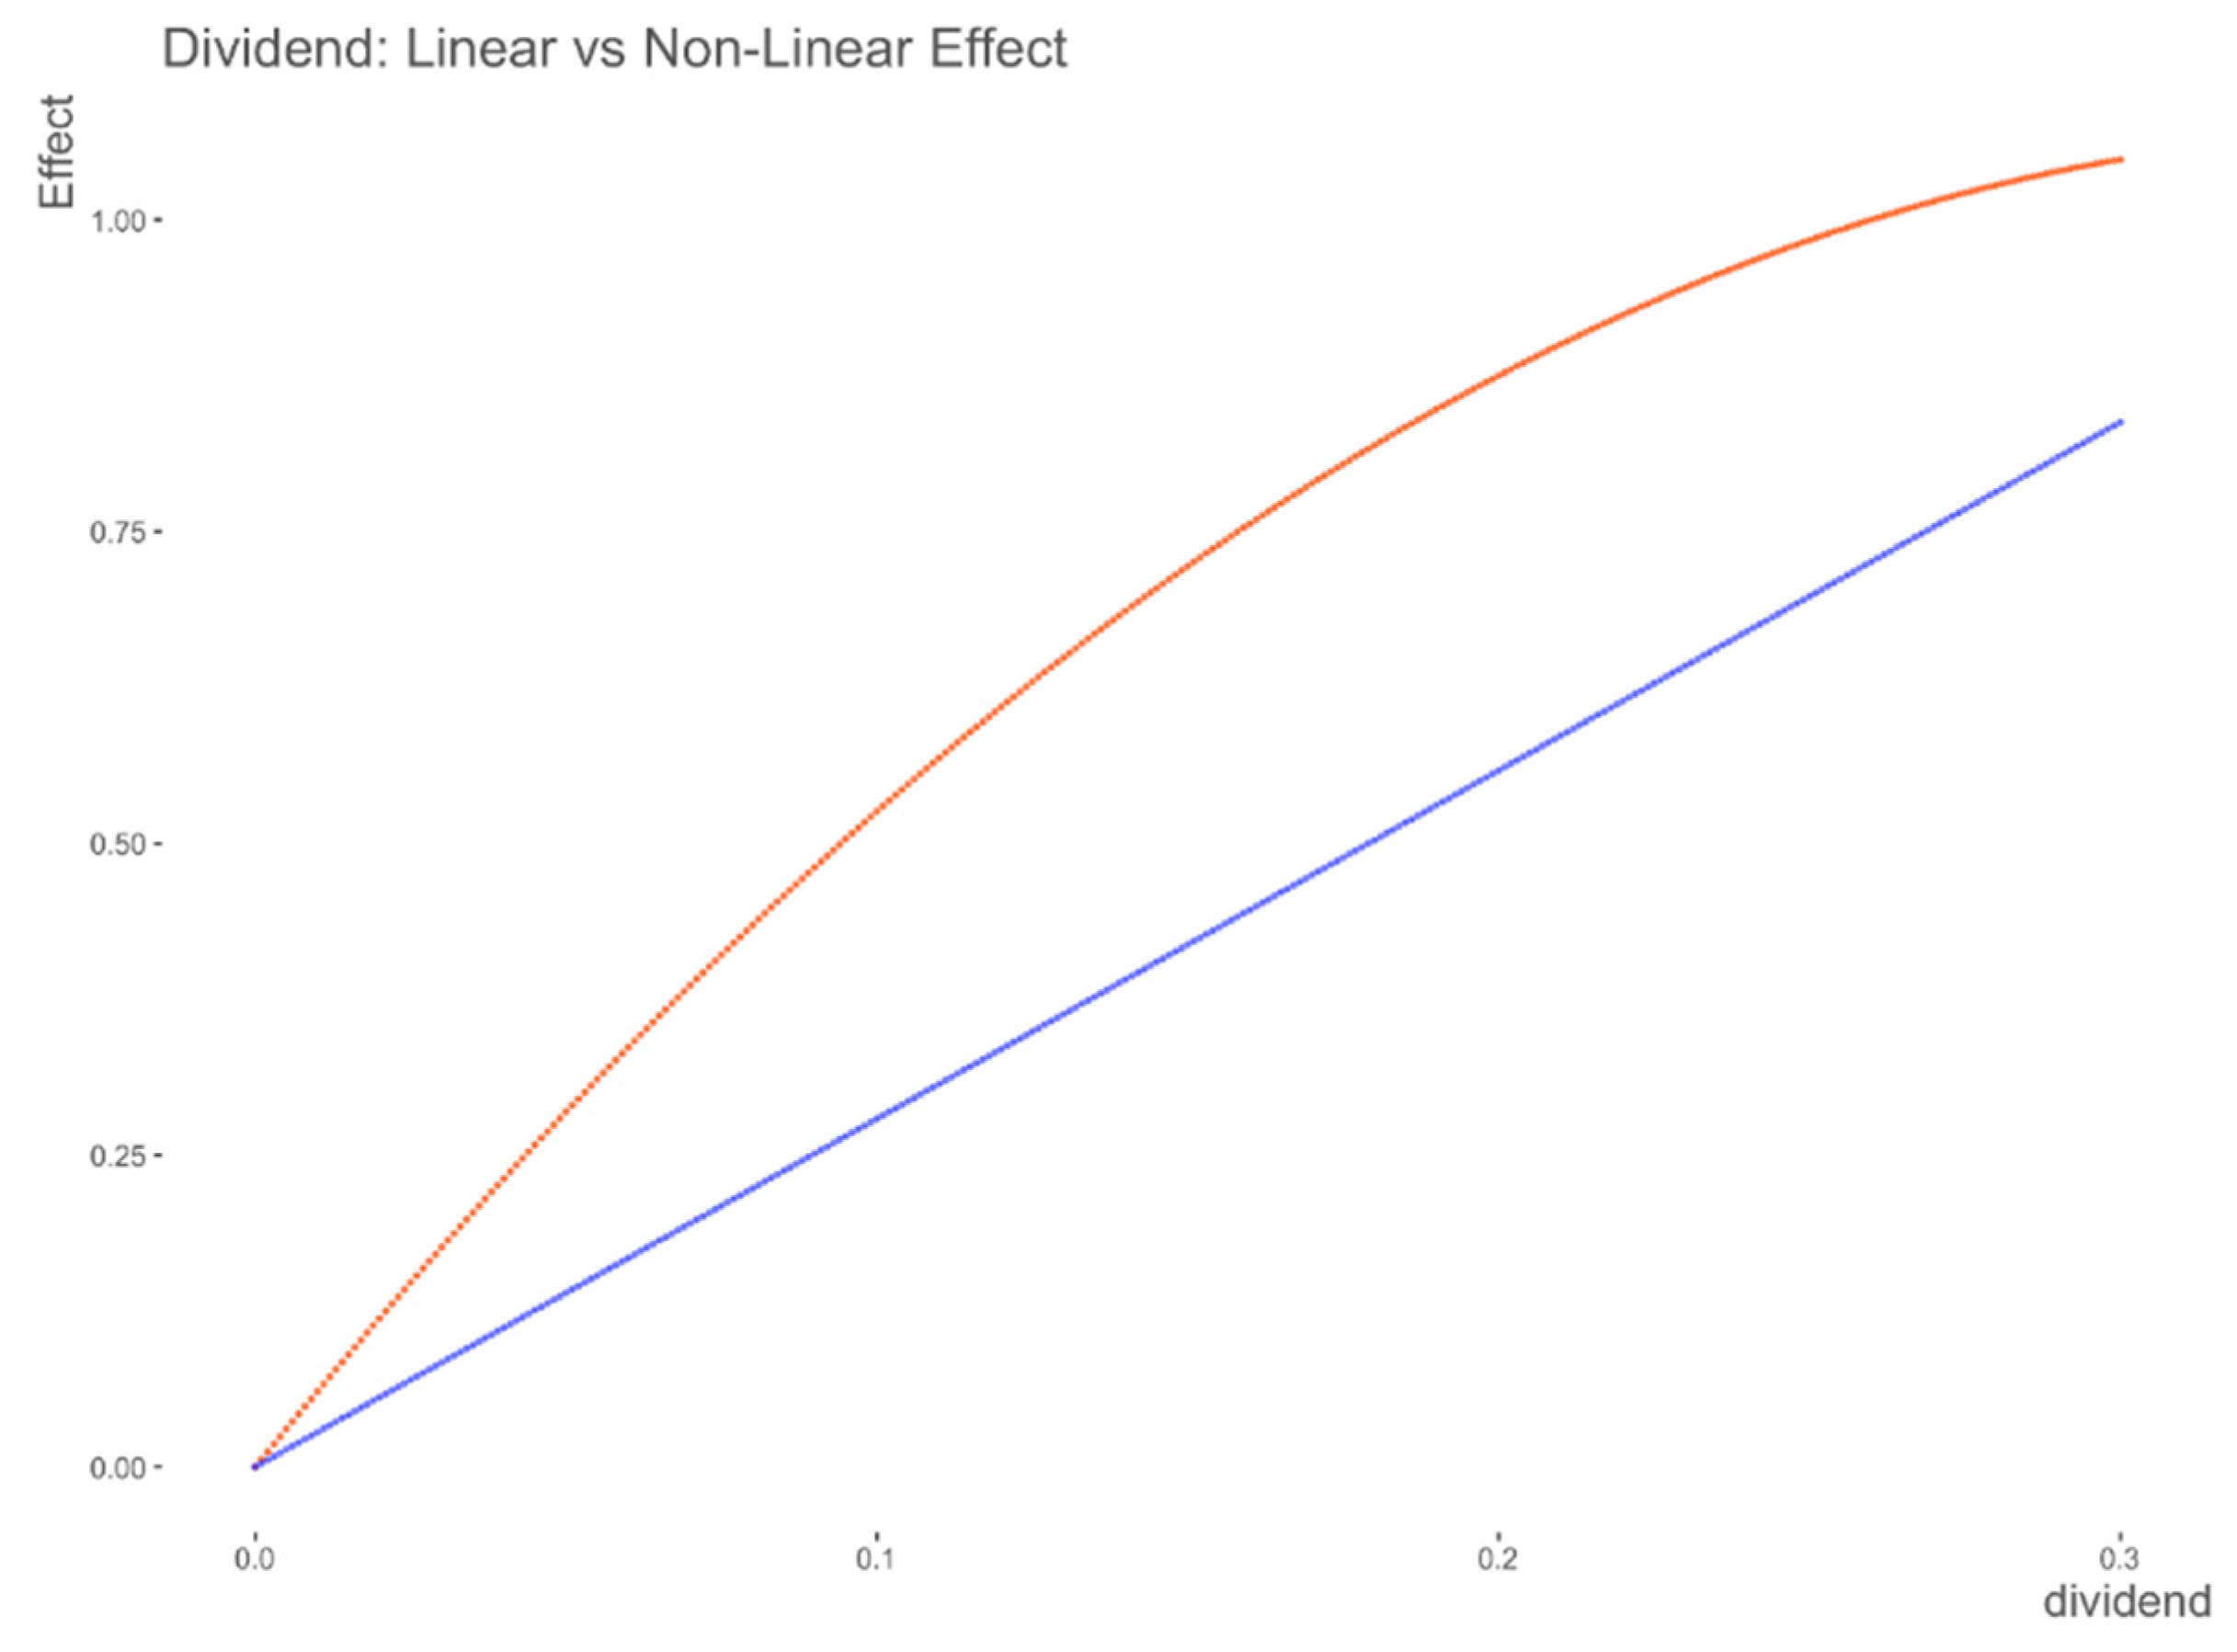

Table 1.
Descriptive statistics of the variables.
| Variable | Mean | StdDesv | Min | Q1 | Median | Q3 | Max |
|---|---|---|---|---|---|---|---|
| PB | 1.070 | 0.660 | 0.008 | 0.597 | 0.926 | 1.420 | 3.982 |
| SC | 0.160 | 0.208 | 0.003 | 0.050 | 0.085 | 0.180 | 1.593 |
| TS | -0.013 | 0.070 | -0.998 | -0.005 | -0.000 | 0.000 | 0.001 |
| SP | 0.167 | 0.180 | -0.006 | 0.000 | 0.092 | 0.298 | 0.757 |
| YNI | 0.068 | 0.093 | -0.531 | 0.038 | 0.074 | 0.119 | 0.265 |
| RE | 0.546 | 0.263 | -0.630 | 0.373 | 0.552 | 0.736 | 1.816 |
| YOCI | -0.002 | 0.045 | -0.356 | -0.015 | 0.000 | 0.011 | 0.351 |
| AOCI | -0.006 | 0.091 | -0.895 | -0.020 | 0.003 | 0.025 | 0.318 |
| EHS | 0.039 | 0.071 | 0.000 | 0.000 | 0.000 | 0.069 | 0.646 |
| MI | 0.042 | 0.064 | -0.001 | 0.000 | 0.009 | 0.059 | 0.420 |
| DP | 0.037 | 0.046 | 0.000 | 0.010 | 0.027 | 0.053 | 0.619 |
| CET1 | 0.740 | 0.139 | 0.242 | 0.644 | 0.753 | 0.831 | 1.000 |
| AT1 | 0.072 | 0.060 | 0.000 | 0.003 | 0.075 | 0.109 | 0.418 |
| T2 | 0.189 | 0.111 | 0.000 | 0.112 | 0.168 | 0.271 | 0.542 |
Table 2.
Variation of the price-to-book ratio over the years.
| Variable | Year | Mean | StdDesv | Min | Q1 | Median | Q3 | Max |
|---|---|---|---|---|---|---|---|---|
| PB | 2005 | 2.161 | 0.540 | 0.950 | 1.846 | 2.143 | 2.513 | 3.814 |
| PB | 2006 | 2.260 | 0.583 | 1.030 | 1.890 | 2.190 | 2.700 | 3.982 |
| PB | 2007 | 1.555 | 0.442 | 0.750 | 1.235 | 1.494 | 1.825 | 2.653 |
| PB | 2008 | 0.705 | 0.368 | 0.121 | 0.424 | 0.687 | 0.865 | 1.878 |
| PB | 2009 | 0.979 | 0.487 | 0.150 | 0.607 | 0.972 | 1.170 | 2.890 |
| PB | 2010 | 0.962 | 0.418 | 0.050 | 0.584 | 1.007 | 1.281 | 1.939 |
| PB | 2011 | 0.659 | 0.385 | 0.030 | 0.338 | 0.663 | 0.888 | 1.490 |
| PB | 2012 | 0.748 | 0.402 | 0.030 | 0.524 | 0.690 | 0.886 | 1.723 |
| PB | 2013 | 0.943 | 0.448 | 0.030 | 0.648 | 0.885 | 1.190 | 1.864 |
| PB | 2014 | 0.966 | 0.497 | 0.008 | 0.636 | 0.900 | 1.220 | 2.243 |
| PB | 2015 | 0.883 | 0.466 | 0.028 | 0.550 | 0.738 | 1.200 | 2.100 |
| PB | 2016 | 0.936 | 0.516 | 0.025 | 0.609 | 0.845 | 1.269 | 1.982 |
| PB | 2017 | 0.988 | 0.494 | 0.017 | 0.680 | 0.951 | 1.230 | 1.963 |
| PB | 2018 | 0.819 | 0.424 | 0.133 | 0.518 | 0.740 | 1.058 | 1.952 |
| PB | 2019 | 0.818 | 0.418 | 0.214 | 0.598 | 0.670 | 1.100 | 2.075 |
| PB | 2020 | 0.744 | 0.488 | 0.160 | 0.460 | 0.590 | 0.950 | 2.310 |
Table 3.
Price-to-book ratio by country.
| Variable | Country | Mean | StdDesv | Min | Q1 | Median | Q3 | Max |
|---|---|---|---|---|---|---|---|---|
| PB | Austria | 1.026 | 0.650 | 0.400 | 0.608 | 0.854 | 1.115 | 2.800 |
| PB | Belgium | 1.289 | 0.497 | 0.280 | 0.988 | 1.375 | 1.650 | 1.900 |
| PB | Denmark | 1.299 | 0.653 | 0.355 | 0.809 | 1.163 | 1.607 | 3.200 |
| PB | Finland | 1.282 | 0.435 | 0.714 | 0.965 | 1.210 | 1.410 | 2.345 |
| PB | France | 0.830 | 0.544 | 0.241 | 0.519 | 0.616 | 0.853 | 2.588 |
| PB | Germany | 0.614 | 0.447 | 0.076 | 0.290 | 0.503 | 0.776 | 1.717 |
| PB | Ireland | 0.576 | 0.804 | 0.030 | 0.050 | 0.165 | 0.657 | 2.420 |
| PB | Italy | 0.789 | 0.609 | 0.008 | 0.375 | 0.595 | 1.013 | 2.893 |
| PB | Norway | 1.137 | 0.415 | 0.429 | 0.880 | 1.082 | 1.243 | 2.537 |
| PB | Portugal | 0.823 | 0.848 | 0.025 | 0.291 | 0.517 | 0.859 | 2.726 |
| PB | Spain | 1.260 | 0.832 | 0.160 | 0.701 | 0.976 | 1.541 | 3.982 |
| PB | Sweeden | 1.510 | 0.555 | 0.224 | 1.288 | 1.523 | 1.723 | 2.869 |
| PB | Switzerland | 1.218 | 0.523 | 0.570 | 0.755 | 1.177 | 1.467 | 2.797 |
| PB | UK | 1.176 | 0.643 | 0.291 | 0.654 | 1.048 | 1.544 | 2.900 |
Table 4.
Model 1 Summary.
| Model 1 | Model 1 | |
|---|---|---|
| (Intercept) | 0.995*** (0.000) | 0.167 (0.501) |
| Country dummies | Yes | Yes |
| SC | 0.122 (0.710) | 0.352 (0.221) |
| TS | 0.583 (0.135) | 0.633* (0.059) |
| SP | 0.128 (0.713) | 0.423 (0.169) |
| YNI | 2.787*** (0.000) | 1.487*** (0.000) |
| RE | 0.265 (0.410) | 0.336 (0.234) |
| YOCI | 1.440*** (0.006) | 2.545*** (0.000) |
| AOCI | 1.032*** (0.009) | 0.826** (0.015) |
| EHS | -0.515 (0.185) | 0.081 (0.811) |
| quartile_TA2 | -0.261*** (0.000) | -0.124*** (0.009) |
| quartile_TA3 | -0.123** (0.029) | -0.067 (0.170) |
| quartile_TA4 | -0.330*** (0.000) | -0.172*** (0.003) |
| Lag(price_book) | 0.556*** (0.000) | |
| Num.Obs. | 720 | 675 |
| R2 | 0.465 | 0.702 |
| R2 Adj. | 0.447 | 0.690 |
| * p < 0.1, ** p < 0.05, *** p < 0.01 | ||
Table 5.
Results obtained with Model 2.
| Model 2 | Model 2 | |
|---|---|---|
| (Intercept) | 0.282 (0.257) | 0.179 (0.457) |
| Lag(price_book) | 0.413*** (0.000) | 0.421*** (0.000) |
| Country dummies | Yes | Yes |
| SC | -0.065 (0.853) | 0.221 (0.428) |
| TS | 0.811 (0.235) | 0.632* (0.050) |
| SP | 1.043** (0.011) | 1.034** (0.011) |
| YNI | 2.430*** (0.000) | 2.483*** (0.000) |
| RE | 0.139 (0.685) | 0.355 (0.191) |
| YOCI | 2.253*** (0.000) | 2.409*** (0.000) |
| AOCI | 0.976** (0.010) | 0.956*** (0.003) |
| EHS | -0.552 (0.230) | 0.009 (0.977) |
| quartile_TA2 | -0.137*** (0.003) | -0.139*** (0.002) |
| quartile_TA3 | -0.044 (0.354) | -0.051 (0.284) |
| quartile_TA4 | -0.151*** (0.007) | -0.153*** (0.006) |
| SC2 | 0.160 (0.374) | |
| TS2 | -0.024 (0.975) | |
| SP2 | -1.231*** (0.006) | -1.087** (0.015) |
| YNI2 | 6.109*** (0.000) | 5.992*** (0.000) |
| RE2 | 0.168 (0.321) | |
| YOCI2 | -1.367 (0.549) | |
| AOCI2 | 0.378 (0.535) | |
| EHS2 | 1.509 (0.101) | |
| Num.Obs. | 675 | 675 |
| R2 | 0.733 | 0.731 |
| R2 Adj. | 0.719 | 0.719 |
| * p < 0.1, ** p < 0.05, *** p < 0.01 | ||
Table 6.
Model 3 Results.
| Model 3 | Model 3 | Model 3 | Model 3 | |
| (Intercept) | -0.111 (0.722) | 0.828** (0.013) | -0.336 (0.386) | 1.089* (0.082) |
| Country dummies | Yes | Yes | Yes | Yes |
| CET1 | 1.299*** (0.000) | 0.446 (0.167) | 0.954** (0.010) | -2.870* (0.100) |
| T2 | 0.948** (0.014) | 0.568 (0.151) | 1.771*** (0.000) | 0.444 (0.680) |
| DP | 2.106*** (0.000) | 2.792*** (0.000) | 6.137*** (0.000) | |
| quartile_TA2 | -0.330*** (0.000) | -0.444*** (0.000) | -0.387*** (0.000) | |
| quartile_TA3 | -0.242*** (0.000) | -0.381*** (0.000) | -0.326*** (0.000) | |
| quartile_TA4 | -0.441*** (0.000) | -0.616*** (0.000) | -0.557*** (0.000) | |
| Lag(price_book) | 0.488*** (0.000) | 0.469*** (0.000) | ||
| CET12 | 2.705** (0.030) | |||
| T22 | 2.520 (0.220) | |||
| DP2 | -8.808*** (0.000) | |||
| Num.Obs. | 720 | 704 | 672 | 672 |
| R2 | 0.308 | 0.363 | 0.557 | 0.587 |
| R2 Adj. | 0.293 | 0.346 | 0.543 | 0.573 |
* p < 0.1, ** p < 0.05, *** p < 0.01.
Disclaimer/Publisher’s Note: The statements, opinions and data contained in all publications are solely those of the individual author(s) and contributor(s) and not of MDPI and/or the editor(s). MDPI and/or the editor(s) disclaim responsibility for any injury to people or property resulting from any ideas, methods, instructions or products referred to in the content. |
© 2024 by the authors. Licensee MDPI, Basel, Switzerland. This article is an open access article distributed under the terms and conditions of the Creative Commons Attribution (CC BY) license (http://creativecommons.org/licenses/by/4.0/).
Copyright: This open access article is published under a Creative Commons CC BY 4.0 license, which permit the free download, distribution, and reuse, provided that the author and preprint are cited in any reuse.


