Preprint
Article

Distribution of Natural Trace Elements in Drinking Water Sources of Hungary

Altmetrics

Downloads

97

Views

48

Comments

0

A peer-reviewed article of this preprint also exists.

Submitted:

27 June 2024

Posted:

02 July 2024

You are already at the latest version

Alerts
Abstract
Source water quality is a key determinant of drinking water quality. The recast European Union 2020/2184 drinking water directive (DWD) introduced the obligation for comprehensive risk assessment in drinking water supplies, including the water source and incorporated new elements of natural origin in the list of parameters to be monitored. The current study is the first comprehensive assessment of 15 natural elements (B, Ba, Be, Ca, Co, K, Li, Mg, Mo, Na, Se, Sr, Ti, U and V) in 1155 (82%) Hungarian drinking water sources, including surface water, bank filtered and groundwater sources. Parameters posing a risk to health (Se, V and U) were typically below the lower limit of quantification (LOQ), but higher concentrations (max. 7.0, 17 and 41 µg/L, respectively) may occur in confined locations, the latter exceeding the DWD parametric value in one water supply. Li in a small geographical area, Mg and Ca in the majority of the water supplies reached the concentration range assumed to be protective to health. Water sources were grouped in 6 clusters based on their element distribution, some of them also showing clear geographical patterns. Water types were not differentiated, with the exception of karstic waters (dominated by Ca and Mg). None of the investigated parameters are expected to be a source of public health concern.
Keywords: 
Subject: Environmental and Earth Sciences  -   Environmental Science

1. Introduction

Risk based approach to drinking water safety is taken up world-wide to complement endpoint monitoring (World Health Organization 2022). Monitoring at the tap is still seen as an indispensable element of drinking water control but shifts from being the primary means of safeguarding drinking water quality towards becoming a tool for validating water safety plans (or similar frameworks). The recent recast of the European Union (EU) 2020/2184 Drinking Water Directive (DWD) introduced for the first time the obligation of risk assessment for the entire water supply chain [1]. As drinking water quality is strongly influenced by the water source, better understanding of source water quality and the associated hazards is a cornerstone of the risk-based approach [2]. Hazard assessment of the catchments of drinking water abstraction points is also a requirement under the DWD [1].
Drinking water quality regulations addressing parameters derived from the source water usually focus on potential anthropogenic pollutants and a few geological compounds of known health impact, such as arsenic. Monitoring requirements under the former EU regulation in the European Union followed the same approach, focusing mainly on heavy metals associated primarily with human pollution (e.g. mercury, lead, cadmium, chromium, nickel) [3]. The number of geogenic pollutants for which substantial monitoring data is available in the EU is limited, comprising generally of arsenic, selenium, boron, and fluoride, though national legislations may include additional parameters. The recast DWD extended monitoring requirements (starting from 2026) to new components, including metals of health relevance. Uranium was added with a parametric value of 30 µg/L following the recommendation of the World Health Organisation (WHO) [4]. Calcium, potassium and magnesium were also included in the list of parameters to be monitored, but only for consumer information, and no parametric values have been assigned [1].
The newly introduced natural elements have a confirmed or presumptive impact on human health. Uranium is a nephrotoxic pollutant of primarily geological origin [4,5]. Its concentration in natural waters is usually low (<1.0 µg/L), but depending on the geological framework (e.g. granite rich in uranium) and the mobilizing capacity of groundwater flow systems high concentrations can also occur in certain areas (up to 57 µg/L in Mongolia, 85 µg/L in Italy, 288 µg/L in China and 750 µg/L in Norway) [6,7,8,9,10].
Potassium, calcium and magnesium are essential elements. Potassium concentrations also vary widely in natural waters, but the concentrations present in drinking water are generally not a risk to human health and may be of significance only for sensitive individuals (e.g. those suffering from renal failure) [4].
The inverse association between magnesium and calcium in drinking water and cardiovascular mortality is well established. The protective effect is clearer for magnesium, while further studies are needed for calcium [11,12,13,14]. Low magnesium and calcium intake via drinking water have also been associated with high blood pressure, metabolic syndrome, preeclampsia and amyotrophic sclerosis [15]. For these elements, prior data is scarce, though many jurisdictions, including the Hungarian, require monitoring of total hardness, which primarily consists of magnesium and calcium salts.
Vanadium is not regulated by the DWD, but some EU Member States include it in national legislation, e.g. Italy, with a parametric value of 140 µg/L [10]. The health effects of vanadium are unclear, but therapeutic and toxic effects on human health are possible (e.g. bone, cardiovascular, neurological, immune system, and body weight effects) [16,17]. Its concentration varies in a wide range in surface waters (0.010 µg/L to 68 µg/L), reaching even higher levels in groundwaters, especially in volcanic areas (up to 350 µg/l) [10,18].
Lithium is also an unregulated element of health relevance. The concentration of lithium in drinking water in European countries ranged from <1 µg/L to 20–60 µg/L in northern England, Lithuania and Italy [19,20,21], over 100 µg/L in Greece [22], and more than 1000 µg/L in Austria [23]. Several studies have found a protective association between lithium in drinking water and suicide mortality [20,23,24,25,26,27].
Molybdenum and selenium are essential elements. The concentration of Mo in drinking water is typically low (<10 µg/L), although near mining areas, this value can be much higher (>200 µg/L). The recommended health-based guideline value of WHO is 70 µg/L. The optimal range of Se intake is narrow. Selenium deficiency has been associated with cardiomyopathy and joint disease, while symptoms of selenosis include brittle hair and hair loss, nail malformation and diarrhea [28]. The parametric value of Se has been increased from 10 to 20 µg/L during the recast, based on recent scientific evidence [1,29]. WHO guideline value is 40 µg/L. Environmental concentrations are generally well below 10 µg/L, except in a few seleniferous areas.
The health impact of barium is unclear. There is no evidence of its carcinogenic and mutagenic properties, but there are contradictory results for cardiovascular toxicity (hypertension) and it has been shown to cause nephropathy in animal studies. The WHO recommends a guideline value of 1300 µg/L in drinking water [4,17].
In Hungary, the primary source of drinking water is groundwater (93% of total production volume), including 31% bank filtered water and a smaller proportion of karst water (12%). Surface water accounts for only 7% of the water supply [30]. There are 1403 public utility water supply systems registered in the National Drinking Water Database, operated by 38 water suppliers. Of these systems, 36 supplies use mainly bank filtration, 116 karst water and 1201 other groundwater sources, while 22 rely on surface water abstraction.
Drinking water quality is regularly monitored by the water suppliers and the local public health authorities. Monitoring does not cover elements of natural origin beyond the EU DWD requirements, although total hardness – comprising primarily of calcium and magnesium – is regulated as an indicator parameter (acceptable range: 50–350 mg/L CaO equivalent). Drinking water in Hungary is typically moderately hard (between 100 and 200 mg CaO/L) or hard (>200 mg CaO/L), with total hardness ranging from <1.0 to 393 mg CaO/L [30]. For other unregulated elements, only local studies are available. Previous targeted investigations detected uranium in concentrations up to 25 µg/L in some drinking water sources in Hungary, though not exceeding the new parametric value [31,32,33,34].
The aim of the present study was to carry out a nationwide survey mapping the presence and distribution of (previously) unregulated elements of natural origin in Hungarian drinking water sources. We aimed to identify if the observed distribution of the elements was associated with the water source type or the geographical location of the water supply, reflecting differences in (hydro)geological factors. It was evaluated whether any of these elements poses a potential hazard for drinking water production and requires further attention in risk assessment (water safety plans) on a national or local scale. The survey outcomes also provide representative data for epidemiological studies assessing potential health risks or gains associated with these compounds in drinking water.

2. Materials and Methods

2.1. Study Design

The survey was initiated by the National Center for Public and Pharmacy (NCPHP) as the national regulatory authority. All public utility drinking water suppliers were invited to participate. Participation was voluntary. Water suppliers responding positively received sample containers, instructions for sampling, and a data sheet to be completed during sampling. The sampling data sheet recorded the date and exact location of sampling, the type of raw water (surface, deep groundwater (second or deeper aquifer or depth >50 m), shallow groundwater (from the first aquifer or depth <50 m), karst, bank filtered, other/mixed) and information on water treatment and disinfection.

2.2. Sampling

Water samples were collected between March 2018 and June 2022 by the drinking water supply operators. At least one source water sample was taken for each water supply. Water suppliers were instructed to take a sample representative of the source water composition before water treatment. From water supplies with multiple abstraction points, either a representative subset of the wells or mixed well water representing normal operation were sampled. Samples from water supplies using surface water abstraction were collected after abstraction and mechanical filtration. Samples from water supplies using bank filtration were taken from selected bank filtration wells or their mixed water. Most water supplies were sampled twice in the sampling period. Samples were collected in 50 ml PP centrifuge tubes, and the pH of the samples was reduced below 2 with high-purity nitric acid for preservation (ISO 5667-11:2009). Samples were transported to the laboratory of the NCPHP and stored at room temperature until analysis within 30 days.

2.3. Chemical Analysis

The analytical tests were performed at the NCPHP’s laboratory. Elements were analyzed by ICP-MS ((iCAP RQ, Thermo Fisher Scientific, Germany) (ISO 17294-2:2016). The concentrations of the following elements were measured: boron (B), barium (Ba), beryllium (Be), calcium (Ca), cobalt (Co), potassium (K), lithium (Li), magnesium (Mg), molybdenum (Mo), sodium (Na), selenium (Se), strontium (Sr), titanium (Ti), uranium (U) and vanadium (V).

2.4. Statistical and Geospatial Methods

Statistical evaluation of the results was carried out using the Statistica program (TIBCO Software Inc. (2020). Data Science Workbench, version 14. http://tibco.com.). Values under the lower limit of quantification (LOQ) were replaced by LOQ/√2 in the statistical calculations [35].
Hierarchical cluster analysis (HCA) was used to group the samples based on their similar characteristics [36]. In HCA, each sampling point is initially a separate cluster, and then in iterative steps, the two closest clusters are merged into a single cluster. The number of clusters is thus reduced in each step, eventually leaving a single cluster. Ward’s method and quadratic Euclidean distance were used for merging the clusters. Discriminant analysis (DA) was used to test the appropriateness of the clusters formed by HCA.
Principal component analysis (PCA) was used to reveal the basic characteristics and hidden relationships of the large amount of data and for data reduction [37].
For multivariate statistical analyses (both PCA and HCA), the results were standardised by z-score transformation to reduce the bias resulting from the often orders of magnitude differences in the concentration of the elements.
Elemental concentrations of the different clusters were compared using the non-parametric Kruskal-Wallis H-test (p-value: 0.05), and the correlation between elements was tested using Pearson's correlation test (p-value: 0.05).
Maps were created using ArcGIS Desktop 10.8. program (Ersi Inc., version 10.8.0.12790, https://www.esri.com/en-us/home).

3. Results

3.1. Prevalence and Distribution of Natural Elements

Eighty-seven percent of public utility drinking water suppliers (33 of 38) participated in the survey. Altogether, 1256 samples were collected from 1155 water supply systems, representing 82% of Hungarian drinking water supplies (Figure 1). Of the samples, 84% were deep groundwater, 8.8% karst water, 2.5% bank filtered water, 2.3% shallow groundwater, 1.4% surface water, and <1% mixed water.
The results of the elemental analysis are summarized in Table 1. The concentration of Be did not exceed LOQ in any of the samples, and Co concentrations were above LOQ only in 1% (13 samples). Therefore, these two elements were not included in further analyses. Se and V were rarely present in Hungarian drinking water sources, with more than 85% of samples below the LOQ. Median concentrations of U and Mo were below LOQ for both elements, and even the upper quartile values were only 126 and 164% of LOQ, respectively. The concentration of U exceeded the EU parametric value of 30 µg/L in a single sample with a maximum concentration of 41 µg/L. Ti, B, Li and Ba were detected in the majority of the samples with concentrations ranging over several orders of magnitude from below LOQ to 83, 2570, 265, and 551 µg/L, respectively). K and Na were present in almost all samples (21 and 1 <LOQ samples, max 32 and 252 mg/L, respectively), and Mg, Ca and Sr were above LOQ in every measurement (min-max Mg: 0.55-100 mg/L; Ca: 2.5-174 mg/L; Sr: 21-3310 µg/L). A moderately strong positive correlation (r=0.402-0.556) was observed between Li and K; B and Na; Mg and Ca; Mg and Sr; Se and U; and a moderately strong negative correlation (r=–0.579) between Na and Ca (Table 2).

3.2. Water Supply System Clusters by Water Composition

Based on the HCA, 6 clusters were identified, also confirmed by DA (Wilks' lambda: 0.00363). The dendrogram is shown in Figure S1 in the Electronic Supplementary Material (ESM). Clusters 3 and 4 were the largest, together comprising two-thirds of the water resources (488 and 343 water resources, respectively). Cluster 2 and 5 accounted for 12 and 16% (151 and 200 water resources), respectively. Cluster 1 and 5 were small, with 31 and 43 water sources (2.5 and 3.4%, respectively). In Clusters 1, 2, 4 and 5, 85-99% of the samples are from deep groundwater aquifers (Table 3). Cluster 3 was the most heterogeneous, with deep groundwater comprising 68%, karst water 21%, shallow groundwater and bank filtration 4-4%. This means that cluster 3 includes the vast majority of all karst, shallow groundwater, bank filtered and surface water samples (91, 69, 63 and 67%, respectively). In Cluster 6, deep groundwater samples accounted for 63% of the samples, with shallow groundwater, surface and bank filtered samples comprising 14%, 12% and 9.3%, respectively. All surface water samples in cluster 6 are from Lake Balaton.
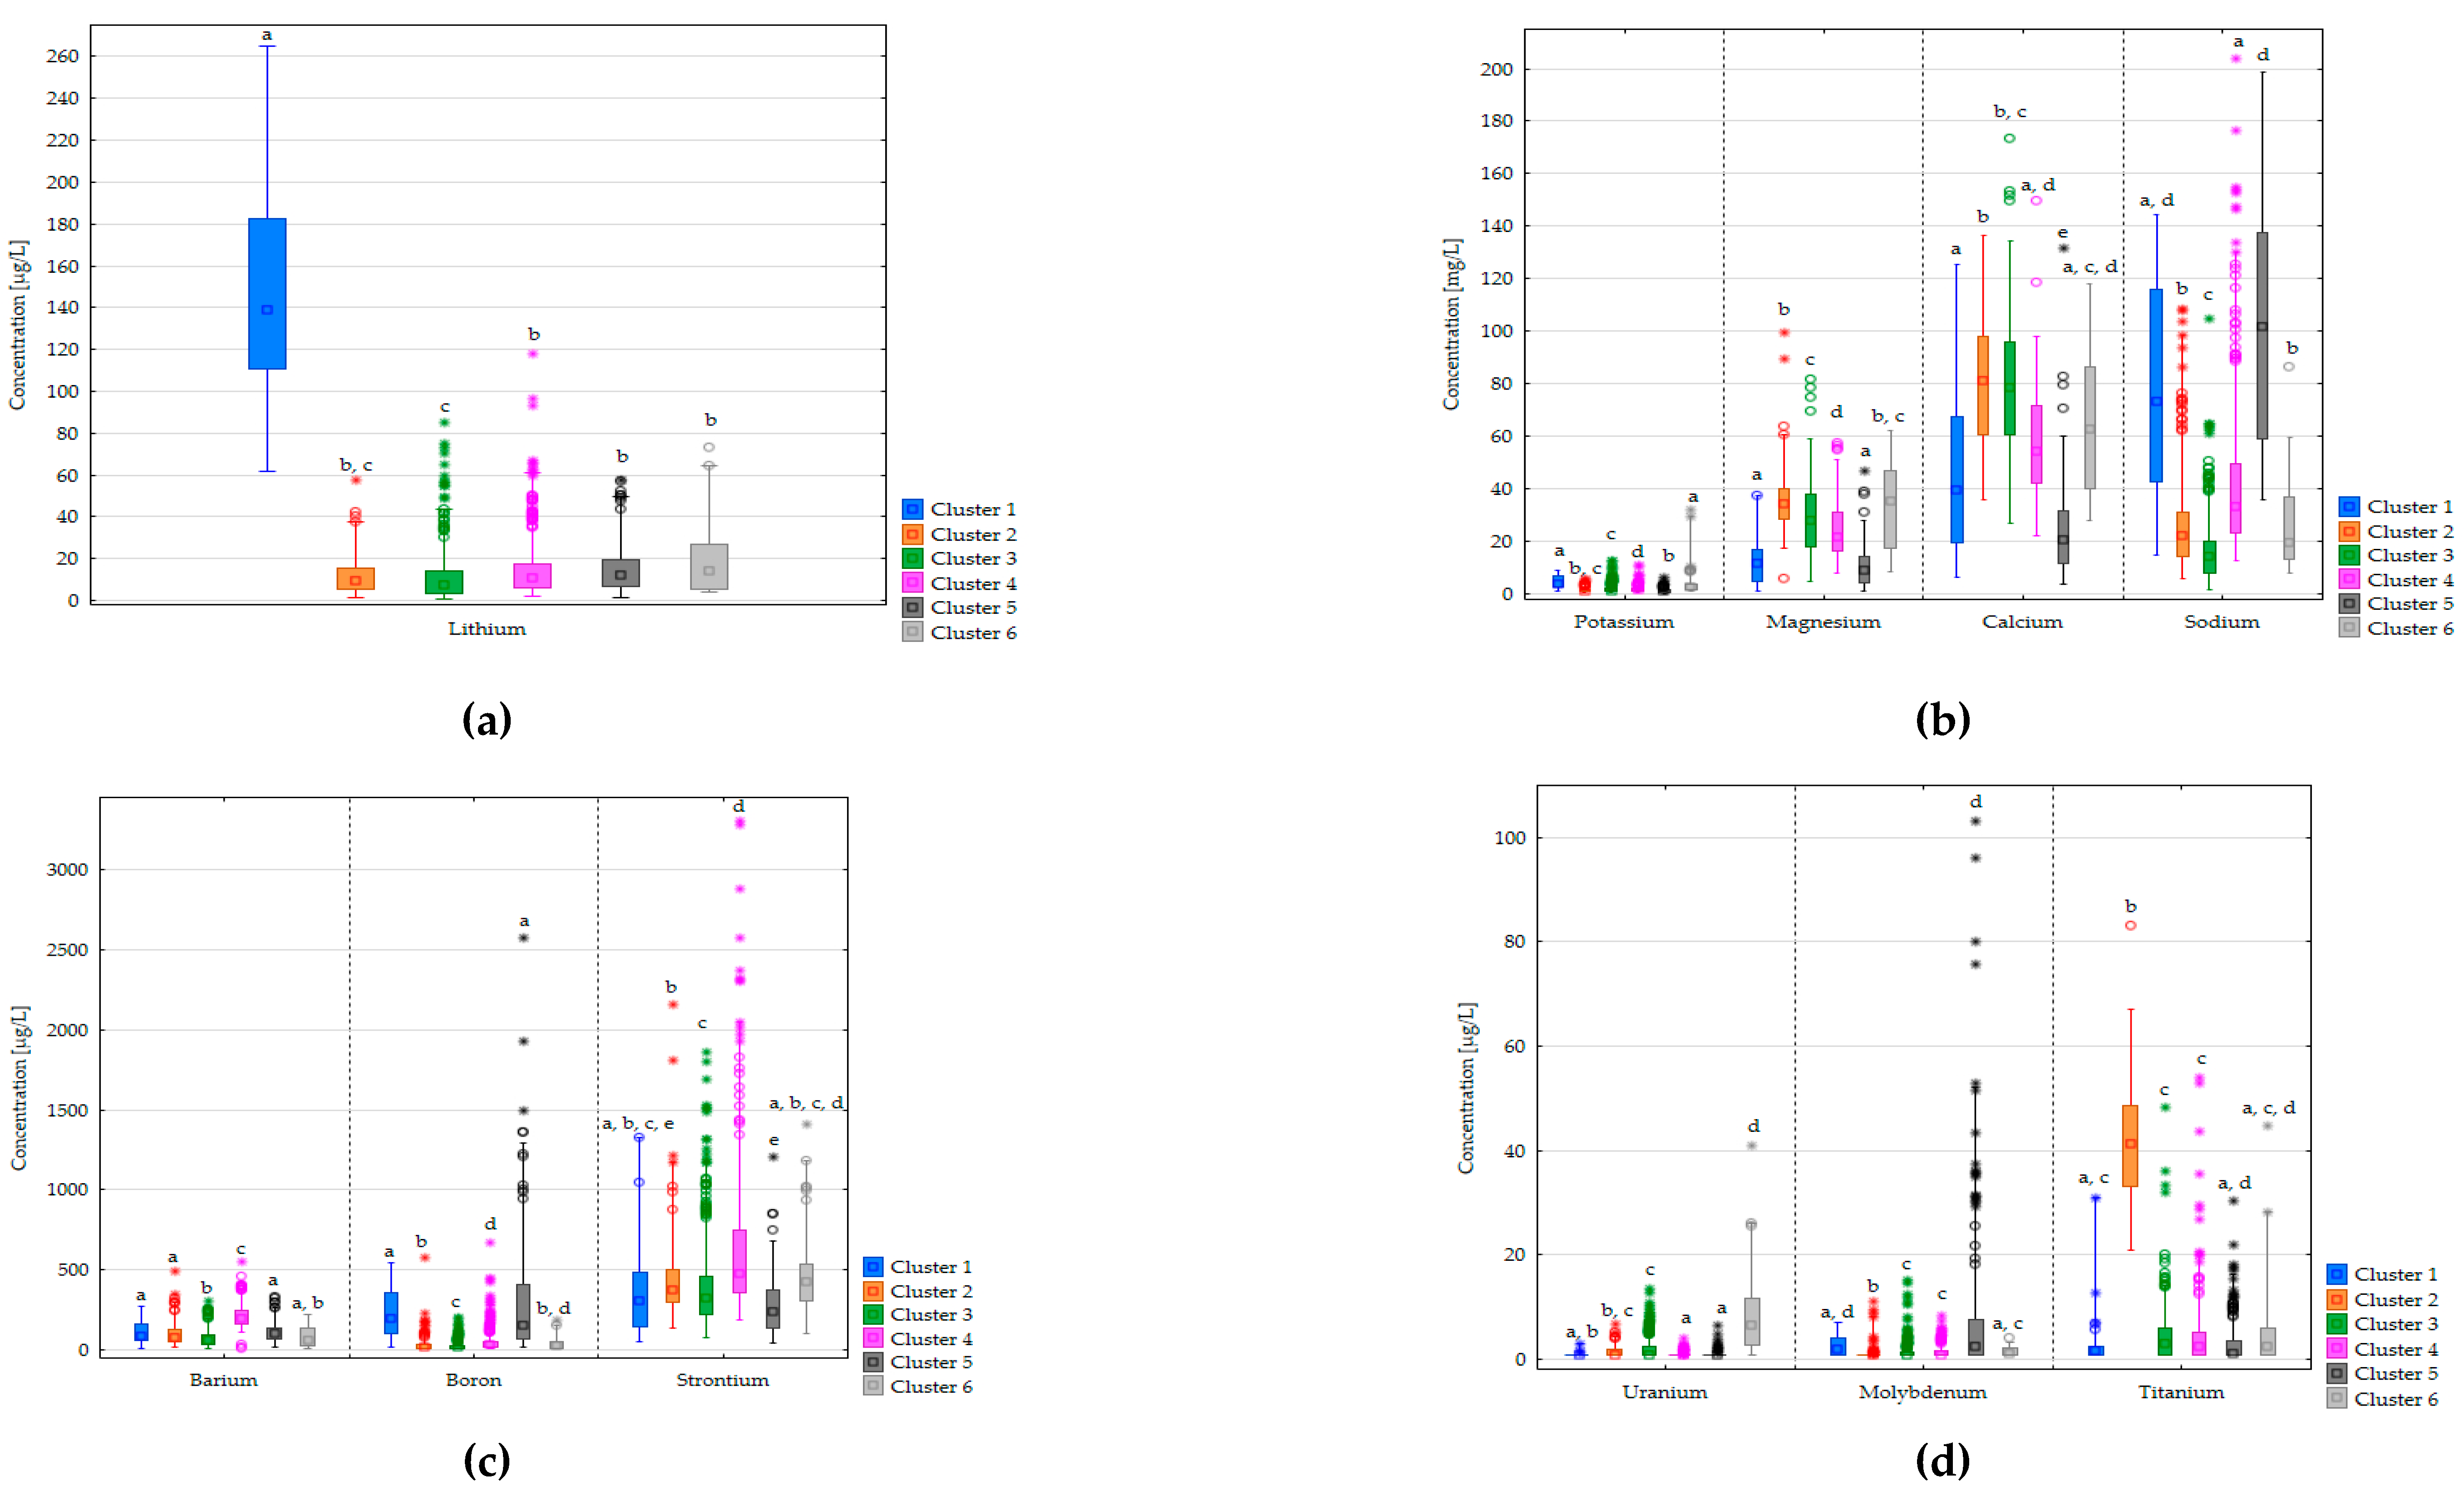
Li concentrations were highest in Cluster 1 (median 139 µg/L). Concentrations were typically an order of magnitude lower in the other clusters, with the lowest values in Clusters 2 and 3 (median 9.6 and 7.5 µg/L, respectively) (Figure 2a). Clusters 1 and 5 were characterized by high B, Na and Mo concentrations (median 198 and 154 µg/L; 73 and 102 mg/L; 1.9 and 2.4 µg/L, respectively), while significantly lower levels were measured in the other clusters, with the lowest in Cluster 3 (median B 15 µg/L; Na 15 mg/L; Mo <LOQ) (Figure 2b-d). Mg concentrations were the highest in Clusters 6 and 2 (median 36 and 35 mg/L), moderately high in Clusters 3 and 4 (median 28 and 22 mg/L), and low in Clusters 1 and 5 (median 12 and 8.9 mg/L). K was most abundant in Clusters 1 and 6 (median 3.9 and 2.5 mg/L) and typically low in the other clusters (median between 1.2 and 1.6 mg/L) but more variable in Clusters 2 and 3. Ca concentrations were the highest in Clusters 2 and 3 (median 81 and 79 mg/L), medium-high in Clusters 1, 4 and 6 (median 40; 54 and 63 mg/L), and low in Cluster 5 (median 21 mg/L). Cluster 2 had elevated levels of Ti (median 41 µg/L) compared to the other clusters (median 1.0-3.0 µg/L). Median concentrations of V and Se exceeded the LOQ only in Cluster 6 (median 2.0 and 1.1 µg/L, respectively). All 6 clusters had significant Sr concentrations (median 239-477 µg/L). The order of the clusters in decreasing concentration from the highest to the lowest are Cluster 4, Cluster 6, Cluster 2, Cluster 3, Cluster 1, Cluster 5. The concentration of Ba was the highest in Cluster 4 (median 195 µg/L) and significantly lower in the others, being lowest in clusters 3 and 6 (median 61 and 65 µg/L). Median U concentrations were below LOQ in most clusters, except in cluster 6. (median 6.4 µg/L).

3.3. Spatial Distribution

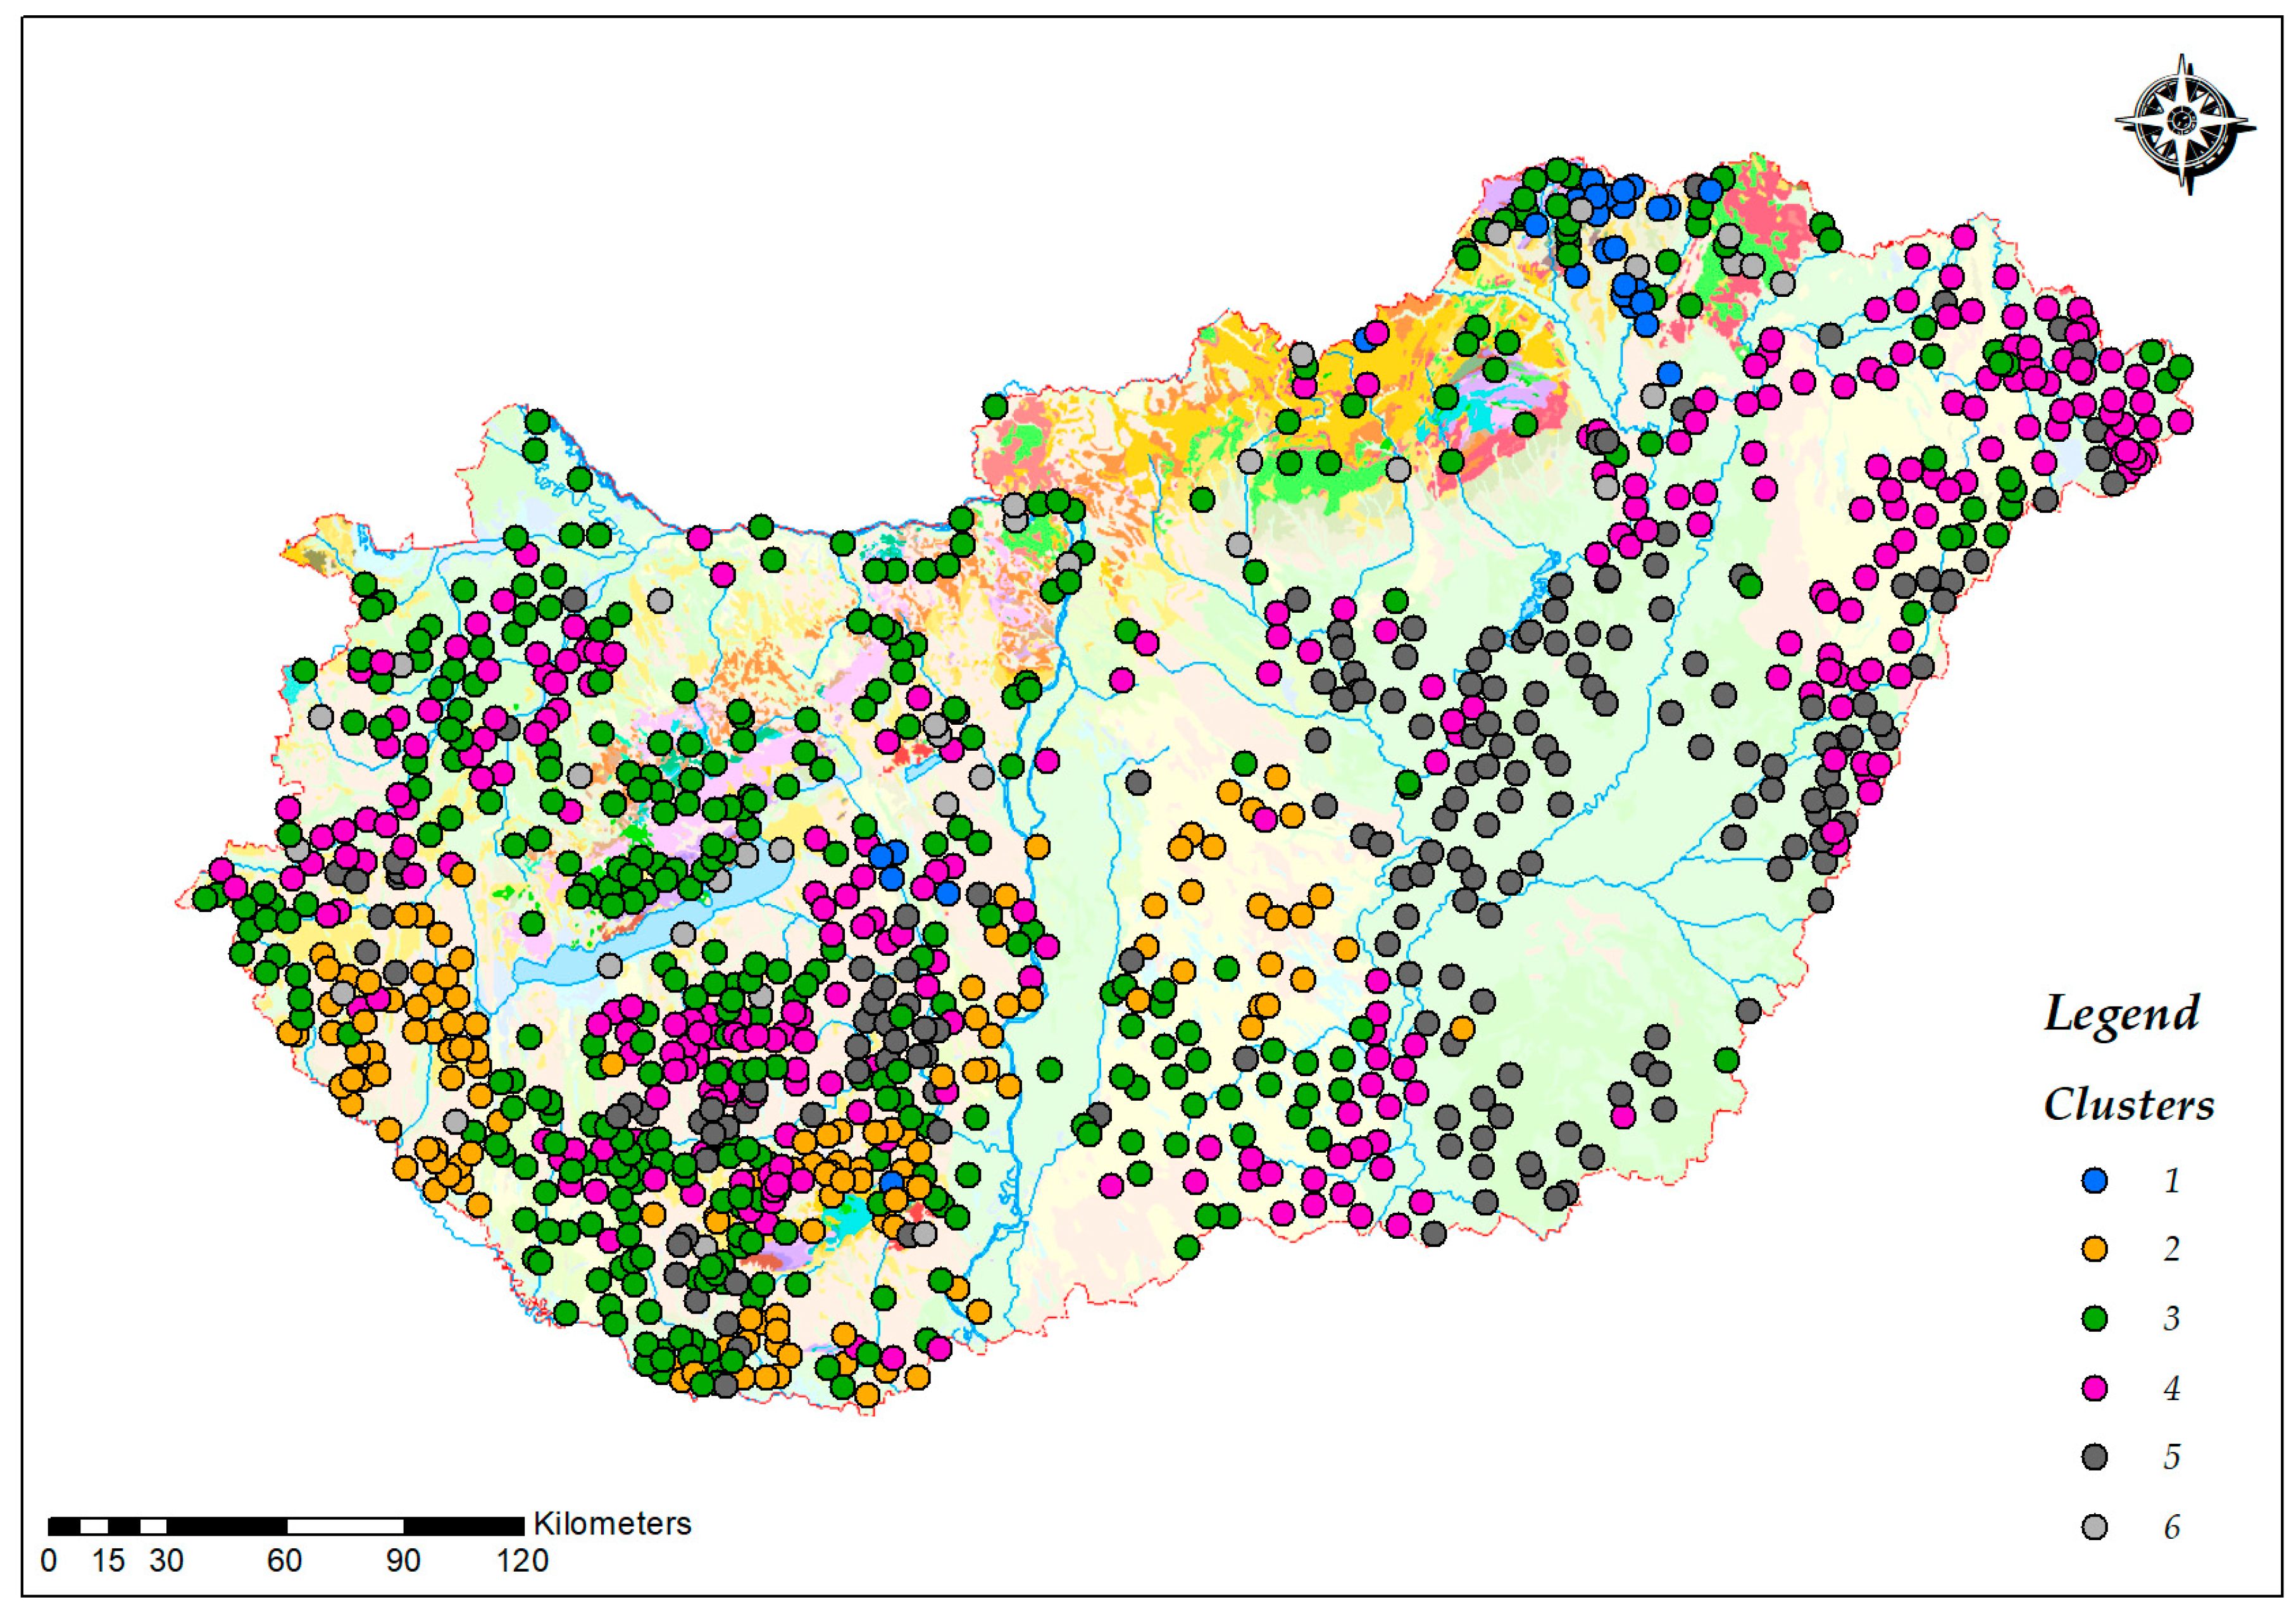
The geographical distribution of the 6 clusters is shown in Figure 3.
Geographically, Cluster 1 is a distinct group located in the northern part of Hungary. Drinking water sources belong to Cluster 2 form recognisable clusters in the southwest, south and central parts of the country. Cluster 3 is dispersed across the country, although it is more prevalent in the western and central parts of the country than in the eastern region. This cluster includes the vast majority of the non-deep groundwater sources (karst, bank filtered, shallow groundwater and surface water). Drinking water sources classified as Cluster 4 are scattered throughout the country. Cluster 5 drinking water sources are localised in the east-southeast part of the country and a specific area in the western half of the country. Cluster 6 is mainly associated with the southern foothills of Transdanubian and Northern Ranges. Characteristics of clusters are summarized in Table 3.

3.4. Principal Component Analysis

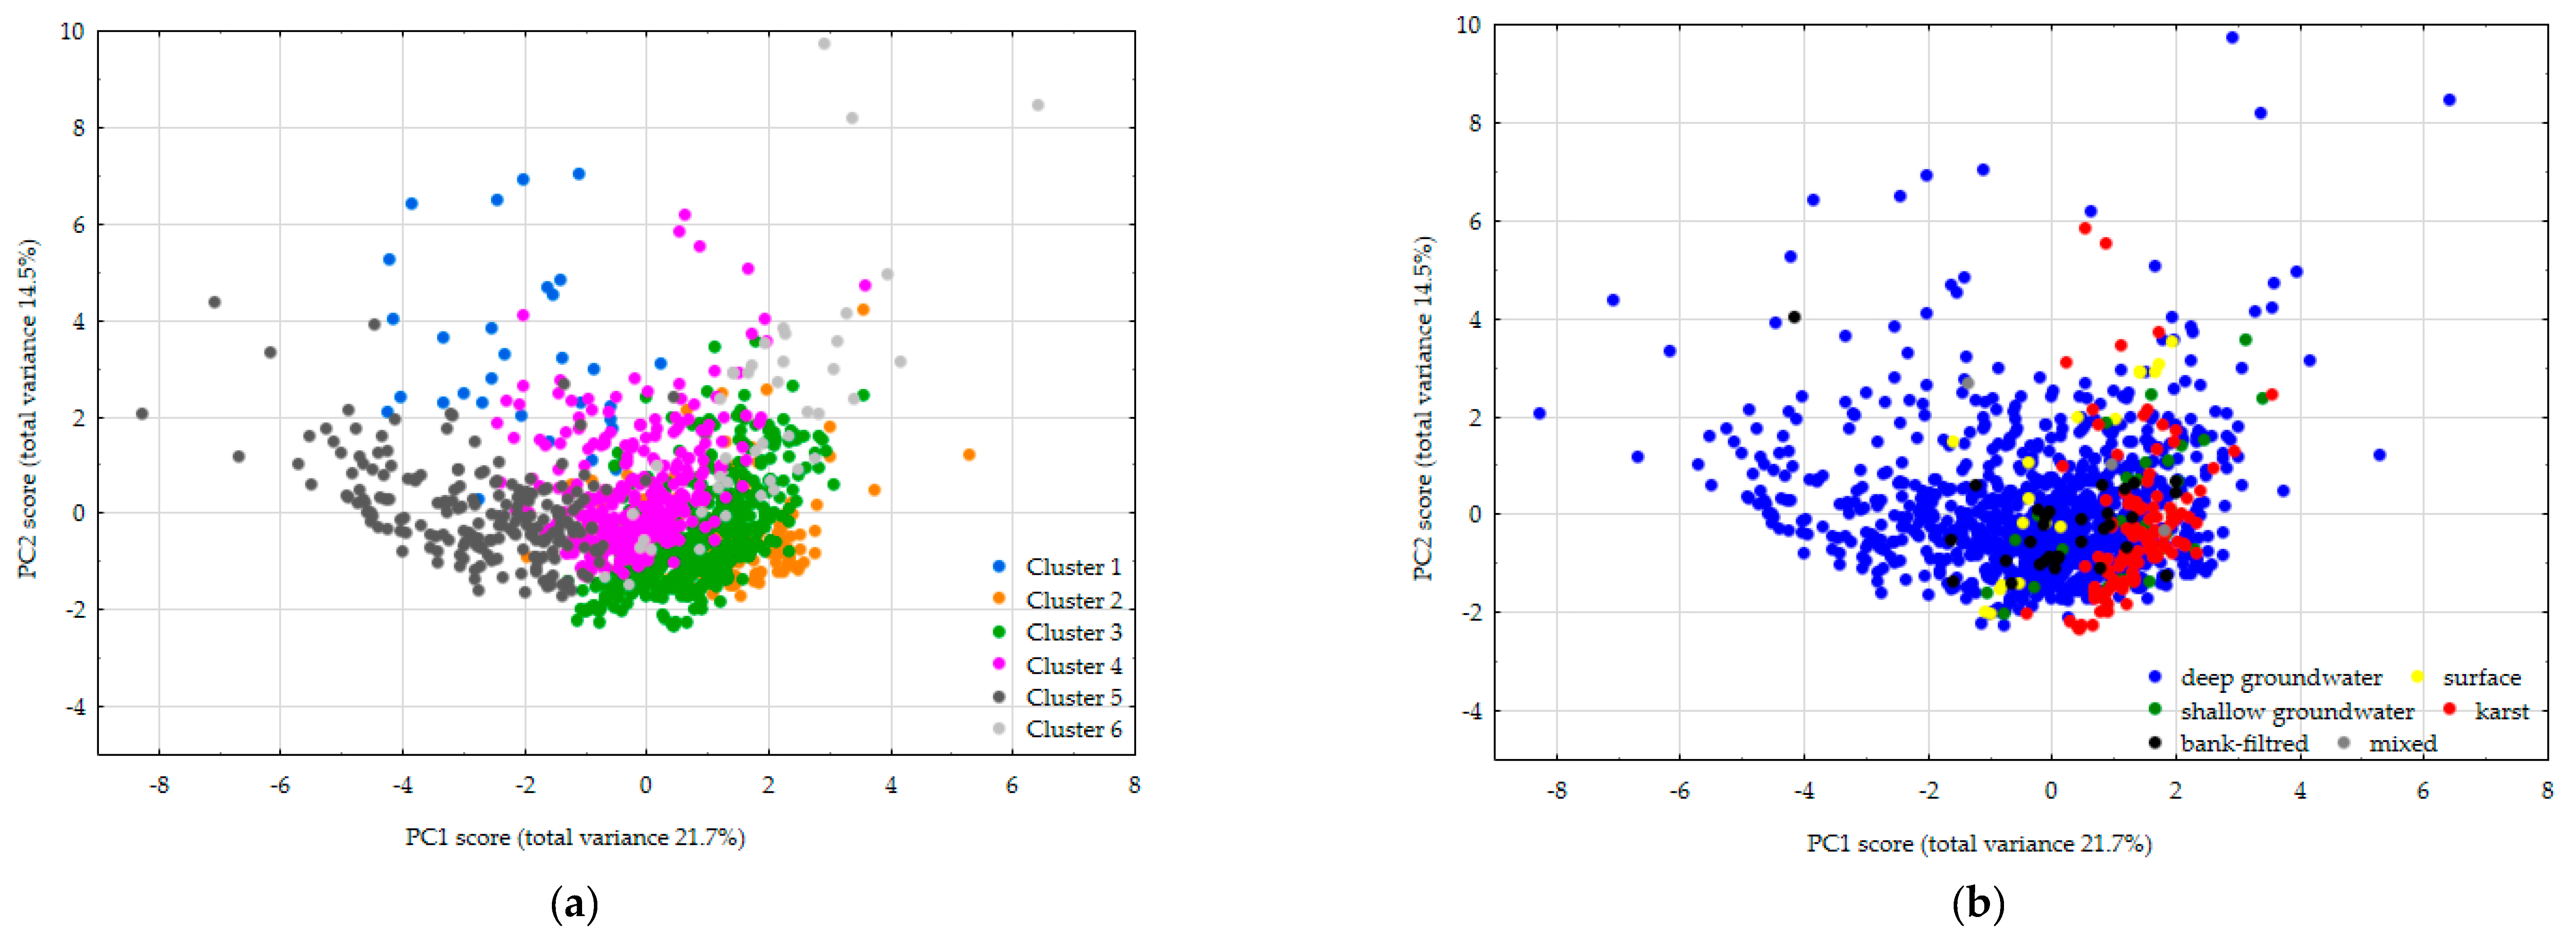
PCA analysis identified 5 principal components (PCs) with eigenvalues greater than 1. These 5 PCs explain 65% of the total variance. Characteristic elements (loading values <-0,4 or >0,4) of PC1 are B, Ca, Mg, Mo and Na (total variance 21.7%) and K, Li and Sr in case of PC2 (total variance 14.5%). Loading and eigenvalues of PCs are presented in Table S1 and S2 of the ESM. Samples belonging to the 6 clusters were also grouped together in the PCA, and the clusters were separated by the first two PCs (Figure 3a). Comparing water types, only karst waters formed a distinct group according to the first two PCs (Figure 3b). The overwhelming dominance of groundwater samples masked any other separation by water type.

4. Discussion

Drinking water supply in Hungary relies almost entirely on groundwater sources. Surface water abstraction is limited and, in some areas, seasonal. For example, around Lake Balaton, an important holiday destination, it is used in the summer periods to compensate for the temporary increase of the population. Although by volume, bank filtration contributes significantly to drinking water production, by the number of supplies, deep groundwaters comprise an overwhelming majority. We have hypothesised that the natural element composition of water types liable to surface impact (surface water, bank filtered water, karst water and shallow groundwater) would differ from deep groundwater, but only karst waters exhibited a unique profile, dominated by Ca and Mg due to the predominantly dolomite karst water reservoirs. The similarity in the elemental compositions of surface waters (specifically Lake Balaton) and groundwaters in might be an indication of their interconnection. The significance of groundwater discharge into lakes in Hungary was already demonstrated for Lake Balaton [38] and also for Lake Velence [33].
In groundwater, the prevalence of natural elements is determined not only by the geological composition of the aquifer but also by the groundwater flow systems that are characterised by different physicochemical conditions (e.g. pH, temperature, redox potential, dissolved gas content), changing from recharge to discharge areas and from local to regional flow systems. These systematic changes control the dissolution of elements and the resulting differences in the composition of the groundwater even within the same aquifer [39].
Of the geological features of the Pannonian Basin, the sediments originating from the ancient Lake Pannon are among the most important water reservoirs of drinking water and thermal water. As the Lake basin was filled, the deep basin and tubidite formations, followed by the various delta facies change into sediments of fluvial origin at the end of the sequence. These regions, to a large extent, overlap with water sources of high (up to 100 µg/L) arsenic concentration [40]. For decades, arsenic has been the primary focus of investigations and drinking water quality improvement programmes in Hungary. Since ample historical data was already available for arsenic, it was not part of the current study, but potential overlaps were investigated. High arsenic water sources were evenly distributed between Clusters 3, 4 and 5, and no clear correlation was observed at this level of analysis with the prevalence of other elements. In the ranges of Hungary, carbonates (dolomite, limestone) and volcanics, lesser extent metamorphic and magmatic (granite) rocks are most prevalent. The latter ones can be the source of various elements, among others uranium.
According to the current scientific consensus, U has the highest health relevance of the investigated parameters. Observed uranium concentrations in Hungary are low compared to other European countries [6,7,8,9,10]. The highest uranium levels (in Cluster 6) corresponded spatially to locations of elevated gross alpha activity used for the determination of the indicative dose in drinking water [41]. Some of these locations were investigated previously in detail, approaching the groundwater quality problem from the perspective of groundwater flow systems, taking into account (besides geological factors) the subsurface residence time and flow path of groundwater by a basin-scale survey [33,38]. These local studies confirmed that uranium contributed most to the measured elevated gross alpha activity (up to 0.8 Bq/L), which originated from the mobilizing effect of local flow systems due to oxidising conditions. Neither the calculated indicative dose nor U as a nephrotoxic element were identified as a source of significant health hazard.
Se, V and Mo are typically present at concentrations below the LOQ or in low concentrations in Hungarian water sources. Higher values (>5 µg/L) were measured in a limited number of water supplies (8 and 3 for V and Se, respectively), stipulating a local source. In the case of Mo and Se, similar results were obtained in Croatia by Ćurković et al. (2016) in drinking water (median concentration Se <1.0 µg/L; Mo <1.0 µg/L) [42]. Smedley et al. reported low Mo concentrations in drinking water in England and Wales (<1.0-1.5 µg/L) [43]. Studies from other European countries identified considerably higher levels (e.g. up to 350 µg/L V in Italy and 40 µg/L Se in France). However, these problems in other countries are also occur in relatively confined geographic areas (e.g. V together with U in volcanic areas in central Italy and Se in the Chalk Aquifer of Northern France). [10,29]. In the present study, V occurred in areas localised in the Northern Range volcanic complexes. Moderately strong correlation was seen between U and Se, which occur in the southern foreland of the Velence Hills built-up of granitic rocks.
Lithium was also measured in significant concentrations, even exceeding 250 µg/L in specific locations, which is relatively high compared to most other European studies [19,20,22,23]. Li is characteristic for the deep groundwater sources, suggesting longer groundwater residence time (i.e. more time for rock-water interactions). Higher concentrations than the ones measured in Hungary were only reported from Austria in Europe [23]. The protective effect of higher lithium intake via drinking water was also confirmed in a previous Hungarian study using a subset of data from the present study [24]. The presence of Be, Co and Mo is negligible in Hungarian drinking water sources. Neither Be nor Ba exceeded in any of the samples and Mo only four times (0.3%) the guideline value recommended by WHO (12, 1300 and 70 µg/L, respectively) [4].
Ca and Mg were dominant in karst waters. However, other aquifers hosted by sedimentary rocks, such as sandstone with carbonate cement may exhibit higher abundance of Ca beside Na and K as dominant ions.
For both Ca and Mg, median concentrations and lower quartile values exceed the minimum concentrations recommended by several EU Member States (30 mg/L and 10 mg/L, respectively) [15]. However, in-country variability was high, and some regions, especially the Great Plains in southeastern Hungary, population is at risk of insufficient intake of Mg and Ca from drinking water.

5. Conclusions

The study confirmed that none of the investigated parameters pose a risk to drinking water quality and consequently to the health of the consumers on a national scale. However, local hydrogeological conditions may lead to emergence of natural elements in higher concentration in some water supplies. Such local exceedances e.g. of U or V require further investigation and if needed, risk mitigation measures.
In hydrogeological studies, usually the major elements (Ca, Mg, Na, K, Cl, SO4, HCO3) are used for characterization of composition of waters. The presented study highlighted the importance of trace elements and the multivariate data analysis tools, which can reveal links and explain geographical distributions. Nevertheless, involving more data into the analysis (well depth, lithology, flow system evaluation results) would result in more detailed picture about the origin of these elements.

Supplementary Materials

The following supporting information can be downloaded at the website of this paper posted on Preprints.org, Figure S1: Dendrogram of HCA; Table S1: Eigen values of the PC’s; Table S2: PC’s loading values of the elements.

Author Contributions

Conceptualization, B. I. and M.V.; methodology, B.I..; formal analysis, B.I..; investigation, B.I..; data curation, I.B., N.E., K.H-CS..; writing—original draft preparation, B.I..; writing—review and editing, P.B., V.M., A.E..; visualization, I.B., K.H-CS.; supervision, M.V. All authors have read and agreed to the published version of the manuscript.

Funding

This research received no external funding

Data Availability Statement

Ready to disclose the dataset upon acceptance of the paper as a supplementary material.

Acknowledgments

We acknowledge the contribution of drinking water supply operators in providing the samples and metadata on the water supplies.

Conflicts of Interest

The authors declare no conflict of interest.

References

  1. The European Parliament and the Council of the European Union, ‘Directive (EU) 2020/2184 of the European Parliament and of the Council of 16 December 2020 on the quality of water intended for human consumption.‘ 2020 [Online]. Available: https://eur-lex.europa.eu/legal-content/EN/TXT/PDF/?uri=CELEX:32020L2184.
  2. World Health Organization, ‘Water safety plan manual Step-by-step risk management for drinking-water suppliers Second edition’. World Health Organization, 2023 [Online]. Available: https://iris.who.int/bitstream/handle/10665/366148/9789240067691-eng.pdf?sequence=1.
  3. Council of the European Union, ‘Council Directive 98/83/EC of 3 November 1998 on the quality of water intended for human consumption.‘ 1998 [Online]. Available: https://eur-lex.europa.eu/legal-content/EN/TXT/PDF/?uri=CELEX:31998L0083.
  4. World Health Organization, ‘Guidelines for drinking-water quality‘, Fourth edition incorporating the first and Second addenda. Geneva: World Health Organization, 2022 Available: https://iris.who.int/bitstream/handle/10665/352532/9789240045064-eng.pdf?sequence=1.
  5. European Food Safety Authority (EFSA), ‘Uranium in foodstuffs, in particular mineral water’, EFS2, vol. 7, no. 4, 0 2009. [CrossRef]
  6. Jerome Nriagu, Dong-Ha Nam, Titilayo A. Ayanwola, Hau Dinh, Erdenebayar Erdenechimeg, Chimedsuren Ochirb and Tsend-Ayush Bolormaa ., ‘High levels of uranium in groundwater of Ulaanbaatar, Mongolia’, Science of The Total Environment, vol. 414, pp. 722–726, Jan. 2012. [CrossRef]
  7. D. Cicchella, S. Albanese, B. De Vivo, E. Dinelli, L. Giaccio, A. Lima, P. Valera, ‘Trace elements and ions in Italian bottled mineral waters: Identification of anomalous values and human health related effects’, Journal of Geochemical Exploration, vol. 107, no. 3, pp. 336–349, Dec. 2010. [CrossRef]
  8. B. Frengstad, A. K. Midtgård Skrede, D. Banks, J. Reidar Krog, and U. Siewers, ‘The chemistry of Norwegian groundwaters: III. The distribution of trace elements in 476 crystalline bedrock groundwaters, as analysed by ICP-MS techniques’, Science of The Total Environment, vol. 246, no. 1, pp. 21–40, Jan. 2000. [CrossRef]
  9. Y. Wu, Y. Wang, and X. Xie, ‘Occurrence, behavior and distribution of high levels of uranium in shallow groundwater at Datong basin, northern China’, Science of The Total Environment, vol. 472, pp. 809–817, Feb. 2014. [CrossRef]
  10. D. Cinti, P. P. Poncia, L. Brusca, F. Tassi, F. Quattrocchi, and O. Vaselli, ‘Spatial distribution of arsenic, uranium and vanadium in the volcanic-sedimentary aquifers of the Vicano–Cimino Volcanic District (Central Italy)’, Journal of Geochemical Exploration, vol. 152, pp. 123–133, May 2015. [CrossRef]
  11. L. Jiang, Pengcheng He, Jiyan Chen, Yong Liu, Dehui Liu, Genggeng Qin and Ning Tan, ‘Magnesium Levels in Drinking Water and Coronary Heart Disease Mortality Risk: A Meta-Analysis’, Nutrients, vol. 8, no. 1, p. 5, Jan. 2016. [CrossRef]
  12. L. A. Catling, I. Abubakar, I. R. Lake, L. Swift, and P. R. Hunter, ‘A systematic review of analytical observational studies investigating the association between cardiovascular disease and drinking water hardness’, Journal of Water and Health, vol. 6, no. 4, pp. 433–442, Dec. 2008. [CrossRef]
  13. World Health Organization, ‘Calcium and magnesium in drinking water : Public health significance’, Calcium and magnesium in drinking water : Beneficial impacts on health, p. 180, 2009 Available: https://iris.who.int/bitstream/handle/10665/43836/9789241563550_eng.pdf?sequence=1.
  14. V. Gianfredi, N. L. Bragazzi, D. Nucci, M. Villarini, and M. Moretti, ‘Cardiovascular diseases and hard drinking waters: Implications from a systematic review with meta-analysis of case-control studies’, Journal of Water and Health, vol. 15, no. 1, pp. 31–40, Feb. 2017. [CrossRef]
  15. F. Kozisek, ‘Regulations for calcium, magnesium or hardness in drinking water in the European Union member states’, Regulatory Toxicology and Pharmacology, vol. 112, p. 104589, Apr. 2020. [CrossRef]
  16. R. Russo, S. Sciacca, D. I. La Milia, A. Poscia, and U. Moscato, ‘Vanadium in drinking water: Toxic or therapeutic?! Systematic literature review and analysis of the population exposure in an Italian volcanic region’, European Journal of Public Health, vol. 24, no. suppl_2, Oct. 2014. [CrossRef]
  17. M. Ferrante, G. Oliveri Conti, Z. Rasic-Milutinovic, and D. Jovanovic, ‘Health effects of metals and related substances in drinking water‘ London: IWA publishing, 2014.
  18. Y. Vasseghian, S. Sadeghi Rad, J. A. Vilas–Boas, and A. Khataee, ‘A global systematic review, meta-analysis, and risk assessment of the concentration of vanadium in drinking water resources’, Chemosphere, vol. 267, p. 128904, Mar. 2021. [CrossRef]
  19. N. Kabacs, A. Memon, T. Obinwa, J. Stochl, and J. Perez, ‘Lithium in drinking water and suicide rates across the East of England’, Br J Psychiatry, vol. 198, no. 5, pp. 406–407, May 2011. [CrossRef]
  20. V. Liaugaudaite, N. Mickuviene, N. Raskauskiene, R. Naginiene, and L. Sher, ‘Lithium levels in the public drinking water supply and risk of suicide: A pilot study’, Journal of Trace Elements in Medicine and Biology, vol. 43, pp. 197–201, Sep. 2017. [CrossRef]
  21. M. Pompili, Maurizio Pompili, Monica Vichi, Enrico Dinelli, Roger Pycha, Paolo Valera, Stefano Albanese, Annamaria Lima, Benedetto De Vivo, Domenico Cicchella, Andrea Fiorillo, Mario Amore, Paolo Girardi, Ross J Baldessarini, ‘Relationships of local lithium concentrations in drinking water to regional suicide rates in Italy’, The World Journal of Biological Psychiatry, vol. 16, no. 8, pp. 567–574, Nov. 2015. [CrossRef]
  22. Giotakos, P. Nisianakis, G. Tsouvelas, and V.-V. Giakalou, ‘Lithium in the Public Water Supply and Suicide Mortality in Greece’, Biol Trace Elem Res, vol. 156, no. 1–3, pp. 376–379, Dec. 2013. [CrossRef]
  23. Nestor D. Kapusta, Nilufar Mossaheb, Elmar Etzersdorfer, Gerald Hlavin, Kenneth Thau, Matthaus Willeit, Nicole Praschak-Rieder, Gernot Sonneck and Katharina Leithner-Dziubas, ‘Lithium in drinking water and suicide mortality’, Br J Psychiatry, vol. 198, no. 5, pp. 346–350, May 2011. [CrossRef]
  24. Balint Izsak, Anna Hidvegi, Lajos Balint, Tibor Malnasi, Marta Vargha, Tamas Pandics, Zoltan Rimer, and Peter Dome ‘Investigation of the association between lithium levels in drinking water and suicide mortality in Hungary’, Journal of Affective Disorders, vol. 298, pp. 540–547, Feb. 2022. [CrossRef]
  25. Fateme Barjasteh-Askari, Mojtaba Davoudi, Homaon Amini, Moamad Ghorbni, Medi Yaseri, Masoud Yunesian, Amir Hossein Mahvi and David Lester, ‘Relationship between suicide mortality and lithium in drinking water: A systematic review and meta-analysis’, Journal of Affective Disorders, vol. 264, pp. 234–241, Mar. 2020. [CrossRef]
  26. Anjum Memon, Imogen Rogers, Sophie M D D Fitzsimmons, Ben Cater, Rebecca Strawbridge, Diego Hidalgo-Mazzei, and Allan H Young, ‘Association between naturally occurring lithium in drinking water and suicide rates: Systematic review and meta-analysis of ecological studies’, Br J Psychiatry, vol. 217, no. 6, pp. 667–678, Dec. 2020. [CrossRef]
  27. B. Eyre-Watt, E. Mahendran, S. Suetani, J. Firth, S. Kisely, and D. Siskind, ‘The association between lithium in drinking water and neuropsychiatric outcomes: A systematic review and meta-analysis from across 2678 regions containing 113 million people’, Aust N Z J Psychiatry, vol. 55, no. 2, pp. 139–152, Feb. 2021. [CrossRef]
  28. R. Abejón, ‘A Bibliometric Analysis of Research on Selenium in Drinking Water during the 1990–2021 Period: Treatment Options for Selenium Removal’, IJERPH, vol. 19, no. 10, p. 5834, May 2022. [CrossRef]
  29. E. Barron, V. Migeot, S. Rabouan, M. Potin-Gautier, F. Se ́ by, P. Hartemann, Y. Lévi, and B. Legube, ‘The case for re-evaluating the upper limit value for selenium in drinking water in Europe’, Journal of Water and Health, vol. 7, no. 4, pp. 630–641, Dec. 2009. [CrossRef]
  30. ‘Magyarország ivóvizének minősége, 2022.’, National Center for Public Health and Pharmacy, 2023 [Online]. Available: https://www.nnk.gov.hu/attachments/article/726/2023_9_Ivo%CC%81vi%CC%81zmino%CC%8Bse%CC%81g%202022.pdf.
  31. Erőss, K. Csondor, B. Izsák, M. Vargha, Á. Horváth, and T. Pándics, ‘Uranium in groundwater – The importance of hydraulic regime and groundwater flow system’s understanding’, Journal of Environmental Radioactivity, vol. 195, pp. 90–96, Dec. 2018. [CrossRef]
  32. K. Csondor, P: Baják, H. Sureck, B. Izsák, Á. Horváth, M. Vagha, A. Erőss, ‘Transient nature of riverbank filtered drinking water supply systems - A new challenge of natural radioactivity assessment’, Journal of Environmental Radioactivity, vol. 211, p. 106072, Jan. 2020. [CrossRef]
  33. Petra Baják, Katalin Hegedűs-Csondor, Mia Tiljander, Kirsti Korkka-Niemi, Heinz Surbeck, Bálint Izsák, Márta Vargha, Ákos Horváth, Tamás Pándics and Anita Erőss, ‘Integration of a Shallow Soda Lake into the Groundwater Flow System by Using Hydraulic Evaluation and Environmental Tracers’, Water, vol. 14, no. 6, p. 951, Mar. 2022. [CrossRef]
  34. Petra Baják, Bence Molnár, Katalin Hegedűs-Csondor, Mia Tiljander, Viktor Jobbágy, Viktória Kohuth-Ötvös, Bálint Izsák, Márta Vargha , Ákos Horváth, Emese Csipa, Mihály Óvári, Csaba Tóbi, Péter Völgyesi, Krzysztof Pelczar, Mikael Hult, and Anita Erőss, ‘Natural Radioactivity in Drinking Water in the Surroundings of a Metamorphic Outcrop in Hungary: The Hydrogeological Answer to Practical Problems’, Water, vol. 15, no. 9, p. 1637, Apr. 2023. [CrossRef]
  35. C. W. Croghan and P. P. Egeghy, ‘Methods of Dealing with Values Below the Limit of Detection using SAS’. US-EPA, 2003 Record ID: 64046.
  36. Brian S. Everitt, Sabine Landau, Morven Leese, and Daniel Stahl, Cluster analysis, 5th ed. in Wiley series in probability and statistics. Chichester, West Sussex, U.K: Wiley, 2011. [CrossRef]
  37. S. Wold, K. Esbensen, and P. Geladi, ‘Principal component analysis’, Chemometrics and Intelligent Laboratory Systems, vol. 2, no. 1–3, pp. 37–52, Aug. 1987. [CrossRef]
  38. Ádám Tóth, Petra Baják , Márk Szijártó , Mia Tiljander, Kirsti Korkka-Niemi, Nina Hendriksson and Judit Mádl-Szőnyi, ‘Multimethodological Revisit of the Surface Water and Groundwater Interaction in the Balaton Highland Region—Implications for the Overlooked Groundwater Component of Lake Balaton, Hungary’, Water, vol. 15, no. 6, p. 1006, Mar. 2023. [CrossRef]
  39. J. Tóth, ‘Groundwater as a geologic agent: An overview of the causes, processes, and manifestations’, Hydrogeology Journal, vol. 7, no. 1, pp. 1–14, Feb. 1999. [CrossRef]
  40. G. Dura, P. Rudnai, M. Kádár, and M. Vargha, ‘The health risks of consuming drinking water with elevated arsenic content of geochemical origin’, Central European Geology, vol. 57, no. 3, pp. 307–316, Sep. 2014. [CrossRef]
  41. ‘Módszertani Útmutató Ivóvizek radiológiai paramétereinek vizsgálatához és értékeléséhez 2023’. National Center for Public Health and Pharmacy, 2023 [Online]. Available: https://www.nnk.gov.hu/attachments/article/726/2023_8_M%C3%B3dsz.%C3%BAtm._Iv%C3%B3viz_radiologiai%20vizsg..pdf.
  42. M. Ćurković, L. Sipos, D. Puntarić, K. Dodig-Ćurković, N. Pivac, and K. Kralik, ‘Arsenic, Copper, Molybdenum, and Selenium Exposure through Drinking Water in Rural Eastern Croatia’, Pol. J. Environ. Stud., vol. 25, no. 3, pp. 981–992, 2016. [CrossRef]
  43. P. L. Smedley, D. M. Cooper, and D. J. Lapworth, ‘Molybdenum distributions and variability in drinking water from England and Wales’, Environ Monit Assess, vol. 186, no. 10, pp. 6403–6416, Oct. 2014. [CrossRef]
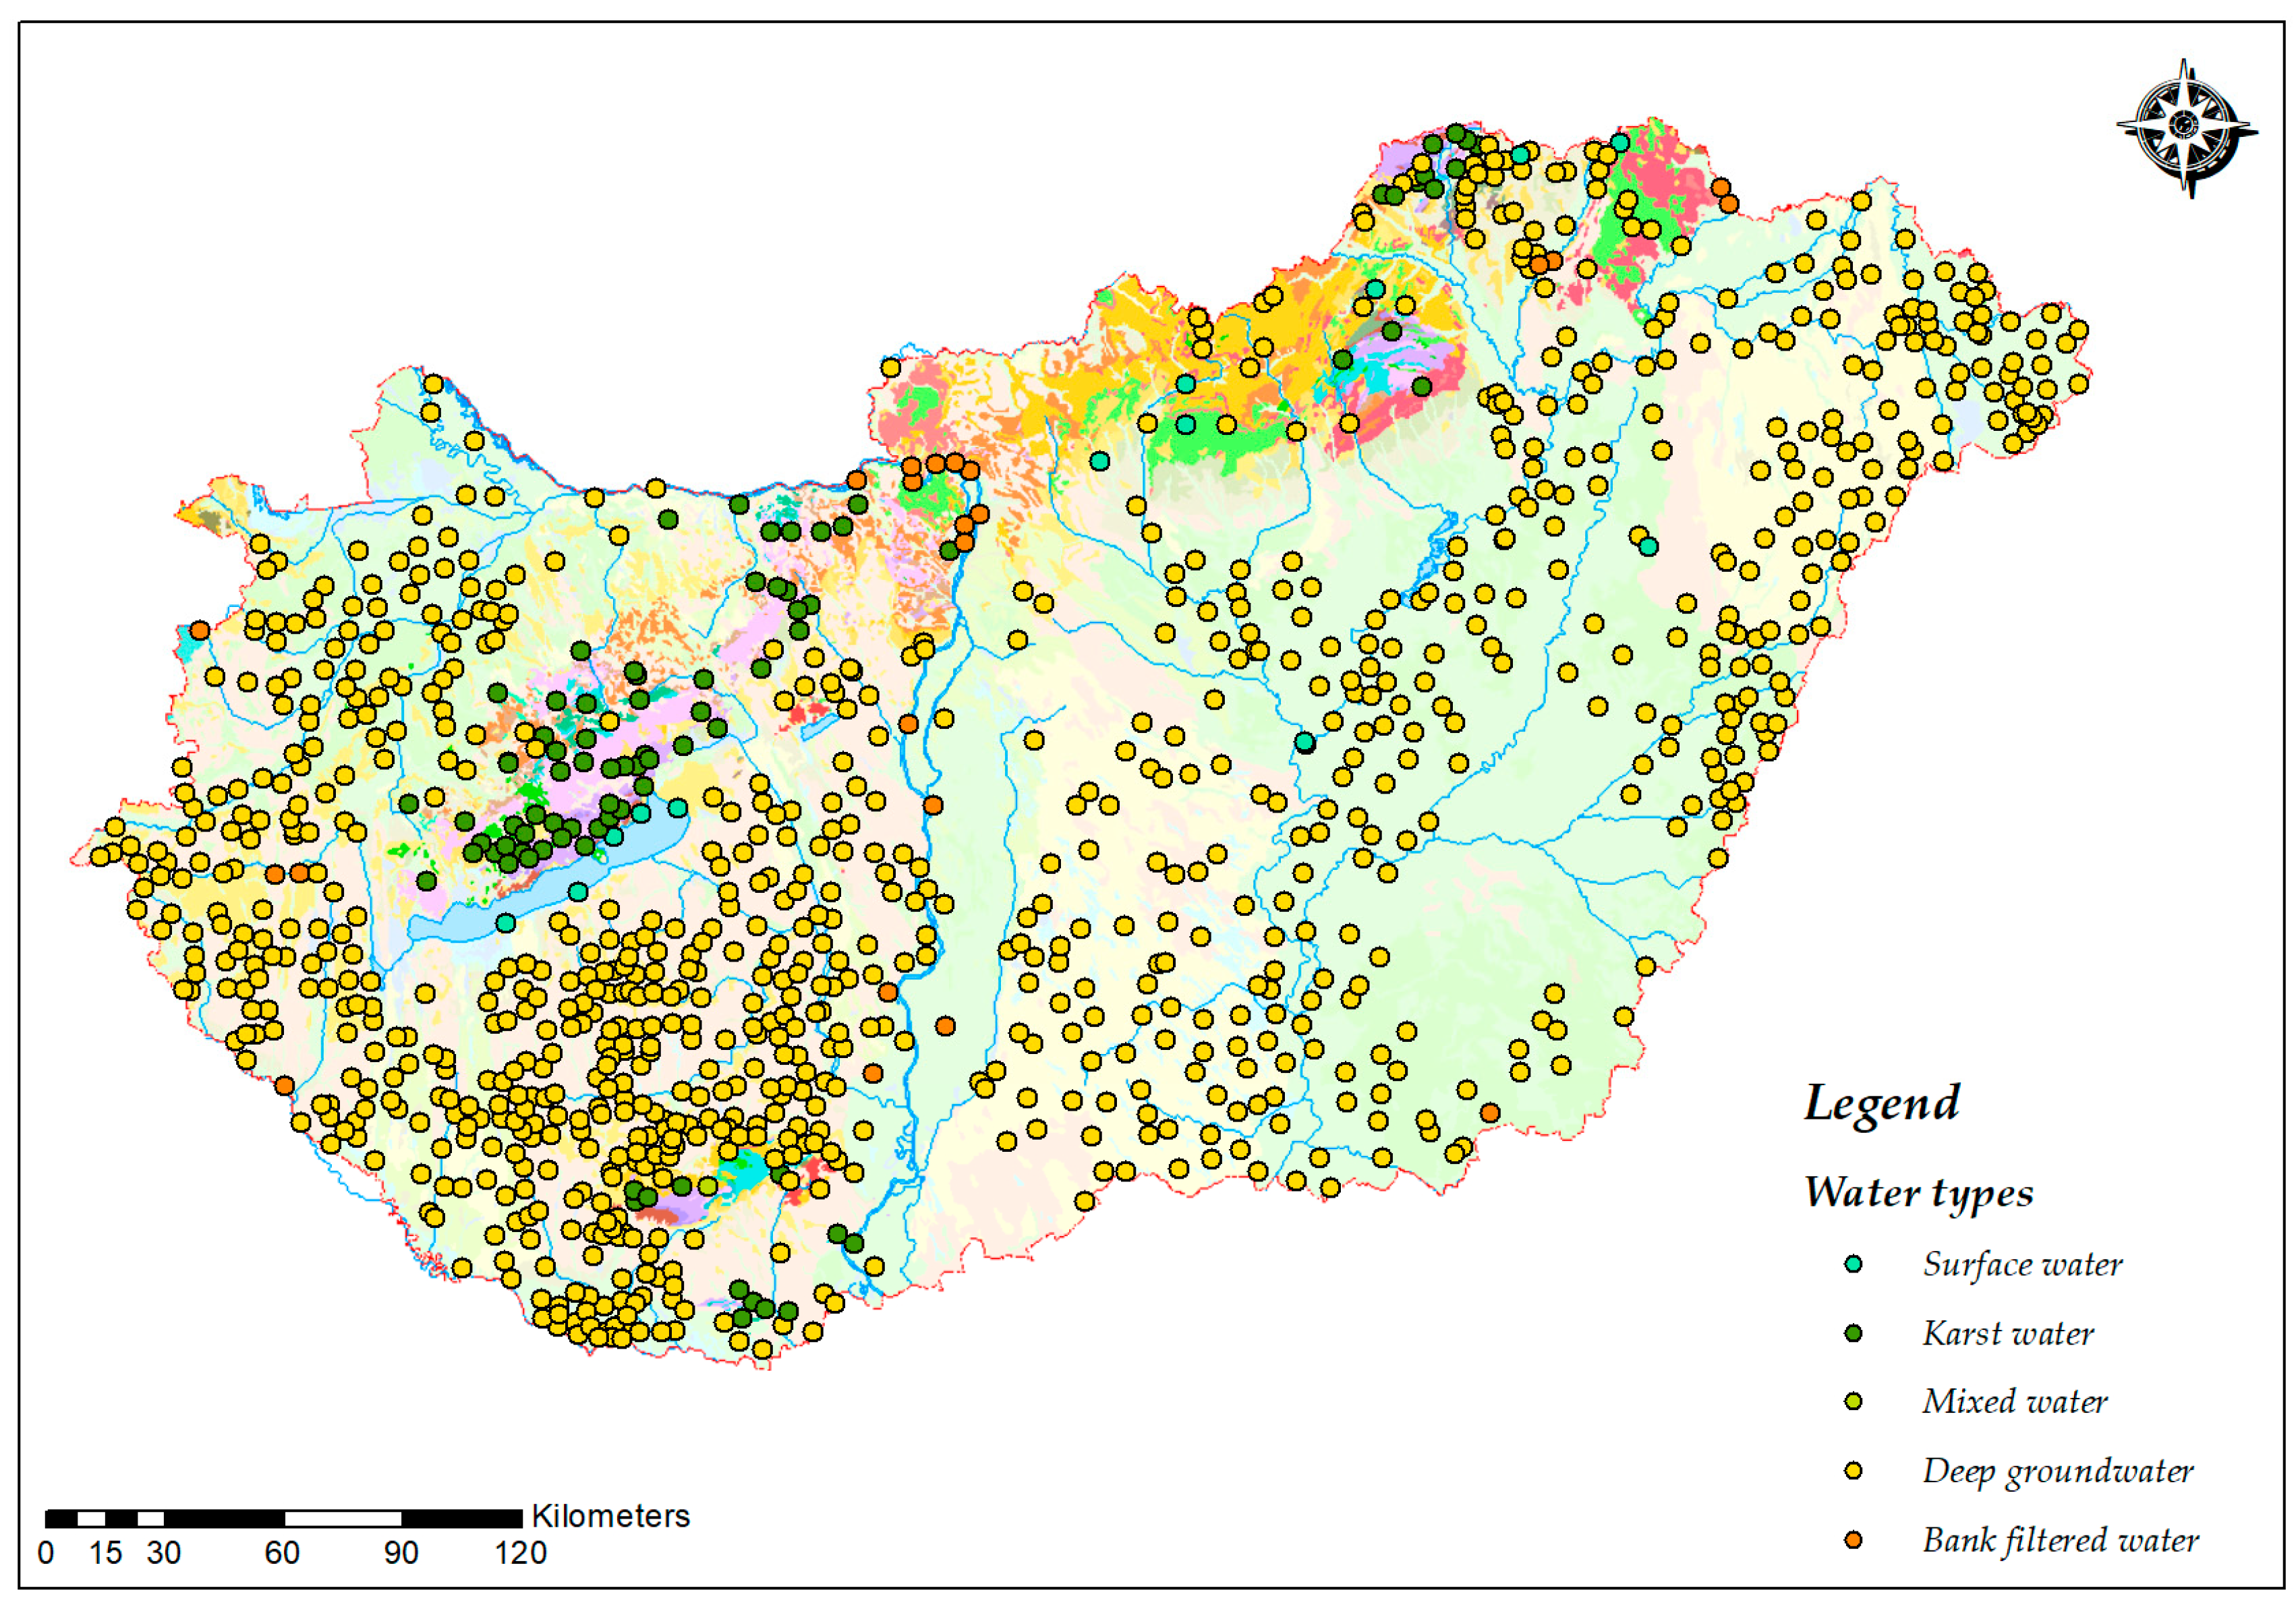
Figure 1. Geographical distribution of the sampled drinking water sources classified by water type (n=1155).
Preprints 110574 g001
Figure 2. a)-d) Comparison of the 6 clusters by elements (a) lithium, (b) potassium, magnesium, calcium, sodium (c) barium, boron, strontium (d) uranium, molybdenum, titanium. The boxplots show the median (☐), lower and upper quartile (box), 2.5 and 97.5 percentiles (whiskers), outliers (○) and extremes (*), and the statistically significant difference between clusters (letters).
Preprints 110574 g002
Figure 3. Spatial distribution the sampled drinking water supplies by the 6 HCA clusters. n=1155.
Preprints 110574 g003
Figure 3. a)-b) Separation of water resource samples along the first two principal components (PC1 and PC2) on a 2D-score PCA plot depicted as (a) clusters (b) water types.
Preprints 110574 g004
Table 1. Descriptive statistics of the natural elements measured in Hungarian drinking water sources (n: number of samples, Std.Dev.: standard deviation, LOQ: lower limit of quantification).
Variable Dimension LOQ n Minimum Lower quartile Mean Std.Dev. Median Upper quartile Maximum % of samples <LOQ
B µg/L 10 1256 <LOQ 13 84 185 25 62 2570 16
Ba µg/L 10 1256 <LOQ 54 120 83 103 170 551 2
Be µg/L 1.0 1256 <LOQ <LOQ <LOQ 0 <LOQ <LOQ <LOQ 100
Ca mg/L 0.50 1256 2.5 40 64 31 63 85 174 0
Co µg/L 1.0 1256 <LOQ <LOQ <LOQ 0.42 <LOQ <LOQ 11 99
K mg/L 0.50 1256 <LOQ 1.1 1.9 1.9 1.4 2.0 32 2
Li µg/L 1.0 1256 <LOQ 5.1 16 25 10 17 265 2
Mg mg/L 0.50 1256 0.55 15 25 14 23 35 100 0
Mo µg/L 1.0 1256 <LOQ <LOQ 2.4 6.6 <LOQ 1.6 103 58
Na mg/L 0.50 1256 <LOQ 15 40 40 25 50 252 0
Se µg/L 1.0 1256 <LOQ <LOQ <LOQ 0.46 <LOQ <LOQ 7.0 86
Sr µg/L 10 1256 21 241 448 354 366 519 3310 0
Ti µg/L 1.0 1256 <LOQ <LOQ 8.4 14 2.9 7.3 83 31
U µg/L 1.0 1256 <LOQ <LOQ 1.5 2.4 <LOQ 1.3 41 72
V µg/L 1.0 1256 <LOQ <LOQ <LOQ 0.85 <LOQ <LOQ 17 91
Table 2. Pearson’s correlation matrix of natural elements measured in Hungarian drinking water sources (p-value: 0.05, statistically significant correlation marked in bold).
Variable B Ba Ca K Li Mg Mo Na Se Sr Ti U V
B 1.0000
Ba 0.0621 1.0000
Ca -0.3420 -0.0809 1.0000
K 0.0875 0.0403 0.1315 1.0000
Li 0.2236 0.0838 -0.0813 0.4015 1.0000
Mg -0.2747 0.0612 0.5562 0.1469 -0.0243 1.0000
Mo 0.3175 -0.0234 -0.2026 -0.0067 0.0415 -0.1592 1.0000
Na 0.5370 0.2132 -0.5792 0.0611 0.2606 -0.3611 0.3008 1.0000
Se -0.0614 -0.0811 0.1124 0.0818 0.0401 0.1862 -0.0333 -0.0841 1.0000
Sr -0.0984 0.3538 0.1649 0.1933 0.1898 0.4615 -0.0911 0.0021 0.0619 1.0000
Ti -0.0796 -0.0622 0.3296 -0.0229 -0.0475 0.2999 -0.0709 -0.1128 -0.0696 0.0323 1.0000
U -0.0819 -0.1528 0.1199 0.1362 0.0449 0.2978 0.0205 -0.1064 0.4326 0.1069 -0.0059 1.0000
V -0.0353 -0.1312 0.0167 0.1988 -0.0467 0.0322 0.0213 -0.0807 0.0463 -0.0496 -0.0232 0.1333 1.0000
Table 3. Characteristics of the clusters: dominant elements, number of samples and their distribution by water types.
Cluster number Characteristic element Σn Distribution by water type
deep groundw. karst w. shallow groundw. surface w. bank filtered w. mixed w.
Cluster 1 Li, B, Na, Mo, K 31 27 1 1 1 1 0
Cluster 2 Ti, Ca, Mg 151 138 5 2 0 5 1
Cluster 3 Ca 488 333 101 20 12 20 1
Cluster 4 Ba, Na, Sr 343 340 3 0 0 0 0
Cluster 5 Mo, B, Na 200 196 0 0 0 2 1
Cluster 6 Mg, K, U, Se, V 43 27 1 6 5 4 0
Disclaimer/Publisher’s Note: The statements, opinions and data contained in all publications are solely those of the individual author(s) and contributor(s) and not of MDPI and/or the editor(s). MDPI and/or the editor(s) disclaim responsibility for any injury to people or property resulting from any ideas, methods, instructions or products referred to in the content.
Copyright: This open access article is published under a Creative Commons CC BY 4.0 license, which permit the free download, distribution, and reuse, provided that the author and preprint are cited in any reuse.
Prerpints.org logo

Preprints.org is a free preprint server supported by MDPI in Basel, Switzerland.

Subscribe

© 2024 MDPI (Basel, Switzerland) unless otherwise stated