Submitted:
01 July 2024
Posted:
01 July 2024
You are already at the latest version
Preprints on COVID-19 and SARS-CoV-2
Abstract
Purpose: To explore how race and residential zip codes' socioeconomic index (SES) influenced COVID-19 testing rates in St. Louis during the early and peak phases of the pandemic.
Method: An ecological study was conducted using COVID-19 testing data from March to November 2020 in St. Louis City. The study included 16,915 individual tests from 30 residential zip codes.
Results: The overall testing rate in St. Louis was 303.97 per 10,000 population. Testing rates among Blacks, Whites, American Indian/Alaskan Natives, and Asians were 374.26, 247.77, 360.63, and 242.41 per 10,000, respectively. Higher testing rates were observed in low and middle SES zip codes compared to high SES zip codes. Adjusted for SES, testing rates were 1.68% higher among Blacks and 0.43% higher among American Indian/Alaskan Natives compared to Whites, and 0.033% lower among Asians. Geographical mapping showed higher testing rates in the inner core and lower rates in the periphery of St. Louis.
Conclusion: Race and SES influence testing rates. Areas with low testing rates should be targeted for intervention in St. Louis.
Keywords:
Covid-19
; Testing Rates
; Race
; Socioeconomic Index (SES)
; Geographical Mapping
; Disparity
Introduction
Background
The COVID-19 pandemic has had a devastating effect globally on many sectors of human life, such as health, economic, and social systems. Though the toll continues to be seen and felt, this was especially so in the early and peak phases of the pandemic. Over 500 million cases and 6 million deaths have been reported globally [1]. In the United States (US), there are well over 80 million cases and 950,000 reported deaths [2,3]. At a more disaggregated, granular level, there appears to be a disproportionate burden of COVID-19 morbidity and mortality among racial minorities in the US [4].
A review of current literature shows that research on COVID-19 around racial disparities is increasing [5]. However, a greater percentage of published papers on COVID-19 and racial disparities are heavily skewed toward the analysis and discussion of the clinical outcomes such as morbidity, often quantified with proxy measures of hospitalizations and the mortality associated with COVID-19 [5,6]. There is a relative dearth in the literature on testing, which can equally explain the mechanisms at work in producing these disparities.
Access to testing and testing behaviors are essential factors to contain any pandemic, especially in the early and peak phases where there are limited and restricted testing resources. Testing may be a proxy measure that provides crucial insights into access to health care and its delivery, mainly because, prior to COVID-19 testing becoming more readily available, there was limited/restricted access to testing in the early part of the pandemic [7]. Hence, a careful analysis of testing data may reveal patterns and trends that allude to disparities in access to testing or otherwise.
Secondly, determinants of health such as socioeconomic status, education, healthcare insurance, and others may shape access to testing, and hence low testing trends may partly provide insights as to why there are disparities in communities of color. Additionally, insights from testing patterns can inform targeted interventions and programs to improve access to testing and other healthcare services for those disadvantaged.
The St. Louis region has historically suffered from racial segregation and resultant health disparities as a corollary effect [8,9]. As stated above, this growing concern of racial and ethnic minority communities experiencing an increasingly disproportionate burden of COVID-19 infection and mortality[10] may be happening in the St Louis region. No study has examined racial/ethnic disparities in testing patterns in a racially and socioeconomically diverse population such as the St. Louis area. Are these disparities clustered in specific geographical locations at a more granular level, and does the zip codes’ socioeconomic index influence this trend? Understanding how race and socioeconomic index influence COVID-19 testing can equip us for a quick response to the next pandemic.
This study aims to contribute to the body of literature by evaluating the influence of race and residential zip codes’ socioeconomic index on testing patterns and whether there are geographical clusters of areas lacking in testing for targeted interventions in a racially and socioeconomically diverse metropolitan area such as the St. Louis city.
St. Louis Context and COVID-19
As of 2021, the White (non-Hispanic) and Black (non-Hispanic) populations in St Louis were 45.5% and 43.9%, respectively. The Hispanic population was 4.4%, and the Asian (non-Hispanic) was 3.5%. All other racial and ethnic groups constituted 2.7% [11]. The St Louis region remains one of the geographical areas in the United States where racial segregation and its effects are highly persistent[12]. “The Delmar Divide,” described by the BBC elsewhere aptly elucidates this phenomenon [13].A significant number of blacks reside in the northern part of the city, where decades of redlining, deed covenants, rezoning, etc., have ultimately led to high poverty and few public services [14,15,16].. The effects of segregation manifest as health disparities due to poverty and the consequent lack of access to health literacy and healthcare services [17,18,19].. The first confirmed COVID-19 case in St. Louis was on March 7th, 2020, [20,21] and the first COVID-19 -related death in the St. Louis area was reported on March 22nd, 2020 [22]. As of November 4th, 2022, there have been 58,807 total confirmed cases of COVID-19 translating to 19,499.8 per 100,000 people and 801 total confirmed deaths translating to 265.6 total deaths per 100,000 people [23].
Methods
Data
We conducted an ecological study using COVID-19 testing data from the City of St. Louis Department of Health COVID-19 database. The Department received and collated data from hospitals and testing centers within the city limits. Data included in this analysis were from March to November 2020. There were 16,915 individual COVID-19 tests performed within this period. Variables selected for the study included race and the residential zip codes’ socioeconomic index (SES) in St. Louis city. Race had 5 categories of White, Black/African American, and Asian, a combined category of American Indian/Alaskan Native, and Other, representing all other races or people of a mixed race. However, our analysis limited the race variable to White, Black/African American, Asian and American Indian/Alaskan. We excluded the “other” level in the race category because we did not know which races were aggregated as the “other.” We excluded zip codes outside the limit of St. Louis city. Other variables in the City of St. Louis Department of Health COVID-19 database included age, gender, test result (defined as positive, negative, indeterminate), test type (defined as PCR, etc.), test date, etc.
We extracted the test month from the stated test date as the month in which the COVID-19 testing was done. We defined the socioeconomic index (SES) from the socioeconomic deprivation scores variable of the Missouri Health Rankings Project utilizing data from the Washington University School of Medicine and Hospital Industry Data Institute, [24] whose source data is from census-based zip code level data and primary data from hospital discharges at the zip code level in St. Louis. The socioeconomic deprivation index scores considered factors such as low education, high school education, college education, childhood poverty, unemployment, household size, median home value, Medicaid, uninsured, non-English speakers, median household income, racial income inequality, renter-occupied housing, single-parent households, unmarried adults, and blue-collar workers, making it an excellent approximate measure for socioeconomic status at the zip code level. The socioeconomic deprivation scores generally ranged from -6 to 3, with residential zip codes with higher deprivation scores being worse off in socioeconomic standards than those with lower deprivation scores. The residential zip codes included in our study had deprivation scores that ranged from -4.91 to 2.12. To ensure a straightforward interpretation of our result, we defined our socioeconomic index scores to be 3.12 – deprivation index scores; that way, the maximum deprivation score became our minimum socioeconomic index score of 1, and the minimum deprivation score of -4.91 became our maximum socioeconomic index score of 8.03. Thus, an increase in the socioeconomic index (SES) represents an improvement in the socioeconomic standards of residential zip codes.
The outcome variable was COVID-19 tests performed within the period, and the testing rate was estimated as the individual COVID-19 tests performed in each zip code divided by the population size in that zip code. We estimated the testing rate of each race at the zip code as the tests performed by each race divided by the racial population size at that zip code. The data on racial population size and percentage racial distribution for each zip code was extracted from Think Health St. Louis, a web-based population data and community health information for community assessment, strategic planning, advocacy, etc., for policymakers and community members of St. Louis City and County. More details on this data source can be found at www.ThinkHealthSTL.org. A total of 30 zip codes met inclusion criteria within the city limits of St. Louis. See Figure 1 for inclusion and exclusion criteria.
Statistical Analysis
We ran a Pearson correlation analysis between testing rates per 10,000 populations in St. Louis and the residential zip codes’ socioeconomic index stratified by race. We also conducted a linear regression analysis between testing rates per 10,000 population and race, controlling for the socioeconomic index of zip codes. We also looked at the trend in testing over the study period stratified by race and socioeconomic index and mapped testing rates in different zip codes in St. Louis city using a Geographic Information System software called Quantum GIS (QGIS). All statistical analyses were performed in R 4.2.0, [25] except mapping, where we used QGIS. Visualization of the COVID-19 testing rate per 10,000 population and race, the socioeconomic index, and the population distribution of the various races in St. Louis city was performed using choropleth maps (color maps). Choropleth maps are widely used because they form a visual representation of a given statistical data[26,27]. In our study, the choropleth maps are used to represent and enhance visual comparison of the COVID-19 testing rate and the socioeconomic index among the selected Zip codes in St. Louis city. In creating choropleth maps, the equal intervals method was employed in the QGIS environment. The COVID-19 testing rate was categorized into five classes, while the SES was categorized into three classes (low, medium, and high).
Results
Overall testing rates in St. Louis were 303.97 per 10,000 population. The Blacks/African Americans and American Indian/Alaskan Natives tested the highest at 374.26 and 360.63 per 10,000, respectively, followed by Whites and Asians who tested at 247.77 and 242.41 per 10,000, respectively. See Table 1.
There was generally a weak association between testing rates and socioeconomic index. Also, race modified the association between testing rates and the socioeconomic index of residential zip codes. Thus, for all the races, testing rates decreased as the socioeconomic index of residential zip codes improved, except for American Indian/Alaskan Natives, whose testing rates increased weakly as the socioeconomic index of zip codes improved. See Figure 2.
For every 10,000 population, tests, compared to the white population, were higher by 168 (1.68%) and 43 (0.43%) among Blacks/African Americans and American Indian/Alaskan Natives, respectively, and lower by 3.3 (0.033%) among Asians when we controlled for residential zip codes’ socioeconomic index. Also, for every 10,000 population, tests decreased by 25 (0.25%) for every unit improvement in the socioeconomic index of the residential zip codes.
For every 10,000 population, tests, compared to the white population, were higher by 168 (1.68%) and 43 (0.43%) among Blacks/African Americans and American Indian/Alaskan Natives, respectively, and lower by 3.3 (0.033%) among Asians when we controlled for residential zip codes’ socioeconomic index. Also, for every 10,000 population, tests decreased by 25 (0.25%) for every unit improvement in the socioeconomic index of the residential zip codes. See Table 2.
Residential zip codes in the inner core of St. Louis city generally had higher testing rates regardless of their socioeconomic index. In contrast, the zip codes in the periphery of St. Louis city had lower testing rates independent of their socioeconomic index. See Figure 3.
Racial population distribution had less influence on the testing rates in St. Louis City, as the zip codes with predominantly black or white populations in the inner core of St. Louis city had higher testing rates, whereas the zip codes in the periphery of St. Louis city with predominantly black or white populations had lower testing rates. See Figure 4.
Largely, zip codes with predominantly white populations in St. Louis city were of the higher socioeconomic index, whereas those with mostly black populations were of the lower socioeconomic index. See Figure 5.
There was generally an increase in testing rates over the study period. Testing rates were highest among American Indian/Alaskan Natives in March, June, July, August, September, and November but highest among Asians in May and October. The testing rates among Asians in May and October were the highest recorded peaks over the study period. There were also no testing rates for American Indian/Alaskan Natives in April and May. Overall, testing rates were higher among all the races in October. See Figure 6.
The testing rates were generally higher in the low and middle socioeconomic index residential zip codes and less in the high socioeconomic index zip codes. Among Asians, testing rates were highest in May and October in the lower socioeconomic index zip codes, whereas among American Indian/Alaskan Natives, testing rates were highest in the middle socioeconomic zip codes compared to the testing rates among other races. See Figure 7.
Discussion
Our study found that, mainly, racial minorities and, generally, populations in the lower socioeconomic index tested more than those in the higher socioeconomic index. This might be because low-income households and racial minorities are likely to live in larger household sizes, with an increased likelihood of living in overcrowded homes with shared facilities or communal areas,[28,29] reducing the opportunity to isolate in case of COVID-19 exposure. This, coupled with the fact that people living in the lower SES and racial minorities mostly work as essential workers and therefore could not work remotely, leaving them extensively exposed to the COVID-19 pandemic,[30,31,32,33] could be the potential reasons for the increased testing at the poorest SES.
Additionally, the deliberate and concerted efforts made by the St. Louis City Department of Health (DOH) to establish testing sites in socioeconomically deprived areas of the city, targeting those at the lower end of the SES who were at higher risk of contracting or spreading COVID-19 to address equity in response to COVID-19 [14] and received national recognition for these deliberate policy decisions[15], could be another potential reason for the elimination of significant testing disparity between the racial minority groups and the majority white population in the St. Louis city. This also shows that policy decisions anchored in equity at the local, state, or federal level can positively mitigate a public health emergency such as the COVID-19 pandemic. Also, our result of blacks testing more than whites is compatible with a previous study by Rentsch and colleagues, which found that Blacks were more likely to be tested for COVID-19 than whites or the Hispanic/Latino population [36].
However, our study results differed from Brandt, Katerina et al., 2021, which found a significant disparity in access to testing in North Carolina, with the distribution or access to COVID-19 testing not evenly distributed across racial-ethnic groups, especially in the Latinx, Non-Latinx Black and other historically marginalized population [37]. This proves that public health policies and interventions are different across the US, and therefore different geographical locations in the US are more likely to respond differently to pandemics and thus achieve different public health outcomes/goals. It will be helpful if the successful interventions by the St. Louis City Health Department for eliminating the disparity of COVID-19 testing rates among racial groups could be adopted and implemented nationally in future pandemics, especially in areas where there was a significant disparity in testing rates among racial minority groups and the white populations.
The increase in testing rates over the study period might be due to the rise in the prevalence of COVID-19 cases and the availability of testing kits over time. Also, the peaks of testing rates around October might be due to family members testing ahead of a popular social gathering of Americans for Thanksgiving.
In the geographical mapping, it is evident that areas with poorer testing rates were located at the periphery of St. Louis, whereas the city’s inner core had the highest testing rates. This clustering of areas of higher and lower testing rates had no association with SES or racial population distributions. Therefore, it would be interesting to investigate other additional characteristics that account for this geographical location disparity in testing rates in St. Louis city. Also, clustering areas with high and low testing can be helpful for targeted interventions to increase testing in the St. Louis area.
Limitations
Our results may not be generalizable as we only used data from St. Louis City. Also, our results should be interpreted cautiously to avoid ecological fallacy, given that this was an ecological study where we did not account for individual-level factors such as comorbidity, religious and socio-political affiliations, etc. Furthermore, other studies are needed to understand how individual-level and geographical characteristics contribute to the testing patterns in the St Louis area. Additionally, in the early days of the pandemic, demographic data such as race was poorly collected, which could also impact our findings.
Another important limitation of our study is that we could not look at the testing rates of the Hispanic/Latino race in St. Louis city- this was because the testing data we had access to had aggregated the smaller racial populations in St. Louis city as “other.” It will be necessary for other studies in the Midwestern regions to consider this level of race category and its association with COVID-19 testing rates, especially given the overwhelming burden of COVID-19 morbidity and mortality among the Hispanics/Latino race in the US [38,39,40,41].
Lastly, the population sizes extracted for the estimation of our testing rates were that of 2022. The population size at each zip code in 2020 may likely vary from what we used for our analysis. Therefore, our testing rates are only a rough estimate of the COVID-19 testing rates during 2020. Also, we could not access the population sizes for our study from the US census bureau due to the granular nature of our research. Thus, some of our racial population sizes were likely to be below the threshold that the US census bureau could share their data.
Conclusion
Race, socioeconomic index, and geographical location can influence COVID-19 testing rates. Therefore, these factors need to be considered in policymaking to increase testing rates. This study also shows areas in the St Louis region where testing was poorly accessed and can be used to increase access to testing in the areas that desperately need it.
References
- WHO Coronavirus (COVID-19) Dashboard. Accessed March 6, 2021. https://covid19.who.int.
- COVID-19 Map. Johns Hopkins Coronavirus Resource Center. Accessed October 29, 2020. https://coronavirus.jhu.edu/map.html.
- CDC. COVID Data Tracker. Centers for Disease Control and Prevention. Published March 28, 2020. Accessed March 6, 2021. https://covid.cdc.gov/covid-data-tracker.
- Tai DBG, Shah A, Doubeni CA, Sia IG, Wieland ML. The Disproportionate Impact of COVID-19 on Racial and Ethnic Minorities in the United States. Clinical Infectious Diseases. 2021; 72(4):703-706. [CrossRef]
- Sze S, Pan D, Nevill CR, et al. Ethnicity and clinical outcomes in COVID-19 : A systematic review and meta-analysis. EClinicalMedicine. 2020;29. [CrossRef]
- CDC. Cases, Data, and Surveillance. Centers for Disease Control and Prevention. Published February 11, 2020. Accessed March 6, 2021. https://www.cdc.gov/coronavirus/2019-ncov/covid-data/investigations-discovery/hospitalization-death-by-race-ethnicity.html.
- The Lost Month: How a Failure to Test Blinded the U.S. to Covid-19. Aggressive screening might have helped contain the coronavirus in the United States. But technical flaws, regulatory hurdles and lapses in leadership let it spread undetected for weeks. New York Times. https://www.nytimes.com/2020/03/28/us/testing-coronavirus pandemic.html extracted 11/7/2022.
- Analysis of Cancer Incidence Data in Eight Zip codes around Coldwater Creek 1996-2011. Accessed February 4, 2021. https://health.mo.gov/living/healthcondiseases/chronic/cancer/pdf/ccanalysisSept2014. pdf.
- Farley JE. Black-White Housing Segregation in the City of St. Louis: A 1988 Update. Urban Affairs Quarterly. 1991; 26(3):442-450. [CrossRef]
- The COVID Racial Data Tracker. The COVID Tracking Project. Accessed October 28, 2020. https://covidtracking.com/race.
- https://usafacts.org/data/topics/people-society/population-and-demographics/our-changing-population/state/missouri/county/st-louis-city?endDate=2021-01-01&startDate=2010-01-01.
- Logan JR, Stults BJ. (2011). The persistence of segregation in the metropolis: New findings from the 2010 Census. Retrieved from: http://www.s4.brown.edu/us2010/Data/Report/report2.pdf.
- https://www.bbc.com/news/ay/magazine-17361995.
- Chromeextension://efaidnbmnnnibpcajpcglclefindmkaj/https://forthesakeofall.files.wordpress.com/2013/11/policy-brief-4.pdf.
- Block JP, Scribner RA, DeSalvo KB. (2004). Fast food, race/ethnicity, and income: A geographic analysis. Am J Prev Med. 27(3):211-217. [CrossRef]
- University of Michigan. Economic consequences of segregation. Retrieved from: http://www.umich.edu/~lawrace/consequences.htm.
- Acevedo-Garcia D, Lochner KA, Osypuk TL, Subramanian S V. (2003). Future directions in residential segregation and health research: A multilevel approach. Am. J. Public Health. 93(2):215. [CrossRef]
- Goodman MS, Gaskin DJ, Si X, Stafford JD, Lachance C, Kaphingst KA. (2012). Self-reported segregation experience throughout the life course and its association with adequate health literacy. Heal. Place. 18(5):1115–1121. 9. [CrossRef]
- Kaphingst KA, Goodman M, Pyke O, Stafford J, Lachance C. (2012). Relationship between self-reported racial composition of high school and health literacy among community health center patients. Heal. Educ Behav. 39(1):35–44. [CrossRef]
- https://medicine.wustl.edu/news/early-covid-19-shutdowns-helped-st-louis-area-avoid-thousands-of-deaths/.
- https://www.ksdk.com/article/news/health/coronavirus/st-louis-county-coronavirus-timeline-travel-quarantine/63-f81d92d8-dd20-4557-a487-101ce826418f.
- https://www.stlouis-mo.gov/government/departments/health/news/first-death-related-covid-19-city-of-st-louis.cfm.
- https://www.stlouis-mo.gov/covid-19/data/.
- https://exploremohealth.org/reports/zip-health-report/.
- R Core Team (2022). R: A language and environment for statistical computing. R Foundation for Statistical Computing, Vienna, Austria. URL https://www.R-project.org/.
- Palsky, G. (2008). Connections and exchanges in European thematic cartography . The case of 19th century choropleth maps. May 2013, 3–4. https://doi.org/10.4000/belgeo.11893.
- Al-ghamdi, A. (2014). Optimising the Selection of a Number of Choropleth Map Classes. June 2014. https://doi.org/10.1007/978-3-319-08180-9.
- Martin C.A., Jenkins D.R., Minhas J.S. Socio-demographic heterogeneity in the prevalence of COVID-19 during lockdown is associated with ethnicity and household size: results from an observational cohort study. EClinicalMedicine. 2020;25 [PMC free article] [PubMed] [Google Scholar]. [CrossRef]
- Jing Q.-.L., Liu M.-.J., Zhang Z.-.B. Household secondary attack rate of COVID-19 and associated determinants in Guangzhou, China: a retrospective cohort study. Lancet Infect Dis. 2020;3099:1–10. [PMC free article] [PubMed] [Google Scholar]. [CrossRef]
- Hawkins D. Differential occupational risk for COVID-19 and other infection exposure according to race and ethnicity. Am J Ind Med. 2020;63:817–820. [PMC free article] [PubMed] [Google Scholar]. [CrossRef]
- McClure, E.S., Vasudevan, P., Bailey, Z., et al., 2020. Racial capitalism within public health: how occupational settings drive COVID-19 disparities. Am. J. Epidemiol. [CrossRef]
- Using race- and age-specific COVID-19 case data to investigate the determinants of the excess COVID-19 mortality burden among Hispanic Americans By D. Phuong (Phoenix) Do, Reanne Frank.
- COVID-19 and Essential Workers: A Narrative Review of Health Outcomes and Moral Injury Joanna Gaitens, Marian Condon, Eseosa Fernandes, Melissa McDiarmid PMID: 33557075.
- https://www.stlouis-mo.gov/government/departments/health/communicable-disease/COVID-19 /documents/upload/COVID-19 -One-Year-Report-City-of-St-Louis.pdf.
- Post-Dispatch Article:https://www.stltoday.com/lifestyles/health-med-fit/coronavirus/what-s-working-in-public-health-cdc-director-finds-reason-for-hope-in-st-louis/article_9ae68eba-4fe8-55d6-be7a-1e7ee44f7bee.html.
- Rentsch, C. T., Kidwai-Khan, F., Tate, J. P., Park, L. S., King Jr, J. T., Skanderson, M., & Justice, A. C. (2020). Patterns of COVID-19 testing and mortality by race and ethnicity among United States veterans: A nationwide cohort study. PLoS medicine, 17(9),e1003379. [CrossRef]
- Brandt, Katerina, et al. “SARS-CoV-2 testing in North Carolina: Racial, ethnic, and geographic disparities.” Health & place 69 (2021): 102576. [CrossRef]
- Understanding and Addressing Latinx COVID-19 Disparities in Washington State Barbara Baquero, Carmen Gonzalez, Magaly Ramirez, Erica Chavez Santos, India J Ornelas. PMID: 33148042 PMCID: PMC7935426 . [CrossRef]
- Using race- and age-specific COVID-19 case data to investigate the determinants of the excess COVID-19 mortality burden among Hispanic Americans By D. Phuong (Phoenix) Do, Reanne Frank.
- COVID-19 Pandemic: Disparate Health Impact on the Hispanic/Latinx Population in the United States Raul Macias Gil, Jasmine R Marcelin, Brenda Zuniga-Blanco, Carina Marquez, Trini Mathew, Damani A Piggott. PMID: 32729903 PMCID: PMC7454709 . [CrossRef]
- New York Fatalities COVID-19 by Race/Ethnicity. New York Department of Health. https://www1.nyc.gov/assets/doh/downloads/pdf/imm/covid-19-deaths-race-ethnicity-05142020-1.pdf. Published 2020. Accessed 11/7/2022.
Figure 1.
Study Attrition Diagram showing our inclusion and exclusion criteria.
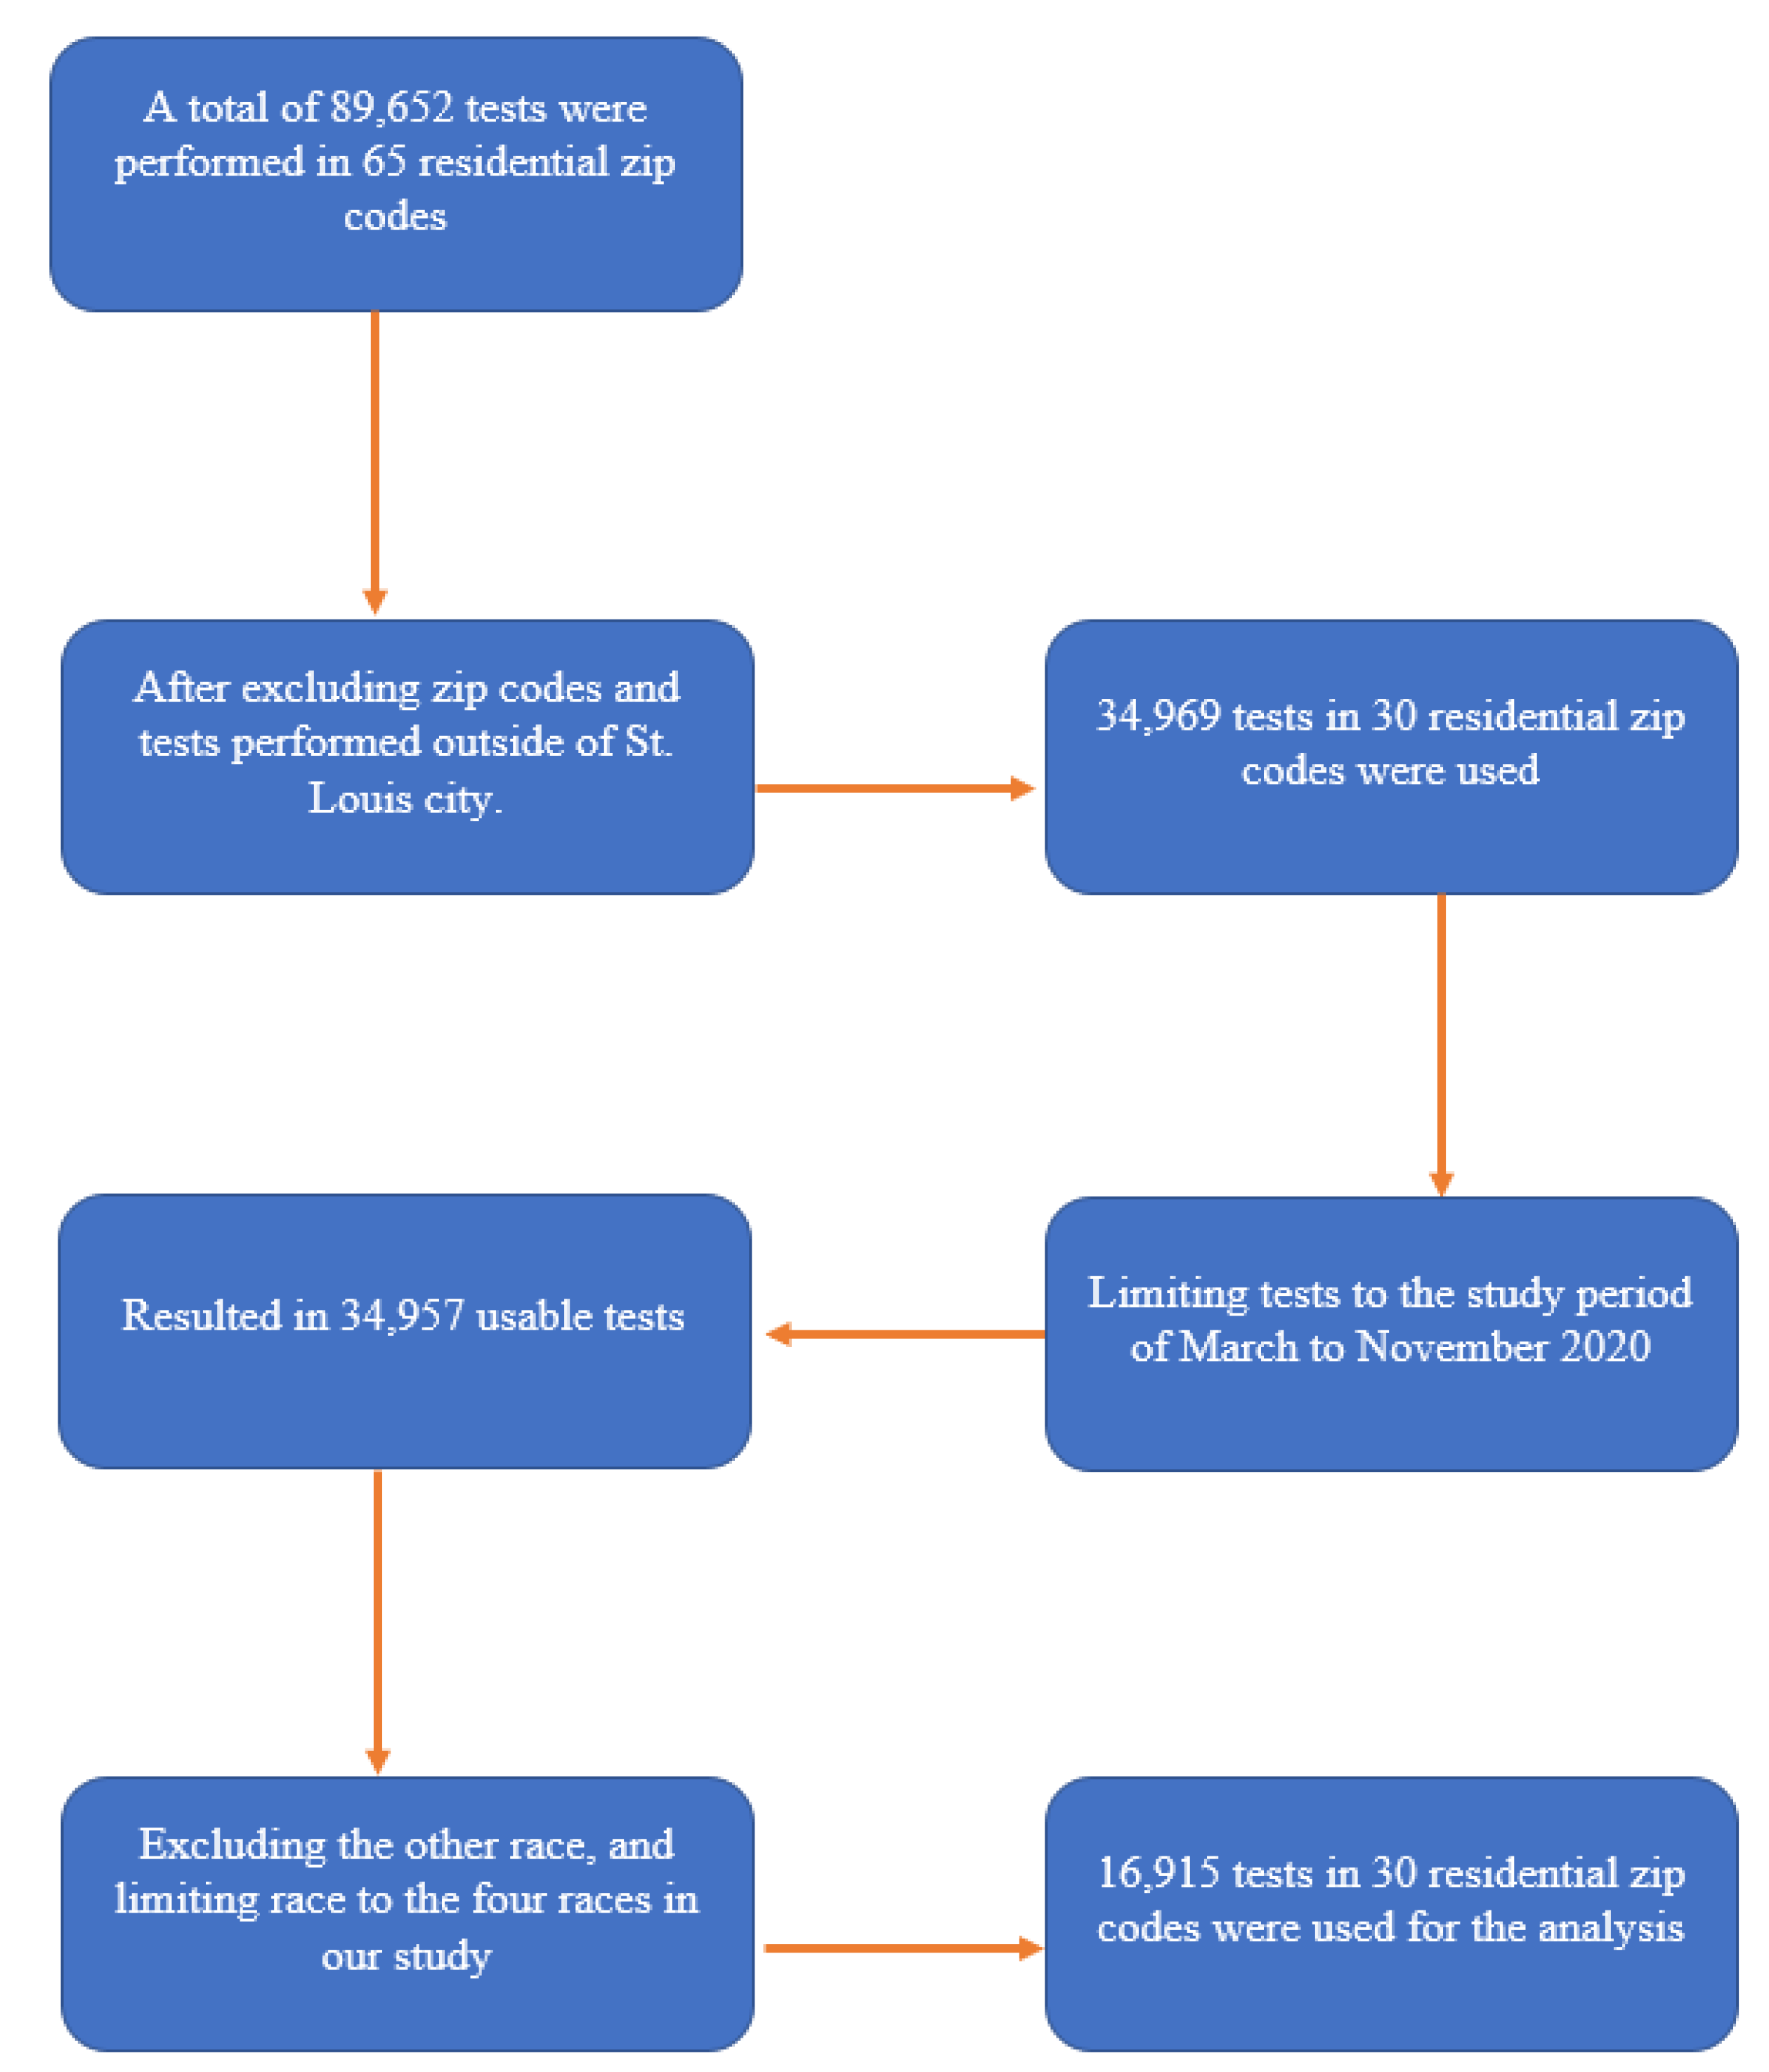
Figure 2.
Pearson Correlation between Testing Rates and Socioeconomic Index of zip codes stratified by Race.
Figure 2.
Pearson Correlation between Testing Rates and Socioeconomic Index of zip codes stratified by Race.
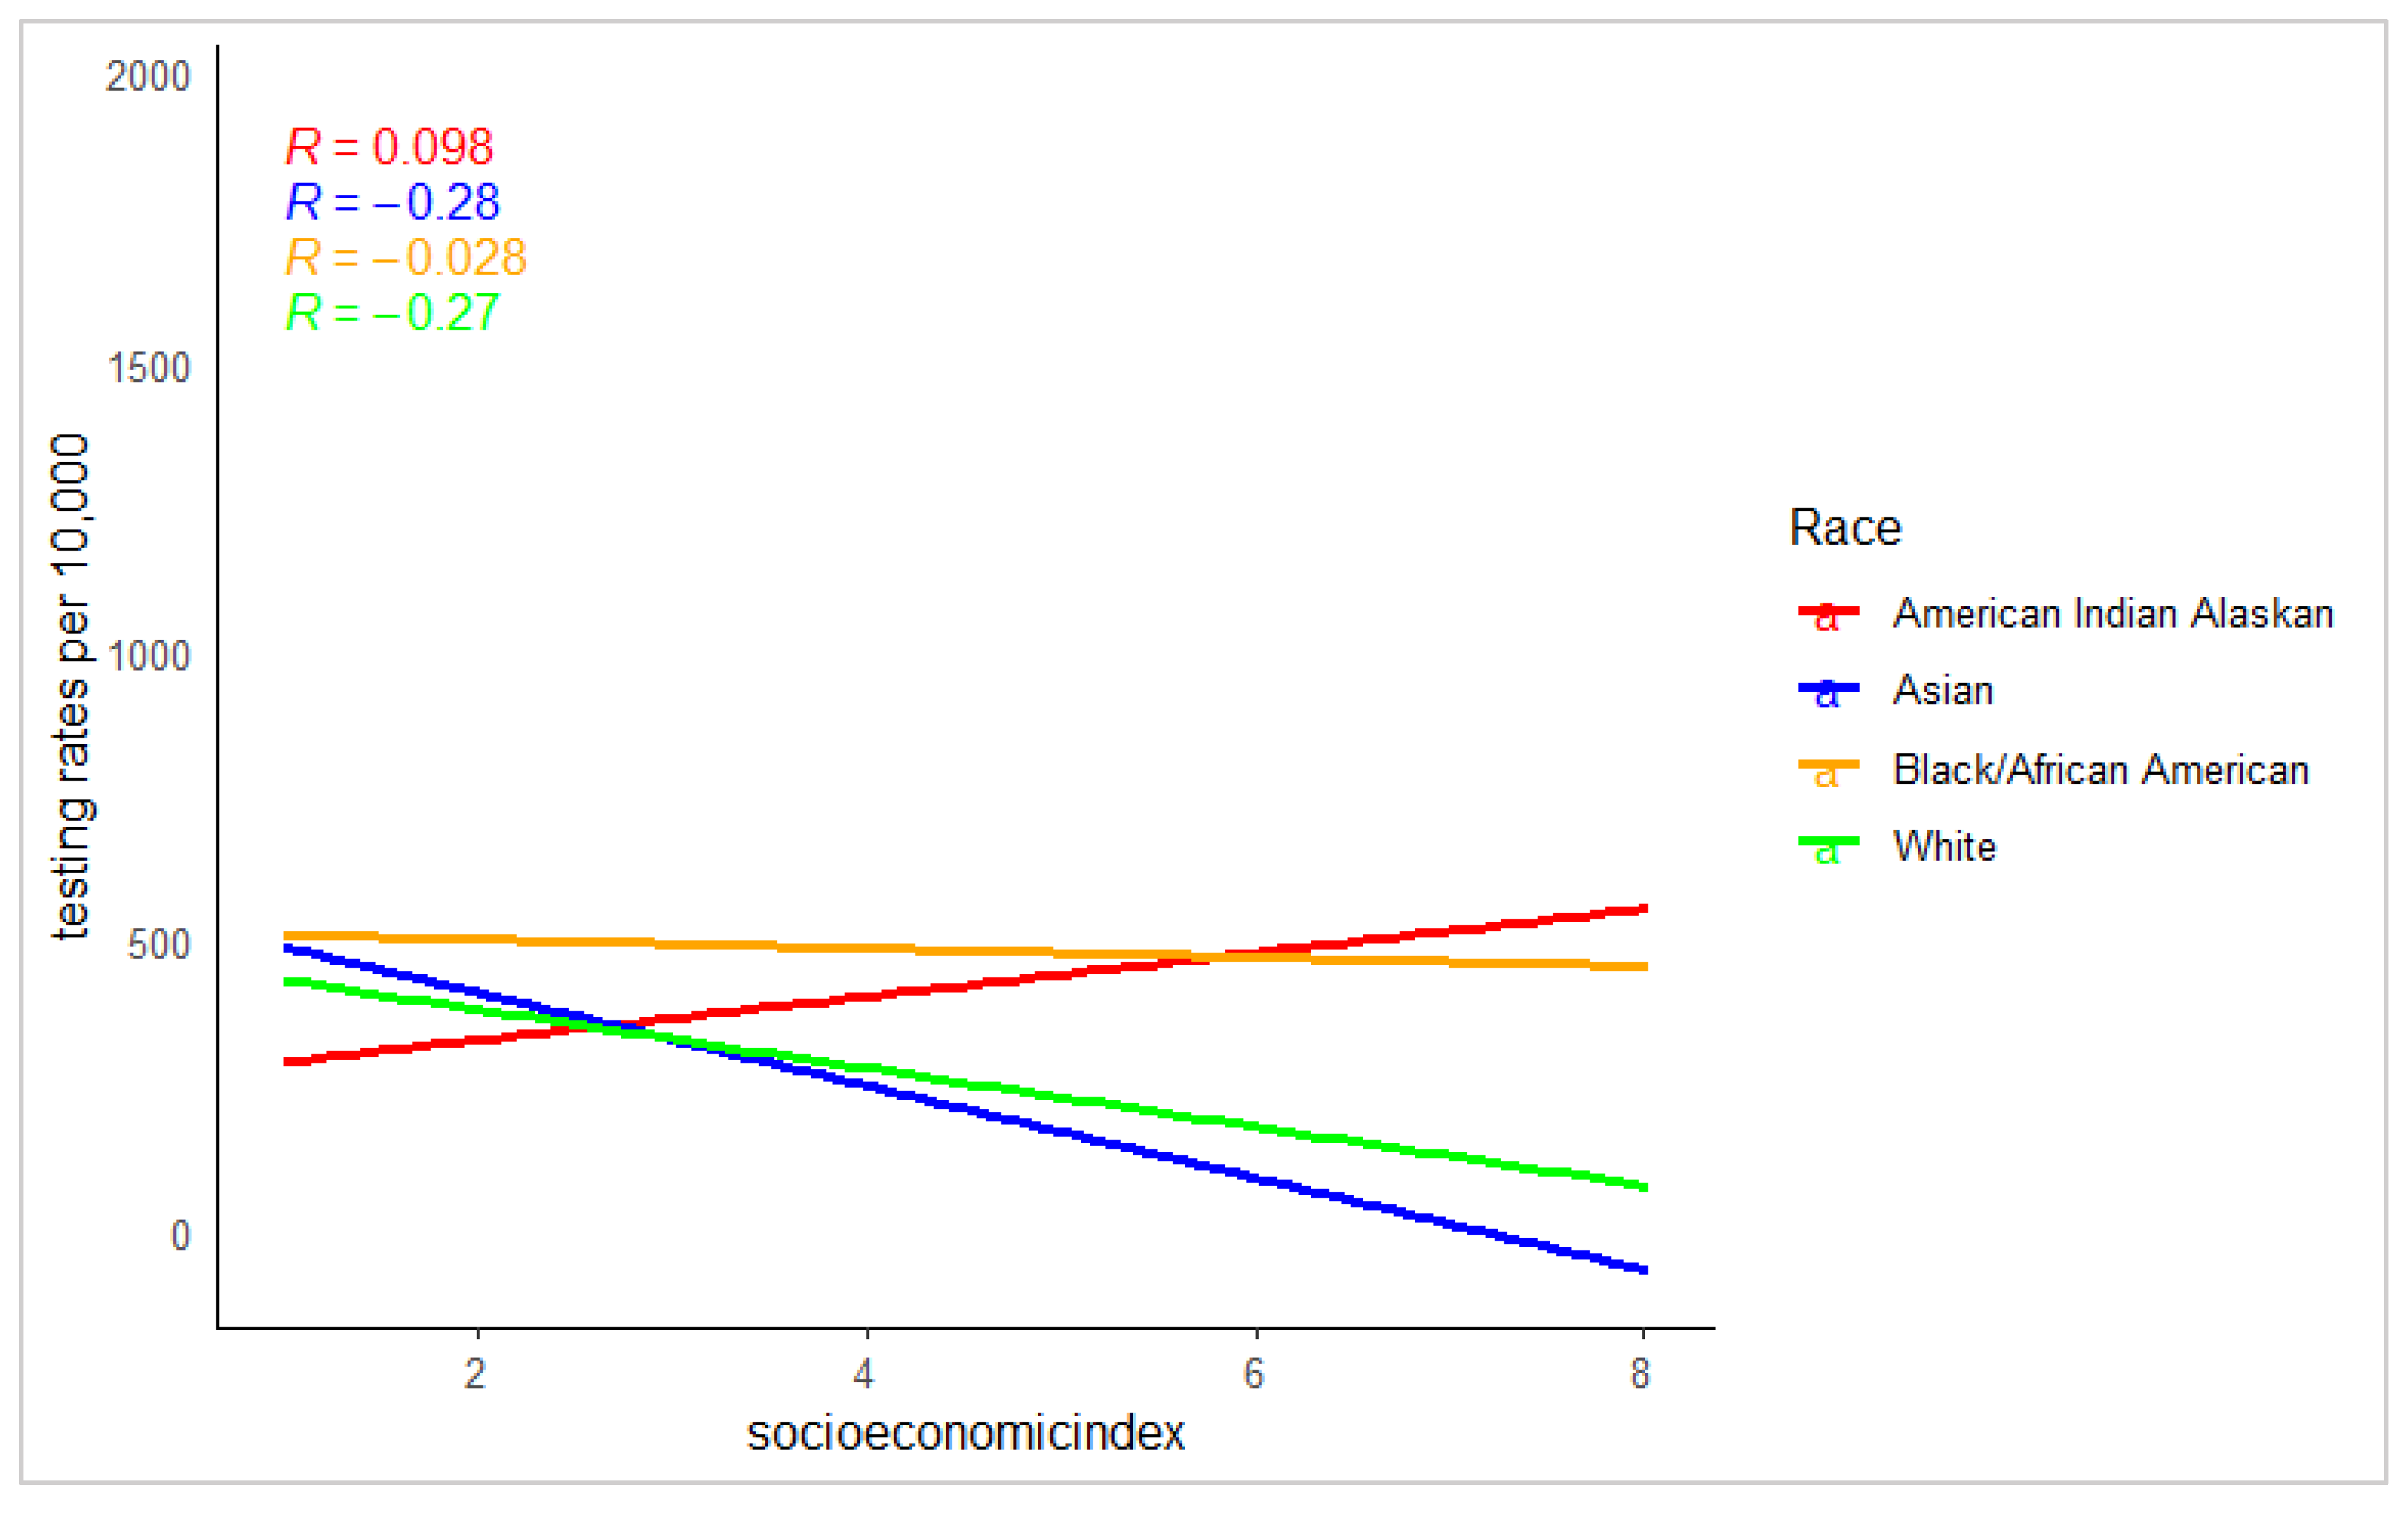
Figure 3.
Map showing the COVID-19 testing rates and the socioeconomic index of St. Louis City in the USA.
Figure 3.
Map showing the COVID-19 testing rates and the socioeconomic index of St. Louis City in the USA.
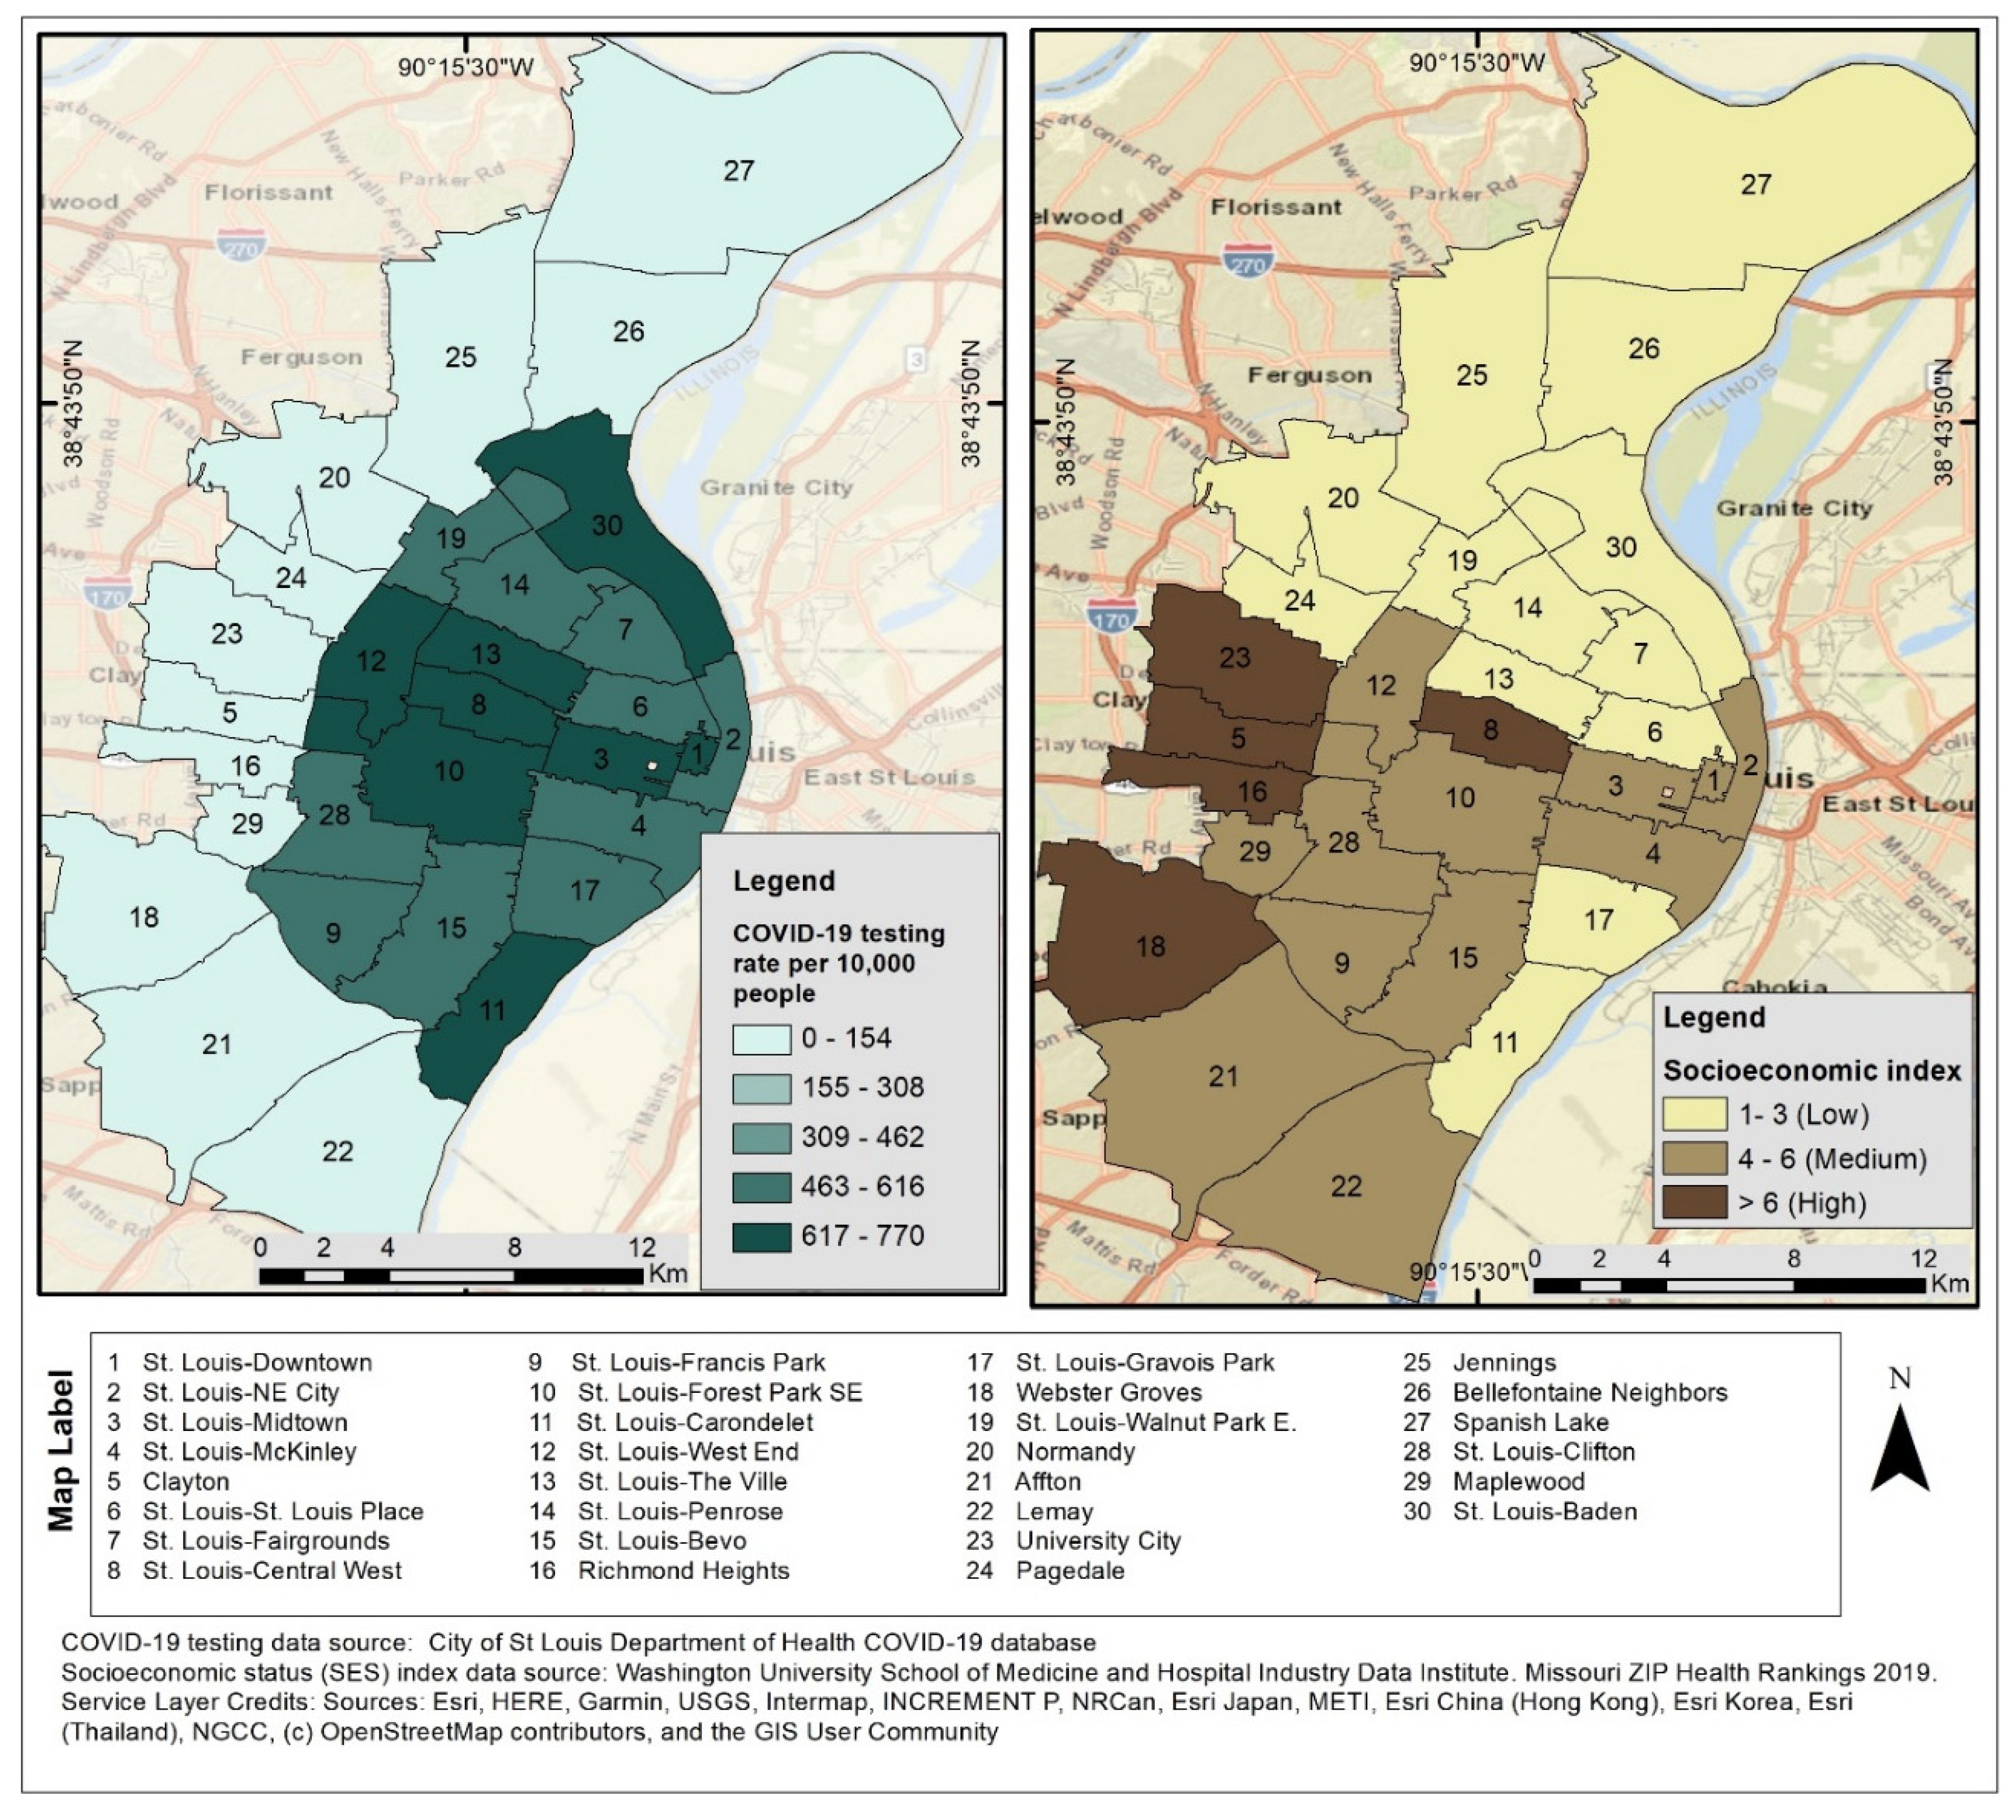
Figure 4.
Map showing the Distribution of Racial Population over COVID-19 Testing Rates in the St. Louis City in the USA.
Figure 4.
Map showing the Distribution of Racial Population over COVID-19 Testing Rates in the St. Louis City in the USA.
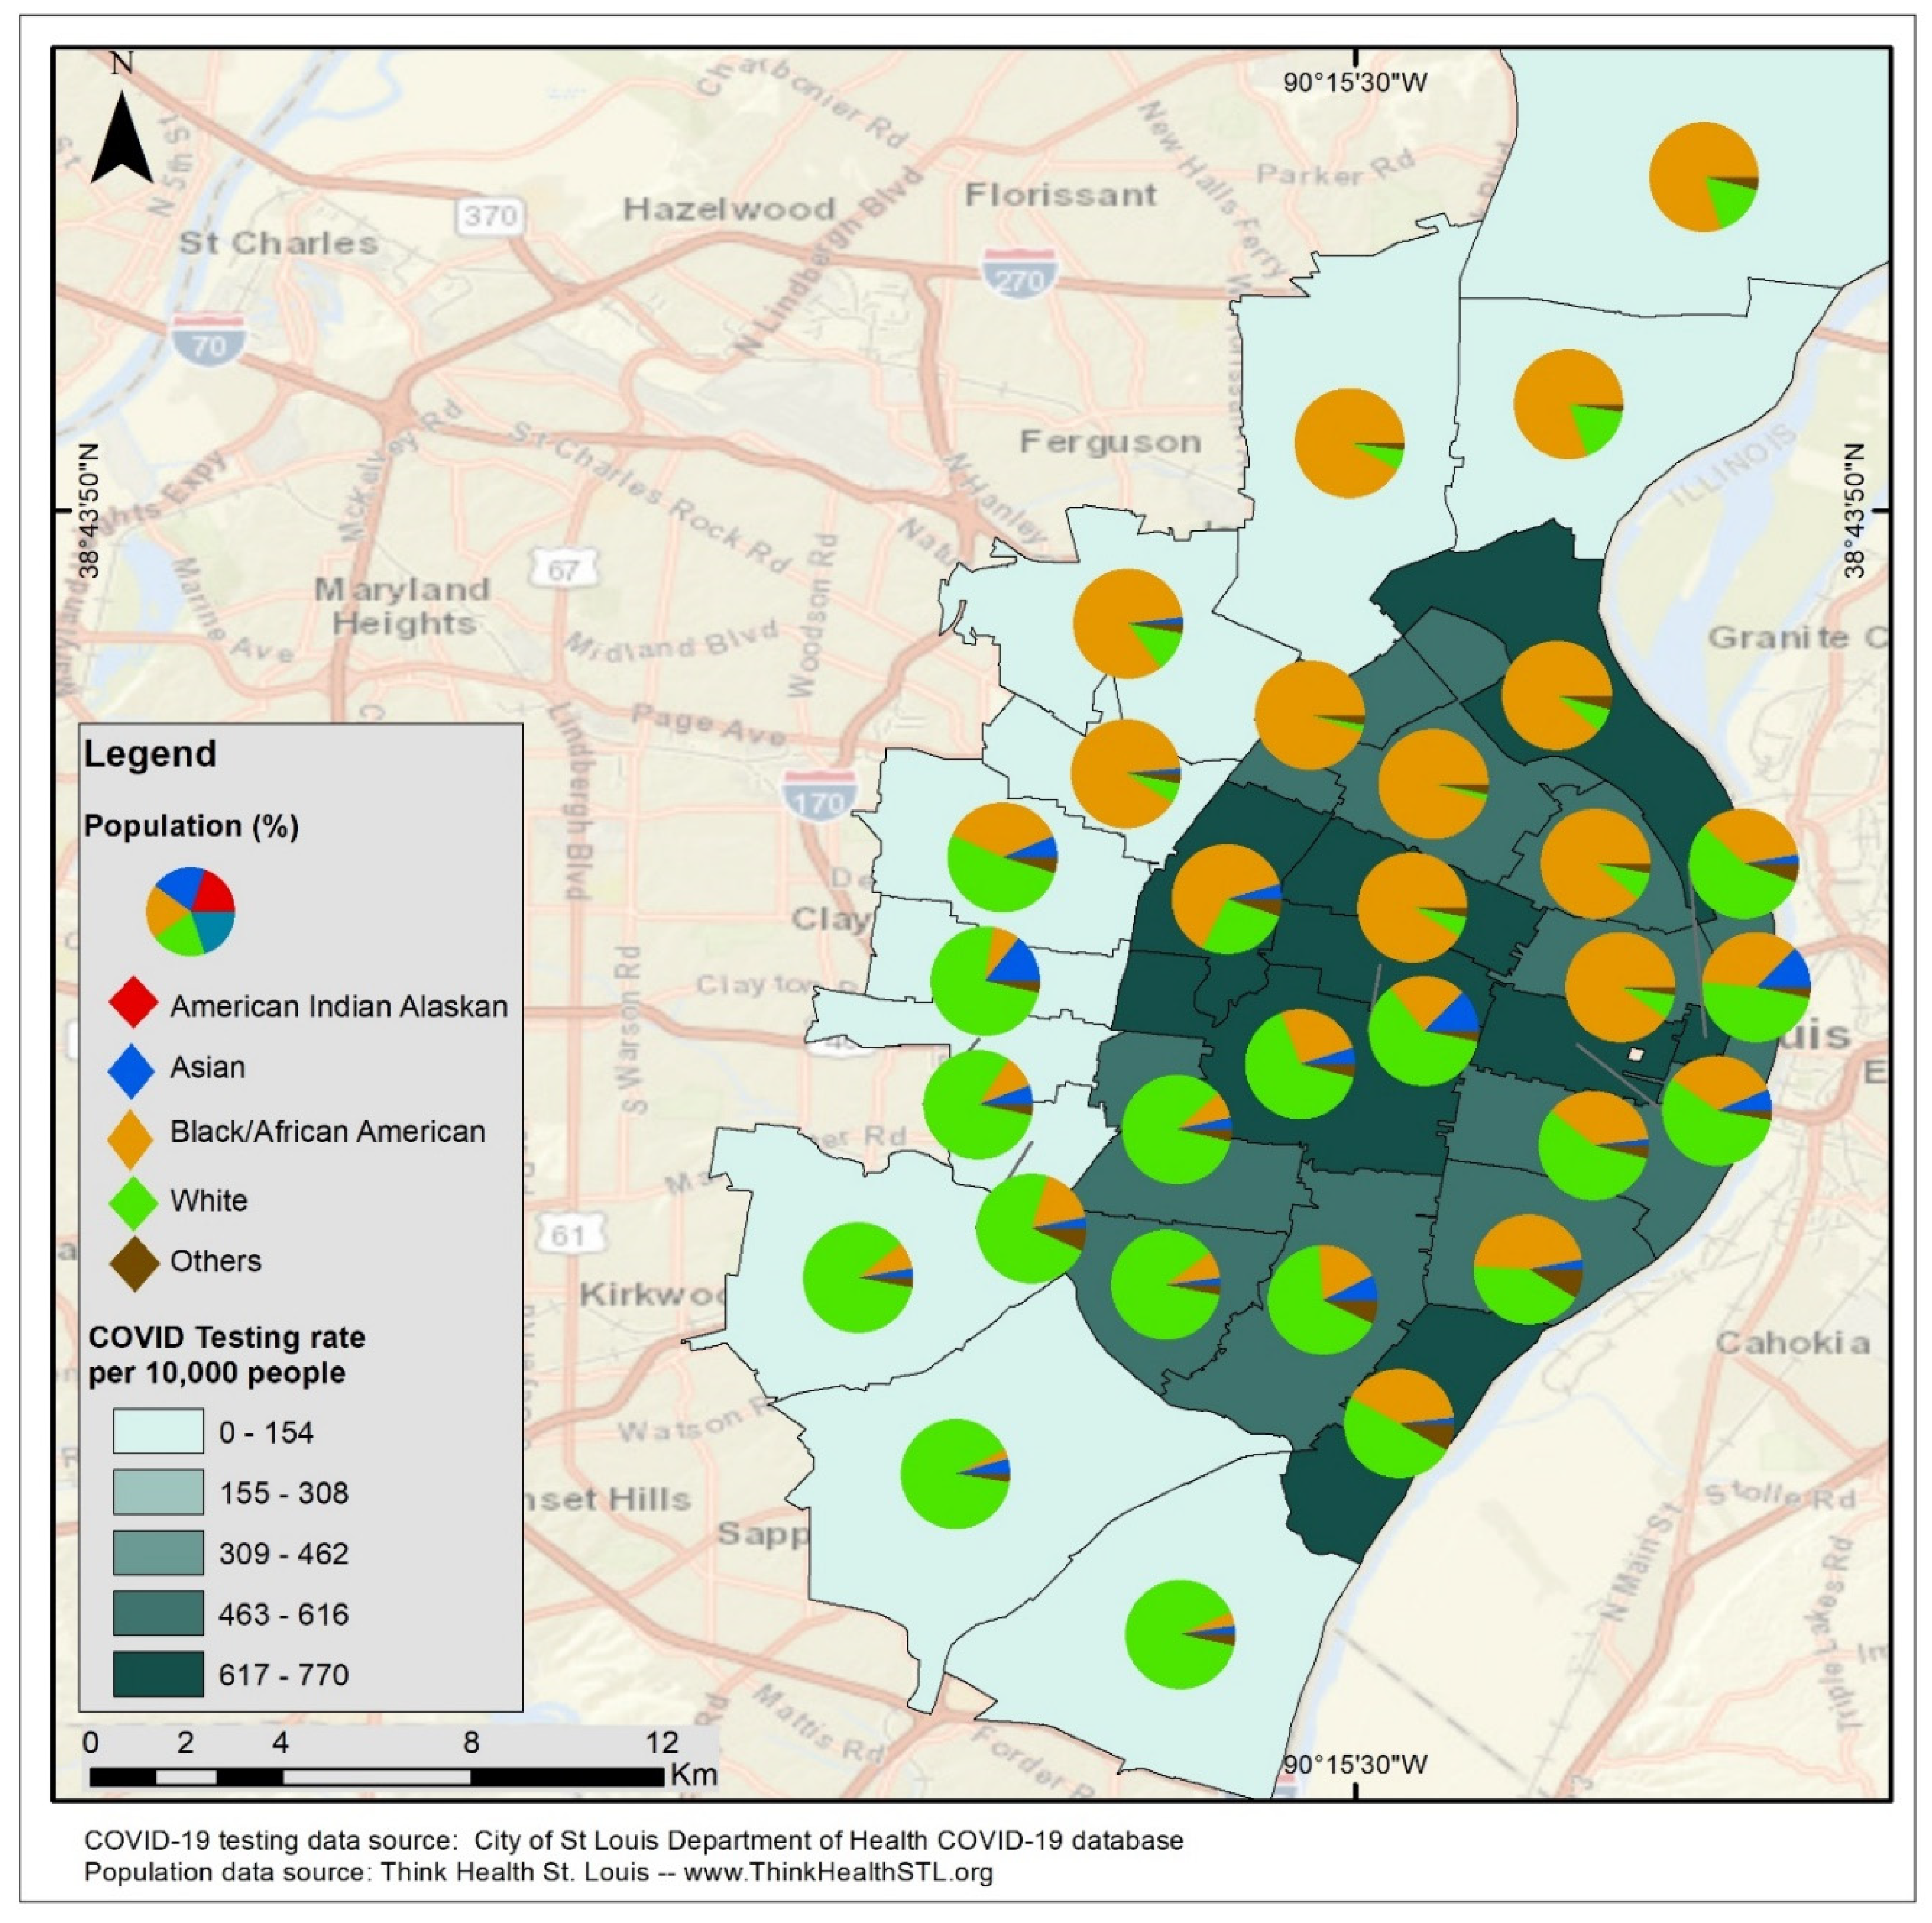
Figure 5.
Map showing the Distribution of Racial Population over Socioeconomic Index of the St. Louis City in the USA.
Figure 5.
Map showing the Distribution of Racial Population over Socioeconomic Index of the St. Louis City in the USA.
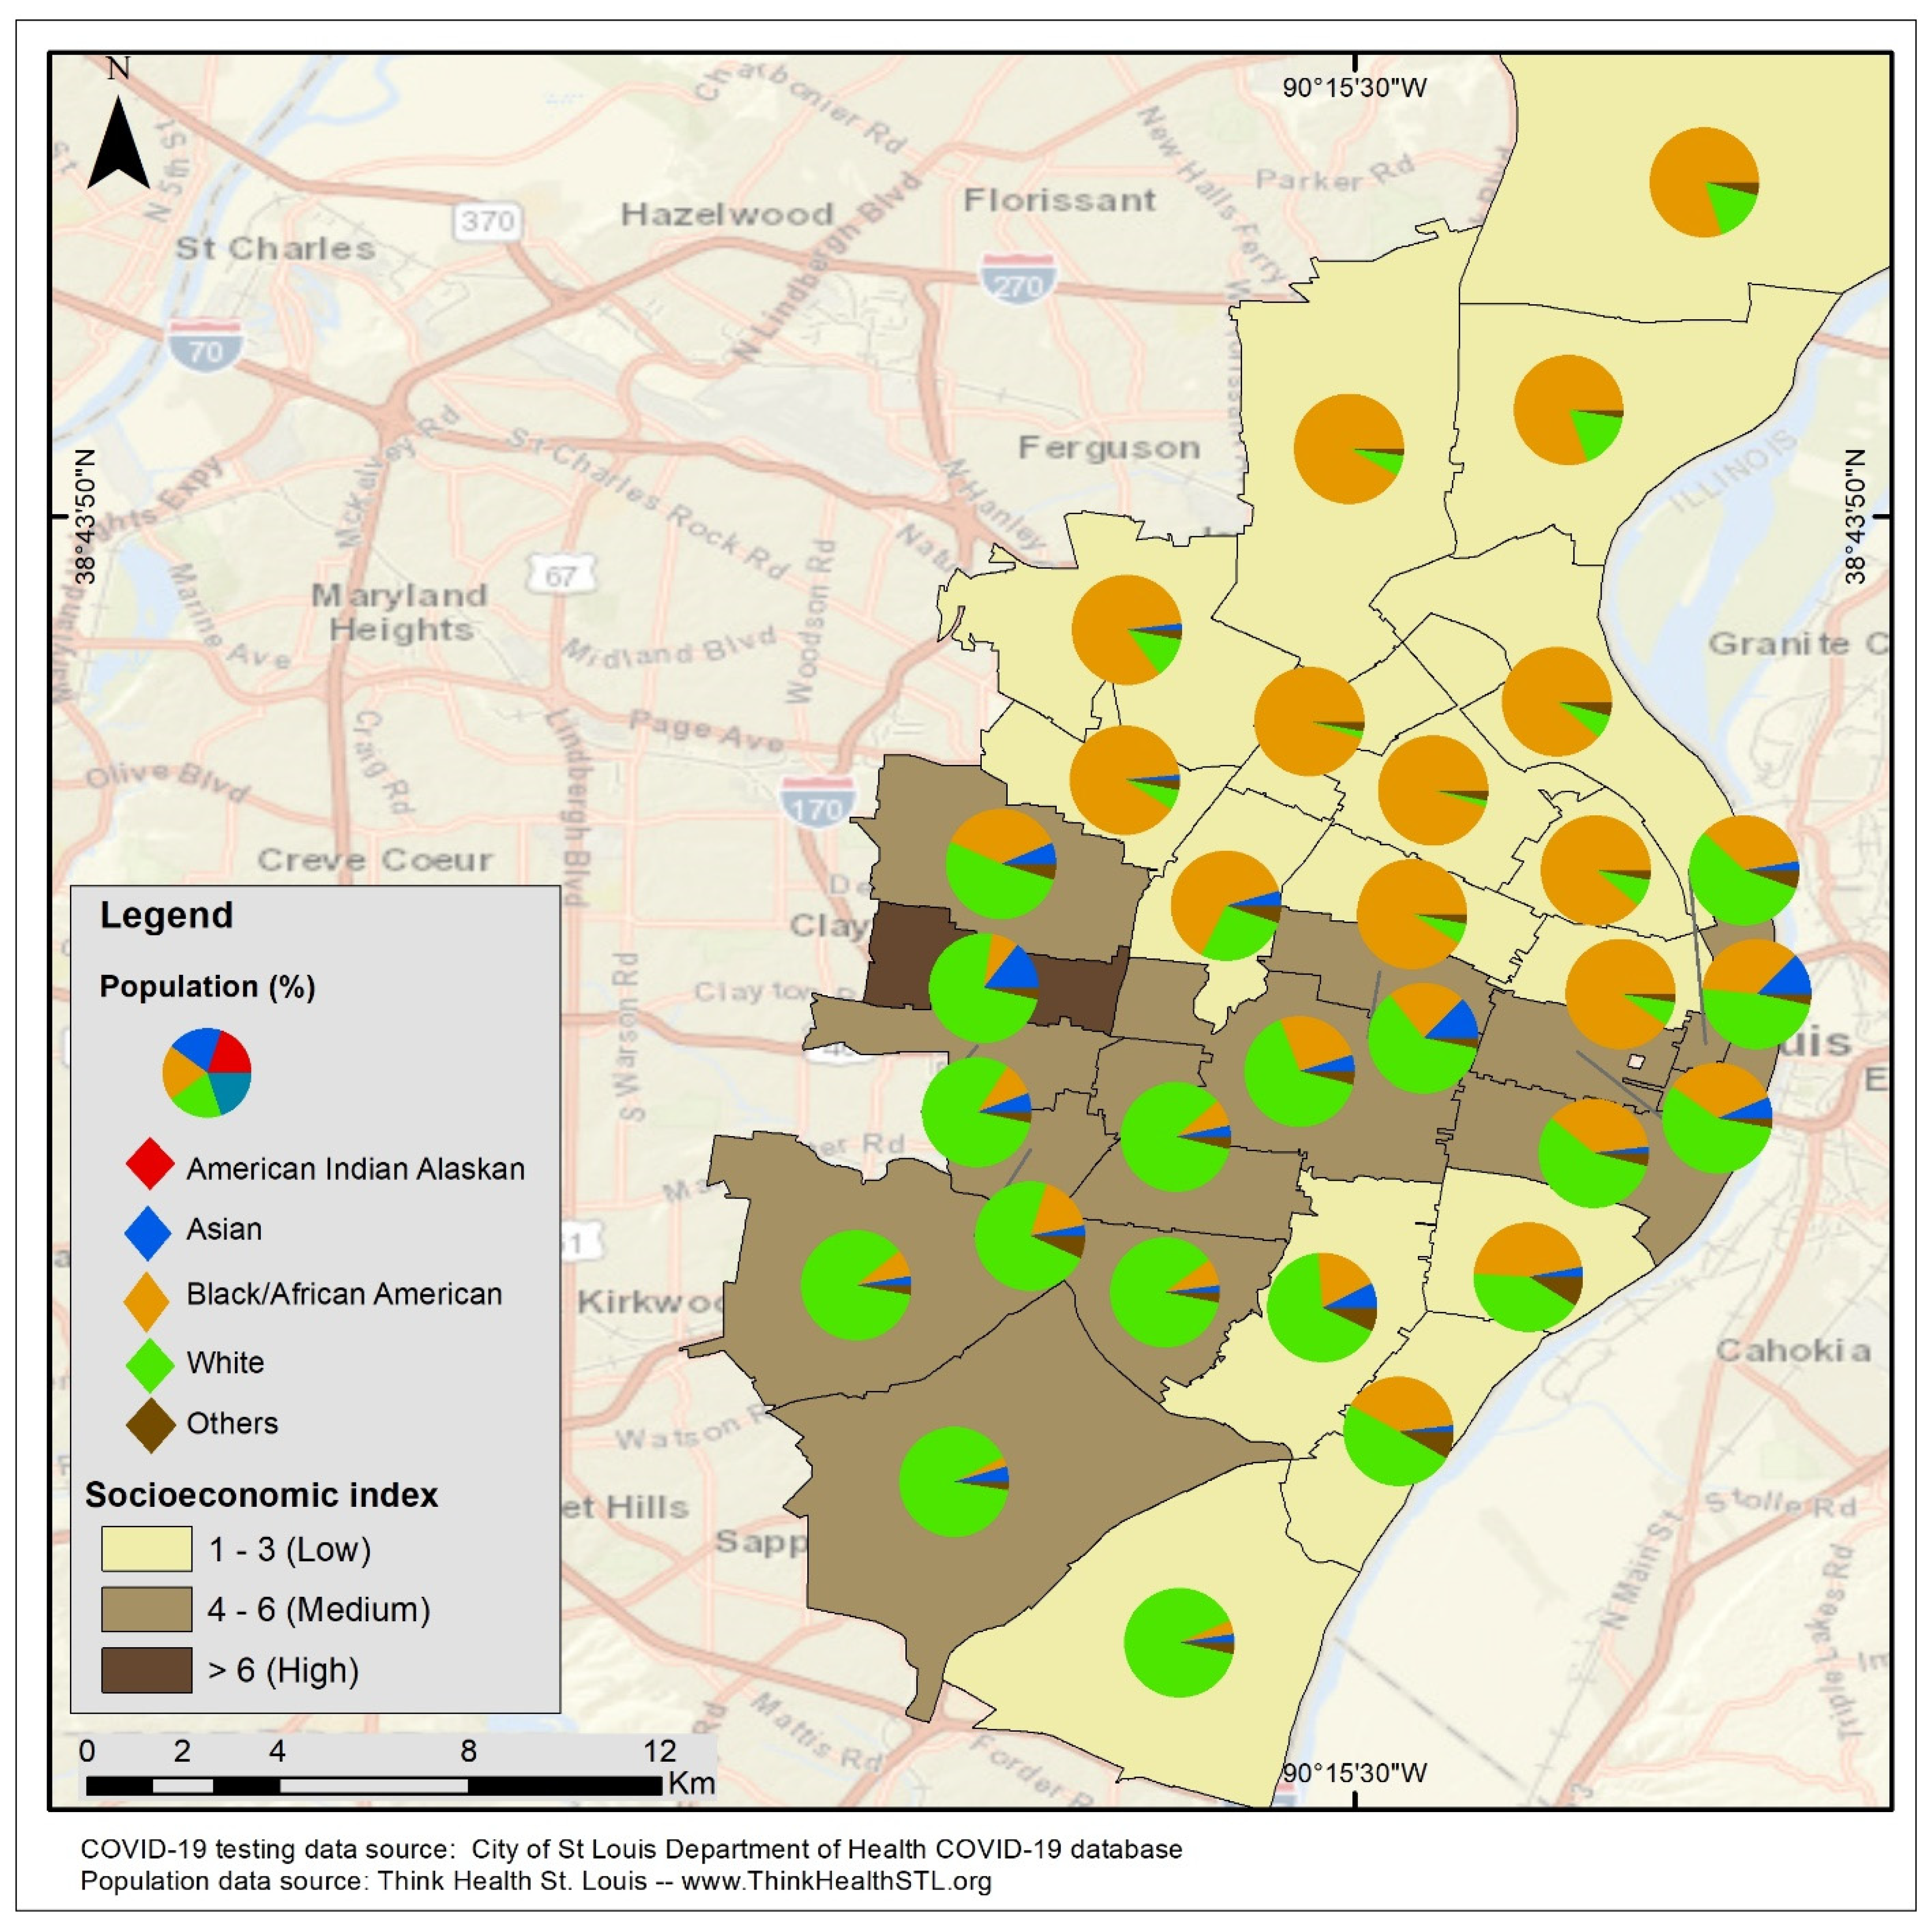
Figure 6.
Trend in Testing Rates Over Time.
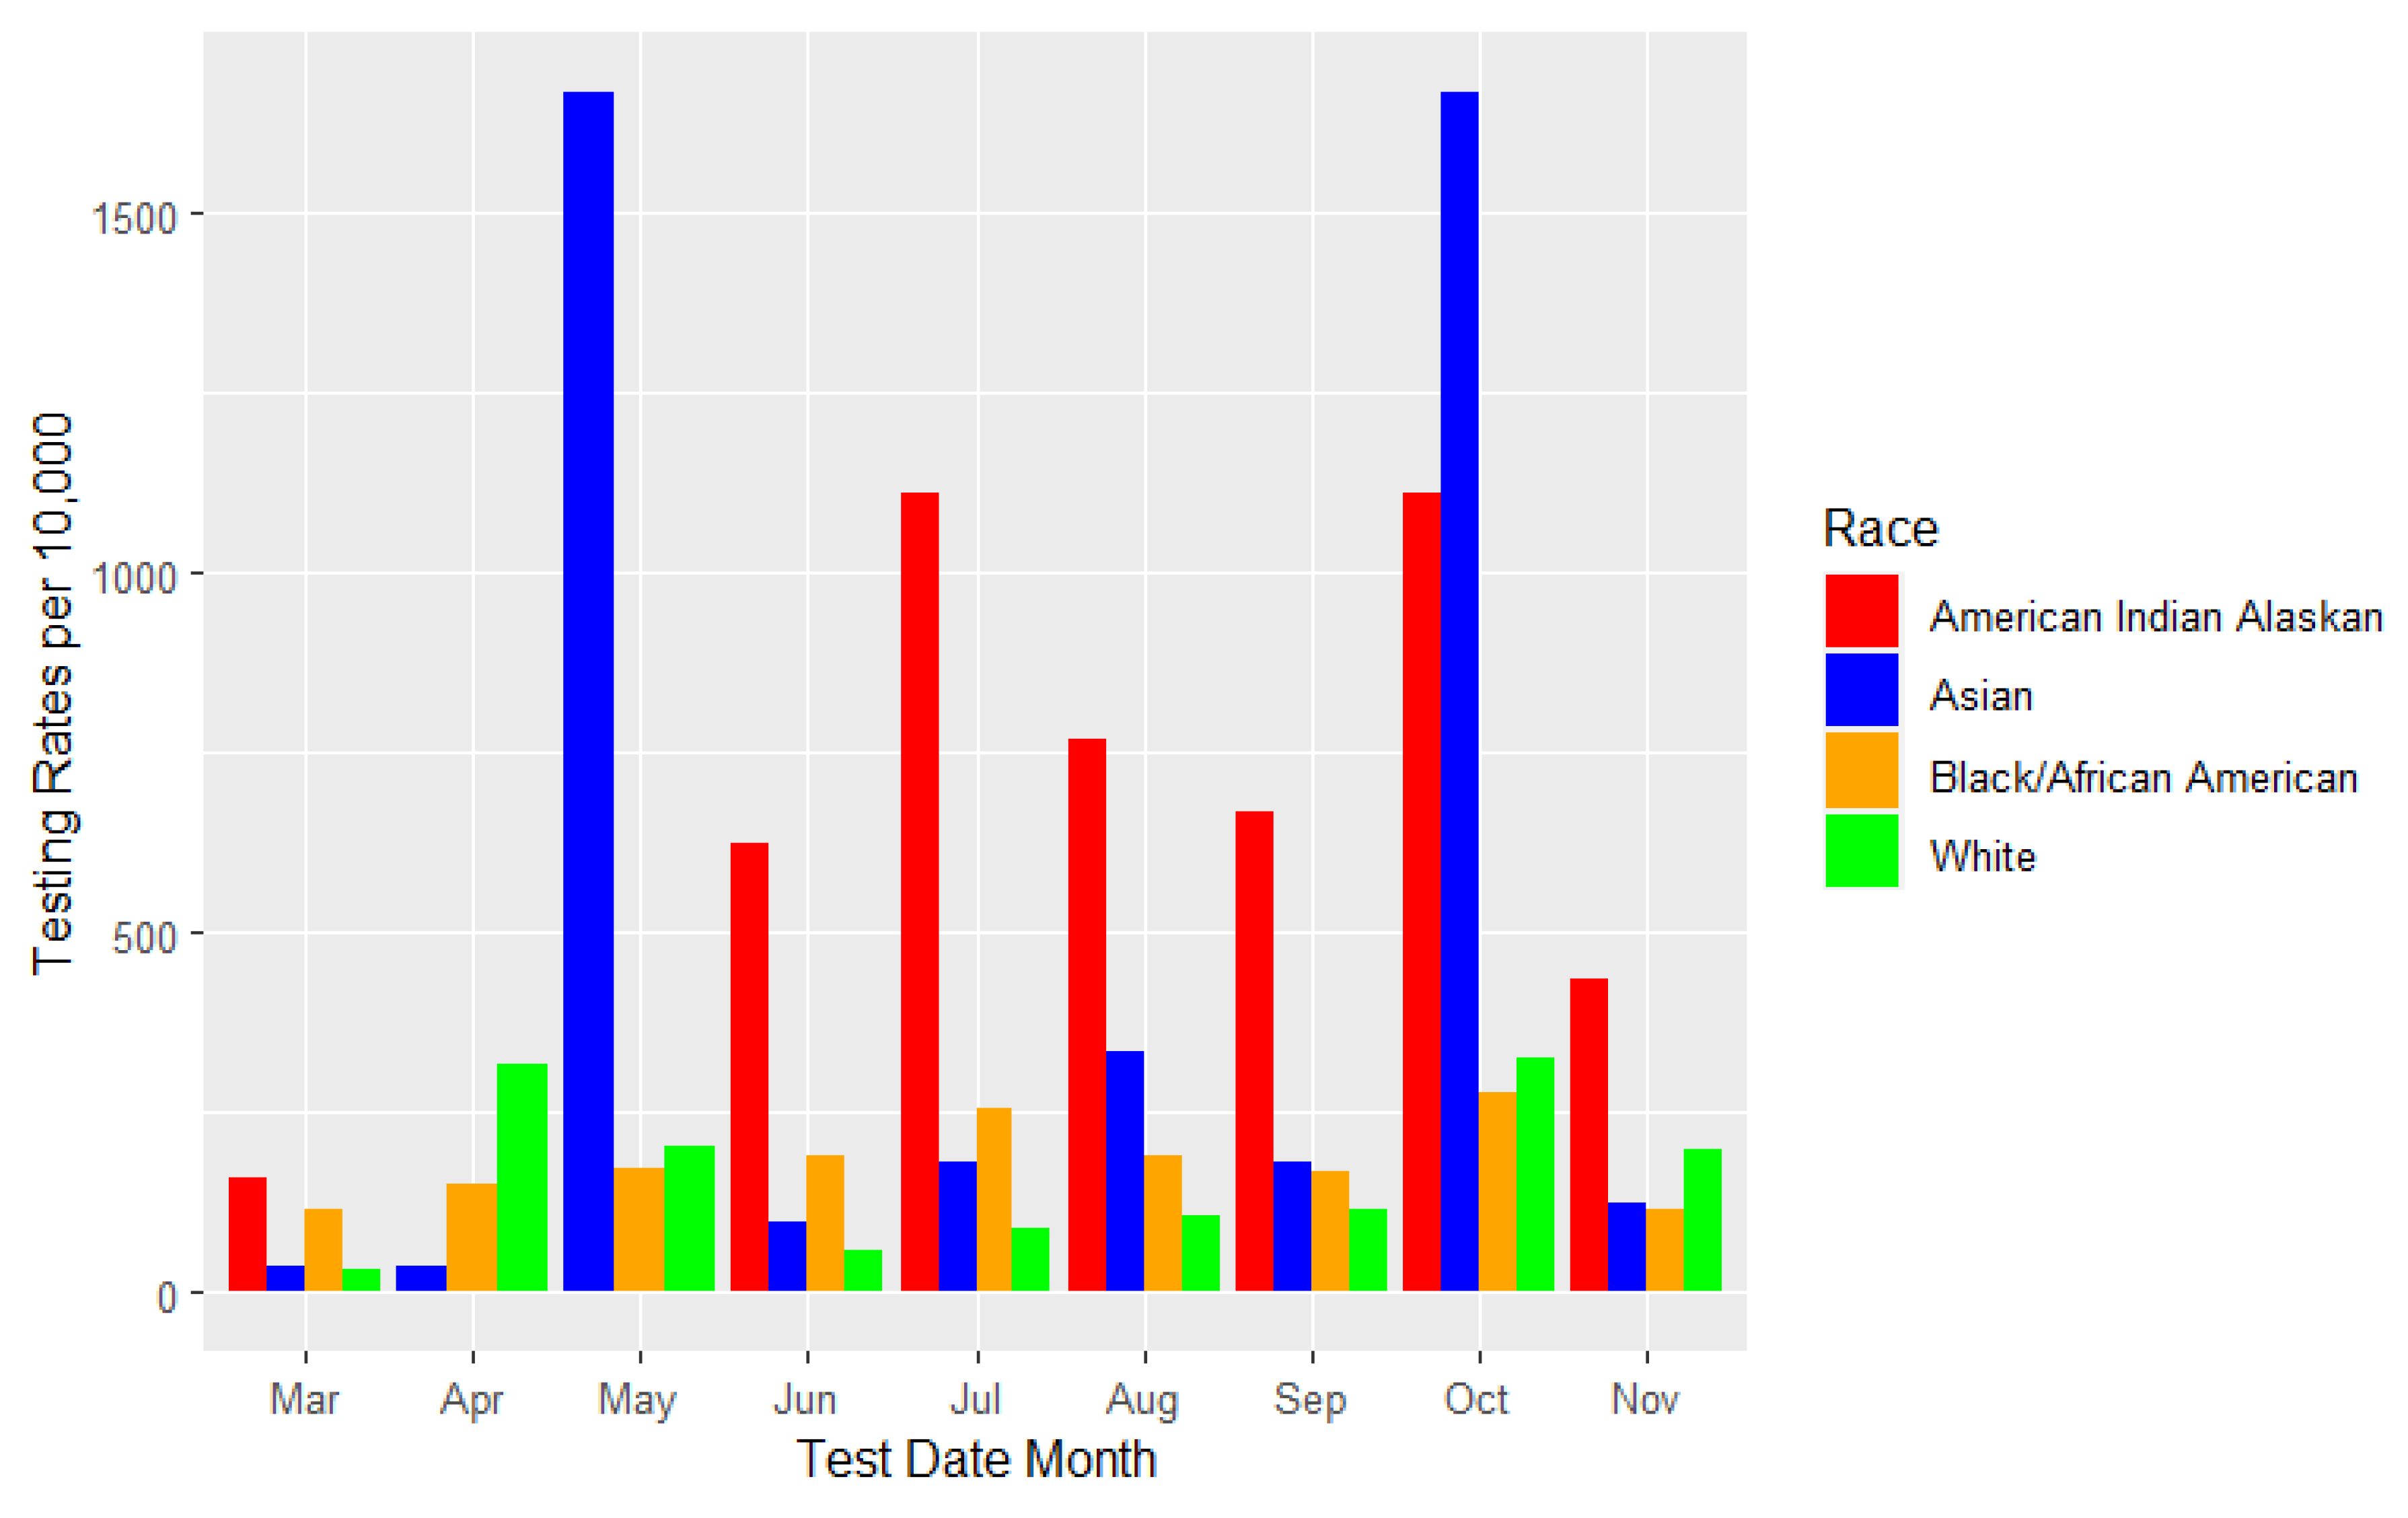
Figure 7.
Trend in Testing Rates Over Time Stratified by Socioeconomic Index Category.
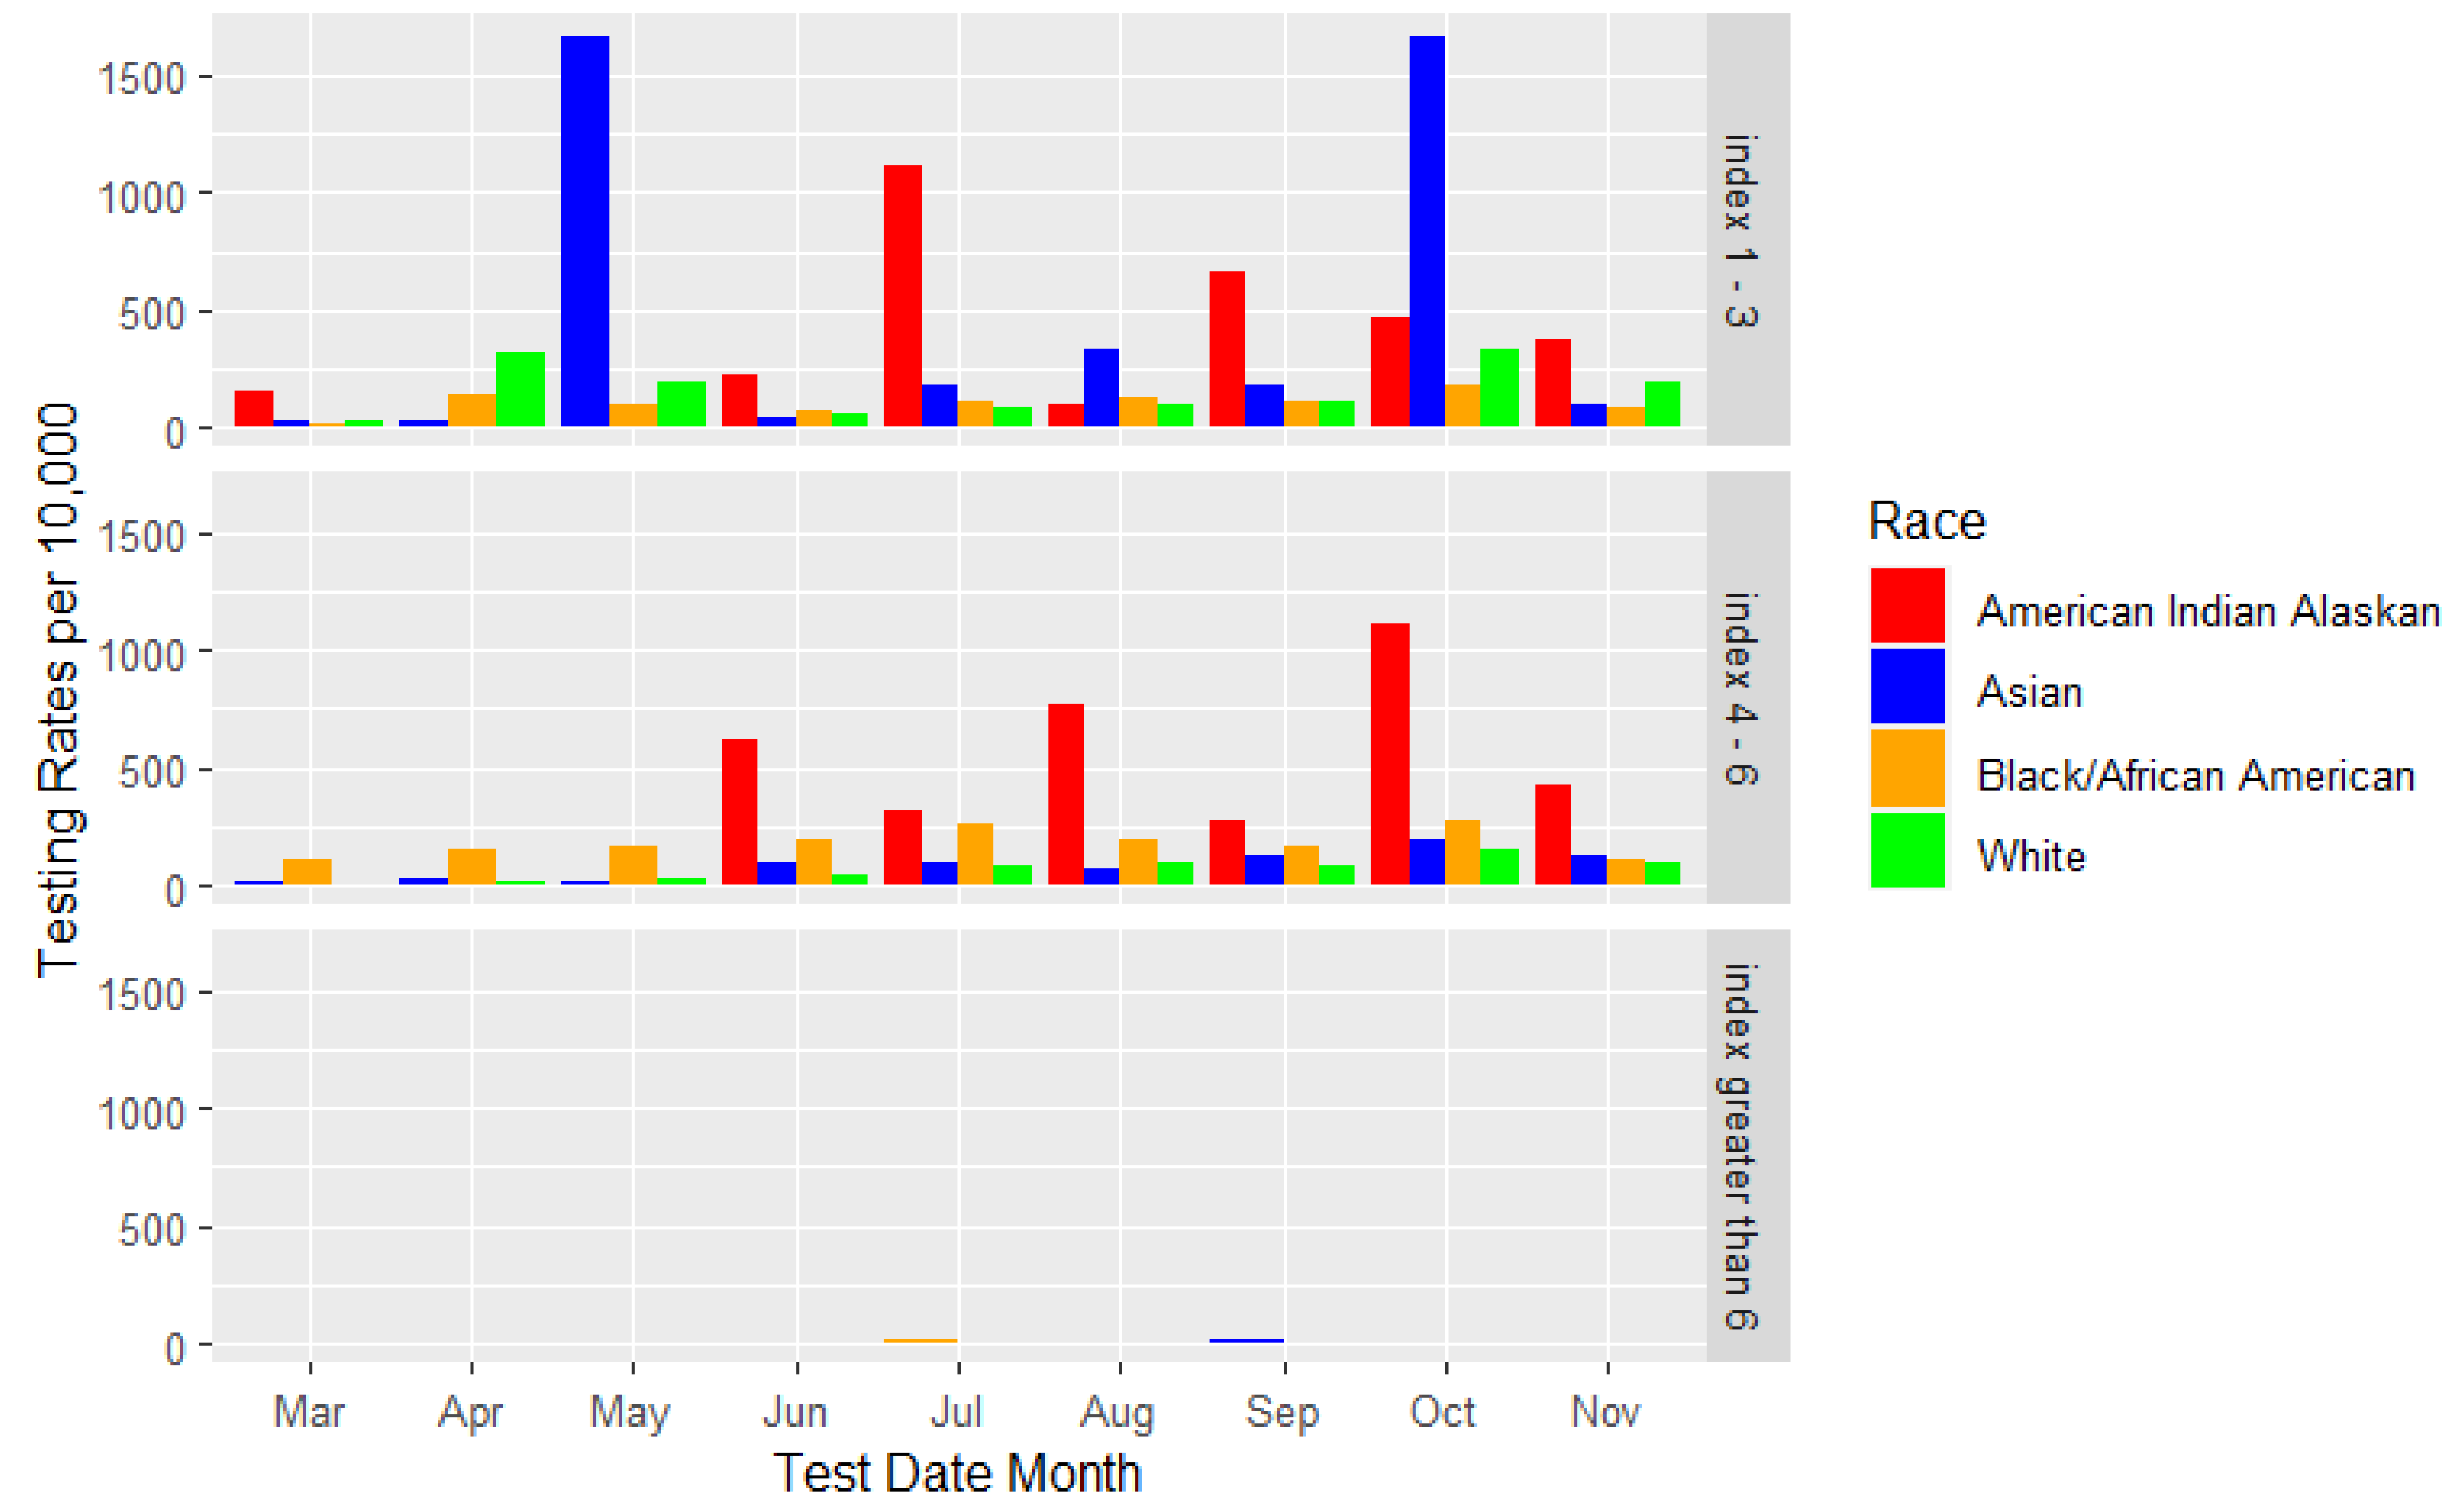

Table 1.
Descriptive Statistics of Testing Rates in St. Louis.
| Covariates | Testing Rates Per 10,000 |
| Overall Testing in St. Louis | 303.97 |
| Race | |
| American Indian/Alaskan native | 360.63 |
| Asian | 242.41 |
| Blacks/African Americans | 374.26 |
| White | 247.77 |
| Socioeconomic Index Category | |
| Index 1-3 (Low SES) | 363.23 |
| Index 4-6 (Medium SES) | 259.53 |
| Index > 6 (High SES) | 33.57 |
Table 2.
Association between testing rates and race controlling for socioeconomic index.
| Characteristics | Beta | CI (95%) | P-value |
| Intercept | 405 | 174, 635 | <0.001 |
| Race | |||
| White | ref | ref | ref |
| American Indian Alaskan | 43 | -184, 271 | 0.7 |
| Asian | -3.3 | -231, 224 | >0.9 |
| Black/African American | 168 | -60, 396 | 0.15 |
| Socioeconomic Index | -25 | -78, 28 | 0.4 |
Disclaimer/Publisher’s Note: The statements, opinions and data contained in all publications are solely those of the individual author(s) and contributor(s) and not of MDPI and/or the editor(s). MDPI and/or the editor(s) disclaim responsibility for any injury to people or property resulting from any ideas, methods, instructions or products referred to in the content. |
© 2024 by the authors. Licensee MDPI, Basel, Switzerland. This article is an open access article distributed under the terms and conditions of the Creative Commons Attribution (CC BY) license (http://creativecommons.org/licenses/by/4.0/).
Copyright: This open access article is published under a Creative Commons CC BY 4.0 license, which permit the free download, distribution, and reuse, provided that the author and preprint are cited in any reuse.


