
Submitted:
28 June 2024
Posted:
01 July 2024
You are already at the latest version
Abstract
The presented work offers a novel process scheme for valorizing historical Pb-Zn slag, which involves crushing, grinding, and then using separation techniques to concentrate valuable components (nonferrous metals). This methodology could have a significant impact on the global beneficiation of metallurgical slags since, in theory, it is significantly more simple, environmentally friendly, and cost-effective than standard pyrometallurgical or hydrometallurgical procedures. According to previous physicochemical and mineralogical studies, Pb-Zn slag from "Topilnica" Veles is a valuable secondary raw material. This inhomogeneous technogenic resource contains substantial amounts of nonferrous metals (Pb, Zn, Cu, and Ag). However, laboratory tests have indicated that the Pb-Zn slag contains a very uneven valuable metals amounts, ranging from several g/ton to several tens of g/ton. The main issue is that traditional metallurgical procedures for releasing beneficial elements are not commercially viable since the valuable elements are "trapped" within amorphous aluminosilicates or intergrowths of alloy grains and glassy phases. Gravity concentration (Wilfley 13 shaking table) and magnetic separation (Davis separator and disk separator) were used to obtain the final concentrate following comminution and grindability testing. The gravity concentration proved more effective. This streamlined approach of valorizing Pb-Zn slag can reduce the need for hazardous chemicals used in hydrometallurgical refinement operations, as well as the extremely high temperatures required for pyrometallurgical processing. This is the first investigation into the feasibility of this novel approach, which includes direct investigations of the Pb-Zn slag feed using these alternative technologies. After extracting the valuable metals, the amorphous aluminosilicate part of the Pb-Zn slag can be reapplied as an alternative raw material in the building sector, adding to the circularity of the suggested approach..
Keywords:
alternative mineral raw materials
; metallurgy
; microstructural analysis
; critical resources
; nonferrous metals
; zero waste
1. Introduction
A critical resource is, by definition, a raw material that can only be used by at most one process at any one time [1,2]. What is considered a critical resource depends on the branch of industry, the cost of processing, and the potential of returning the resource to the same or another process [3]. Critical minerals, including copper, lithium, nickel, cobalt, and rare earth elements, are essential components for many of the rapidly developing renewable energy technologies, including electric vehicles, power networks, and wind turbines. Still, a large number of other ores and minerals can be considered critical or at least essential. Most material resources have varying levels of risk in terms of supply interruption, vulnerability, and environmental and social repercussions [4]. All natural resources can become critical at some point in the future. Therefore, developing critical mineral projects for a decarbonized future and the preservation of nature is a key asset of contemporary scientific and industrial practice [5,6]. Lead and zinc are the two non-ferrous metals that are most commonly used in different industrial fields, after copper and aluminum [7]. The US Geological Survey has already included zinc on its Critical Minerals list [8]. Zn is a grayish, slightly brittle metal that is used in a variety of applications, including galvanization and alloying with other metals to create varous cast products (door handles, brass, bronze, etc.). In the ongoing decade, the amount of zinc mined worldwide is estimated at 13 million tons. The Zn production carbon footprint, as determined by the GHG Protocol Standard method, is 0.93 tons CO2e per ton of Zn [9,10]. Lead is a soft, low-melting, and ductile base metal that is very resistant to corrosion. The primary applications of Pb are in batteries, as a sound barrier due to its high density, as a shield against X-rays, as a base metal in electrodes in the process of electrolysis, as a coloring element in ceramic glazes, etc. [11]. Total estimated global lead reserves are 85 million metric tons; however, the annual amount of mined Pb is 4.49 million metric tons worldwide [12]. Lead has a much smaller carbon footprint than zinc, ranging from 30 to 76 kg CO2/kg of Pb [13,14].
High quantities of nonferrous metals tend to accumulate in waste products generated during the smelting of metal ores [15]. Environmental concerns have led to a shift toward hydrometallurgy regarding the refinement of nonferrous metals; however, pyrometallurgical processing still accounts for 10% to 20% of Zn and Pb total output [16]. Zn and Pb can be obtained from smelter slags at volumes of 70 and 7 kt/y, respectively [17]. The great majority of these waste materials (slags) are disposed of or temporarily kept in industrial solids storage facilities or in open landfills due to a lack of commercially viable technologies for their valorization. Lead and zinc are both mostly present in amorphous phases, from which extraction can be challenging. Current methods of treating metallurgical slags, including reprocessing, desulfurization, backfilling, and restoration, are not commonly employed due to their high cost and/or limited efficiency [18,19]. Solid waste in remote rural areas, especially those close to abandoned mining sites or smelters, has gotten far less attention because the local authority cannot afford the huge expenses of waste handling and properly disposing of it. Consequently, the development of waste treatment technologies that are technically, environmentally, and economically feasible becomes imperative. The Pb-Zn slag has several possible uses because of its appropriate mineralogical characteristics. Specifically, there is economic potential for the extraction of important metals, including Ag, Pb, Zn, and Cu. In order to produce metal concentrates from their collected concentrates, techniques including gravity concentration and magnetic separation are being developed [20]. Upon the extraction of valuable elements, the rest of this technogenic material can be reapplied in civil engineering due to its aluminosilicate origin [21,22,23]. Using Pb-Zn slags to produce building materials is a feasible and profitable approach to recycling them, especially if the finished goods can be produced and sold nearby. This aligns with the Sustainable Development Goals (SDGs) put forth by the UN in the 2030 Agenda. The metallurgy and mining industries are under pressure to develop sustainable technologies in order to satisfy the relevant SDGs [24,25,26].
Various studies have been conducted regarding the issue of revalorization and extracting valuable elements via magentic separation and/or gravity concentration. Since each raw material is different and depends on its origin, processing methodology, and environmental conditions upon landfilling, each defined procedure for refinement represents an entirely new case study. For instance, the recovery of the minor metals (V, Cr, Mn, Co, Ba, La, Ce, and Fe) contained in waste landfills was conducted via gravity sorting and magnetic force sorting. The methodology of processing the elements directly depends on the chemical morphology of each element in the landfill. In the gravity sorting method, the resulting metal concentration was large when the heavy liquid specific gravity was 2.5 or 2.75 g/cm3 and above. Magnetic force sorting can efficiently separate metals and non-metals and is effective as a pretreatment for a more advanced concentration stage [27]. Gravity separators and corresponding technologies are constantly being improved and upgraded by developing mathematical models employed in novel experiments such as three-phase separation [28]. Magnetic separation was used in iron enrichment from Zn- and Pb-bearing refractory iron ore (47.04% Fe, 0.39% Pb, and 0.30% Zn). At elevated temperatures, iron was extracted by magnetic separation (obtained concentrates had magnetite and metallic iron). Elevated temperature decreased Zn and Pb contents in concentrate [29]. A novel method was proposed for efficient recovery of boron from boron-bearing iron concentrate (the tailings of complex paigeite ore) through mineral phase transformation and low-temperature separation via supergravity. Low-temperature separation of boron-rich slag from the iron phase was conducted at 1523 K via supergravity. The boron was efficiently recovered into the boron-rich slag with a high recovery of 98.24% and a high mass fraction of B2O3 of 39.27 wt%. Low-temperature separation greatly improved the recovery of boron and also improved the activity of boron-rich slag for sustainable utilization [30]. Supergravity technology was also being employed as an efficient method to remove trace impurities and recycle valuable components from secondary sources (waste-stained copper wire). Based on the results, supergravity technology is feasible for the purification of Cu alloys, and it has provided a theoretical foundation for the recycling of high-purity copper [31]. Rare earth mineral deposits are typically processed using several different unit operations, including flotation, gravity, magnetic, and electrostatic separation techniques. Two of the most important beneficiation techniques for RE minerals are gravity and magnetic separation [32,33]. Pb-Zn mine tailings were reprocessed using centrifugal dense media separation. The obtained results showed that the DMS technique allowed high recovery of cerussite (PbCO3) and smithsonite (ZnCO3) present in the tailings. Also, it successfully depolluted the studied mine tailings [34]. Gravity separation was used in enhanced desliming and as a precursor to flotation in the upgrading of cassiterite from tailings [35]. Magnetic and gravity separation were employed in transforming iron ore processing by simplifying the comminution and replacing reverse flotation with the mentioned methods [36].
The present work has identified an entirely new process circuit for the valorization of historic Pb-Zn slag, covering the crushing, grinding, and subsequent application of separation methods for concentrating valuable elements, i.e., nonferrous metals. In principle, the approach is vastly simple, environmentally sustainable, and more cost-effective than the conventional circuit (i.e., application of standard pyrometallurgical or hydrometallurgical procedures); hence, it may have very significant implications globally on the beneficiation of metallurgic slags. Namely, Pb-Zn slag from “Topilnica” Veles (Northern Macedonia), according to the previously performed physicochemical and mineralogical characterization, represents a potentially valuable secondary raw material. It is an inhomogeneous technogenic resource with potentially significant contents of non-ferrous metals such as Pb, Zn, Cu, and Ag. However, laboratory analyses have shown that despite the presence of useful elements and minerals, the slag from the “Topilnca” Veles has a very variable content of useful metals, which ranges from several g/t to several tens of grams per ton. The main problem is that the valuable elements are “trapped” within amorphous aluminosilicates or intergrowths of alloy grains and glassy phases, making standard metallurgical procedures for useful element liberation not cost-effective. Following the comminution and grindability tests, single stages of either gravity concentration on a Wilfley 13 shaking table or magnetic separation on a Davis separator or disk separator were tested to deliver the final concentrate. Gravity concentration gave preferable results. By using this simplified technology to valorize Pb-Zn slag, there would be no need for hazardous chemicals used in metallurgical procedures for refinement or extremely high temperatures for pyrometallurgical processes. This is the first investigation of the potential for applying this new circuit, incorporating direct investigations of the Pb-Zn slag feed using these alternative technologies. Upon extracting the valuable metals, the amorphous aluminosilicate part of the Pb-Zn slag can be reapplied as an alternative raw material in the building industry, which would further contribute to the circularity of the proposed procedure.
2. Materials and Methods
2.1. Characterization of Pb-Zn Slag
The artificial (secondary) mineral raw material, i.e., Pb-Zn slag from the Topilnica Veles smelter, North Macedonia (KEPS MONT GROUP), was analyzed in this study. Currently, there are 2,000,000 t of this historic Pb-Zn slag located at the landfill near the smelter. Preliminary analyses of this raw material have been conducted in our previous work [37]. Chemical analysis of the Pb-Zn slag detected: SiO2 (17.4%), Al2O3 (7.4%), CaO (12.3%), MgO (2.1%), Fe2O3 (47.7%), Pb (2.3%), Zn (7.1%), S (2.1%), and Ag (27.5 ppm) [37]. It was concluded that slag with this chemical composition has a realistic potential for further refining, with the goal of extracting valuable elements and reusing the remaining raw material in civil engineering (i.e., construction materials such as mortar or concrete) in accordance with Circular Economy and Zero Waste principles.
The composition of this artificial raw material is complex, consisting of amorphous and mineral phases such as wurtzite ((Zn,Fe)S), sphalerite (ZnS), galena (PbS), cerussite (PbCO3), akermanite ((Ca2Mg[Si2O7]), wüstite (FeO), monticellite (CaMgSiO4), franklinite ((Zn2+, Fe3+)·2O4), and zincite (ZnO) [37]. Chemical analysis, X-ray Diffraction (XRD), and Scanning Electron Microscopy (SEM) with an Energy Dispersive X-ray Spectrometer (EDS) revealed the presence of a variety of inclusions containing lead alloys, zinc alloys, elemental silver, copper, and iron. Melted silicates, mixed aluminosilicates, and Fe-Mn-Zn spinels are most likely responsible for the occurrence of the amorphous phase. Wüstite, as source of iron, which emerged as skeletal inclusions in the glassy matrix, was far less abundant [37]. According to SEM/EDS, lead and zinc alloys contained a high concentration of copper. Alloys appeared predominantly as inclusions, or as simple to complex conglomerates with a glassy matrix of elemental iron or wüstite. The majority of alloy grains were up to 100 µm in diameter, although some were bigger (up to 300 µm). Alloy grains larger than 100 µm were free or in the form of simple conglomerates [37]. The presence of visible and/or “invisible” (i.e., structural) silver was not detected in Zn-alloys. Grains corresponding to Pb-alloys appeared in the form of spheres, and unlike Zn-alloys, they comprised both visible and structural Ag [37]. Silver was oval-shaped or in the form of small wires sizing up to 5 µm. Elemental silver and copper were found in both the glassy matrix and wüstite as tiny inclusions of 2-3 µm and 7-8 µm, respectively [37]. Elemental silver can also be found in the crevices of host grains [38]. Iron (in elemental form) was mostly found as wüstite, magnetite, hematite, troilite, and spinel, but in considerably smaller levels in pyrite and arsenopyrite [37,39].
The mineralogical and microstructural examination revealed that the investigated raw material is extremely complex. Therefore, for it to be reused, Pb-Zn slag has to be thoroughly examined to determine what component may be valorized and how it can be accomplished. This type of secondary raw material is unique to each smelter; there is no laboratory or factory procedure for treating it, hence there are no starting points for further refinement and valorization. As a result, it was decided to follow the standard procedure for processing and refining technogenic raw materials, to record all obtained outputs, and to include analyses at each stage of the procedure to demonstrate the significance of the preparation and refinement process, as well as methods for concentrating useful components into commercial products.
2.2. The Preparation of Input Slag Sample and Experimental Plan for Technological Testing
The input Pb-Zn slag sample weighed 50 kg and had an upper grain size of 5 mm. The preparation of the sample for testing (shredding, sieving, and homogenization) was performed in Phase 1. Grindability tests were performed as part of the technological preparation to find the ideal conditions for separating and releasing beneficial components from inert and harmful ones. The Phase 2 of the experiment included determining the concentration’s likelihood and selecting the optimal approach. The experimental plan is illustrated schematically in Figure 1.
Primary crushing was conducted on a laboratory roller crusher, and grinding was conveyed on a laboratory ball-mill. The laboratory batch mill “Denver” [40] was employed during the “sieving step” in Phase 1. (Figure 1, upper and left side of the scheme). The input slag sample was crushed/milled to a maximum size of 2 mm for further technological tests. This sample was then homogenized, and samples of mass m=1kg were obtained for grinding test. The second phase (Figure 1, lower right side of the scheme) focused on concentration methods and procedures, which included concentration assessments (i.e., application of magnetic separation and gravity concentration) of useful components in different products. In Figure 1, ∆L is the tailings fraction and ∆T is a concentration of non-ferrous metal alloys.
2.3. Determination of the Grain-Size Distribution of the Pb-Zn Slag (Starting Sample)
The grain size distribution of the Pb-Zn slag sample (starting sample) was determined following grinding on a Denver-type laboratory batch mill. The upper grain size limit (du) is 2 mm. The granulometry of the resulting Pb-Zn slag sample was determined using Tyler’s series of sieves [41], with the last sieve in the sequence having a 0.1 mm opening. All the oversize masses, starting with the first sieve and moving towards the last sieve in the set, were weighted, and the cumulative undersize and the direct curve were calculated and illustrated in Figure 2.
The obtained average grain diameter of the Pb-Zn slag sample is d50=0.65 mm, while the upper limit of grain size (du) is 1.31 mm.
2.4. Grindability Test
Two grindability tests (GT) were conducted: 1) wet grinding (WGT); and 2) dry grinding (DGT). WGT is usually more effective than DGT; therefore, the DGT was conducted only for one duration (20 minutes) to compare the results. The WGT was expected to use 60% and 70% solid phase (SP), respectively. However, during the test with 60% SP, it was observed that an excessive amount of water appeared in the mill. Pb-Zn slag did not behave like a regular mineral raw material or ore. Namely, grinding an ore with a high content of silicates and a low content of metallic minerals results in pulverized matter in the form of a pulp that envelops the grinding tools like a film, which helps the comminution. Contrary to the previously described scenario, in the 60% SP test, the pulp was not formed. Instead, the excess water remained in one part of the mill. Therefore, the test with the 70% SP was undertaken.
The GT identifies the ideal grinding duration and slag’s fineness (an optimal grain size class) that enables the maximal release of valuable components (metal minerals). Two experimental sets were carried out in the “Denver” laboratory batch mill (the mass of the initial sample was 1 kg and the maximal grain diameter was 2 mm). Three grinding times were employed in Experimental Set No.1 (ES-1): 14 min, 20 min, and 26 min. Grinding times for Experimental Set No. 2 (ES-2) were: 32 min, 38 min, and 44 min. Following the grinding procedure, all the obtained grinding products underwent visual qualitative analysis with an optical microscope. The fineness of the powder was determined by sieving (set of sieves with openings: 0.150 mm, 0.100 mm, and 0.025 mm in ES-1, and 0.100 mm, 0.075 mm, 0.053 mm, 0.037 mm, and 0.025 mm in ES-2).
2.5. Magnetic Separation
Magnetic separation (MS) tests were carried out on Pb-Zn slag with a size class of - 0.1+0.00 mm. Commercial magnetic separators are continuous-process devices which use a moving stream of particles that enter and exit the magnetic field to perform separation. Particle speed throughout the field must be precisely regulated, which usually means using free fall as a form of feeding [42]. The MS was performed using two devices: a Davis magnetic separator (“wet” method) and a magnetic separator with a disk (“dry” method). The sample for MS was prepared by combining the grain size classes obtained during GT but with diameter limits of -0.1+0.00 mm. This sample was separated into two parts: one for the MS test on the Davis separator and the other for the disk separator. In the Davis separator, the separation tube is placed between the poles of a powerful electromagnet at an angle of 45° (configurable). The tube is agitated back and forth and rotated by a motorized system. Magnetic particles are collected inside the tube in the zone of high magnetism, while non-magnetic minerals are washed away [43]. The Davis separator with a magnetic induction of 700 gauss=0.07 T was used in the experiment. A magnetic disc separator uses electromagnetic forces to separate materials with different magnetic susceptibilities. This separator typically consists of three high-intensity electromagnetic disks, each placed at a different height from the feed conveyor [44,45]. The magnetic separator with a disk used in this experiment had a maximum current of I=1.8A and a magnetic induction of 11,000 gauss=1.1T.
2.6. Gravity Concentration
The gravity concentration (GC) was performed on Pb-Zn slag with a size class of - 0.1+0.00 mm. Similar to the MS experiment, the raw material’s size class was assessed using the mineralogical properties of Pb-Zn slag, structural-textural properties, degree of cohesiveness (i.e., freedom), and concentration criteria. Namely, because more than 85% of the usable components are free in grain classes with a diameter of less than 0.1 mm, GC was performed on a sample of this size. The grain size classes used as an input for the GC (obtained by wet sieving) are -0.1 +0.075 mm; -0.075+0.053 mm; -0.053 +0.037 mm; -0.037 +0.025 mm; -0.025 +0.00 mm.
The GC of the individual grain size classes was carried out on a Wilfley 13 shaking table. The function of the Wilfley table is to separate two or more mixed materials based on their density. This device works by flowing items across a level surface, i.e., the table, using water. The water serves as a medium of separation [46,47]. The table’s working area has been optimized to handle mud and finely ground raw materials. The Wilfley shaking table has proven to be a very effective tool for concentrating small classes by gravity in a thin layer of water. Based on theory and experience, the gravity concentration procedure was designed to yield the definitive products (∆T and ∆L) after double purification. ∆L is the tailings fraction and ∆T is a concentration of non-ferrous metal alloys Figure 3 depicts an established procedure for sample preparation and testing via GC.
2.7. Instrumental Analyses
Chemical analysis, i.e., identification and quantification of selected chemical elements was conducted using the atomic absorption spectroscopy (AAS) technique on a PinAAcle 900 Perkin Elmer instrument (PerkinElmer, Waltham, MA, USA). AAS has a high degree of accuracy, with results typically ranging from 0.5 to 5%. It is a highly sensitive test procedure that can measure as low as parts per billion (g/kg) depending on the material under test. The instrument is a flame-only device with a real double-beam design for quick startup and long-term reliability. It has fiber optics to maximize light flow for greater detection limits, an eight-lamp mount, and automated flame and burner assembly optimization for increased production. Pulverized slag samples (d50 < 63 μm) were used in the analyses. Samples were dried at 105 °C before pulverization in a planetary ball mill.
Microscopic analysis: medium-sized grain classes (about -2.38+0.00 mm) of Pb-Zn slag were placed in Plexiglas plates for optical microscope recording. The preparation area was 2.2 cm2. The quartering procedure maintained the authenticity of the starting grain mixture. Visual examination of the samples helped in revealing the range of mineral phases found in the original slag sample. The analysis was performed using Carl Zeiss-Jena’s JENAPOL-U polarizing microscope for transmitted and reflected light (ZEISS, Reutlingen, Germany), as well as a measuring tool. The samples were recorded using an Axiocam 105 color camera and the Carl Zeiss AxioVision SE64 Rel. 4.9.1 software package, which included the multiphase module.
Scanning electron microscopy with an energy dispersive X-ray spectrometer (SEM/EDS): The Pb-Zn slag sample was carbon-coated (20 nm layer, density 2.25 g/cm3). The analysis was performed on the JEOL JSM-6610LV SEM (JEOL, Akishima, Tokyo, Japan). The magnification range for this device is 5 to 300,000 times. The electron source was a W wire (LaB 6). The voltage ranged from 0.3 to 30 kV. The instrument employs a vacuum system consisting of a rotary pump and turbomolecular pump (included in the microscope’s basic configuration), an ion pump (for LaB6), and a rotary pump for low vacuum (10-270 Pa). The following detectors were used: SE, BSE, CL, and EDS. The detection limit for elements Z ≥ 5 is approximately 0.1 wt.%, with a resolution of 126 eV. The sample chamber has five axes of movement: X, Y, Z, T-tilt, and R-rotation; the maximum sample size is 20 cm (width), 8 cm (height), and 1 kilogram. Two infrared cameras were included. The microanalysis standards included 64 natural minerals and synthetic chemicals. The LEICA SCD005 (Leica Microsystems, Wetzlar, Germany) is used to coat samples with gold (Au) or carbon. An ultrasonic bath, binoculars, and other equipment were also present. A voltage of 20 kV and an extinction duration of 50 seconds were used. The lower limit of EDX sensitivity was around 0.3%.
3. Results
3.1. Determination of Grindability
A grindability test was employed to identify the conditions (grinding time and grain size class) for separating useful components in Pb-Zn slag from inert or hazardous ones. The mechanical processing of slag and other similar technogenic raw materials containing a certain percentage of nonferrous metals is a field lacking in technological know-how and experience. The experiment was conceptualized based on previous experience in grinding hard metallic ores with high aluminosilicate concentrations. Wet grinding was used for a variety of reasons: 1) it complements the subsequent concentration procedures (wet magnetic separation and wet gravity concentration), and 2) it is up to four times more efficient than dry grinding (uses less energy for the same grinding action).
Pb-Zn slag contains valuable minerals (wurtzite, sphalerite, galena, cerussite, akermanite, wüstite, monticellite, franklinite, and zincite [37]) corresponding to metal alloys present in the form of complex intergrowths. The amorphous phase (glassy tailings) of aluminosilicates, silicates, spinel, and mixed spinel-silicate composition, as previously assumed, is the predominant phase in observed slag samples [37]). The amorphous phase is responsible for the extremely high hardness of Pb-Zn slag. Upon grinding (short grinding periods), non-metallic mineral phases (crushed parts of the glassy matrix) are expected to appear in oversize classes (a residue on a sieve). Metal minerals are the “softer” part of the slag’s complex composition; therefore, they are expected to be in undersize classes.
The initial sieve test design (ES-1) included the following projected sieve openings: (1) sieve with a 0.15 mm opening to separate coarser grain sizes (+0.15 mm) with no useful components (i.e., crushed glassy phase, i.e., tailings); (2) sieves with 0.15 mm and 0.1 mm openings to conduct “pre-concentration” of useful minerals (softer metal minerals and/or their complex intergrowths) in the -0.15+0.1 mm grain size class. Initial testing on the starting raw material revealed that the release limit of viable components begins with classes of approximately 0.1 mm; and (3) sieve with 0.025 mm opening to separate the -0.025+0.00 mm class to determine if metallic components (lead-copper and zinc-copper intergrowths) have transitioned into the finest class while grinding.
The purpose of these tests was to detect the grain size classes in which non-useful tailings are concentrated so they could be eliminated from further processing in order to decrease energy consumption during milling. Furthermore, detection of the exact particle size of metallic components is important, so their migration into the fine-size class is prevented because concentrating them at that point becomes challenging. Figure 4 shows grain size distribution diagrams for ES-1 for intervals (t) of 14, 20, and 26 min (i.e, GT-1, GT-2, and GT-3).
As shown in the graphs (Figure 4), longer grinding periods resulted in a material with a smaller mean grain diameter (d50) and upper grain limit (du): t=14 min, d50=97.5 µm, du = 193.3 µm; t=20 min, d50=76.3 µm, du=165.7 µm; and t=26 min, d50=55.7 µm, du=142.5 µm.
In the first GT (t = 14 min), mineralogical analysis revealed that the coarsest grain class (+0.15 mm) contained fused vitreous phase and metal alloy grains. Analysis was conducted by visual examination of the grain mixture obtained as oversize on a 0.15 mm sieve. The sample was observed by an optical microscope (described in Section 2.7). This class accounts for 25.41% of the overall micronized product in GT-1. Conglomerates and intergrowths were found in the -0.15+0.1 mm class. In the finest grain size class (-0.025+0.0 mm) of the slag sample, alloy grains and tailings were indistinguishable. The finest class accounted for 14.83% of the total mass used in the GT-1.
With an extended grinding in the second GT (t=20 min), mineralogical analysis revealed, same as in the GT-1, that the coarsest class (+0.15 mm) is composed of fused glassy phases and metal alloy grains. The fused inclusions and intergrowths were also evident in the finer class (- 0.15+0.1 mm). The number of free alloy grains increased. In the finest class (-0.025+0.0 mm), alloy grains were found to glow under the microscope’s reflected light (i.e., they are distinguishable). A longer grinding period of 20 minutes resulted in a higher mass share of the lowest grain size class (21.39%), which is roughly 6.5% higher than GT-1.
In the third GT (t = 26 min), the mineralogical analysis revealed that the coarsest grain size class (+0.15 mm) contains fused glassy phases and metal alloy grains, as well as very large free metal alloy grains. The share of the +0.15 mm class in the total micronized product is rather small (3.06%). The middle class (-0.15+0.1 mm) consisted of more free alloy grains than fused grains. Alloy particles were identifiable in the -0.025+0.0 mm class. The grinding period of 26 minutes produced the highest mass share of the finest grain size class, its participation in the GT-3 being 26.98%. That is a mass increase of approximately 5.6% over the GT-2 and 12.15% over the GT-1. The obtained results of the mineralogical analysis of the GT-3 show that the coarse class (+0.15 mm), despite its small mass share of 3.06% in the total amount of micronized product, cannot be rejected as the class in which tailings are concentrated solely due to the presence of large alloy grains.
The second sieve test design (ES-2) included the following projected sieve openings: i.e., grain size classes: -0.10+0.075 mm; -0.075+0.053 mm; -0.053+0.037 mm; -0.037+0.025 mm; and -0.025+0.00 mm. Figure 5 shows grain size distribution diagrams for ES-2 intervals (t) of 32, 38, and 44 min (i.e., GT-4, GT-5, and GT-6). These GTs did not contain a +0.15 mm grain size class as a result of the extended milling. The coarsest grain size class found in these samples was -0.15 + 0.1 mm.
Grinding for a longer period reduced the mean grain diameter (d50) and upper grain limit (du) of the treated Pb-Zn slag (Figure 5): t=32 min, d50=44.2 µm, du = 93.4 µm; t=38 min, d50=37.2 µm, du=89.1 µm; and t=44 min, d50=28.9 µm, du=87.2 µm.
In the GT-4 (t = 32 min), the -0.15+0.1 mm class accounted for only 8.12% of the total mass. This class contains fewer coalescing alloys and less amorphous phases, as well as more free alloy grains. The rest of the observed classes (-0.10+0.075 mm; -0.075+0.053 mm; -0.053+0.037 mm; -0.037+0.025 mm; and -0.025+0.00 mm) comprised free alloy grains, vitreous phase, and silicates. The finest class (-0.025+0.00 mm) contained small metal grains up to 10 μm in size. Although the Pb-Zn slag sample was ground for 32 min, there are free alloy grains and a small amount of coalesced mineral grains in the coarsest class (0.15–0.1 mm); therefore, this class cannot be rejected as a class in which tailings are concentrated. The mass percentage of the finest class (-0.025 + 0.00 mm) increased to 38.45%, which is an 11.47% increase over the GT-3 (t = 26 min).
The coarsest class (-0.15+0.1 mm) accounted for only 2.22% of the total mass after the GT-5 (t = 38 min). There were more free alloy grains, a few alloy fusions, and amorphous phases in this class. All other classes contained free alloy grains, a glassy phase, and silicates. Spinel was found in the -0.053+0.037 mm class. It was in needle-like form, sizing up to 150 μm in length and 30-35 μm in width. This might be the outcome of the slag grains breaking into long, needle-like shapes due to the mechanical crushing [48,49]. The -0.025+0.00 mm class contained a considerable number of metal grains, about 10 μm in size. Even with the extra grinding (38 minutes total), the mass percentage of this class in the entire mass increased only marginally to 38.96%. This shows a slight increase of 0.51% over the GT-4, when the mass share of the finest class was 38.45%.
Even though the mass share of the coarsest class (-0.15+0.1 mm) was only 2.12% in the GT-6 (t = 44 min), free alloy grains and silicates were still present. The analyzed grain size classes in the GT-6 were identical to the two previous GTs. Free alloy grains, the glassy phase, and silicates were found in all classes. As in the previous test, a needle-shaped spinel was found in the -0.053+0.037 mm class. Very fine metal grains were found in the -0.025+0.00 mm class. This class’s mass participation ascended to 48.20% as the grinding time increased (t = 44 min), which is a 9.24% increase from the GT-5.
Figure 6. shows the grain size distribution of the Pb-Zn slag grain mixture obtained after dry grinding for 20 minutes. The dry-grinded mixture had a mean grain diameter of 206.1 µm and an upper grain size of 335.2 µm. Thus, wet grinding (t = 20 min) with the same energy and time input outperformed dry grinding of the identical material.
The GT1-3 results indicate that no test, not even with the shortest or longest grinding duration, can exclude the coarsest class (+0.15 mm), in which tailings were expected to be concentrated. The mineralogical study of this class revealed free alloy grains and fusions of glassy phase and alloys; therefore, it cannot be described as a tailings-concentrated class. The coarsest class in the GT4-6 was -0.15+0.10 mm, which also could not be excluded from GTs as a class that contains concentrated tailings solely. Namely, this class contained grains of metal alloys and conglomerates; hence, eliminating it would result in a loss in metal utilizability.
Furthermore, the GT results demonstrated that the Pb-Zn slag does not behave like ore and that the metal grains do not crush easily, despite being known to be softer than both the glassy phase and the silicates. Extended grinding from GT-2 to GT-6 (20–44 min) raised the metal content and the finest class (-0.025+0.00 mm) content. The finest class had a significant mass share, which could make the metal concentration procedure difficult. The presence of large metal grains in the coarsest class is very uncommon, especially lead grains, considering the mechanical characteristics and relative softness of lead. Large metal grains may make grinding more challenging since they have a propensity to collide with one another and the balls in the mill during grinding. The outcome is an increase in grain size rather than a decrease in size.
The GTs supplied fundamental information on the grinding process and the release of usable components from Pb-Zn slag. It was determined that most of the free utilizable components are present in the -0.1+0.00 mm class. Therefore, this class was further used in magnetic separation and gravity concentration tests, which are methods for successfully separating nonferrous metal alloys and minerals into one product while separating tailings into another.
3.2. Magnetic Separation of Pb-Zn Slag
After GTs, the Pb-Zn slag was subjected to a magnetic separation test to further reduce inefficient components. MS removes iron-containing magnetic components from the sample and is expected to result in final products (concentrates) with a higher metal content (relative to the input) and thereby improved utilizability. “Wet” and “dry” separation procedures were tested on a Pb-Zn slag sample of -0.1+0.00 mm grain size.
3.2.1. Magnetic Separation of Pb-Zn Slag by Davis Separator
The Pb-Zn slag magnetic separation experiment was conducted using a Davis separator, which divided the sample into its magnetic fraction (MF) and non-magnetic fraction (NMF). Both fractions were dried and subjected to chemical analysis via AAS. The results are reported in the form of a material balance in Figure 7.
The analysis of the results of MS performed on the Davis separator revealed that the MF and NMF were not adequately separated. The MF accounted for 14.81% and the NMF 85.19% of the total treated mass. A considerable amount of nonferrous metals that have been separated by applying a low magnetic field are present in the MF: 1.03% lead, 3.48% zinc, and 0.62% copper (Figure 7). The amount of Cu in MF is 38% higher than that of the input (0.45%). Non-ferrous metals are known to be non-magnetic; therefore, their presence in the MF is uncommon, especially if a low magnetic field is employed for separation, which should only separate strongly magnetic components. The reason for the presence of Zn in the MF could be the mineral franklinite (ZnFe2O4). Theoretically, franklinite is composed of 16.59% Zn and 37.78% Fe [50]. Thereby, the presence of Zn in the MF can be explained either by its association with franklinite, or amorphous formations in the slag that are chemically similar to franklinite. However, this explanation is not feasible for Pb or Cu.
Due to the small mass share of the MF (14.81%), the utilizability (marked with “u” in Figure 7) of non-ferrous metals in the MF is also relatively small. The utilizability of lead (uPb) in MF is 9.14%, while uZn is 7.36%. uCu is relatively high (20.42%) due to the high Cu concentration in this fraction, but the utilizability of Fe is low (16.79%). Nonferrous metals exhibited high utilizability in the NMF. uPb is 90.86%, even though the Pb concentration (1.78%) in proportion to the input (1.67%) is only 6.7% higher, indicating a very low concentration. Concentrations of Zn and Cu in the NMF are 7.61% and 0.42%, respectively. The NMF had a lower concentration of Cu than the input. The Fe content in the NMF is significant at 30.01%, indicating a minor decrease from the 30.72% of Fe in the input raw material. The utilizability of Zn in the NMF is 92.64%. However, the Zn content (7.61%) in the NMF in relation to input has increased by 8.7%, which is quite low.
In comparison to the input (30.72%) and NMF (30.01%), the quantification of Fe (34.83%) in the MF indicates a low concentration. Iron is comprised in the glassy phase, spinels, franklinite, and wüstite. In a low magnetic field, one part of these mineral forms is transferred into the MF and the other part remains in the NMF, depending on their magnetic properties. However, the iron content in the MF is only 13.4% higher than that of the input. The MF’s insufficient uFe (16.79%) indicates 83.21% loss of Fe in the NMF. Thereby, there was no discernible separation of nonferrous metals from iron carrier components at a low magnetic field of 0.07T. Non-ferrous metals were partially isolated from the MF (1.03% Pb, 3.48% Zn, and 0.62% Cu), and therefore lost from further refinement procedure. Furthermore, their presence deteriorates the quality of the fraction in which Fe should be concentrated. A very small concentration of Fe in MF (34.83%) emerged under a low magnetic field. Given the same magnetic field settings, the concentration of Cu (20.42%) in the MF was high, which is not ideal from the standpoint of the product’s quality.
Pb-Zn slag separation under low magnetic field conditions was not successful, according to the data presented. More specifically, the Cu content in this fraction was lower than that of the input raw material, and no substantial concentration of nonferrous metals in NMF was achieved relative to the input. There was no noticeable increase in iron concentration in MF in comparison to the input.
3.2.2. Magnetic Separation of Pb-Zn Slag by Disk Separator
The second MS experiment was performed using a magnetic separator with a disk. Separation was conducted in a dry state, with a magnetic induction more than 15 times higher than that of a Davis separator. The MF and NMF of the Pb-Zn slag sample were obtained following the disk separation test and both fractions were chemically analyzed by the AAS. The results are presented in Figure 8 as a material balance.
The results displayed in Figure 8 show that the separation of the MF and NMF was more successful than in the previous experiment, but still not perfect, even with a disk separator with strong magnetic induction (1.1T). The mass of MF acquired in this experiment was 53.11%, which is significantly higher than the mass obtained by Davis separator (14.81%). The MF comprised comparatively larger concentrations of nonferrous metals: 1.38% Pb, 6.44% Zn, and 0.49% Cu. This separation resulted in higher Pb and Zn concentrations in the MF compared to the experiment with a Davis separator (Figure 7). Cu concentration in the input (0.46%) was lower than that of MF (0.49%). The copper concentration in the MF is undesirable in terms of the product’s quality. In contrast to the content obtained by the Davis separator, which operated in a low magnetic field (0.07T), the amount of nonferrous metals in the MF increased under a strong magnetic field (1.1T). For instance, the Zn content in the MF was 6.44%, which is slightly lower than the Zn concentration in the input sample (6.98%) and far higher than the Zn content obtained by the Davis separator (3.48%). The appearance of Zn in the MF can also be partially attributed to the presence of franklinite (ZnFeO4) or amorphous forms that are chemically similar to franklinite.
The mass share of MF after the experiment in the disk separator is nearly 3.6 times higher than the mass obtained via Davis separator. This suggests a notable loss or use of non-ferrous metals. The utilizability of Pb (uPb) is 42.9%, while uZn, and uCu are 48.97% and 56.92%, respectively. Utilizabilities of the non-ferrous metals in the NMF are as follows: uPb is 57.1%, uZn is 51.03%, and uCu is 43.08%. Despite a 1.218 and 1.088-fold increase in Pb and Zn concentrations relative to input(s), respectively, these levels remain low. The concentration of Zn in the NMF of the sample treated with the Davis separator is approximately the same as the Zn concentration obtained by the disk separator, but the utilizability of Zn in the NMF of the Davis separator is significantly higher than that of the disk separator. Similar to uZn, utilizability of copper in NMF of Davis separator was higher than that of disk separator, eventhough Cu concetrations in both NMFs were the same.
Compared to the input, the concentrations of Pb (2.08%) and (7.6%) Zn in the NMF were higher. The amount of Cu (0.42%) in this fraction decreased in comparison to the input (0.46%). Furthermore, Fe content in the NMF is significant at 29.86%, exhibiting a small decrease from the Fe value (31.38%) obtained for the input raw material. The low concentration of iron in the MF (32.72%) in comparison with input and NMF can be explained by the fact that in a strong magnetic field, fewer magnetic minerals with lower iron content, such as spinels and franklinite composed of various divalent and trivalent cations (in this case, Fe and Zn), passed into the magnetic fraction.
When franklinite with a high Zn content is submitted to separation using a strong magnetic field, the Zn content in the MF increased. Weaker magnetic minerals with low Fe concentration were also separated, influencing an increase in Fe content in the magnetic fraction. In this case, Fe is concentrated in the MF with a small increase (4.3%) over the input. The utilizability of Fe (uFe) in the MF is 55.38%, resulting in a Fe loss of 44.62% in the NMF. Thus, using a stronger magnetic field (1.1T) in the Pb-Zn slag separation process did not result in significant separation of nonferrous metals from iron carrier components.
3.2.3. Mineralogical Analysis of Magnetic Separation Products – Optical Microscopy
According to the results of chemical analyses, the magnetic separation procedures applied to the Pb-Zn slag in two previously explained testing sets with different experimental conditions and magnetic induction strengths did not yield a suitable technological outcome. A mineralogical analysis of the resulting magnetic separation products was carried out in order to gain a better understanding of why the magnetic separation of Pb-Zn slag, which was intended to separate nonferrous metals from components containing iron, underperformed.
The structural elements of the analyzed samples are grouped into five formations according to the degree of freedom and the way they interconnect: (1) free grains - representing free mineral grains with about 100% visible surface; (2) inclusions - represent the examined mineral, which contains other minerals whose total surface area does not exceed 10–30%; (3) impregnations - represent the examined mineral, which is incorporated in other minerals where its total surface does not exceed 10–30%; (4) simple fusion - represents the examined mineral, which has fused with one mineral, where its total surface ranges from 30–70%); and (5) complex conglomerate - represents the examined mineral, which has conglomerated with several minerals, where its total surface ranges from 10–50%.
Microphotographs of the MF separated from the Pb-Zn slag sample obtained on a Carl Zeiss-Jena’s JENAPOL-U polarizing microscope are shown in Figure 9a–f. The estimated percentage of free alloy grains in MF is 91%, while the percentage of alloy grains that are in the form of inclusions, impregnations, or simple fusions sums up to 9%. The size of the free grains ranges from 26 µm to 159 µm, while the inclusions, impregnations, or simple fusion diameters are from 50 µm to 74 µm. The inclusions whose dimensions range from a maximum of 20 µm to submicron dimensions are not included in the calculation because their mass share is small and it was not possible to separate them.
Figure 9a gives a preview of a simple fusion of one or more minerals grouped in a single formation. Free grains of alloys are visible in Figure 7b–e. Figure 7f depicts another simple fusion of minerals. All microphotographs were recorded in air and reflected light.
Microphotographs of the NMF of the Pb-Zn slag sample are given in Figure 10a–f. The percentage of free alloy grains in this sample is 83%, while the percentage of alloy grains that are in the form of inclusions, impregnations, or simple fusions is 17%. The diameters of the free grains range from 35 µm to 140 µm. The inclusions, impregnations, or simple aggregates exhibited diameters in the range of 32 µm to 92 µm. Inclusions with dimensions from 20 µm to submicron dimensions are not included in the calculation. It was observed that the alloy content in NMF is higher compared to MF.
Figure 10a,b give a preview of two free alloy grains. Free alloy grain (blue) and simple fusion of alloys (red) are depicted in Figure 10c. Two free alloy grains are also visible in Figure 10d. Figure 10e shows free alloy grain (blue) and simple fusion of alloys (red), while two free alloy grains are visible in Figure 10f. All microphotographs were recorded in air and reflected light.
The study of the MF and NMF microphotographs of the Pb-Zn slag sample served to confirm whether this artificial raw material was adequately prepared for the magnetic separation process. In theory, the liberation of magnetic particles should be optimal. Specifically, the MF contained 91% free alloy grains, while only 9% of them coalesced with other grains through inclusions, impregnations, simple fusions, or complex conglomerates. Given that 91% of the non-ferrous metal alloy grains (copper, zinc, and lead) found in the MF are free, they ought to have passed into the MF during the MS procedure. The degree of freedom of the alloy grains in this sample is ideal, based on the visual assessment of the NMF microphotographs. Analysis of the test data showed that 83% of the alloy grains in the NMF are free, whereas 17% are fused in different ways with other grains. This indicates that free alloy grains of non-ferrous metals (lead, zinc, or copper) account for 83% of all the alloy grains found in NMF and that these grains entered the NMF during the magnetic separation process. Thereby, mineralogical analysis revealed that the Pb-Zn slag was adequately prepared for magnetic separation process. Grains derived from various slag components were optimally released because the input material was crushed to the theoretically ideal grain size class of -0.1+0.00mm.
3.2.4. Scanning Electron Microscopy Analysis of Pb-Zn Slag Samples
As it was previously concluded, magnetic separation of the Pb-Zn slag sample using two distinct magnetic separators with different magnetic inductions produced unsatisfactory results. The chemical analysis of the outputs revealed that there was no adequate separation of non-ferrous metals into the NMF and iron-containing components into the MF. To better understand this problem and the outcomes, scanning electron microscopy, accompanied by an EDS system for targeted chemical analysis, was performed on the initial slag sample to identify the presence of certain elements in individual slag grains. SEM microphotographs of characteristic Pb-Zn slag grains are given in Figure 11a–f. Table 1 shows the semiquantitative chemical analysis (EDS) of Pb-Zn slag grains.
The first analyzed grain of the oxidized lead alloy (Figure 11a), indicated as 11a/1 in Table 1, has 75.23% Pb, 0.79% Cu, and 0.70% Fe. Although this percentage of iron is very low, it provides a certain degree of magnetism. The second oxidized lead alloy grain (11a/2), besides 55.73% Pb and 16.77% Cu, has 3.76% Fe. As in the prior situation, this grain has a low iron content, indicating low magnetism. The grain of the glassy matrix grain (11b/1, Figure 11b) contained 7.03% Ca, 8.26% Si, and 29.05% Fe, as well as a large amount of copper (0.60%) and zinc (16.67%). Due to its high Fe concentration, this grain can be considered magnetic. Therefore, Cu and Zn constituents are transported with this grain and concentrated into the magnetic fraction, as seen in both magnetic separation studies. Two oxidized lead alloy grains, designated as 11c/1 and 11c/4, are observed in Figure 11c. The initial grain (11c/1), in addition to the nonferrous metals (82.69% Pb and 2.36% Cu), is iron-free and thus nonmagnetic. The other grain (11c/4) has 0.95% Fe in addition to the nonferrous metals (79.05% Pb and 3.50% Cu). The iron content is minimal, although the grain can be described as low-magnetic. A similar situation occurs with the oxidized lead alloy grains marked as 11d/1 and 11d/2 (Figure 11d). The first one contains nonferrous metals (84.62% Pb and 2.36% Cu), but does not contain iron in its composition. As such, it is undoubtedly non-magnetic. The other grain, in addition to lead, has 76.23% Pb and 0.54% Fe, making it low-magnetic. In addition to the nonferrous metals (36.97% Cu and 33.10% Zn), the oxidized copper-zinc alloy grain designated as 11e/1 contains 8.94% Fe (Figure 11e). This grain is surely magnetic. The last investigated grain (11f/1, Figure 11f) is certainly non-magnetic because it is composed of non-ferrous metals (90.70% Pb and 0.46% Cu) and contains no iron. This grain contains a certain amount of silver (0.97% Ag).
The EDS analysis of the scanned alloy grains and the glassy matrix indicate that non-ferrous metal grains have entered the magnetic phase. To be more specific, the grains of nonferrous metal alloys containing iron are showing a certain degree of magnetism, and as such, they pass into the magnetic fraction during magnetic separation. These results demonstrated why the magnetic concentration of Pb-Zn slag did not show the expected results. The majority of Fe was bound in mineral or amorphous formations; therefore, it was impossible to liberate via a mecanical procedure for concentration. As a result, the usable components could not be separated from the tailings to form an individual product.
3.3. Gravity Concentration of Pb-Zn Slag
The investigations were then directed toward separating and valorizing useful elements from Pb-Zn slag using the gravity concentration method. Several factors were explored before determining the most suitable GC settings. The key premise is that slag is not an ore, which implies that it contains more than just minerals. The methodology of the experiment was determined by the sample’s mineralogical properties (the presence of amorphous and crystalline phases), structural and textural characteristics, degree of cohesion (freedom) of components, and the fact that the sample contains useful components primarily as alloys. Namley Pb-Zn slag consists of alloy-mineral intergrowths and an amorphous phase [1]. The investigated slag is composed of: (1) oxidized lead alloy with copper and iron (Pb, Cu, O, Fe): γ = 9.84-9.25 g/cm3; (2) oxidized lead alloy with copper (Pb, Cu, O): γ = 8.73-9.21 g/cm3; (3) oxidized zinc alloy with copper (Cu, Fe, Zn, O): γ = 6.33-6.73 g/cm3; (4) wüstite grains: γ = 5.7 g/cm3; (5) elemental iron grains: γ = 7.87 g/cm3; (6) galena grains (PbS): γ = 7.2-7.6 g/cm3; (7) sphalerite grains (ZnS): γ = 3.9-4.1 g/cm3; (8) grains of amorphous phase (spinels) chemically similar to franklinite: γ = 5.07-5.22 g/cm3; and (9) silicate grains (gelenite/akermanite/wollastonite): γ = 3.00 g/cm3. The initial Pb-Zn slag sample had the same characteristics as the input sample for magnetic separation, with a particle size of -0.1+0.00 mm.
These tests marked the first attempts to conduct gravity concentration and subsequent valorization of Pb-Zn slag “Veles”. Because there are no predetermined standards, requirements, or attributes that must be met by the product made by concentrating Pb-Zn slag in order for it to be commercially viable, the success of gravity concentration cannot be evaluated solely on the basis of the tests conducted.
3.3.1. Concentration Criterion for Gravity Concentration Experimet
If the concentration criterion is greater than 1.5 (ζ > 1.5), the probability of successful gravity concentration of a raw material in a wet environment (water), i.e., mineral/component separation into different products, is high. The GC procedure was limited to obtaining two products, ∆T and ∆L, because the Pb-Zn slag had a metal alloy concentration of roughly 5-6% (i.e., tailings content is slightly more than 90%). As an output, the total raw material was separated into two parts: ∆L (the tailings fraction) and ∆T (the concentration of non-ferrous metal alloys).
The following formula is used to calculate the separation of a two-component system, including grains of oxidized lead-copper alloy and an amorphous phase (spinel), when the concentration conditions for their GC in a thin layer of water are satisfied:
Separation in a two-component system consisting of oxidized zinc-copper alloy grains and an amorphous phase is conducted using the formula:
The experiment used a concentration criterion of 1.5 due to the higher first concentration criterion (ζ1 = 1.93) and lower second concentration criterion (ζ2 = 1.4) compared to the theoretical value required for successful separation of two minerals or components.
The separation of the copper-containing amorphous phase (spinel) grains from the oxidized zinc alloy grains can be challenging. The worst-case scenario is adopting the amorphous phase’s specific mass as γ = 5.07–5.22 g/cm3, which is also the specific mass of franklinite and magnetite. The amorphous phase might be similar to franklinite, but in reality, this component of slag is far more complex, containing Si, Ca, Mg, and Al. The amorphous phase has a specific mass of less than γ < 5.0 g/cm3, however, a larger value (5.6 g/cm3) was chosen for safety.
3.3.2. Grain Size Distribution of the Pb-Zn Slag Used for Gravity Concentration
Five size classes obtained by the wet sieving were employed as the grain-size classes for the GC: -0.1+0.075 mm; -0.075+0.053 mm; -0.053+0.037 mm; -0.037+0.025 mm; -0.025+0.00 mm. The grain size distribution of the sample used for GC is presented in Figure 12.
The initial crushed sample of Pb-Zn slag for GC has a mean grain diameter of d50 = 0.86 μm and a maximum diameter of d95 = 94.82 μm. Even after the sample was ground to a size of -0.1 mm, 18.88% of the finest class (-0.025 + 0.00 mm) was present. All of the alloy’s valuable components that are softer than the tailings in this paragenesis move to the finer classes and are crushed more readily; therefore, this is undesirable. The classes -0.1+0.075 mm, -0.075+0.053 mm, -0.053+0.037 mm, and -0.037+0.025 mm contributed 22.45%, 25.11%, 17.79%, and 15.77% of the overall mass share, respectively.
3.3.3. Load Balance of the Gravity Concentration of Pb-Zn Slag
Gravity concentration was conducted on a Wilfley 13 shaking table (described in Section 2.6). When using the gravity concentration approach, it is difficult to visually distinguish the fractions of the slag by color (there is a visible separation on the table, i.e., bands are distinguishable, but the color difference is minimal), which is very different from ores. Sub-samples were taken from each grain-size class and treated on the shaking table. Following GC, all acquired compounds were dried, their masses determined, and samples prepared for chemical analysis. Based on the chemical analysis, a load balance was determined, demonstrating the concentrations and utilizability values of all the obtained products. Figure 13 and Figure 14 illustrate the load balance based on grain size classes and input, respectively. Figure 13 displays the load balance for each class, which equals 100%. Figure 14 shows the load balance, which takes into consideration all classes and products in proportion to their input. In addition, Table 2 shows the cumulative products of GC given as metal (Pb, Zn, Cu, and Ag) concentrations and utilizabilities.
According to chemical analysis, the original Pb-Zn slag sample has a high content of zinc (≈ 7%), lead (≈ 2%), and copper (≈ 0.5%) [37]. However, the alloy grains as usable components do not contain significant amounts of zinc or copper; instead, the tailings do. On the other hand, lead is primarily found in oxidized lead alloy grains with copper. Pulverizing the material to a fineness of - 100+0.00 μm increased participation in the finest class -25+0.00 μm to 18.88% (Figure 12). The fact that non-ferrous metals are very soft and quickly broken-down means that they easily slip into the smallest classes during grinding, and thus they are being lost from the valorization procedure.
Based on the data illustrated in Figure 13 and Figure 14, it can be concluded that the separation of individual components into different products based on size classes calculated using the concentration criterion is well performed. In the coarsest class (-100+75 µm), 9.46% of the total mass belongs to the concentrate fraction, while the rest (90.45%) is in the tailings fraction (Figure 3). Alloy grains are easily separable in this class. Total ΔT fraction is 20.44%, 15.79%, and 14.97% for the three following grain size ckasses. Useful components summed up to only 3.03% in the finest class, which means that this class can easily be disregarded as mainly tailings. This demonstrates that the gravity concentration parameters used in this experiment were correctly determined and implemented.
Figure 13 and Figure 14 show satisfactory results for separating lead and silver concentrates (ΔT fractions of Pb and Ag). The results obtained for the separation of zinc and copper concentrates (ΔT fractions of Zn and Cu) are somewhat inferior. As it can be seen from Figure 13, the coarsest class (-100+75 μm) produced the highest concentrations of Pb, Zn, Cu, and Ag (ΔT fraction): 8.44%, 7.42%, 0.77%, and 125 ppm (g/t), respectively. Smaller size classes gave lower concentrates (ΔT) of non-ferrous metals and silver. For instance, the finest class (-25+0 µm) had the following concentrations of Pb, Zn, Cu, and Ag: 3.37%, 4.82%, 0.54%, and 40.88 ppm, respectively. Therefore, the majority of useful elements are located in the coarser classes, from where they can be separated.
The best results in separation using GC were achieved for lead and silver. Despite the relatively low content of lead in the input raw material (1.75%), Pb concentrates reached mass share from 3.37% (in the fine class -25+0.00 μm) to 8.44% (in the class -100+75 μm), as can be seen in Figure 13 and Figure 14. The silver quantity in the concentrate ranges from 125 g/t (for the class -100+75 μm) to a minimum of 51.5 g/t for the class -75+53 μm. Concentrations of Zn range from 5 to 8% in useful grain size classes, while Cu is below 1% in all classes.
The content of lead in the cumulative concentrate (i.e., all ΔT fractions combined) is 5.28% (Table 2), with the utilizability of lead in it being 39.22%. The content of silver in the cumulative concentrate is 76.12 g/t, with the utilizability of silver being 42.68%. The results regarding the content and utilizability of lead and silver obtained during gravity concentration indicate that silver follows lead, that is, there is free silver and invisible silver in the structure of the lead alloy intergrowths [37]. Free silver, which is very fine, sizing 2–5 μm, probably passed into the finest class (-25+0.00 μm) during comminution and ended up in tailings to a significant extent. Namely, the highest silver content is in the -25+0.00 μm class (RI = 28.97 g/t), and its ΔL is 28.60 g/t (Figure 14). As it was mentioned, the gravity concentration procedure was more successful in the separation of Pb and Ag than Cu and Zn. For each grain size class, the Zn concentrates (ΔT) were higher than its tailings fraction (ΔL), except for the finest size class (-25+0.00 μm), in which ΔL was higher than ΔT. The copper content for each grain size class exhibited a higher ΔT fraction than ΔL fraction. This means that separation has been successfully achieved. The zinc content in the cumulative concentrate (all ΔT fractions combined) is 6.69%, with a utilizability of 14.16% (Table 2). The copper content in the cumulative concentrate is 0.58%, with an utilizability of 16.58%. The GC underperformance with zinc and copper can be attributed to the small concentration criteria of 1.4 in the two-component system of oxidized zinc alloy grains with copper and an amorphous phase.
4. Conclusions
The study establishes a novel procedure for valorizing historical Pb-Zn slag that involves crushing, grinding, and subsequent separation processes for concentrating valuable components (nonferrous metals). This technology will have a considerable impact on the global beneficiation of metallurgical slags since, in theory, it is much simpler, more ecologically friendly, and less expensive than typical pyrometallurgical or hydrometallurgical methods. The main conclusions are stated below:
- The investigated Pb-Zn slag is not an ore, but rather an engineered secondary raw material; thereby, it contains more than just minerals. It consists of an amorphous phase and alloy grains of lead, copper, and zinc, which are valuable components.
- The minerals found in Pb-Zn slag are largely artificial minerals, which are rare in nature and generated under extreme conditions.
- This is the first all-inclusive (physical-chemical, mineralogical, and technical) investigation into this type of Pb-Zn slag. There are no past practical or theoretical experiences with this specific raw material; therefore, the findings cannot be compared to those achieved with ores, minerals, or even other forms of slag. For these reasons, the techniques for preparing and valorizing beneficial components are required to be tailored to the specific tested raw material, which represents a unique study in this field of science.
- Within the framework of this technological research, the following procedures were adopted: micronization (crushing and grinding) and separation (magnetic and gravity).
- Crushing using a roller crusher revealed that the raw material is exceedingly hard and difficult to break, and that during crushing, it frequently takes on needle-like and elongated shapes.
- Grindability tests demonstrated that the solid phase of Pb-Zn slag acts fundamentally differently from ore during wet grinding: no pulp is produced, no film forms on the mill balls, and water remains in excess in one part of the mill. The adopted solid phase share was 70%, with grinding times ranging from 14 to 44 minutes. Coarser classes (+150μm and -150+100μm) could not be discarded or declared as tailings since they all include valuable alloy grains or intergrowths of alloys and glassy phase. During grinding, there is no segregation of non-ferrous metals into finer grades and tailings into bigger ones, at least not to the amount that would allow pre-concentration of the raw material to be accomplished through grading. The mineralogical examination of the grinding test results revealed that the usable components of the Pb-Zn slag are the most efficiently liberated at a crushing fineness of -0.1+0.00 mm.
- The magnetic separation performed on the Davis separator and the disk separator gave unsatisfactory results; specifically, the magnetic and non-magnetic fractions were not adequately separated. In the Davis separator, the MF accounts for 14.81% of the total mass, while the NMF accounts for 85.19%. The MF has a relatively high concentration of nonferrous metals, but no significant concentration of nonferrous metals was found in the NMF. There was no significant increase in iron concentration in MF compared to the input. Disk separator produced better results: MF had a mass share of 53.11%. However, the iron level in NMF is high, at 29.86%. Optical microscopy revealed that the Pb-Zn slag was properly prepared for magnetic separation and that valuable elements should be optimally liberated. However, SEM/EDS investigation revealed that non-ferrous alloys include iron and exhibit some degree of magnetism, so they pass into the magnetic fraction. The majority of Fe was bonded in mineral or amorphous formations, making the concentration difficult using magnetic separation. As a result, the usable components could not be separated from the tailings to produce one end product.
- Gravity concentration procedure gave satisfactory results for separating lead and silver concentrates. The results obtained for the separation of zinc and copper concentrates are somewhat inferior. The majority of useful elements are located in the coarser classes, from where they can be separated. The GC underperformance with zinc and copper can be attributed to the small concentration criteria of 1.4 in the two-component system of oxidized zinc alloy grains with copper and an amorphous phase.
The demonstrated methodology of valorizing Pb-Zn slag can reduce the usage of harmful chemicals in hydrometallurgical refinement processes, as well as the extremely high temperatures required for pyrometallurgical treatment. This is the first study to look into the feasibility of this new approach, which includes direct testing of the Pb-Zn slag feed with various separation and concentration techniques. After extracting the valuable metals, the amorphous aluminosilicate fraction of the Pb-Zn slag can be reapplied as an alternative raw material in the construction industry, increasing the circularity of the proposed approach.
Author Contributions
Conceptualization, D.R, A.T.; methodology, D.R., A.T., J.S.; validation, D.R., A.T., J.S.; formal analysis, D.R., J.S., V.J., D.T.; investigation, D.R., J.S., D.T.; writing—original draft preparation, review and corrections, A.T., D.R.; D.R.; M.S, D.B. contributed to the design and implementation of the research. supervision, A.T., D.R. All authors have read and agreed to the published version of the manuscript.
Funding
This research was funded by the Ministry of Science, Technological Development and Innovation of the Republic of Serbia (Contract No.: 451-03-47/2024-01/200012 and 451-03-66/2024-03/ 200012) and COST Action CA22124: EU Circular Economy Network for All: Consumer Protection through reducing, reusing, repairing
Institutional Review Board Statement
Not applicable.
Informed Consent Statement
Not applicable.
Data Availability Statement
Not applicable.
Acknowledgments
The authors gratefully appreciate support from the projects financially supported by the Ministry of Science, Technological Development and Innovation of the Republic of Serbia ((Contract No.: 451-03-47/2024-01/200012 and 451-03-66/2024-03/ 200012) and COST Action CA22124: EU Circular Economy Network for All: Consumer Protection through reducing, reusing, repairing).
Conflicts of Interest
The authors declare they have no competing interest or financial conflict among them.
References
- Schellens, M.K.; Gisladottir, J. Critical Natural Resources: Challenging the Current Discourse and Proposal for a Holistic Definition. Resources 2018, 7, 79. [Google Scholar] [CrossRef]
- Shuai, J.; Zhao, Y.; Xiong, X.; Shuai, C.; Wang, J. The co-opetition relationships of critical mineral resources for the solar PV industry between China and the world major powers. J. Clean. Product. 2023, 426, 139171. [Google Scholar] [CrossRef]
- Aarikka-Stenroos, L.; Kokko, M.; Pohls, E. Catalyzing the circular economy of critical resources in a national system: Case study on drivers, barriers, and actors in nutrient recycling. J. Clean. Product. 2023, 397, 136380. [Google Scholar] [CrossRef]
- Helbig, C.; Schrijvers, D.; Hool, A. Selecting and prioritizing material resources by criticality assessments. One Earth 2021, 4:3, 339–345. [Google Scholar] [CrossRef]
- Santosh, M.; Groves, D.; Yang, C. Habitable planet to sustainable civilization: Global climate change with related clean energy transition reliant on declining critical metal resources. Gondwana Research. 2024, 130, 220–233. [Google Scholar] [CrossRef]
- Groves, D.; Müller, D.; Santosh, M.; Yang, C. The heterogeneous distribution of critical metal mineral resources: An impending geopolitical issue. Geosystems and Geoenvironment. 2024, 100288. [Google Scholar] [CrossRef]
- Chen, D.T.; Roy, A.; Li, Y.; Bogush, A.; Au, W.Y.; Stegemann, J. Speciation of toxic pollutants in Pb/Zn smelter slags by X-ray Absorption Spectroscopy in the context of the literature. J. Hazard. Mater. 2023, 460, 132373. [Google Scholar] [CrossRef]
- U.S. Geological Survey Releases 2022 List of Critical Minerals. Available online: https://www.usgs.gov/news/national-news-release/us-geological-survey-releases-2022-list-critical-minerals (accessed on 22 May 2024).
- Kania, H.; Saternus, M. Evaluation and Current State of Primary and Secondary Zinc Production—A Review. Appl. Sci. 2023, 13, 2003. [Google Scholar] [CrossRef]
- Carbon Footprints of Teck Special High Grade Zinc and Continuous Galvanizing Grade Zinc. Available online: https://www.teck.com/media/Carbon-Footprint-of-Teck-Special-High-Grade-Zinc.pdf (accessed on 22 May 2024).
- World resource forum. Available online: https://www.wrforum.org/wrf-publications/resource-snapshot-6-lead (accessed on 22 May 2024).
- Statista. Available online: www.statista.com (accessed on 22 May 2024).
- Bača, P.; Vanýsek, P. Issues Concerning Manufacture and Recycling of Lead. Energies. 2023, 16, 4468. [Google Scholar] [CrossRef]
- U.S. Environmental Protection Agency (EPA). Available online: https://www.epa.gov (accessed on 22 May 2024).
- Buch, A.C.; Niemeyer, J.C.; Marques, E.D.; Silva-Filho, E.V. Ecological risk assessment of trace metals in soils affected by mine tailings. J. Hazard Mater. 2021, 403, 123852. [Google Scholar] [CrossRef]
- Nowińska, K.; Zdzisław, A. Slags of the Imperial Smelting Process for Zn and Pb Production. In book: Reference Module in Materials Science and Materials Engineering. Ed. Saleem Hashmi. Oxford, Elsevier. 2017, 1–5. [Google Scholar] [CrossRef]
- Safa, M.; Goodarzi, A.; Lorestani, B. Enhanced post freeze-thaw stability of Zn/Pb co-contaminated soil through MgO-activated steel slag and fiber treatment. Cold Regions Sci. Technol. 2023, 210, 103826. [Google Scholar] [CrossRef]
- Ettler, V.; Johan, Z. 12 years of leaching of contaminants from Pb smelter slags: Geochemical/mineralogical controls and slag recycling potential. Appl. Geochem. 2014, 40, 97–103. [Google Scholar] [CrossRef]
- Wang, W. , Gan, Y., Kang, X., Synthesis and characterization of sustainable ecofriendly unburned bricks from slate tailings. J. Mater. Res. Technol. 2021. 14, 1697–1708. [CrossRef]
- Fawzy, M.; El Ghar, S.; Gaafar, I.; El shafey, A.; Diab, M.; Hussein, A. Recovery of valuable heavy minerals via gravity and magnetic separation operations from Diit Quaternary stream sediments, southern coast of the Red Sea. Egypt. J. Physics. 2022, 2305, 012020. [Google Scholar] [CrossRef]
- Saedi, A.; Jamshidi-Zanjani, A.; Darban, A.K.; Mohseni, M.; Nejati, H. Utilization of lead–zinc mine tailings as cement substitutes in concrete construction: Effect of sulfide content. J. Build. Eng. 2022, 57, 104865. [Google Scholar] [CrossRef]
- Chen, W.; Peng, R.; Straub, C.; Yuan, B. Promoting the performance of one-part alkali-activated slag using fine lead-zinc mine tailings. Constr. Build. Mater. 2020, 236, 117745. [Google Scholar] [CrossRef]
- Doussang, L.; Samson, G.; Deby, F.; Huet, B.; Guillon, E.; Cyr, M. Durability parameters of three low-carbon concretes (low clinker, alkali-activated slag and supersulfated cement). Constr. Build. Mater. 2023, 407, 133511. [Google Scholar] [CrossRef]
- Monteiro, N.B.R. , da Silva, E.A., Moita Neto, J.M., Sustainable development goals in mining. J. Clean. Prod. 2019, 228, 509–520. [Google Scholar] [CrossRef]
- United nations - SDGs. Available online: https://unfoundation.org/what-we-do/issues/sustainable-development-goals/ (accessed on 22.5.2024).
- Kanneboina, Y.; Saravanan, J.; Kabeer, T.; Bisht, K. Valorization of lead and zinc slags for the production of construction materials - A review for future research direction. Constr. Build. Mater. 2023, 367, 130314. [Google Scholar] [CrossRef]
- Kamura, K.; Makita, R.; Uchiyama, R.; Tanaka, H. Examination of metal sorting and concentration technology in landfill mining –with focus on gravity and magnetic force sorting. Waste Manage. 2022, 141, 147–153. [Google Scholar] [CrossRef]
- Assar, M.; Asaadian, H.; Stanko, M.; Grimes, B.A. A theoretical and experimental investigation of continuous oil–water gravity separation. Chem. Engin. Sci. 2024, 298, 120375. [Google Scholar] [CrossRef]
- Luo, L.; Zhang, X.; Wang, H.; Zheng, B.; Wei, C. Comparing strategies for iron enrichment from Zn- and Pb-bearing refractory iron ore using reduction roasting-magnetic separation. Powder Technol. 2021, 393, 333–341. [Google Scholar] [CrossRef]
- Li, Y.; Gao, J.; Lan, X.; Guo, Z. A novel method for efficient recovery of boron from boron-bearing iron concentrate: Mineral phase transformation and low-temperature separation via super-gravity. Mineral. Engin. 2022, 189, 107899. [Google Scholar] [CrossRef]
- Meng, L.; Liu, Y.; Qu, J.; Guo, Z. Enrichment and separation behaviors of impurities from stripped copper wire with super-gravity fields. Chem. Engin. Process. Process Intensification. 2023, 191, 109483. [Google Scholar] [CrossRef]
- Jordens, A.; Sheridan, R.; Rowson, N.; Waters, K. Processing a rare earth mineral deposit using gravity and magnetic separation. Mineral. Engin. 2014, 62, 9–18. [Google Scholar] [CrossRef]
- Jordens, A.; Marion, C.; Langlois, R.; Grammatikopoulos, T.; Rowson, N.; Waters, K. Beneficiation of the Nechalacho rare earth deposit. Part 1: Gravity and magnetic separation. Mineral. Engin 2016, 99, 111–122. [Google Scholar] [CrossRef]
- Khalil, A.; Argane, R.; Benzaazoua, M.; Bouzahzah, H.; Taha, Y.; Hakkou, R. Pb–Zn mine tailings reprocessing using centrifugal dense media separation. Mineral. Engin. 2019, 131, 28–37. [Google Scholar] [CrossRef]
- Amosah, M.E.; Yvon, M.; Zhou, J.; Galvin, K. The role of enhanced desliming and gravity separation as a precursor to flotation in the upgrading of cassiterite from tailings. Mineral.Engin. 2024, 208, 108581. [Google Scholar] [CrossRef]
- Rodrigues, A.; Delboni, H.; Silva, K.; Zhou, J.; Galvin, K.; Filippov, L. Transforming iron ore processing – Simplifying the comminution and replacing reverse flotation with magnetic and gravity separation. Mineral. Engin. 2023, 199, 108112. [Google Scholar] [CrossRef]
- Radulović, D.; Terzić, A.; Stojanović, J.; Jovanović, V.; Todorović, D.; Ivošević, B. Reapplication Potential of Historic Pb–Zn Slag with Regard to Zero Waste Principles. Sustainability. 2024, 16, 720. [Google Scholar] [CrossRef]
- Hirschmann, M.M. Iron-wüstite revisited: A revised calibration accounting for variable stoichiometry and the effects of pressure. Geochimica et Cosmochimica Acta. 2021, 313, 74–84. [Google Scholar] [CrossRef]
- Zhang, Z. The Characteristics and Reduction of Wustite, Chapter (4) in Book Iron Ores and Iron Oxides - New Perspectives. Intech Open, Rijeka, 2023, 1. [CrossRef]
- Nikolić, V.; García, G.G.; Coello-Velázquez, A.L.; Menéndez-Aguado, J.M.; Trumić, M.; Trumić, M.S. A Review of Alternative Procedures to the Bond Ball Mill Standard Grindability Test. Metals 2021, 11, 1114. [Google Scholar] [CrossRef]
- Tyler sieves. Available online: https://wstyler.com/particleanalysis/ test-sieves/wstyler-test-sieves/ (accessed on 15 May 2024).
- Richardson, J.; Harker, J.; Backhurst, J. Particulate Solids, Chapter (1) in Book Chemical Engineering Series, Chemical Engineering (Fifth Edition), Butterworth-Heinemann, 2002, 1-94. [CrossRef]
- Murariu, V.; Svoboda, J. The Applicability of Davis Tube Tests to Ore Separation by Drum Magnetic Separators. Physical Separation Sci. Engin. 2003, 12, 803215. [Google Scholar] [CrossRef]
- Premaratne, W.A.P.J.; Rowson, N. The Processing of Beach Sand from Sri Lanka for the Recovery of Titanium Using Magnetic Separation. Physic. Separation Sci. Engin. 2003, 12. [Google Scholar] [CrossRef]
- Xie, S.; Hu, Z.; Lu, D.; Zhao, Y. Dry Permanent Magnetic Separator: Present Status and Future Prospects. Minerals 2022, 12, 1251. [Google Scholar] [CrossRef]
- R.J. Manser, R.W. Barley, B.A. Wills. The shaking table concentrator - The influence of operating conditions and table parameters on mineral separation - The development of a mathematical model for normal operating conditions. Mineral. Engin. 1991, 4:3–4, 369–381. [CrossRef]
- Çiçek, T.; Cöcen, I.; Engin, V.T; Cengizler, H. An efficient process for recovery of fine coal from tailings of coal washing plants. Energy Sources Part A Recovery Utilization and Environmental Effects. 2008, 30, 1716–1728. [Google Scholar] [CrossRef]
- Obradovic, N.; Fahrenholtz, W.G.; Corlett, C.; Filipovic, S.; Nikolic, M.; Marinkovic, B.A.; Failla, S.; Sciti, D.; Di Rosa, D.; Sani, E. Microstructural and Optical Properties of MgAl2O4 Spinel: Effects of Mechanical Activation, Y2O3 and Graphene Additions. Materials 2021, 14, 7674. [Google Scholar] [CrossRef] [PubMed]
- Trukhanov, A.V.; Trukhanova, E.; Zubar, T.; Yao, Y.; et al. Structure and magnetic properties of the spinel-polymer composites. J. Mater.s Res. Technol. 2024, 30, 7115–7124. [Google Scholar] [CrossRef]
- Al-Anazi, A.; Abdelraheem, W.H.; Scheckel, K.; Nadagouda, M.; O’Shea, K.; Dionysiou, D. Novel franklinite-like synthetic zinc-ferrite redox nanomaterial: synthesis, and evaluation for degradation of diclofenac in water. Appl Catal B. 2020, 275. [Google Scholar] [CrossRef] [PubMed]
Figure 1.
The experimental plan of Pb-Zn slag treatment.
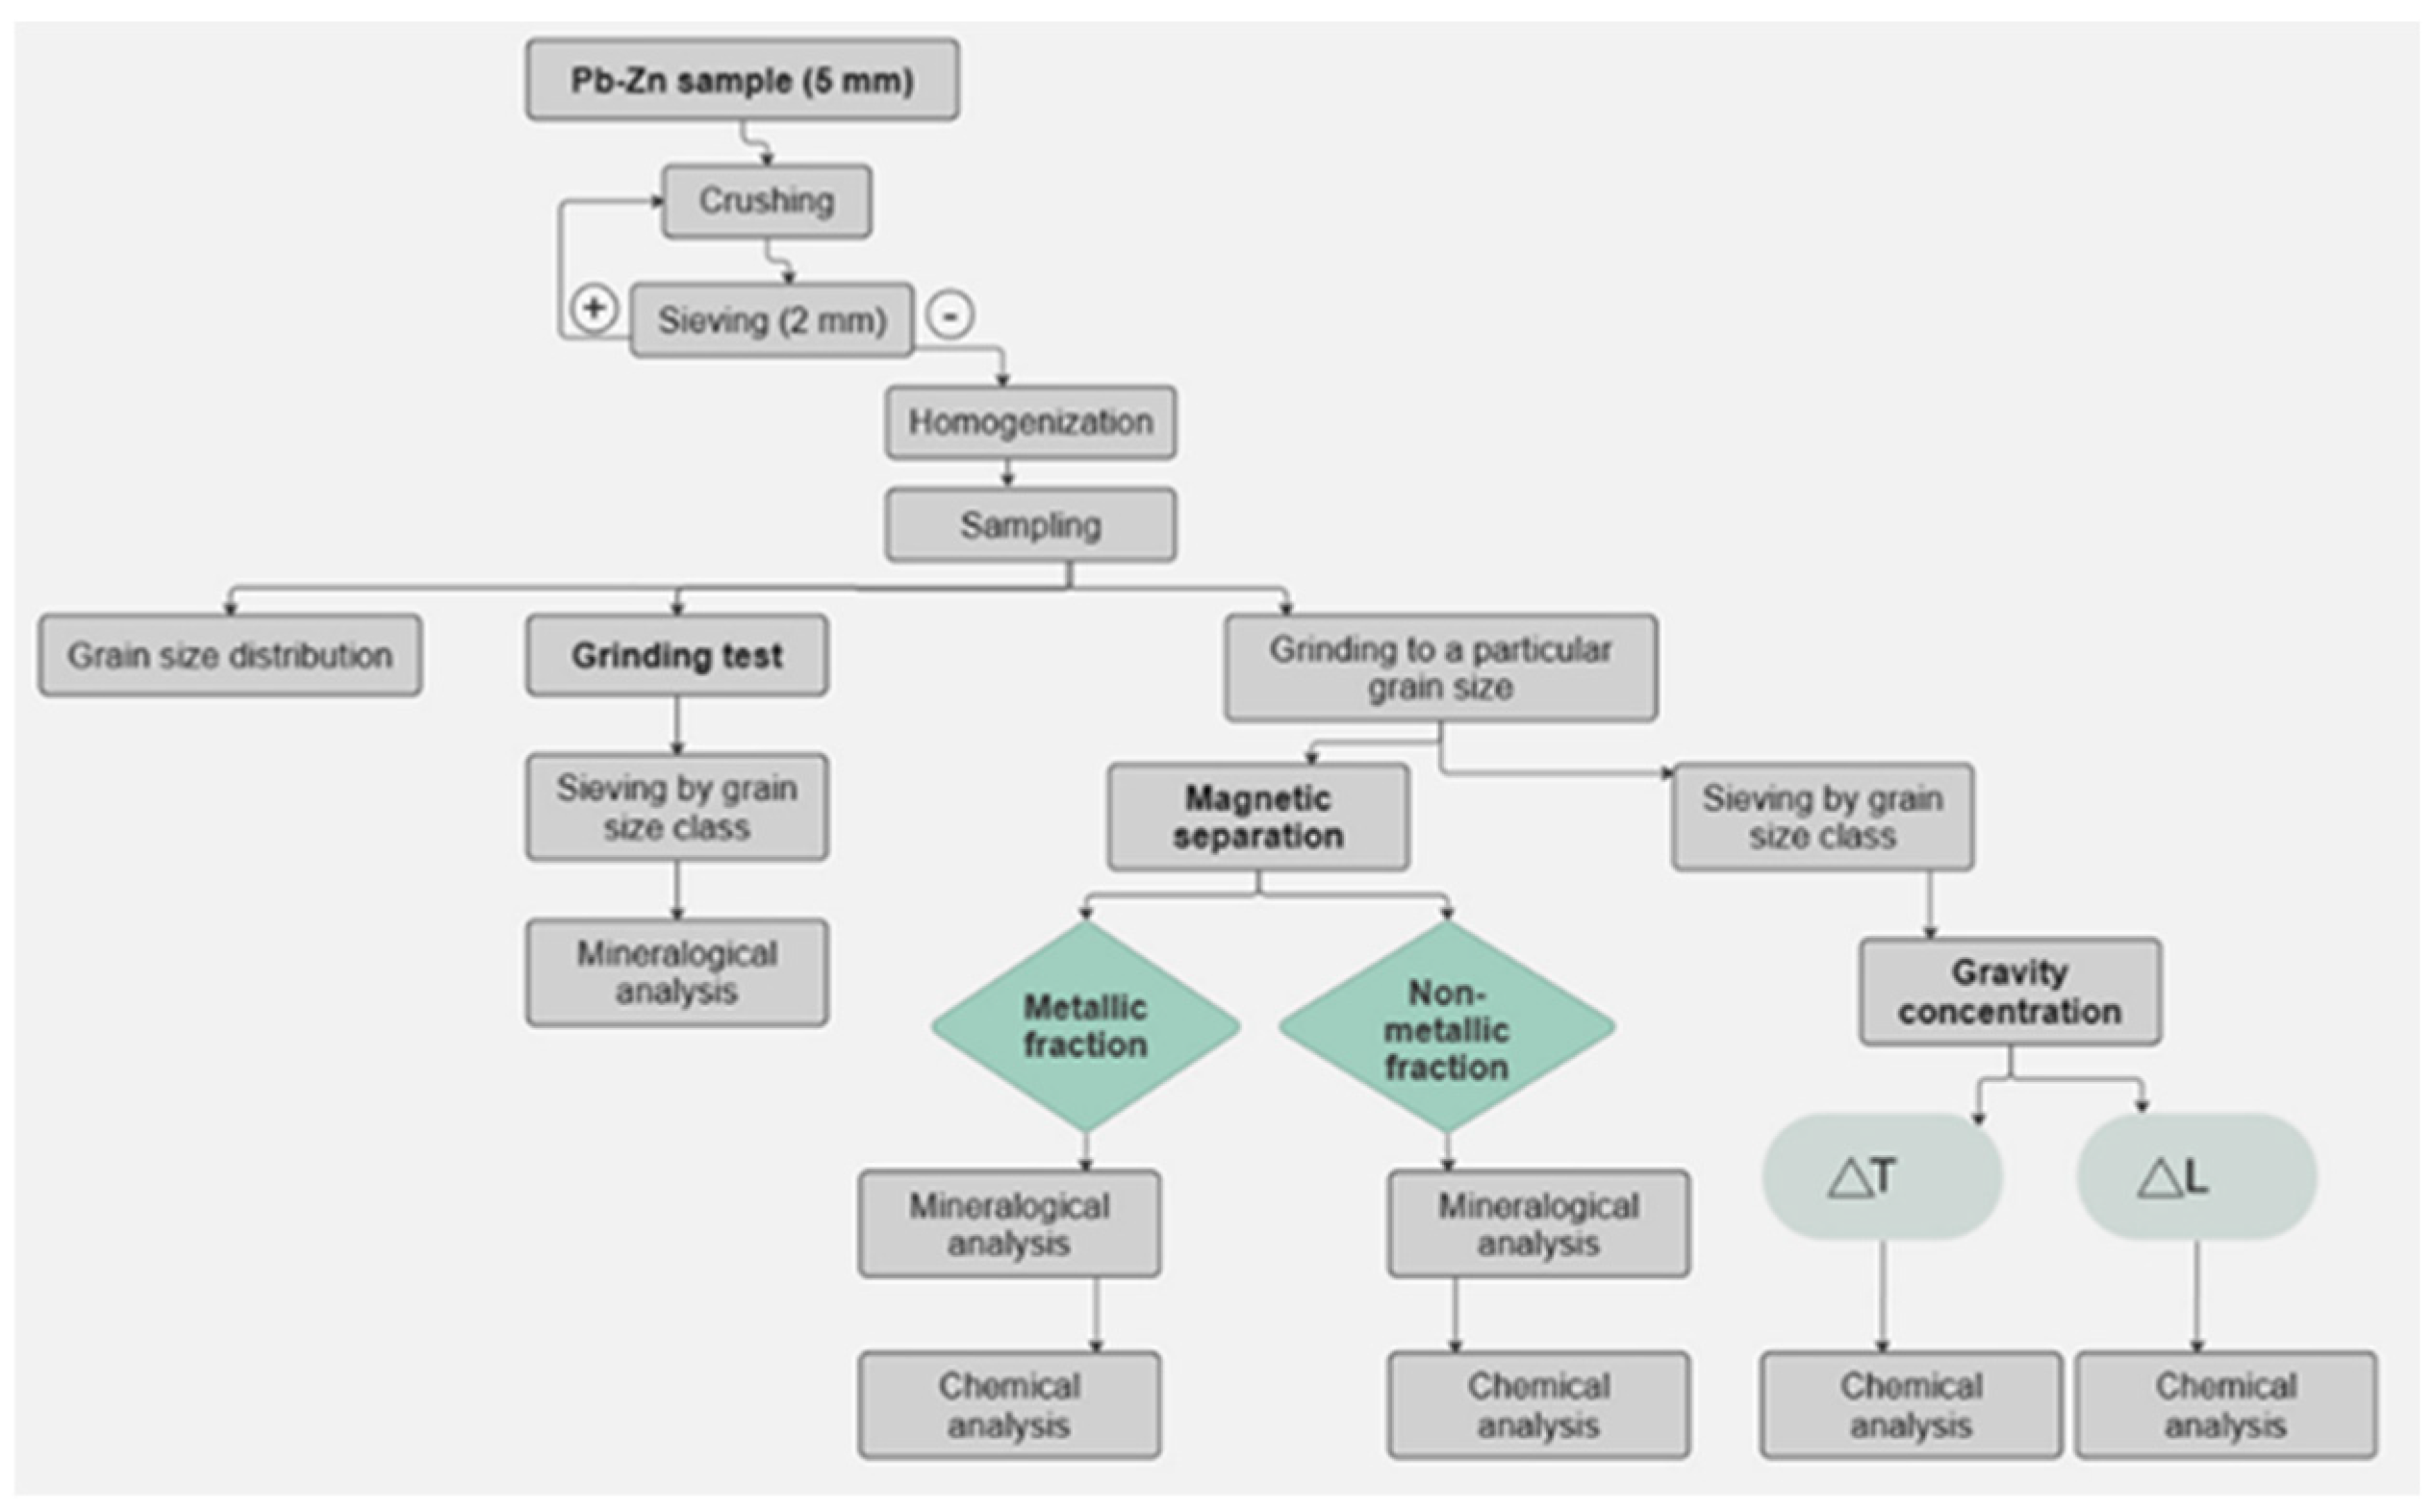
Figure 2.
Grain size distribution of the starting Pb-Zn slag sample.
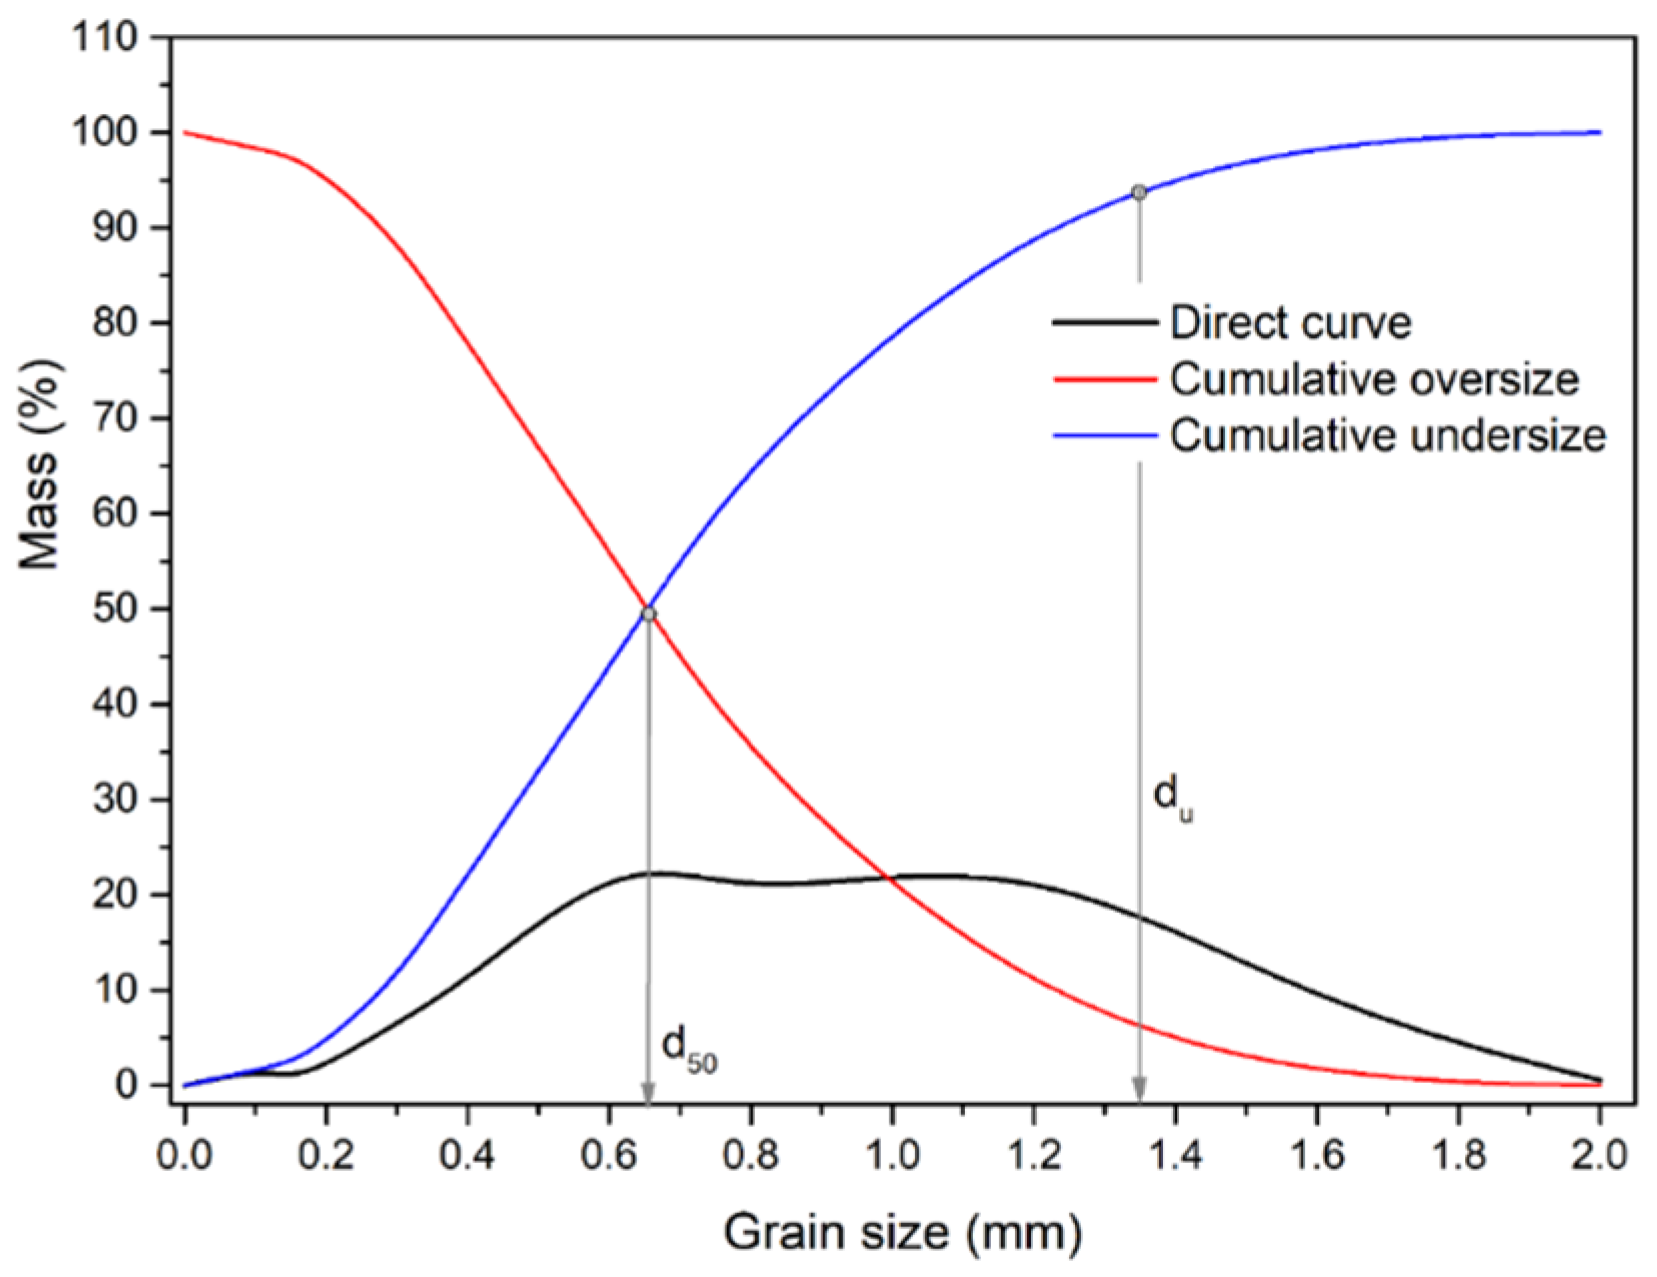
Figure 3.
Scheme for preparing and separating Pb-Zn slag samples using the GC method.
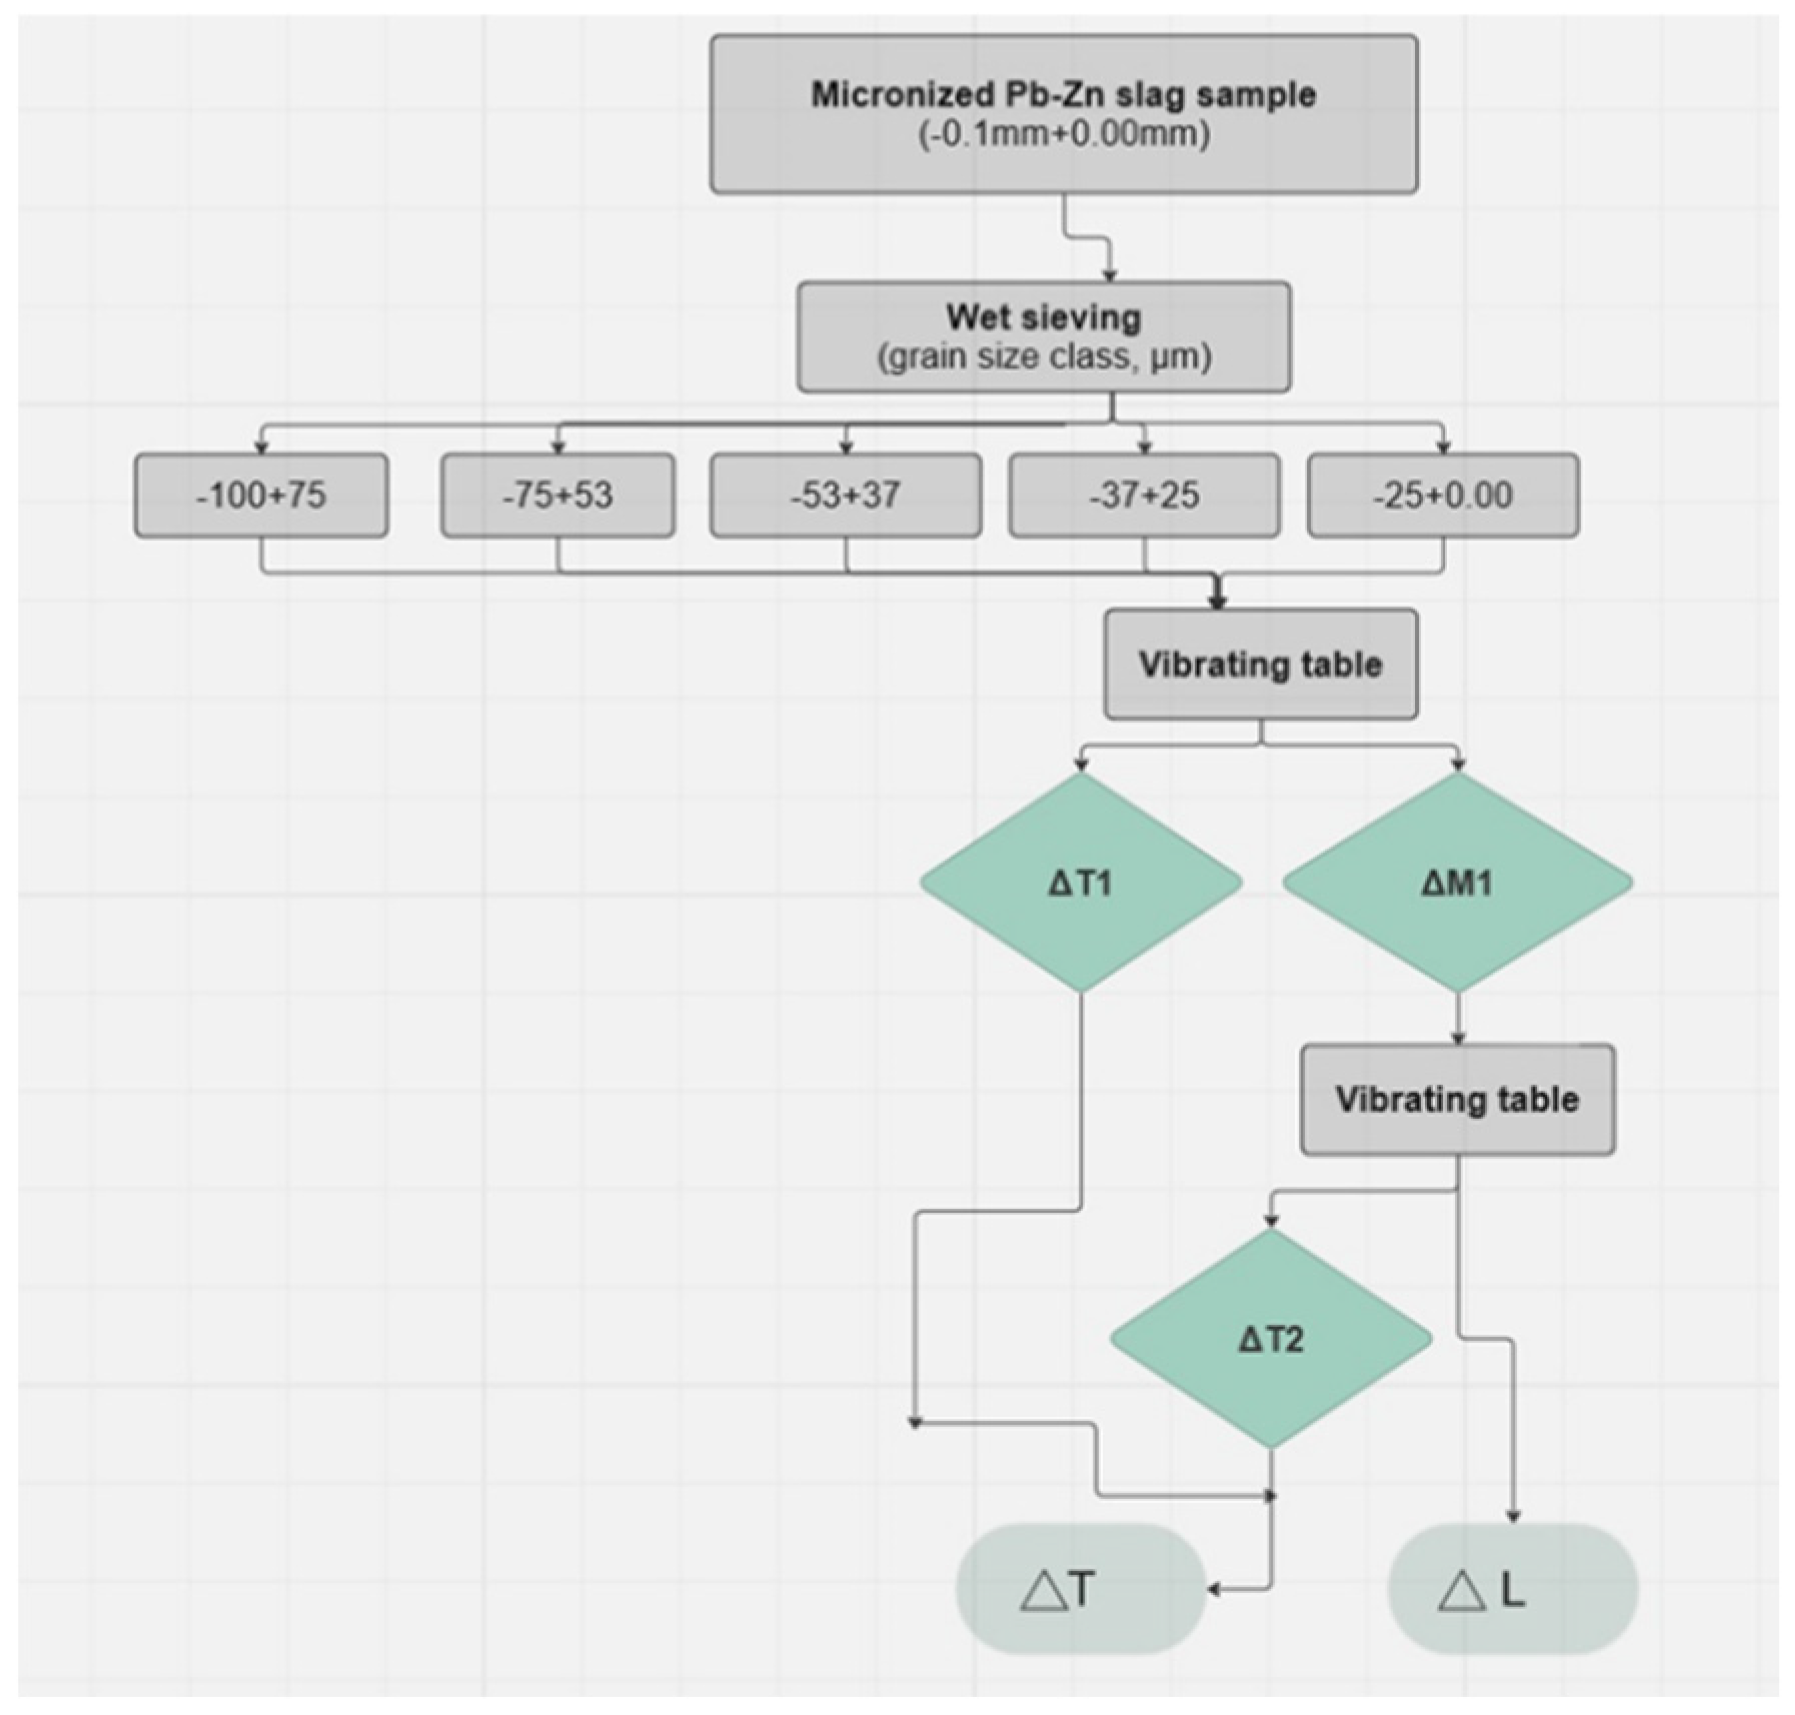
Figure 4.
Grain size distribution diagrams for ES-1 (wet grinding).
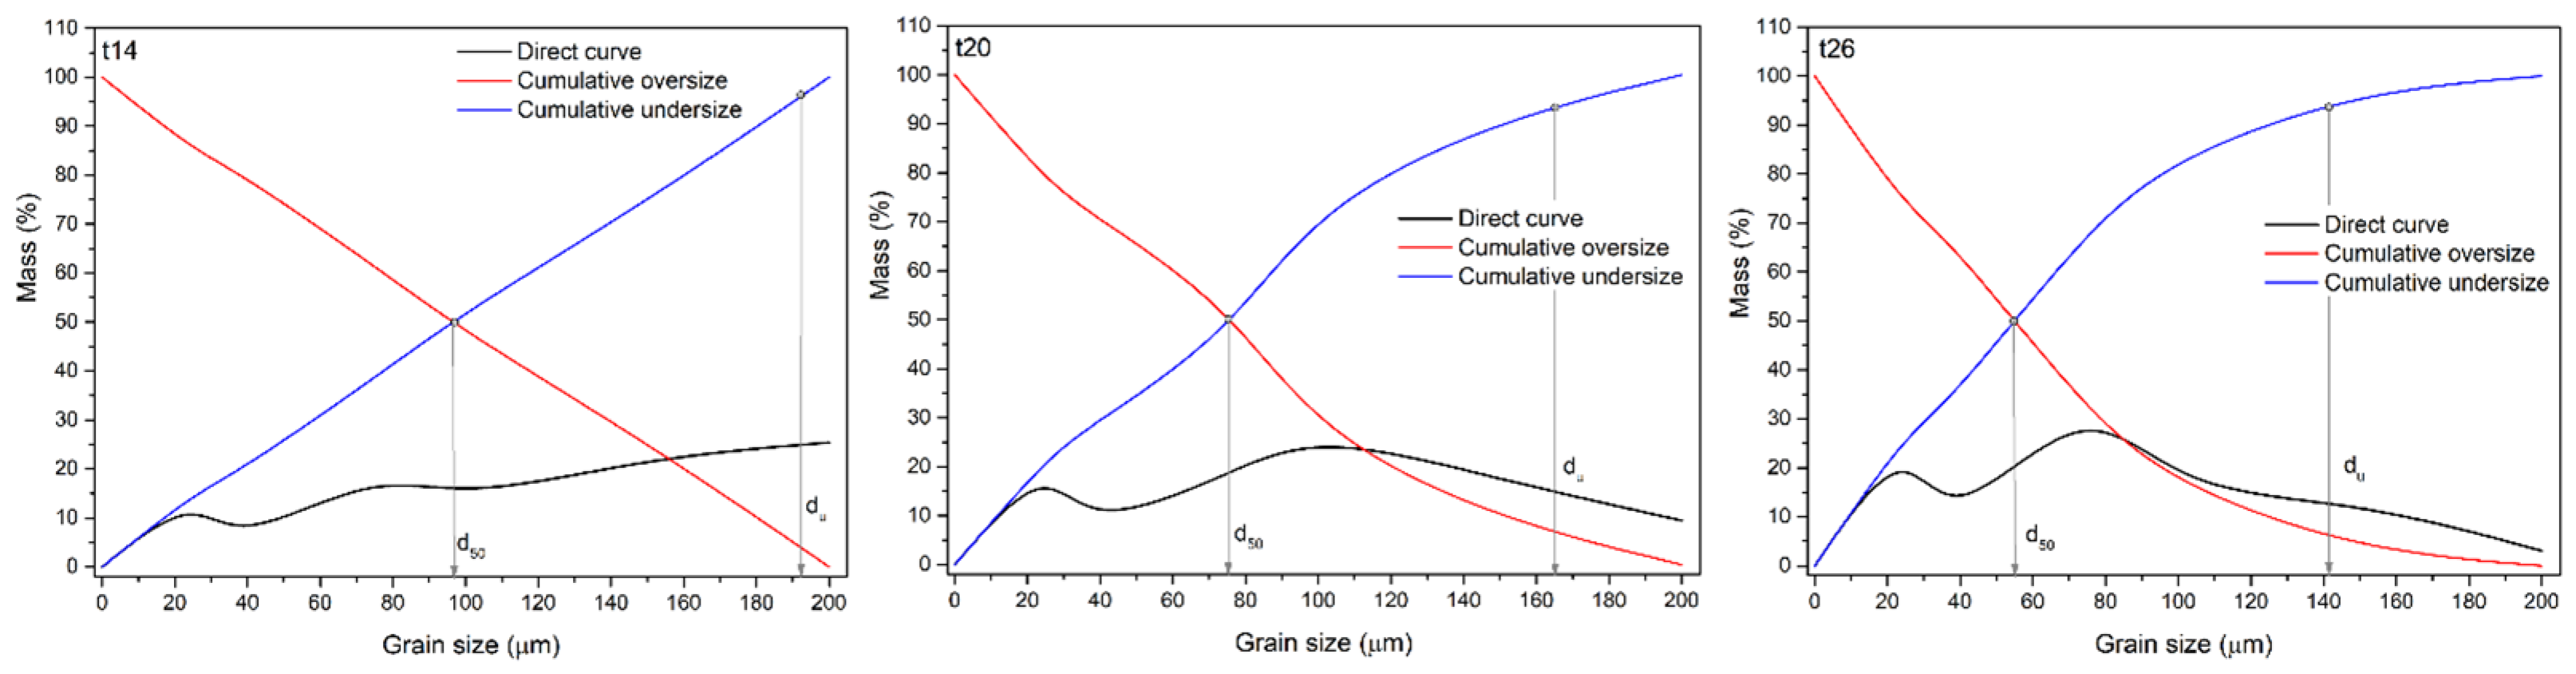
Figure 5.
Grain size distribution diagrams for ES-2 (wet grinding).
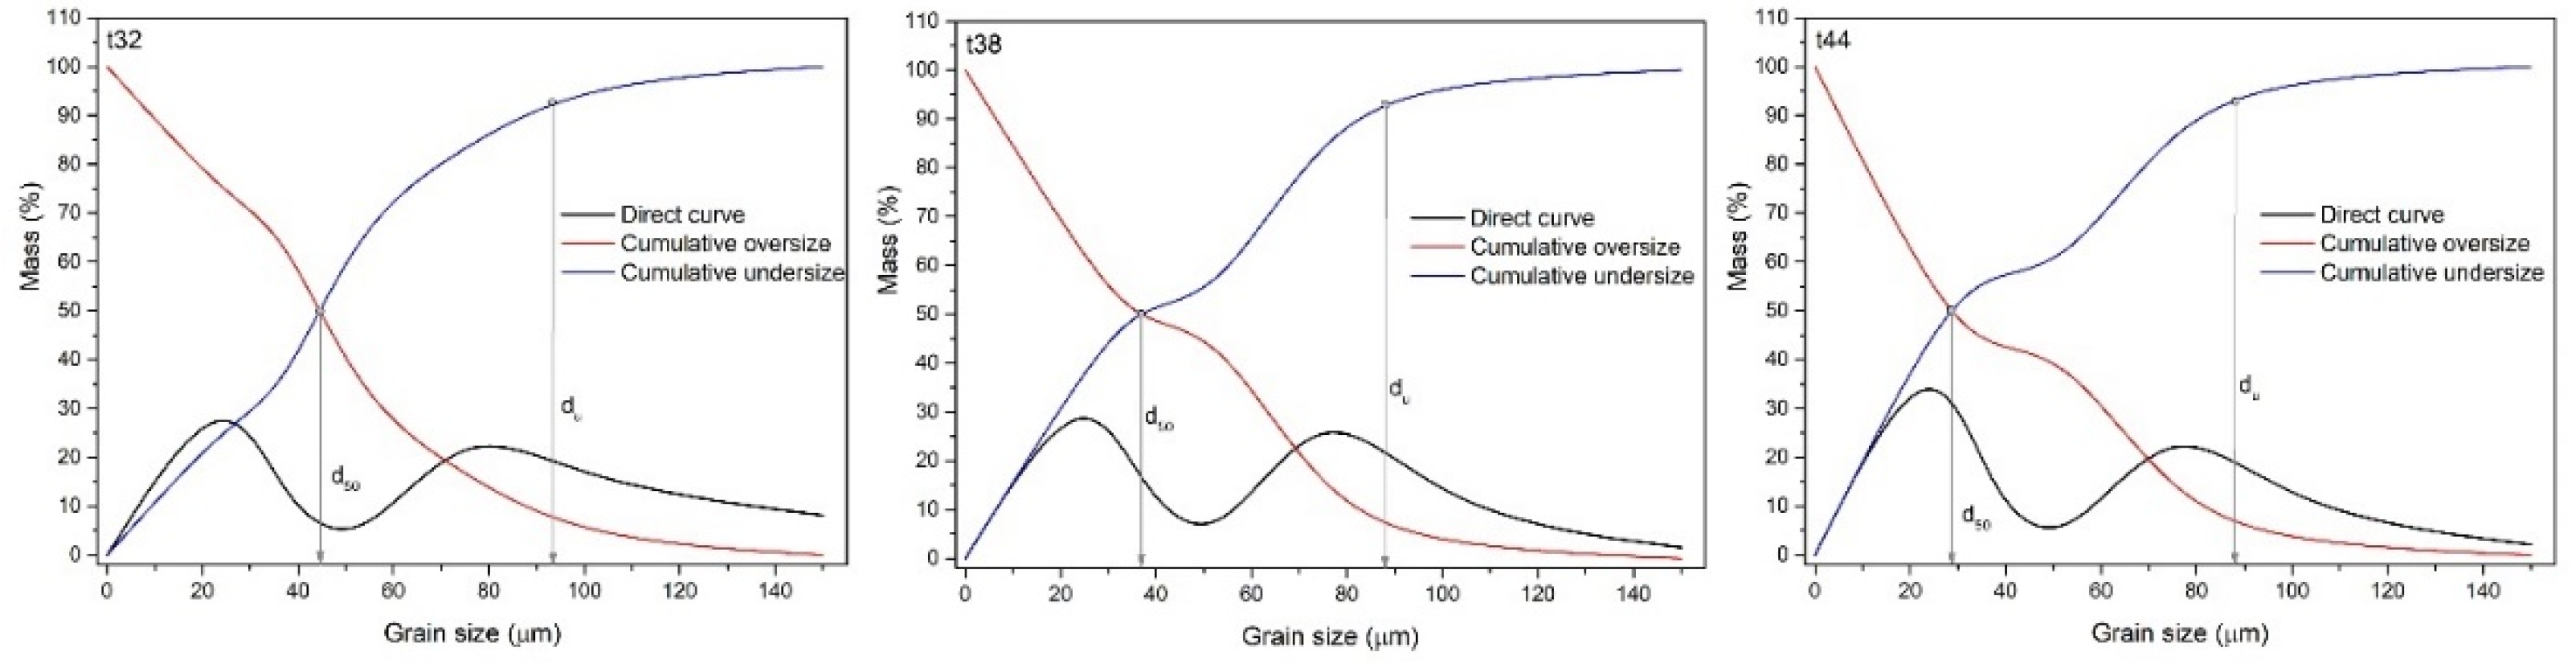
Figure 6.
Grain size distribution of the Pb-Zn slag grain mixture after dry grinding.
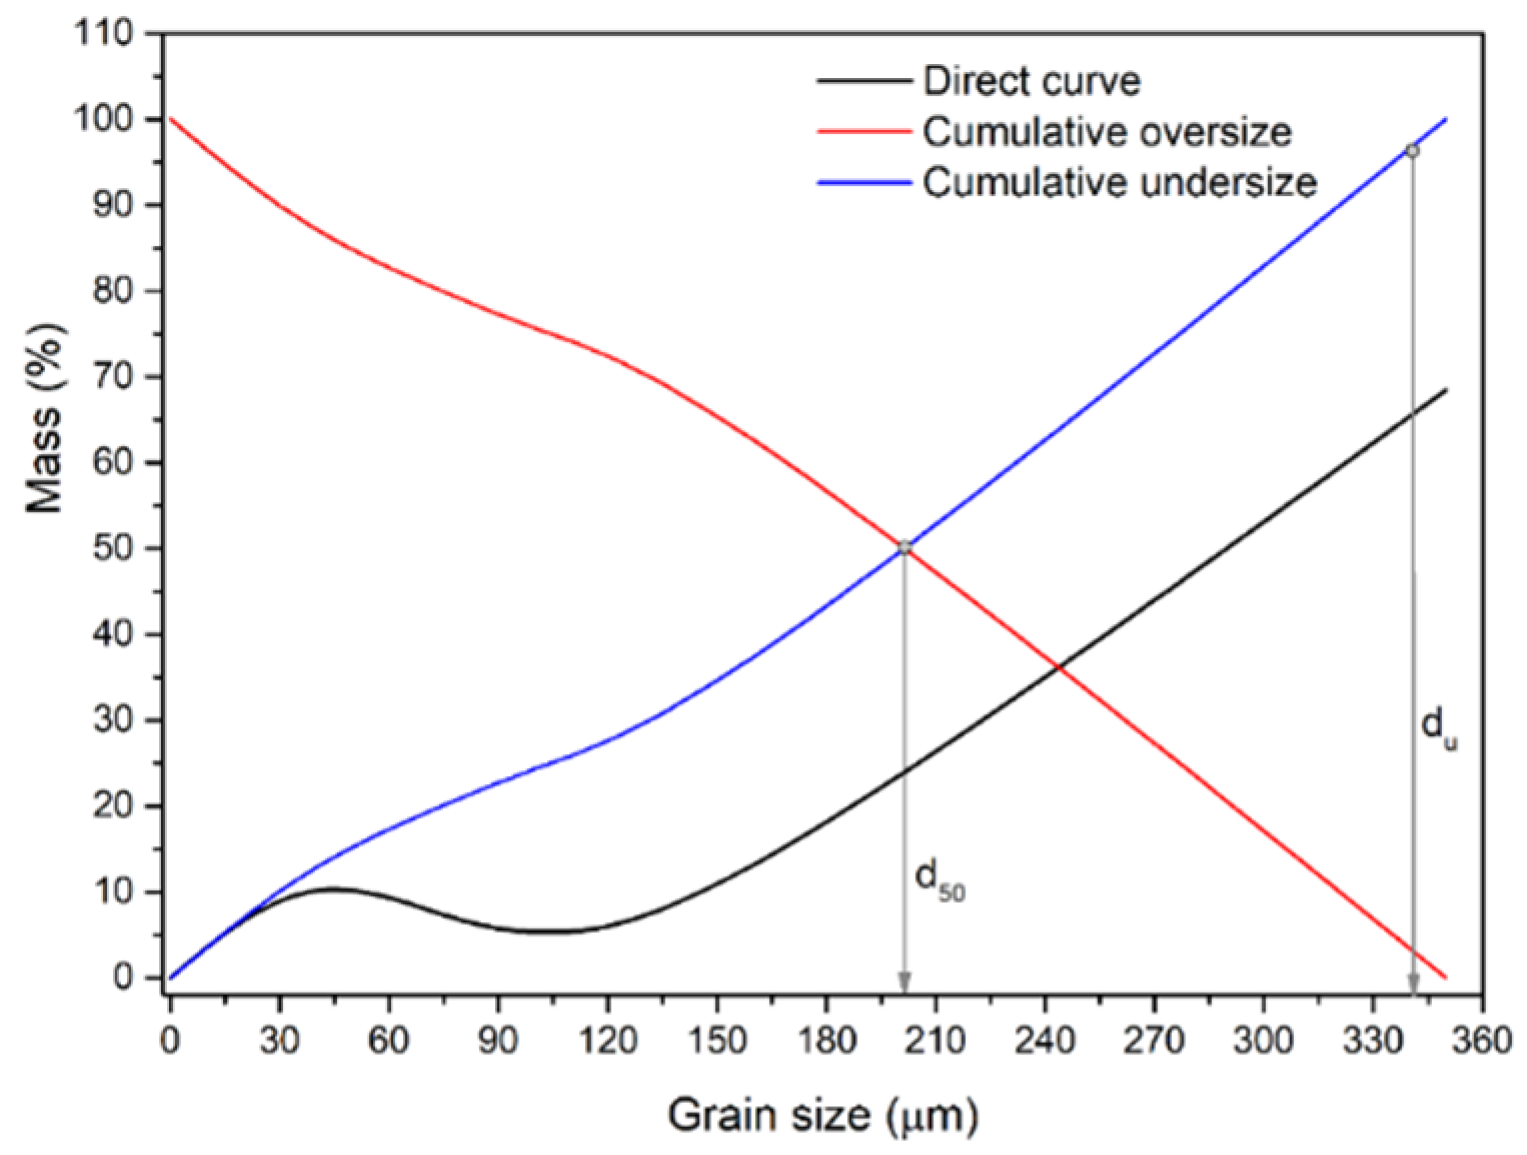
Figure 7.
Magnetic separation balance of Pb-Zn slag after application of Davis separator.
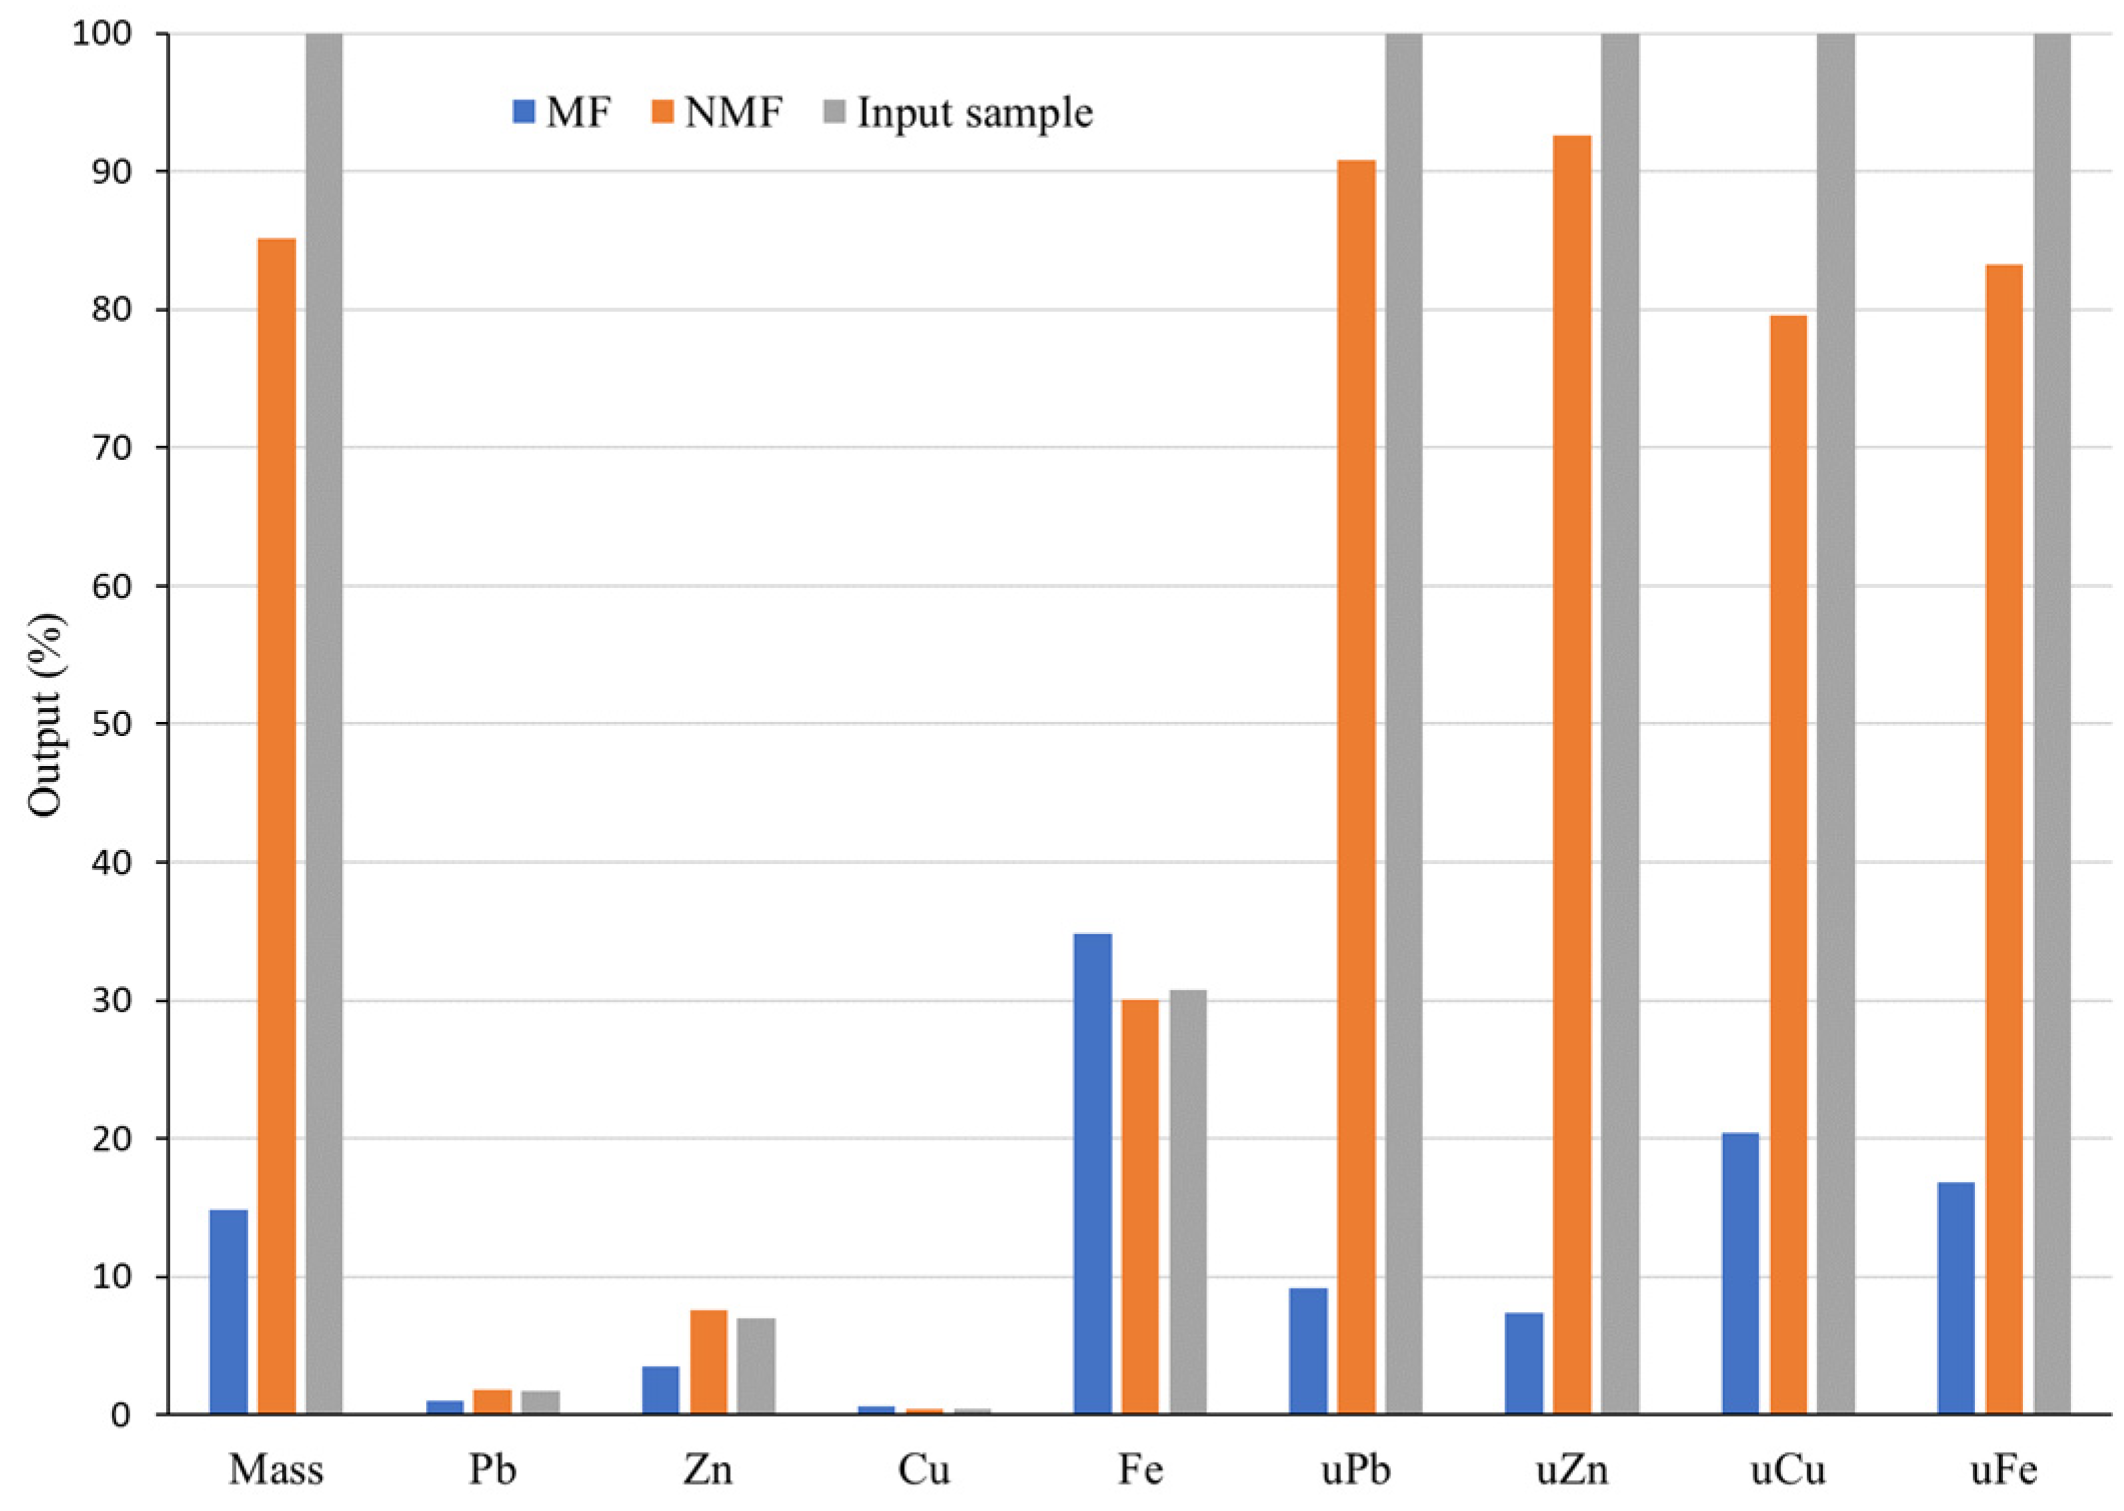
Figure 8.
Magnetic separation balance of Pb-Zn slag after application of disk separator.
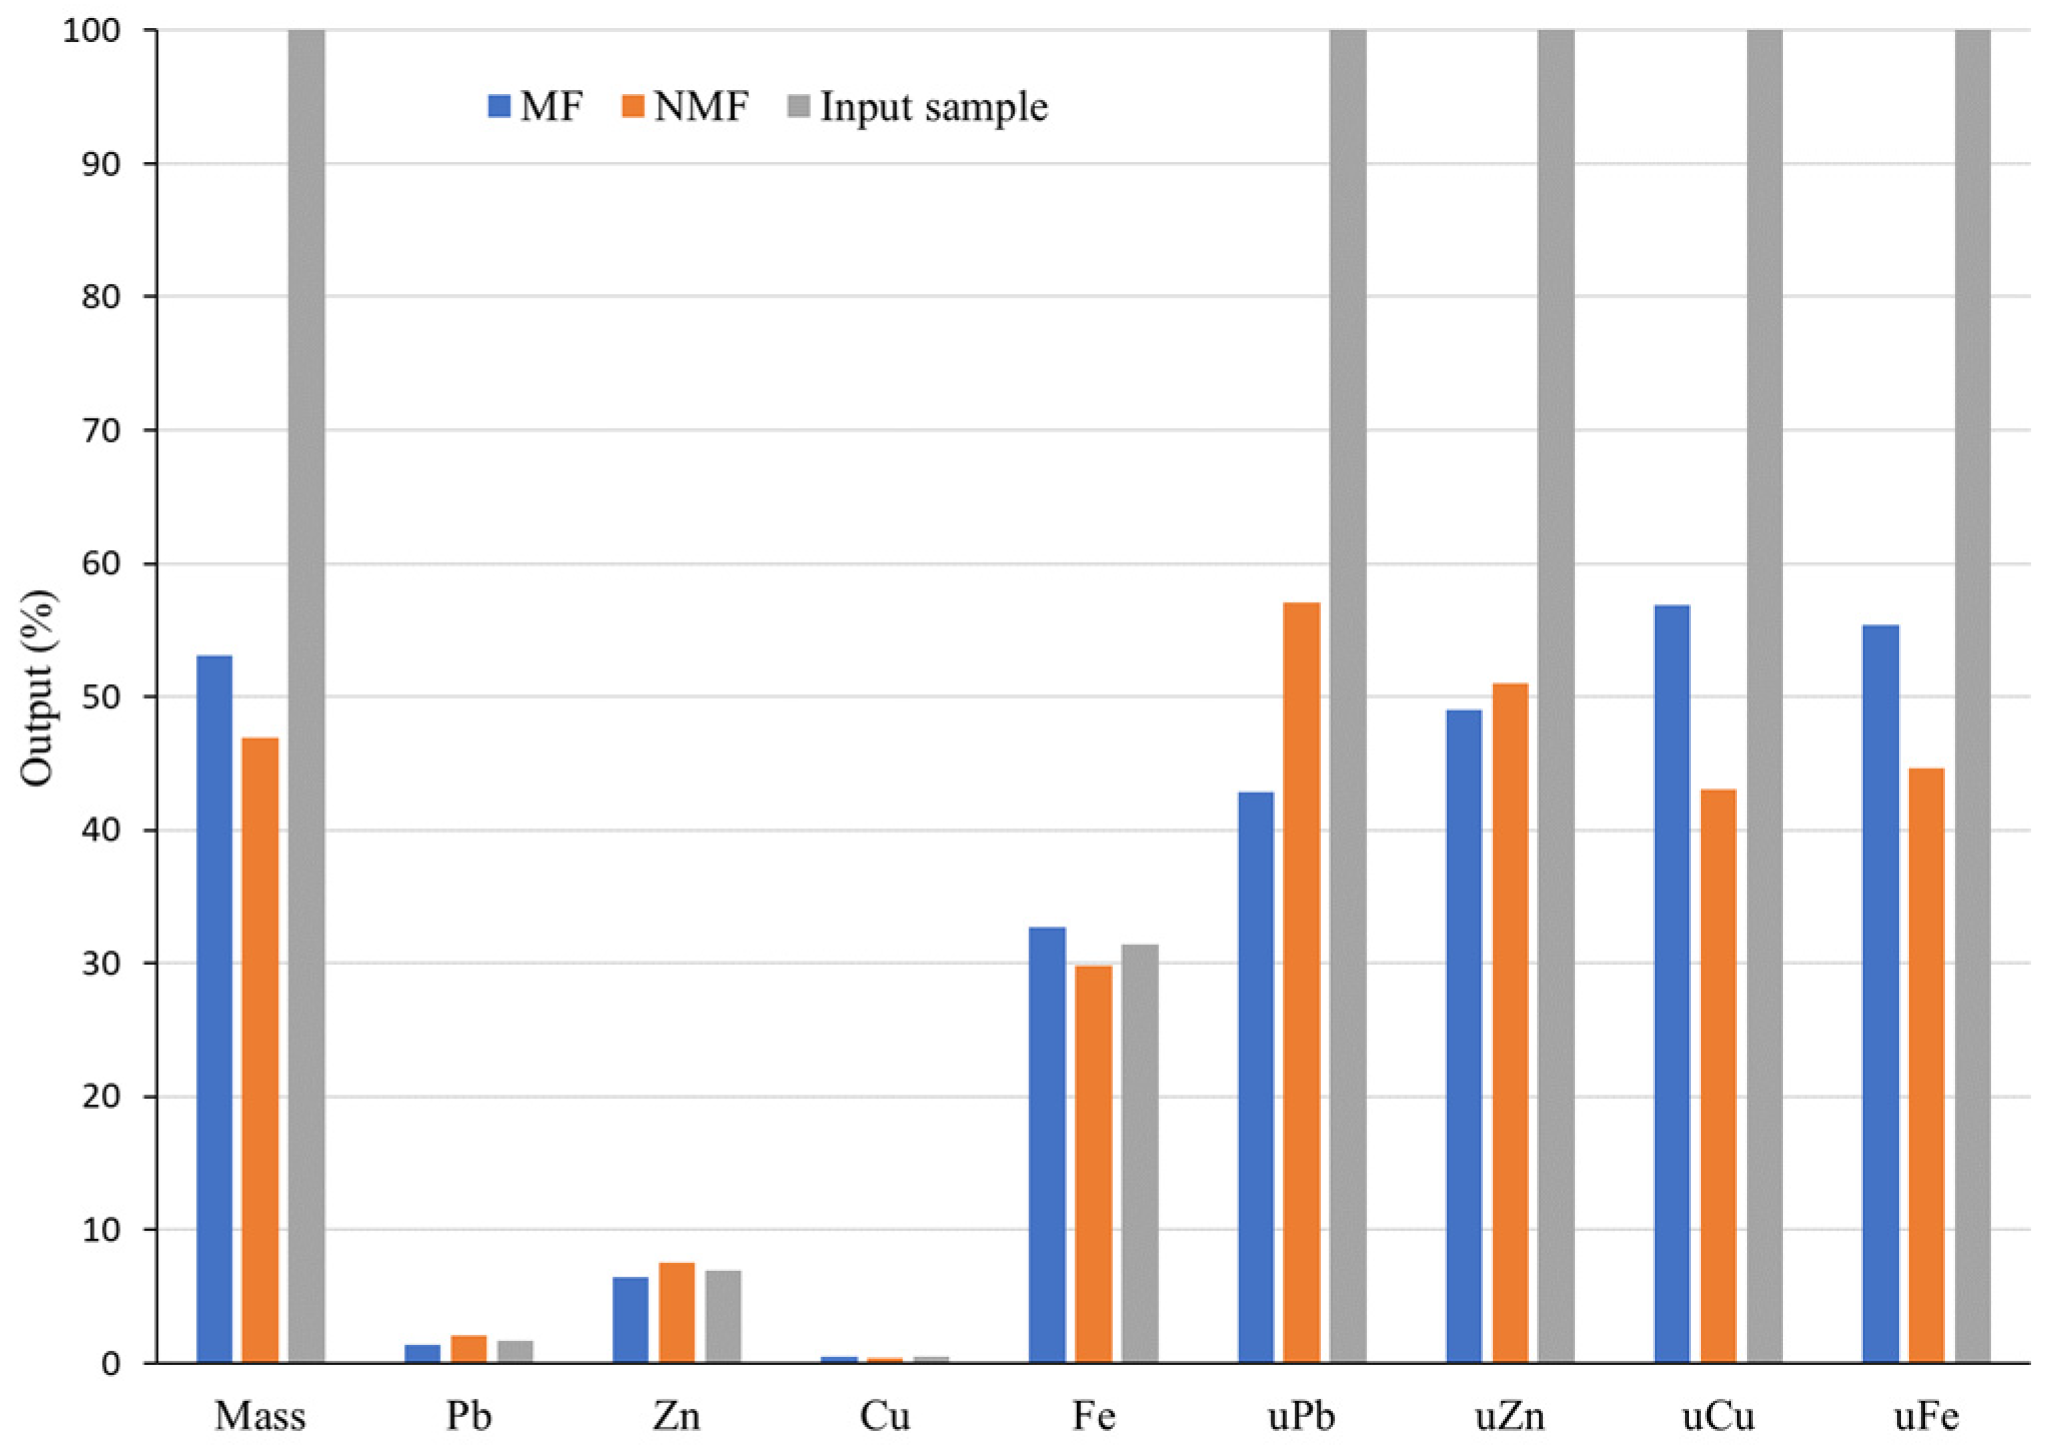
Figure 9.
Microphotographs of the magnetic fraction of the Pb-Zn slag sample.
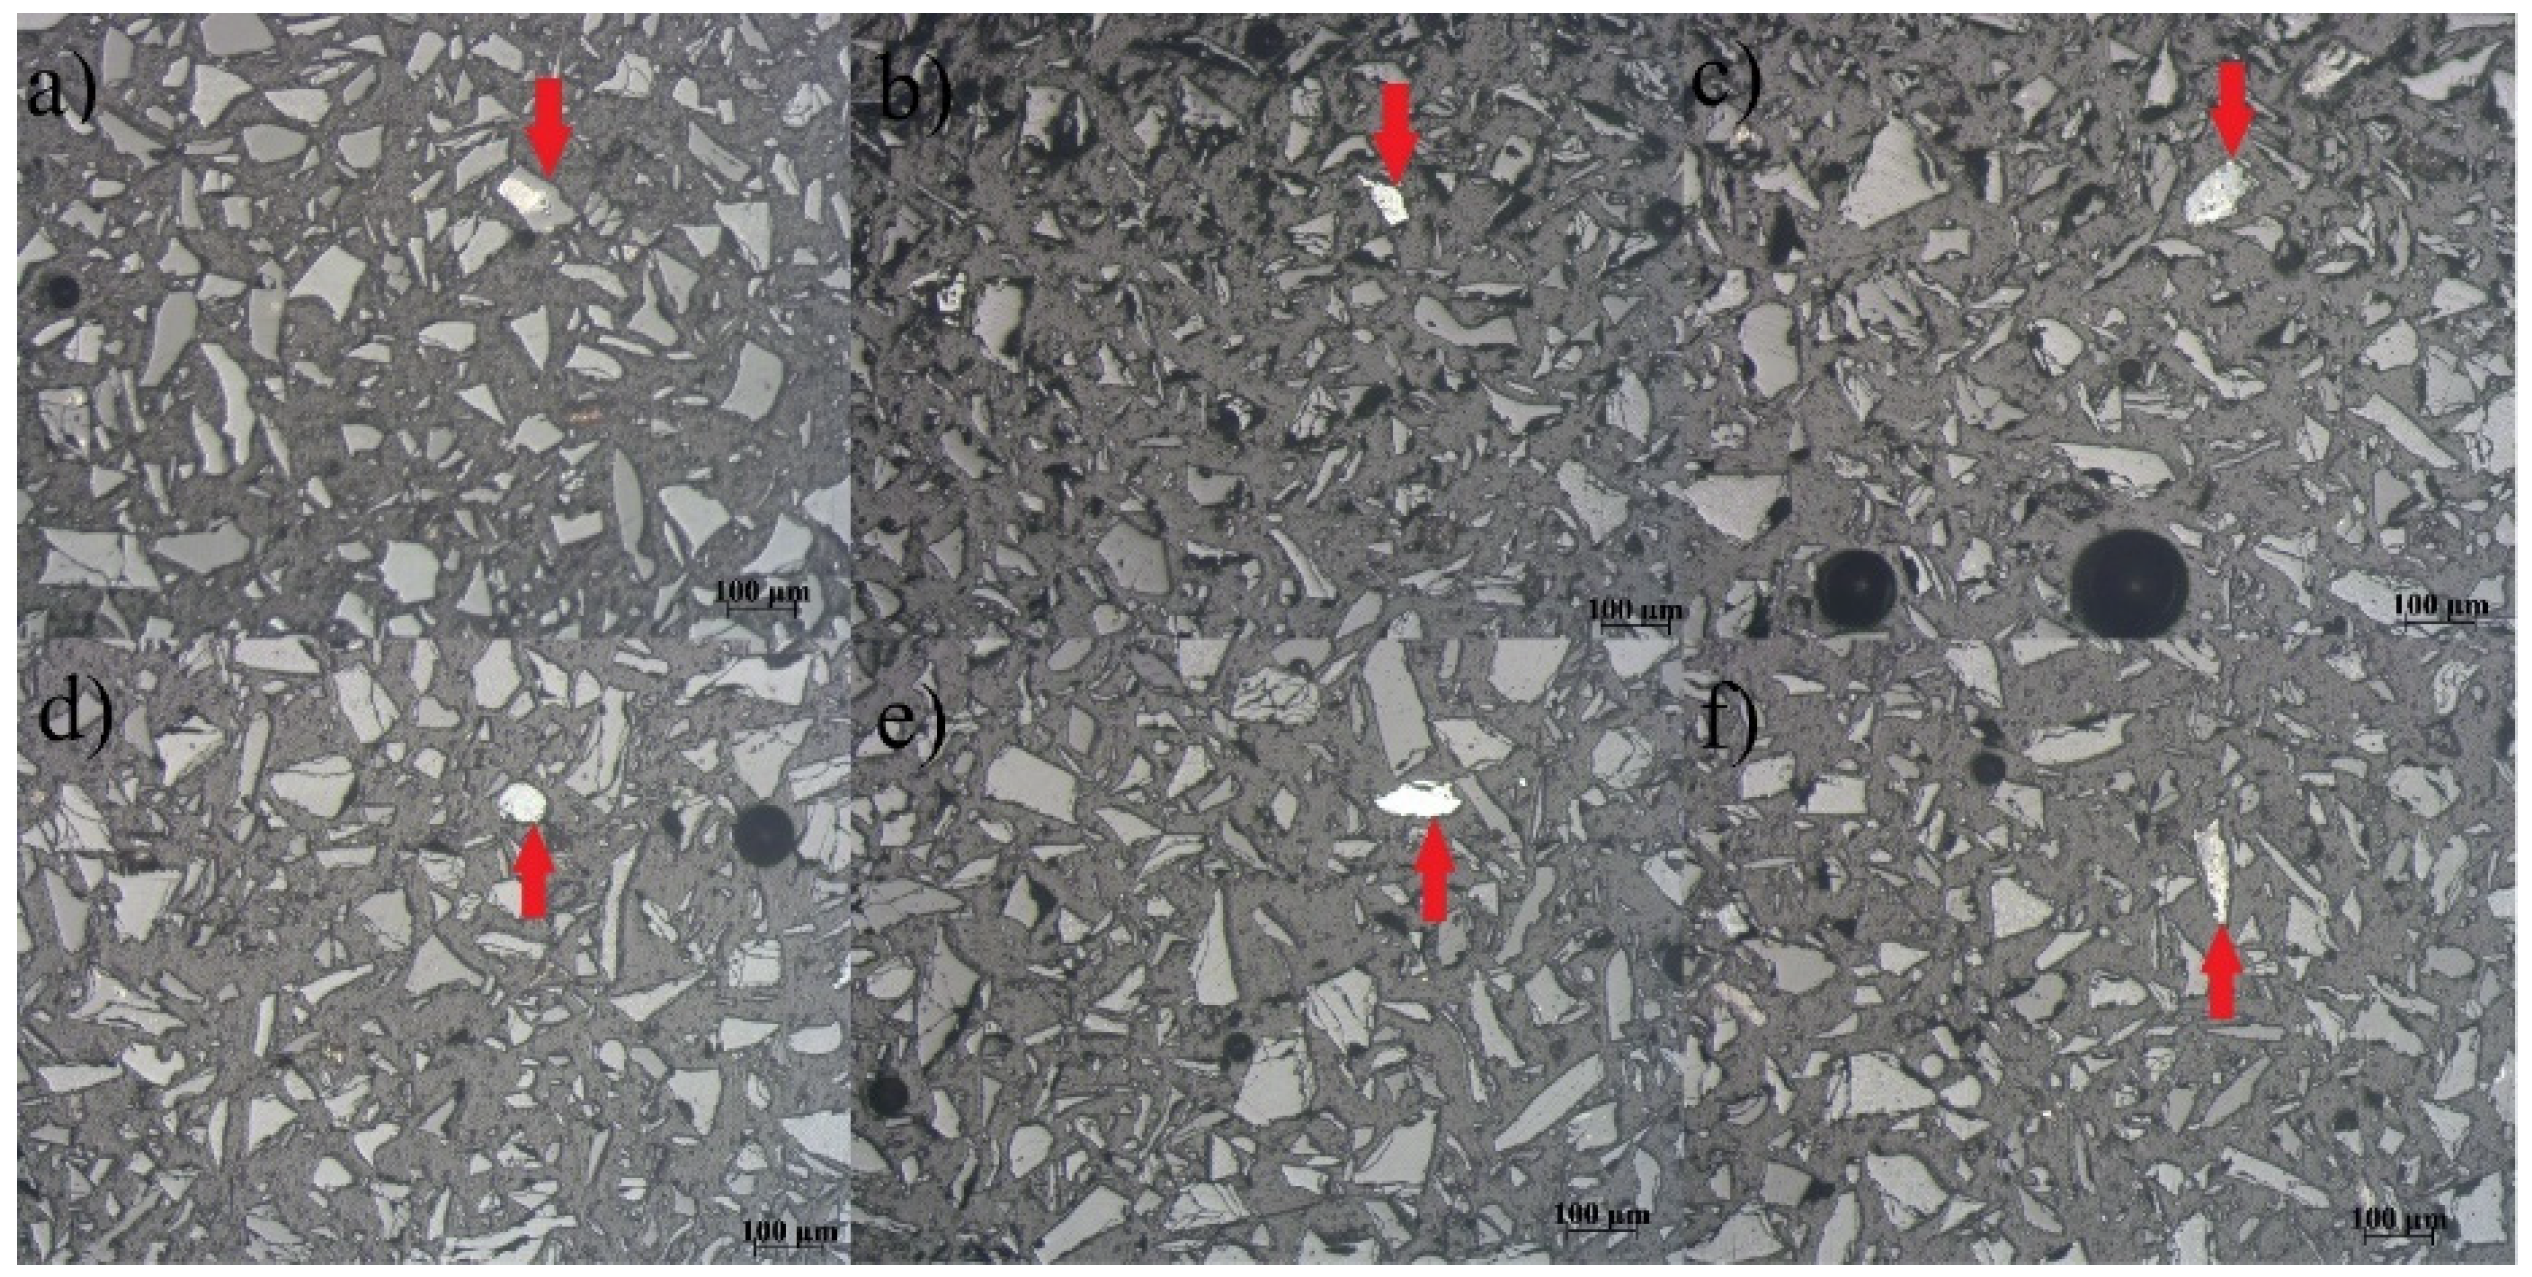
Figure 10.
Microphotographs of the non-magnetic fraction of the Pb-Zn slag sample.
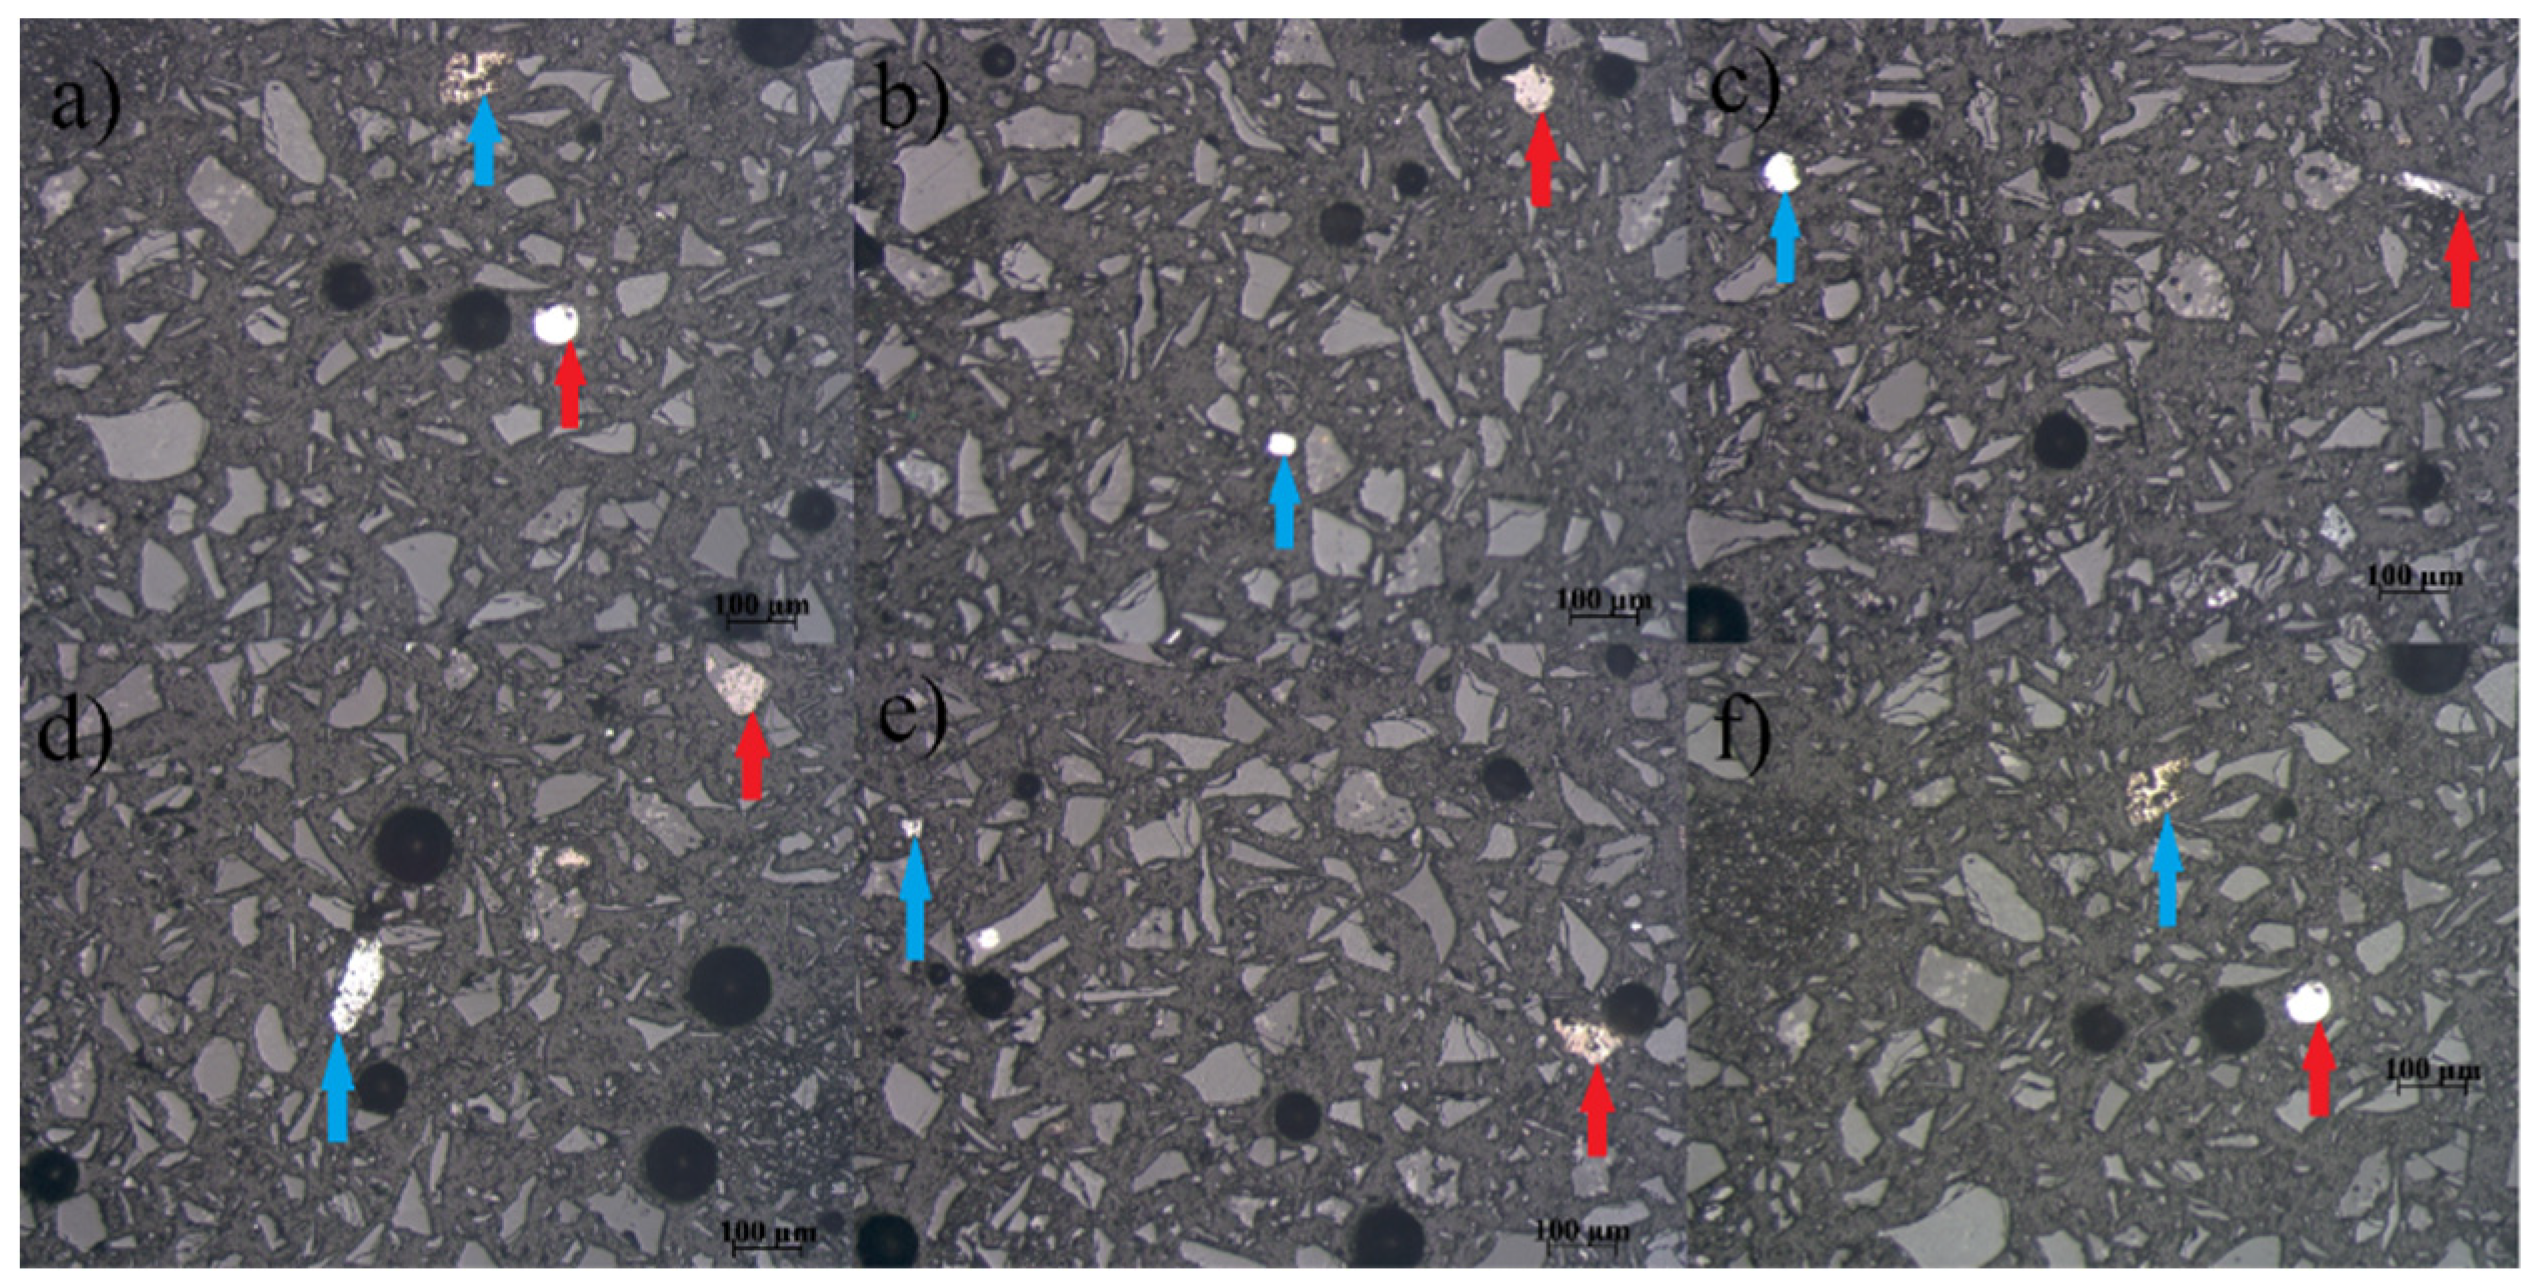
Figure 11.
SEM microphotographs of Pb-Zn slag: a) oxidized lead alloy; b) glassy matrix; c) oxidized lead alloy; d) oxidized lead alloy; e) oxidized copper-zinc alloy; and f) oxidized lead alloy.
Figure 11.
SEM microphotographs of Pb-Zn slag: a) oxidized lead alloy; b) glassy matrix; c) oxidized lead alloy; d) oxidized lead alloy; e) oxidized copper-zinc alloy; and f) oxidized lead alloy.
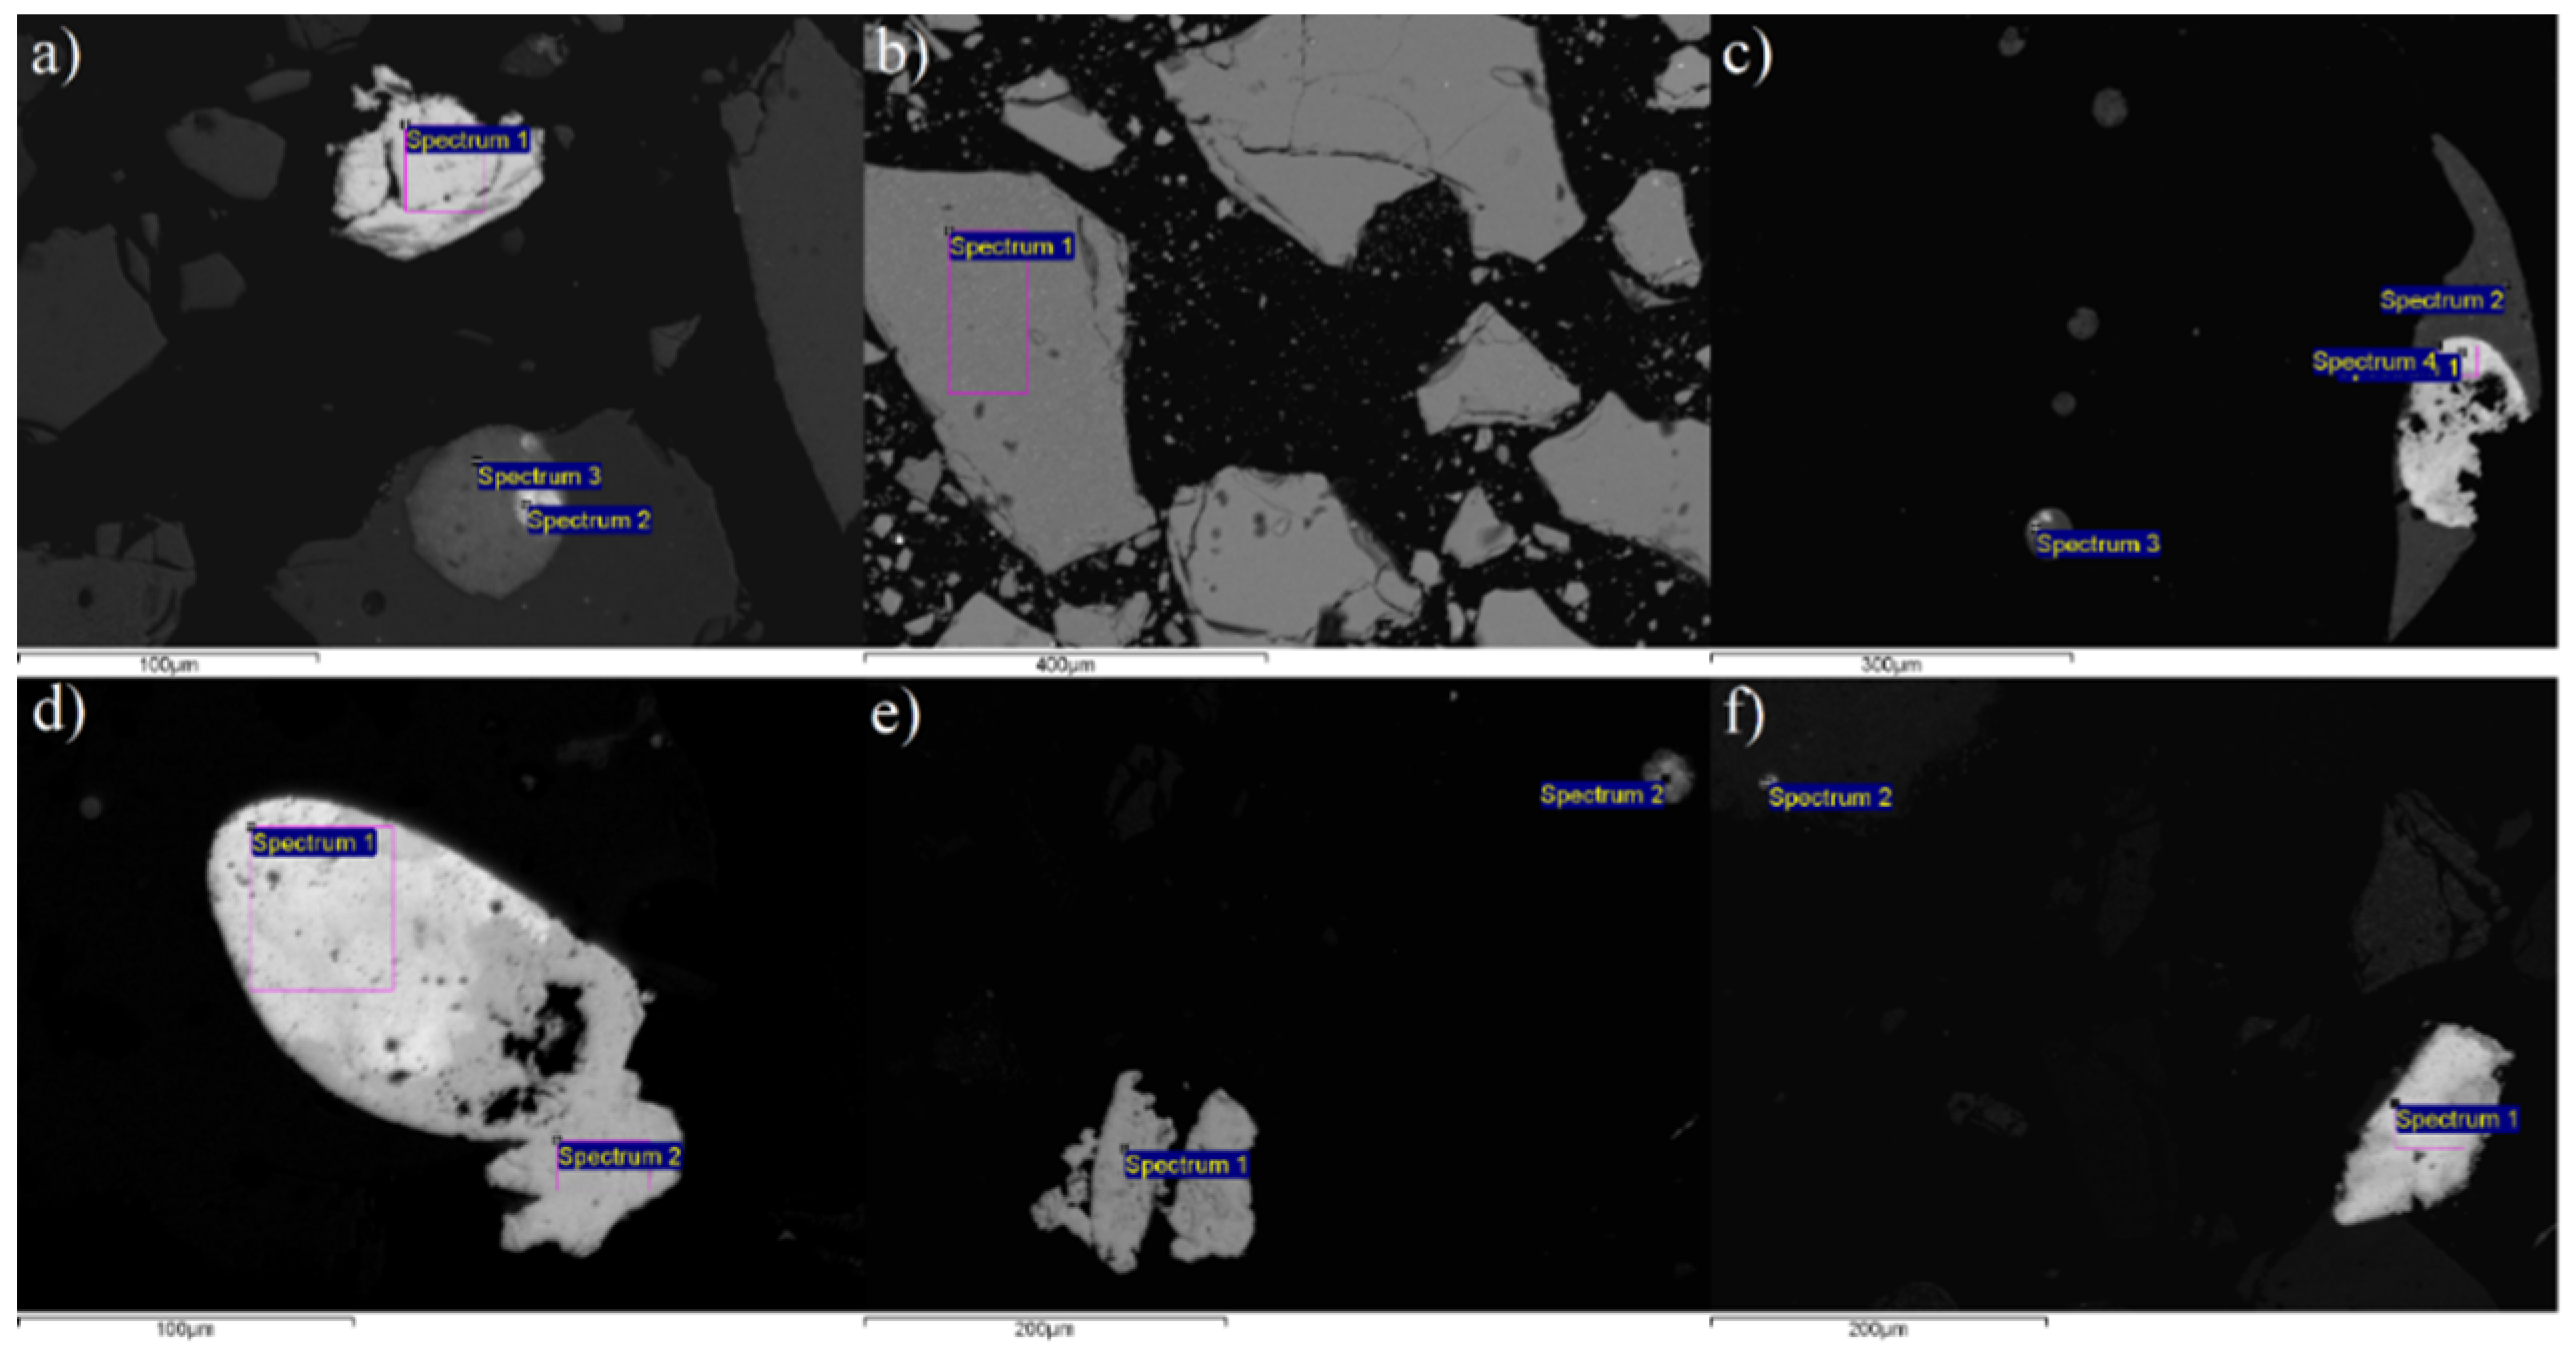
Figure 12.
Grain size distribution of the PB-Zn slag sample used for gravity concentration.
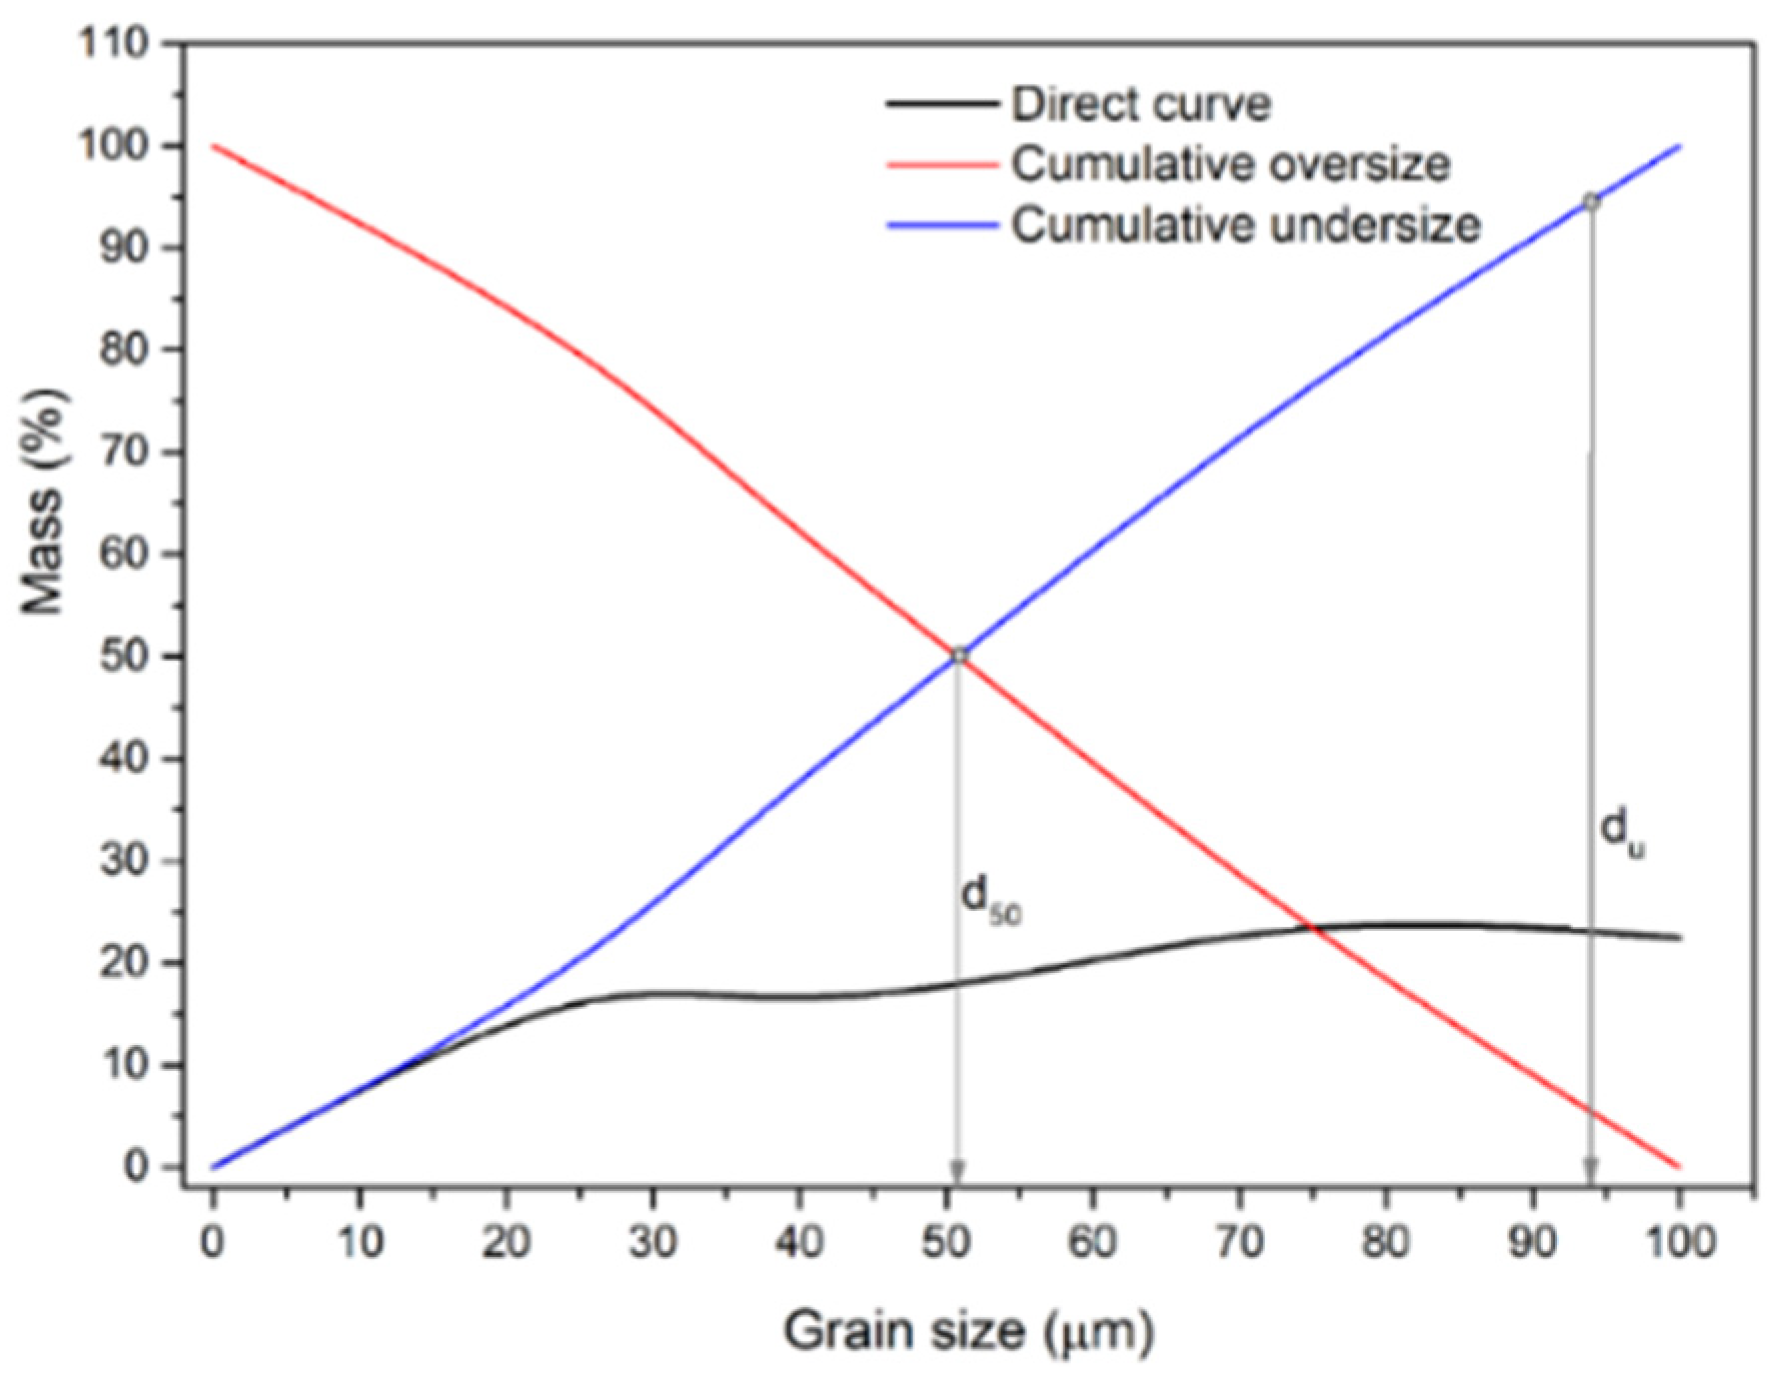
Figure 13.
Load balance of the GC of Pb-Zn slag in relation to grain-size class.
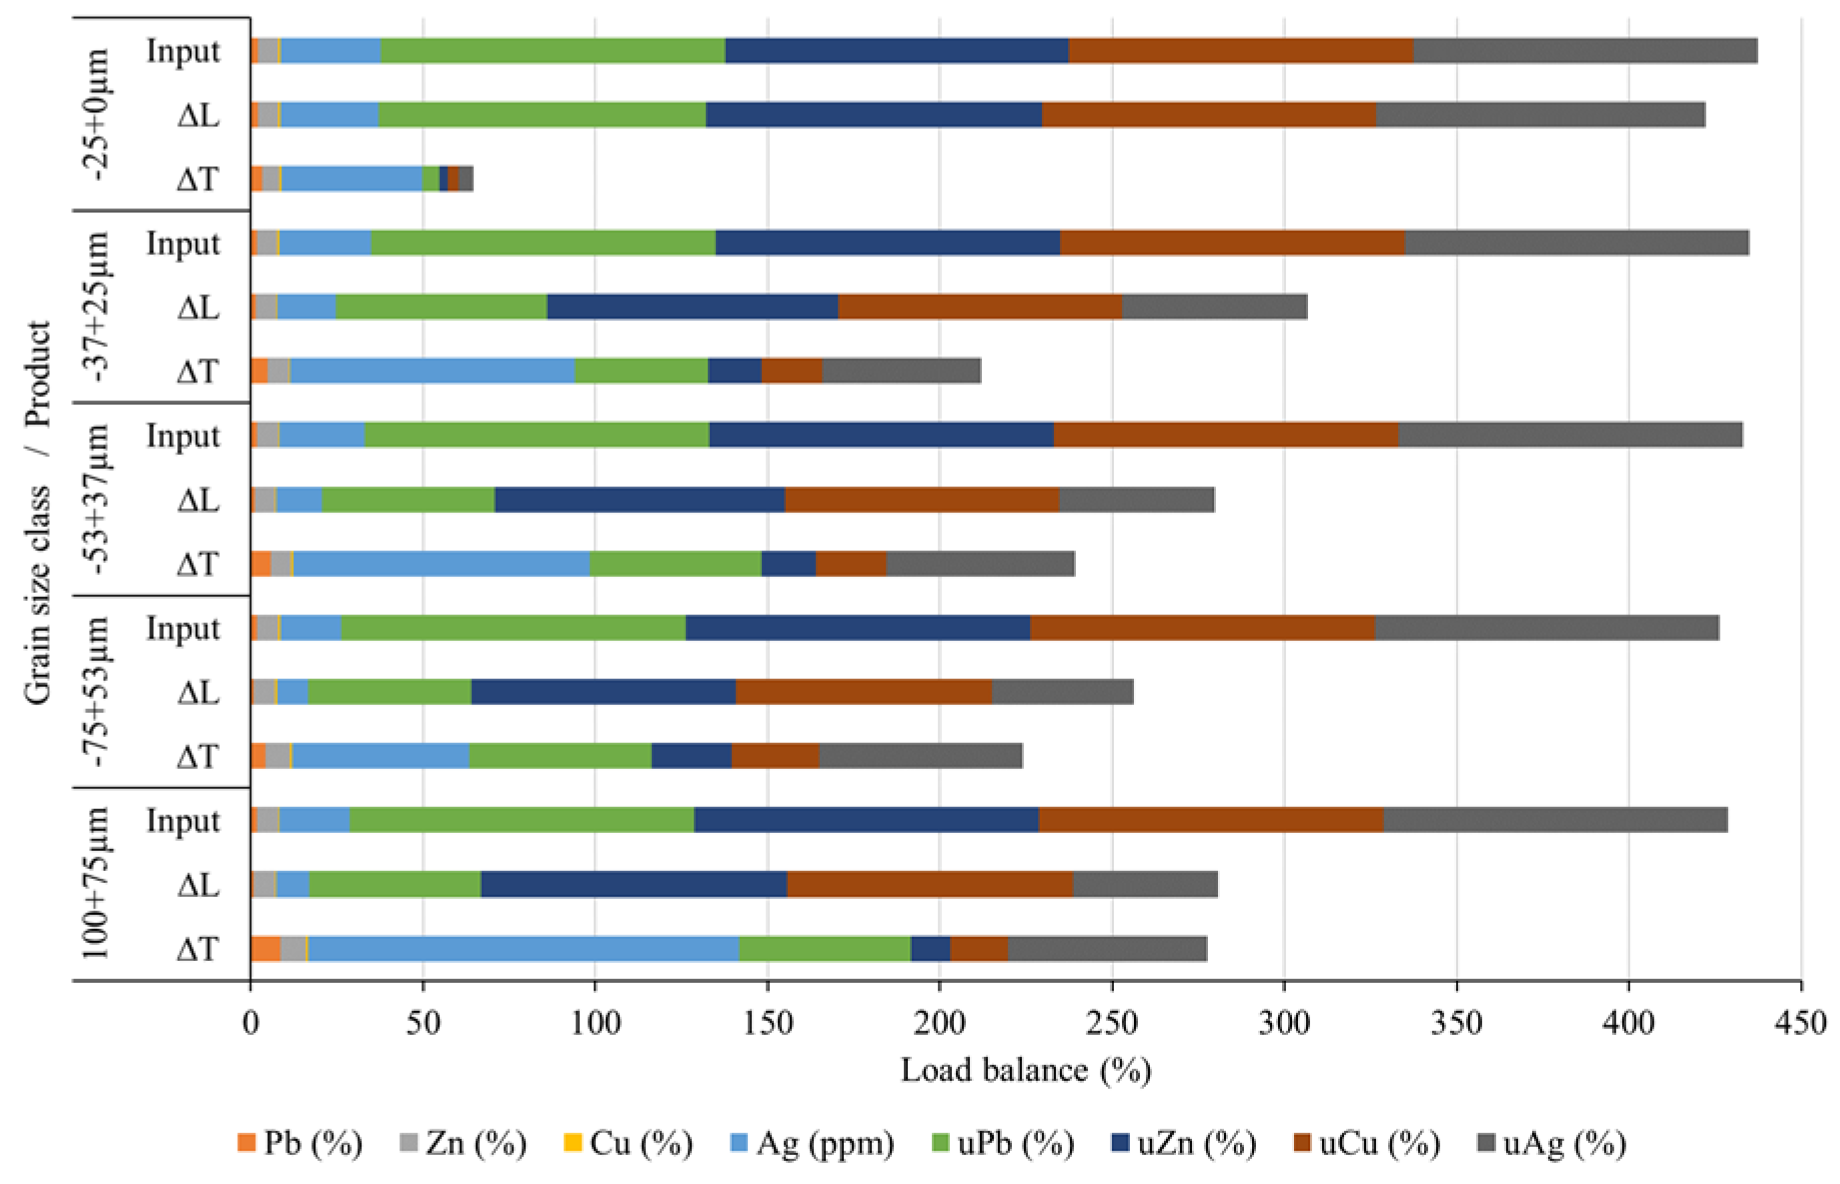
Figure 14.
Load balance of the GC of Pb-Zn slag in relation to the input.
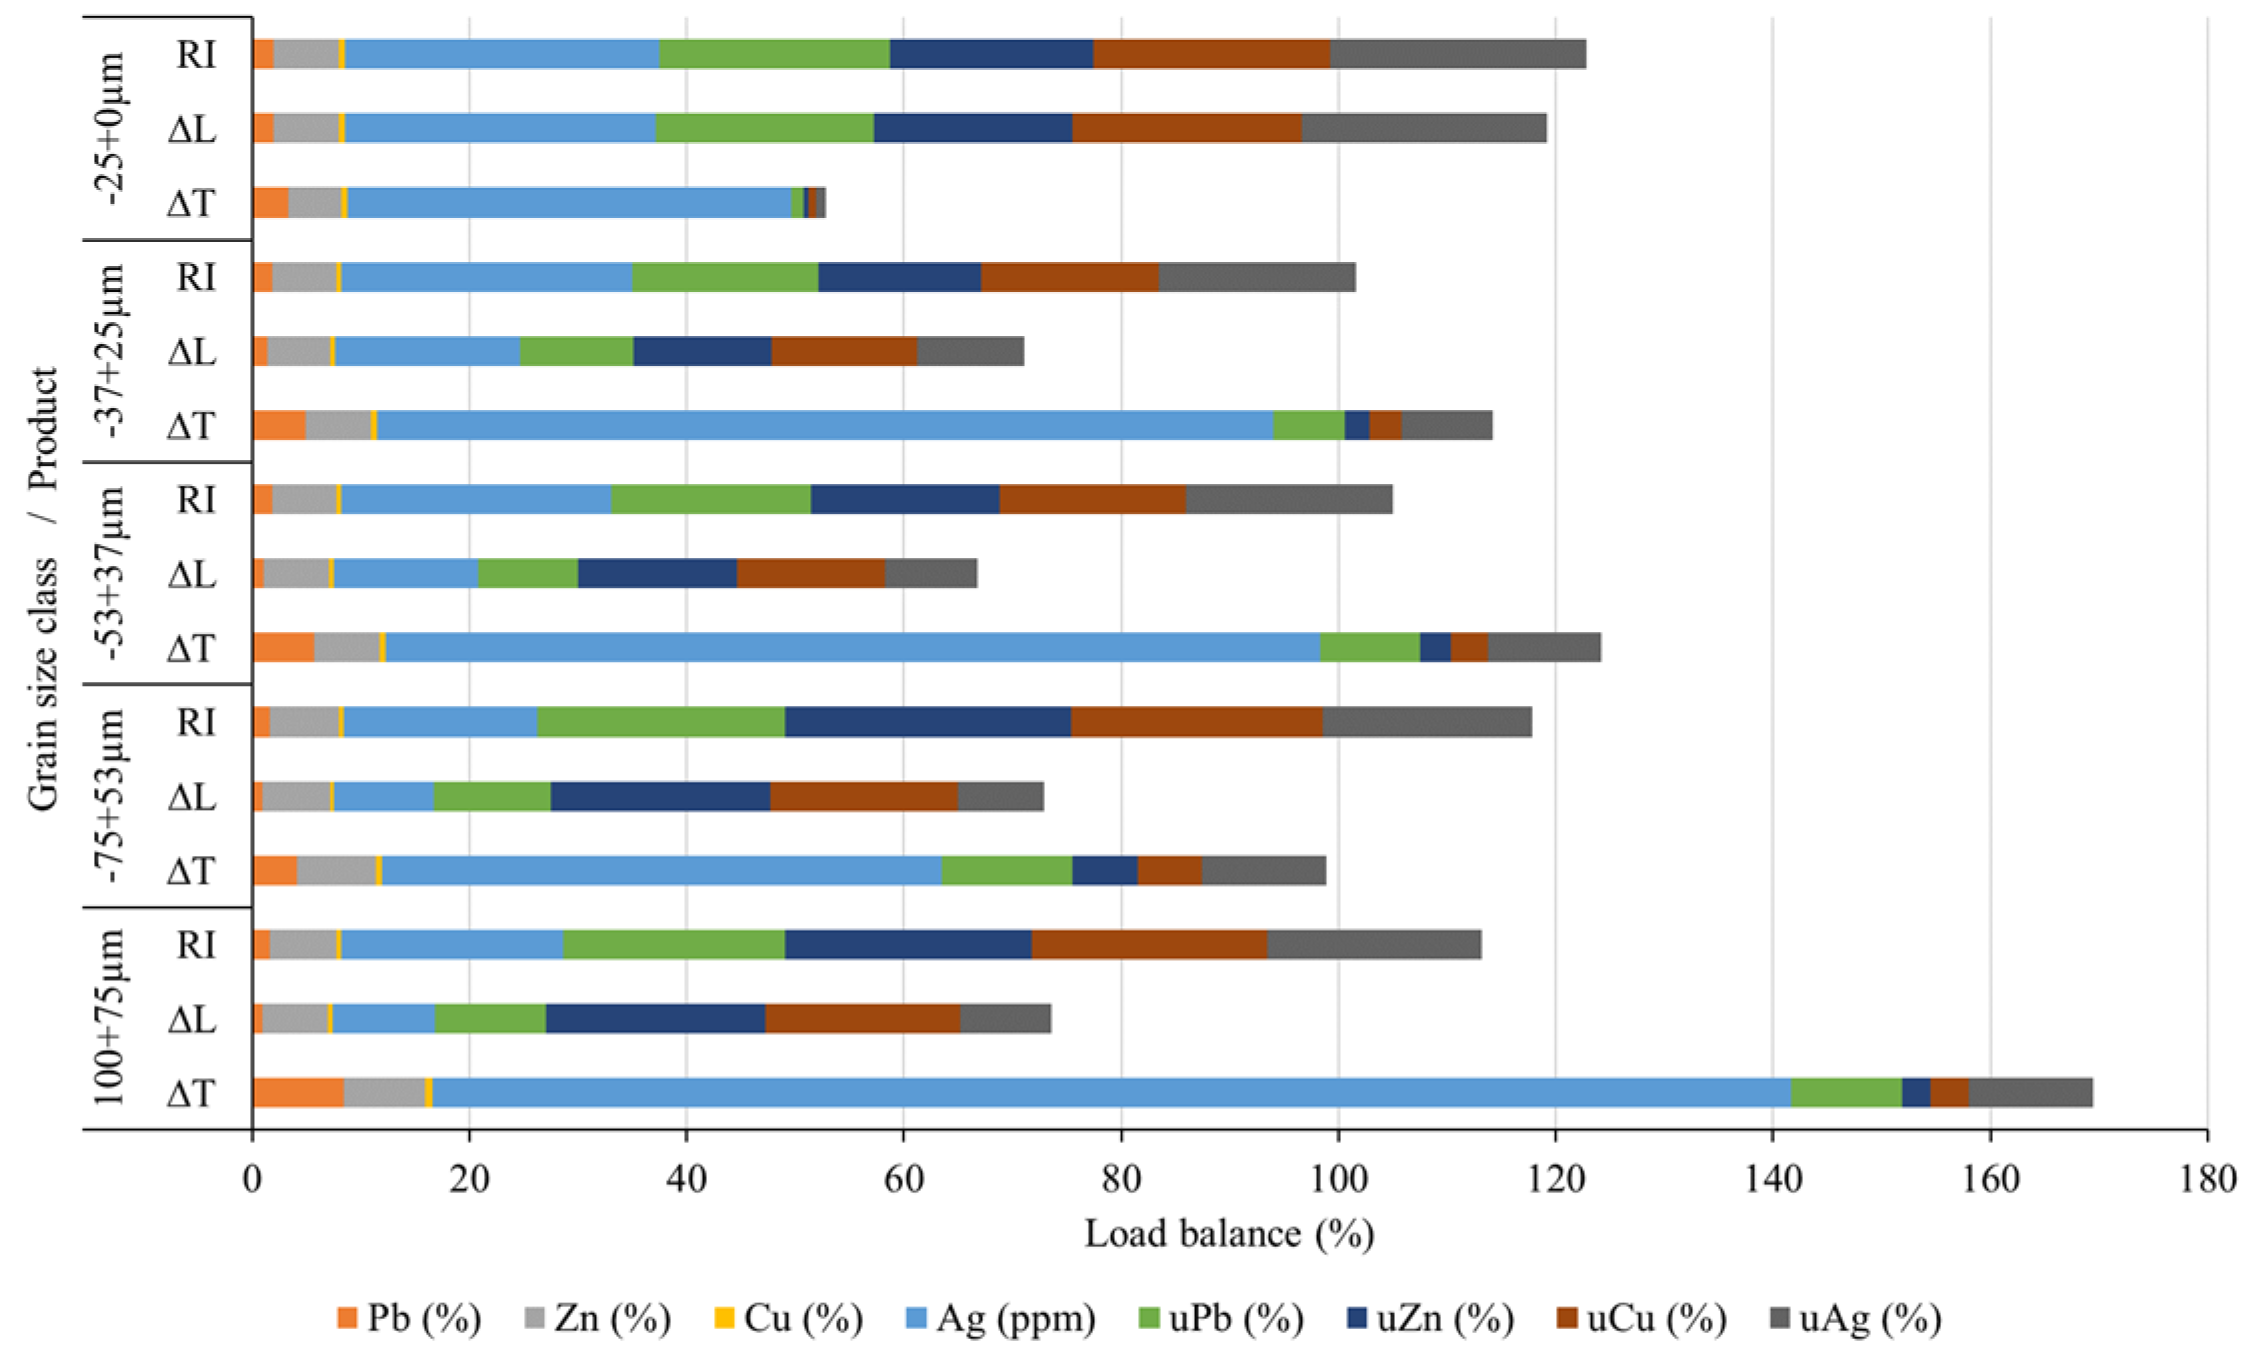

Table 1.
Chemical analysis of the selected grains in the Pb-Zn slag sample.
| Spectrum in Figure 11 | Pb (%) | Cu (%) | Fe (%) | As (%) | S (%) | O (%) | Ca (%) | Si (%) | Al (%) | Zn (%) | Ag (%) |
| 11a/1 | 75.23 | 0.79 | 0.70 | - | - | 22.40 | - | - | - | - | - |
| 11a/2 | 55.73 | 16.77 | 3.76 | 1.1 | 13.30 | 8.62 | - | - | - | - | - |
| 11a/3 | 54.98 | 17.02 | 3.74 | 1.1 | 13.00 | 8.15 | |||||
| 11b/1 | - | 0.60 | 29.05 | - | - | 30.30 | 7.03 | 8.26 | 2.45 | 16.67 | - |
| 11c/1 | 82.69 | 2.36 | - | - | - | 14.95 | - | - | - | - | - |
| 11c/4 | 79.05 | 3.50 | 0.95 | - | - | 16.50 | - | - | - | - | |
| 11d/1 | 84.62 | 2.36 | - | - | - | 13.01 | - | - | - | ||
| 11d/2 | 76.23 | - | 0.54 | - | 21.81 | 1.41 | - | - | - | - | |
| 11e/1 | - | 36.97 | 8.94 | - | - | 8.81 | 2.53 | 3.56 | 1.28 | 33.10 | - |
| 11f/1 | 90.70 | 0.46 | - | - | - | 7.76 | - | - | - | - | 0.97 |
Table 2.
Cumulative balance of gravity concentration products.
| Grain size class (μm) | Product | M (%) | Pb (%) | Zn (%) | Cu (%) | Ag (ppm) | uPb (%) | uZn (%) | uCu (%) | uAg (%) |
| -100+0 | ∑∆T | 12.99 | 5.28 | 6.69 | 0.58 | 76.12 | 39.22 | 14.16 | 16.58 | 42.68 |
| ∑∆L | 87.01 | 1.22 | 6.05 | 0.43 | 15.26 | 60.78 | 85.84 | 83.42 | 57.32 | |
| Input | 100.00 | 1.75 | 6.13 | 0.45 | 23.17 | 100.00 | 100.00 | 100.00 | 100.00 |
Disclaimer/Publisher’s Note: The statements, opinions and data contained in all publications are solely those of the individual author(s) and contributor(s) and not of MDPI and/or the editor(s). MDPI and/or the editor(s) disclaim responsibility for any injury to people or property resulting from any ideas, methods, instructions or products referred to in the content. |
© 2024 by the authors. Licensee MDPI, Basel, Switzerland. This article is an open access article distributed under the terms and conditions of the Creative Commons Attribution (CC BY) license (http://creativecommons.org/licenses/by/4.0/).
Copyright: This open access article is published under a Creative Commons CC BY 4.0 license, which permit the free download, distribution, and reuse, provided that the author and preprint are cited in any reuse.


