1. Introduction
Measuring semantic textual similarity (STS) is a fundamental problem in Natural Language Processing (NLP), with applications ranging from question answering and information retrieval to text summarization and machine translation evaluation [
1]. The goal of STS is to quantify the degree of semantic equivalence between two pieces of text, typically between two sentences. The accurate measurement of semantic similarity is crucial for tasks that require understanding the context and language nuances.
Traditional approaches to STS have relied on hand-crafted features and rules, which can be brittle and hard to generalize [
2,
3,
4,
5]. In recent years, deep learning techniques, particularly neural network models, have shown remarkable success in capturing semantic relationships in text data. Among these models, Siamese networks have emerged as a powerful architecture for learning semantic similarities in an end-to-end fashion [
6].
Siamese networks consist of two or more identical subnetworks (referred to as twins) that share parameters and encode input samples independently. The encoded vector representations are then compared using a similarity function to produce a similarity score between the inputs. The network is trained on pairs of samples with known similarity labels, learning to produce higher scores for similar pairs and lower scores for dissimilar pairs.
While Siamese networks have demonstrated promising results on STS tasks, the choice of similarity function plays a crucial role in their performance [
7,
8]. Different similarity functions capture different aspects of the relationship between the encoded representations, and their suitability may vary depending on the characteristics of the data and the specific STS task at hand.
In this paper, we present a comprehensive comparative study of various similarity functions for Siamese networks in the context of STS tasks. We evaluate and analyze the performance of fundamental widely used similarity functions. Our study aims to provide insights into the performance stability of these similarity functions, their impact on the effectiveness of Siamese networks for STS tasks, and introduce an effective and straightforward method for optimal threshold selection.
Our contributions in this paper are threefold: using the widely recognized STS Benchmark dataset [
9], (1) we provide a comprehensive evaluation and analysis of similarity functions for Siamese networks on STS, (2) we calculate optimal thresholds with different metrics, and (3) we introduce a new straightforward multi-objective approach for optimal threshold selection for similarity functions and show its effectiveness.
2. Related Work
Siamese networks have been widely adopted for learning similarity metrics from data in various domains, including natural language processing tasks such as semantic textual similarity (STS) [
10]. In the context of STS, several studies have investigated the use of different similarity functions within the Siamese architecture.
One of the most commonly used similarity functions is cosine similarity, which measures the cosine of the angle between two vector representations. Neculoiu et al. [
11] employed a Siamese network with cosine similarity for STS tasks, evaluating different text encoding methods such as word embeddings and contextualized embeddings from pre-trained language models.
Another popular choice is the Pearson correlation coefficient, which measures the linear correlation between two vectors. Wang et al. [
12] developed a Siamese network that used Pearson correlation as the similarity function, incorporating external knowledge from WordNet and ConceptNet to improve performance on challenging STS datasets.
Beyond cosine similarity and Pearson correlation, researchers have explored customized similarity functions tailored for Siamese networks in STS tasks. Reimers and Gurevych [
13] introduced the SBERT (Sentence-BERT) model, which uses a combination of cosine similarity and Pearson correlation as the similarity function within a Siamese network trained on natural language inference data.
Later, Xu et al. [
14] proposed the Smooth Inverse Frequency (SIF) similarity function, which incorporates information about the frequency of words and phrases. Their experiments showed that the SIF similarity outperformed cosine similarity and Pearson correlation on certain STS datasets.
Pushing the fundamental similarity function performance understanding further, Jiao et al. [
15] introduced a new similarity function called the Adaptive Margin Cosine Similarity (AMCS), which dynamically adjusts the margin based on the similarity between the input samples. Their results demonstrated the effectiveness of the AMCS compared to other similarity functions.
3. Analysis of Fundamental Similarity Functions
We chose identical model architectures to train the Siamese RNN on the same data and compare the output vectors with multiple similarity functions. We selected Euclidean distance, Canberra distance, Dice coefficient, Hamming distance, Jaccard similarity, Manhattan distance, Minkowski distance, Cosine similarity and Pearson correlation coefficient for our study due to their fundamental nature and wide applicability in measuring similarity between vectors.
The loaded data was split into training and validation sets, with the validation set comprising 20% of the original data. The sentences were tokenized and padded to ensure a consistent length. Notably, the dataset’s similarity scores were normalized to a range between 0 and 1 to facilitate the model’s training and evaluation.
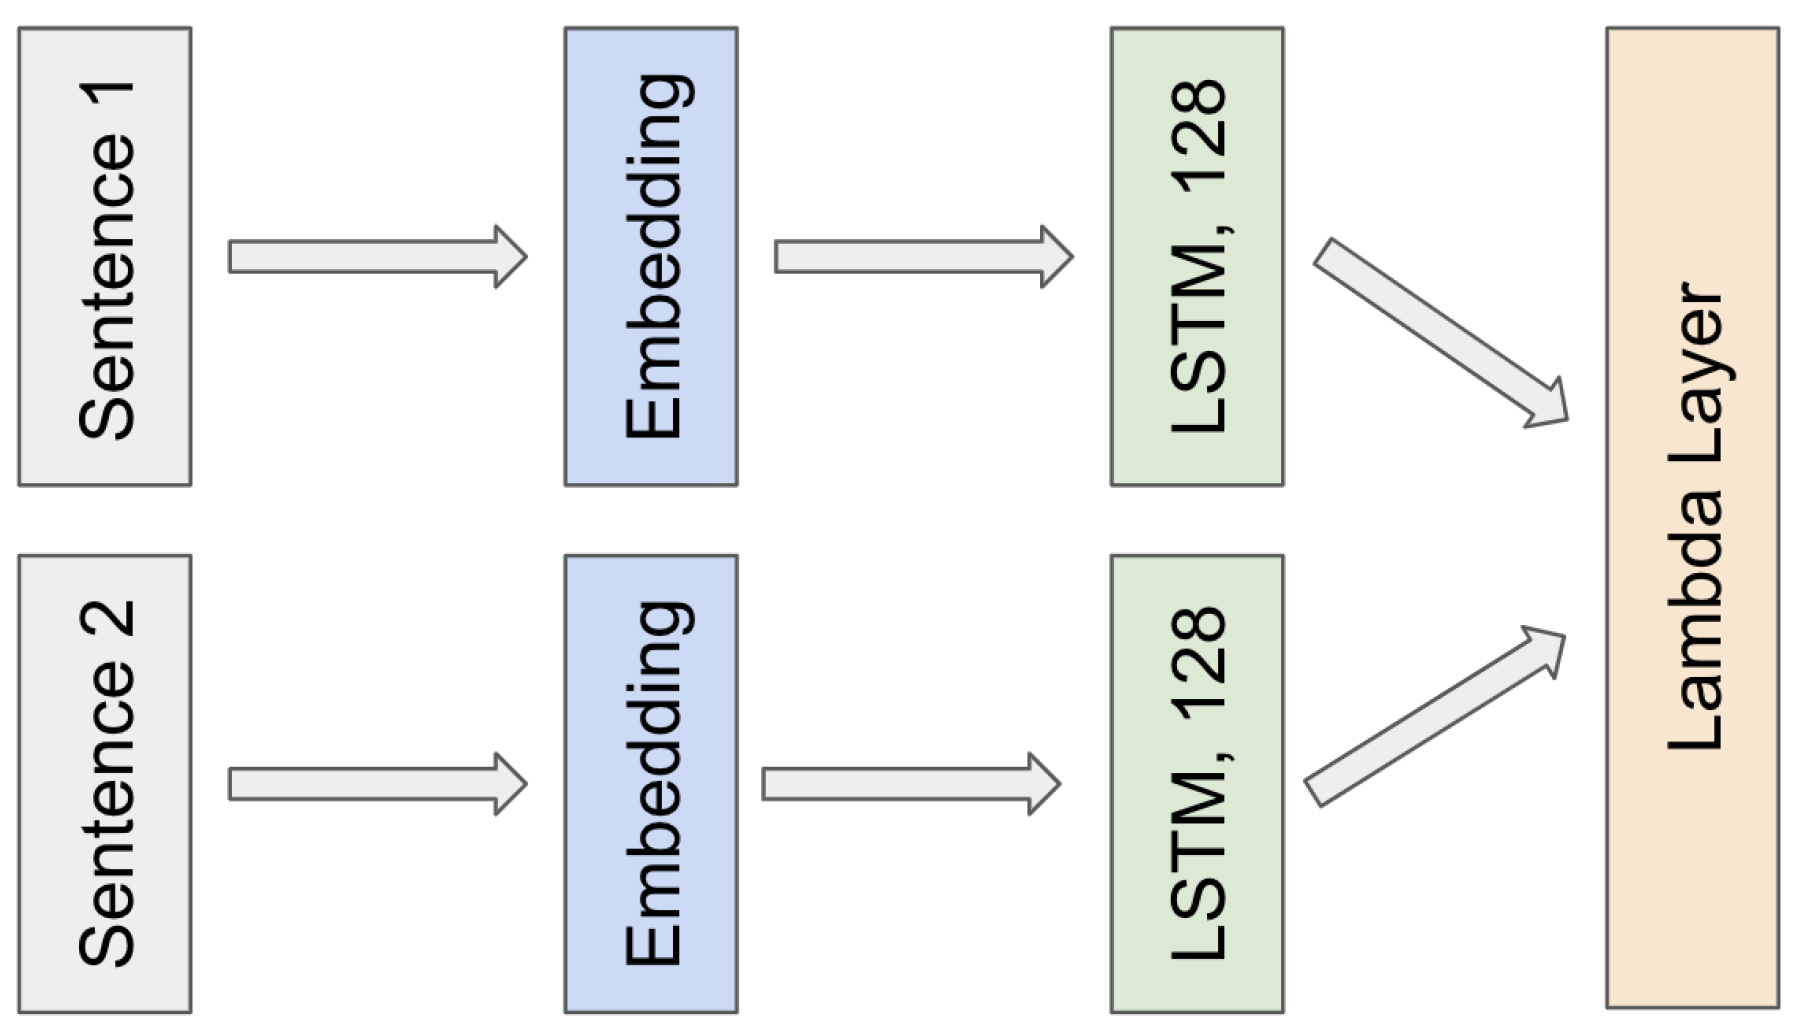
The Siamese RNN architecture consisted of two input layers, a shared Embedding layer, a shared Long Short-Term Memory (LSTM) layer, and a Lambda layer that computed the similarity score between the encoded representations of the two input sentences using the chosen similarity function. The Siamese RNN model was compiled with a mean squared error loss function and the Adam optimizer. The model architecture is illustrated in
Figure 1.
For the validation set, we experimented with threshold values ranging from 0.1 to 0.9 in increments of 0.1. The best threshold was selected based on the highest F1 Score, Matthews Correlation Coefficient (MCC), and Area Under the Receiver Operating Characteristic (AUC ROC) curve. The results of this threshold optimization process are summarized in
Table 1,
Table 2, and
Table 3.
The results demonstrate that the Pearson correlation coefficient achieves the highest F1 Score of 91.4% at the threshold of 0.6 on the dataset, indicating its effectiveness in capturing the semantic similarity between sentence pairs. In contrast, the Dice coefficient peaks lowest at a threshold of 0.1, with an F1 Score of only 0.268, suggesting its limited performance for this task.
Interestingly, due to their mathematical nature, distance-based measures such as Canberra distance, Dice coefficient, Minkowski distance, and Hamming distance tend to achieve their best F1 Score results closer to the studied threshold range borders, either at the lower end (0.1) or the higher end (0.9). This behavior can be attributed to the inherent properties of these distance metrics, which may not align well with the underlying distribution of similarity scores in the dataset.
The superior performance of the Pearson correlation coefficient can be attributed to its ability to capture linear relationships between the encoded representations of the input sentences. By measuring the degree of correlation between these representations, it can effectively quantify their semantic similarity, leading to a more accurate classification of sentence pairs as similar or dissimilar.
The analysis of the Matthews Correlation Coefficient (MCC) results provides further insights into the performance of various similarity measures on the dataset. The MCC, known for its effectiveness in evaluating binary classifications even with imbalanced datasets, offers a complementary perspective to the F1 Score analysis.
The Pearson correlation coefficient demonstrates high-level once again, achieving the highest MCC value of 0.382 at a threshold of 0.5. This result reinforces the measure’s effectiveness in capturing semantic similarities between sentence pairs, as it shows a stronger correlation between the predicted and actual classifications compared to other measures. The Pearson correlation’s ability to detect linear relationships in the encoded sentence representations proves beneficial not only in terms of precision and recall (as indicated by the F1 Score) but also in overall classification accuracy and balance between true and false positives and negatives.
The Cosine similarity demonstrates superior performance, achieving the highest MCC value of 0.455 at a threshold of 0.5. This result underscores the measure’s effectiveness in capturing semantic similarities between sentence pairs, as it shows a stronger correlation between the predicted and actual classifications compared to other measures. The cosine similarity’s ability to measure the cosine of the angle between two vectors in a multi-dimensional space proves highly beneficial, not only in terms of precision and recall (as indicated by the F1 Score) but also in overall classification accuracy and balance between true and false positives and negatives.
In contrast, the Minkowski distance exhibits the poorest performance with a peak MCC of -0.018. This negative MCC value suggests that the Minkowski distance’s predictions are slightly worse than random chance for this particular task. The poor performance of Minkowski distance can be attributed to its sensitivity to the scale of the features and its potential inability to capture the nuanced semantic relationships present in the encoded sentence representations.
Similar to the F1 Score analysis, other distance-based measures like Canberra distance, Dice coefficient, and Hamming distance likely show varying degrees of suboptimal performance in the MCC metric. These measures may struggle to align with the underlying distribution of similarity scores in the dataset, resulting in lower MCC values compared to the Pearson correlation coefficient.
The disparity between the highest and lowest MCC values (0.382 vs. -0.018) underscores the significant variation in the effectiveness of different similarity measures for this semantic textual similarity task, highlighting the importance of choosing an appropriate similarity measure that aligns well with the nature of the data and the specific requirements of the task at hand.
Moreover, the MCC results provide a more nuanced view of the measures’ performance, particularly in handling potential class imbalances in the dataset. The higher MCC value of the Pearson correlation coefficient indicates its robustness in correctly classifying both similar and dissimilar sentence pairs, maintaining a good balance between sensitivity and specificity.
The analysis of the Area Under the Receiver Operating Characteristic curve (AUC ROC) results provides valuable insights into the discriminative power of various similarity measures across different classification thresholds. This metric is particularly useful as it assesses the performance of the measures independently of any specific threshold, offering a comprehensive view of their effectiveness.
The Pearson correlation coefficient once again demonstrates its superiority, achieving the highest AUC ROC value of 0.698 at a threshold of 0.5. The Cosine similarity achieves a strong 0.694 as well. These results further solidifies the Pearson correlation’s and the Cosine similarity’s effectiveness in the task of semantic textual similarity.
In contrast, the Canberra distance exhibits the 2nd lowest peak again with AUC ROC value of 0.518. This result suggests that the Canberra distance’s ability to discriminate between similar and dissimilar sentence pairs is only marginally better than random chance (which would yield an AUC ROC of 0.5). The poor performance of the Canberra distance may be due to its sensitivity to small changes when coordinate values are close to zero, which might not be suitable for the distribution of features in the encoded sentence representations.
Both the Cosine similarity and the Pearson correlation coefficient significantly outperform other measures, particularly the Minkowski distance, in its ability to discriminate between similar and dissimilar sentence pairs across various thresholds. This consistent superior performance across different evaluation metrics (F1 Score, MCC, and AUC ROC) strongly supports the choice of these two similarity functions for STS tasks. Conversely, the extremely poor performance of the Minkowski distance, with an AUC ROC near 0.5, strongly cautions against its use in this context, as it demonstrates no meaningful discriminative power for semantic similarity judgments. Finalizing the threshold selection for each similarity function, we get the results demonstrated in
Table 4.
It can be observed that the Pearson correlation coefficient emerges as the superior measure consistently across all three metrics, demonstrating robust performance in capturing semantic similarities between sentence pairs. It achieves the highest F1 Score of 91.4% at a threshold of 0.6, the highest MCC of 0.382 at a threshold of 0.5, and the highest AUC ROC of 0.698. This consistent excellence can be attributed to its ability to effectively capture linear relationships in the encoded sentence representations, aligning well with the underlying structure of semantic similarities in the dataset.
The Cosine similarity demonstrates a solid performance across all metrics, handling dataset imbalance problems better than other similarity functions with the highest MCC score value of 0.455. This consistent excellence can be attributed to its ability to effectively measure the cosine of the angle between two vectors in a multi-dimensional space, aligning well with the underlying structure of semantic similarities in the dataset.
The most stable performance is achieved by the Jaccard similarity across all metrics. This stability of the Jaccard similarity is particularly noteworthy in the context of practical applications. While it may not achieve the highest scores, its consistent performance across different evaluation criteria suggests a robust and dependable measure for semantic similarity tasks. The uniform optimal threshold of 0.5 simplifies implementation and reduces the need for threshold tuning, which can be advantageous in real-world scenarios where simplicity and reliability are valued. The Jaccard similarity’s stable performance can be attributed to its fundamental property of measuring the overlap between sets. In the context of semantic textual similarity, this translates to effectively capturing the shared semantic components between sentence pairs, regardless of the specific evaluation metric used [
16,
17]. This consistency across metrics suggests that the Jaccard similarity aligns well with the underlying distribution of similarity in the dataset, making it a versatile choice for various evaluation scenarios.
In contrast, distance-based measures such as the Minkowski distance, Canberra distance, and Dice coefficient consistently underperform across all metrics. The Minkowski distance, in particular, shows the poorest performance, with its AUC ROC (0.498) indicating no better discriminative power than random chance. These results suggest that distance-based measures may not be well-suited for this specific semantic similarity task, possibly due to their sensitivity to feature scales and inability to capture nuanced semantic relationships.
The significant performance gap between the Pearson correlation coefficient and other measures underscores the critical importance of selecting an appropriate similarity measure for semantic textual similarity tasks. The choice of measure can dramatically impact the model’s overall performance, reliability, and ability to generalize [
18,
19].
Furthermore, the analysis reveals interesting patterns in the behavior of different measures. Distance-based measures tend to achieve their best results at extreme thresholds, suggesting a misalignment with the underlying distribution of similarity scores in the dataset. This observation highlights the need for careful consideration of the mathematical properties of similarity measures in relation to the specific characteristics of the task and dataset at hand.
In conclusion, the fundamental similarity functions’ analysis provides strong support for the use of the Pearson correlation coefficient and the Cosine similarity in scenarios where maximizing performance metrics is the primary goal. However, it also highlights the Jaccard similarity as an excellent choice when stability and consistency across different evaluation criteria are prioritized. The stable performance of the Jaccard similarity, coupled with its consistent optimal threshold, makes it a reliable and practical option for many real-world applications of semantic textual similarity.
Conversely, the poor performance of distance-based measures, especially the Minkowski distance, cautions against their use in the STS context. The inherent limitations of distance-based functions in handling semantic tasks are further highlighted by the findings. Regardless of the threshold selection approach, these metrics struggle to achieve the same level of performance as their similarity-based counterparts. This underscores the need for more sophisticated techniques that can better account for the complex and context-dependent nature of textual similarity, moving beyond simple distance-based comparisons.
4. Multi-Objective Approach for Optimal Threshold Selection
After the fundamental similarity functions’ analysis completion, we introduce a novel multi-objective approach for optimal threshold selection in similarity functions that demonstrates enhanced effectiveness through its ability to find a robust compromise among multiple performance metrics. Our method combines the strengths of three widely recognized evaluation metrics: F1 Score, Matthews Correlation Coefficient (MCC), and Area Under the Receiver Operating Characteristic curve (AUC ROC) that we used above for similarity function performance analysis.
The core strength of our approach lies in its capacity to synthesize information from multiple metrics, each capturing different aspects of model performance:
- 1)
F1 Score: Balances precision and recall, crucial for tasks where both false positives and false negatives are significant [
13,
20].
- 2)
MCC: Provides a balanced measure of both classification and misclassification rates, particularly valuable in imbalanced datasets [
11,
17,
21].
- 3)
AUC ROC: Offers a threshold-independent measure of discriminative ability across all possible classification thresholds [
8,
9,
22].
By combining the peak threshold values for the range (0.1 to 0.9) of these metrics, our method achieves a compromise that addresses the limitations of relying on any single metric. The compromise is reached by applying a weighted average formula, as detailed in (1):
Multi-Objective Optimal Threshold (T) =
The multi-objective nature of our approach contributes to increased robustness in several ways:
- 1)
Mitigation of Metric-Specific Biases: Each evaluation metric has its own biases and limitations. By combining multiple metrics, our method reduces the impact of these individual biases, leading to a more balanced and robust threshold selection.
- 2)
Adaptability to Data Characteristics: The inclusion of diverse metrics allows the method to adapt to various data distributions and similarity function behaviors. This adaptability is crucial when dealing with complex STS datasets, where semantic similarity can manifest in different forms.
- 3)
Resilience to Outliers: The weighted aggregation approach inherently reduces the influence of potential outlier thresholds, as it prioritizes consensus among metrics. This feature enhances the method’s resilience to anomalies or noise in the data [
23].
- 4)
Comprehensive Performance Evaluation: By considering multiple aspects of performance simultaneously, the method provides a more comprehensive evaluation of threshold effectiveness. This holistic approach is more likely to identify thresholds that perform well across various performance criteria, rather than excelling in one area at the expense of others.
- 5)
Generalization Potential: The compromise-driven nature of the approach potentially leads to threshold selections that generalize better across different subsets of data or related tasks. This is particularly valuable in the context of semantic textual similarity, where the nature of similarity can vary across different text types or domains [
10,
24].
Another notable advancement is that our method explores thresholds from 0.1 to 0.9 with a 0.1 step, allowing for a granular search of the optimal threshold space. The fine-grained approach enables the precise identification of performance optima for each metric, the detailed exploration of the trade-offs between different performance aspects, together with the potential discovery of nuanced threshold values that might be overlooked by coarser approaches [
25,
26].
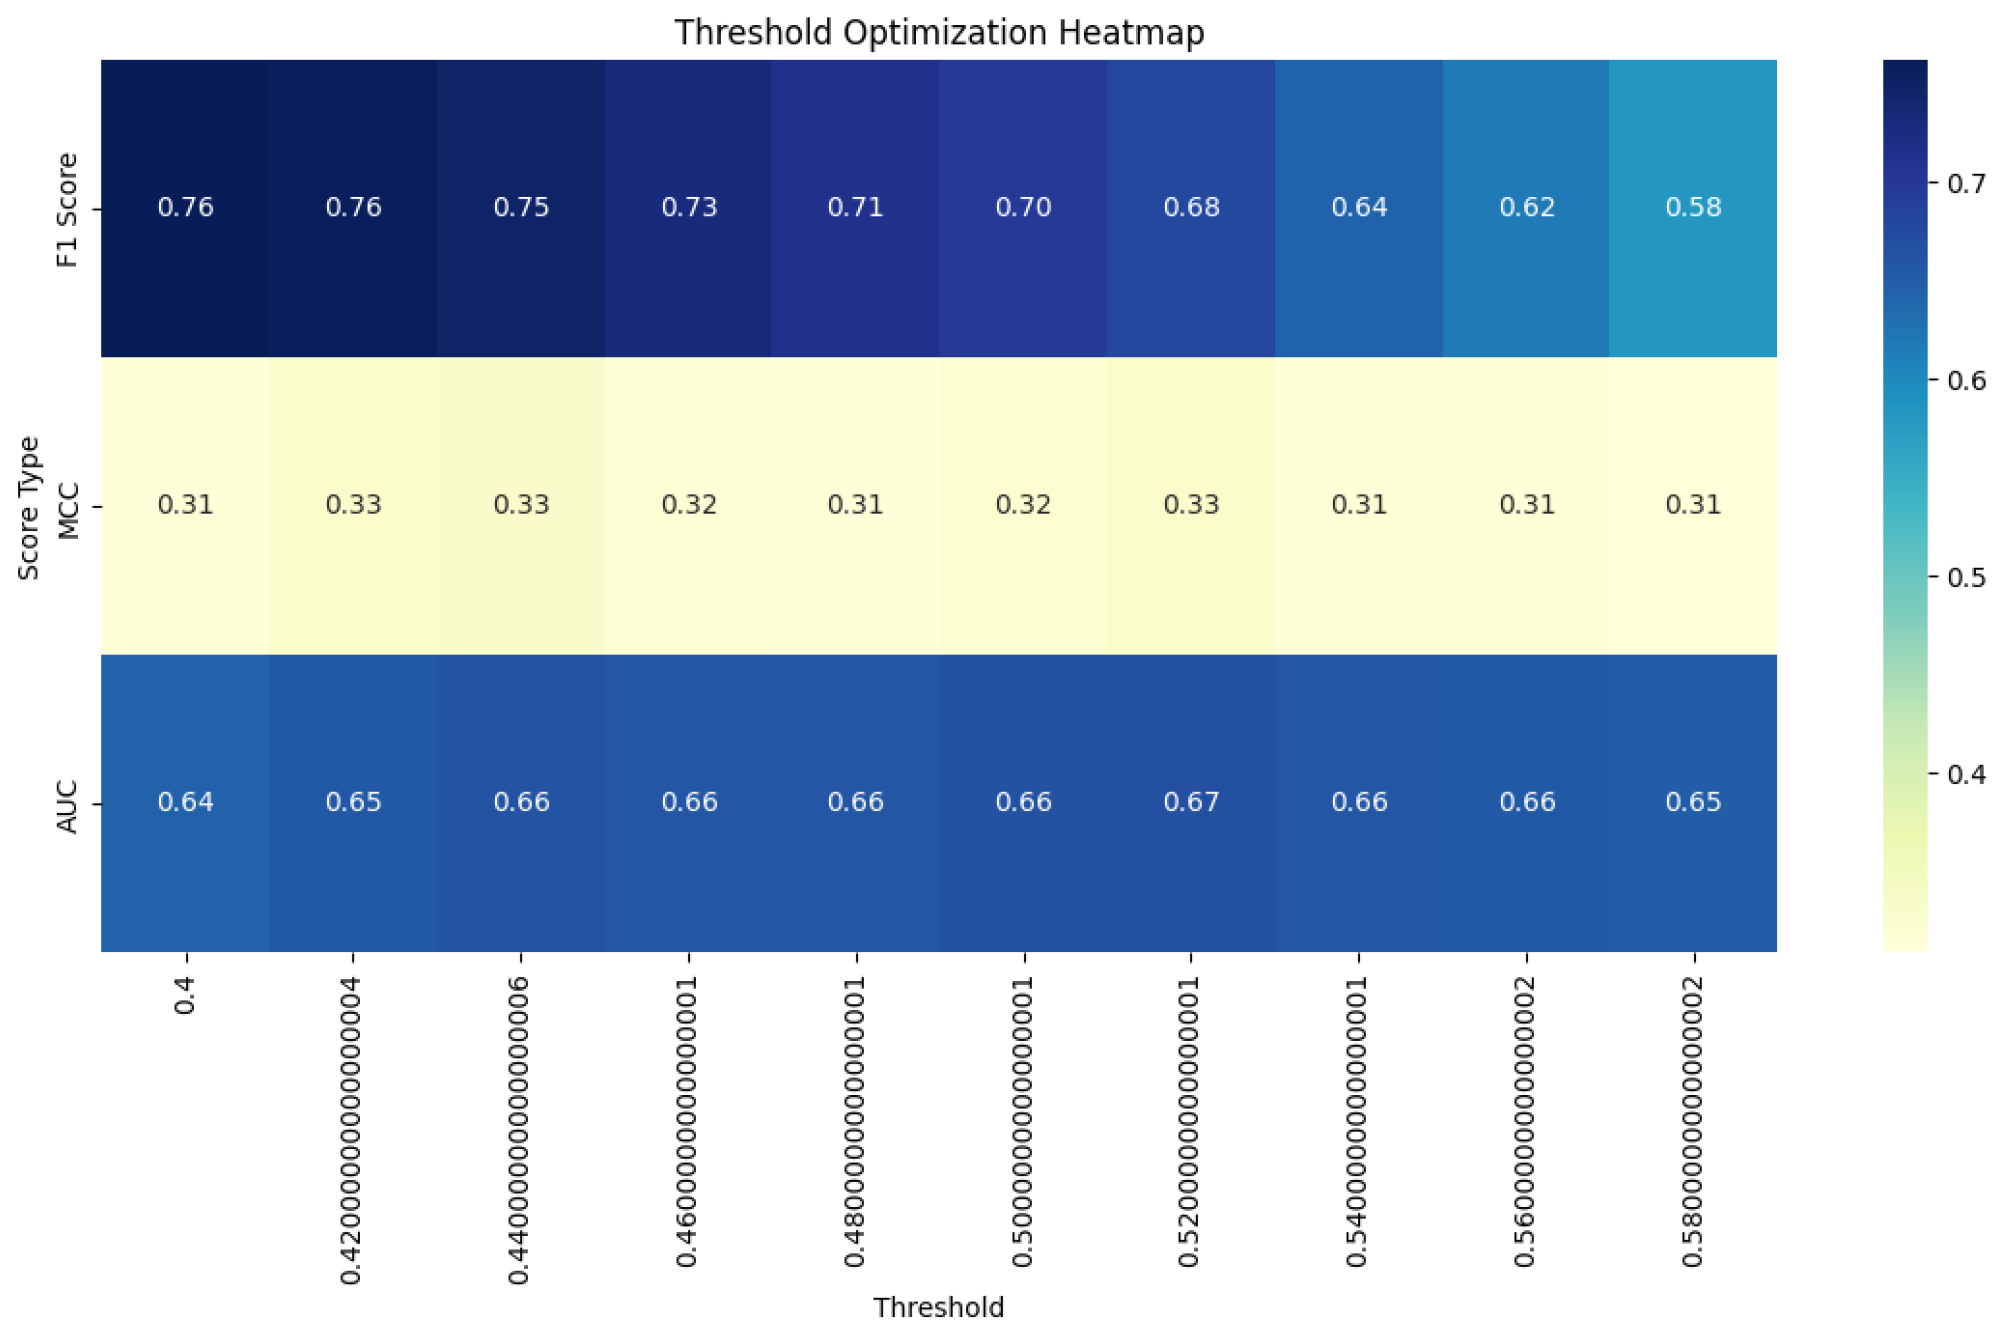
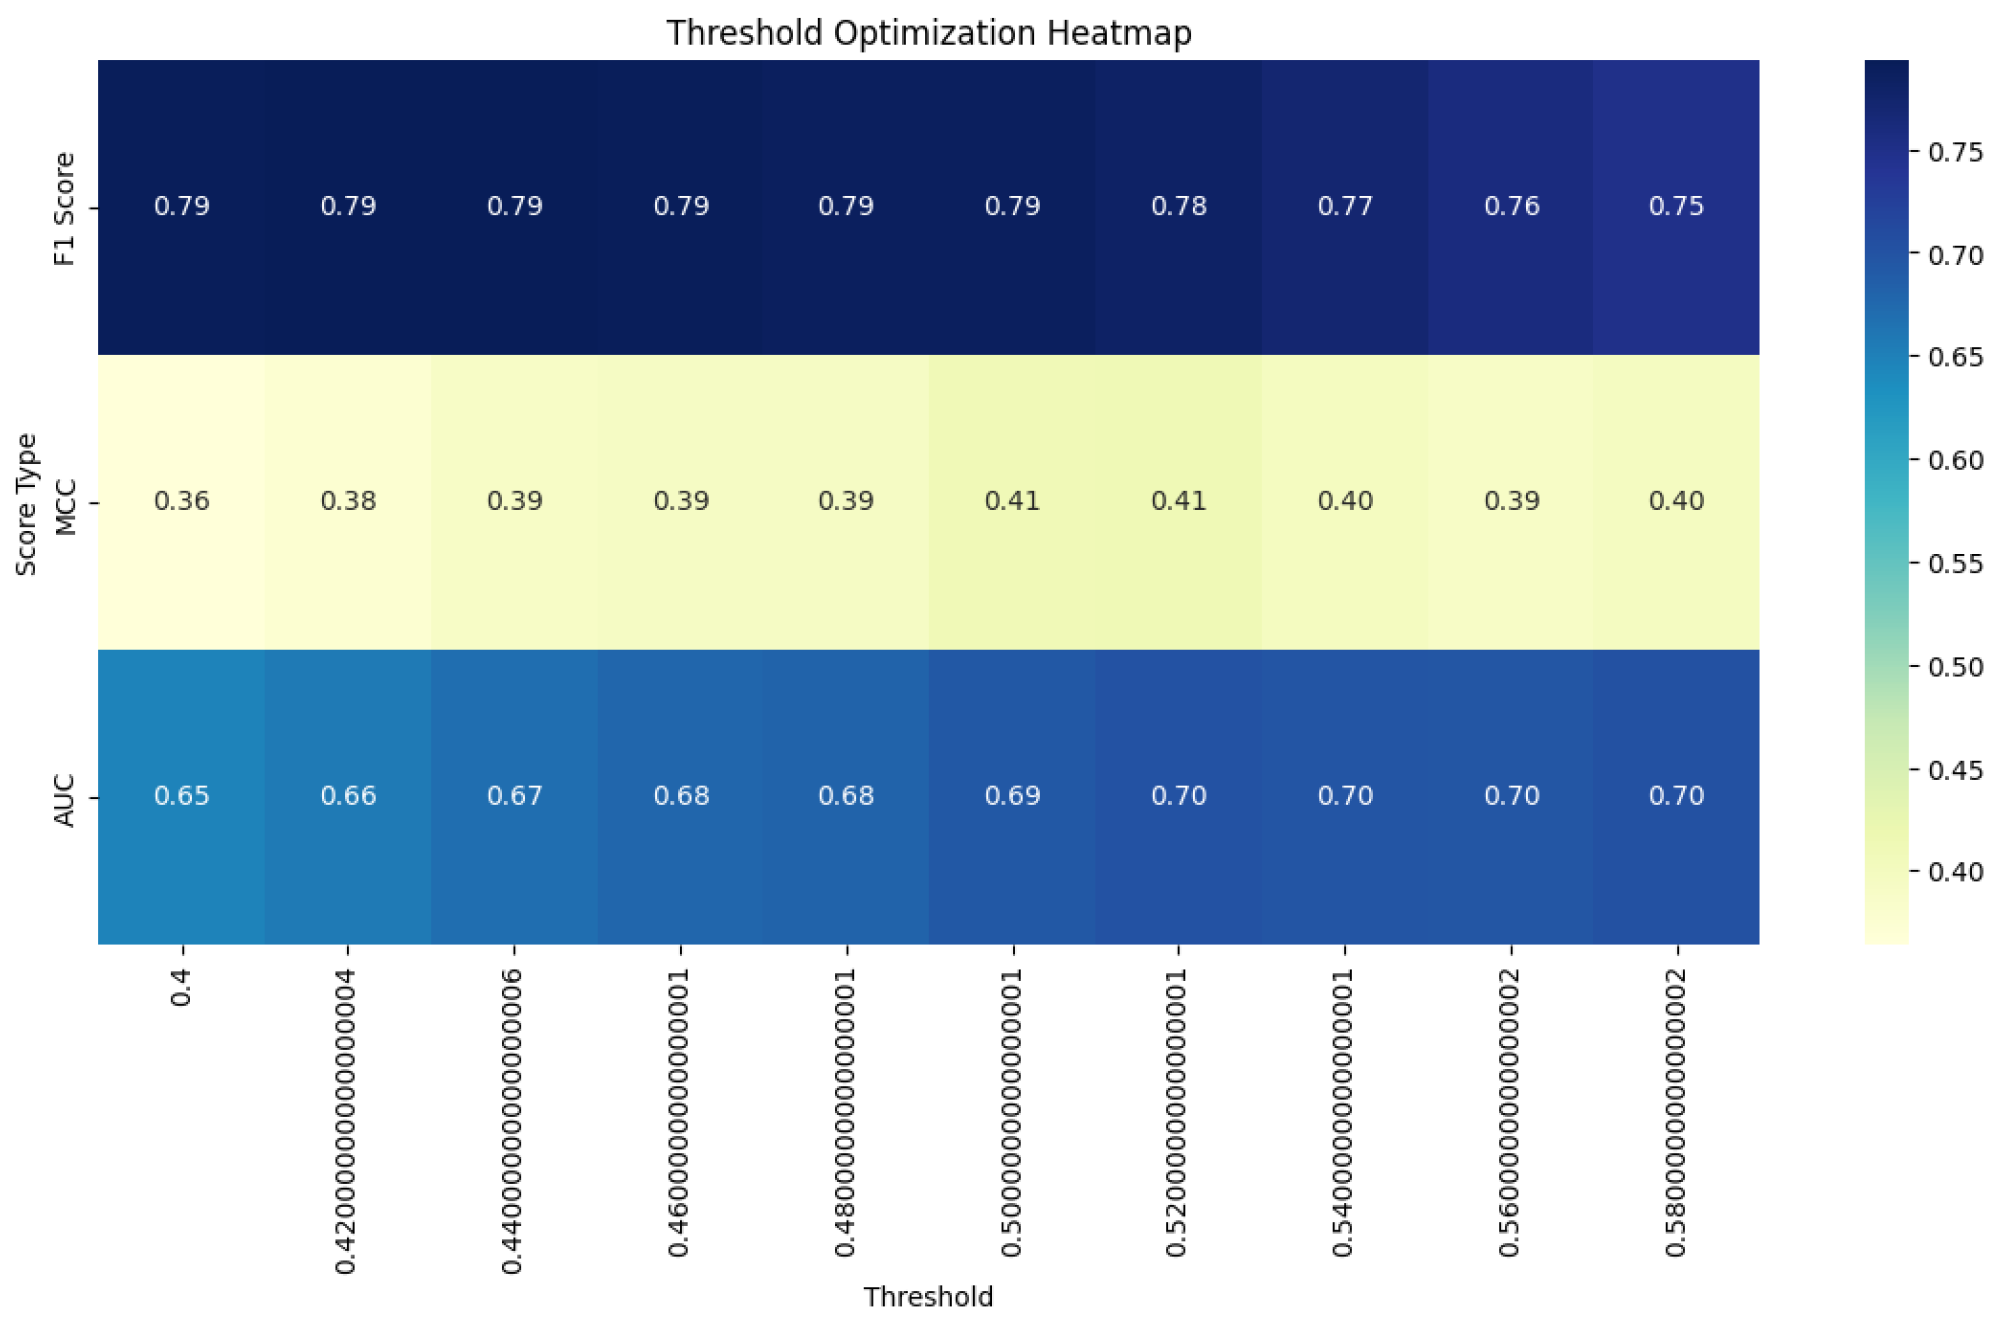
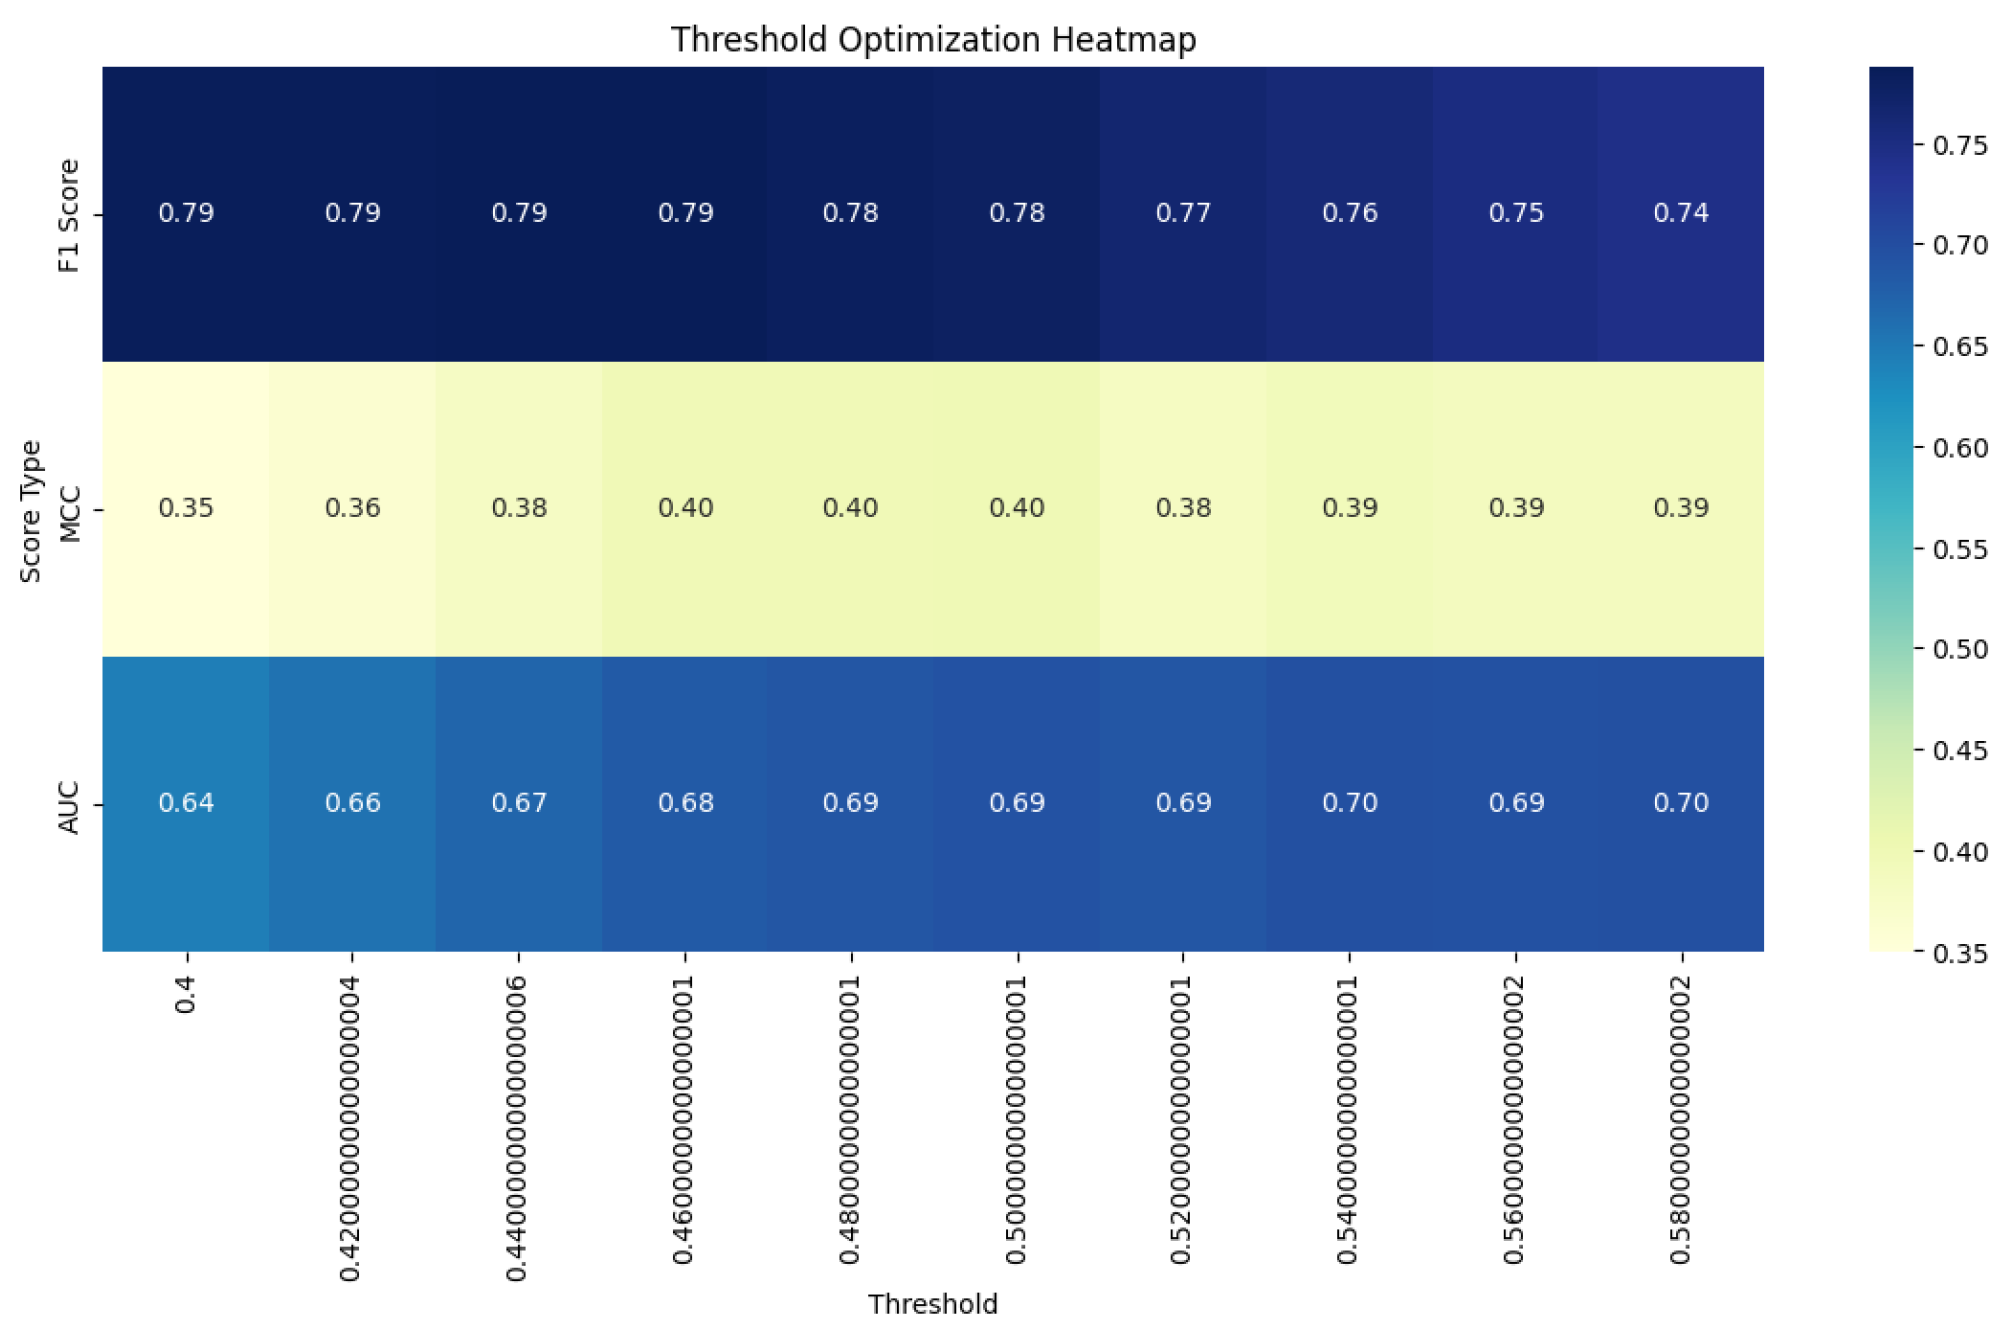
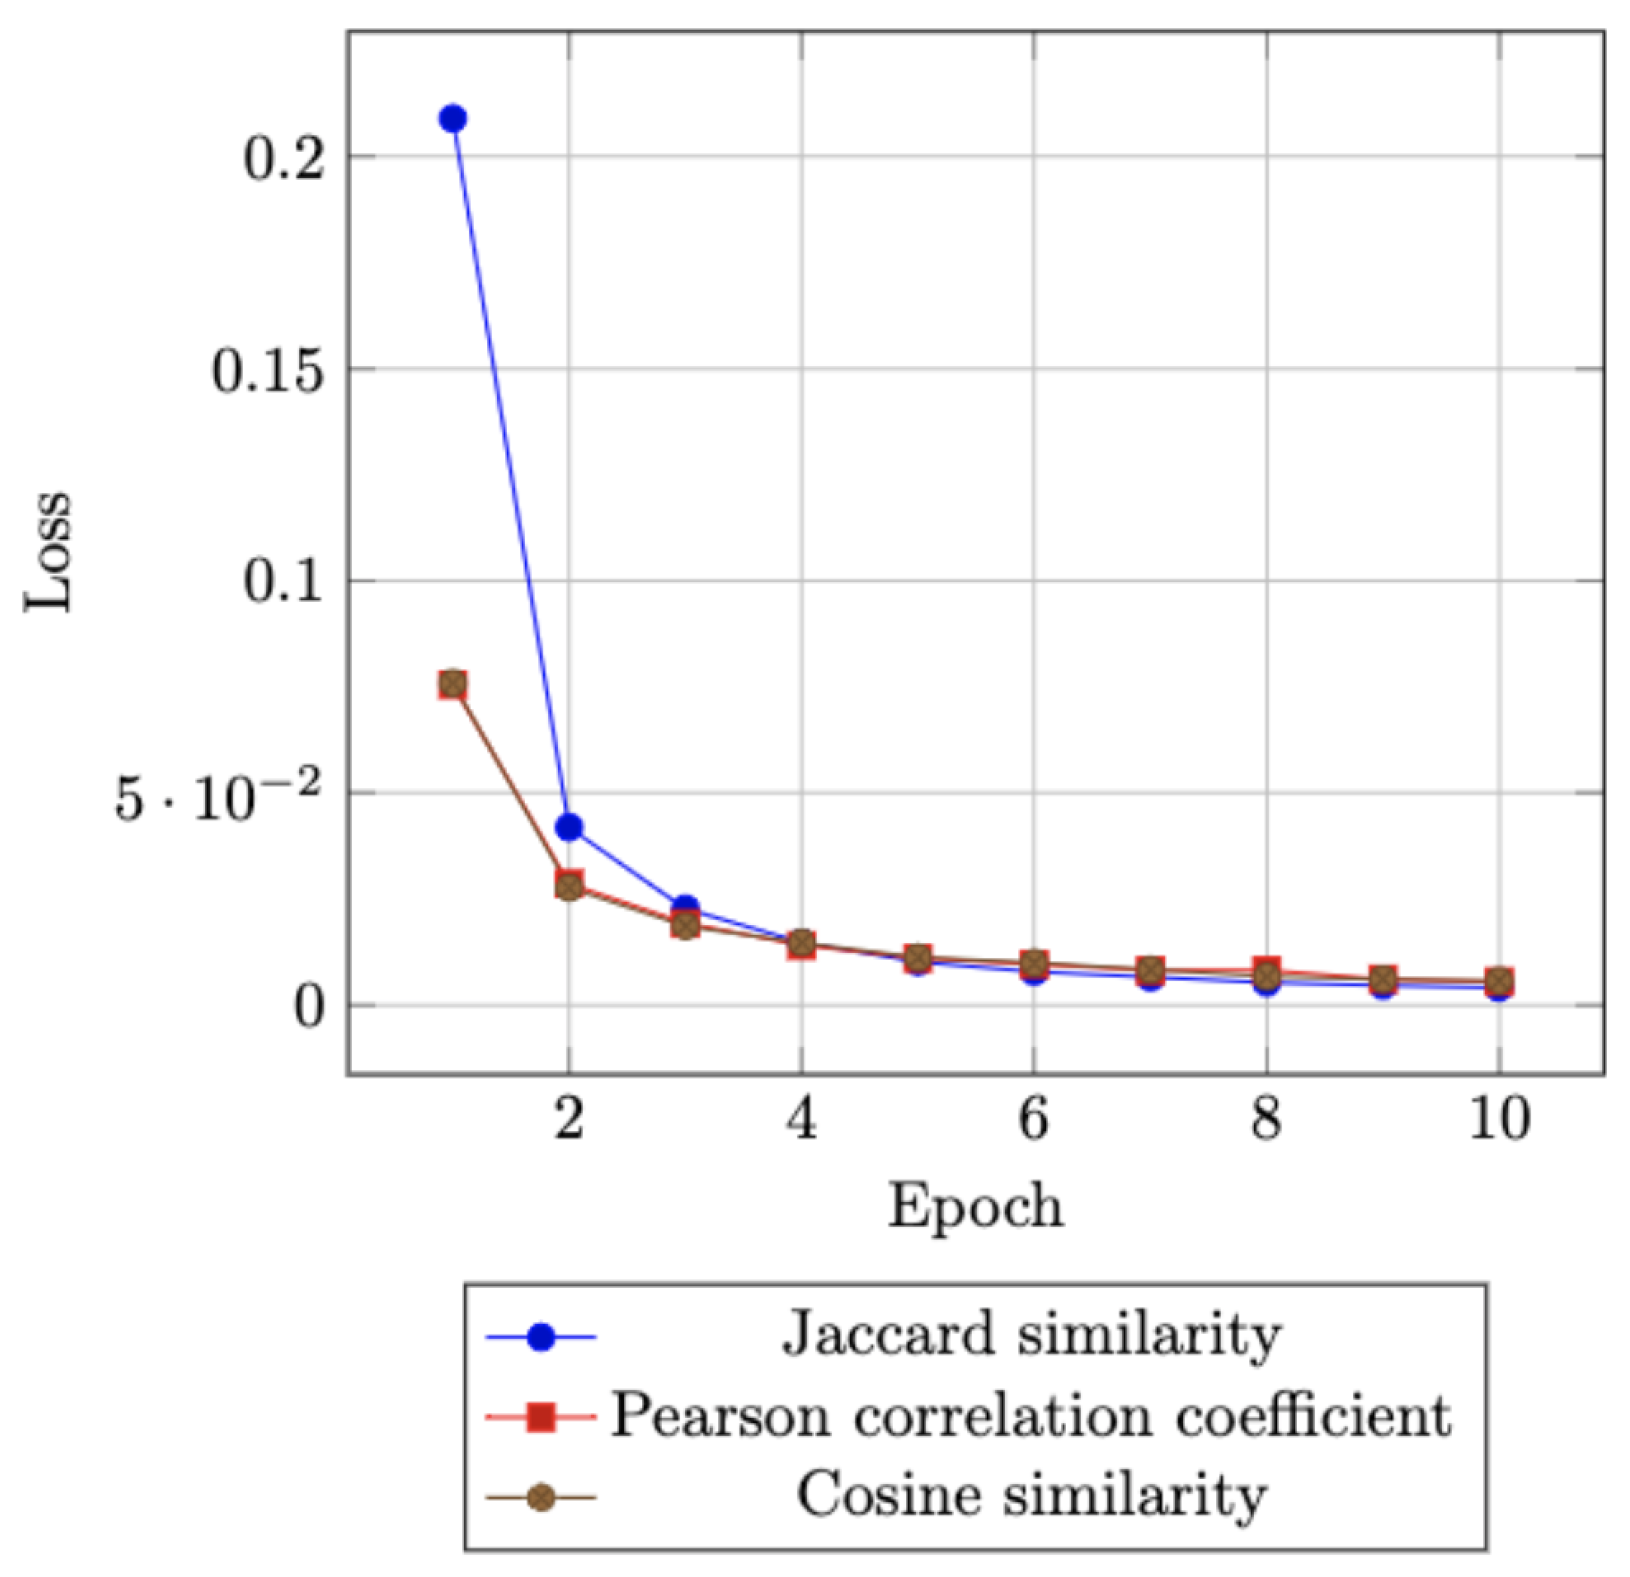
Based on the previous analysis, we study three most stable similarity functions that can learn complex relationships on STS tasks: Jaccard similarity, Pearson correlation coefficient, and Cosine similarity. Calculating the optimal threshold values with our approach as well as the metrics, we get results demonstrated in
Table 5 and
Figure 2,
Figure 3,
Figure 4, and
Figure 5:
The Jaccard similarity demonstrates remarkable consistency across all metrics which was noted in studies before [
27,
28]. The optimal threshold of 0.5 remains unchanged for F1 Score, MCC, and AUC ROC. This consistency reaffirms the Jaccard similarity’s stability and reliability in semantic textual similarity tasks, as we previously noted. The multi-objective approach does not alter its performance, suggesting that the Jaccard similarity’s optimal threshold is robust across different evaluation criteria.
The Pearson correlation coefficient shows a nuanced response to the multi-objective threshold. While the F1 Score experiences a slight decrease from its peak value, it still maintains a strong performance of 0.865. Notably, both the MCC and AUC ROC scores show improvement under the new threshold. This trade-off suggests that the multi-objective approach has successfully balanced the different aspects of performance, slightly sacrificing F1 Score to gain improvements in other metrics. The overall enhancement in MCC and AUC ROC indicates a more balanced and generalizable performance across different evaluation criteria [
29,
30].
The Cosine similarity demonstrates the most significant benefits from the multi-objective threshold approach. It shows substantial improvements across all three metrics - F1 Score, MCC, and AUC ROC. This uniform enhancement suggests that the previous single-metric optimization may have been suboptimal for cosine similarity. The multi-objective approach has effectively identified a threshold that better captures the strengths of Cosine similarity across multiple performance aspects, potentially uncovering its true capabilities in semantic textual similarity tasks.
These results highlight the effectiveness of the multi-objective threshold selection approach, particularly for measures like the Pearson correlation coefficient and Cosine similarity. The method’s ability to find a balance between different performance metrics is evident, leading to more robust and more generalizable threshold selections. For the Jaccard similarity, the approach confirms its inherent stability across different evaluation criteria.
5. Conclusion
Our study presents a comprehensive analysis of various similarity measures for semantic textual similarity tasks, utilizing the STS Benchmark dataset. Our investigation encompassed a range of traditional similarity functions and introduced a novel multi-objective approach for optimal threshold selection. The research findings offer significant insights into the effectiveness and robustness of different similarity measures, with important implications for both theoretical understanding and practical applications in natural language processing.
Key findings from our analysis reveal that the Cosine similarity and the Pearson correlation coefficient consistently outperform other measures across multiple evaluation metrics. This exceptional performance can be attributed to their ability to effectively capture the angular similarity between vector representations of sentences, which aligns well with the semantic structure of the data.
Notably, the Jaccard similarity exhibits remarkable stability, consistently selecting 0.5 as the optimal threshold across all evaluation metrics. While not achieving the highest scores, its uniform performance suggests it as a reliable choice for applications where consistency and simplicity are prioritized.
In contrast, distance-based measures such as the Minkowski distance, Canberra distance, and Dice coefficient consistently underperform, indicating their limited suitability for this specific semantic similarity task. This underperformance highlights the importance of choosing appropriate similarity measures that align with the nature of the semantic relationships in the data.
Our novel straightforward multi-objective approach for threshold selection proves to be particularly effective. By synthesizing information from F1 Score, MCC, and AUC ROC, this method achieves a robust compromise among multiple performance aspects. The approach’s ability to balance different metrics leads to more generalizable threshold selections, addressing the limitations of single-metric optimizations.
The granular threshold exploration from 0.1 to 0.9 with a 0.1 step allows for precise identification of performance optima, revealing nuanced threshold values that might be overlooked by coarser approaches. This fine-grained analysis provides deeper insights into the behavior of different similarity measures across various thresholds.
Future research directions could explore the application of these findings to other datasets and domains, investigate the integration of these similarity measures with more advanced machine learning techniques, and further refine the multi-objective approach to include additional performance metrics or adaptive weighting schemes.
These findings contribute significantly to the ongoing development of more accurate and reliable semantic textual similarity systems, with potential applications ranging from information retrieval and text classification to more advanced natural language understanding tasks.
Data Availability Statement
The code is uploaded to GitHub repository and is available at:
GitHub Link.
Acknowledgments
This work is done with the guidance of Sparcus Technologies Limited, a leading research-oriented machine learning and data science agency with headquarters in Hong Kong, HKSAR.
Conflicts of Interest
All the authors declare no conflicts of interest.
References
- J. Bromley, I. Guyon, Y. LeCun, E. Säckinger, and R. Shah, “Signature Verification using a ‘Siamese’ Time Delay Neural Network,” Neural Information Processing Systems, 1993.
- R. Mihalcea and P. Tarau, “TextRank: Bringing Order into Texts,” 2004. Available: https://aclanthology.org/W04-3252.pdf.
- E. Agirre, D. Cer, M. Diab, and A. Gonzalez-Agirre, “SemEval-2012 Task 6: A Pilot on Semantic Textual Similarity,” ACLWeb, Jul. 08, 2012. https://aclanthology.org/S12-1051 (accessed Jun. 28, 2024).
- D. Bär, T. Zesch, and I. Gurevych, “A Reflective View on Text Similarity,” 2011. Accessed: Jun. 28, 2024. [Online]. Available: https://aclanthology.org/R11-1071.pdf.
- R. Kiros et al., “Skip-Thought Vectors,” Neural Information Processing Systems, 2015.
- W. Yin, H. Schütze, B. Xiang, and B. Zhou, “ABCNN: Attention-Based Convolutional Neural Network for Modeling Sentence Pairs,” Transactions of the Association for Computational Linguistics, vol. 4, pp. 259–272, Dec. 2016. [CrossRef]
- W. Gomaa and A. Fahmy, “A Survey of Text Similarity Approaches,” International Journal of Computer Applications, vol. 68, no. 13, pp. 975–8887, 2013.
- D. Chandrasekaran and V. Mago, “Evolution of Semantic Similarity—A Survey,” ACM Computing Surveys, vol. 54, no. 2, pp. 1–37, Apr. 2021. [CrossRef]
- A. Conneau, G. Lample, M. Ranzato, L. Denoyer, and H. Jégou, “MTEB: A Multilingual Evaluation Benchmark for Cross-Lingual Transfer,”, 2020. arXiv:2009.11467.
- J. Mueller and A. Thyagarajan, “Siamese Recurrent Architectures for Learning Sentence Similarity,” Proceedings of the AAAI Conference on Artificial Intelligence, vol. 30, no. 1, Mar. 2016. [CrossRef]
- P. Neculoiu, L. Boroditsky, and M. Vertan, “Siamese networks for semantic textual similarity,” EMNLP, 2020.
- Z. Wang, P. Ng, X. Ma, R. Nallapati, and B. Xiang, “Multi-passage BERT: A Globally Normalized BERT Model for Open-domain Question Answering,”, Oct. 2019. arXiv:1908.08167.
- N. Reimers and I. Gurevych, “Sentence-BERT: Sentence Embeddings using Siamese BERT-Networks,” arXiv.org, 2019. arXiv:1908.10084.
- H. Xu, H. Le, and G. Liu, “Smooth inverse frequency: A simple and effective similarity function for Siamese networks in semantic textual similarity,” ACL, 2021.
- X. Jiao, Y. Huang, and C. Hong, “Adaptive margin cosine similarity for Siamese networks in semantic textual similarity,” EMNLP, 2022.
- K. S. Tai, R. Socher, and C. D. Manning, “Improved Semantic Representations From Tree-Structured Long Short-Term Memory Networks,”, May 2015. arXiv:1503.00075.
- A. P. Parikh, O. Täckström, D. Das, and J. Uszkoreit, “A Decomposable Attention Model for Natural Language Inference,”, Sep. 2016. arXiv:1606.01933.
- Z. Yang, D. Yang, C. Dyer, X. He, A. Smola, and E. Hovy, “Hierarchical Attention Networks for Document Classification,” Association for Computational Linguistics, 2016. Available: https://aclanthology.org/N16-1174.pdf.
- Z. Lin et al., “A Structured Self-attentive Sentence Embedding,”, 2017. arXiv:1703.03130.
- M. Peters et al., “Deep Contextualized Word Representations,” Proceedings of the 2018 Conference of the North American Chapter of the Association for Computational Linguistics: Human Language Technologies, Volume 1 (Long Papers), vol. 1, 2018. [CrossRef]
- J. Howard and S. Ruder, “Universal Language Model Fine-tuning for Text Classification,”, 2018. arXiv:1801.06146.
- J. Devlin, M.-W. Chang, K. Lee, and K. Toutanova, “BERT: Pre-training of Deep Bidirectional Transformers for Language Understanding,”, May 24, 2019. arXiv:1810.04805.
- Y. Liu et al., “RoBERTa: A Robustly Optimized BERT Pretraining Approach,”, Jul. 26, 2019. arXiv:1907.11692.
- Z. Lan, M. Chen, S. Goodman, K. Gimpel, P. Sharma, and R. Soricut, “ALBERT: A Lite BERT for Self-supervised Learning of Language Representations,”, Feb. 2020. arXiv:1909.11942.
- C. Raffel et al., “Exploring the Limits of Transfer Learning with a Unified Text-to-Text Transformer,” Journal of Machine Learning Research, vol. 21, no. 140, pp. 1–67, 2020, Available: https://www.jmlr.org/papers/v21/20-074.html.
- K. Clark, M.-T. Luong, Q. V. Le, and C. D. Manning, “ELECTRA: Pre-training Text Encoders as Discriminators Rather Than Generators,”, Mar. 2020. arXiv:2003.10555.
- B. Tom et al., “Language Models are Few-Shot Learners,” Advances in Neural Information Processing Systems, vol. 33, 2020.
- Y. Zhang and Q. Yang, “A Survey on Multi-Task Learning,” IEEE Transactions on Knowledge and Data Engineering, vol. 34, no. 12, pp. 1–1, 2021. [CrossRef]
- A. Vaswani et al., “Attention is All you Need,” Advances in Neural Information Processing Systems, vol. 30, pp. 5998–6008, 2017.
- Q. Li et al., “A Survey on Text Classification: From Shallow to Deep Learning,” arxiv.org, Aug. 2020. [CrossRef]
|
Disclaimer/Publisher’s Note: The statements, opinions and data contained in all publications are solely those of the individual author(s) and contributor(s) and not of MDPI and/or the editor(s). MDPI and/or the editor(s) disclaim responsibility for any injury to people or property resulting from any ideas, methods, instructions or products referred to in the content. |
© 2024 by the authors. Licensee MDPI, Basel, Switzerland. This article is an open access article distributed under the terms and conditions of the Creative Commons Attribution (CC BY) license (http://creativecommons.org/licenses/by/4.0/).
