Submitted:
27 June 2024
Posted:
01 July 2024
You are already at the latest version
Abstract
Keywords:
1. Introduction
2. Literature Review
2.1. Introduction to Credit Card Fraud Detection
2.2. The Importance of Detecting Credit Card Fraud
2.3.1. Automated Pattern Recognition
2.3.2. Predictive Modelling
2.3.3. Dynamic Risk Scoring
2.3.4. Anomaly Detection
2.3.5. Natural Language Processing (NLP)
2.3.6. Integration with Existing Systems
2.4. Credit Card Fraud Detection: Machine Learning Applications
2.5. Credit Card Fraud Detection Using Apache Spark
2.6. How Machine Learning Algorithms Enhance Decision Quality in Detecting Fraud
2.6.1. Improved Detection Accuracy
2.6.2. Real-time Processing and Analysis
2.6.3. Handling Big Data and Complex Variables
2.6.4. Adaptive Learning for Evolving Threats
2.6.5. Cost Efficiency through Automation
2.6.6. Enhanced Scalability
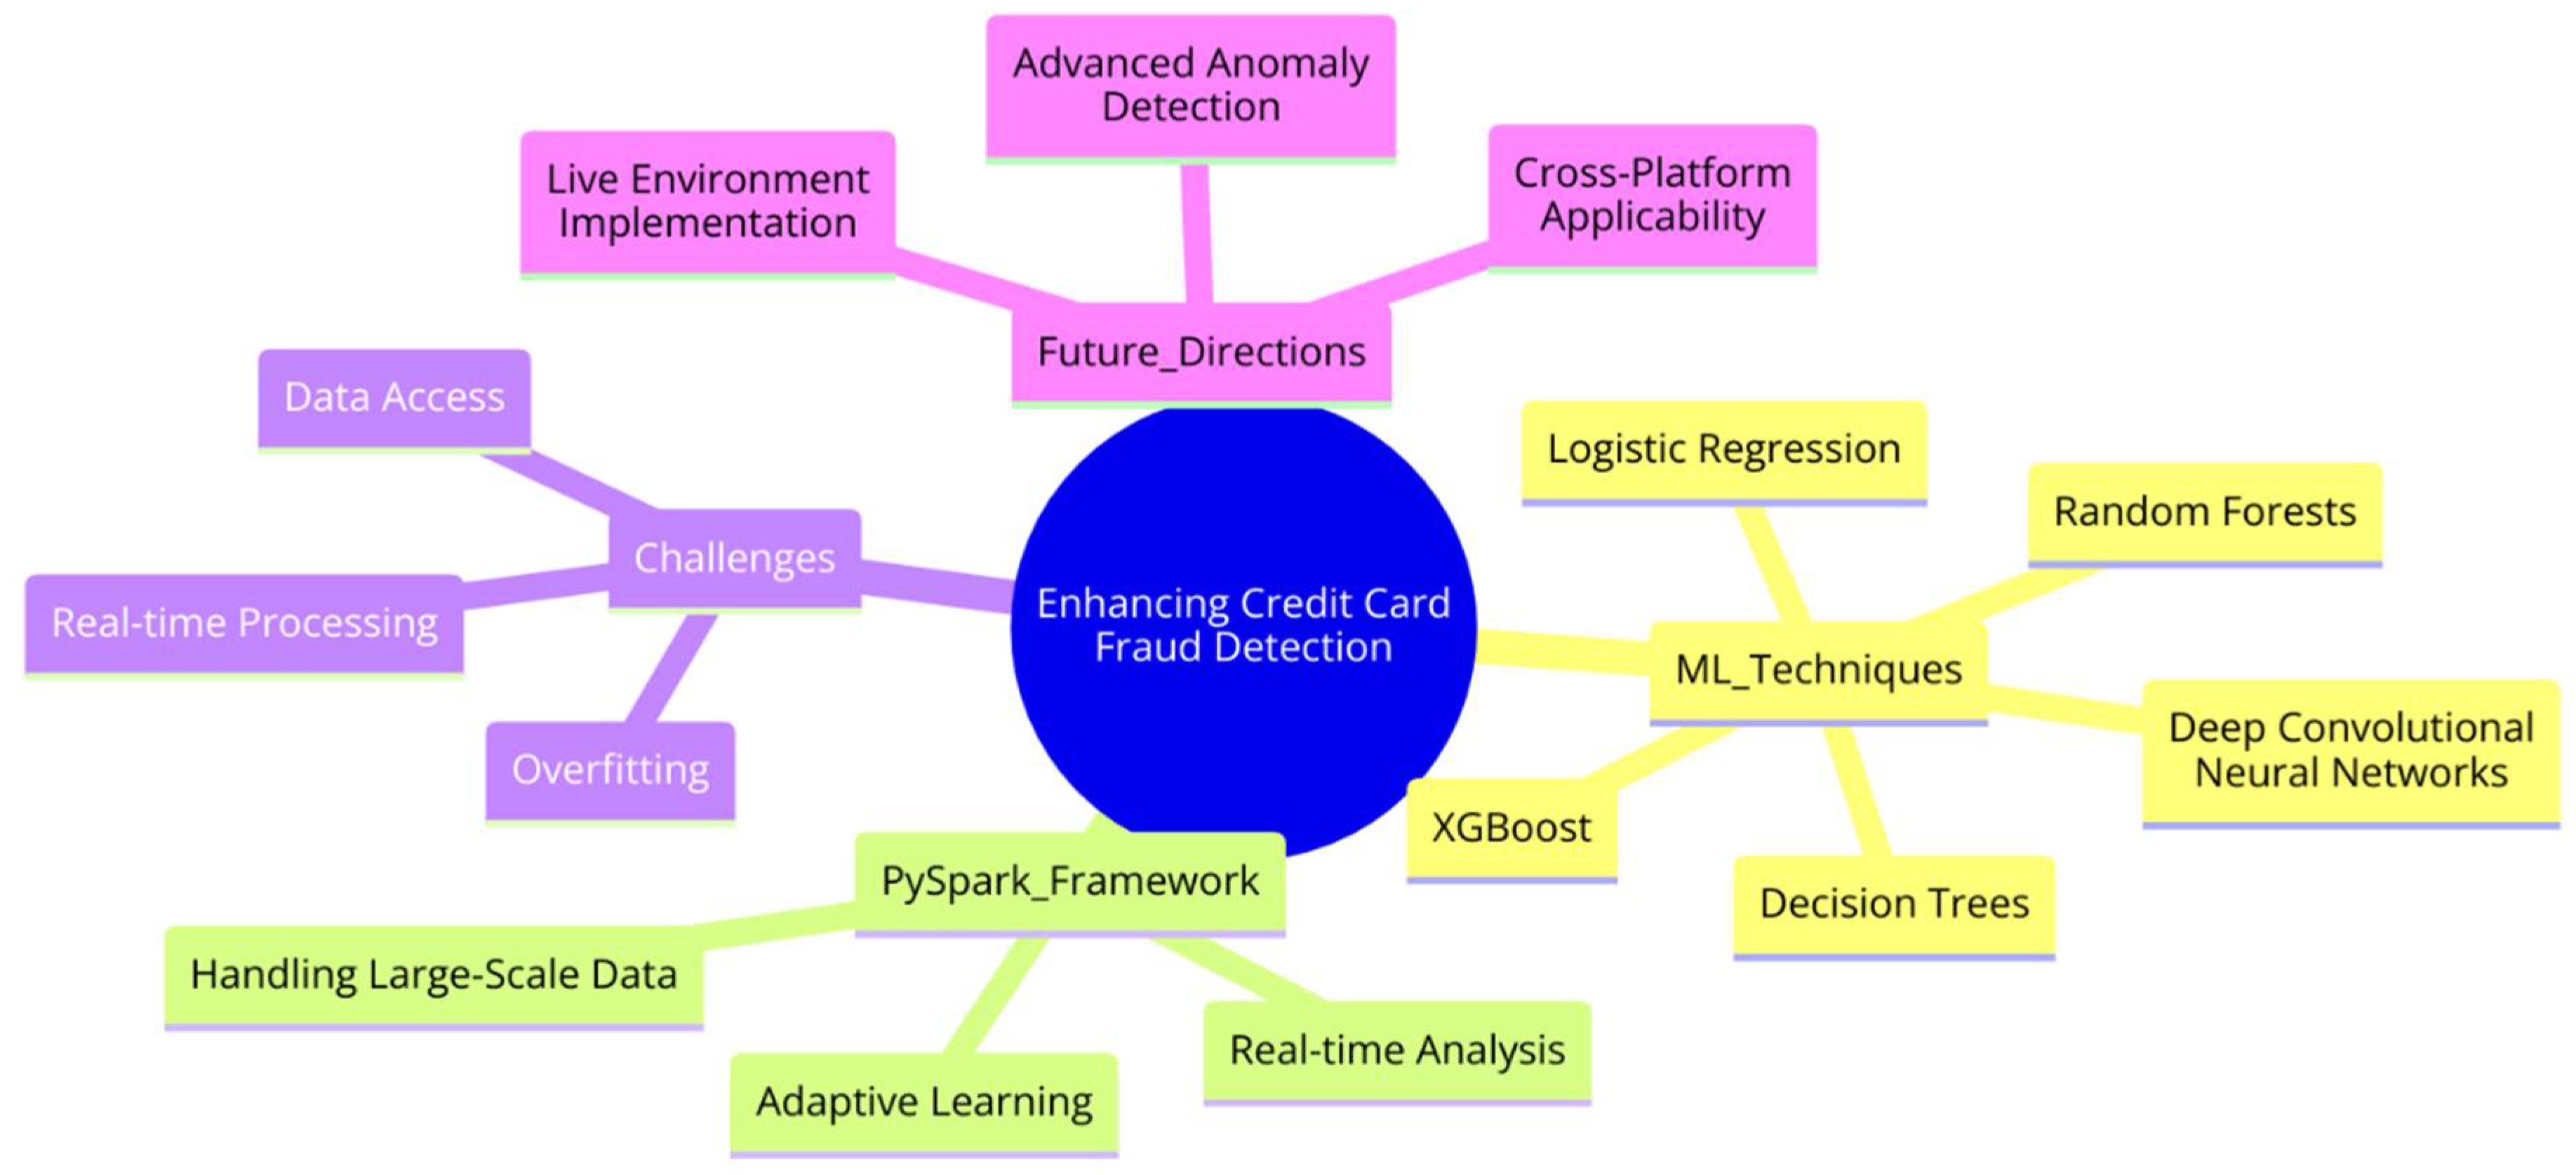
3. Materials and Methods
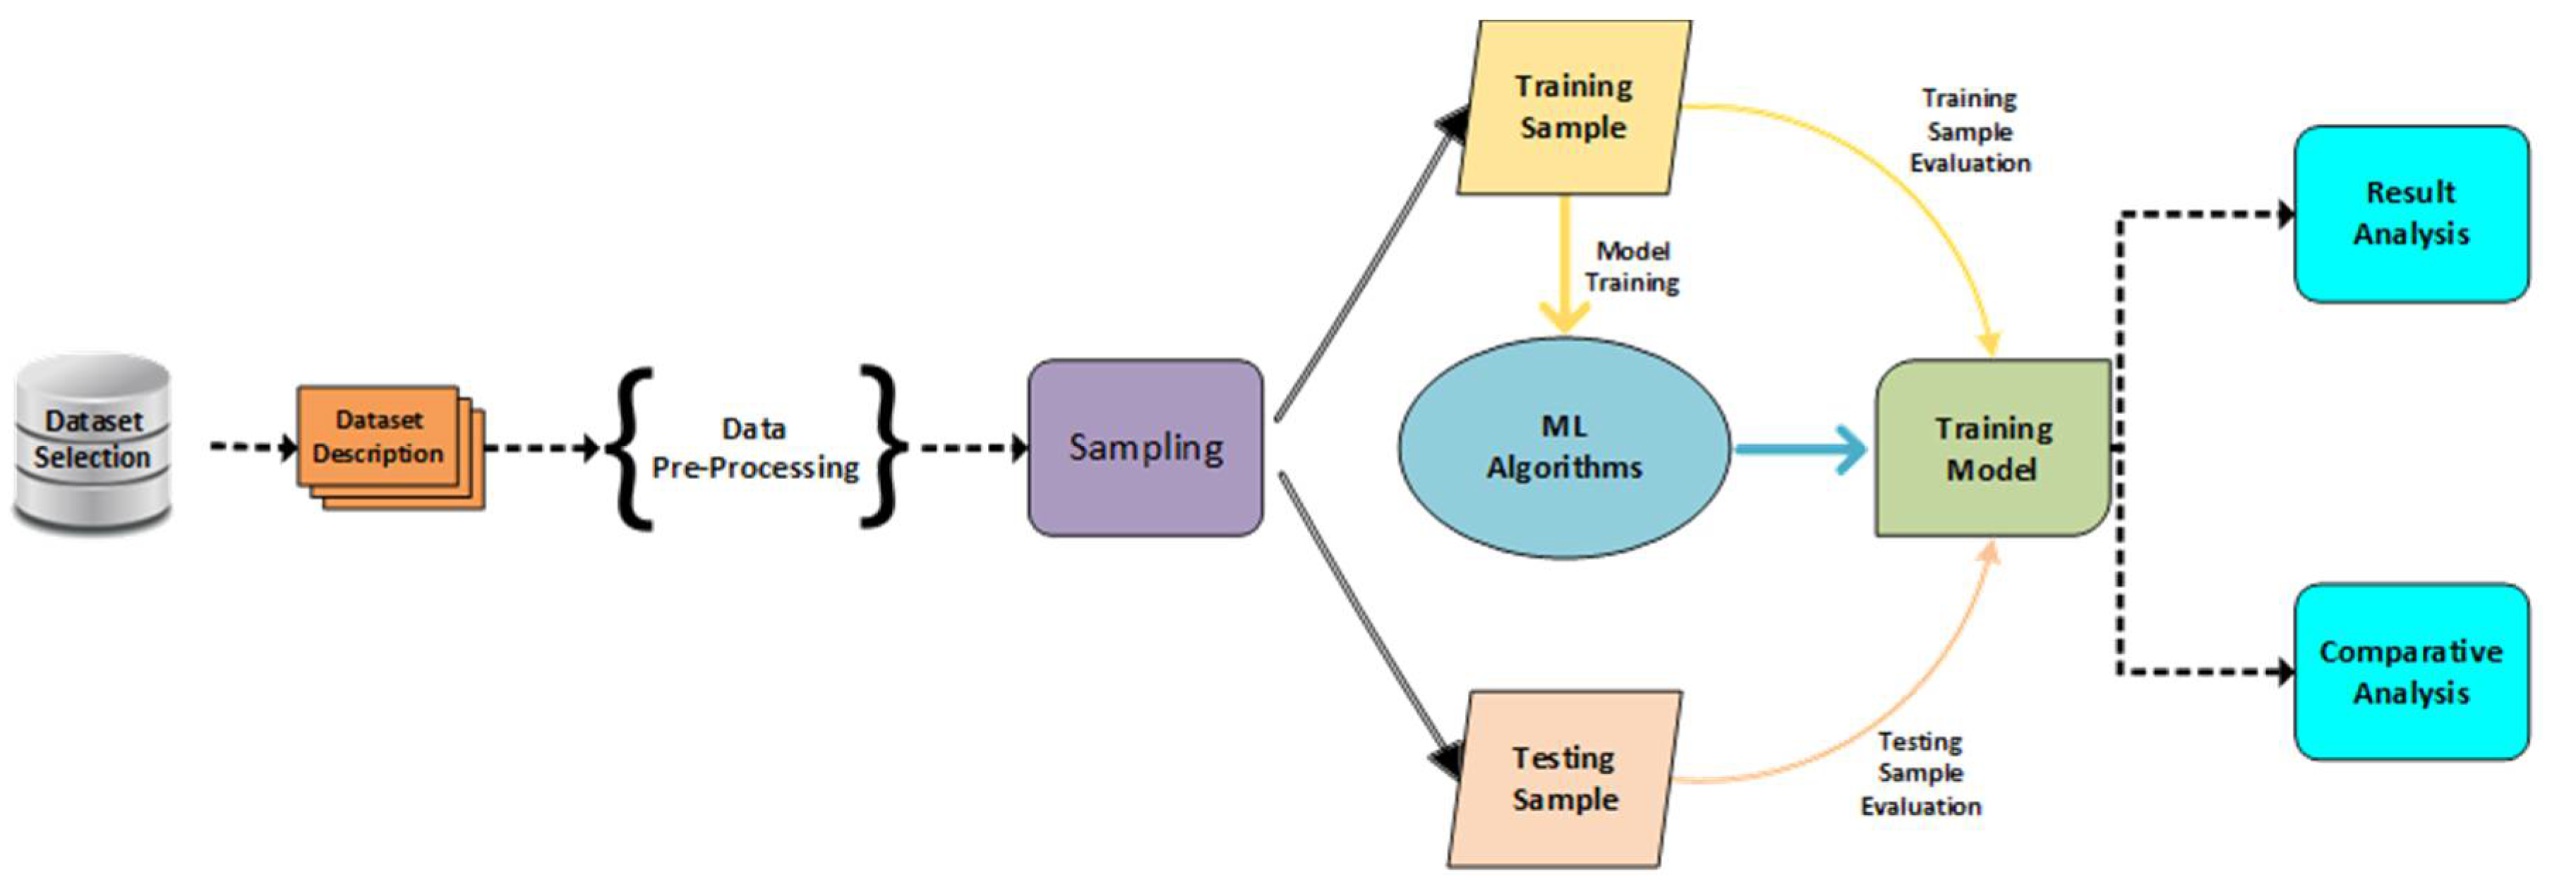
- Logistic Regression:
- DecisionTrees
- Random Forest
- XGBoost
3.1. Dataset Description
3.2. Dataset Pre-Processing
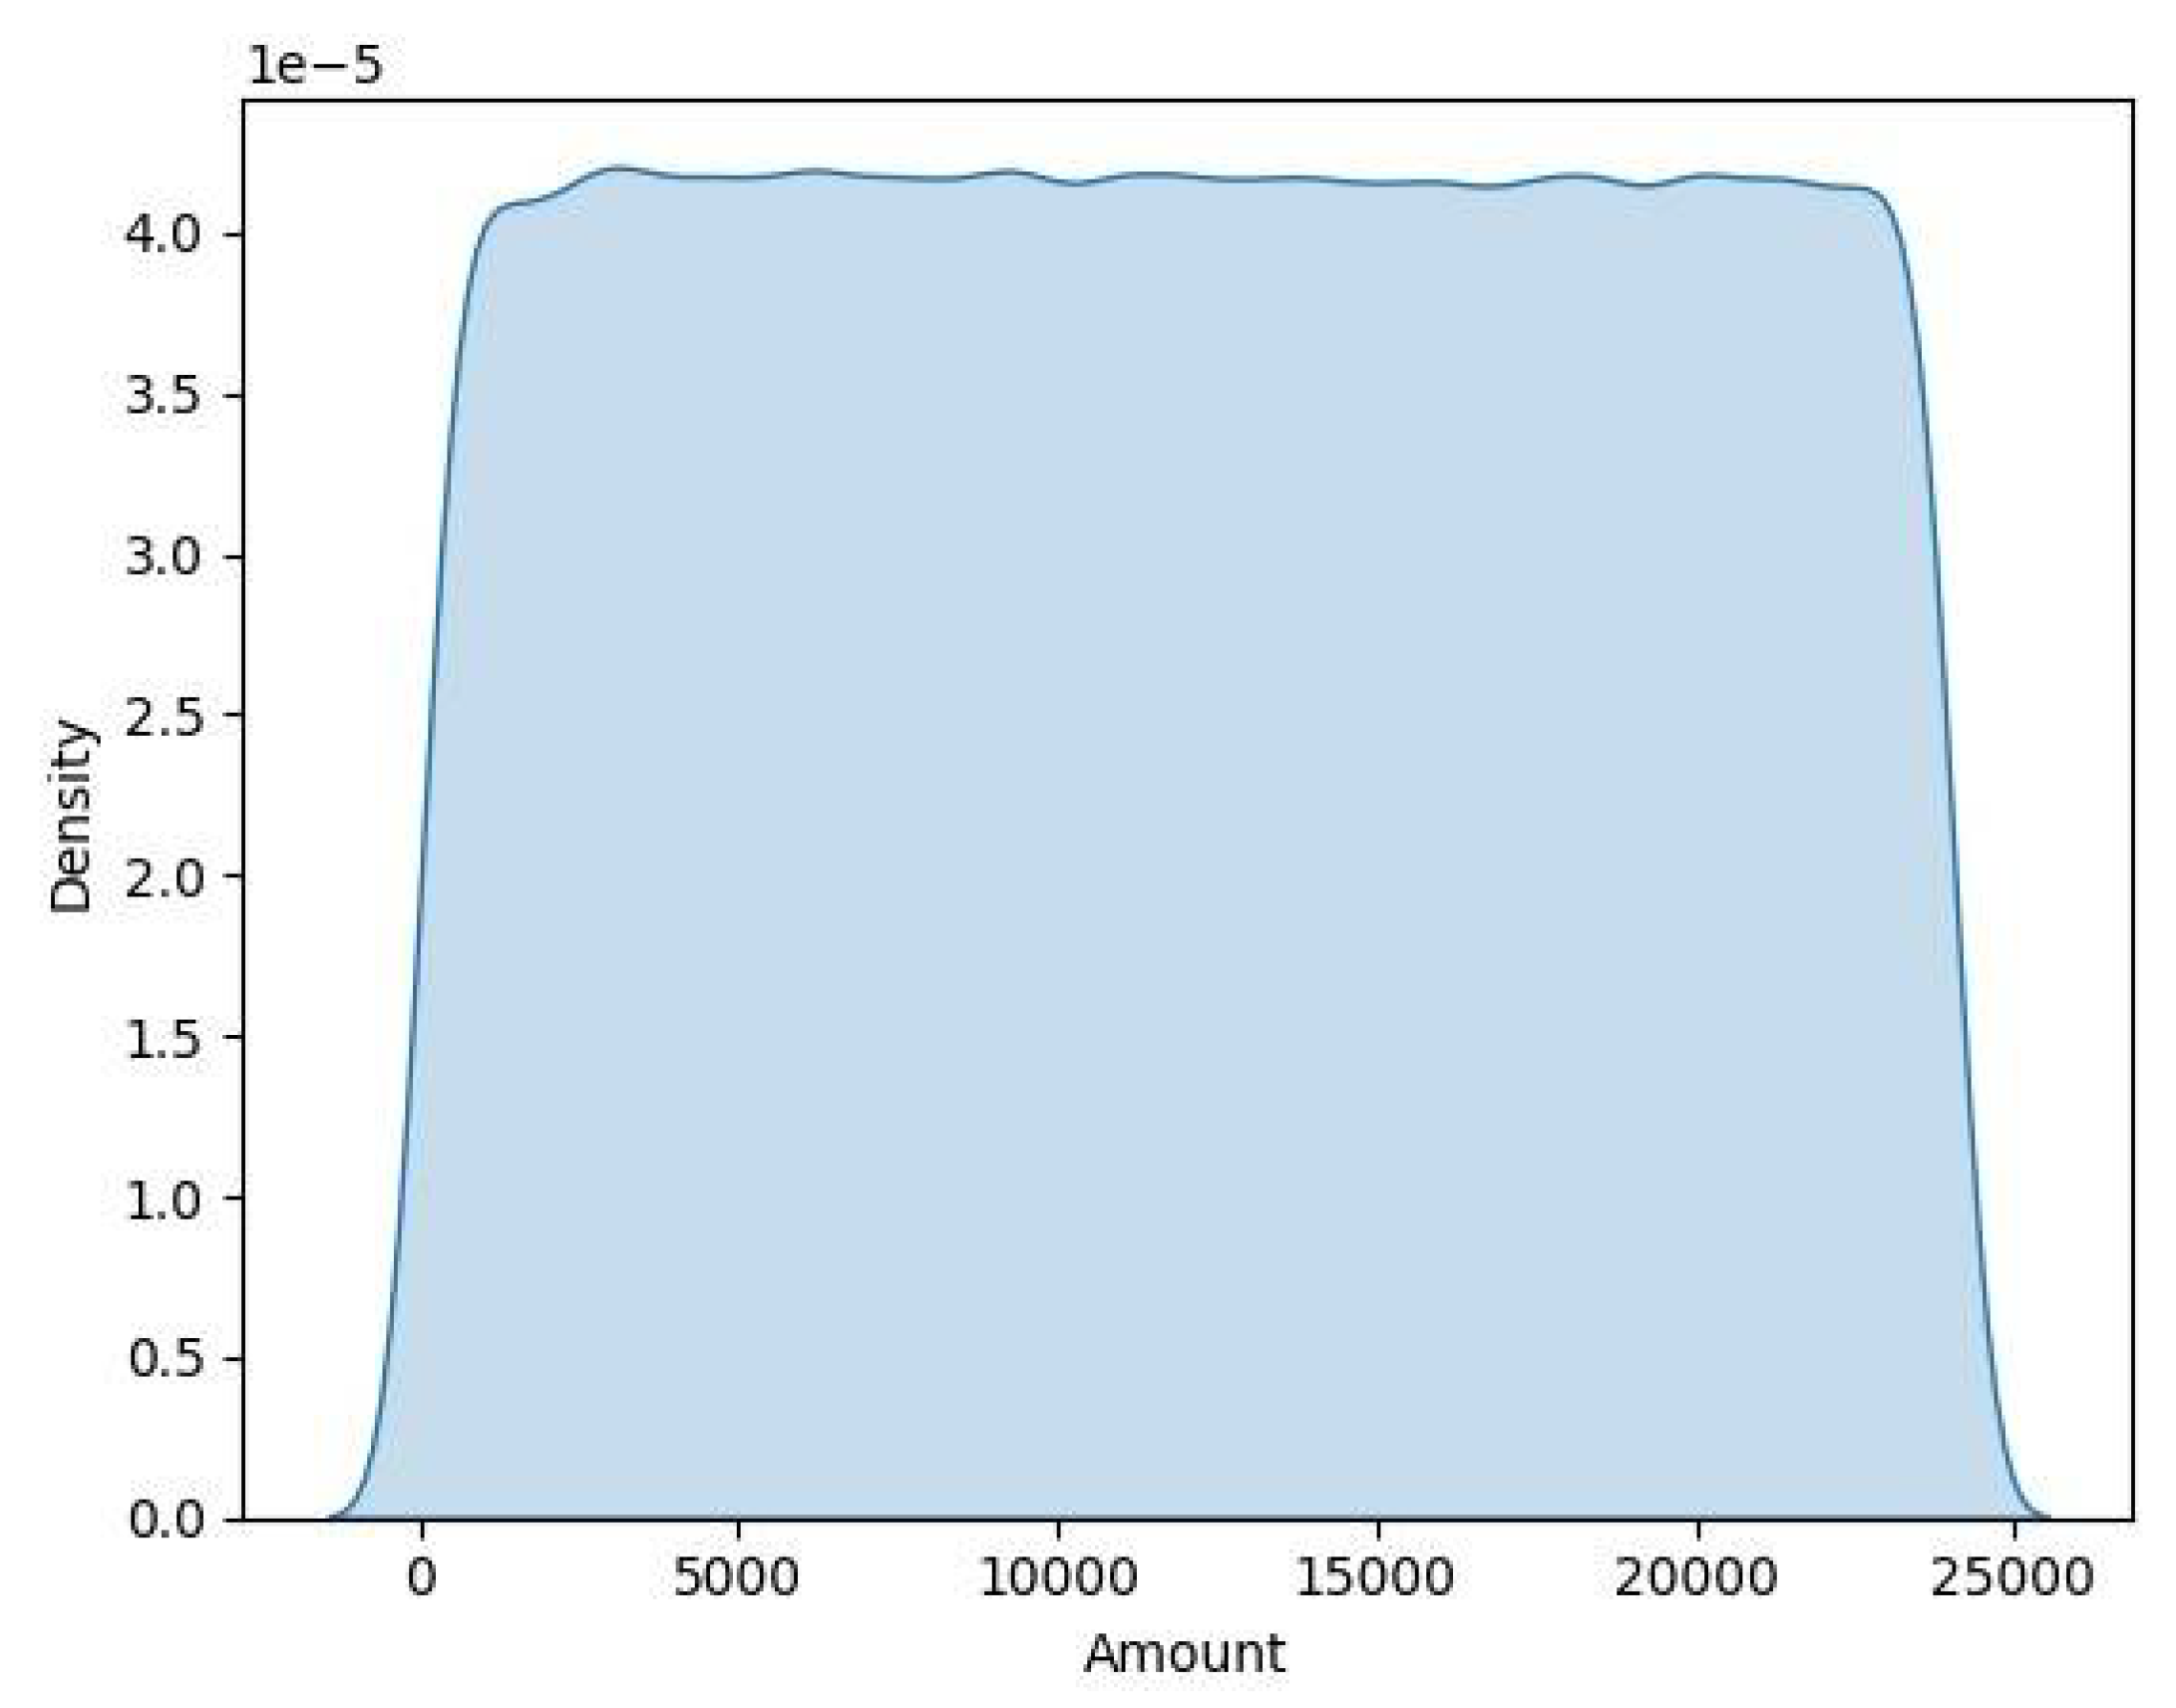
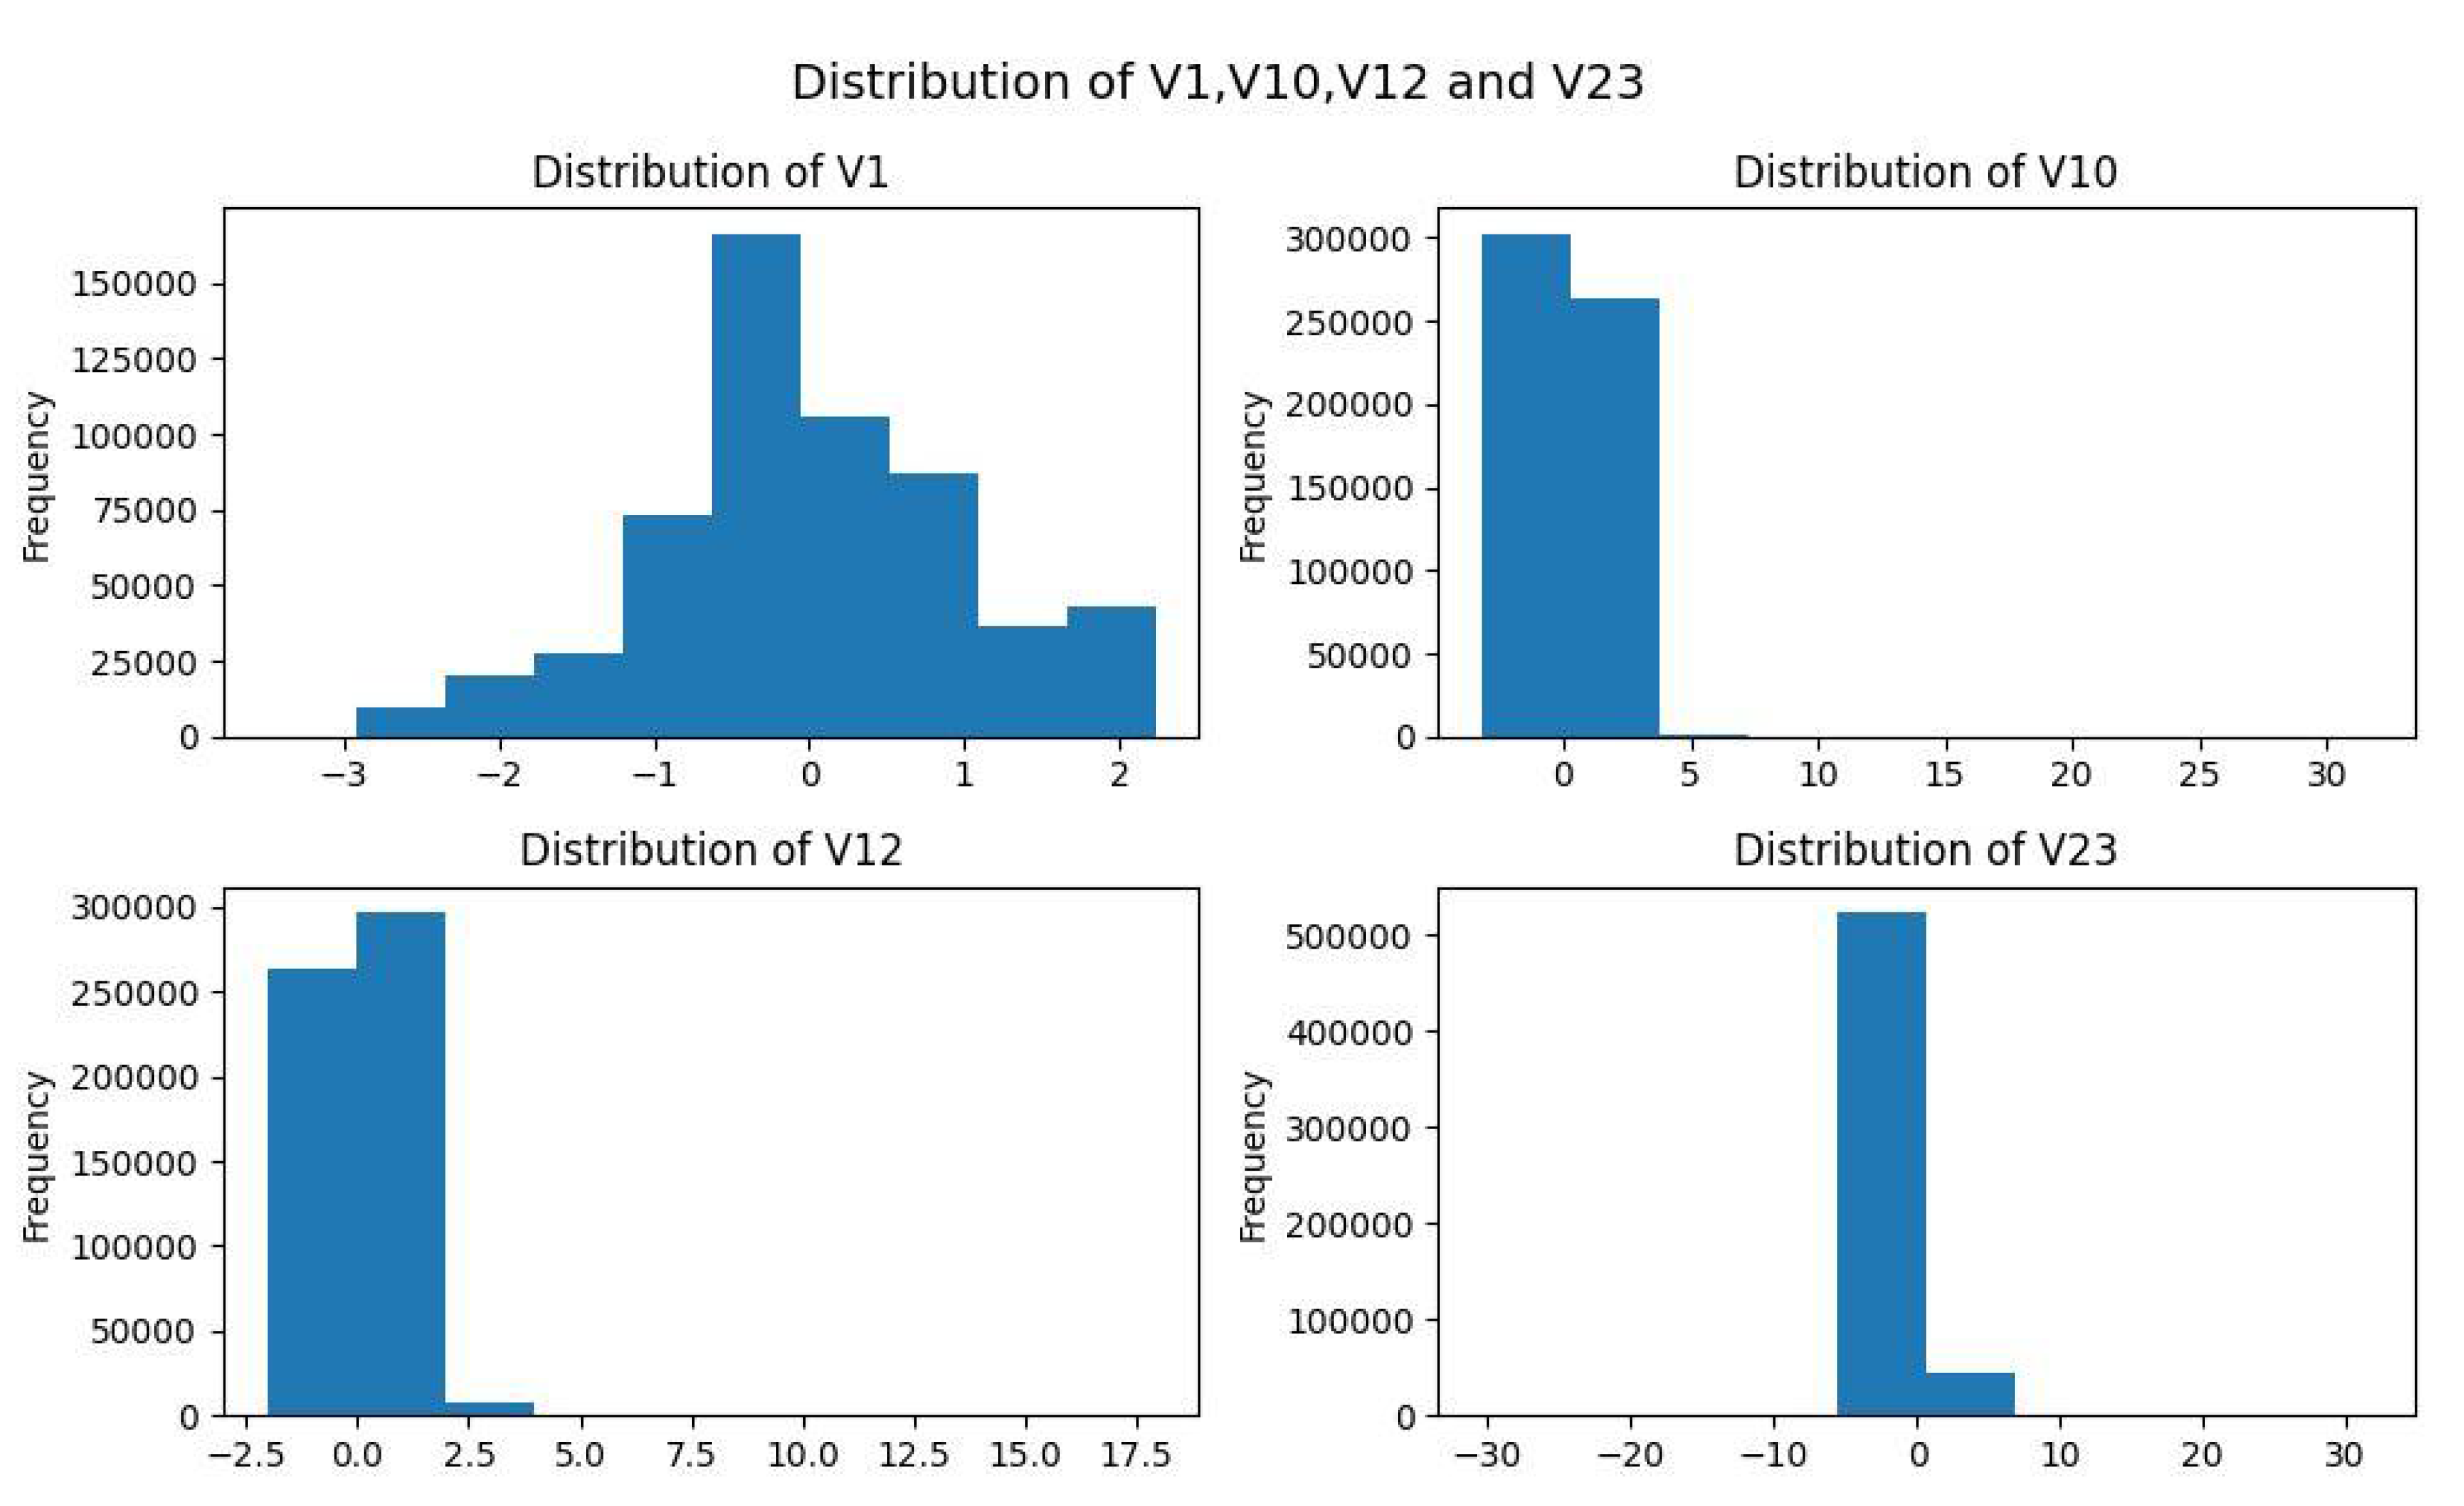
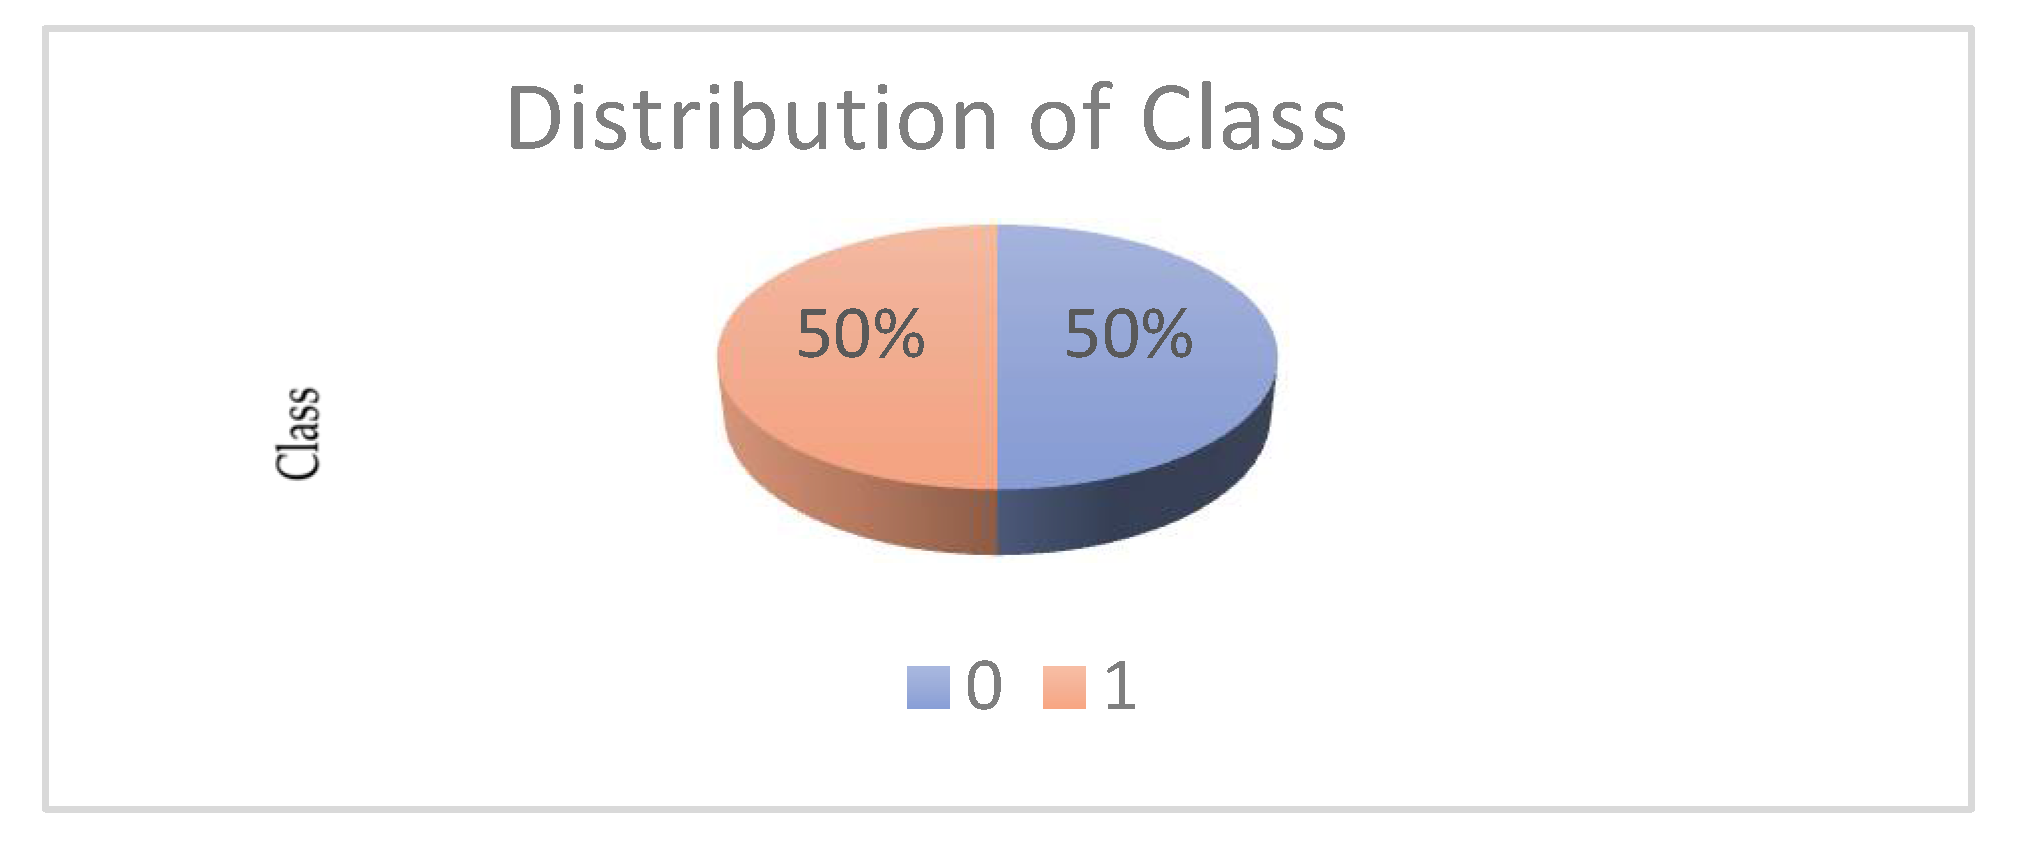

3. Results
| Training Accuracy | ||||
| Model Accuracy is: | 0,97 | |||
| [[208643 4593] | ||||
| [ 10330 202906]] | ||||
| precision | recall | f1-score | support | |
| 0 | 0,95 | 0,98 | 0,97 | 213236 |
| 1 | 0,98 | 0,95 | 0,96 | 213236 |
| accuracy | 0,97 | 426472 | ||
| macro avg | 0,97 | 0,97 | 0,97 | 426472 |
| weighted avg | 0,97 | 0,97 | 0,97 | 426472 |
| Training Accuracy | ||||
| Model Accuracy is: | 1,0 | |||
| [[71060 19] | ||||
| [ 0 71079]] | ||||
| precision | recall | f1-score | support | |
| 0 | 1,00 | 1,00 | 1,00 | 71079 |
| 1 | 1,00 | 1,00 | 1,00 | 71079 |
| accuracy | 1,00 | 142158 | ||
| macro avg | 1,00 | 1,00 | 1,00 | 142158 |
| weighted avg | 1,00 | 1,00 | 1,00 | 142158 |
| Training Accuracy | ||||
| Model Accuracy is: | 0,97 | |||
| [[209470 3766] | ||||
| [ 9686 203550]] | ||||
| precision | recall | f1-score | support | |
| 0 | 0,96 | 0,98 | 0,97 | 213236 |
| 1 | 0,98 | 0,95 | 0,97 | 213236 |
| accuracy | 0,97 | 426472 | ||
| macro avg | 0,97 | 0,97 | 0,97 | 426472 |
| weighted avg | 0,97 | 0,97 | 0,97 | 426472 |
| Training Accuracy | ||||
| Model Accuracy is: | 0,97 | |||
| [[69837 1242] | ||||
| [ 3280 67799]] | ||||
| precision | recall | f1-score | support | |
| 0 | 0,96 | 0,98 | 0,97 | 71079 |
| 1 | 0,98 | 0,95 | 0,97 | 71079 |
| accuracy | 0,97 | 142158 | ||
| macro avg | 0,97 | 0,97 | 0,97 | 142158 |
| weighted avg | 0,97 | 0,97 | 0,97 | 142158 |
| [CV] | END | ..learning_rate=0,01 | max_depth=4 | n_estimators=400 | total time= | 8,1s |
| [CV] | END | ..learning_rate=0,01 | max_depth=4 | n_estimators=400 | total time= | 7,9s |
| [CV] | END | ..learning_rate=0,01 | max_depth=4 | n_estimators=400 | total time= | 8,2s |
| [CV] | END | ..learning_rate=0,01 | max_depth=4 | n_estimators=400 | total time= | 7,9s |
| [CV] | END | ..learning_rate=0,01 | max_depth=5 | n_estimators=300 | total time= | 6,5s |
| [CV] | END | ..learning_rate=0,01 | max_depth=5 | n_estimators=300 | total time= | 6,9s |
| [CV] | END | ..learning_rate=0,01 | max_depth=5 | n_estimators=300 | total time= | 7,0s |
| [CV] | END | ..learning_rate=0,01 | max_depth=5 | n_estimators=300 | total time= | 6,6s |
| [CV] | END | ..learning_rate=0,01 | max_depth=5 | n_estimators=300 | total time= | 6,8s |
| [CV] | END | ...learning_rate=0,1 | max_depth=5 | n_estimators=300 | total time= | 6,8s |
| [CV] | END | ...learning_rate=0,1 | max_depth=5 | n_estimators=300 | total time= | 7,2s |
| [CV] | END | ...learning_rate=0,1 | max_depth=5 | n_estimators=300 | total time= | 6,7s |
| [CV] | END | ...learning_rate=0,1 | max_depth=5 | n_estimators=300 | total time= | 6,5s |
| [CV] | END | ...learning_rate=0,1 | max_depth=5 | n_estimators=300 | total time= | 6,5s |
| Training Accuracy | ||||
| Model Accuracy is: | 0,97 | |||
| [[209366 3870] | ||||
| [ 9538 203698]] | ||||
| precision | recall | f1-score | support | |
| 0 | 0,96 | 0,98 | 0,97 | 213236 |
| 1 | 0,98 | 0,96 | 0,97 | 213236 |
| accuracy | 0,97 | 426472 | ||
| macro avg | 0,97 | 0,97 | 0,97 | 426472 |
| weighted avg | 0,97 | 0,97 | 0,97 | 426472 |
3.2. Comparative Analysis
4. Discussion & Conclusions
- Future Work
- Limitations
Author Contributions
Funding
Data Availability Statement
Conflicts of Interest
References
- Boutaher, N.; Elomri, A.; Abghour, N.; Moussaid, K.; Rida, M. (2020, November). A review of credit card fraud detection using machine learning techniques. In 2020 5th International Conference on cloud computing and artificial intelligence: technologies and applications (CloudTech) (pp. 1-5). IEEE.
- Minastireanu, E.A.; Mesnita, G. An Analysis of the Most Used Machine Learning Algorithms for Online Fraud Detection. Informatica Economica 2019, 23. [Google Scholar] [CrossRef]
- Alnafessah, A.; Casale, G. Artificial neural networks based techniques for anomaly detection in Apache Spark. Cluster Computing 2020, 23, 1345–1360. [Google Scholar] [CrossRef]
- Priscilla, C.V.; Prabha, D.P. (2020). Credit card fraud detection: A systematic review. In Intelligent Computing Paradigm and Cutting-edge Technologies: Proceedings of the First International Conference on Innovative Computing and Cutting-edge Technologies (ICICCT 2019), Istanbul, Turkey, October 30-31, 2019 1 (pp. 290-303). Springer International Publishing.
- Shirodkar, N.; Mandrekar, P.; Mandrekar, R.S.; Sakhalkar, R.; Kumar, K.C.; Aswale, S. (2020, February). Credit card fraud detection techniques–A survey. In 2020 International Conference on Emerging Trends in Information Technology and Engineering (ic-ETITE) (pp. 1-7). IEEE.
- Kasa, N.; Dahbura, A.; Ravoori, C.; Adams, S. (2019, April). Improving credit card fraud detection by profiling and clustering accounts. In 2019 Systems and Information Engineering Design Symposium (SIEDS) (pp. 1-6). IEEE.
- Sadgali, I.; Sael, N.; Benabbou, F. Detection of credit card fraud: State of art. Int. J. Comput. Sci. Netw. Secur 2018, 18, 76–83. [Google Scholar]
- Fiore, U.; De Santis, A.; Perla, F.; Zanetti, P.; Palmieri, F. Using generative adversarial networks for improving classification effectiveness in credit card fraud detection. Information Sciences 2019, 479, 448–455. [Google Scholar] [CrossRef]
- Abdulghani, A.Q.; Uçan, O.N.; Alheeti, K.M.A. (2021, December). Credit card fraud detection using XGBoost algorithm. In 2021 14th International Conference on Developments in eSystems Engineering (DeSE) (pp. 487-492). IEEE.
- Karthika, J.; Senthilselvi, A. Smart credit card fraud detection system based on dilated convolutional neural network with sampling technique. Multimedia Tools and Applications 2023, 1–18. [Google Scholar] [CrossRef]
- Darwish, S.M. A bio-inspired credit card fraud detection model based on user behavior analysis suitable for business management in electronic banking. Journal of Ambient Intelligence and Humanized Computing 2020, 11, 4873–4887. [Google Scholar] [CrossRef]
- Tyagi, N.; Rana, A.; Awasthi, S.; Tyagi, L.K. (2022). Data Science: Concern for Credit Card Scam with Artificial Intelligence. In Cyber Security in Intelligent Computing and Communications (pp. 115-128). Singapore: Springer Singapore.
- Velasco, R.B.; Carpanese, I.; Interian, R.; Paulo Neto, O.C.; Ribeiro, C.C. A decision support system for fraud detection in public procurement. International Transactions in Operational Research 2021, 28, 27–47. [Google Scholar] [CrossRef]
- Kannagi, A.; Mohammed, J.G.; Murugan, S.S.G.; Varsha, M. Intelligent mechanical systems and its applications on online fraud detection analysis using pattern recognition K-nearest neighbor algorithm for cloud security applications. Materials Today: Proceedings 2023, 81, 745–749. [Google Scholar] [CrossRef]
- Patil, S.; Nemade, V.; Soni, P.K. Predictive modelling for credit card fraud detection using data analytics. Procedia computer science 2018, 132, 385–395. [Google Scholar] [CrossRef]
- Karthik VS, S.; Mishra, A.; Reddy, U.S. Credit card fraud detection by modelling behaviour pattern using hybrid ensemble model. Arabian Journal for Science and Engineering 2022, 1–11. [Google Scholar] [CrossRef]
- Vanini, P.; Rossi, S.; Zvizdic, E.; Domenig, T. Online payment fraud: from anomaly detection to risk management. Financial Innovation 2023, 9, 1–25. [Google Scholar] [CrossRef]
- Nascimento, D.C.; Barbosa, B.; Perez, A.M.; Caires, D.O.; Hirama, E.; Ramos, P.L.; Louzada, F. (). Risk management in e-commerce—a fraud study case using acoustic analysis through its complexity. Entropy 2019, 21, 1087. [Google Scholar]
- Alazizi, A.; Habrard, A.; Jacquenet, F.; He-Guelton, L.; Oblé, F.; Siblini, W. (2019, November). Anomaly detection, consider your dataset first an illustration on fraud detection. In 2019 IEEE 31st international conference on tools with artificial intelligence (ICTAI) (pp. 1351-1355). IEEE.
- Sood, P.; Sharma, C.; Nijjer, S.; Sakhuja, S. Review the role of artificial intelligence in detecting and preventing financial fraud using natural language processing. International Journal of System Assurance Engineering and Management 2023, 14, 2120–2135. [Google Scholar] [CrossRef]
- Xu, X.; Xiong, F.; An, Z. Using machine learning to predict corporate fraud: evidence based on the gone framework. Journal of Business Ethics 2023, 186, 137–158. [Google Scholar] [CrossRef]
- Esenogho, E.; Mienye, I.D.; Swart, T.G.; Aruleba, K.; Obaido, G. A neural network ensemble with feature engineering for improved credit card fraud detection. IEEE Access 2022, 10, 16400–16407. [Google Scholar] [CrossRef]
- Ludera, D.T. (2021). Credit card fraud detection by combining synthetic minority oversampling and edited nearest neighbours. In Advances in Information and Communication: Proceedings of the 2021 Future of Information and Communication Conference (FICC), Volume 2 (pp. 735-743). Springer International Publishing.
- Abd El-Naby, A.; Hemdan EE, D.; El-Sayed, A. An efficient fraud detection framework with credit card imbalanced data in financial services. Multimedia Tools and Applications 2023, 82, 4139–4160. [Google Scholar] [CrossRef]
- Alfaiz, N.S.; Fati, S.M. Enhanced credit card fraud detection model using machine learning. Electronics 2022, 11, 662. [Google Scholar] [CrossRef]
- Singh, A.; Jain, A. An efficient credit card fraud detection approach using cost-sensitive weak learner with imbalanced dataset. Computational Intelligence 2022, 38, 2035–2055. [Google Scholar] [CrossRef]
- Krishna Rao, N. V. , Y., Shalini, N., Harika, A., Divyavani, V., & Mangathayaru, N. (2021). Credit card fraud detection using spark and machine learning techniques. In Machine Learning Technologies and Applications: Proceedings of ICACECS 2020; Springe: Singapore; pp. 163–172.
- Madhavi, A.; Sivaramireddy, T. (2021). Real-Time Credit Card Fraud Detection Using Spark Framework. In Machine Learning Technologies and Applications: Proceedings of ICACECS 2020 (pp. 287-298). Springer Singapore.
- Zhou, H.; Sun, G.; Fu, S.; Wang, L.; Hu, J.; Gao, Y. Internet financial fraud detection based on a distributed big data approach with node2vec. IEEE Access 2021, 9, 43378–43386. [Google Scholar] [CrossRef]
- Chouiekh, A.; Ibn El Haj, E.H. (2022). Towards Spark-Based Deep Learning Approach for Fraud Detection Analysis. In Proceedings of Sixth International Congress on Information and Communication Technology: ICICT 2021, London, Volume 3 (pp. 15-22). Springer Singapore.
- El Hajjami, S.; Malki, J.; Berrada, M.; Mostafa, H.; Bouju, A. (2021, January). Machine learning system for fraud detection. a methodological approach for a development platform. In International Conference on Digital Technologies and Applications (pp. 99-110). Cham: Springer International Publishing.
- Vlachou, E.; Karras, A.; Karras, C.; Theodorakopoulos, L.; Halkiopoulos, C.; Sioutas, S. Distributed Bayesian Inference for Large-Scale IoT Systems. Big Data and Cognitive Computing 2023, 8, 1. [Google Scholar] [CrossRef]
- Karras, A.; Giannaros, A.; Karras, C.; Theodorakopoulos, L.; Mammassis, C.S.; Krimpas, G.A.; Sioutas, S. TinyML Algorithms for Big Data Management in Large-Scale IoT Systems. Future Internet 2024, 16, 42. [Google Scholar] [CrossRef]
- Khalid, A.R.; Owoh, N.; Uthmani, O.; Ashawa, M.; Osamor, J.; Adejoh, J. Enhancing credit card fraud detection: an ensemble machine learning approach. Big Data and Cognitive Computing 2024, 8, 6. [Google Scholar] [CrossRef]
- Li, Z.; Wang, B.; Huang, J.; Jin, Y.; Xu, Z.; Zhang, J.; Gao, J. A graph-powered large-scale fraud detection system. International Journal of Machine Learning and Cybernetics 2024, 15, 115–128. [Google Scholar] [CrossRef]
- Singh, K.; Kolar, P.; Abraham, R.; Seetharam, V.; Nanduri, S.; Kumar, D. (2024). Automated Secure Computing for Fraud Detection in Financial Transactions. Automated Secure Computing for Next-Generation Systems, 177-189.
- Chen, C.T.; Lee, C.; Huang, S.H.; Peng, W.C. (2024). Credit Card Fraud Detection via Intelligent Sampling and Self-supervised Learning. ACM Transactions on Intelligent Systems and Technology.
- Aburbeian, A.M.; Fernández-Veiga, M. Secure Internet Financial Transactions: A Framework Integrating Multi-Factor Authentication and Machine Learning. AI 2024, 5, 177–194. [Google Scholar] [CrossRef]
- Zhao, Y.; Zheng, G.; Mukherjee, S.; McCann, R.; Awadallah, A. (2023, June). Admoe: Anomaly detection with mixture-of-experts from noisy labels. In Proceedings of the AAAI Conference on Artificial Intelligence (Vol. 37, No. 4, pp. 4937–4945).
- Koutras, K.; Bompotas, A.; Halkiopoulos, C.; Kalogeras, A.; Alexakos, C. Dimensionality Reduction on IoT Monitoring Data of Smart Building for Energy Consumption Forecasting. 2023 IEEE International Smart Cities Conference (ISC2). 2023. [CrossRef]
- Antonopoulou, S.; Stamatiou, Y.C.; Vamvakari, M. An asymptotic expansion for theq-binomial series using singularity analysis for generating functions. Journal of Discrete Mathematical Sciences and Cryptography 2007, 10, 313–328. [Google Scholar] [CrossRef]
- Zehra, S.; Faseeha, U.; Syed, H.J.; Samad, F.; Ibrahim, A.O.; Abulfaraj, A.W.; Nagmeldin, W. Machine Learning-Based Anomaly Detection in NFV: A Comprehensive Survey. Sensors 2023, 23, 5340. [Google Scholar] [CrossRef] [PubMed]
- Antonopoulou, H.; Theodorakopoulos, L.; Halkiopoulos, C.; Mamalougkou, V. Utilizing Machine Learning to Reassess the Predictability of Bank Stocks. Emerging Science Journal 2023, 7, 724–732. [Google Scholar] [CrossRef]
- Stamatiou, Y.; Halkiopoulos, C.; Antonopoulou, H. (2023). A Generic, Flexible Smart City Platform focused on Citizen Security and Privacy. Proceedings of the 27th Pan-Hellenic Conference on Progress in Computing and Informatics. [CrossRef]
- Gousteris, S.; Stamatiou, Y.C.; Halkiopoulos, C.; Antonopoulou, H.; Kostopoulos, N. Secure Distributed Cloud Storage based on the Blockchain Technology and Smart Contracts. Emerging Science Journal 2023, 7, 469–479. [Google Scholar] [CrossRef]
- Karras, A.; Giannaros, A.; Theodorakopoulos, L.; Krimpas, G.A.; Kalogeratos, G.; Karras, C.; Sioutas, S. FLIBD: A Federated Learning-Based IoT Big Data Management Approach for Privacy-Preserving over Apache Spark with FATE. Electronics 2023, 12, 4633. [Google Scholar] [CrossRef]
- Karras, A.; Karras, C.; Bompotas, A.; Bouras, P.; Theodorakopoulos, L.; Sioutas, S. SparkReact: A Novel and User-friendly Graphical Interface for the Apache Spark MLlib Library. Proceedings of the 26th Pan-Hellenic Conference on Informatics. 2022. [CrossRef]
- Gkintoni, E.; Kakoleres, G.; Telonis, G.; Halkiopoulos, C.; Boutsinas, B. A Conceptual Framework for Applying Social Signal Processing to Neuro-Tourism. Springer Proceedings in Business and Economics 2023, 323–335. [Google Scholar] [CrossRef]
- Antonopoulou, H. Kolmogorov complexity based upper bounds for the unsatisfiability threshold of random k-SAT. Journal of Discrete Mathematical Sciences and Cryptography 2020, 23, 1431–1438. [Google Scholar] [CrossRef]
| id | V1 | V2 | V3 | V4 | V5 | V6 | V7 | V8 | V9 | V10 | V11 | V12 | V13 | V14 |
|---|---|---|---|---|---|---|---|---|---|---|---|---|---|---|
| 0 | -0,260648 | -0,469648 | 2,496266 | -0,083724 | 0,129681 | 0,732898 | 0,519014 | -0,130006 | 0,727159 | 0,637735 | -0,987020 | 0,293438 | -0,941386 | 0,549020 |
| 1 | 0,985100 | -0,356045 | 0,558056 | -0,429654 | 0,277140 | 0,428605 | 0,406466 | -0,133118 | 0,347452 | 0,529808 | 0,140107 | 1,564246 | 0,574074 | 0,627719 |
| 2 | -0,260272 | -0,949385 | 1,728538 | -0,457986 | 0,074062 | 1,419481 | 0,743511 | -0,095576 | -0,261297 | 0,690708 | -0,272985 | 0,659021 | 0,805173 | 0,616874 |
| 3 | -0,152152 | -0,508959 | 1,746840 | -1,090178 | 0,249486 | 1,143312 | 0,518269 | -0,065130 | -0,205698 | 0,575231 | -0,752581 | 0,737483 | 0,592994 | 0,559535 |
| 4 | -0,206820 | -0,165280 | 1,527053 | -0,448293 | 0,106125 | 0,530549 | 0,658849 | -0,212660 | 1,049921 | 0,968045 | -1,203171 | 1,029577 | 1,439310 | 0,241454 |
| V15 | V16 | V17 | V18 | V19 | V20 | V21 | V22 | V23 | V24 | V25 | V26 | V27 | V28 | Amount |
|---|---|---|---|---|---|---|---|---|---|---|---|---|---|---|
| 1,804879 | 0,215598 | 0,512307 | 0,333644 | 0,124270 | 0,091202 | -0,110552 | 0,217606 | -0,134794 | 0,165999 | 0,126280 | -0,434824 | -0,081230 | -0,151045 | 17982,10 |
| 0,706121 | 0,789188 | 0,403810 | 0,201799 | -0,340687 | -0,233984 | -0,231984 | -0,194936 | -0,605761 | 0,073469 | -0,577395 | 0,296503 | -0,248052 | -0,064512 | 6531,37 |
| 3,060253 | -0,577514 | 0,885536 | 0,239442 | -2,366079 | 0,361652 | -0,005020 | 0,702906 | 0,945045 | -1,154666 | -0,605564 | -0,312895 | -0,300258 | -0,244718 | 2513,54 |
| -0,697664 | -0,030669 | 0,242629 | 2,178616 | -1,345060 | -0,378223 | -0,378223 | -0,146927 | -0,038212 | -1,893131 | 1,003963 | -0,511950 | -0,165316 | 0,048324 | 5384,44 |
| 0,153008 | 0,224358 | 0,366466 | 0,291782 | 0,445317 | 0,247237 | -0,106984 | 0,729727 | -0,161666 | 0,312561 | -0,141416 | 1,071126 | 0,023712 | 0,419117 | 14278,97 |
| <class ‘pandas.core.frame.DataFrame’> | ||||
| RangeIndex: 568630 entries, 0 to 568629 | ||||
| Data columns (total 31 columns): | ||||
| # | Column | Non-Null | Count | Dtype |
| 0 | id | 568630 | non-null | int64 |
| 1 | V1 | 568630 | non-null | float64 |
| 2 | V2 | 568630 | non-null | float64 |
| 3 | V3 | 568630 | non-null | float64 |
| 4 | V4 | 568630 | non-null | float64 |
| 5 | V5 | 568630 | non-null | float64 |
| 6 | V6 | 568630 | non-null | float64 |
| 7 | V7 | 568630 | non-null | float64 |
| 8 | V8 | 568630 | non-null | float64 |
| id | V1 | V2 | V3 | V4 | V5 | V6 | V7 | V8 | V9 | |
|---|---|---|---|---|---|---|---|---|---|---|
| count | 568630,000000 | 5,686300E+05 | 5,686300E+05 | 5,686300E+05 | 5,686300E+05 | 5,686300E+05 | 5,686300E+05 | 5,686300E+05 | 5,686300E+05 | 5,686300E+05 |
| mean | 284314,500000 | -5,638058E-17 | -1,319545E-16 | -3,518788E-17 | -2,879008E-17 | 7,997245E-18 | -3,958636E-17 | -3,198898E-17 | 2,109273E-17 | 3,998623E-17 |
| std | 164149,486122 | 1,000001E+00 | 1,000001E+00 | 1,000001E+00 | 1,000001E+00 | 1,000001E+00 | 1,000001E+00 | 1,000001E+00 | 1,000001E+00 | 1,000001E+00 |
| min | 0,000000 | -3,495584E+00 | -4,099666E+01 | -3,183760E+00 | -4,951222E+00 | -9,952786E+00 | -2,111111E+01 | -4,351839E+00 | -1,075634E+01 | -3,751919E+00 |
| 25% | 142157,500000 | -5,652859E-01 | -4,866777E-01 | -6,492987E-01 | -6,560203E-01 | -2,934955E-01 | -4,458712E-01 | -2,835329E-01 | -1,922572E-01 | -5,687446E-01 |
| 50% | 284314,500000 | -9,363846E-02 | -1,358939E-01 | 3,528579E-04 | -7,376152E-02 | 8,108788E-02 | 7,871758E-02 | 2,333659E-01 | -1,145242E-01 | 9,252647E-02 |
| 75% | 426471,750000 | 8,326582E-01 | 3,435552E-01 | 6,285380E-01 | 7,070074E-01 | 4,397368E-01 | 4,977881E-01 | 5,259548E-01 | 4,729905E-02 | 5,592621E-01 |
| max | 568629,000000 | 2,229046E+00 | 4,361865E+00 | 1,412583E+01 | 3,201536E+00 | 4,271689E+00 | 2,616840E+01 | 2,178730E+02 | 5,958040E+00 | 2,027006E+01 |
 |
| V1 | V2 | V3 | V4 | V5 | V6 | V7 | V8 | V9 | V10 | V11 | V12 | V13 | V14 | V15 | |
|---|---|---|---|---|---|---|---|---|---|---|---|---|---|---|---|
| 0 | -0,260648 | -0,469648 | 2,496266 | -0,083724 | 0,129681 | 0,732898 | 0,519014 | -0,130006 | 0,727159 | 0,637735 | -0,987020 | 0,293438 | -0,941386 | 0,549020 | 1,804879 |
| 1 | 0,985100 | -0,356045 | 0,558056 | -0,429654 | 0,277140 | 0,428605 | 0,406466 | -0,133118 | 0,347452 | 0,529808 | 0,140107 | 1,564246 | 0,574074 | 0,627719 | 0,706121 |
| 2 | -0,260272 | -0,949385 | 1,728538 | -0,457986 | 0,074062 | 1,419481 | 0,743511 | -0,095576 | -0,261297 | 0,690708 | -0,272985 | 0,659021 | 0,805173 | 0,616874 | 3,060253 |
| 3 | -0,152152 | -0,508959 | 1,746840 | -1,090178 | 0,249486 | 1,143312 | 0,518269 | -0,065130 | -0,205698 | 0,575231 | -0,752581 | 0,737483 | 0,592994 | 0,559535 | -0,697664 |
| 4 | -0,206820 | -0,165280 | 1,527053 | -0,448293 | 0,106125 | 0,530549 | 0,658849 | -0,212660 | 1,049921 | 0,968045 | -1,203171 | 1,029577 | 1,439310 | 0,241454 | 0,153008 |
| Training Accuracy | ||||
| Model Accuracy is: | 0,96 | |||
| [[69545 1534] | ||||
| [ 3520 67559]] | ||||
| precision | recall | f1-score | support | |
| 0 | 0,95 | 0,98 | 0,96 | 71079 |
| 1 | 0,98 | 0,95 | 0,96 | 71079 |
| accuracy | 0,96 | 142158 | ||
| macro avg | 0,96 | 0,96 | 0,96 | 142158 |
| weighted avg | 0,96 | 0,96 | 0,96 | 142158 |
| Training Accuracy | ||||
| Model Accuracy is: | 1,0 | |||
| [[213236 0] | ||||
| [ 0 213236]] | ||||
| precision | recall | f1-score | support | |
| 0 | 1,0 | 1,0 | 1,0 | 213236 |
| 1 | 1,0 | 1,0 | 1,0 | 213236 |
| accuracy | 1,0 | 426472 | ||
| macro avg | 1,0 | 1,0 | 1,0 | 426472 |
| weighted avg | 1,0 | 1,0 | 1,0 | 426472 |
| Training Accuracy | ||||
|---|---|---|---|---|
| Model Accuracy is: | 1,0 | |||
| [[70864 215] | ||||
| [ 92 70987]] | ||||
| precision | recall | f1-score | support | |
| 0 | 1,00 | 1,00 | 1,00 | 71079 |
| 1 | 1,00 | 1,00 | 1,00 | 71079 |
| accuracy | 1,00 | 142158 | ||
| macro avg | 1,00 | 1,00 | 1,00 | 142158 |
| weighted avg | 1,00 | 1,00 | 1,00 | 142158 |
| Training Accuracy | ||||
| Model Accuracy is: | 1,0 | |||
| [[213236 0] | ||||
| [ 0 213236]] | ||||
| precision | recall | f1-score | support | |
| 0 | 1,00 | 1,00 | 1,00 | 213236 |
| 1 | 1,00 | 1,00 | 1,00 | 213236 |
| accuracy | 1,00 | 426472 | ||
| macro avg | 1,00 | 1,00 | 1,00 | 426472 |
| weighted avg | 1,00 | 1,00 | 1,00 | 426472 |
| Training Accuracy | ||||
| Model Accuracy is: | 0,97 | |||
| [[69810 1269] | ||||
| [ 3214 67865]] | ||||
| precision | recall | f1-score | support | |
| 0 | 0,96 | 0,98 | 0,97 | 71079 |
| 1 | 0,98 | 0,95 | 0,97 | 71079 |
| accuracy | 0,97 | 142158 | ||
| macro avg | 0,97 | 0,97 | 0,97 | 142158 |
| weighted avg | 0,97 | 0,97 | 0,97 | 142158 |
| Training Sample for 4 algorithms | ||||
| Log. Regression | Decision Trees | RF | XGBoost | |
| Accuracy | 0,97 | 1,00 | 1,00 | 0,97 |
| Testing Sample for 4 algorithms | ||||
| Accuracy | 0,96 | 1,00 | 1,00 | 0,97 |
| Log. Regression | Decision Trees | RF | XGBoost | |
|---|---|---|---|---|
| Precision | 0,97 | 1,00 | 1,00 | 0,97 |
| Recall | 0,97 | 1,00 | 1,00 | 0,97 |
| F1-Score | 0,97 | 1,00 | 1,00 | 0,97 |
| Log. Regression | Decision Trees | RF | XGBoost | |
|---|---|---|---|---|
| Precision | 0,96 | 1,00 | 1,00 | 0,97 |
| Recall | 0,96 | 1,00 | 1,00 | 0,97 |
| F1-Score | 0,96 | 1,00 | 1,00 | 0,97 |
Disclaimer/Publisher’s Note: The statements, opinions and data contained in all publications are solely those of the individual author(s) and contributor(s) and not of MDPI and/or the editor(s). MDPI and/or the editor(s) disclaim responsibility for any injury to people or property resulting from any ideas, methods, instructions or products referred to in the content. |
© 2024 by the authors. Licensee MDPI, Basel, Switzerland. This article is an open access article distributed under the terms and conditions of the Creative Commons Attribution (CC BY) license (http://creativecommons.org/licenses/by/4.0/).


