1. Introduction
Over-the-counter (OTC) products are medications proven to be safe and effective for purchase without a prescription from a physician, treating conditions such as pain, coughs, colds, diarrhea, heartburn, and allergies. They are readily available in pharmacies, grocery stores, gas stations, and online platforms. A survey indicates that 93% of U.S. adults prefer using OTC medicines for minor health issues before seeking professional care, with 92% of physicians endorsing their effectiveness and safety [
1].
With the rapid development of the Internet, there has been a significant opportunity for collaboration between the medicine retail industry and online platforms. The growing demand for home healthcare and wellness has fueled the expansion of online medicine purchases. Consumers increasingly rely on platforms like Amazon Pharmacy, Health Warehouse, and Optum, projected to account for about 35.26% of total revenue in the OTC pharmaceuticals market by 2024 [
2].
Before deciding to buy OTC medicines, consumers go through several stages. These include recognizing a problem or symptom of a disease (problem recognition), finding appropriate information on drug indications (information search), evaluating alternatives (evaluation of alternatives), and finally deciding on the right medication (purchase decision). After purchasing, consumers evaluate whether the medication met their expectations and how satisfied they feel (post-purchase evaluation) [
3,
4]. Since decisions are largely based on personal experience, they are subject to biases such as age, seriousness of the symptoms, and medication allergies, making the purchasing process complex. Therefore, consumers need to pay more attention to information search and evaluation of alternatives when making medicine purchasing decisions.
Amazon presents a comprehensive selection of medications for conditions like colds, allergies, digestion issues, and pain relief. Each product listing on Amazon provides transparent pricing and user ratings, serving as indicators of perceived value that consider medications' efficacy, quality, and user satisfaction. This information brings convenience and transparency to the online shopping experience. However, consumers are confronted with the daunting task of selecting from a vast array of medicines and their factors to address common conditions. Numerous factors related to OTC medicine impact customer decision-making, such as price, user reviews, efficacy, brand, size, ingredients, and side effects [
5,
6,
7,
8,
9,
10,
11].
Price and perceived value are widely recognized as crucial factors influencing consumer decisions [
12,
13,
14,
15]. When prices are similar, consumers tend to favor medications perceived to offer higher value. Historically, value was prioritized over price by consumers, who believed higher prices correlated with higher value (“you get what you pay for”). However, recent research suggests a shift in consumer behavior towards seeking cost-effective options. Gao et al. discovered that while price and perceived value are positively associated, higher prices do not always equate to proportionally higher perceived value [
16]. Some consumers prioritize value over price, exhibiting lower price sensitivity. For instance, those seeking top-value products are less concerned with price and more willing to pay for perceived quality, while price-sensitive individuals may choose a lower-priced option even if it offers less perceived value than a higher-priced alternative.
Perceived value is defined as the psychological balance consumers strike between expected gains and sacrifices in transactions [
17,
18,
19]. The correlation between value and price is a pivotal area of interest across industries, addressed prominently by Nelson's “Quality-Price Tradeoff” theory [
20]. According to this theory, consumers weigh perceived value against price when making purchasing decisions, expecting higher value as prices increase. Creyer and Ross used a value index to show that consumers often opt for lower-priced, higher-value options over higher-priced, higher-quality ones [
21]. Similarly, Zeithaml emphasized that product value—what consumers receive relative to what they pay—is critical in consumer decision-making [
22]. Yoon et al. noted that shoppers use a value index (value = quality/price) to guide their purchasing decisions [
23].
As medication costs rise significantly—some top-selling drugs have seen over 50% increases in costs since 2012 [
24], with projections of further annual increases [
25]—consumers face heightened pressure to balance value and price when selecting treatments. This trend underscores the importance of choosing cost-effective products that offer competitive prices and high perceived value. To assist consumers in making informed and cost-effective medication purchases, this paper focuses on employing machine learning techniques to identify key factors influencing medication cost-effectiveness. Specifically, we introduce a novel Cost-Effectiveness Rating (CER) indicator derived from a medicine's user rating relative to its price. This CER provides valuable guidance for consumers navigating product choices based on price considerations.
Machine learning and deep learning are essential components of artificial intelligence, widely applied in healthcare, digital retailing, and social media [
26,
27,
28,
29]. In this study, our goal is to simplify customer decision-making when purchasing cost-effective medicines. To achieve this, we utilized machine learning models that incorporate various variables such as medication ingredients, brand, manufacturer, and safety warnings extracted from Amazon web crawls. These models predict the Cost-Effectiveness Rating (CER) of medicines.
We employed a range of machine learning algorithms including Decision Tree (DT), Random Forest (RF), XGBoost, Logistic Regression, and Multilayer Perceptron (MLP) for classification. Decision Trees use nodes and branches to classify data based on attribute values [
30], while Random Forests combine multiple decision trees to enhance accuracy [
31]. XGBoost improves on traditional gradient boosting with optimizations like parallel tree construction and pruning [
32]. Linear Discriminant Analysis (LDA) reduces dimensionality and enhances class separability [
33], and the K-nearest neighbor (KNN) method identifies nearby data points based on distance metrics [
34]. MLP, a neural network with interconnected layers, learns complex data patterns for effective decision-making [
35]. Finally, employing techniques such as SHAP values [
36] and logistic regression, we explored the impact of each variable and identified key factors influencing medication cost-effectiveness.
By leveraging the insights gleaned from our analysis, our objective is to empower consumers to make informed and cost-effective purchasing decisions. Through the identification of key factors, we aim to guide consumers towards maximizing perceived value while minimizing costs. This research not only benefits consumers but also provides valuable insights for manufacturers and retailers, enabling them to enhance product competitiveness by focusing on features that drive cost-effectiveness. Ultimately, our work endeavors to enhance consumer welfare and optimize market dynamics in the pharmaceutical industry by facilitating prudent decision-making in the realm of medication purchases.
3. Results
3.1. Machine Learning Classifiers for CER Across Medicine Types
Table 3,
Table 4,
Table 5 and
Table 6 present an evaluation of eight machine learning classifiers across the four medicine types (cold/allergy/digestion/pain relief), utilizing a 5-fold cross-validation methodology to predict binary Cost-Effectiveness Ratings (CERs). Results are reported as average values with standard deviations. While accuracy and F1 metrics are essential indicators of predictive performance, we primarily emphasize the ROC-AUC metric due to its threshold independence and ability to assess the model's ranking capabilities, crucial for correctly identifying true positives, especially in the context of high-cost-effective medications.
Upon through examination of the results for each medicine type, the choice of the most suitable model varies depending on the specific medication under consideration. For cold medicine, the Random Forest (RF) model emerges as the most effective choice, achieving the highest ROC-AUC of 0.7428 ± 0.0863 among all models, indicating its superior ability to discern between high and low CERs. For allergy medicine, despite the simplicity of the Logistic Regression (LR) model, it demonstrates robust performance with a ROC-AUC of 0.7548 ± 0.045, outperforming alternative models such as Linear Discriminant Analysis (LDA). Furthermore, LR exhibits higher average accuracy (0.6793 vs. 0.6480) and average F1 score (0.6849 vs. 0.6394) compared to LDA, justifying its preference. In the case of digestion medicine, Random Forest (RF) once again showcases its effectiveness with a commendable ROC-AUC of 0.7081 ± 0.071, surpassing Logistic Regression and XGBoost in predictive capability, as supported by higher accuracy and F1 scores. Lastly, for pain relief medicine, Random Forest (RF) stands out with the highest ROC-AUC of 0.8022 ± 0.050, underscoring its robust performance and versatility in handling diverse features.
In summary, while Random Forest (RF) consistently demonstrates commendable performance across different medicine types, the optimal model choice varies based on the unique characteristics and complexities of each medication's dataset. Consequently, for cold medicine, allergy medicine, digestion medicine, and pain relief medicine, the preferred models are Random Forest (RF), Logistic Regression (LR), Random Forest (RF), and Random Forest (RF), respectively. Subsequent sections will delve into the analysis of important features or input factors using the identified best model for each medicine type, assessing their impact on cost-effectiveness ratings.
3.2. Key Feature Categories Influencing CER Across Medicine Types
Figure 10,
Figure 11,
Figure 12, and
Figure 13 provide insights into the primary factors influencing Cost-Effectiveness Ratings (CER) across cold, allergy, digestion, and pain relief medicines. These insights are derived from SHAP values calculated using the best model identified for each medicine type. By examining the top five factors' feature categories in each plot, we discerned the most impactful feature categories for each medicine type from the eight feature categories included in this research (FSA or HSA eligibility, Size metrics, Brand, Manufacturer, Active Ingredients, Special Effects, Symptom Treats, and Safety Warnings).
In
Figure 10, we discerned the key feature categories influencing the CERs of cold medicine using the Random Forest model:
FSA or HSA Eligibility: Signifying the potential for consumers to utilize pre-tax funds for medication purchases, which may be viewed as more cost-effective.
Symptom Treats: The number of symptoms treated emerges as a significant contributor to CER, underscoring the importance of efficacy considerations.
Safety Warnings: The presence of safety warnings also significantly contributes to cost-effectiveness ratings, emphasizing the importance of safety considerations.
Size Metrics: Both lower and higher quantiles of inches play a significant role in influencing CER, suggesting that the physical dimensions of the medication packaging impact its cost-effectiveness.
In
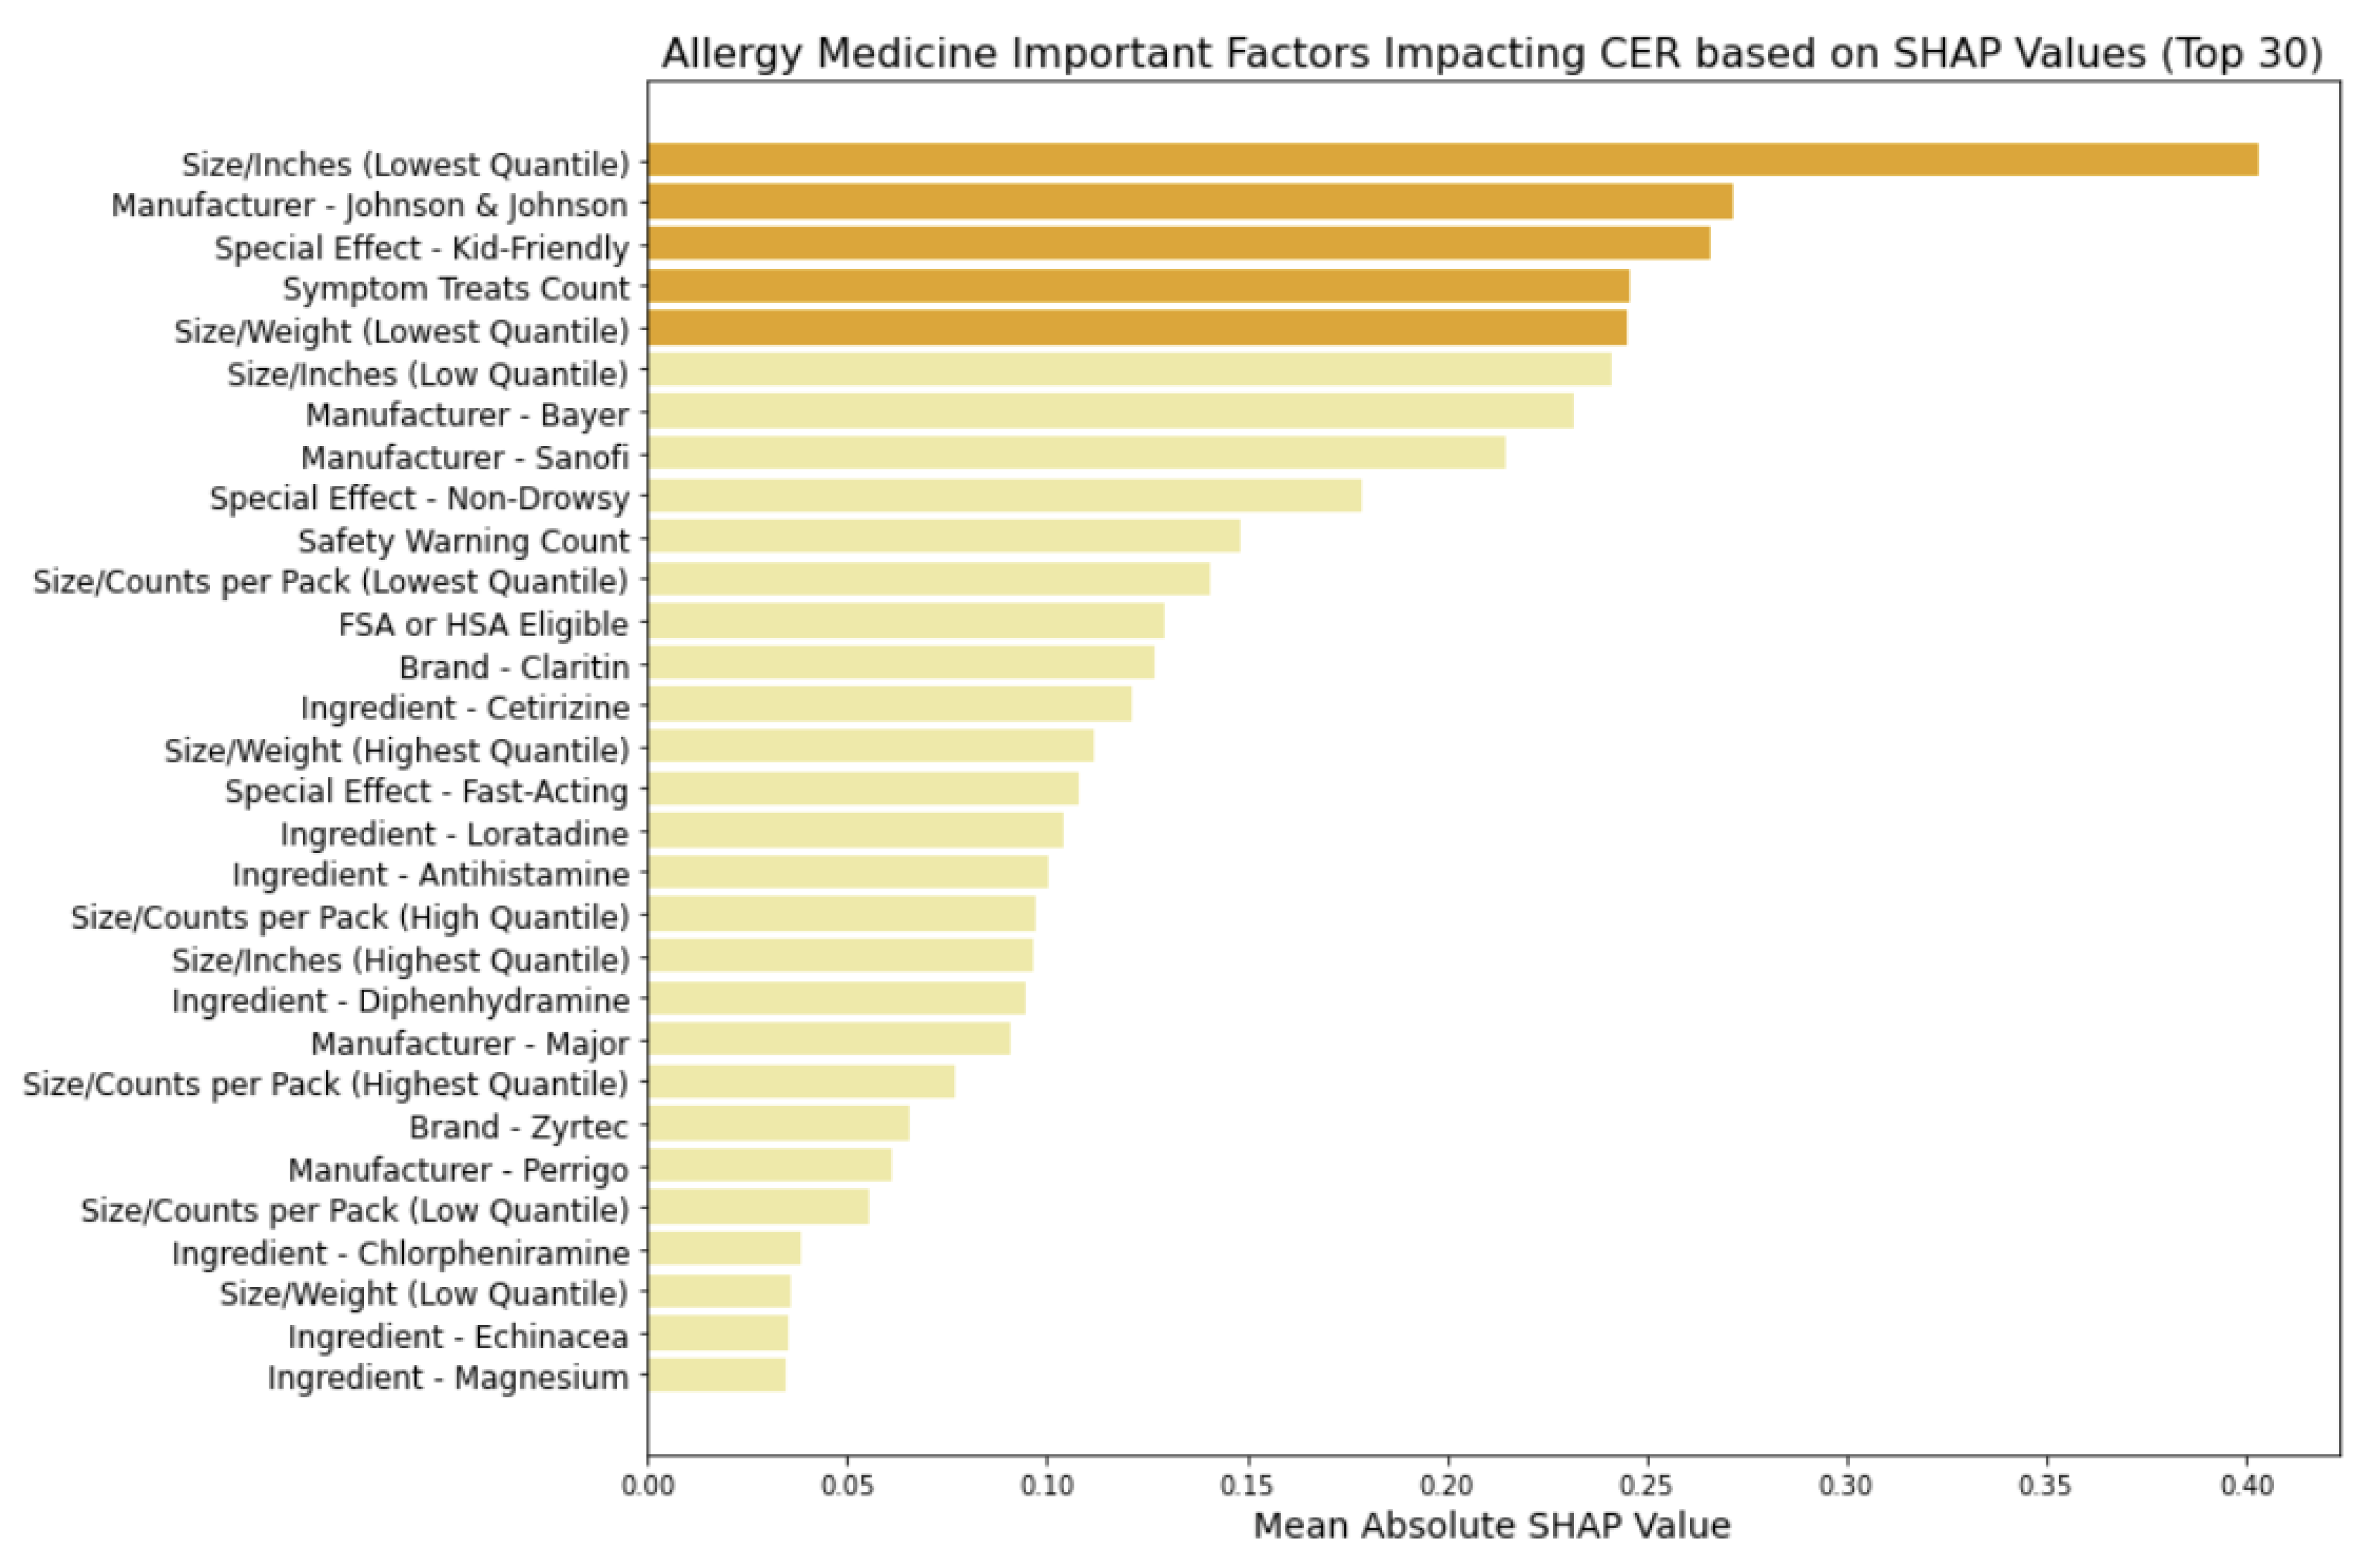
Figure 11, using the Logistic Regression model, we examine the factors influencing the CERs of allergy medicine and identified key feature categories:
Size Metrics: Particularly, smaller-sized packaging or lighter weight contribute to actual cost-effectiveness.
Manufacturer Influence: Specific manufacturers like Johnson & Johnson, Bayer, Sanofi, Major, and Perrigo exert notable influence, indicating that brand reputation and trustworthiness may affect consumer ratings when adjusting the cost
Special Effects: Attributes like being kid-friendly influence CER, enhancing safety perceptions and influencing actual cost-effectiveness.
Symptom Treats: Similarly to cold medicine, the medication's ability to address a broader range of symptoms impacts CER.
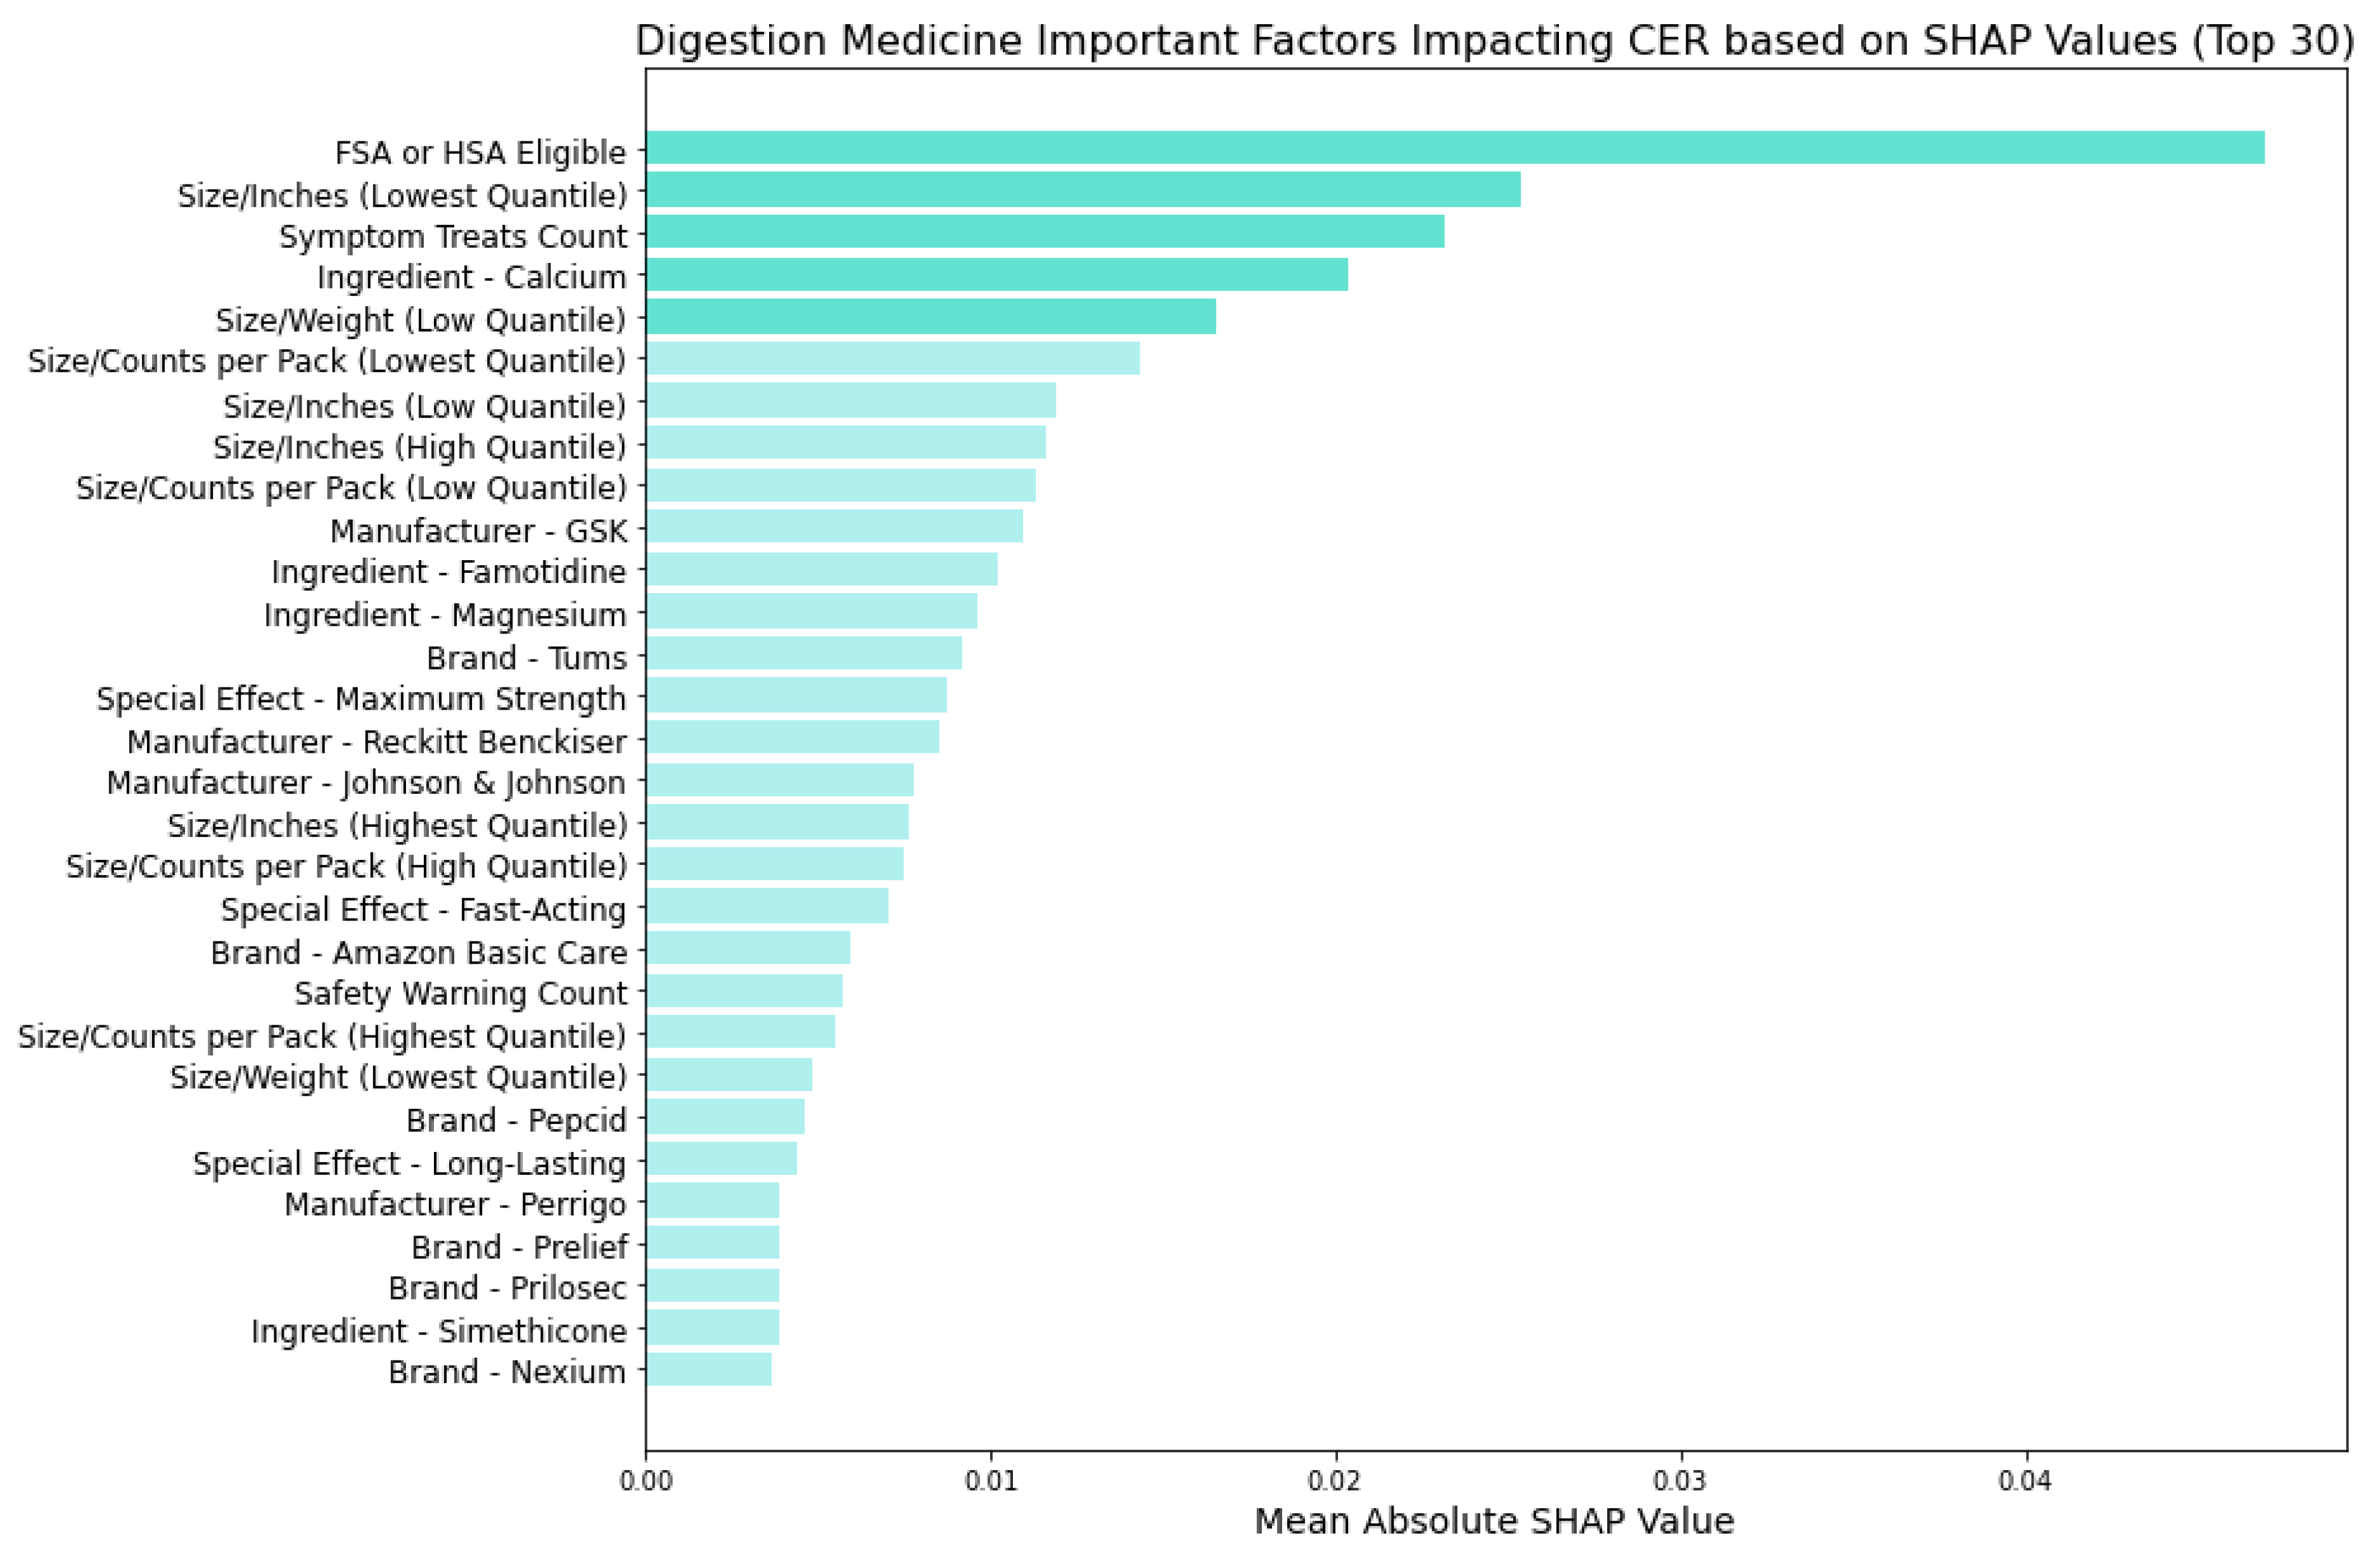
Figure 12 showcases the factors influencing the CERs of digestion medicine using the Random Forest model, where we identified key feature categories:
FSA or HSA Eligibility: Similarly to cold medicine, suggesting the potential for pre-tax fund utilization to be more cost-effective.
Size Metrics: Similar to allergy medicine, smaller-sized packaging or lighter weight particularly affect actual cost-effectiveness.
Symptom Treats: Similarly to cold and allergy medicine, the medication's effectiveness in treating a range of symptoms influences cost-adjusted ratings.
Active Ingredients: Specific ingredients like Calcium, Famotidine, and Magnesium influence perceived cost-effectiveness.
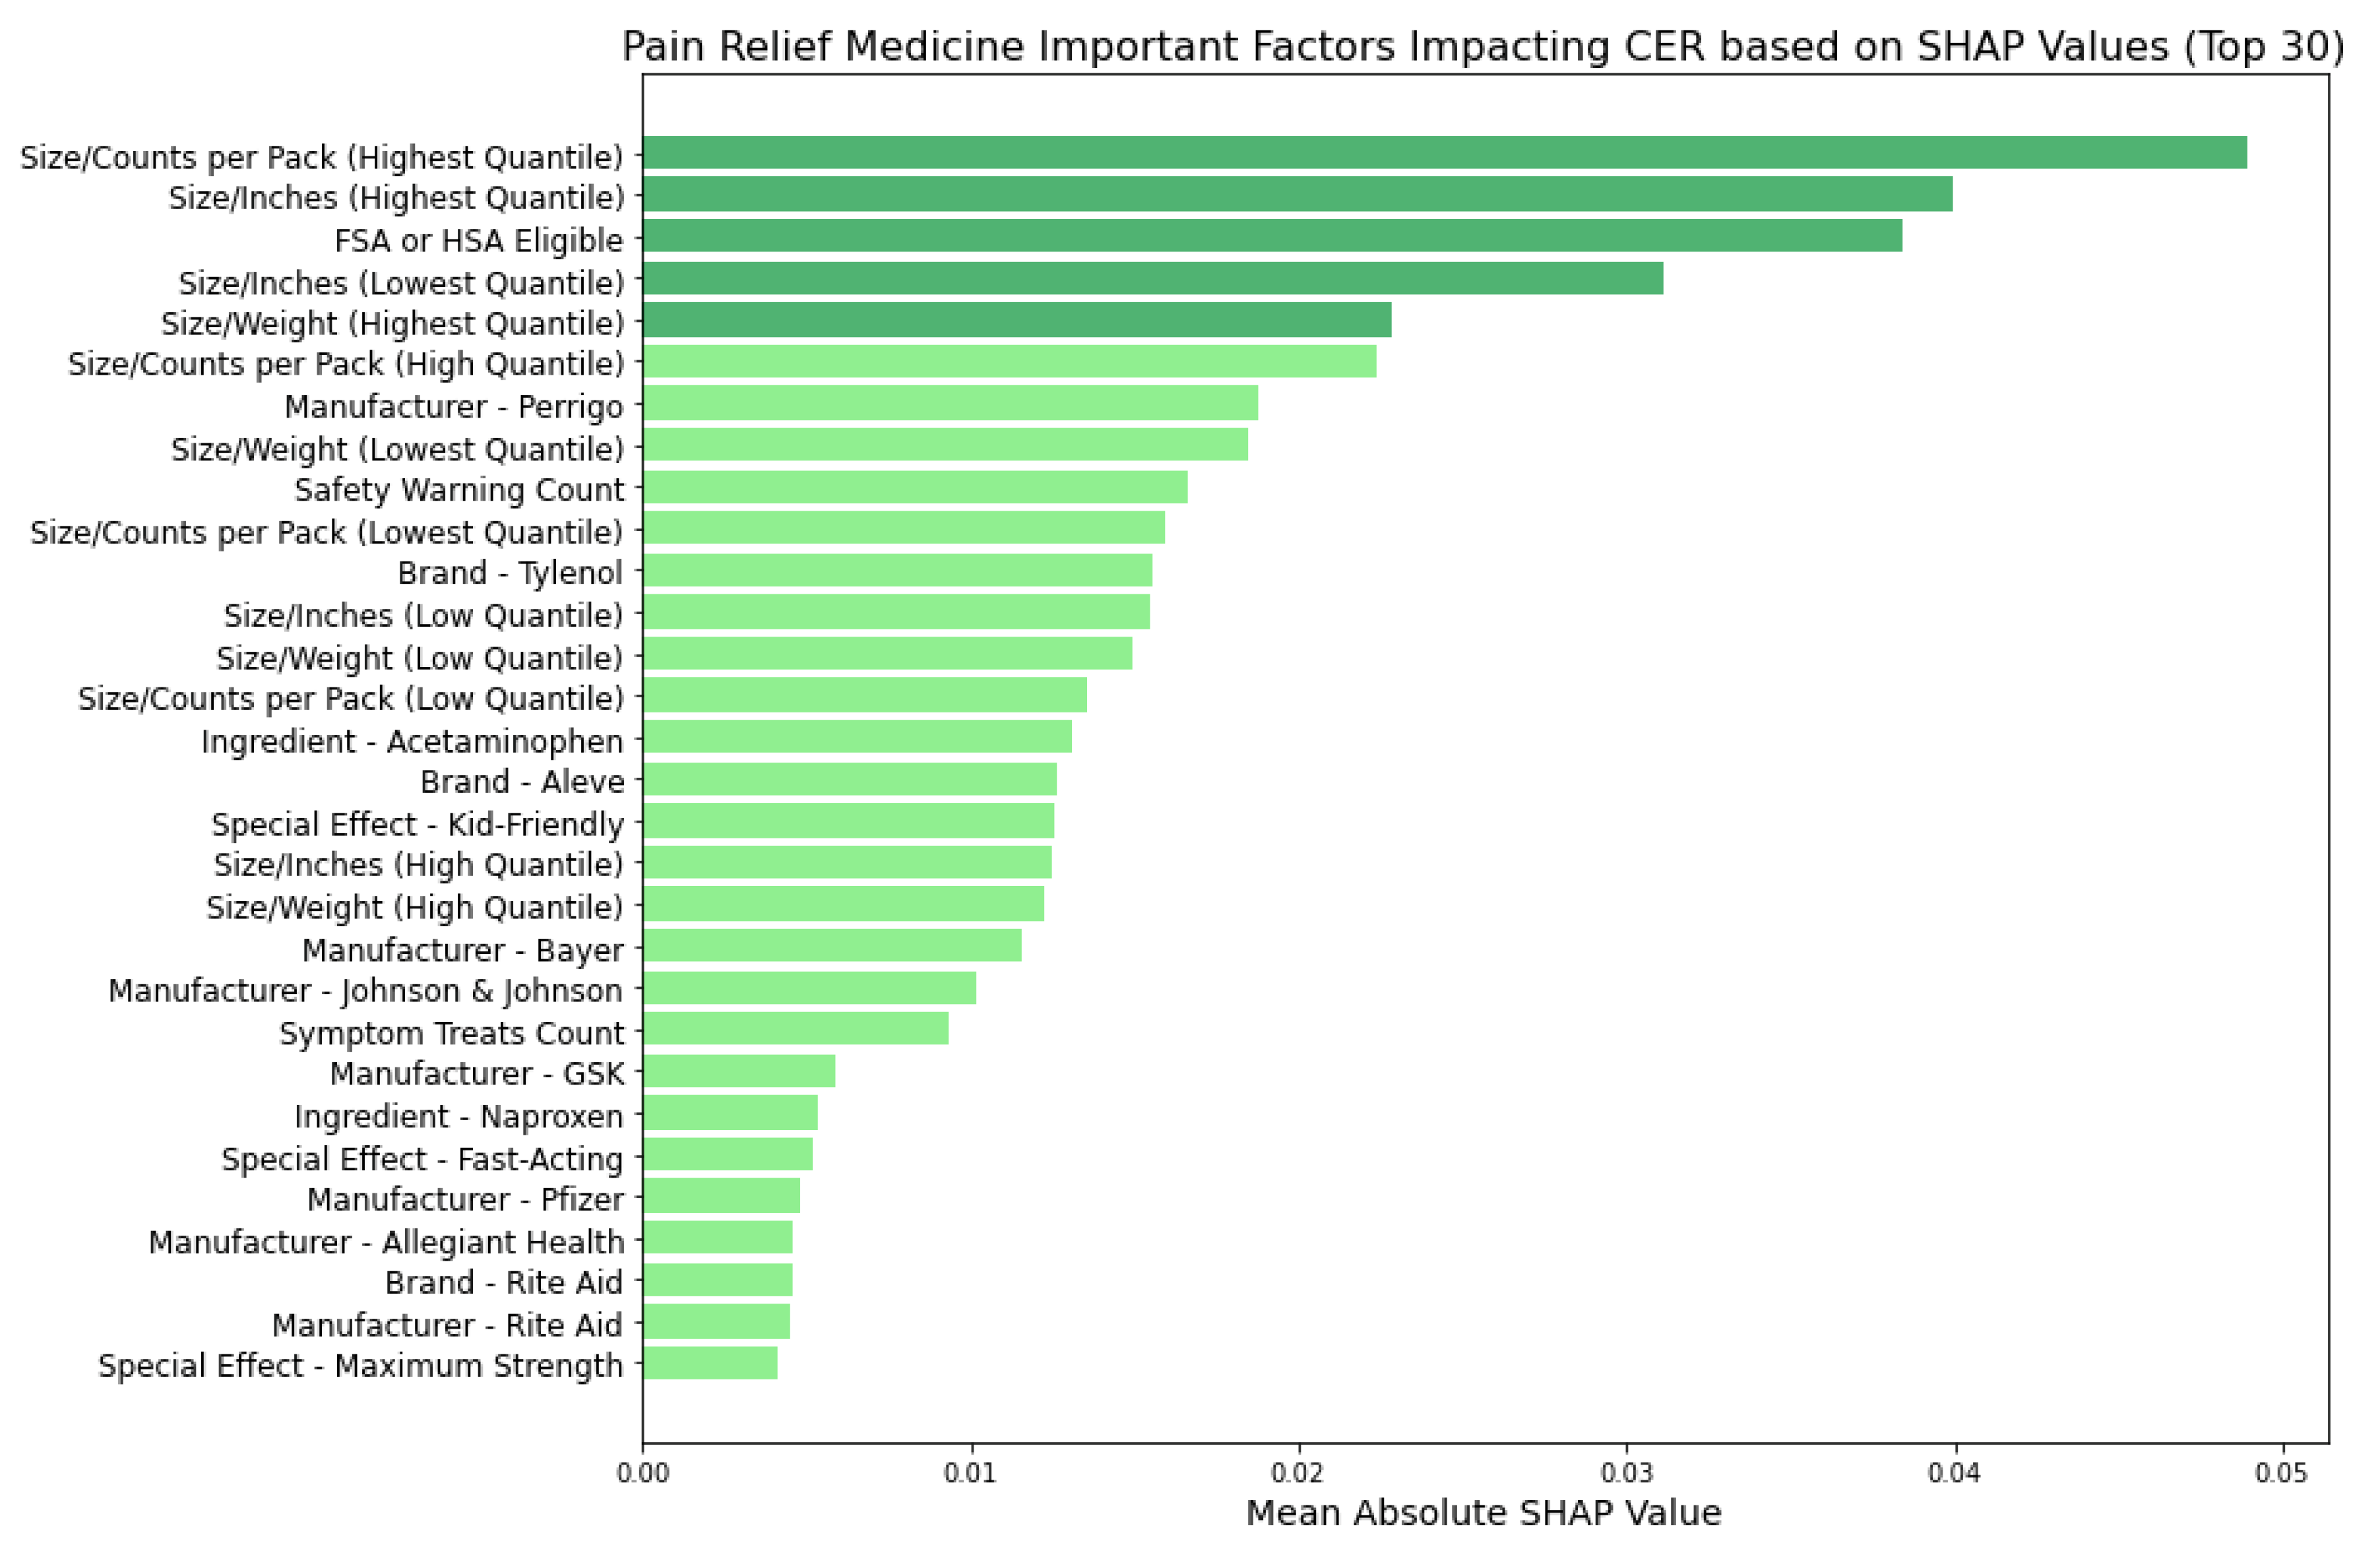
Figure 13 uncovers the factors impacting the CERs of pain relief medicine using the Random Forest model and identified key feature categories:
These insights offer a comprehensive view of the feature categories driving cost-effectiveness across different medicine types, with further detailed analyses of individual factors from these categories presented in the Discussion section.
4. Discussion
Building upon the insights gleaned from the SHAP plots presented in the previous section, which evaluated the relative importance of various factors and identified key feature categories, we proceeded to develop logistic regression models for each of the four medicine types. These models enable us to distinguish between positive effects (indicating higher cost-effectiveness) and negative effects (indicating lower cost-effectiveness) on Cost-Effectiveness Ratings based on the sign of each coefficient.
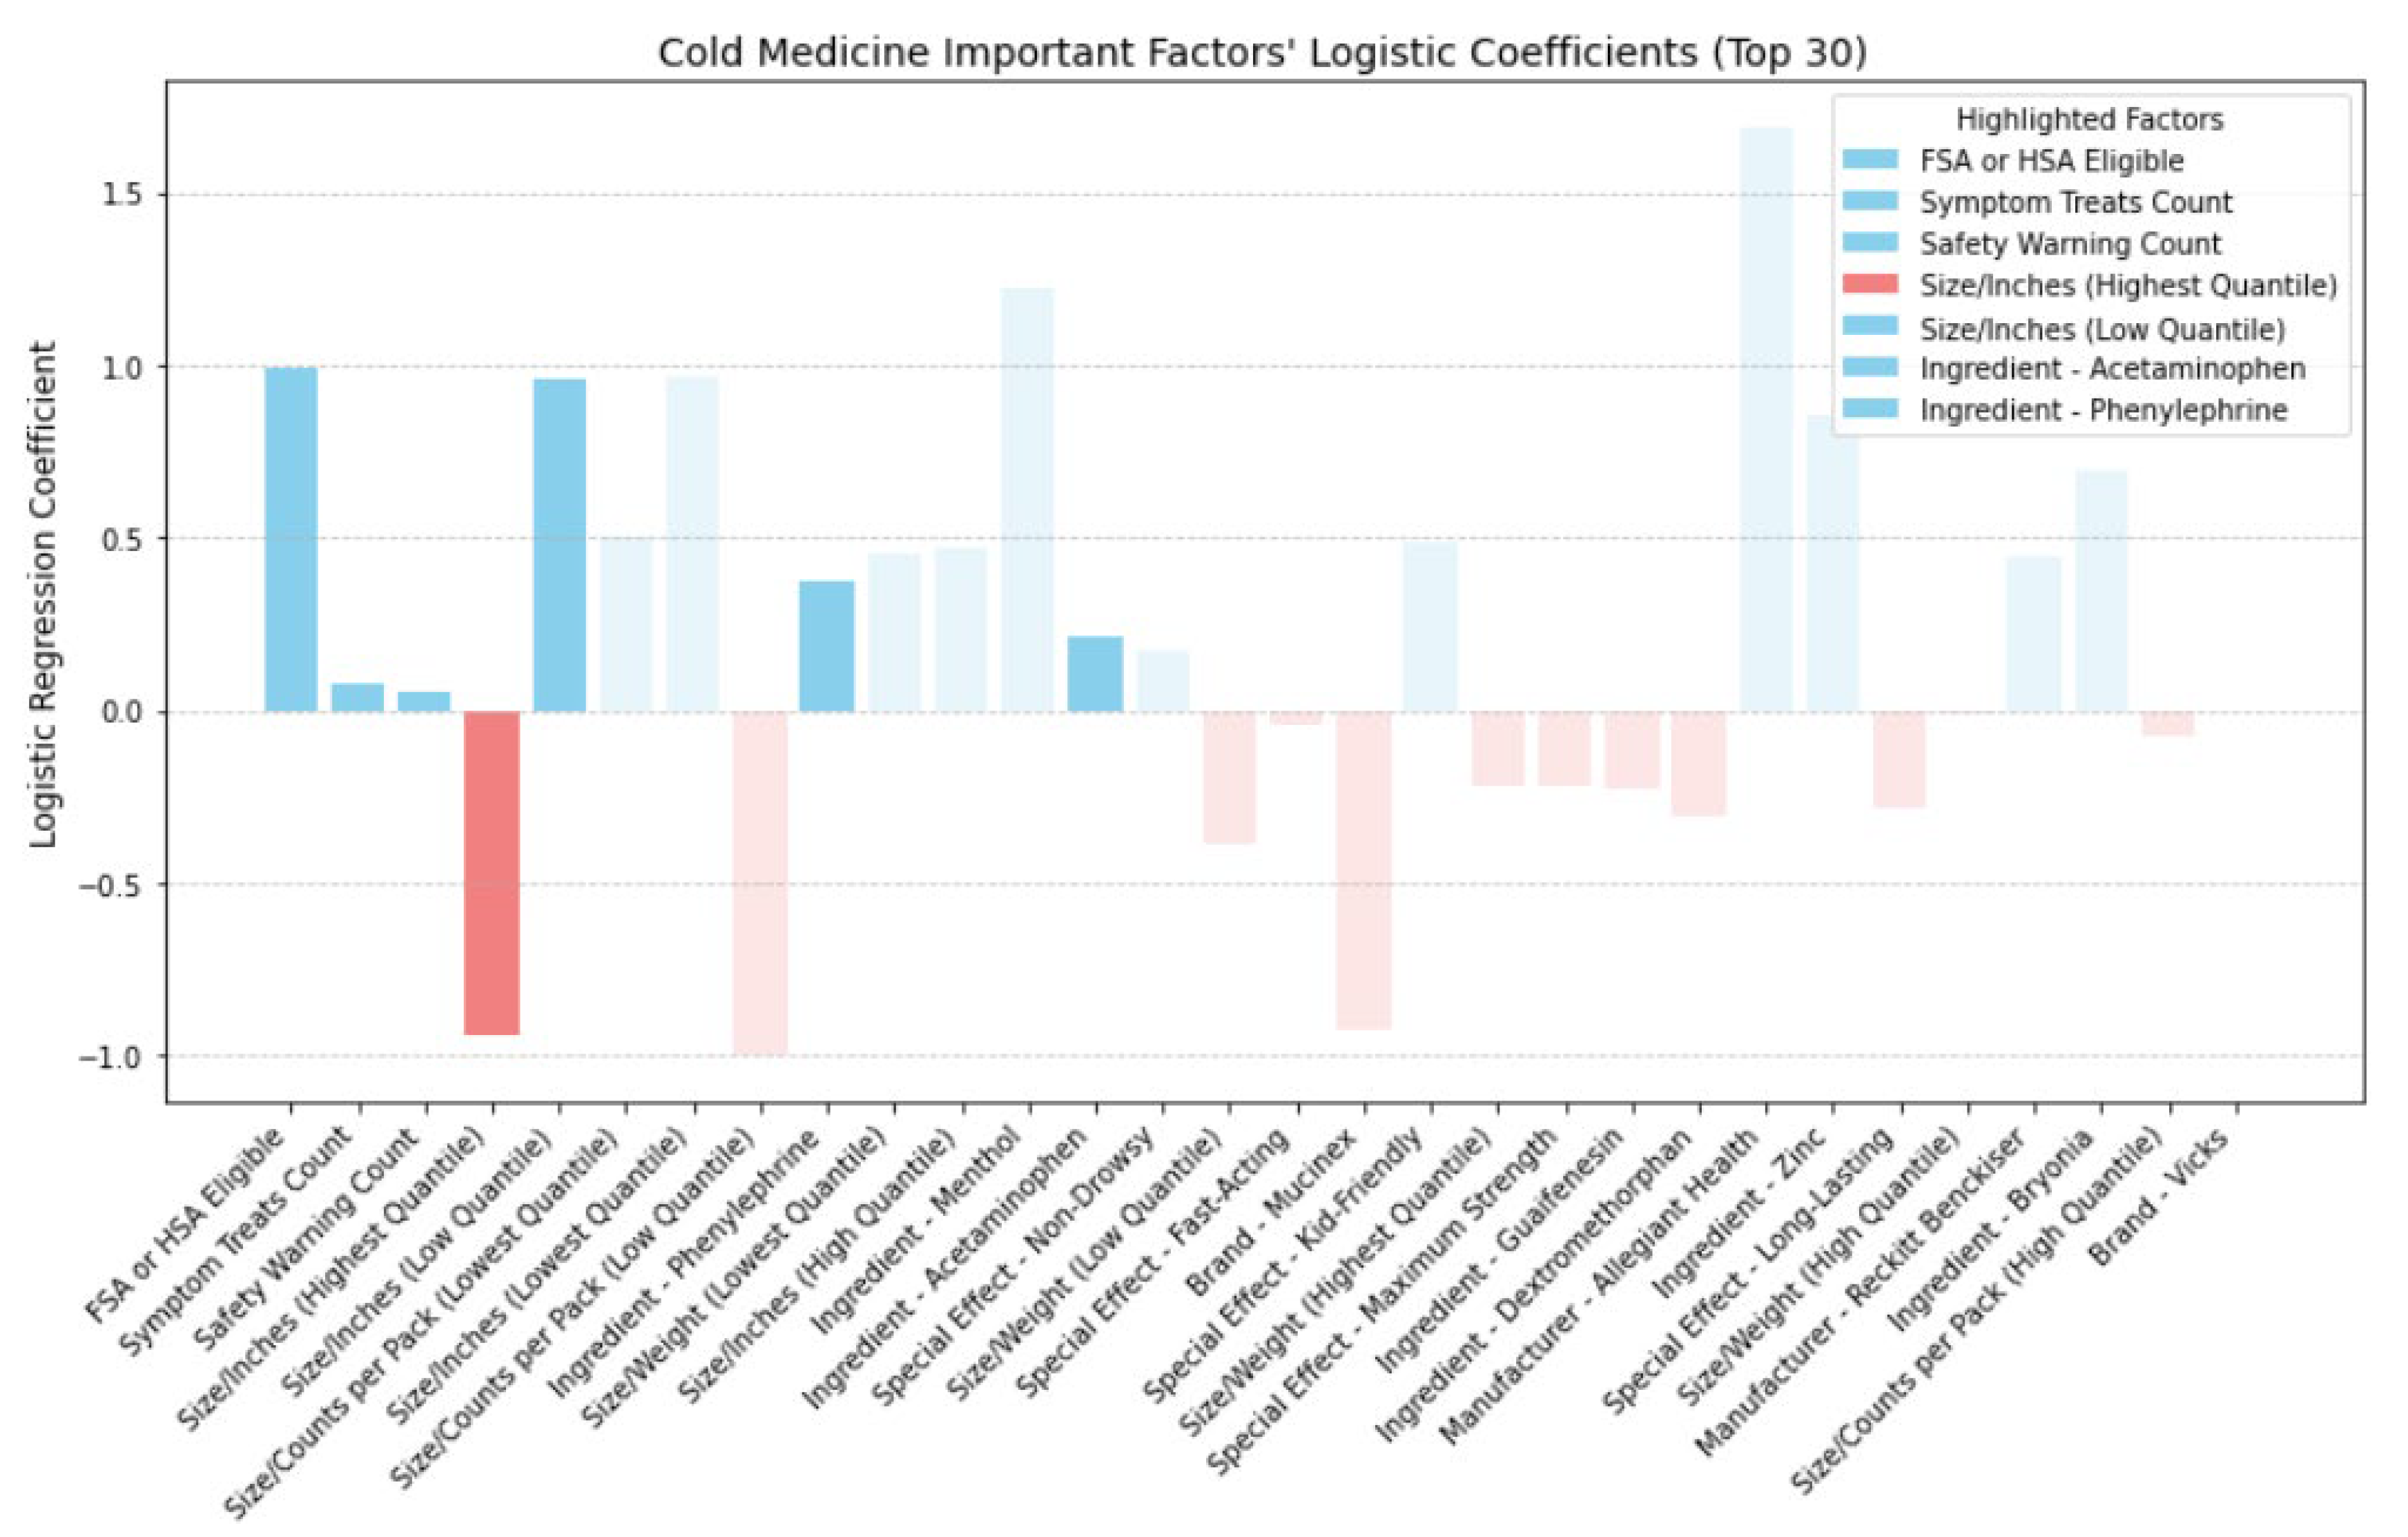
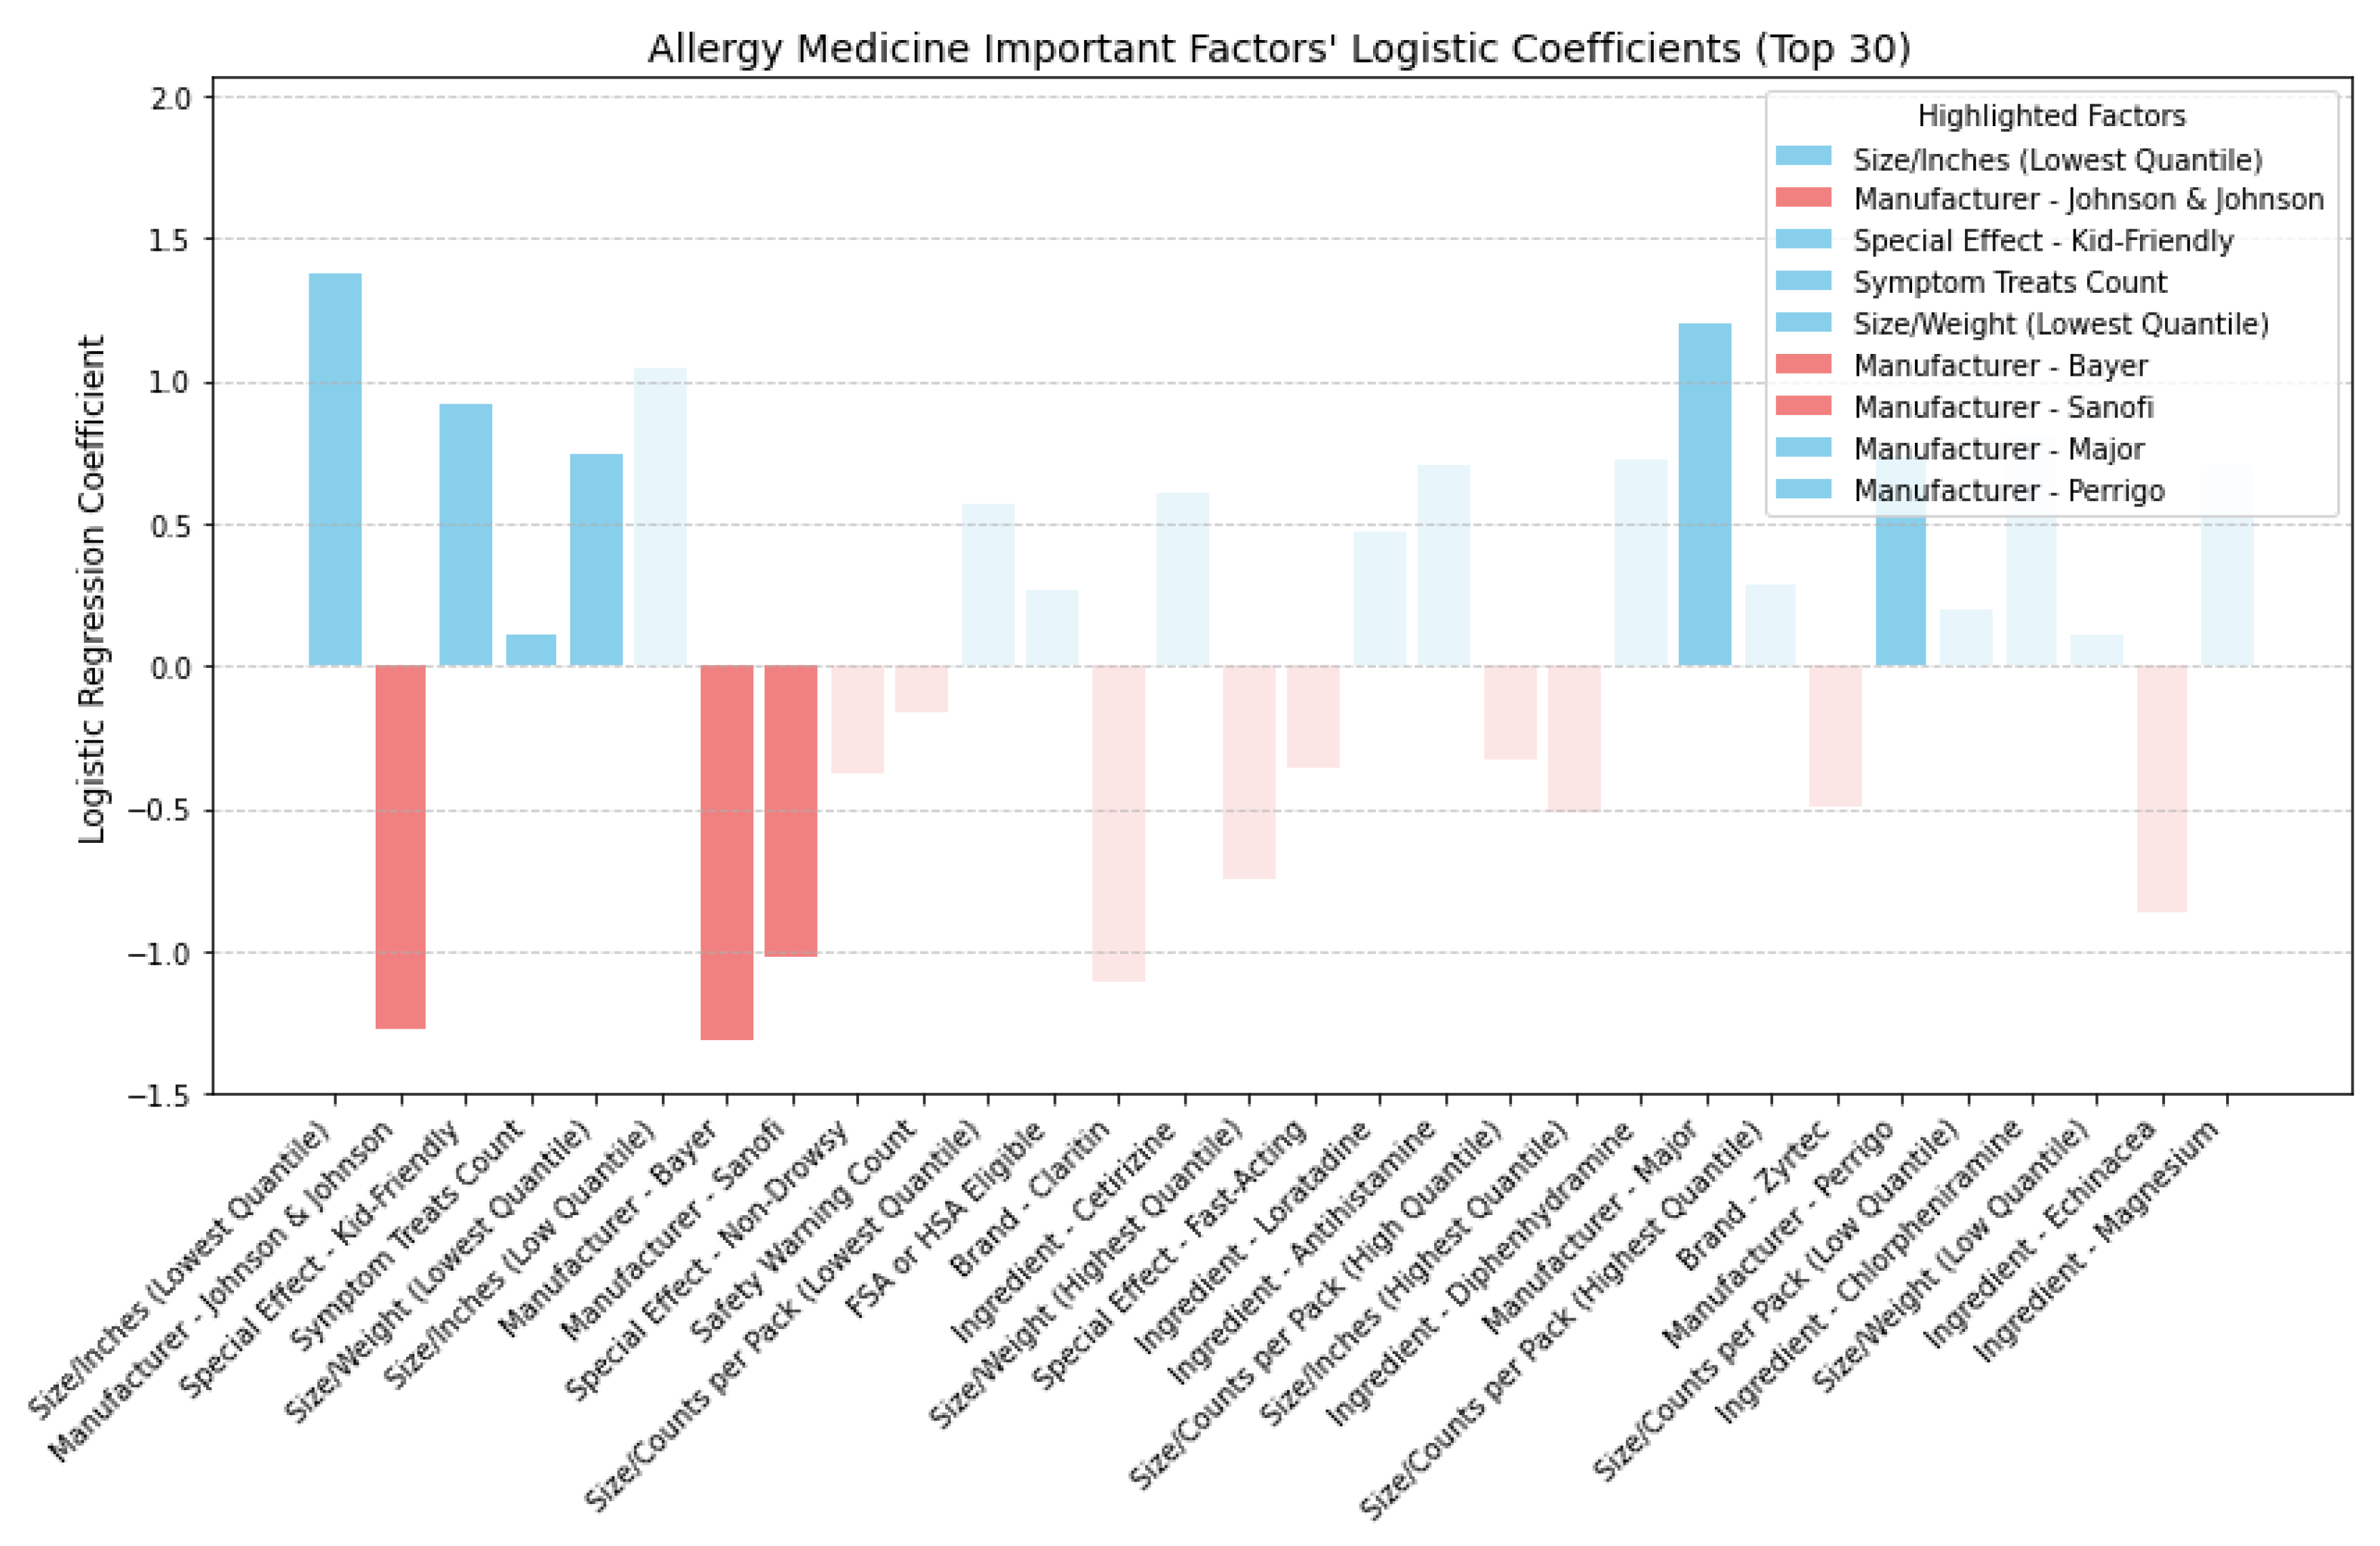
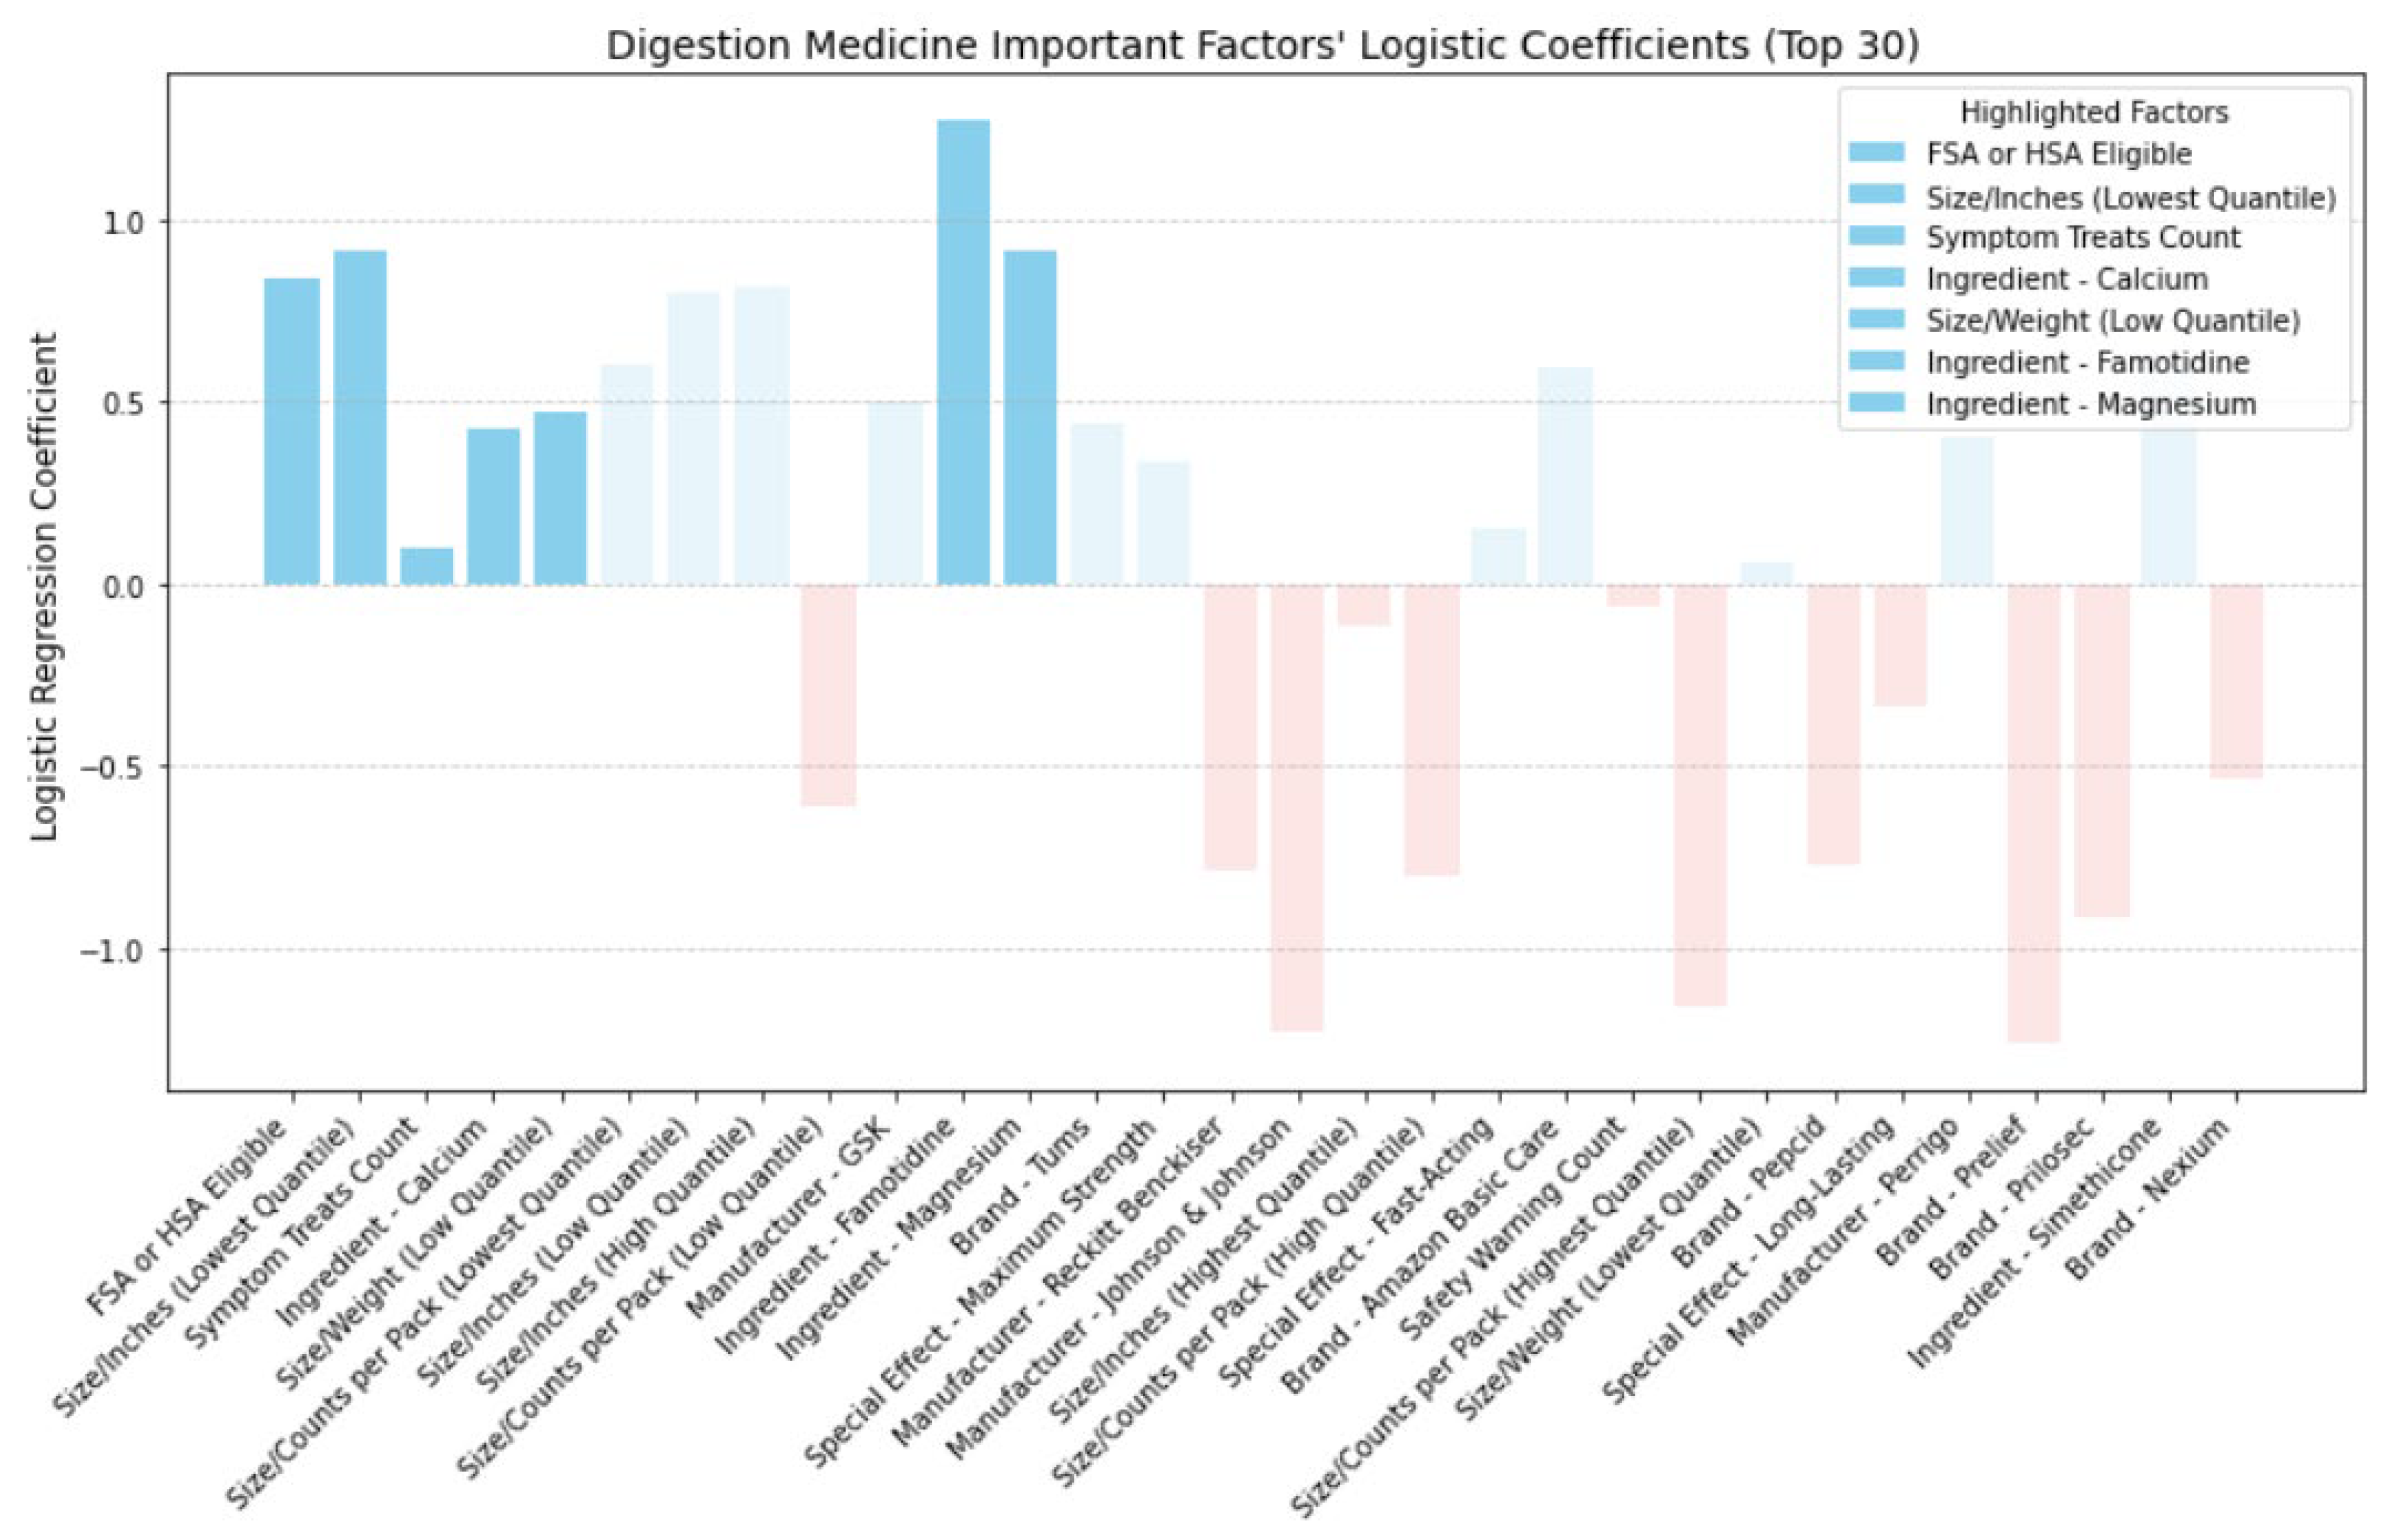
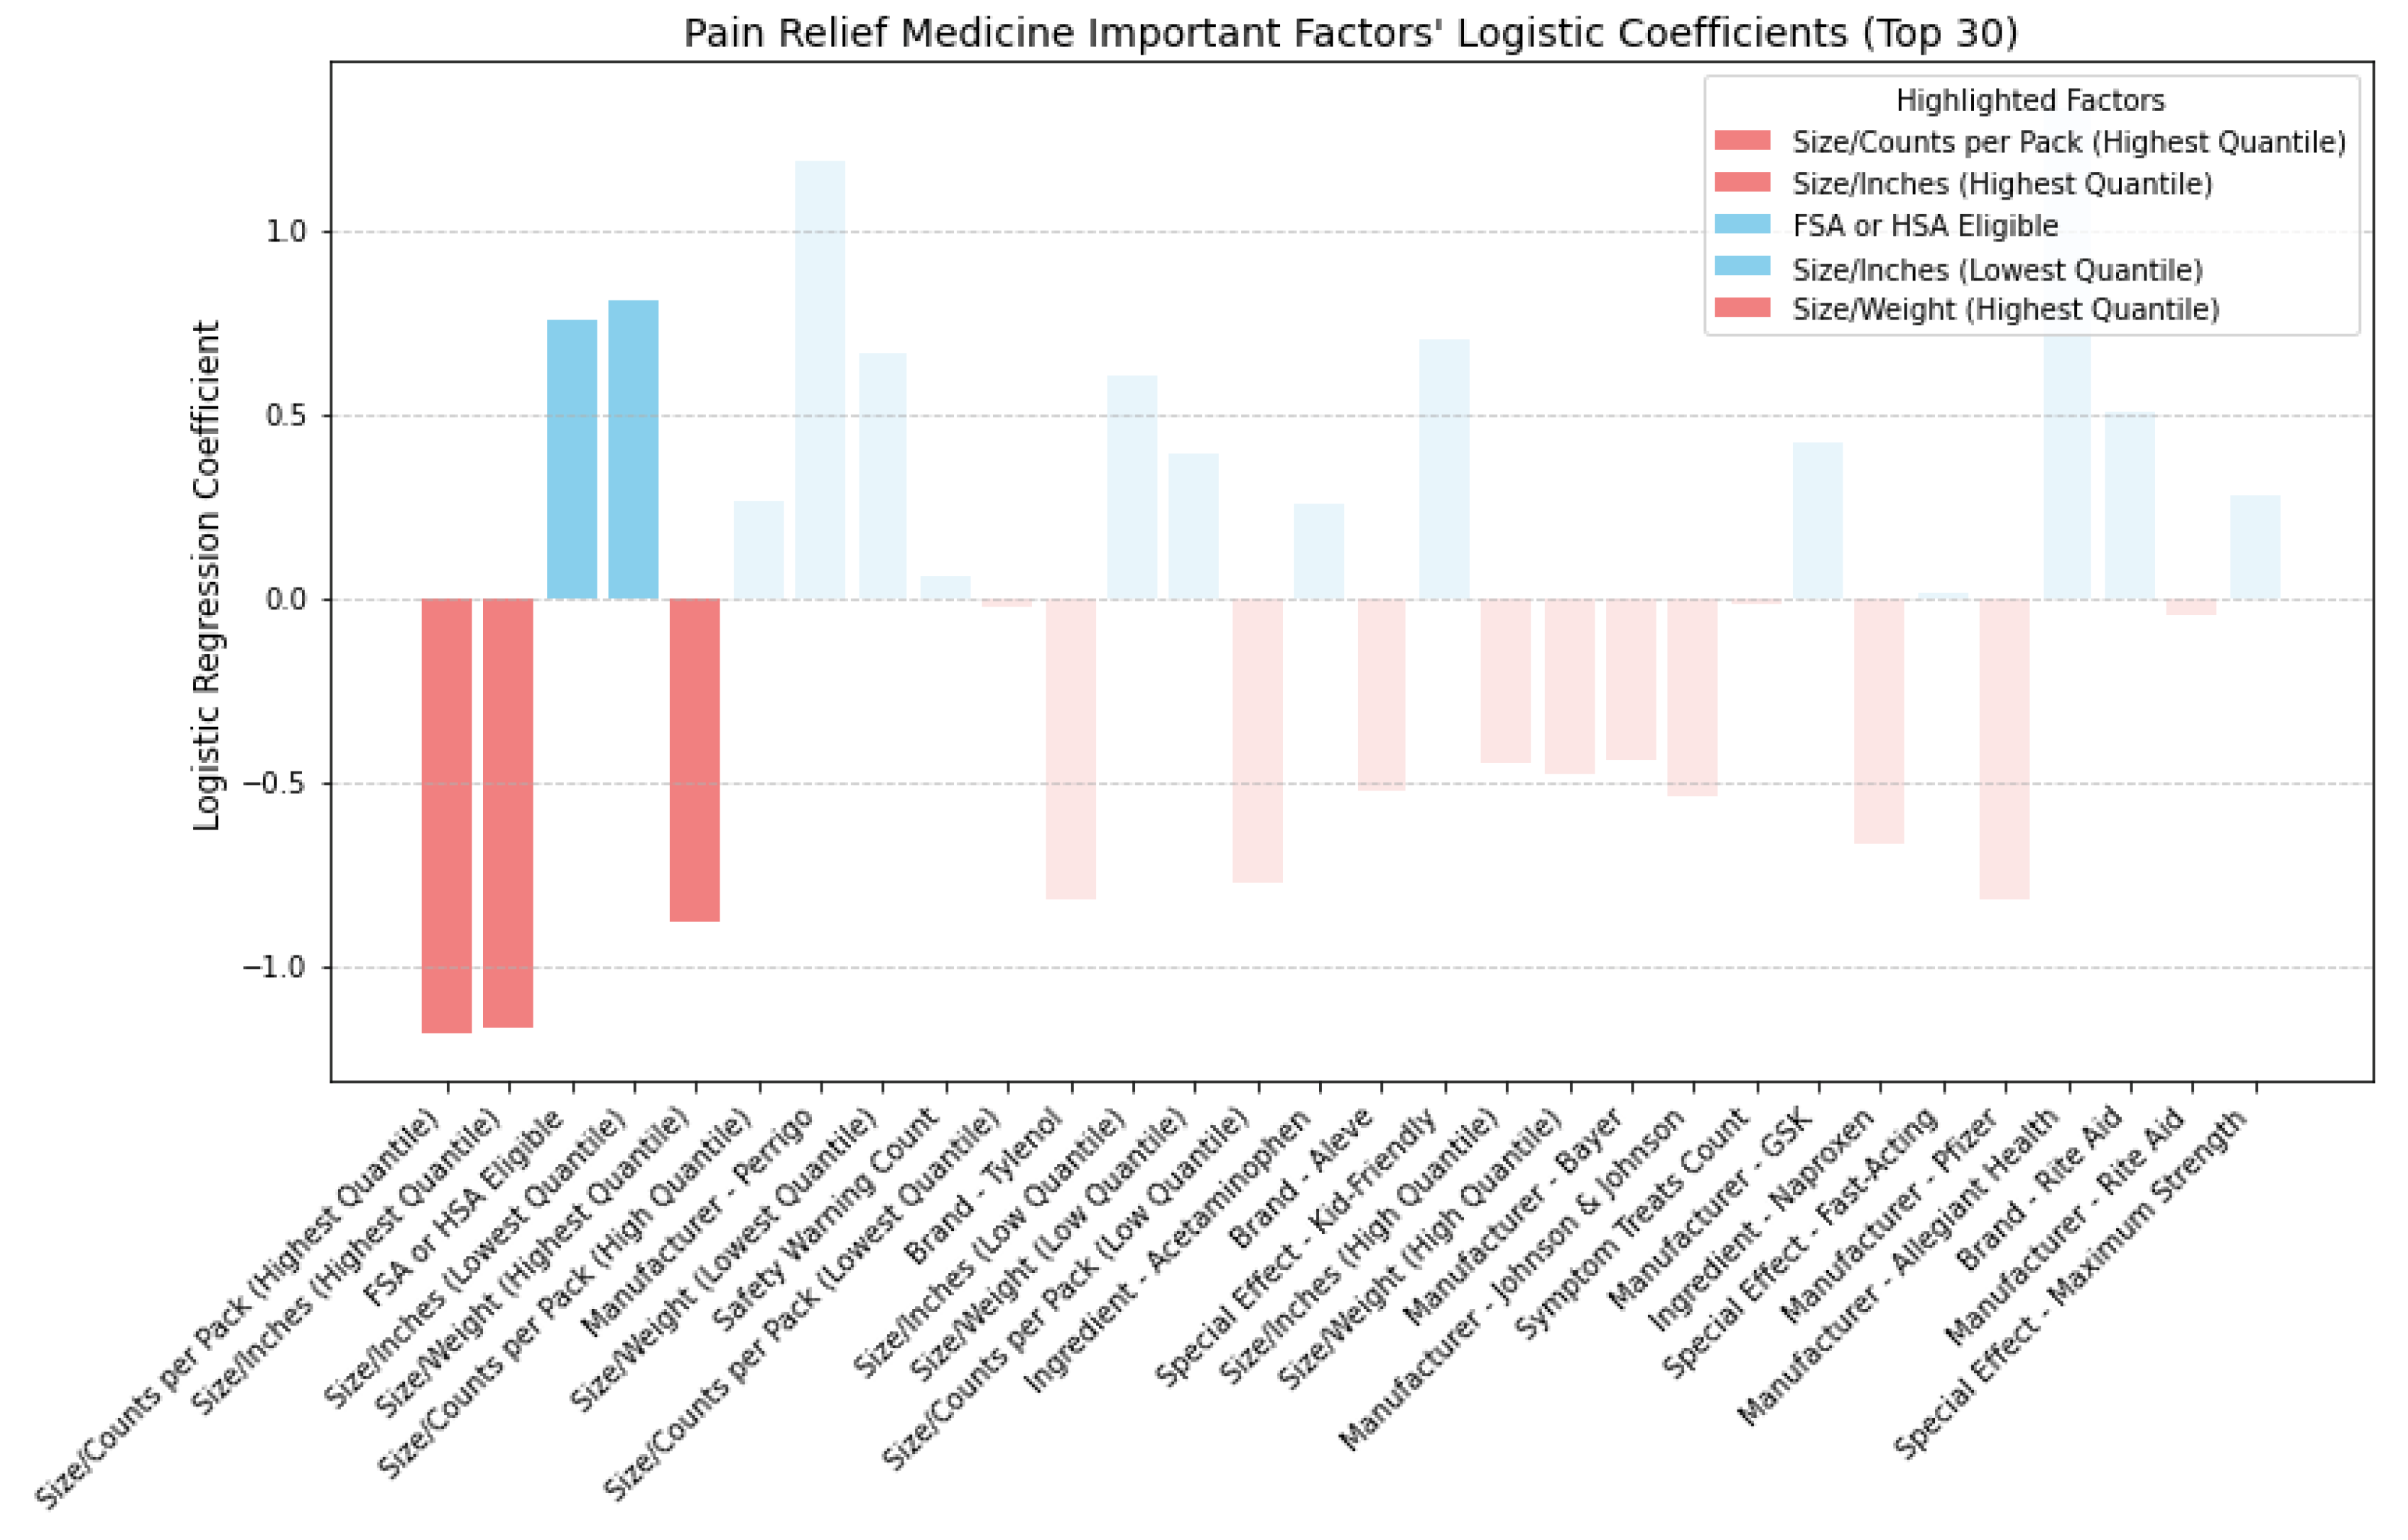
Figure 14 showcase the directional impact of factors, as inferred from logistic regression coefficients, with highlighted factors across cold, allergy, digestion, and pain relief medicine prominently featured.
In
Figure 14, we examined the directional impact of key factors for cold medicine. Both 'FSA or HSA Eligible' and 'Symptom Treats Count' showed positive impacts, indicating that medicines eligible for pre-tax funds and those treating more symptoms tend to be more cost-effective. Surprisingly, 'Safety Warning Count' also positively influenced CER, suggesting that medicines with safety warnings might offer better cost-effectiveness compared to those without. When comparing medicines with and without safety warnings, we found that those with warnings not only had a lower average price (
$12.95 vs.
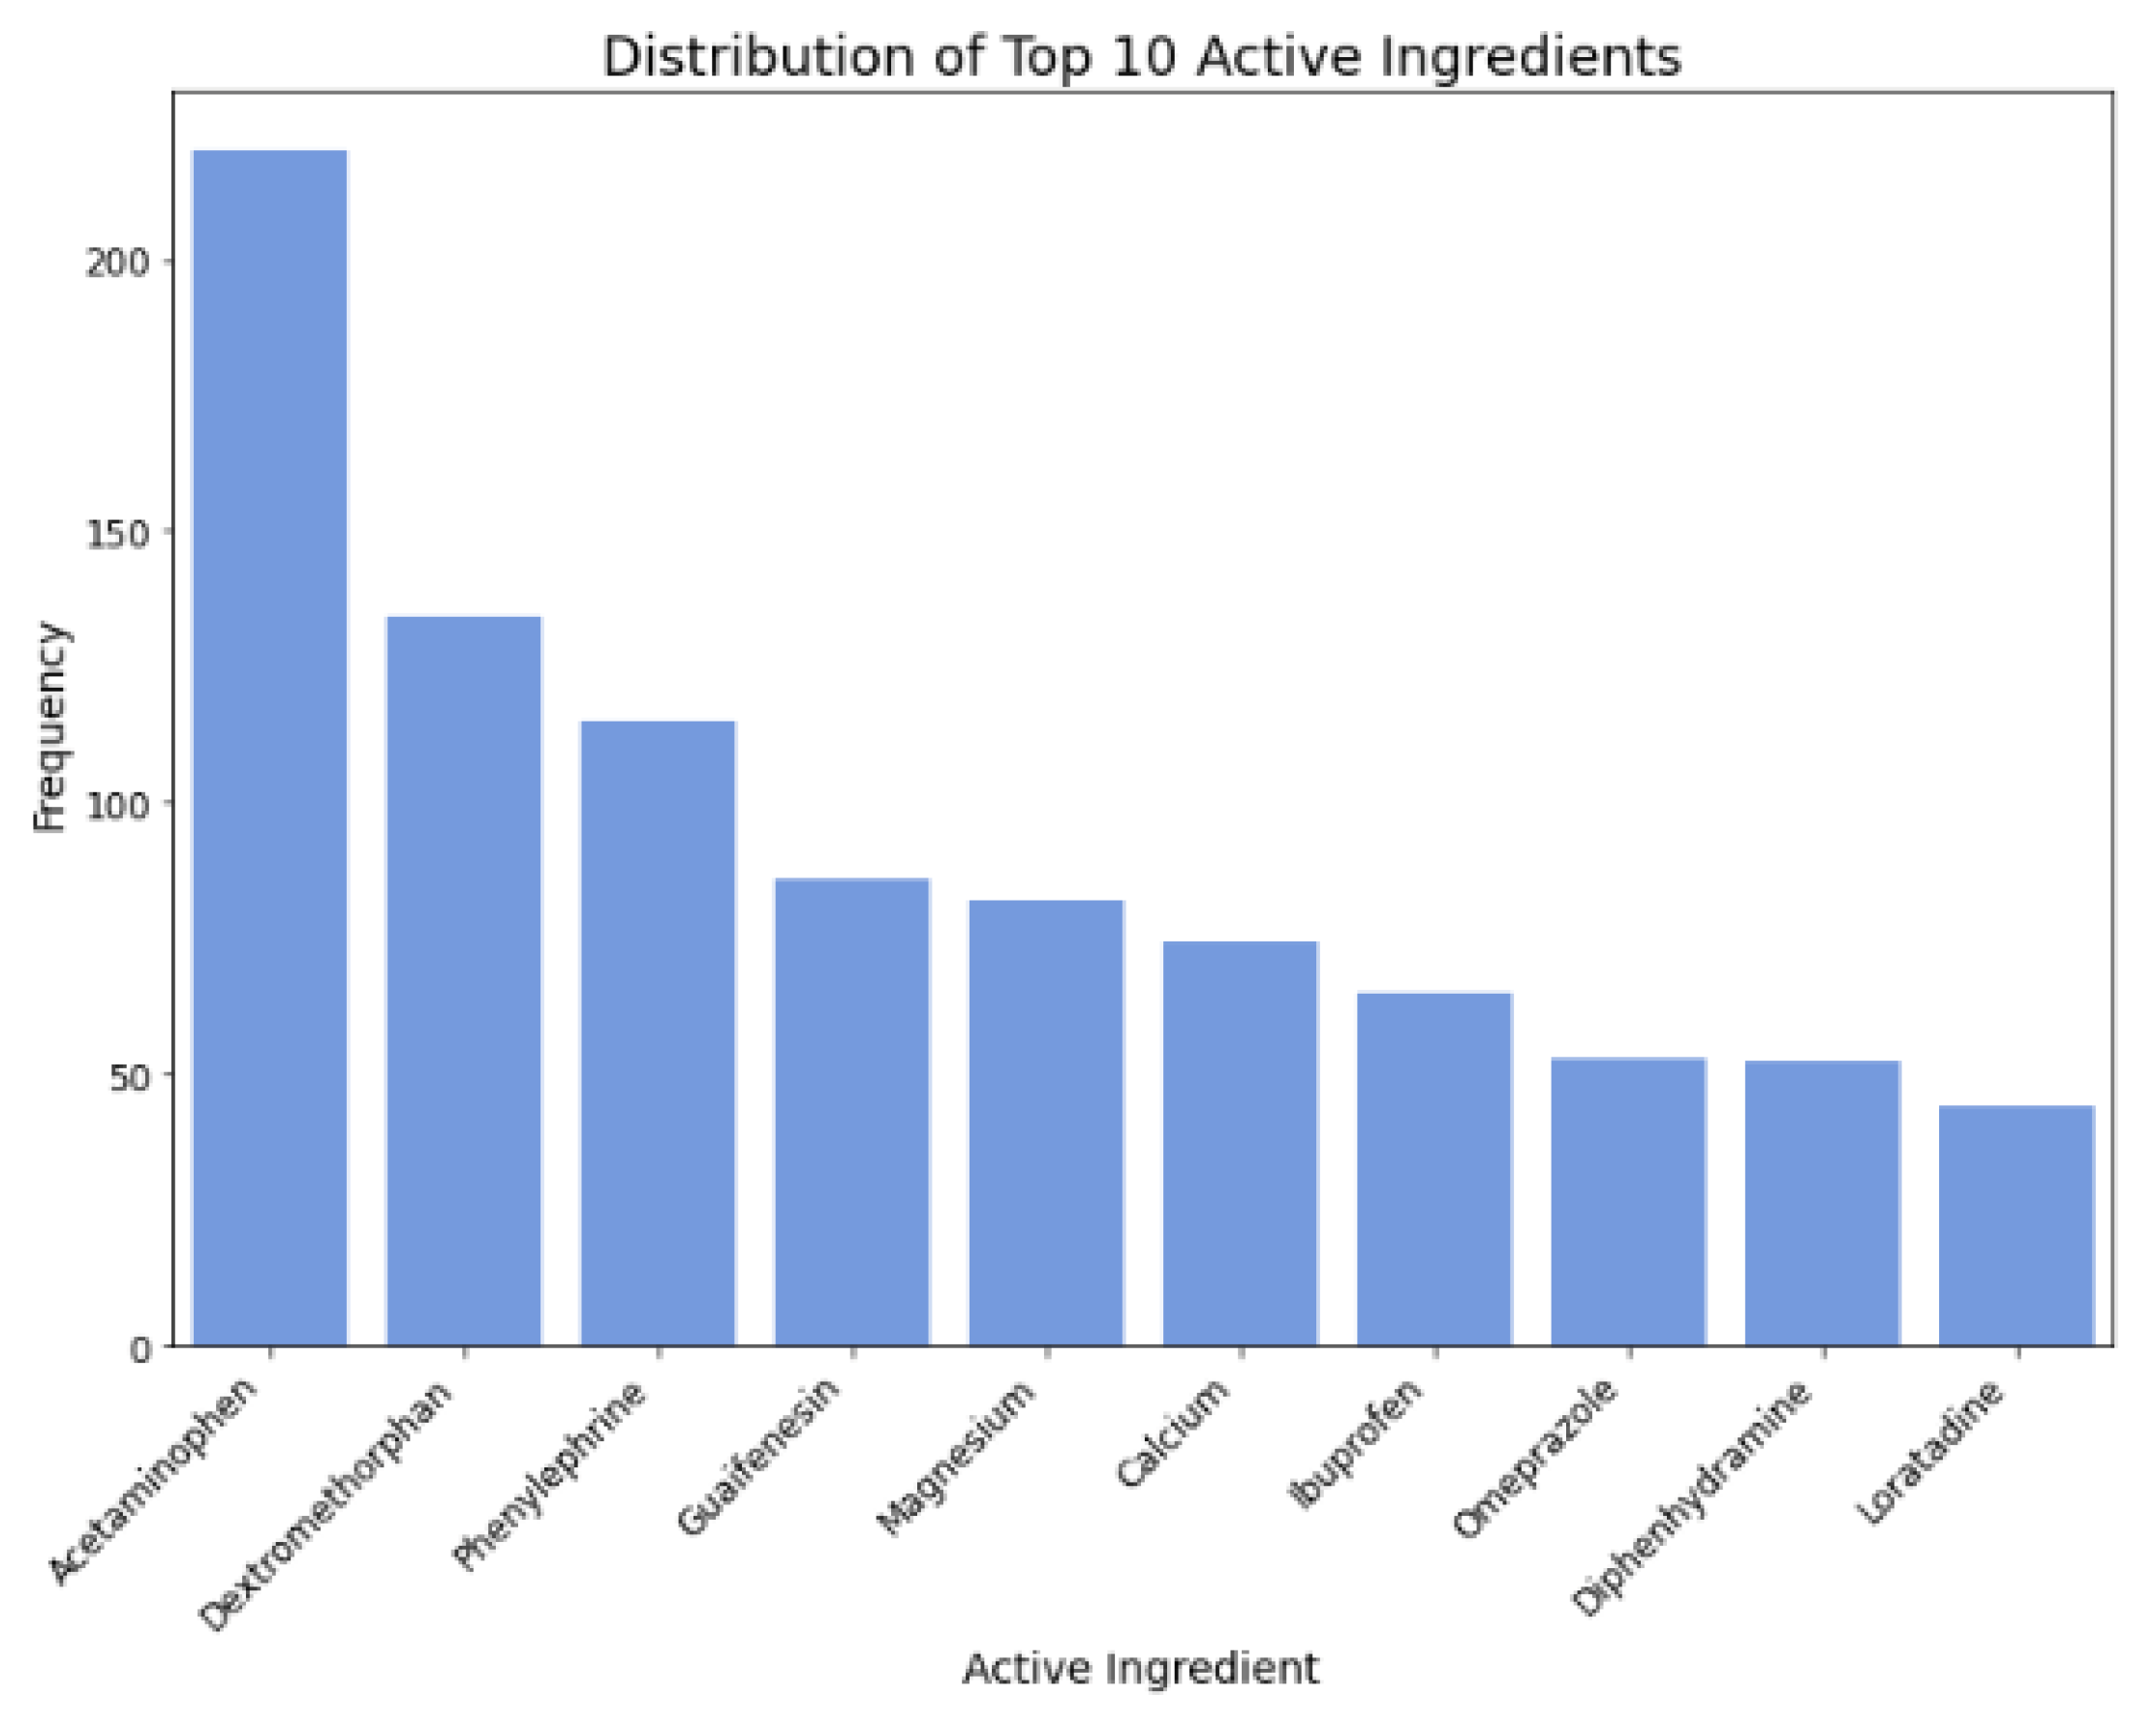
$19.08) but also received higher average ratings (4.68 vs. 4.57). Further analysis revealed that medicines with safety warnings more frequently contained active ingredients such as dextromethorphan, acetaminophen, and phenylephrine (as shown in
Table 7), clinically proven to be effective in treating cold symptoms [
40,
41,
42]. Moreover,
Figure 4-1 highlights phenylephrine and acetaminophen as top factors positively impacting CER, indicating that the inclusion of such ingredients contributes to higher ratings for medicines with safety warnings when the price is the same. Therefore, we do not discourage the purchase of cold medicines with safety warnings. They offer cost-effectiveness due to their lower average price and the inclusion of effective ingredients such as phenylephrine and acetaminophen, resulting in higher ratings. However, individuals should consider their allergies before opting for these medicines. Additionally, smaller packaging positively impacts cost-effectiveness, while larger packaging has a negative effect.
In
Figure 15, we delved into allergy medicine and uncovered insights into the directional impact of key factors. We found that factors like smaller-sized packaging and lighter weight held positive coefficients, affirming their role in improving cost-effectiveness. Moreover, allergy medications featuring kid-friendly special effects demonstrated heightened cost-effectiveness, as indicated by their positive coefficient. Additionally, akin to cold medicine, allergy remedies addressing a broader array of allergy symptoms generally received higher ratings at comparable prices, thus bolstering cost-effectiveness. When scrutinizing manufacturers, we observed negative coefficients for Johnson & Johnson, Bayer, and Sanofi, while Major and Perrigo exhibited positive coefficients. However, a closer examination, as
Table 8 shows, of the average price, rating, and Cost-Effectiveness Ratings (CER) by these manufacturers revealed conflicting outcomes. Despite Perrigo and Major achieving slightly higher ratings, their elevated average prices outweighed the benefits, resulting in lower average CER values, indicating reduced cost-effectiveness. This suggests that interactions may have existed between manufacturer and other feature categories such as brand, ingredients, and safety warnings, collectively influencing cost-effectiveness ratings and thus twisting interpretations of manufacturer logistic coefficient [
43,
44]. Consequently, relying on manufacturer-based decisions may have lacked robustness in guiding consumers towards cost-effective allergy medicine purchases. Therefore, in assessing allergy medicine, we primarily focused on other key feature categories identified for CER, particularly size metrics such as smaller size or lighter weight, special effects—especially those appealing to children—and symptom coverage, particularly medicines capable of addressing a broader range of symptoms.
In
Figure 16, we analyzed the directional impact of key factors in digestion medicine. Similar to cold medicine, being FSA or HSA eligible proved to be more cost-effective, as confirmed by its positive coefficient. Likewise, akin to allergy medicine, smaller-sized packaging or lighter weight also demonstrated increased cost-effectiveness, as indicated by their positive coefficient. Furthermore, akin to both cold and allergy medicine, addressing a broad range of digestion symptoms was shown to be more cost-effective. Regarding active ingredients, Calcium, Famotidine, and Magnesium all exhibited positive coefficients, indicating increased cost-effectiveness. Based on the collected data, top digestion brands containing calcium included Prelief (with 85.71% labeling calcium as an active ingredient), Rolaids, Tums, and Mylanta. For famotidine, Pepcid stood out, with 57.14% labeling famotidine as an active ingredient. Finally, top digestion brands for magnesium were Rolaids (with 71.43% labeling magnesium as an active ingredient) and Mylanta.
In
Figure 17, analyzing pain relief medicine, smaller-sized packaging positively impacts CER, while larger-sized packaging negatively impacts CER. Items eligible for FSA or HSA are more cost-effective.
6. Conclusions
This study used machine learning to identify key factors influencing the cost-effectiveness of over-the-counter (OTC) medications. The analysis revealed that FSA/HSA eligibility, symptom treatment range, active ingredients, special effects, safety warnings, and packaging size significantly impact cost-effectiveness across cold, allergy, digestion, and pain relief medications. Medications eligible for FSA or HSA funds, those treating a broader range of symptoms, and those with smaller packaging are generally perceived as more cost-effective. For cold medicines, the presence of safety warnings does not compromise cost-effectiveness due to their lower average price and the inclusion of effective ingredients such as phenylephrine and acetaminophen. Allergy medications featuring kid-friendly special effects demonstrated heightened cost-effectiveness. Active ingredients like calcium, famotidine, and magnesium notably boost the cost-effectiveness of digestion medicines. Consumers can use these insights to make more informed choices, ensuring they get high-quality treatments at optimal prices. For manufacturers and retailers, emphasizing these key factors can improve product appeal and competitiveness. Overall, leveraging machine learning to understand cost-effectiveness helps improve decision-making for consumers, manufacturers, and retailers in the pharmaceutical industry.
Author Contributions
Conceptualization, B.L., J.Z. and F.T.; methodology, B.L. and J.Z.; software, B.L. and J.Z.; validation, B.L., J.Z., F.T. and S.B.; formal analysis, F.T.; investigation, S.B.; resources, B.L., J.Z. and F.T.; data curation, F.T. and S.B.; writing—original draft preparation, B.L. and J.Z.; writing—review and editing, B.L, J.Z., S.B. and F.T.; visualization, B.L. and J.Z.; supervision, S.B.; project administration, S.B. and F.T. All authors have read and agreed to the published version of the manuscript.
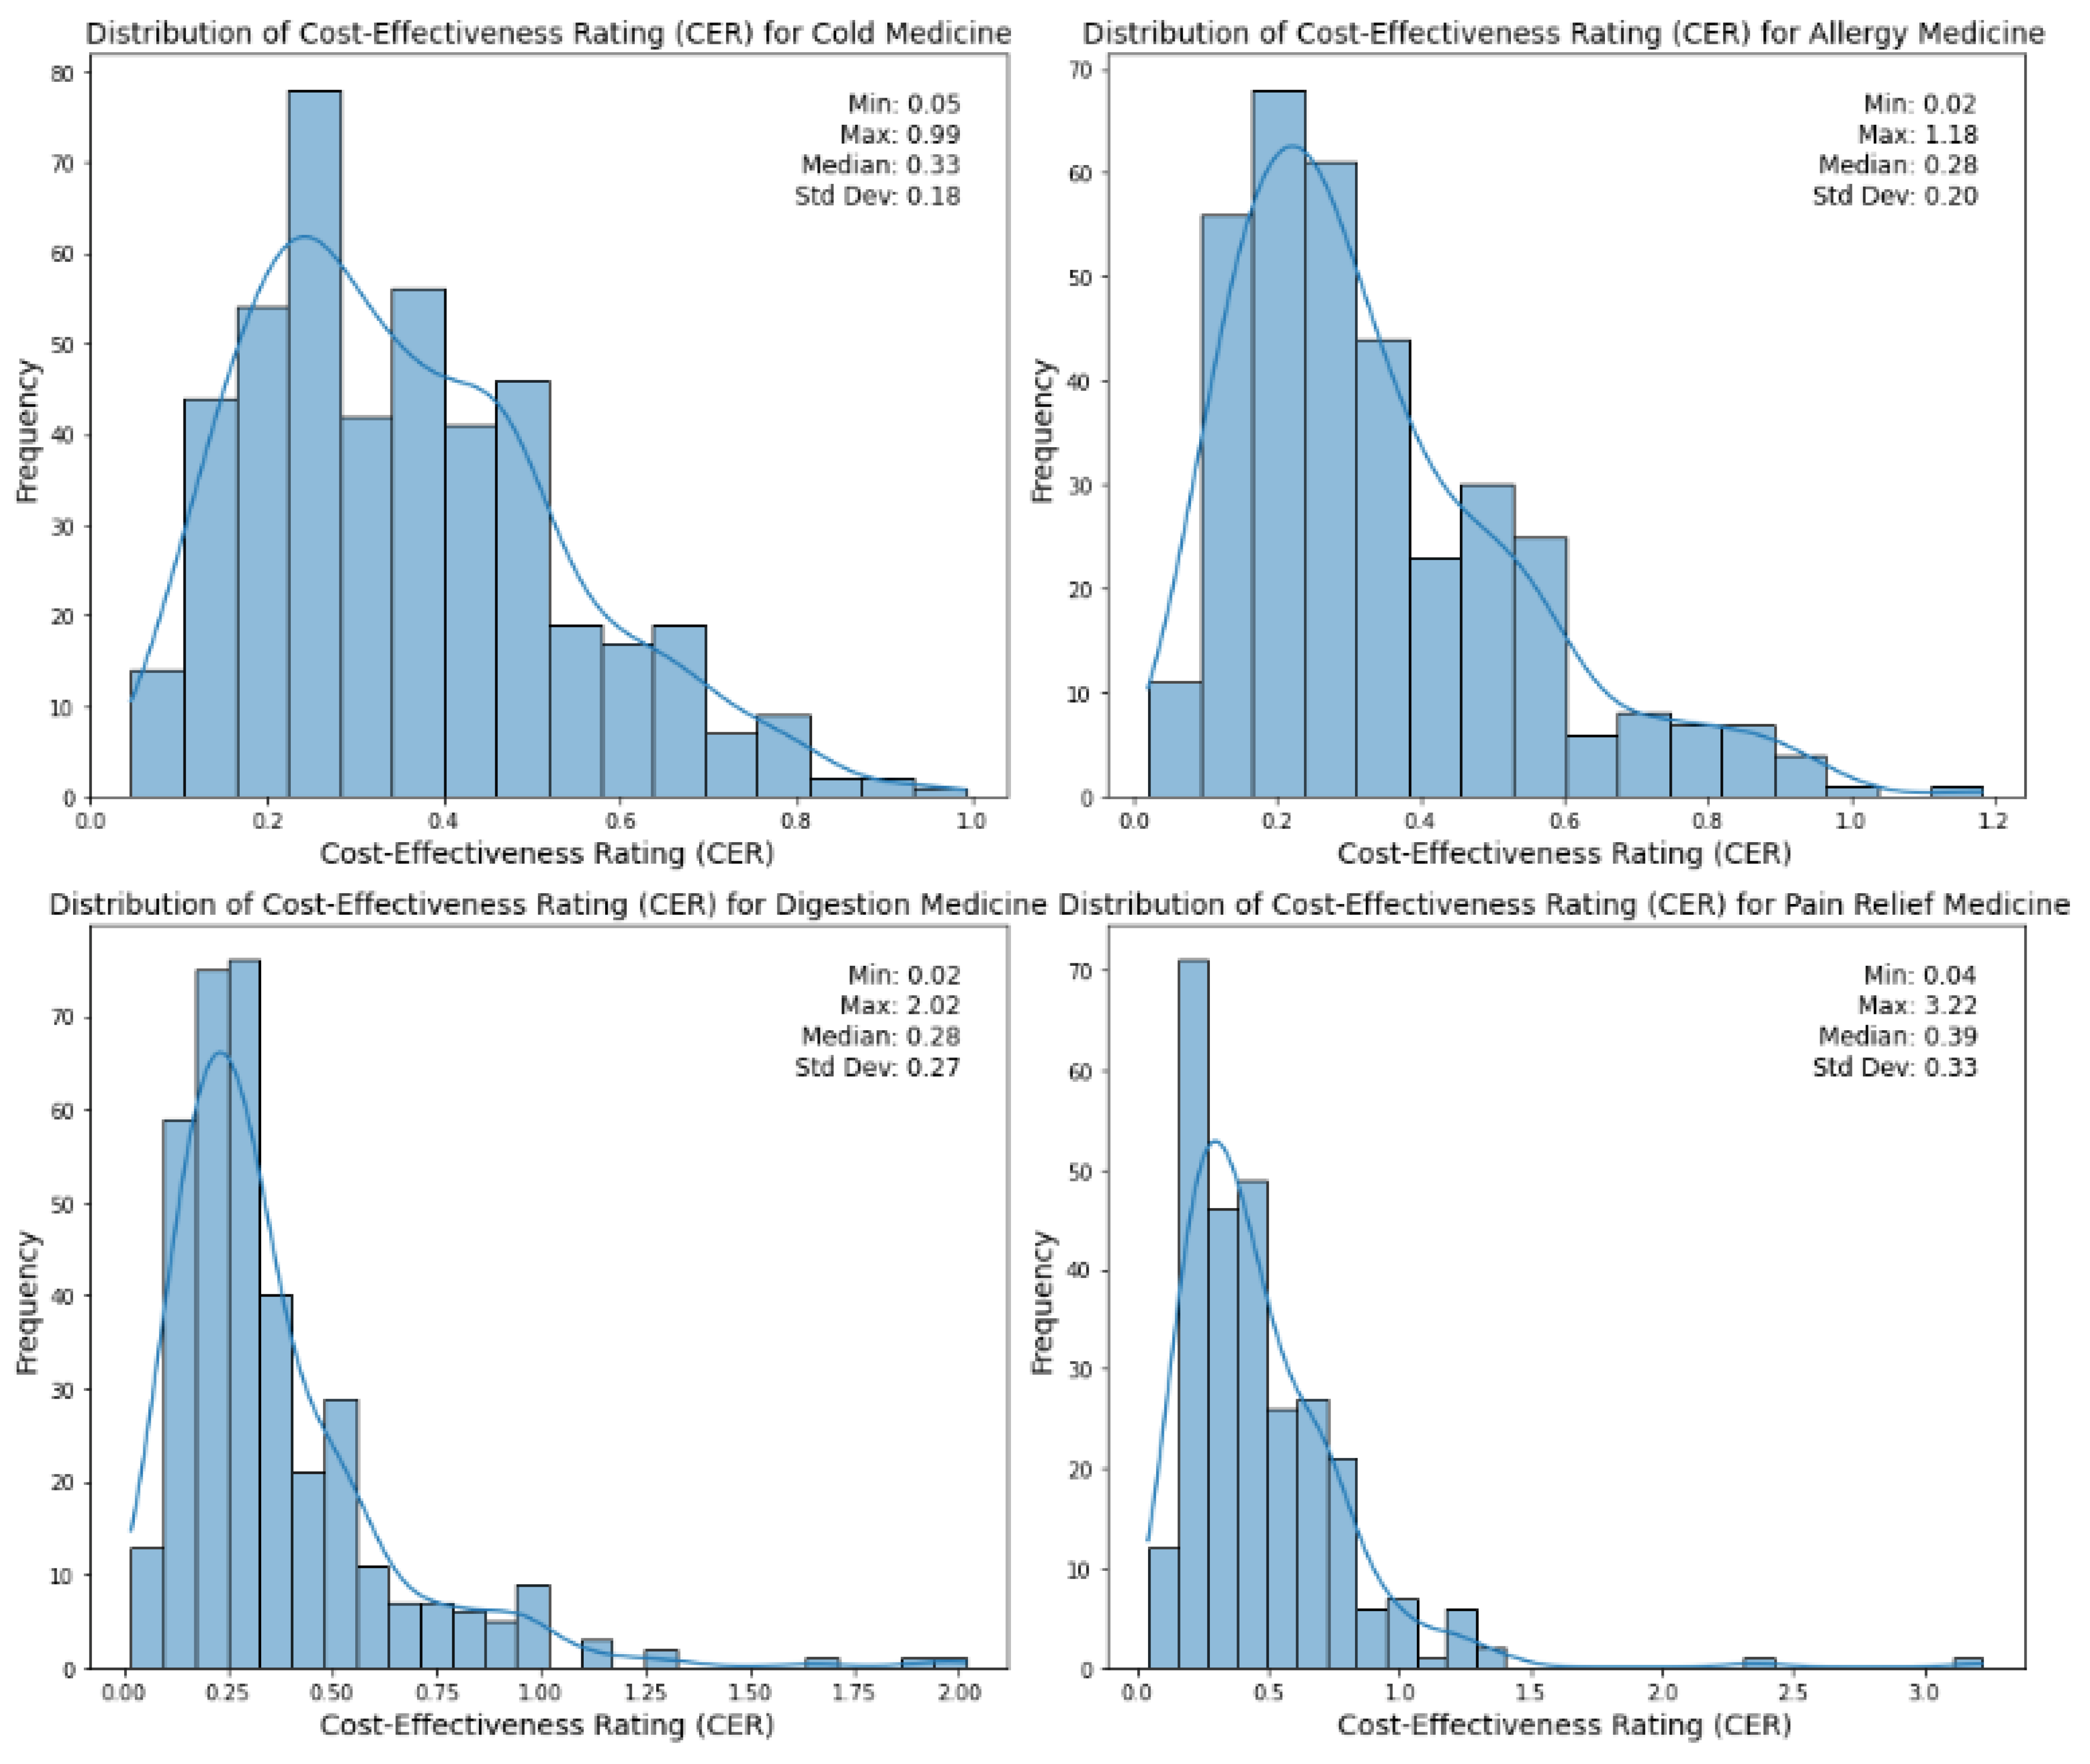
Figure 1.
Distribution of cost-effectiveness ratings (CERs) across medicine types.
Figure 1.
Distribution of cost-effectiveness ratings (CERs) across medicine types.
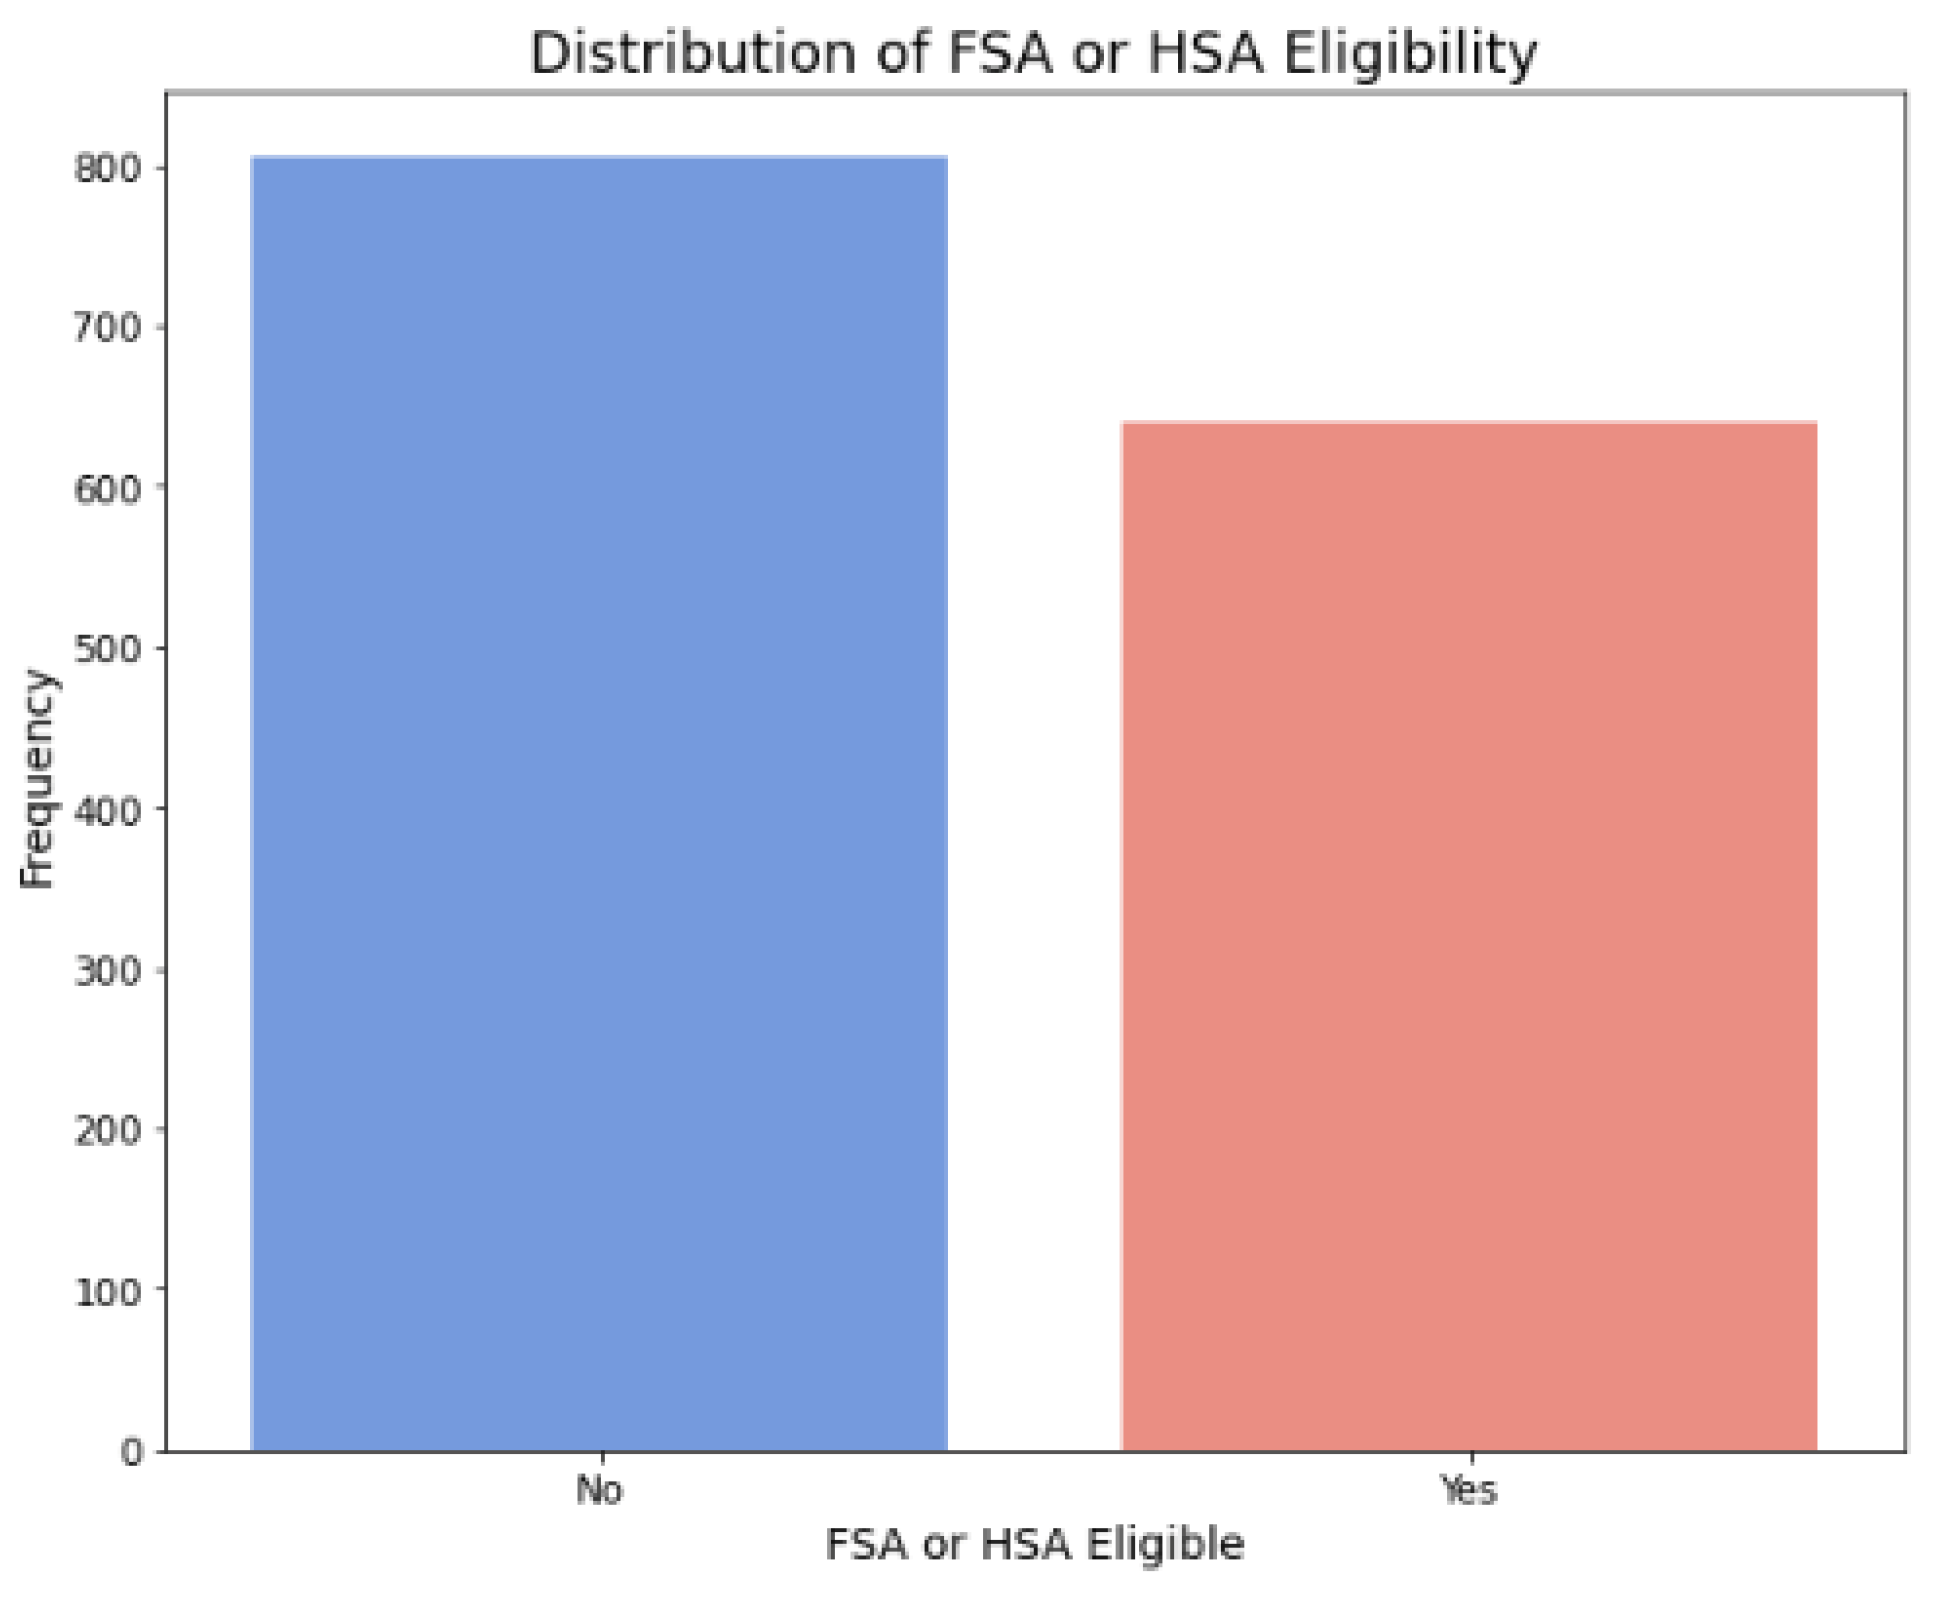
Figure 2.
Distribution of FSA or HSA eligibility.
Figure 2.
Distribution of FSA or HSA eligibility.
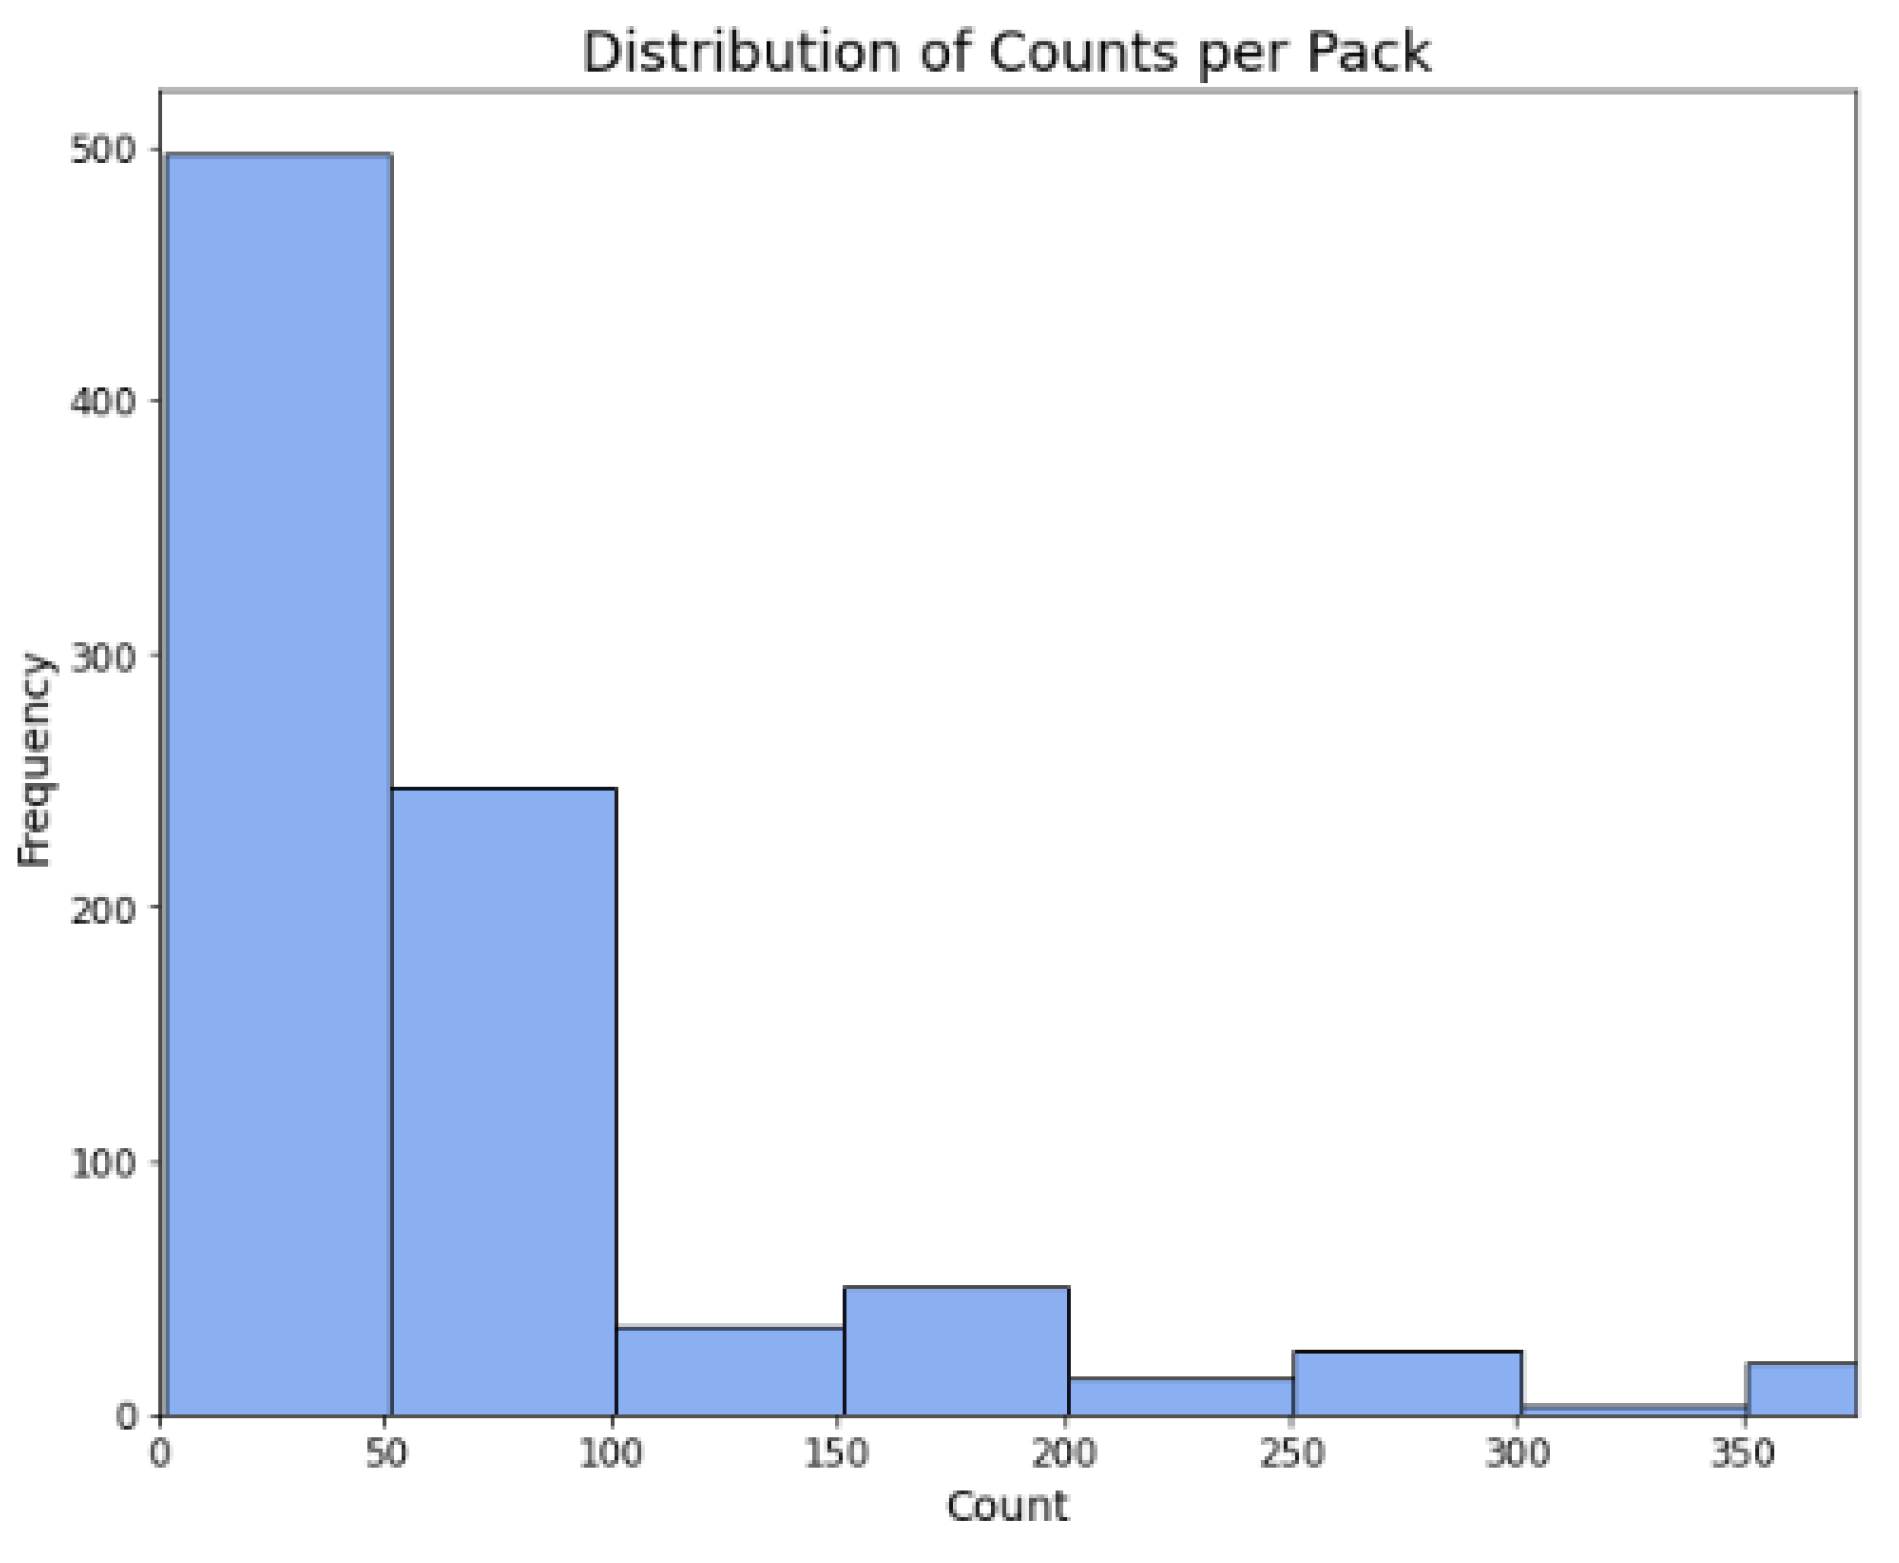
Figure 3.
Distribution of counts per pack.
Figure 3.
Distribution of counts per pack.
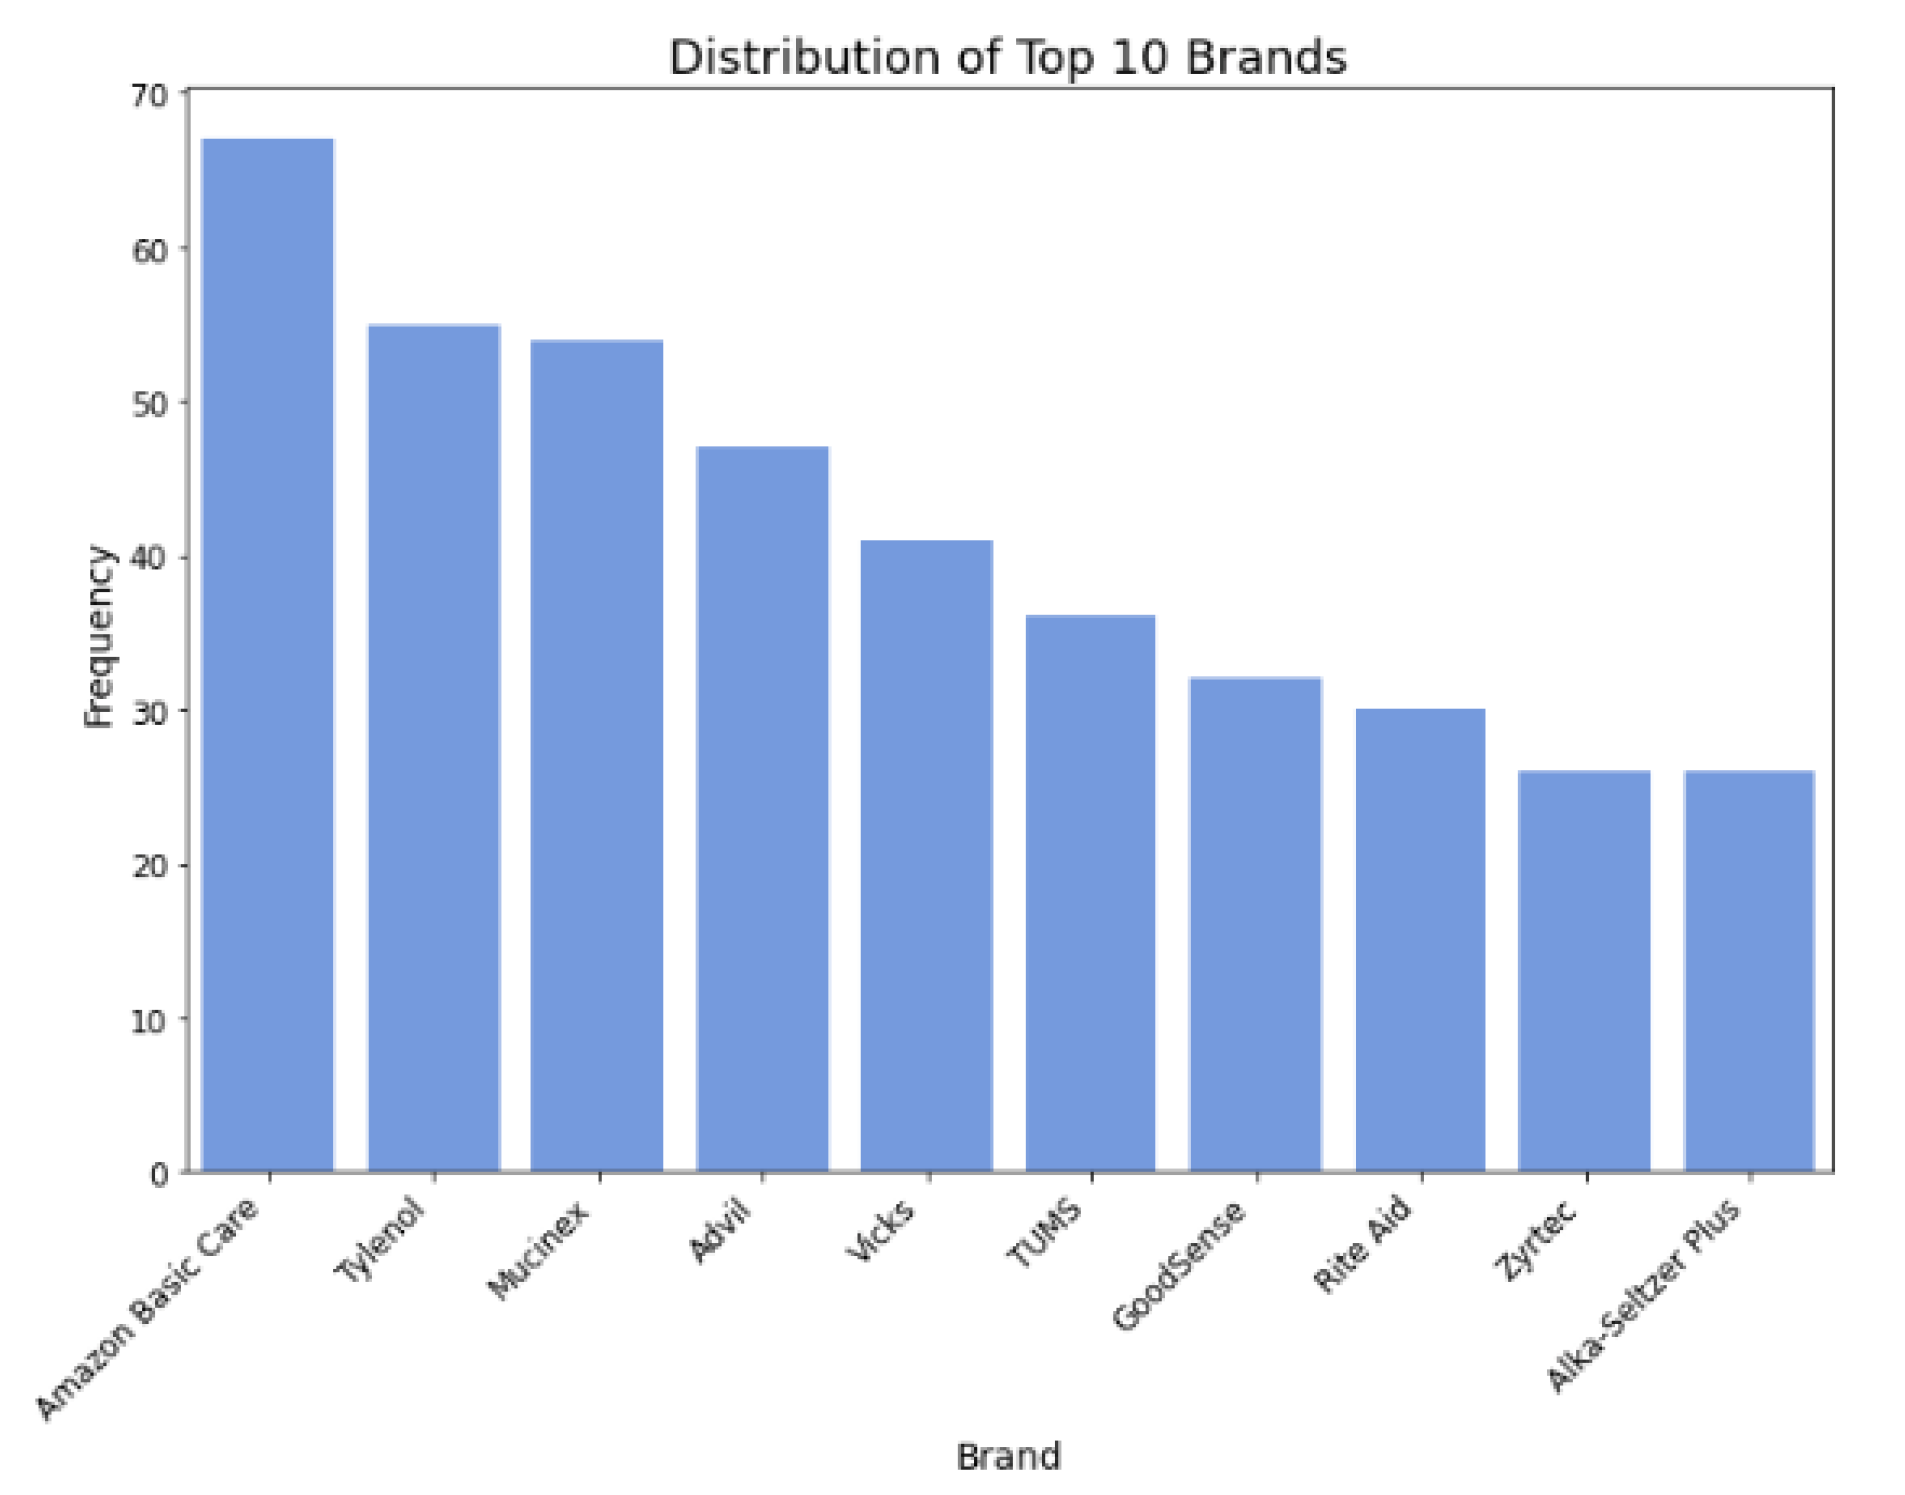
Figure 4.
Distribution of top 10 brands.
Figure 4.
Distribution of top 10 brands.
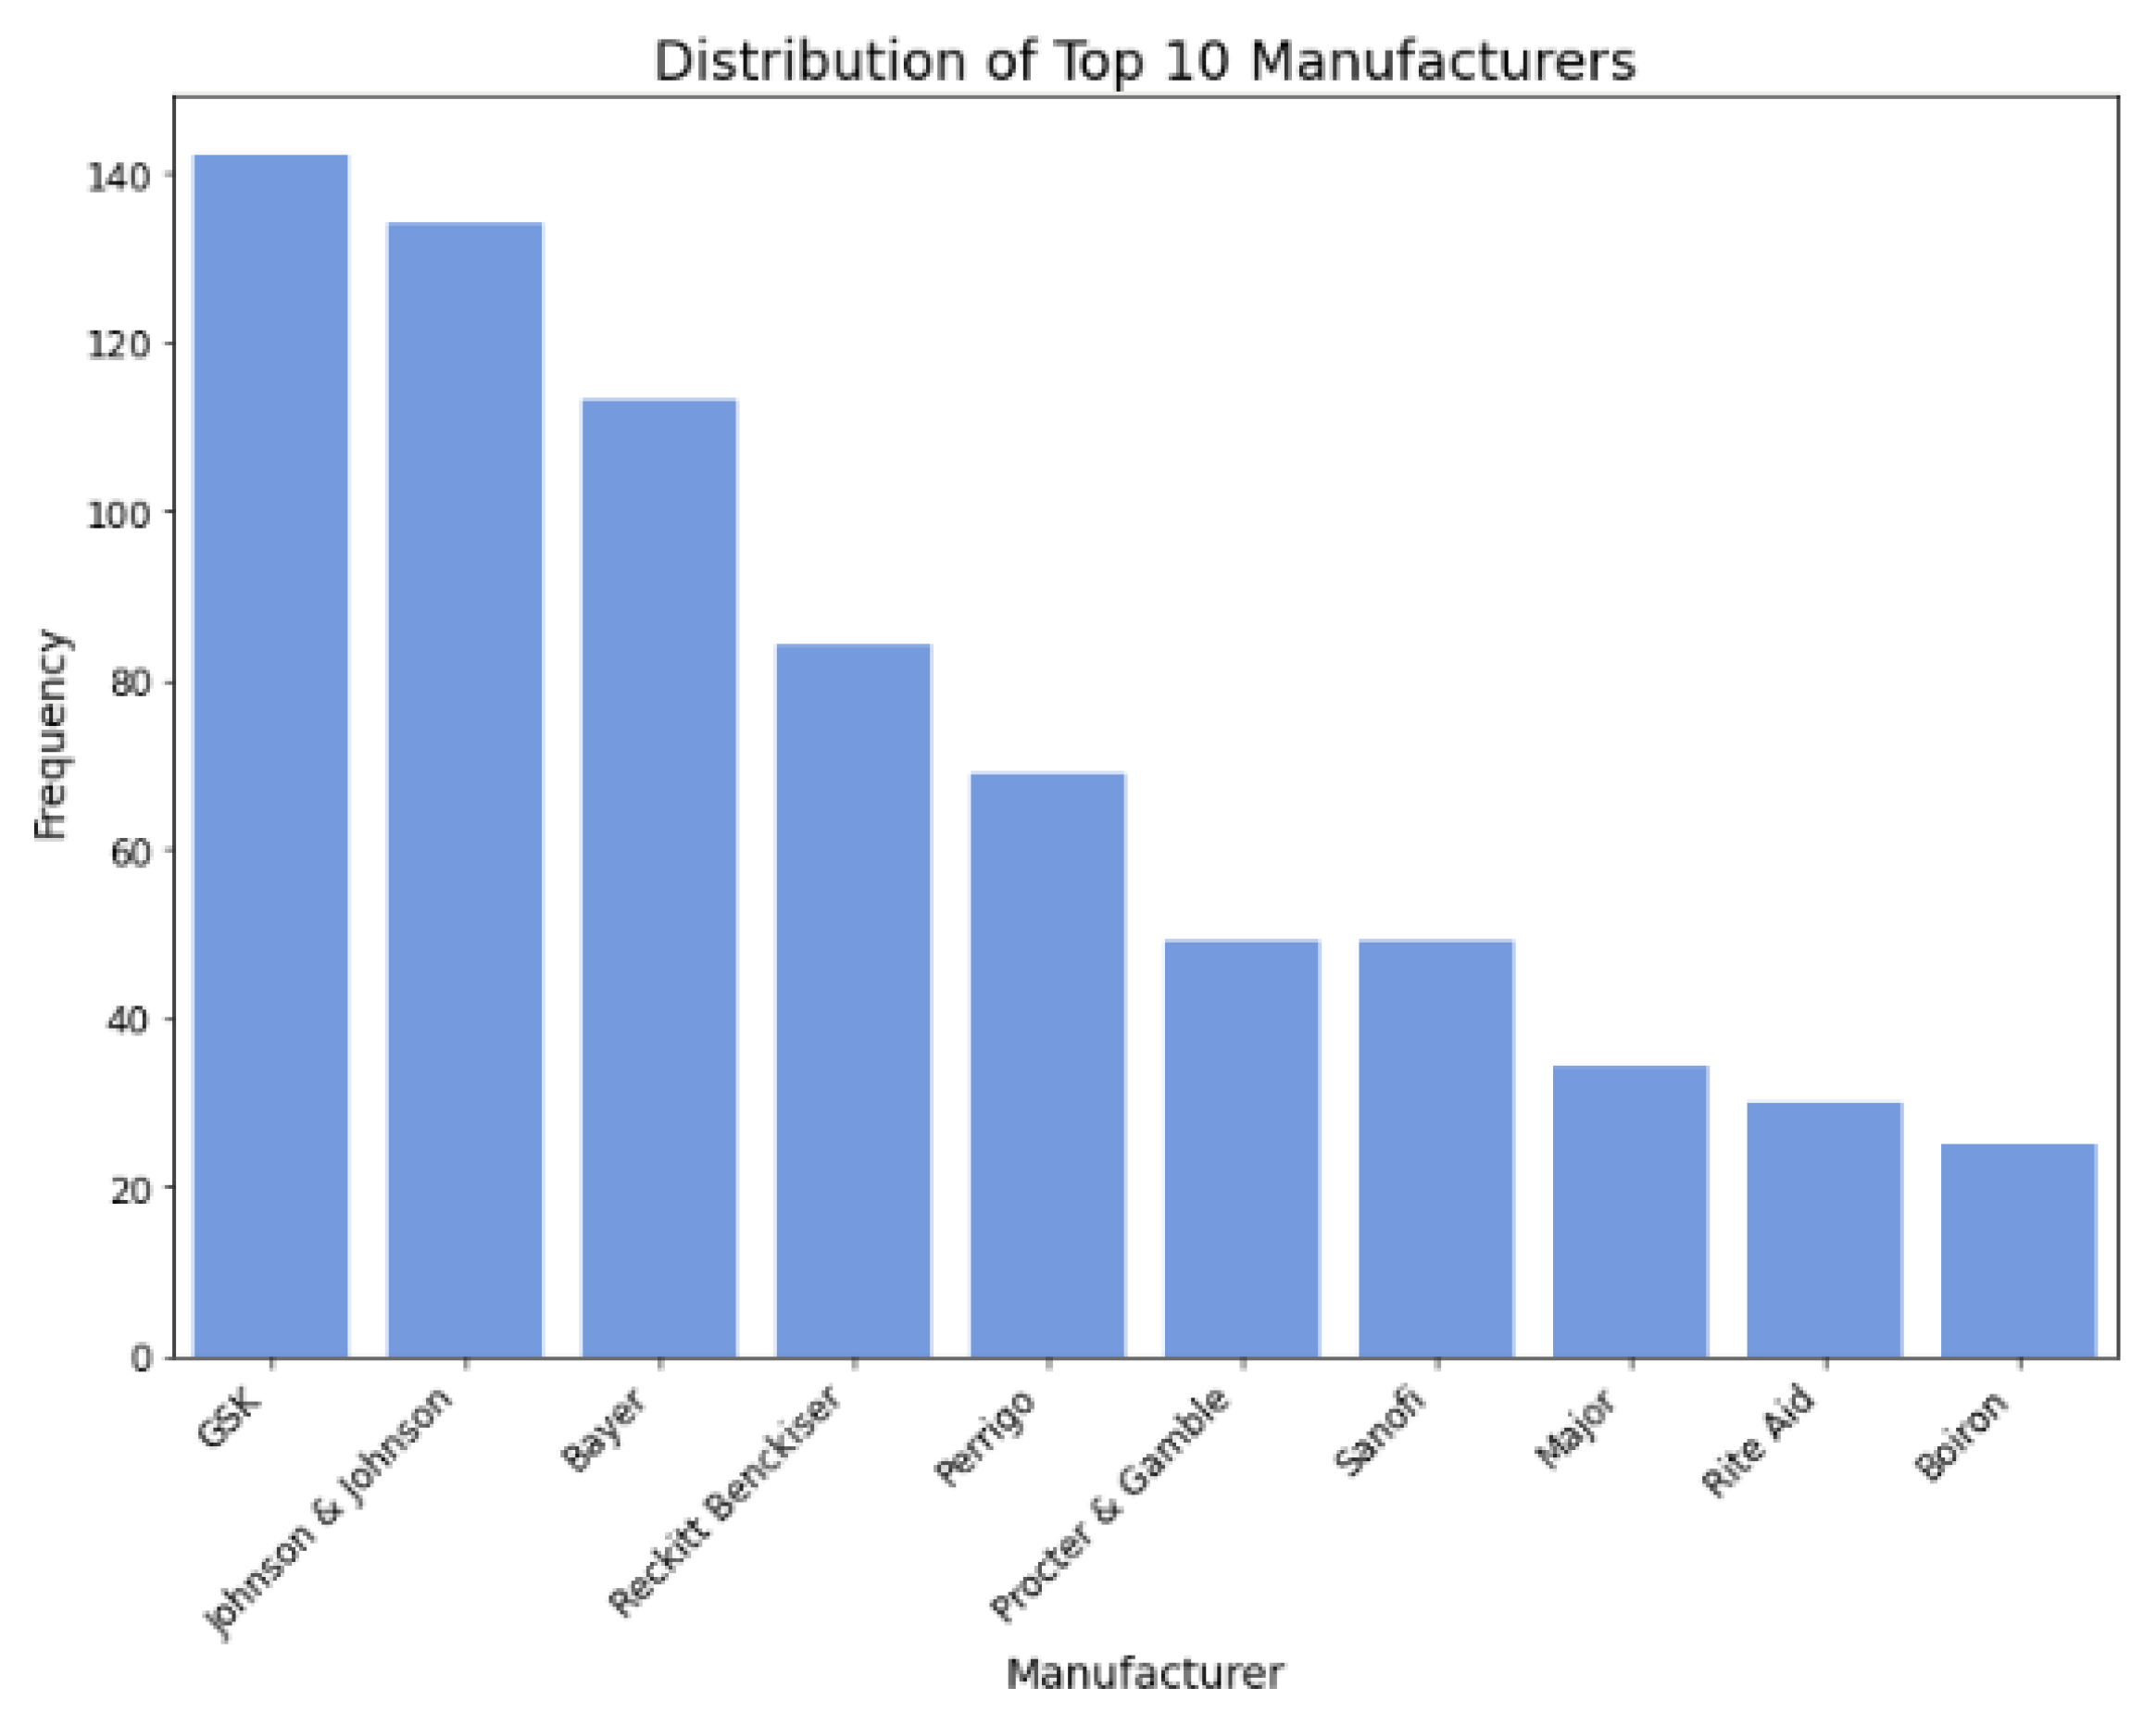
Figure 5.
Distribution of top 10 manufacturers.
Figure 5.
Distribution of top 10 manufacturers.
Figure 6.
Distribution of top 10 active ingredients.
Figure 6.
Distribution of top 10 active ingredients.
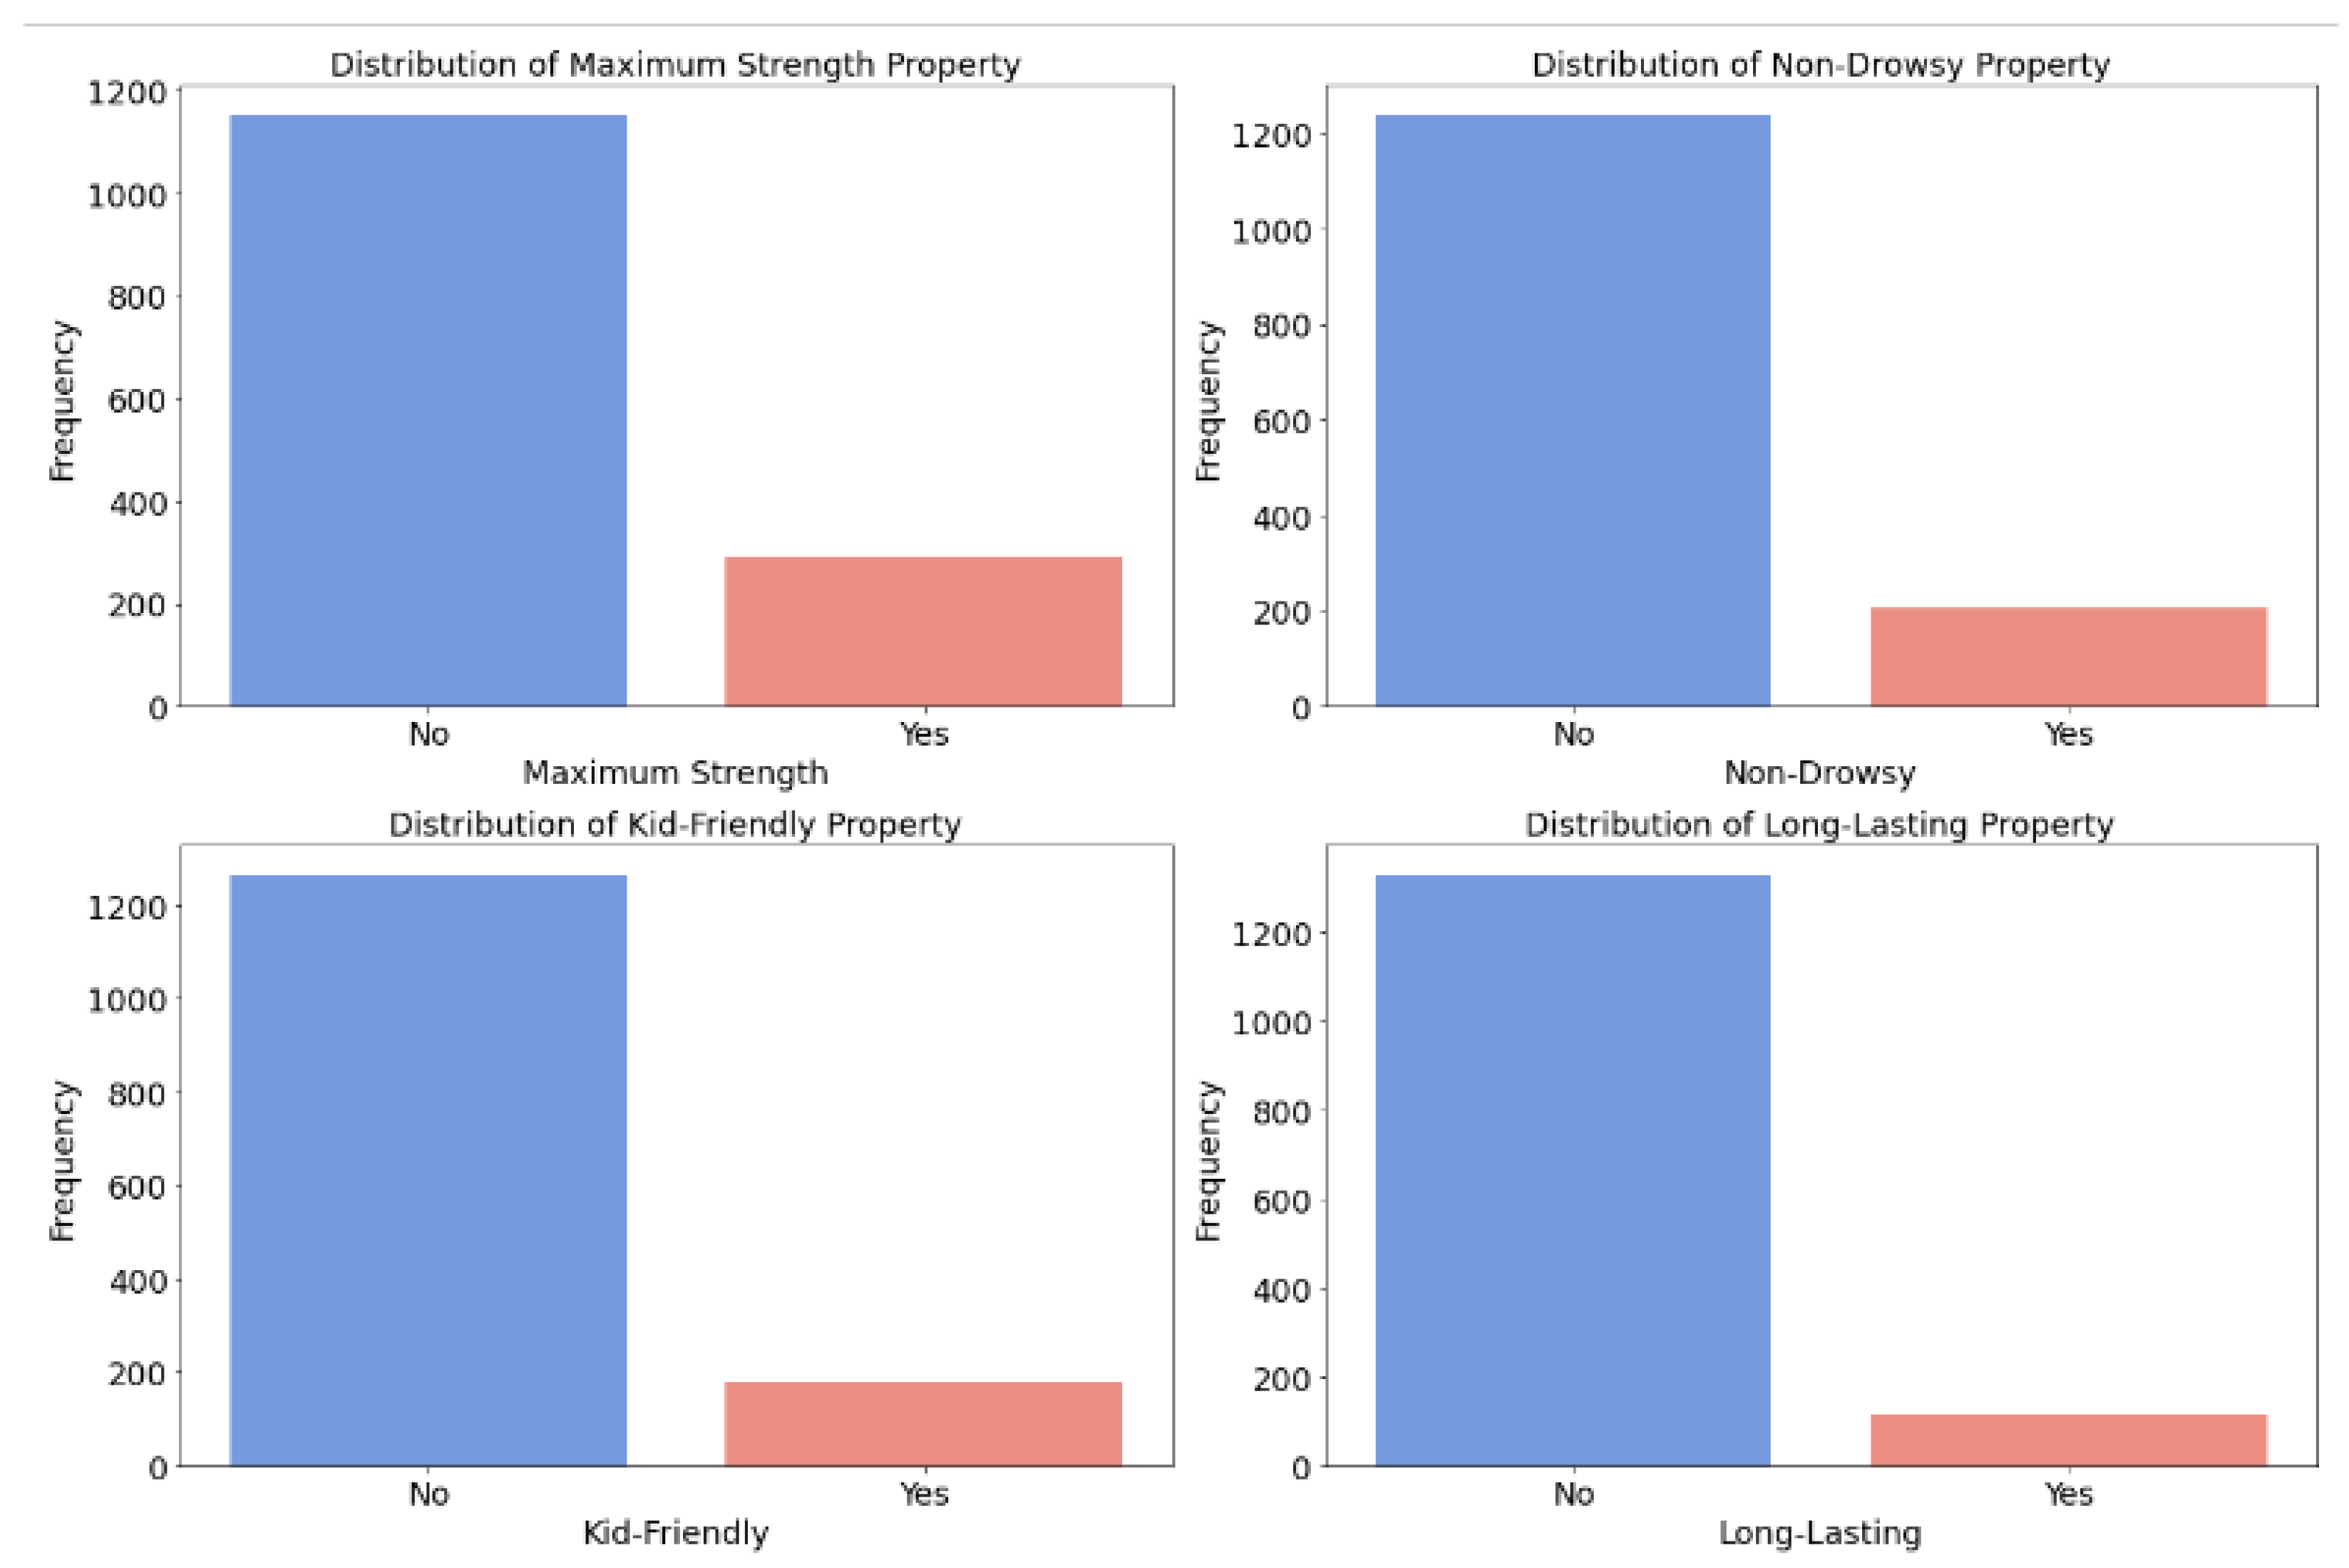
Figure 7.
Distribution of special effects (maximum strength/non-drowsy/kid-friendly/long-lasting).
Figure 7.
Distribution of special effects (maximum strength/non-drowsy/kid-friendly/long-lasting).
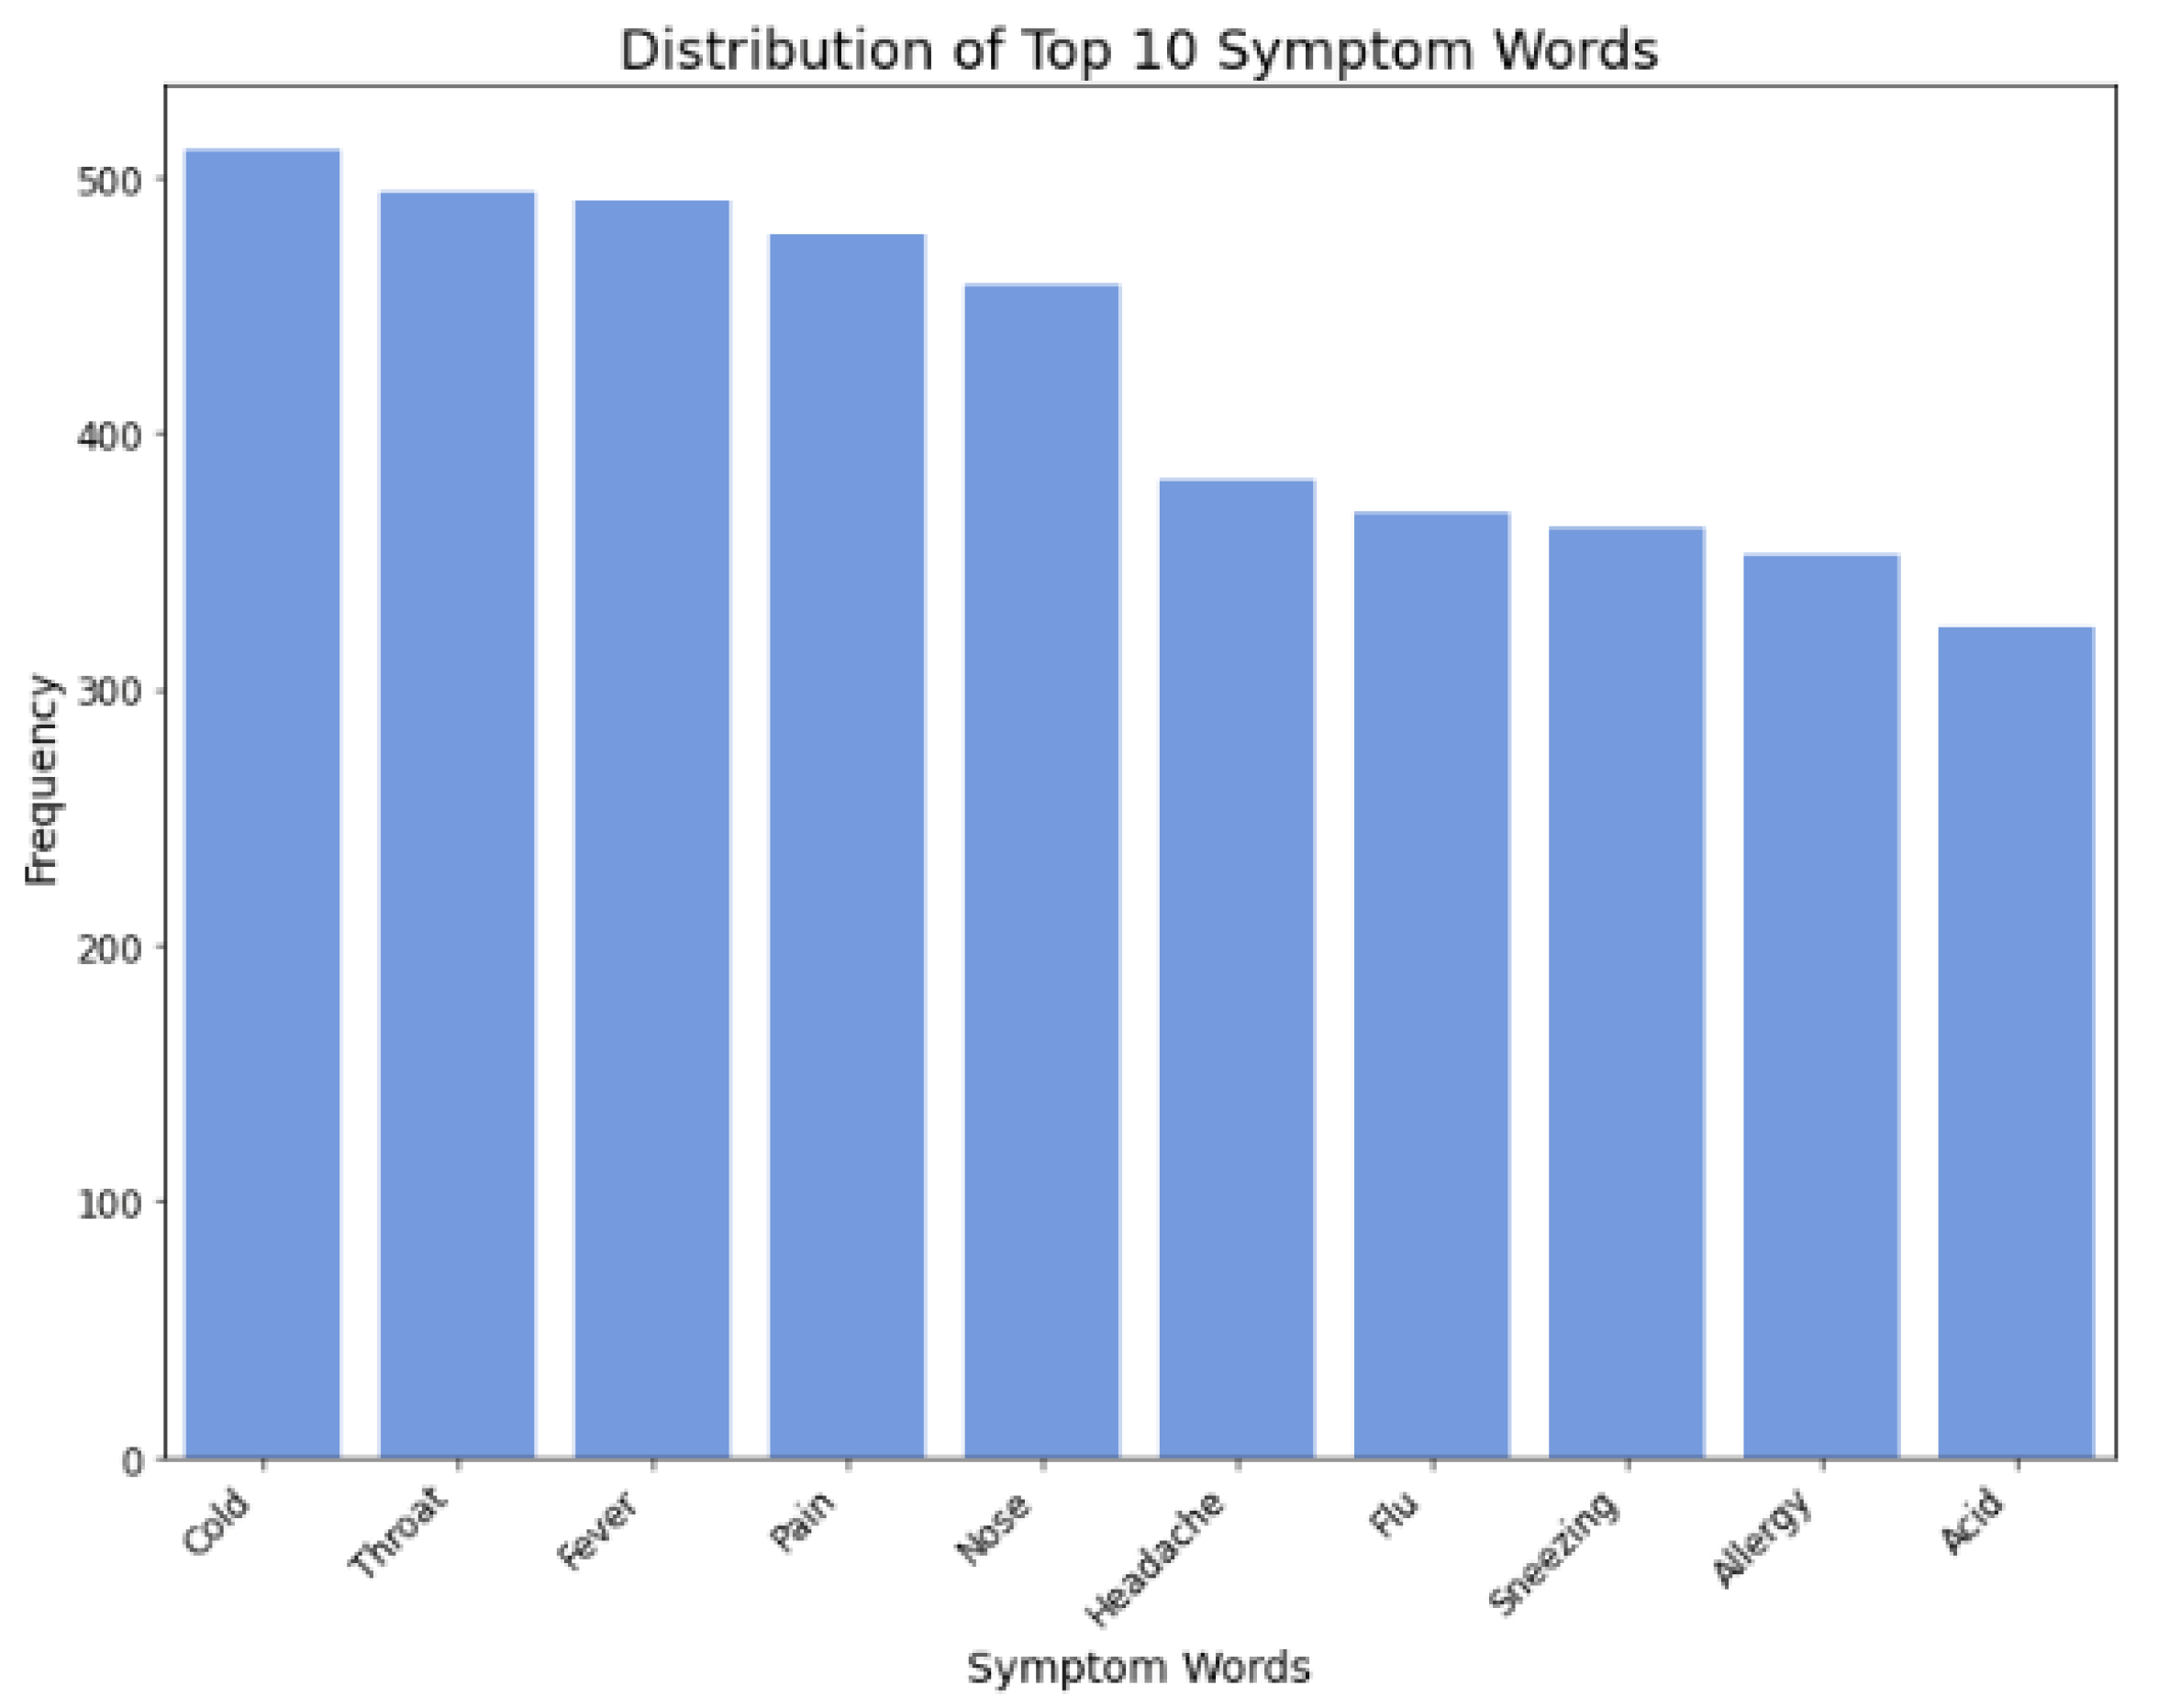
Figure 8.
Distribution of symptom words.
Figure 8.
Distribution of symptom words.
Figure 9.
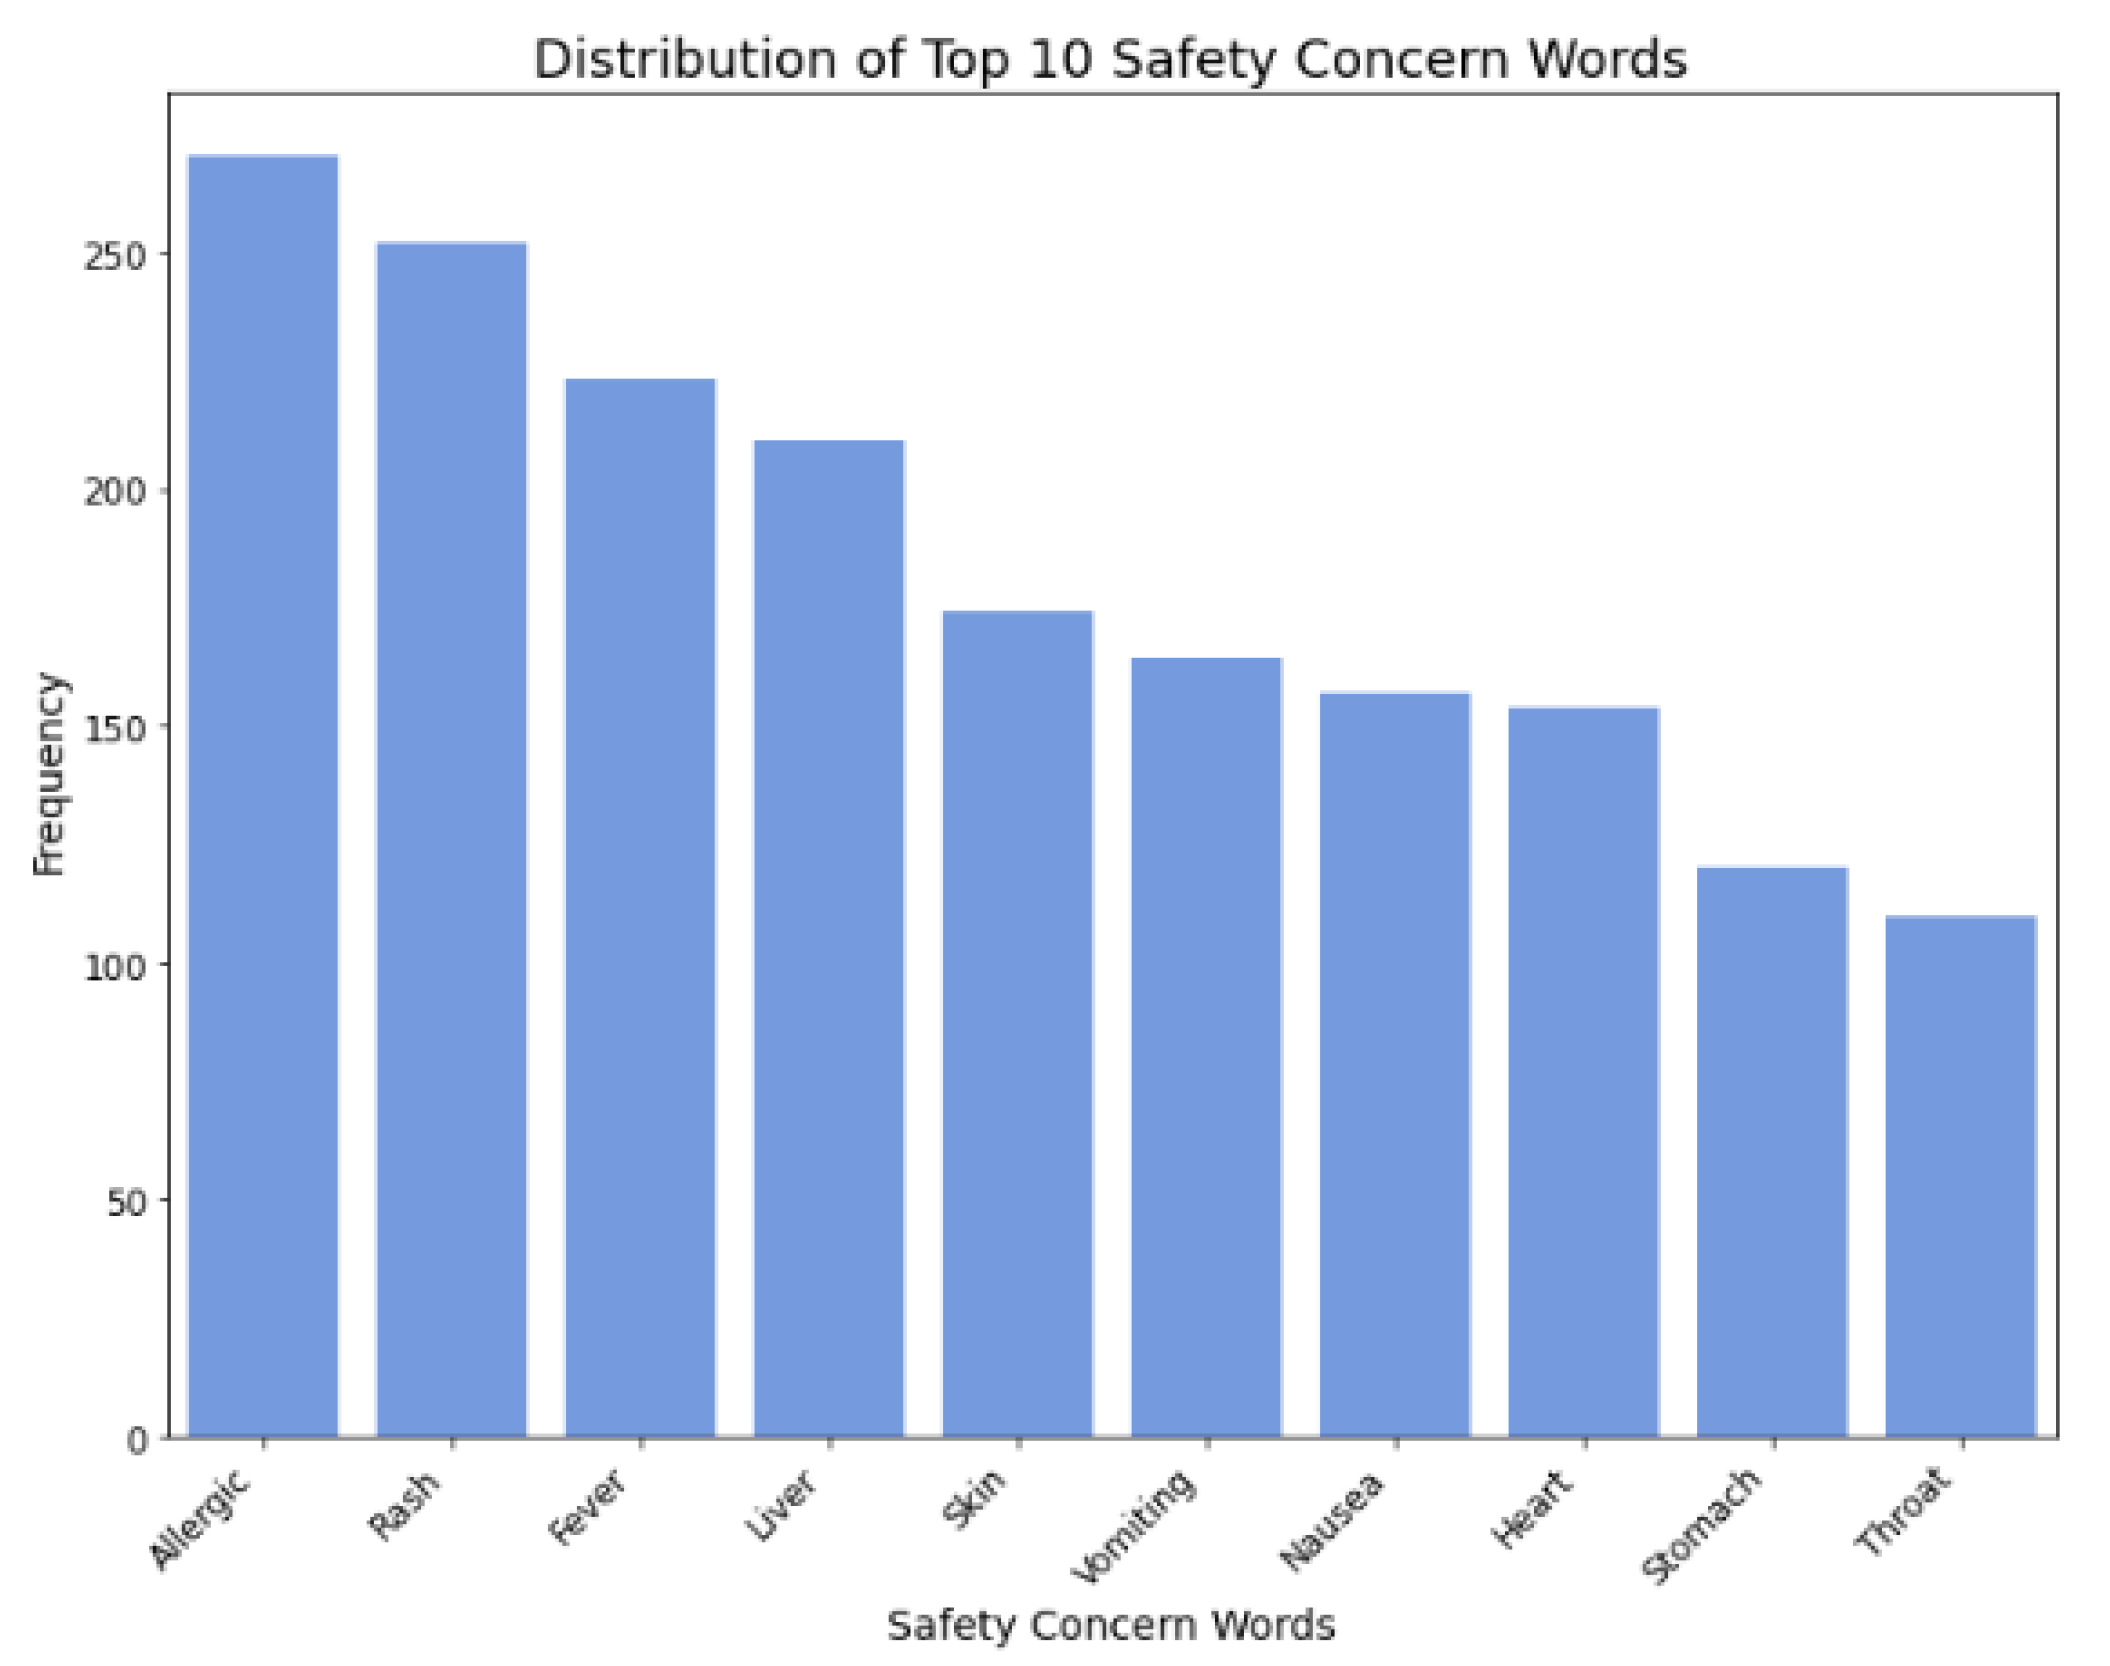
Distribution of safety concern words.
Figure 9.
Distribution of safety concern words.
Figure 10.
Cold medicine important factors impacting CER (SHAP).
Figure 10.
Cold medicine important factors impacting CER (SHAP).
Figure 11.
Allergy medicine important factors impacting CER (SHAP).
Figure 11.
Allergy medicine important factors impacting CER (SHAP).
Figure 12.
Digestion medicine important factors impacting CER (SHAP).
Figure 12.
Digestion medicine important factors impacting CER (SHAP).
Figure 13.
Pain relief medicine important factors impacting CER (SHAP).
Figure 13.
Pain relief medicine important factors impacting CER (SHAP).
Figure 14.
Directional impact of cold medicine factors on CER (logistic regression).
Figure 14.
Directional impact of cold medicine factors on CER (logistic regression).
Figure 15.
Directional impact of allergy medicine factors on cer (logistic regression).
Figure 15.
Directional impact of allergy medicine factors on cer (logistic regression).
Figure 16.
Directional impact of digestion medicine factors on CER (logistic regression).
Figure 16.
Directional impact of digestion medicine factors on CER (logistic regression).
Figure 17.
Directional impact of pain relief medicine factors on CER (logistic regression).
Figure 17.
Directional impact of pain relief medicine factors on CER (logistic regression).
Table 1.
Web crawled data for medicine items illustrated with an example.
Table 1.
Web crawled data for medicine items illustrated with an example.
| Column |
Value |
| Product Name |
DayQuil and NyQuil Combo Pack, Cold & Flu Medicine, Powerful Multi-Symptom Daytime And Nighttime Relief For Headache, Fever, Sore Throat, Cough, 72 Count, 48 DayQuil, 24 NyQuil Liquicaps |
| Price |
$22.99 |
| Rating |
4.80 |
| Number of Reviews |
7081 |
| % 5 Star Review |
86% |
| % 4 Star Review |
10% |
| % 3 Star Review |
3% |
| % 2 Star Review |
1% |
| % 1 Star Review |
1% |
| Size |
72 Count (Pack of 1) |
| Item Weight |
0.01 Ounces |
| Item Dimension |
4.38 x 3 x 3.38 inches |
| Product Dimension |
4.38 x 3 x 3.38 inches; 0.01 Ounces |
| FSA or HSA Eligible |
Yes |
| Brand |
Vicks |
| Manufacturer |
Procter & Gamble - HABA Hub |
| Ingredients |
DayQuil Cold & Flu Active Ingredients (In Each Liquicap): Acetaminophen 325 mg (Pain Reliever/Fever Reducer),Dextromethorphan HBr 10 mg (Cough Suppressant),Phenylephrine HCl 5 mg (Nasal Decongestant) Inactive Ingredients: FD&C Red No. 40,FD&C Yellow No. 6,Gelatin,...(See full list in original text)
|
| Special Feature |
Non-drowsy |
| Product Benefit |
Cough, Cold & Flu Relief, Sore Throat. Fever, & Congestion Relief |
| Special Use |
Cold, Cough, Sore Throat, Fever |
| About |
About this item-- FAST, POWERFUL MULTI-SYMPTOM RELIEF: Use non-drowsy DayQuil for daytime relief and at night try NyQuil for fast relief so you can rest EFFECTIVE COLD & FLU SYMPTOM RELIEF: DayQuil and NyQuil Cold & Flu medicine temporarily relieve common cold & flu symptoms FEEL BETTER FAST: Just one dose starts working fast...(See full description in original text)
|
| Item Description |
Knock your cold out with Vicks DayQuil and NyQuil SEVERE Cold & Flu Liquid medicine. Just one dose starts working fast to relieve 9 of your worst cold and flu symptoms, to help take you from 9 to none. From the world's #1 selling OTC cough and cold brand**, Vicks DayQuil and NyQuil SEVERE provide fast, powerful, maximum strength relief...(See full description in original text)
|
| Safety Information |
Safety Information DayQuil Cold & Flu: Liver warning: This product contains acetaminophen. Severe liver damage may occur if you take: • More than 4 doses in 24 hours, which is the maximum daily amount for this product • Other drugs containing acetaminophen • 3 or more alcoholic drinks every day while using this product. Sore throat warning: If sore throat is severe...(see full safety information in original text)
|
| Directions |
Take only as directed--see Overdose warning. Do not exceed 4 doses per 24 hours. Adults and children 12 years and over: 2 LiquiCaps with water every 4 hours…(See full directions in original text)
|
| ASIN |
B00796NI1Q |
| Link |
https://www.amazon.com/Vicks-Medicine-Multi-Symptom-Nighttime-Liquicaps/dp/B00796NI1Q/ref=sr_1_22?c=ts&keywords=Cold+%26+Flu+Medicine&qid=1699298540&refinements=p_85%3A2470955011&refresh=1&rps=1&s=hpc&sr=1-22&ts_id=3761171 |
Table 2.
Overview of features.
Table 2.
Overview of features.
| Feature Category |
Feature |
Explanation |
Feature Type |
| FSA or HSA Eligible |
FSA or HSA Eligible |
Indicates if the medicine item is Flexible Spending Account (FSA) or Health Savings Account (HSA) Eligible (Yes/No) |
Binary |
| Size |
Counts per Pack |
Indicates if the counts per pack belong to Lowest/Low/High/Highest quantile |
Binary |
| Weight |
Indicates if the Weight of the item (in ounces) belong to Lowest/Low/High/Highest quantile |
Binary |
| Inches |
Indicates if the Dimensions of the item (in inches) belong to Lowest/Low/High/Highest quantile |
Binary |
| Brand |
Brand |
Indicates the brand of the item (Yes for corresponding one-hot encoded brand column, No for others) |
Binary |
| Manufacturer |
Manufacturer |
Indicates the manufacturer of the item (Yes for corresponding one-hot encoded manufacturer column, No for others) |
Binary |
| Ingredients |
Active Ingredients |
Indicates the presence of active ingredients (Yes for corresponding one-hot encoded ingredient columns, No if ingredient is absent) |
Binary |
| Special Effect |
Fast-Acting |
Indicates if the item qualifies as fast-acting property |
Binary |
| Long-Lasting |
Indicates if the item qualifies as long-lasting property |
Binary |
| Maximum Strength |
Indicates if the item has maximum strength property |
Binary |
| Non-Drowsy |
Indicates if the item qualifies as non-drowsy property |
Binary |
| Kid-Friendly |
Indicates if the item qualifies as kid-friendly property |
Binary |
| Symptom Treats |
Symptom Treats Count |
Number of symptom words this medicine item treats |
Numerical |
| Safety Warnings |
Safety Warning Count |
Number of safety concern words this medicine item has |
Numerical |
Table 3.
Cold medicine performance metrics of machine learning classifiers using 5-fold cross-validation.
Table 3.
Cold medicine performance metrics of machine learning classifiers using 5-fold cross-validation.
| |
ROC-AUC |
Accuracy |
Precision |
Recall |
F1-Score |
| Random Forest (RF) |
0.7428 ± 0.0863 |
0.6897 ± 0.0743 |
0.7076 ± 0.0914 |
0.6667 ± 0.1849 |
0.6703 ± 0.1142 |
| XGBoost (XGB) |
0.7256 ± 0.0886 |
0.6853 ± 0.0723 |
0.7026 ± 0.0797 |
0.6533 ± 0.1798 |
0.6619 ± 0.1186 |
| Logistic Regression (LR) |
0.7064 ± 0.0867 |
0.6364 ± 0.0844 |
0.6386 ± 0.1037 |
0.6311 ± 0.2092 |
0.6188 ± 0.1320 |
| Linear Discriminant Analysis (LDA) |
0.7030 ± 0.0831 |
0.6187 ± 0.0674 |
0.6151 ± 0.0613 |
0.6178 ± 0.1888 |
0.6046 ± 0.1108 |
| Multi-Layer Perceptron (MLP) |
0.6843 ± 0.0650 |
0.6322 ± 0.0825 |
0.6304 ± 0.0790 |
0.7200 ± 0.1719 |
0.6560 ± 0.0791 |
| Gaussian Naïve Bayes (GNB) |
0.6473 ± 0.0483 |
0.5675 ± 0.0568 |
0.6456 ± 0.1173 |
0.2844 ± 0.1074 |
0.3880 ± 0.1127 |
| K-Nearest Neighbors (KNN) |
0.6351 ± 0.0612 |
0.5944 ± 0.0702 |
0.6276 ± 0.1004 |
0.5422 ± 0.2064 |
0.5541 ± 0.1196 |
| Decision Tree (DT) |
0.6252 ± 0.0527 |
0.6322 ± 0.0557 |
0.6386 ± 0.1037 |
0.6311 ± 0.2092 |
0.6188 ± 0.1320 |
Table 4.
Allergy medicine performance metrics of machine learning classifiers using 5-fold cross-validation.
Table 4.
Allergy medicine performance metrics of machine learning classifiers using 5-fold cross-validation.
| |
ROC-AUC |
Accuracy |
Precision |
Recall |
F1-Score |
| Logistic Regression (LR) |
0.7548 ± 0.045 |
0.6793 ± 0.054 |
0.6859 ± 0.082 |
0.6997 ± 0.099 |
0.6849 ± 0.049 |
| Linear Discriminant Analysis (LDA) |
0.7449 ± 0.044 |
0.6480 ± 0.050 |
0.6630 ± 0.070 |
0.6373 ± 0.131 |
0.6394 ± 0.065 |
| Multi-Layer Perceptron (MLP) |
0.7269 ± 0.023 |
0.6734 ± 0.038 |
0.6569 ± 0.030 |
0.7278 ± 0.086 |
0.6884 ± 0.045 |
| Random Forest (RF) |
0.7223 ± 0.037 |
0.6736 ± 0.053 |
0.6730 ± 0.068 |
0.6994 ± 0.064 |
0.6823 ± 0.043 |
| XGBoost |
0.7160 ± 0.054 |
0.6679 ± 0.051 |
0.6780 ± 0.068 |
0.6598 ± 0.084 |
0.6641 ± 0.053 |
| Gaussian Naïve Bayes (GNB) |
0.7158 ± 0.013 |
0.5738 ± 0.044 |
0.7340 ± 0.179 |
0.2503 ± 0.103 |
0.3596 ± 0.109 |
| Decision Tree (DT) |
0.6131 ± 0.058 |
0.6137 ± 0.053 |
0.6219 ± 0.056 |
0.5798 ± 0.077 |
0.5988 ± 0.061 |
| K-Nearest Neighbors (KNN) |
0.6044 ± 0.069 |
0.5828 ± 0.066 |
0.6153 ± 0.105 |
0.5002 ± 0.068 |
0.5454 ± 0.056 |
Table 5.
Digestion medicine performance metrics of machine learning classifiers using 5-fold cross-validation.
Table 5.
Digestion medicine performance metrics of machine learning classifiers using 5-fold cross-validation.
| |
ROC-AUC |
Accuracy |
Precision |
Recall |
F1-Score |
| Random Forest (RF) |
0.7081 ± 0.071 |
0.6641 ± 0.035 |
0.7008 ± 0.075 |
0.6323 ± 0.155 |
0.6455 ± 0.058 |
| XGBoost |
0.7023 ± 0.046 |
0.6587 ± 0.045 |
0.6848 ± 0.082 |
0.6547 ± 0.125 |
0.6535 ± 0.044 |
| Logistic Regression (LR) |
0.7004 ± 0.062 |
0.6150 ± 0.059 |
0.6254 ± 0.069 |
0.6335 ± 0.063 |
0.6233 ± 0.022 |
| Linear Discriminant Analysis (LDA) |
0.6777 ± 0.070 |
0.6178 ± 0.076 |
0.6220 ± 0.076 |
0.6505 ± 0.034 |
0.6328 ± 0.044 |
| Gaussian Naïve Bayes (GNB) |
0.6410 ± 0.027 |
0.5494 ± 0.051 |
0.5410 ± 0.048 |
0.8243 ± 0.109 |
0.6455 ± 0.020 |
| K-Nearest Neighbors (KNN) |
0.6351 ± 0.088 |
0.5604 ± 0.074 |
0.6031 ± 0.105 |
0.3974 ± 0.115 |
0.4680 ± 0.102 |
| Multi-Layer Perceptron (MLP) |
0.6351 ± 0.088 |
0.6148 ± 0.054 |
0.5773 ± 0.036 |
0.8743 ± 0.051 |
0.6947 ± 0.036 |
| Decision Tree (DT) |
0.6018 ± 0.059 |
0.5986 ± 0.052 |
0.6030 ± 0.060 |
0.6114 ± 0.049 |
0.6043 ± 0.037 |
Table 6.
Pain relief medicine performance metrics of machine learning classifiers using 5-fold cross-validation.
Table 6.
Pain relief medicine performance metrics of machine learning classifiers using 5-fold cross-validation.
| |
ROC-AUC |
Accuracy |
Precision |
Recall |
F1-Score |
| Random Forest (RF) |
0.8022 ± 0.050 |
0.7576 ± 0.055 |
0.7748 ± 0.072 |
0.7185 ± 0.069 |
0.7433 ± 0.056 |
| Linear Discriminant Analysis (LDA) |
0.7884 ± 0.063 |
0.7432 ± 0.066 |
0.7543 ± 0.093 |
0.7259 ± 0.050 |
0.7363 ± 0.055 |
| Logistic Regression (LR) |
0.7874 ± 0.064 |
0.7179 ± 0.076 |
0.7326 ± 0.098 |
0.6889 ± 0.055 |
0.7070 ± 0.065 |
| Gaussian Naïve Bayes (GNB) |
0.7867 ± 0.061 |
0.6594 ± 0.082 |
0.8042 ± 0.148 |
0.3852 ± 0.127 |
0.5168 ± 0.145 |
| XGBoost |
0.7577 ± 0.055 |
0.7286 ± 0.058 |
0.7240 ± 0.066 |
0.7259 ± 0.065 |
0.7235 ± 0.057 |
| Multi-Layer Perceptron (MLP) |
0.7139 ± 0.091 |
0.6598 ± 0.084 |
0.6337 ± 0.072 |
0.7407 ± 0.105 |
0.6798 ± 0.075 |
| K-Nearest Neighbors (KNN) |
0.6542 ± 0.030 |
0.5869 ± 0.024 |
0.5817 ± 0.027 |
0.5556 ± 0.081 |
0.5652 ± 0.049 |
| Decision Tree (DT) |
0.6373 ± 0.039 |
0.6378 ± 0.040 |
0.6450 ± 0.065 |
0.6000 ± 0.049 |
0.6186 ± 0.034 |
Table 7.
Chi-square test results for statistically significant active ingredient percentage difference in cold medicines with and without safety warnings (P-value < 0.05).
Table 7.
Chi-square test results for statistically significant active ingredient percentage difference in cold medicines with and without safety warnings (P-value < 0.05).
| Active Ingredient |
Chi-Square Statistic |
P-value |
Item Count |
| Dextromethorphan |
41.3911 |
1.25E-10 |
131 |
| Acetaminophen |
40.7375 |
1.74E-10 |
112 |
| Phenylephrine |
35.3099 |
2.81E-09 |
106 |
| Guaifenesin |
5.9919 |
1.44E-02 |
85 |
| Doxylamine |
39.091 |
4.05E-10 |
40 |
| Hydrobromide |
17.634 |
2.68E-05 |
32 |
| Bryonia |
5.4334 |
1.98E-02 |
23 |
| Phosphorus |
3.9605 |
4.66E-02 |
17 |
| Gelsemium |
5.9838 |
1.44E-02 |
15 |
| Ipecacuanha |
4.4107 |
3.57E-02 |
14 |
| Eupatorium |
8.8677 |
2.90E-03 |
13 |
| Perfoliatum |
6.9362 |
8.45E-03 |
12 |
Table 8.
Comparison of manufacturer-based cost-effectiveness for allergy medicine.
Table 8.
Comparison of manufacturer-based cost-effectiveness for allergy medicine.
| Manufacturer |
Average Price |
Average Rating |
Average CER |
| Johnson & Johnson |
12.4 |
4.68 |
0.47 |
| Bayer |
19.68 |
4.57 |
0.35 |
| Sanofi |
11.74 |
4.71 |
0.51 |
| Major |
25.66 |
4.72 |
0.22 |
| Perrigo |
22.55 |
4.73 |
0.3 |
