1. Introduction
Pneumonia[
1] ranks as a significant cause of death among children worldwide. Annually, approximately 1.4 million children succumb to pneumonia, constituting 18% of all child deaths under the age of five. Furthermore, around two billion people globally experience pneumonia each year[
2].Pneumonia presents as a serious respiratory infection with common occurrences. It poses heightened risks for both young children and older adults. Measures are being implemented by authorities to alleviate the burden of pneumonia, including enhancements in vaccination coverage and facilitating improved access to treatment. Currently, the most effective method for diagnosing pneumonia is through a chest X-ray[
3].Pneumonia, specifically, manifests as a highly contagious and life-threatening disease that impacts millions of individuals, especially those aged 65 and above, who may already be managing chronic health issues like asthma[
4] or diabetes[
5].The interpretation of a chest X-ray, particularly in instances of pneumonia, can be misleading due to the potential resemblance of symptoms with other issues such as congestive heart failure [
6] and lung scarring.In the context of a shortage of radiologists, and considering the time constraints and potential accuracy issues associated with their predictions, we have implemented a pneumonia detection model to achieve precise pneumonia predictions[
7] in a shorter duration. The accuracy of the chest X-ray[
8] model surpasses that of radiologists. The model operates on the chexnet architecture[
9], utilizing chest X-ray images as input and generating pneumonia predictions as output. The model is trained on a chest X-ray dataset focused on pneumonia[
10], organized into three folders (train, test, val) with subfolders for each image category (Pneumonia/Normal). The datasett comprises 5,863 X-ray images in JPEG format, categorized into two groups (Pneumonia/Normal). Subroutines developed for chest screening[
11], primarily intended for lung nodule detection, can be efficiently repurposed for diagnosing a range of medical conditions. It includes conditions such as pneumonia, effusion, and cardiomegaly[
12].
ChexNet[
13] is a deep learning algorithm developed for chest X-ray interpretation. It utilizes a convolutional neural network (CNN) architecture to analyze X-ray images and detect various thoracic pathologies. Developed by researchers at Stanford University, ChexNet employs a 121-layer DenseNet architecture[
14], pre-trained on the ImageNet dataset, and fine-tuned on a large dataset of chest X-ray images labeled by radiologists. This approach allows ChexNet to effectively identify and localize 14 different thoracic pathologies, including pneumonia, pneumothorax, and pleural effusion, among others[
15]. The network’s architecture enables it to capture complex patterns and features within the X-ray images, enabling accurate diagnosis. ChexNet has demonstrated high performance in various studies, rivaling or surpassing human radiologists in certain tasks, thereby holding promise for improving diagnostic accuracy and efficiency in healthcare settings.
2. Related Work
Sharma, H., Jain, J., Bansal, P., and Gupta, S, et al. (2020) focused on feature extraction and classification of chest X-ray images using CNN for pneumonia detection at the 10th International Conference On Cloud Computing, Data Science & Engineering (Confluence). Their study contributes to the ongoing efforts in applying convolutional neural networks (CNNs) for pneumonia detection within the broader research landscape[
16].
Islam, M. T., et al. (2017) investigated the effectiveness of different CNNs in detecting abnormalities in chest X-rays [
17]. The study, utilizing the OpenI dataset [
18], played a role in advancing applications of machine learning in chest X-ray screening.
Antin, B., et al. (2017) presented a logistic regression model for pneumonia detection, making a contribution to continuous efforts in the field [
19].
Rajpurkar, P., et al. (2017) conducted a comprehensive examination with the goal of surpassing radiologists’ performance in pneumonia detection [
20]. The “ChexNet” model was introduced, employing DenseNet-121 to identify 14 diseases from a dataset comprising 112,200 images.
Varshni, D., and Thakral, K. (2019) utilized the densNet169+svm classifier for “Pneumonia Detection Using CNN based Feature Extraction” in 2019 [
21]. The emphasis of study was on improving prediction and feature extraction methods.
Kumar, P., and Grewal, M. (2018) made a valuable contribution in that year with research focused on the multilabel classification of thoracic diseases, implementing cascading convolutional networks [
22].
Wang and the team contributed to the exploration of machine learning applications in chest X-ray screening. Zhe Li introduced a convolutional network model for the identification and localization of diseases [
23].
3. Image Classification
The process of image classification is a crucial step in both object discovery within images and broader image analysis. It plays a significant role in providing either the final or intermediate output. Various techniques have been proposed for image classification[
24], and its effectiveness relies on identifying similarities in items, texture, and the description of elements within the images. Two primary methods for classifying images are supervised and unsupervised, operating at the pixel level, treating each pixel as a unit representing the image. The diverse methods used in image classification encompass essential operations such as image acquisition[
25], preprocessing, segmentation, feature extraction, and the core task of classification.
In pneumonia detection from chest X-ray images, the initial stage involves acquiring a dataset labeled with normal and pneumonia cases. Image pre-processing steps, including noise removal and enhancement, refine the dataset for subsequent analysis. Segmentation further dissects the image into background and foreground, often based on intensity or color, facilitating the isolation of key regions. Feature extraction follows, reducing the dataset’s dimensionality to retain essential information for efficient analysis, thereby reducing time and cost.
Classification methodologies, such as artificial neural networks (ANN)[
26], support vector machines (SVM)[
27], and decision trees (DT), are commonly employed to discern patterns indicative of pneumonia. Supervised learning is typically adopted, where the model is trained on labeled data to establish associations between extracted features and the corresponding class labels. The ultimate goal is to automate the identification of pneumonia in chest X-ray images, contributing to medical diagnosis efficiency. However, the task poses challenges due to significant differences within categories and the similarities resulting from various photography methods, presenting complexities in image retrieval and mining.
4. X-ray Medical Images
The discovery of X-rays is credited to Wilhelm Conrad Roentgen, who produced the first X-ray image in 1895[
28]. The ground breaking achievement marked the beginning of a new era in medical imaging. X-rays play a pivotal role in medical diagnostics due to their ability to penetrate the human body and create detailed images of internal structures. The importance of X-rays lies in their capacity to reveal information about bones, organs, and tissues that might be otherwise hidden from view. X-ray technology is widely used in medical diagnoses, enabling healthcare professionals to detect fractures, tumors, infections, and other abnormalities across various medical specialties. The versatility and speed of X-ray examinations make them essential tools for timely and accurate diagnosis, facilitating the formulation of appropriate treatment plans.
In the field of medical diagnosis and treatment, medical imaging assumes a pivotal role, serving as a crucial component in the decision-making process. Radiologists meticulously review the obtained medical images, generating comprehensive reports summarizing their findings. Subsequently, referring physicians rely on these reports and images to devise effective diagnosis and treatment plans. The integration of follow-up medical imaging into the assessment process is a common practice, enabling healthcare professionals to gauge the success of treatments and monitor changes over time.
Chest X-ray analysis emerges as a prominent diagnostic tool, offering valuable insights into various diseases. A notable trend in medical imaging is the exploration of automated solutions for analysis, aiming to reduce workloads, enhance efficiency, and minimize the risk of human error in interpretation. The imaging process itself revolves around the use of X-rays or high-energy photons to capture detailed images of internal structures. Within medical settings, X-rays penetrate solid matter, producing images that portray a “density map” of electrons, effectively highlighting the locations of soft tissues and bones.
The significance of chest X-ray imaging in clinical examinations is underscored by its widespread use for diagnosing lung diseases. The process involves passing an X-ray beam through the body, employing two distinct methods: the posterior-anterior (PA) method, where the ray beam traverses from the back to the front, and the anterior-posterior (AP) method, where the ray beam traverses from the front to the back. The resulting black-and-white image reflects the absorption of X-rays, delineating different densities within the body. Notably, air in the lungs appears black due to its low density. The chest X-ray image captures intricate details of the rib cage, lungs, heart, airways, and blood vessels, providing invaluable information for comprehensive medical assessments.
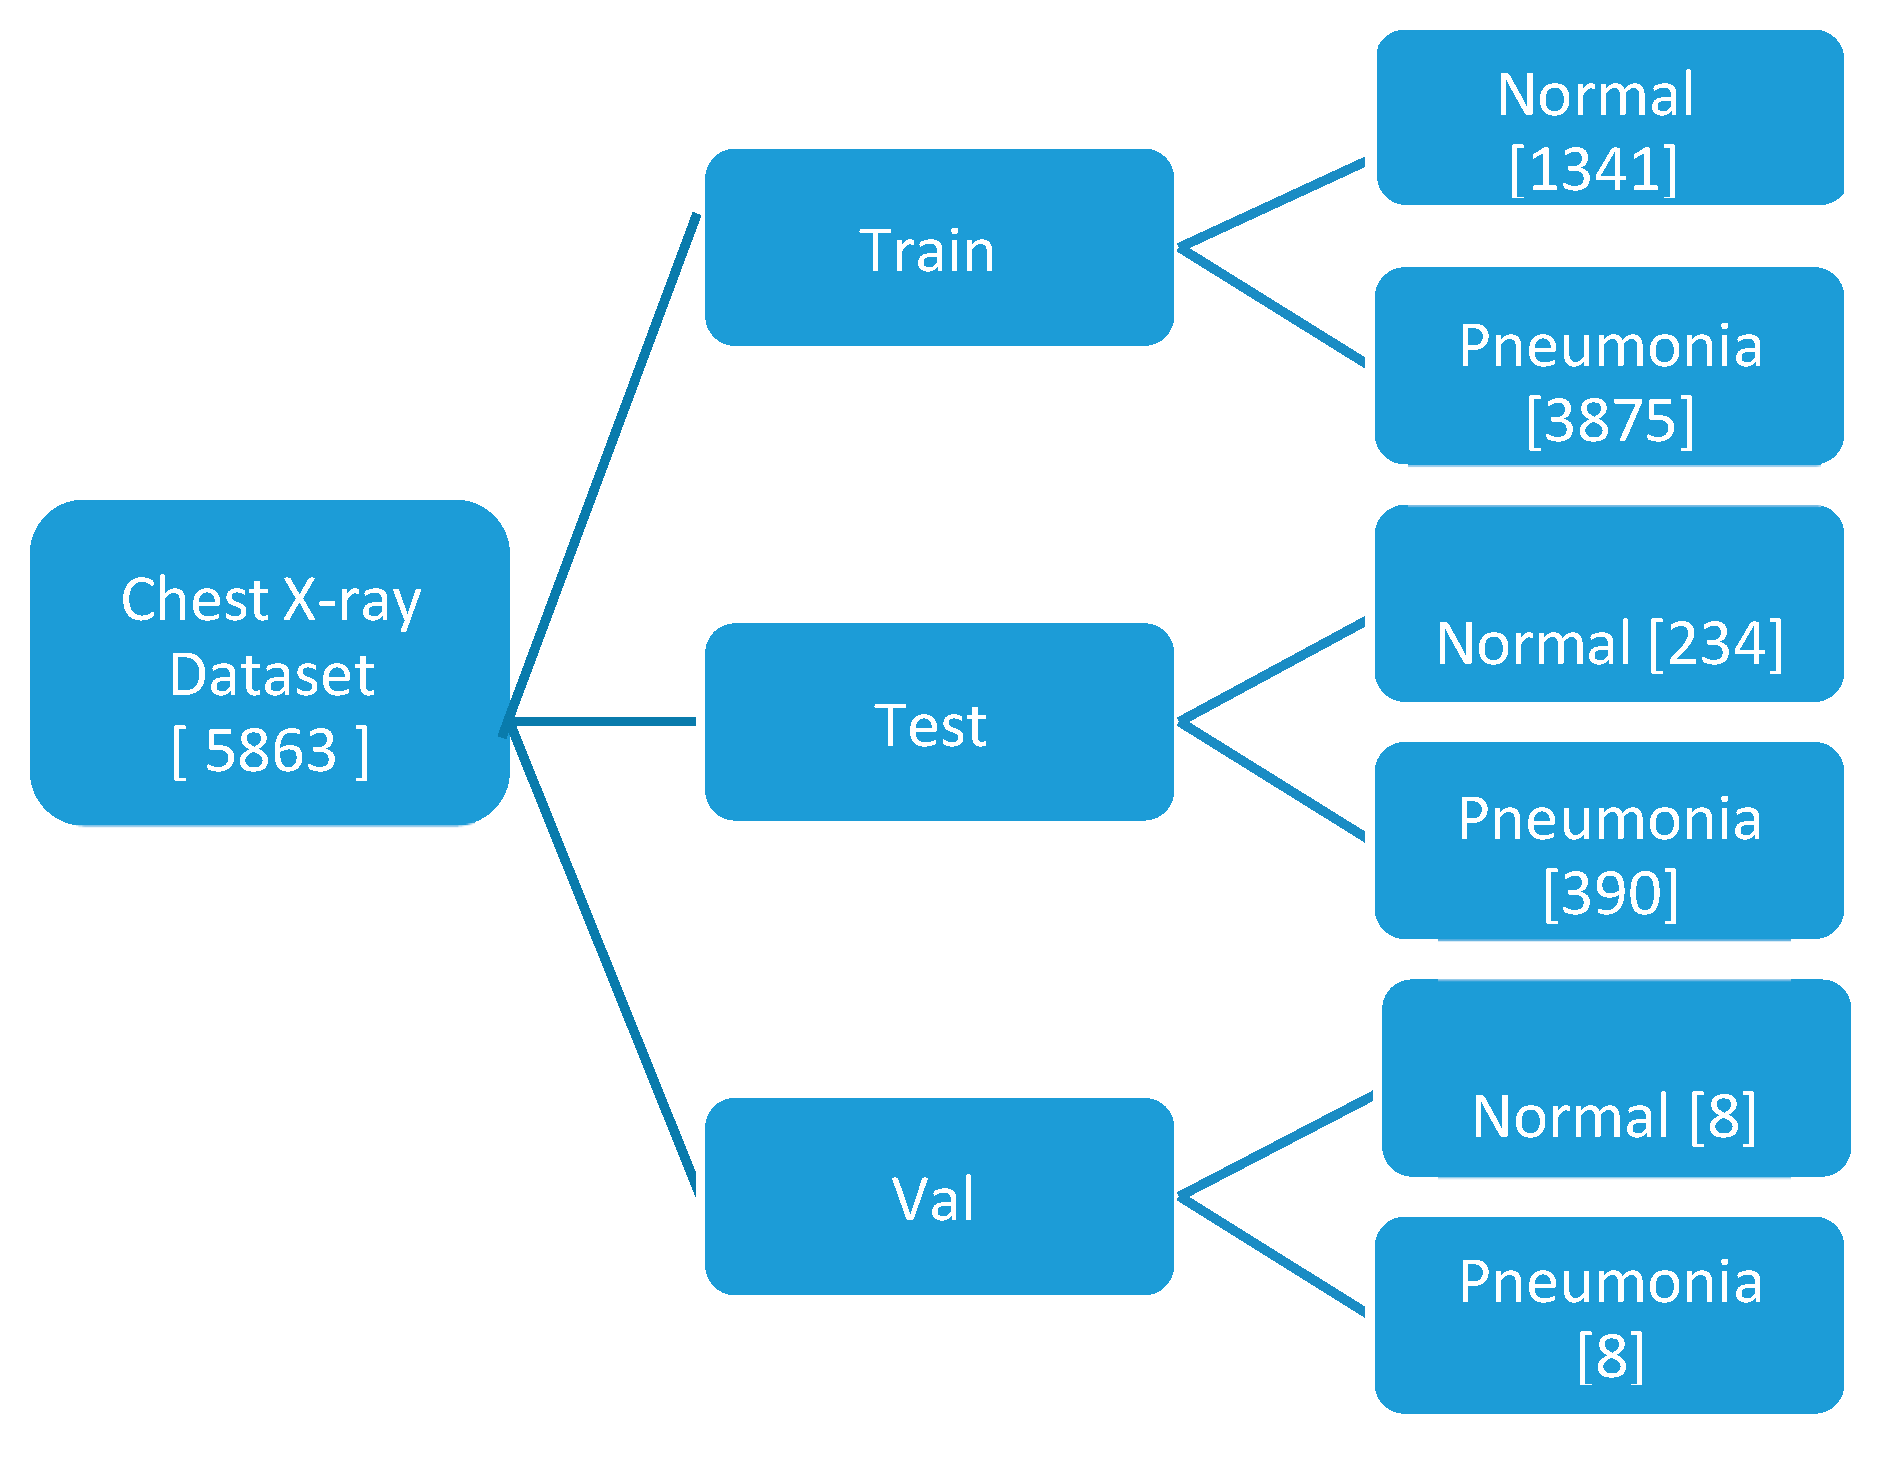
The model utilizes a compact dataset containing 5863 chest X-ray images from distinct patients. It classifies images with pneumonia as one of the annotated pathologies as positive examples, while marking all other images as negative examples. The dataset is partitioned into training, testing, and validation sets for the pneumonia detection task, ensuring no patient overlap between them. Prior to feeding the images into the network, they undergo downscaling to 224x224 dimensions.
In the model testing phase, a specific test set is employed, comprising 234 normal and 390 pneumonia patient frontal chest X-rays. Radiologists, devoid of access to patient information or knowledge of disease prevalence, label the images using a standardized data entry program.
Figure 1.
Hierarchical representation of Dataset Segregation.
Figure 1.
Hierarchical representation of Dataset Segregation.
5. ChexNet Algorithm
The ChexNet algorithm functions by leveraging deep learning techniques to interpret chest X-ray images for identifying various thoracic pathologies. Initially, the algorithm is trained on a large dataset of chest X-ray images that have been meticulously annotated by expert radiologists. This training process involves presenting the algorithm with a vast array of labeled X-ray images, allowing it to learn and extract patterns and features indicative of different thoracic conditions.
The core of the ChexNet algorithm lies in its utilization of a deep convolutional neural network (CNN) architecture, specifically DenseNet121[
29]. This architecture is capable of capturing intricate patterns and structures within the X-ray images, enabling the algorithm to discern subtle abnormalities. DenseNet121 [
30]has been pre-trained on a diverse set of images from the ImageNet dataset, which imparts it with a broad understanding of visual features before fine-tuning it on the chest X-ray dataset.
During training, the ChexNet algorithm adjusts its internal parameters through a process called backpropagation, wherein it minimizes the disparity between its predictions and the ground truth labels provided by radiologists. Through numerous iterations, the algorithm refines its ability to accurately classify X-ray images based on the presence or absence of specific thoracic pathologies.
Once trained, ChexNet can analyze new, unseen chest X-ray images and produce predictions regarding the likelihood of various pathologies being present. This analysis involves passing the X-ray images through the trained CNN, which extracts features and makes predictions based on the learned patterns. The final output typically includes probabilities for each pathology, indicating the algorithm’s confidence in its predictions.
ChexNet’s effectiveness stems from its ability to generalize learned features from a large and diverse dataset, coupled with its capacity to discern subtle abnormalities in X-ray images. By harnessing the power of deep learning, ChexNet holds promise for assisting radiologists in diagnosing thoracic pathologies more accurately and efficiently, ultimately contributing to improved patient care and outcomes.
i. Convolutional Neural Networks (CNNs):
CNNs are the backbone of many image classification tasks, including chest X-ray analysis. They employ convolutional layers to extract features from input images. The formula for a convolutional layer involves convolving the input image with a set of learnable filters (kernels) followed by an activation function. The output feature maps are generated by applying the convolution operation:
ii. Global Average Pooling:
Global Average Pooling is often used in CNN architectures to reduce the spatial dimensions of the feature maps generated by convolutional layers before feeding them into the fully connected layers. It computes the average of each feature map, resulting in a fixed-size vector regardless of the input image size.
iii. Dense (Fully Connected) Layers:
Dense layers are used for classification tasks. They connect every neuron in one layer to every neuron in the next layer. The formula for a dense layer involves computing the dot product of the input vector with the weight matrix, adding bias, and applying an activation function:
iv. Softmax Activation:
Softmax activation is commonly used in the output layer of classification models. It converts raw scores (logits) into probabilities. The formula for softmax activation is:
where
P(yi) is the probability of class i,
zi is the raw score for class i
K is the number of classes.
v. Categorical Cross-Entropy Loss:
Categorical Cross-Entropy is a commonly used loss function for multi-class classification problems. It measures the dissimilarity between the predicted probability distribution and the actual distribution (one-hot encoded labels). The formula for categorical cross-entropy loss is:
where
N is the number of samples,
M is the number of classes,
yij is the actual label (0 or 1), and
y^ij is the predicted probability for class j.
6. Methodology
6.1. Dataset Preparation
i. Data Collection:
A dataset of chest X-ray images labeled for pneumonia presence needs to be gathered. These images should be obtained from reliable sources and annotated by medical professionals to ensure accuracy.
ii. Data Cleaning and Preprocessing :
The collected images may need to be cleaned to remove any artifacts or irrelevant information. Preprocessing steps such as resizing, normalization, and augmentation may also be applied to enhance the quality and diversity of the dataset.
iii. Data Splitting:
The dataset is typically divided into training, validation, and test sets. The training set is used to train the model, the validation set is used to tune hyperparameters and evaluate performance during training, and the test set is used to evaluate the final model performance.
6.2. Model Training (ChexNet)
i. Model Selection :
ChexNet, a deep learning model specifically designed for chest X-ray analysis, is chosen for this task. ChexNet typically consists of convolutional neural network (CNN) layers followed by fully connected layers for classification.
ii. Model Architecture:
The architecture of ChexNet is tailored to extract features relevant to pneumonia detection from chest X-ray images. It may include multiple convolutional layers with pooling, batch normalization, and activation functions like ReLU.
iii. Training Procedure:
The model is trained using the training dataset through an optimization algorithm such as stochastic gradient descent (SGD) or Adam. The loss function, often binary cross-entropy, measures the difference between predicted and true labels.
6.3. Model Evaluation
i. Performance Metrics :
The model’s performance is assessed using various metrics such as accuracy, precision, recall, F1-score, and area under the ROC curve (AUC). These metrics provide insights into how well the model is able to distinguish between normal and pneumonia cases.
ii. Validation Set Evaluation:
The trained model is evaluated on the validation set to assess its generalization ability and identify potential overfitting or underfitting issues. This step helps in fine-tuning hyperparameters and optimizing the model’s performance.
6.4. Analyses
i. Image Upload and Prediction :
Users can upload chest X-ray images through the GUI, and the trained model makes predictions on whether pneumonia is present or not. The predicted probability scores and corresponding messages are displayed to the user.
ii. Confusion Matrix Visualization :
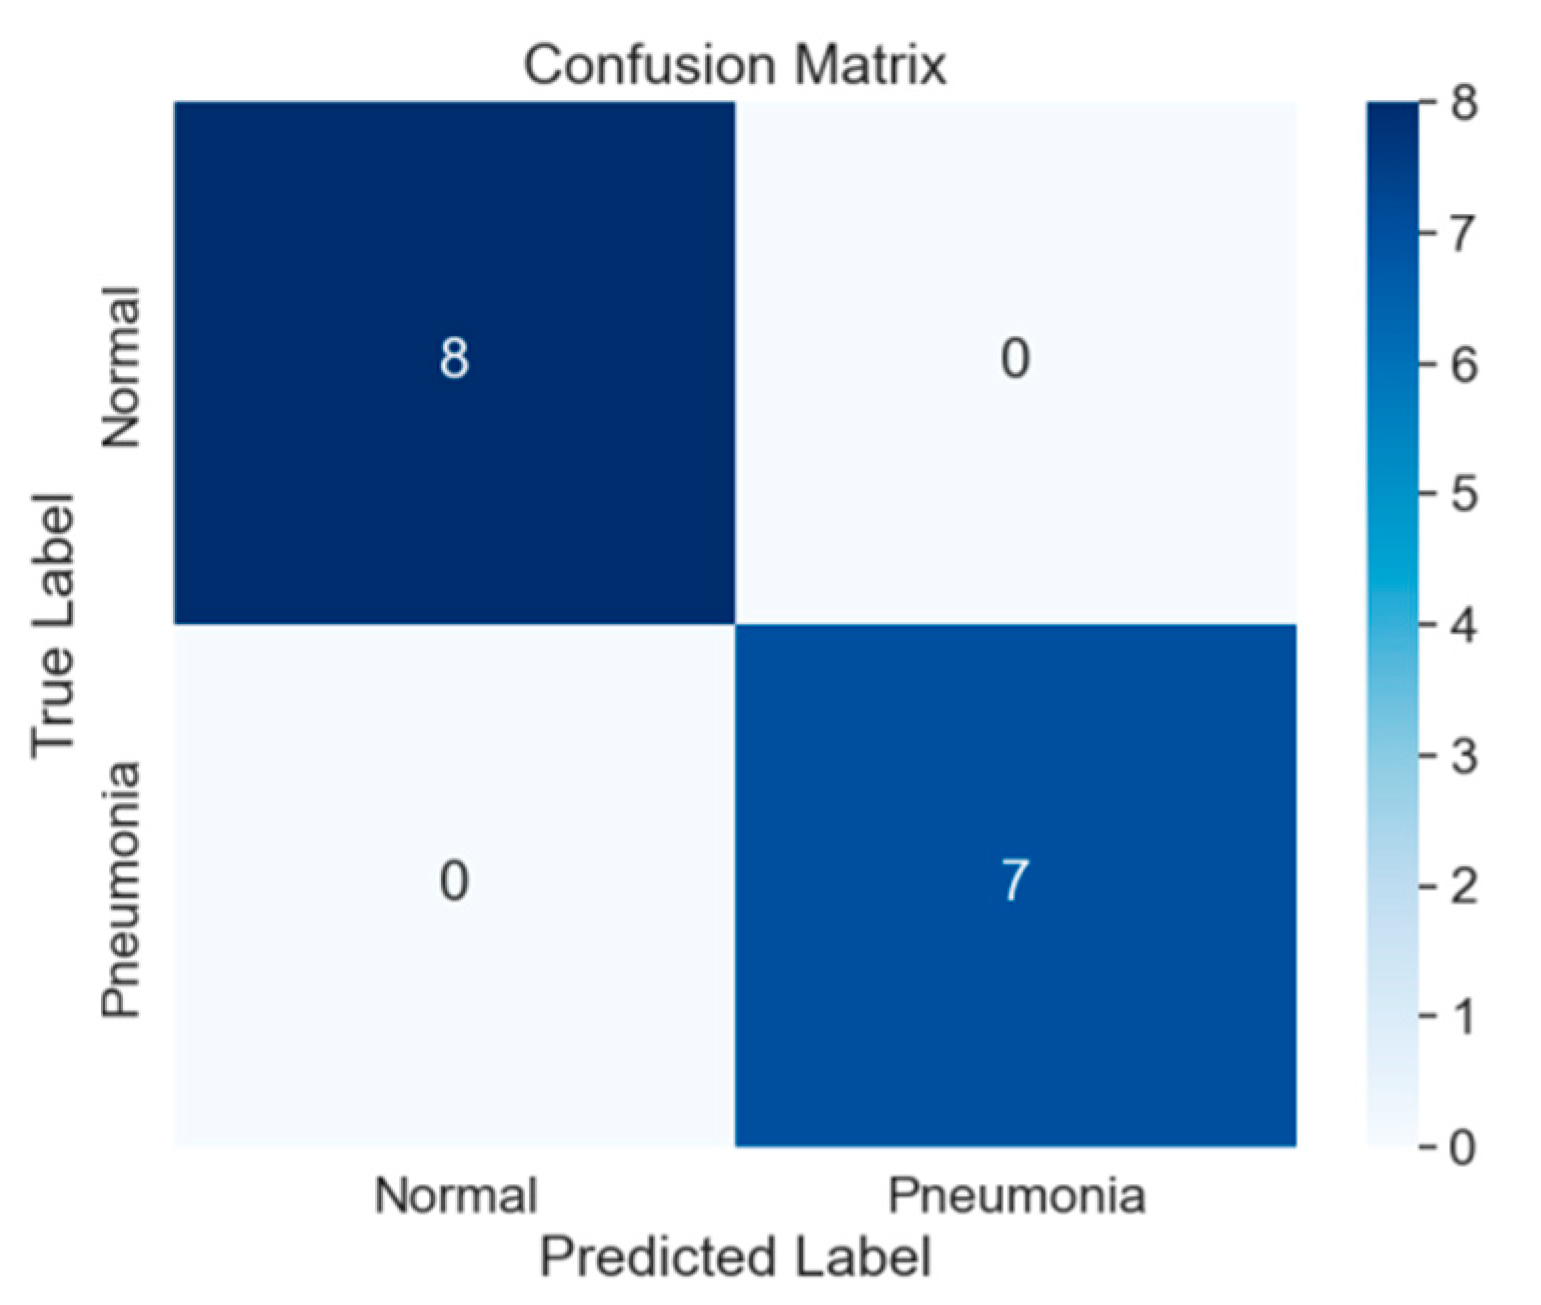
The confusion matrix provides a detailed breakdown of the model’s performance, showing true positives, true negatives, false positives, and false negatives. Visualizing the confusion matrix helps in understanding the model’s strengths and weaknesses.
iii. ROC Curve Plotting :
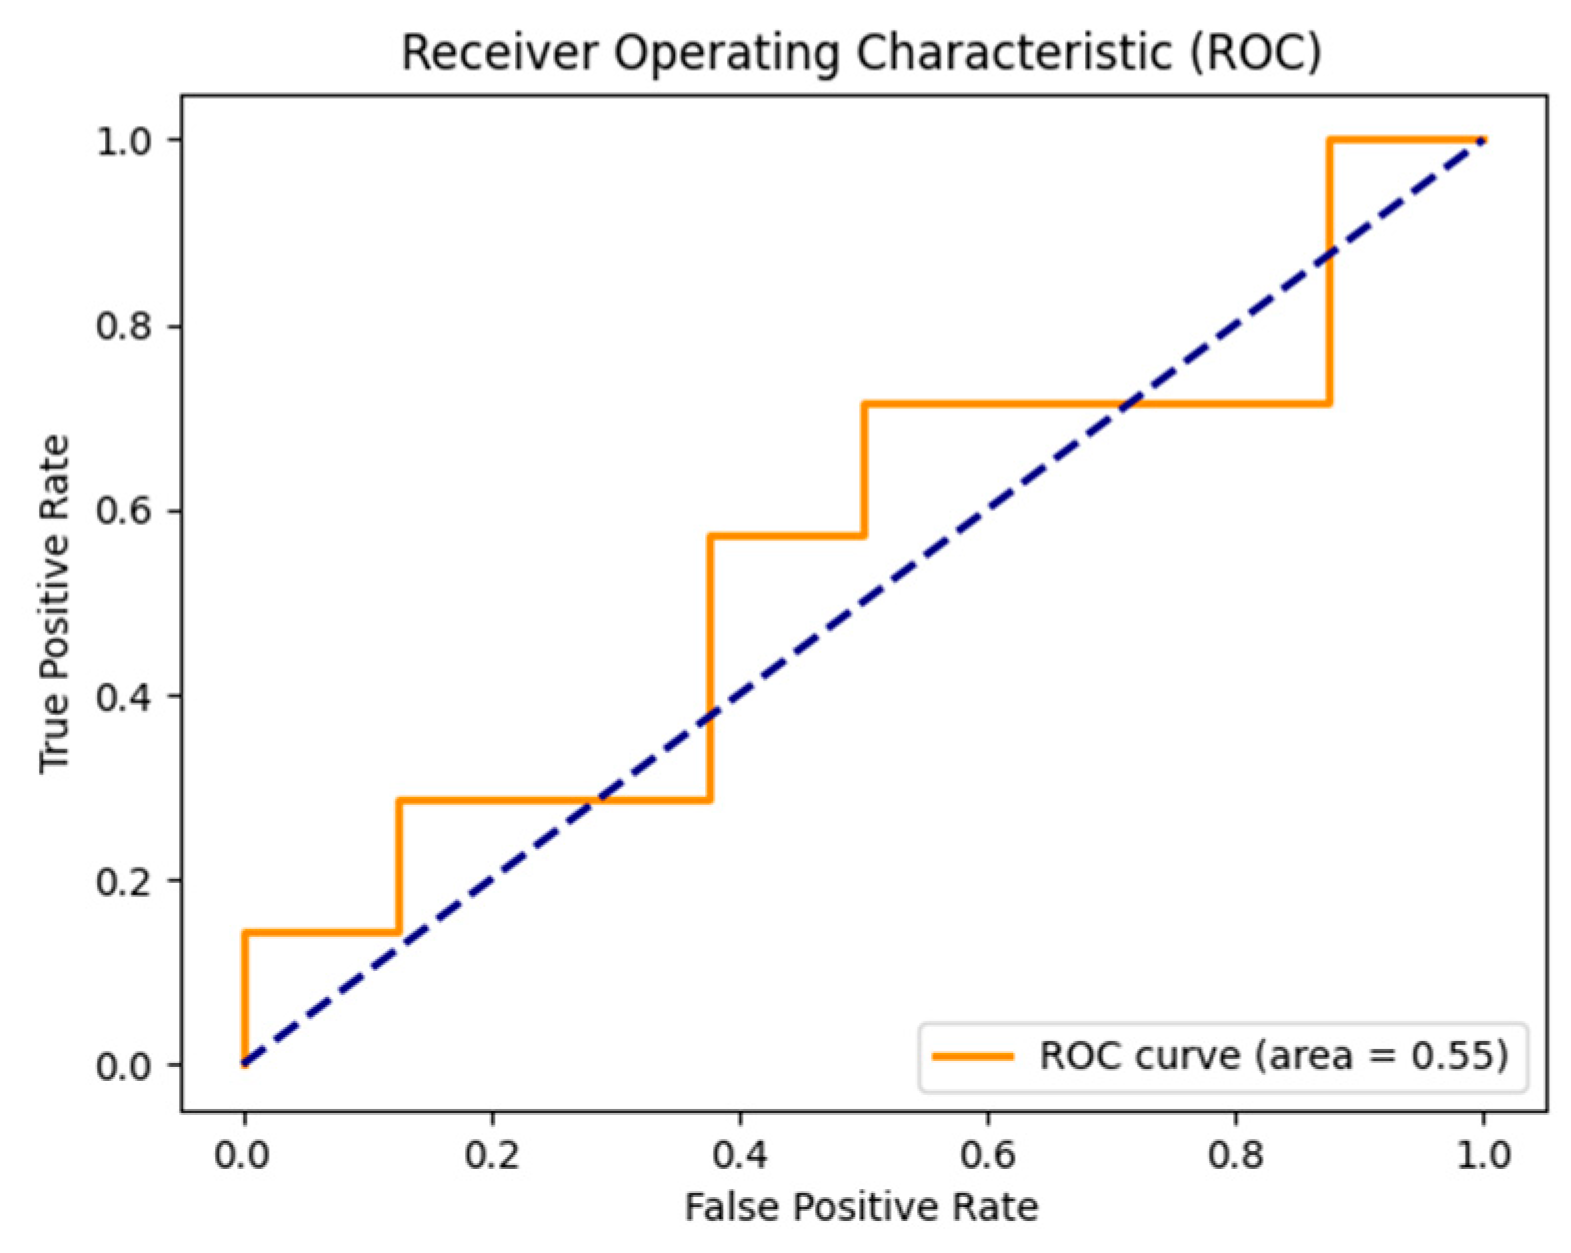
The Receiver Operating Characteristic (ROC) curve illustrates the trade-off between true positive rate and false positive rate at various threshold settings. The area under the ROC curve (AUC) quantifies the model’s discriminative ability, with higher values indicating better performance.
7. Experimental Results
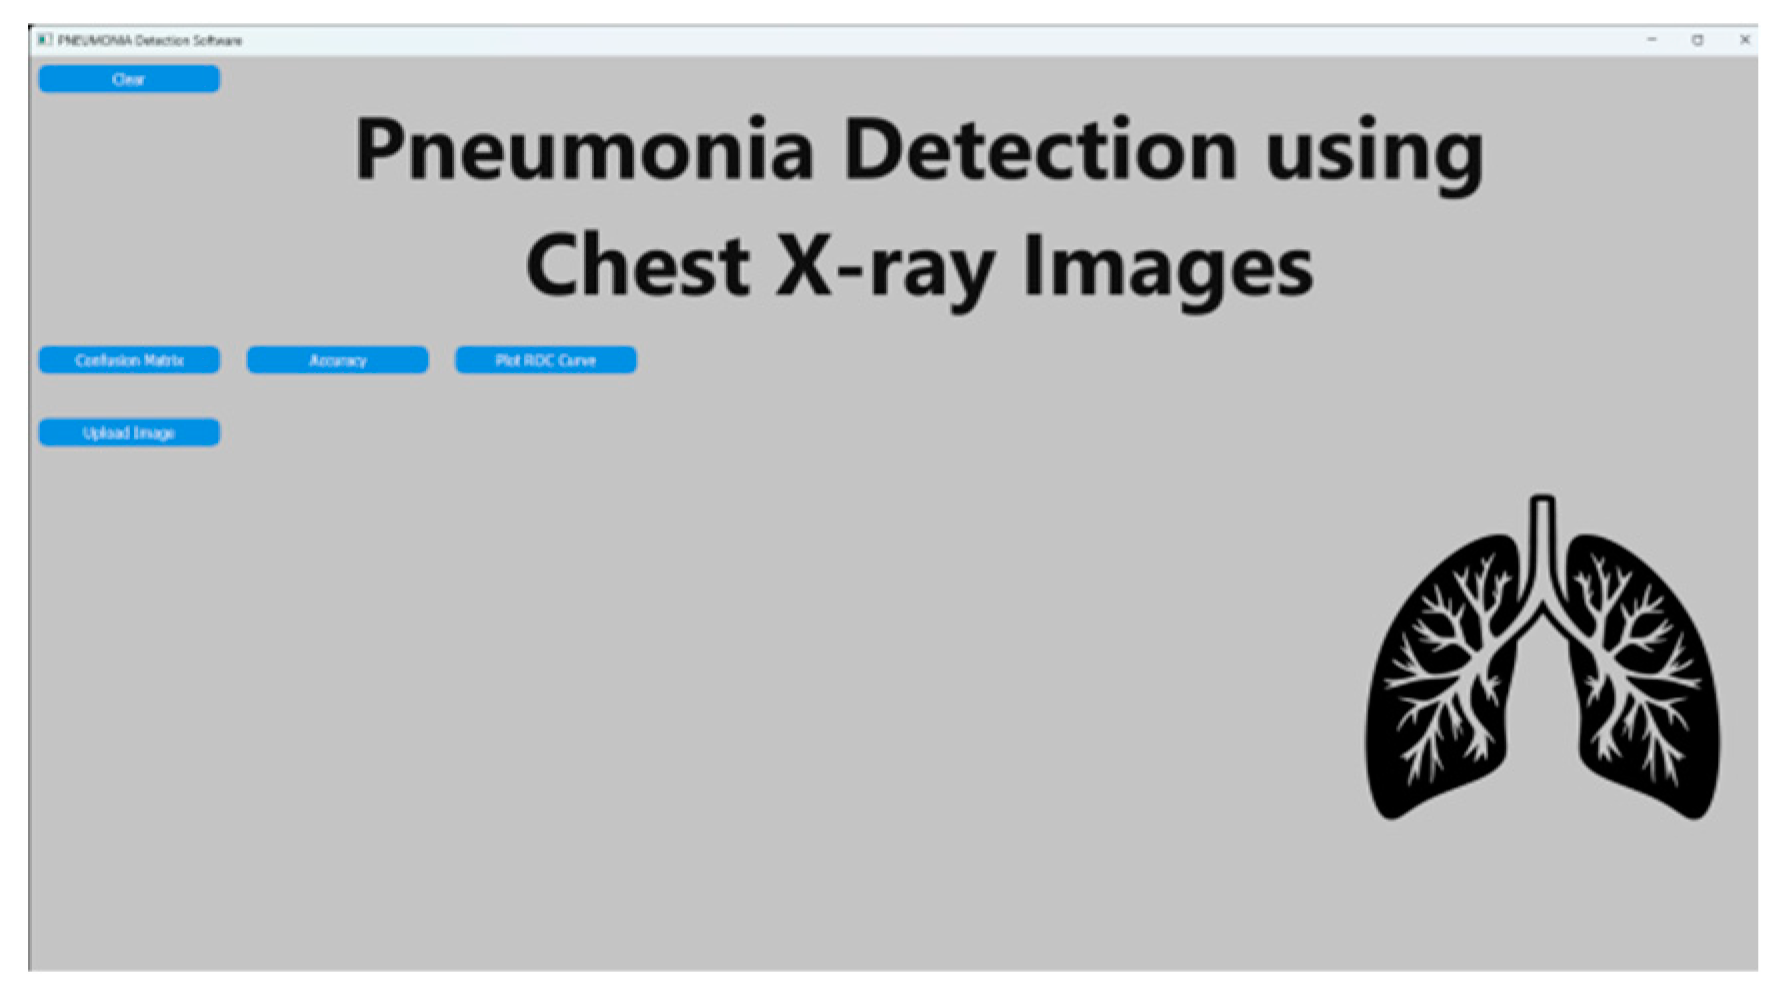
The Chest X-ray image processing application provides a user-friendly and systematic approach for the analysis and comprehension of medical images. Users can easily upload Chest X-ray images by following step-by-step instructions, receive timely processing time tooltips, and access various functions, including accuracy assessment and confusion matrix generation. The color-coded result presentation, with green signifying normal results and red indicating pneumonia, enhances clarity and user-friendliness. The application serves as a valuable resource for healthcare professionals and researchers, facilitating efficient and dependable image analysis in the realm of medical diagnostics.
Figure 3.
In a user-friendly environment, users can interact with the model by uploading chest X-ray images for prediction.
Figure 3.
In a user-friendly environment, users can interact with the model by uploading chest X-ray images for prediction.
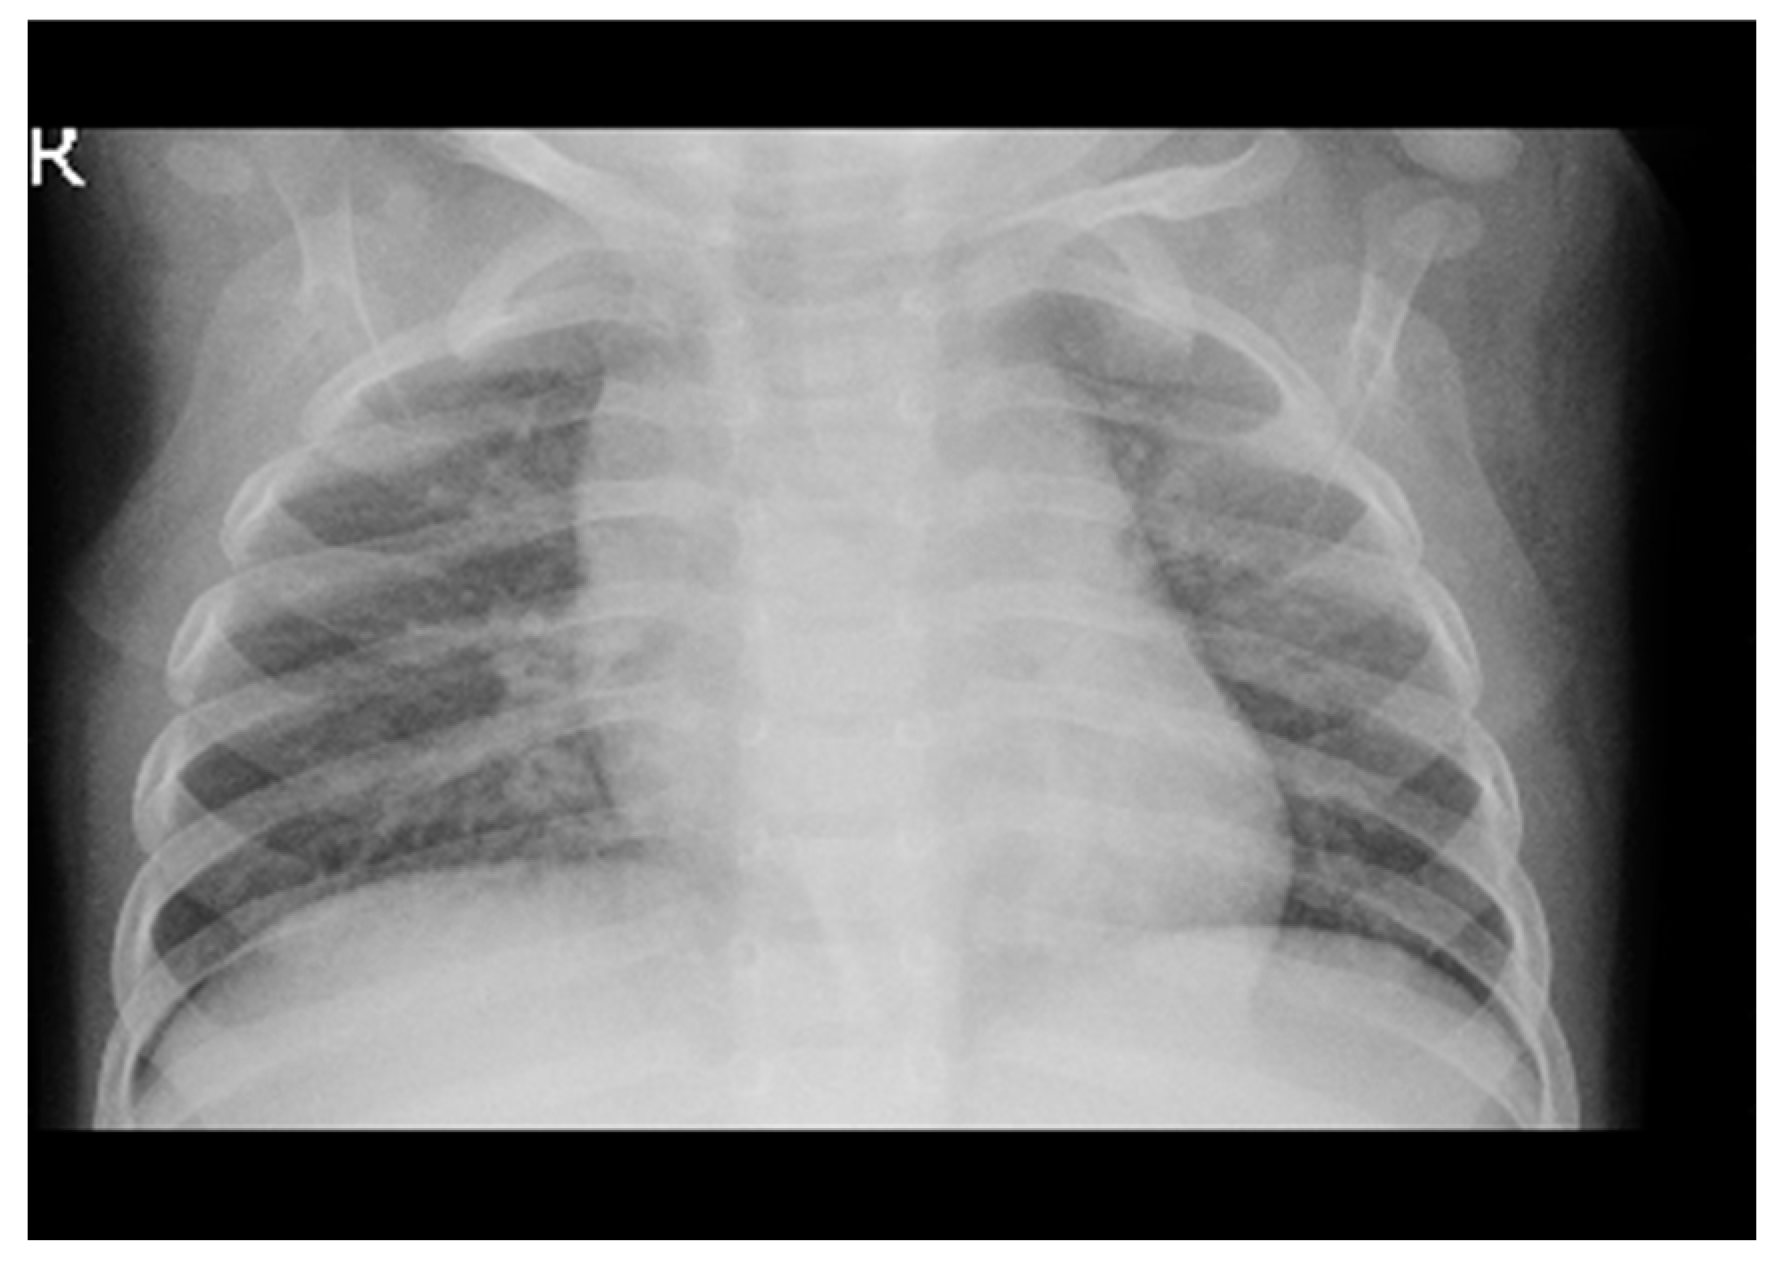
Figure 4.
After image upload, the prediction button becomes visible and triggers the prediction process
Figure 4.
After image upload, the prediction button becomes visible and triggers the prediction process
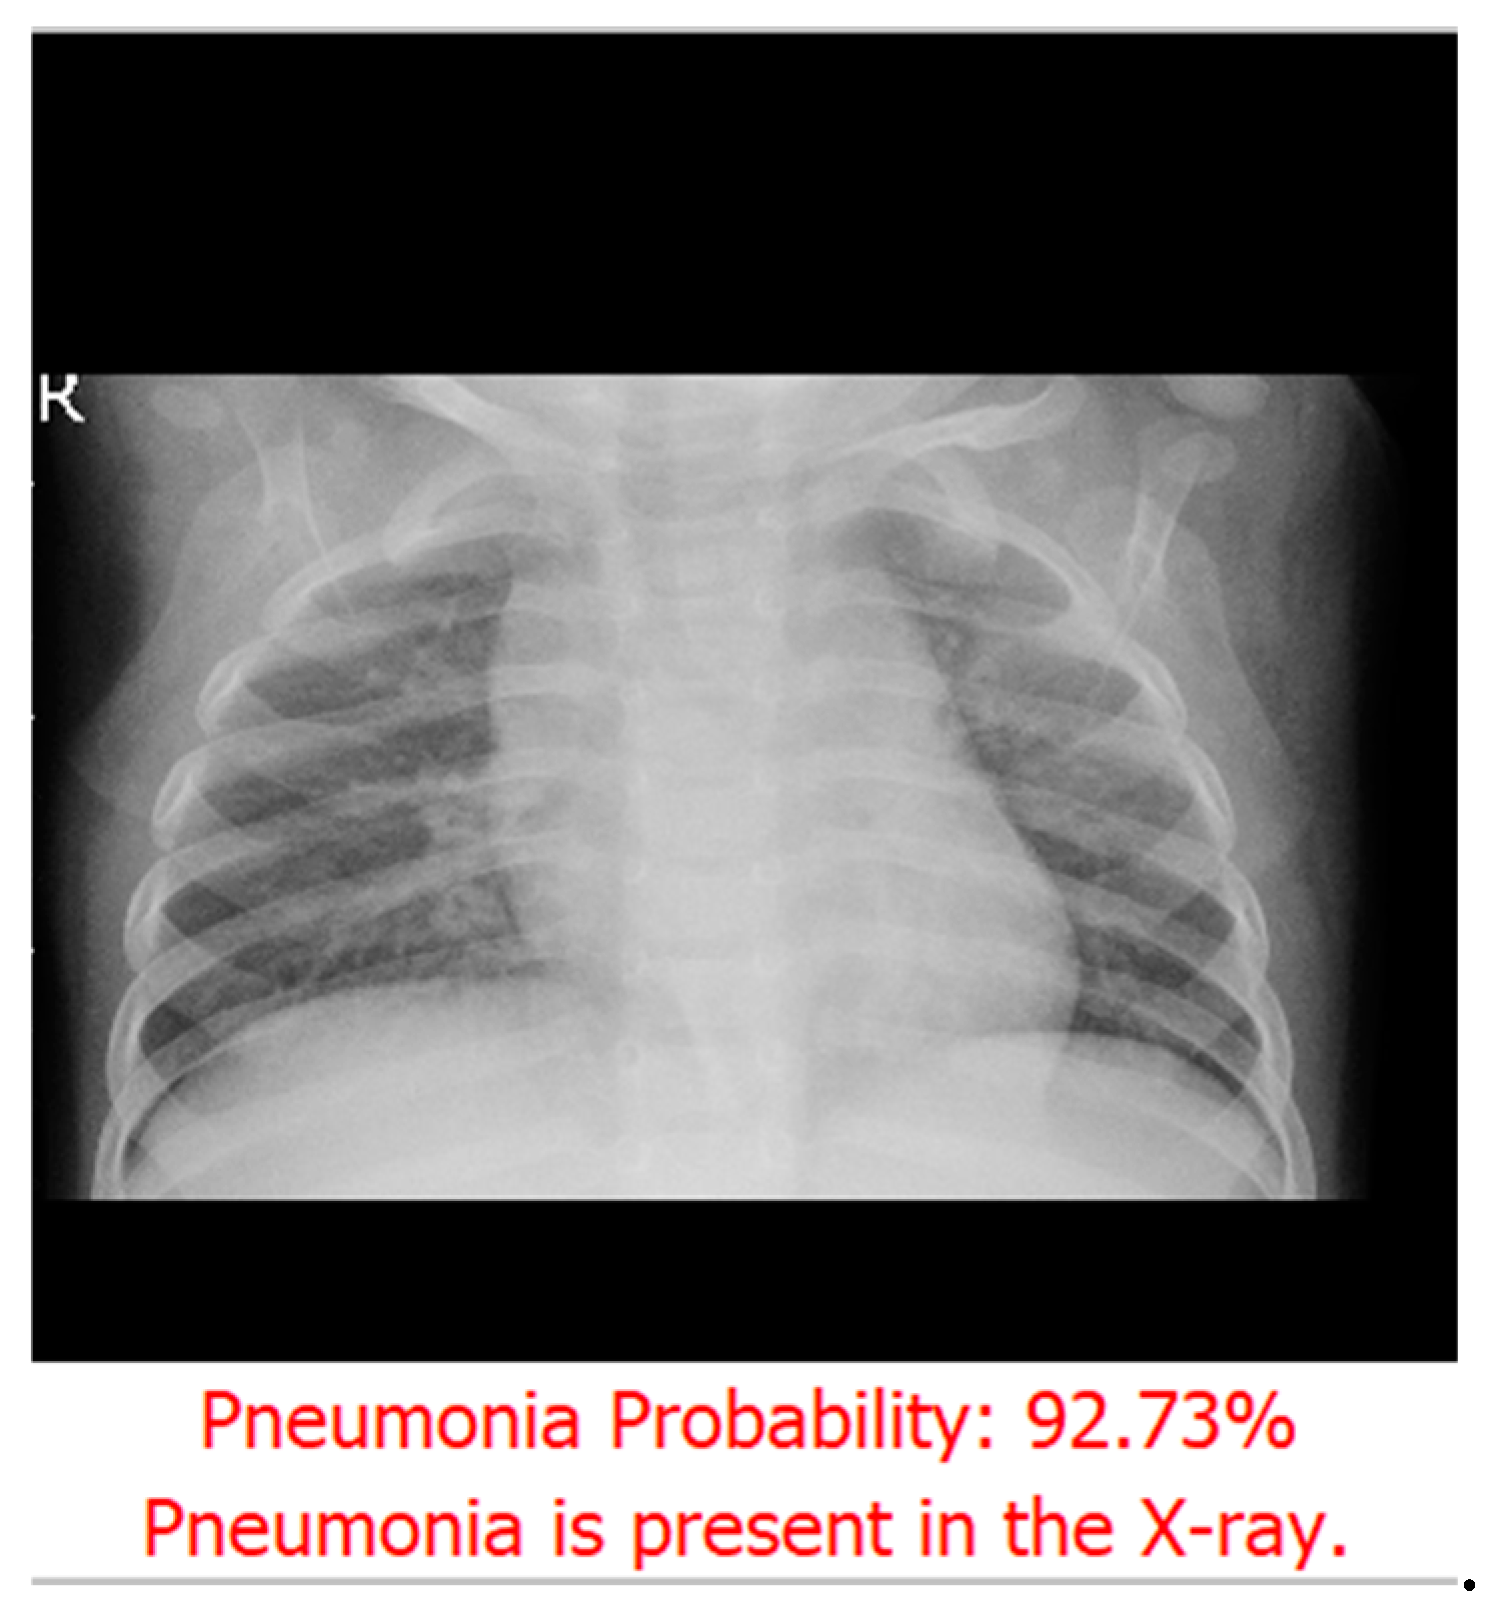
Figure 5.
After prediction, the probability score is displayed as a percentage along with the result.
Figure 5.
After prediction, the probability score is displayed as a percentage along with the result.
Figure 6.
Confusion Matrix image visually depicts the classification model’s performance by illustrating the counts of true positive, true negative, false positive, and false negative predictions.
Figure 6.
Confusion Matrix image visually depicts the classification model’s performance by illustrating the counts of true positive, true negative, false positive, and false negative predictions.
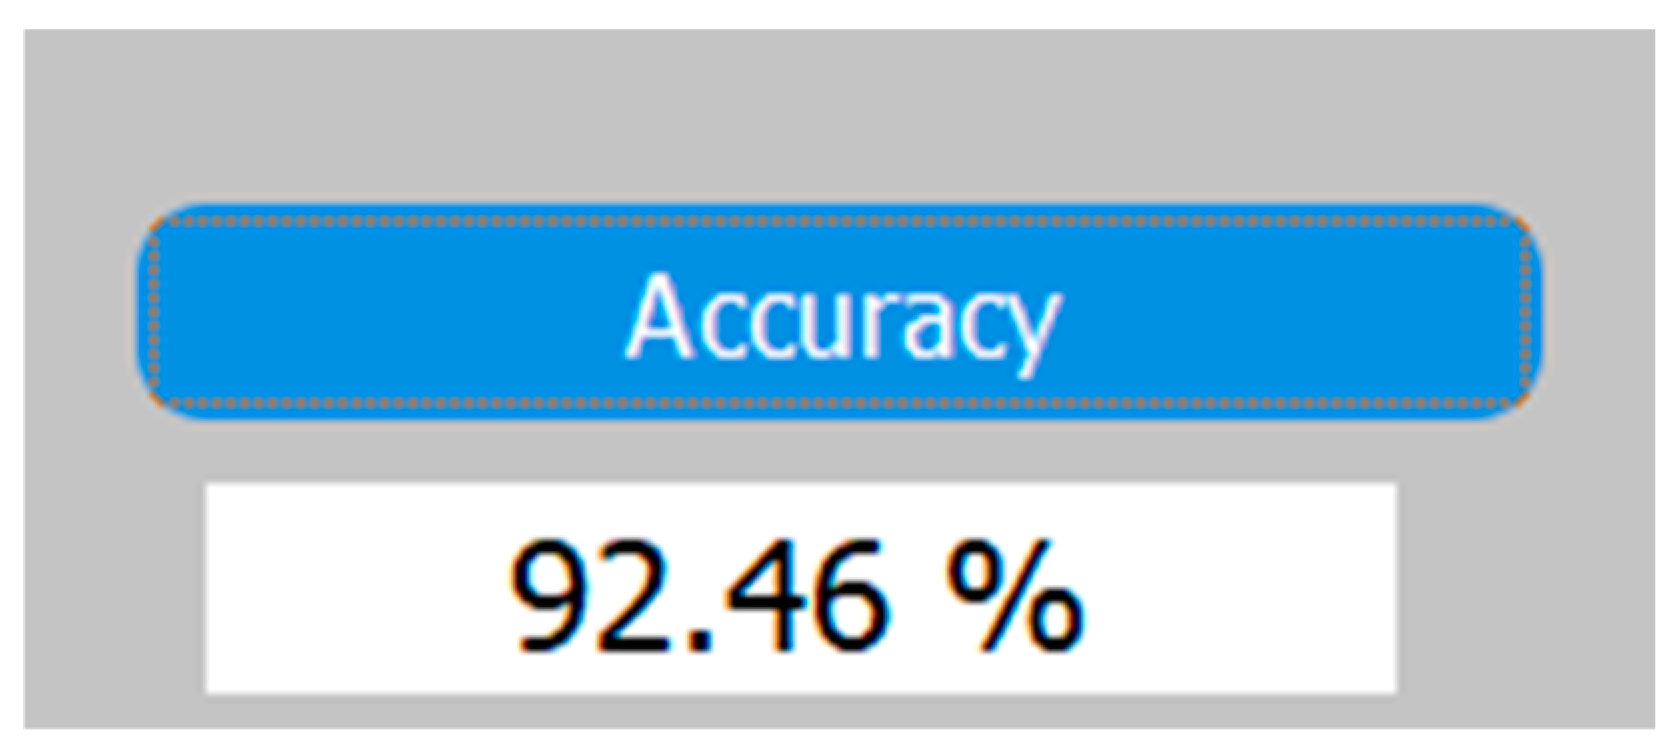
Figure 7.
Accuracy is determined by the model (.h5) used in the project. When you click on the ‘Accuracy’ button, it will display the test accuracy of the model.”.
Figure 7.
Accuracy is determined by the model (.h5) used in the project. When you click on the ‘Accuracy’ button, it will display the test accuracy of the model.”.
Figure 8.
FPR=0, TPR=1.0; no false positives, all true positives detected. TPR decreases as FPR rises, but less steeply, indicating improved performance. AUC=0.55, better than prior example. FPR=0.8, TPR=0.2, classifier performance evaluated.
Figure 8.
FPR=0, TPR=1.0; no false positives, all true positives detected. TPR decreases as FPR rises, but less steeply, indicating improved performance. AUC=0.55, better than prior example. FPR=0.8, TPR=0.2, classifier performance evaluated.
Classification Report:
| |
precisinn |
recall |
F1-score |
support |
| 0 (normal) |
0.93 |
0.82 |
0.87 |
234 |
| 1(pneumonia) |
0.90 |
0.96 |
0.93 |
390 |
| Accuracy |
|
0.91 |
624 |
| Macro avg |
0.91 |
0.89 |
0.90 |
624 |
Class Normal :
Precision: 0.93 (93% of predicted normals were actually normal)
Recall: 0.82 (82% of actual normals were captured by the model)
F1-Score: 0.87 (Balanced metric considering precision and recall)
Support: 234 instances
Class Pneumonia :
Precision: 0.90 (90% of predicted pneumonia cases were actually pneumonia)
Recall: 0.96 (96% of actual pneumonia cases were captured by the model)
F1-Score: 0.93 (Balanced metric considering precision and recall)
Support: 390 instances
Overall Metrics:
Accuracy: 0.91 (Overall correct predictions)
Macro Avg (Average across both classes):
Precision: 0.91
Recall: 0.89
F1-Score: 0.90
Support: 624 instances
8. Conclusions
The application of a CheXNet-inspired convolutional neural network (CNN) for pneumonia detection in chest X-ray images has yielded promising outcomes. The analysis, as portrayed by the confusion matrix on a test set comprising 624 cases, reveals the model’s successful identification of 376 pneumonia cases with only 14 misclassifications. Simultaneously, it accurately identified 191 out of 234 normal cases while registering 43 false positives.
The system’s accuracy, standing at 92.47%, is accompanied by notably high precision, recall, and F1-scores for the pneumonia class. This implies the model’s heightened sensitivity and specificity in detecting pneumonia instances, showcasing a substantial capability to differentiate between normal and pathological chest X-ray findings.
The findings underscore the potential applicability of deep learning models, such as the one developed in this study, for expediting precise pneumonia diagnoses. The heightened recall rate for the pneumonia class suggests the model’s reliability in medical screening, thereby mitigating the risk of false negatives—an imperative consideration in clinical settings.
Despite the low incidence of false positives and false negatives, there exists an indication for further refinement of the model. Potential enhancements encompass the integration of larger and more diverse datasets for training, improved preprocessing techniques, or the exploration of more sophisticated network architectures. Looking forward, continual improvement is committed to ensuring increased accuracy and reliability in future iterations of the model.
Data Availability Statement
The Images utilized in this research are sourced from web-based databases.
Acknowledgements
The author extends appreciation to all researchers whose insights have enhanced the study, fostering continuous learning for the benefits of future generations.
Conflicts of Interest
The author affirms the absence of any conflicts of interest related to the present study.
References
- Varshni, D.; Thakral, K.; Agarwal, L.; Nijhawan, R.; Mittal, A. Pneumonia detection using CNN based feature extraction. In Proceedings of the IEEE International Conference on Electrical, Computer and Communication Technologies (ICECCT), Coimbatore, India, 20–22 February 2019; pp. 1–7. [Google Scholar]
- Imran, A. Training a CNN to detect Pneumonia. 2019. Available online: https://medium.com/datadriveninvestor/training-a-cnn-to- detect-pneumonia-c42a44101deb (accessed on 23 December 2019).
- WHO. Standardization of Interpretation of Chest Radiographs for the Diagnosis of Pneumonia in Children; World Health Organization: Geneva, Switzerland, 2001. [Google Scholar]
- Awal, A.; Hossain, S.; Debjit, K.; Ahmed, N.; Nath, R.D.; Habib, G.M.M.; Khan, S.; Islam, A.; Mahmud, M.A.P. An Early Detection of Asthma Using BOMLA Detector. IEEE Access 2021, 9, 58403–58420. [Google Scholar] [CrossRef]
- G, S.; Kp, S.; R, V. Automated detection of diabetes using CNN and CNN-LSTM network and heart rate signals. Procedia Comput. Sci. 2018, 132, 1253–1262. [Google Scholar] [CrossRef]
- Braunwald, E.; Bristow, M.R. Congestive Heart Failure: Fifty Years of Progress. Circ. 2000, 102. [Google Scholar] [CrossRef]
- Zhang, D.; Ren, F.; Li, Y.; Na, L.; Ma, Y. Pneumonia Detection from Chest X-ray Images Based on Convolutional Neural Network. Electronics 2021, 10, 1512. [Google Scholar] [CrossRef]
- Rajpurkar, Pranav, Jeremy Irvin, Kaylie Zhu , Brandon Yang, Hershel Mehta, Tony Duan, Daisy Ding, Aarti Bagul, Curtis Langlotz, Katie Shpanskaya, Matthew P. Lungren, and Andrew Y. Ng. “CheXNet: Radiologist-Level Pneumonia Detection on Chest X-Rays with Deep Learning.”.
- Tammina, S. Transfer learning using VGG-16 with Deep Convolutional Neural Network for Classifying Images. Int. J. Sci. Res. Publ. (IJSRP) 2019, 9, 143–150. [Google Scholar] [CrossRef]
- Kaushik, V., Nayyar, Anand, Kataria, Gaurav, and Jain, Rachna. (2020, April 28). Pneumonia Detection Using Convolutional Neural Networks (CNNs). In Lecture Notes in Networks and Systems (pp. 471-483). ISBN 978-981-15-3368-6. [CrossRef]
- Mazzone, P.J.; Silvestri, G.A.; Souter, L.H.; Caverly, T.J.; Kanne, J.P.; Katki, H.A.; Wiener, R.S.; Detterbeck, F.C. Screening for Lung Cancer. Chest 2021, 160, e427–e494. [Google Scholar] [CrossRef] [PubMed]
- Sarpotdar, S.(2022). Cardiomegaly Detection using Deep Convolutional Neural Network with U-Net. [CrossRef]
- Dasari, Haritha & Pranathi, M. & Reethika, Mary. (2020). COVID Detection from Chest X-rays with DeepLearning: CheXNet. 1-5. [CrossRef]
- Deng, J.; Dong, W.; Socher, R.; Li, L.-J.; Li, K.; Fei-Fei, L. ImageNet: A large-scale hierarchical image database. In Proceedings of the 2009 IEEE Conference on Computer Vision and Pattern Recognition, Miami, FL, USA, 20–25 June 2009; pp. 248–255. [Google Scholar] [CrossRef]
- Alapat, D.J.; Menon, M.V.; Ashok, S. A Review on Detection of Pneumonia in Chest X-ray Images Using Neural Networks. J. Biomed. Phys. Eng. 2022, 12, 551–558. [Google Scholar] [CrossRef] [PubMed]
- Sharma, H.; Jain, J.S.; Bansal, P.; Gupta, S. Feature Extraction and Classification of Chest X-Ray Images Using CNN to Detect Pneumonia. 2020 10th International Conference on Cloud Computing, Data Science & Engineering (Confluence); pp. 227–231.
- Mohammad Tariqul Islam, Md Abdul Aowal, Ahmed Tahseen Minhaz and Khalid Ashraf, “Abnormality detection and localization in chest x- rays using deep convolutional neural networks”, 2017. 2017.
- Chen, Y.-J.Y.-J.; Hua, K.-L.; Hsu, C.-H.; Cheng, W.-H.; Hidayati, S.C. Computer-aided classification of lung nodules on computed tomography images via deep learning technique. OncoTargets Ther. 2015, 8, 2015–2022. [Google Scholar] [CrossRef] [PubMed]
- Benjamin Antin, Joshua Kravitz and Emil Martayan, Detecting Pneumonia in Chest X-Rays with Supervised Learning, 2017.
- Pranav Rajpurkar, Jeremy Irvin, Kaylie Zhu, Brandon Yang, Hershel Mehta, Tony Duan, Daisy Ding, Aarti Bagul, Curtis Langlotz, Katie Shpanskaya et al., “Chexnet: Radiologist-level pneumonia detection on chest x-rays with deep learning”, 2017.
- Varshni, D.; Thakral, K.; Agarwal, L.; Nijhawan, R.; Mittal, A. Pneumonia detection using CNN based feature extraction. In Proceedings of the IEEE International Conference on Electrical, Computer and Communication Technologies (ICECCT), Coimbatore, India, 20–22 February 2019; pp. 1–7. [Google Scholar]
- Pulkit Kumar, Monika Grewal and Muktabh Mayank Srivastava, “Boosted cascaded convnets for multilabel classification of thoracic diseases in chest radiographs”, International Conference Image Analysis and Recognition, pp. 546552, 2018.
- Li, Chong Wang, Mei Han, Yuan Xue, Wei Wei, Li-Jia Li, et al., “Thoracic disease identification and localization with limited supervision”, 201.
- Krishna, M.M.; Neelima, M.; Harshali, M.; Rao, M.V.G. Image classification using Deep learning. Int. J. Eng. Technol. 2018, 7, 614–617. [Google Scholar] [CrossRef]
- Mishra, V.K.; Kumar, S.; Shukla, N. Image Acquisition and Techniques to Perform Image Acquisition. SAMRIDDHI : A J. Phys. Sci. Eng. Technol. 2017, 9, 21–24. [Google Scholar] [CrossRef]
- Grossi, E.; Buscema, M. Introduction to artificial neural networks. Eur. J. Gastroenterol. Hepatol. 2007, 19, 1046–1054. [Google Scholar] [CrossRef] [PubMed]
- Evgeniou, T.; Pontil, M. Support Vector Machines: Theory and Applications. 2001, 2049, 249–257. [CrossRef]
- Jadwaa, S.K. X-Ray Lung Image Classification Using a Canny Edge Detector. J. Electr. Comput. Eng. 2022, 2022, 1–8. [Google Scholar] [CrossRef]
- Hasan, N.; Bao, Y.; Shawon, A.; Huang, Y. DenseNet Convolutional Neural Networks Application for Predicting COVID-19 Using CT Image. SN Comput. Sci. 2021, 2, 1–11. [Google Scholar] [CrossRef]
- Huang, G.; Liu, Z.; Van Der Maaten, L.; Weinberger, K.Q. Densely connected convolutional networks. In Proceedings of the 2017 IEEE Conference on Computer Vision and Pattern Recognition, Honolulu, HI, USA, 21–26 July 2017; pp. 2261–2269. [Google Scholar] [CrossRef]
|
Disclaimer/Publisher’s Note: The statements, opinions and data contained in all publications are solely those of the individual author(s) and contributor(s) and not of MDPI and/or the editor(s). MDPI and/or the editor(s) disclaim responsibility for any injury to people or property resulting from any ideas, methods, instructions or products referred to in the content. |
© 2024 by the authors. Licensee MDPI, Basel, Switzerland. This article is an open access article distributed under the terms and conditions of the Creative Commons Attribution (CC BY) license (http://creativecommons.org/licenses/by/4.0/).
