
Submitted:
29 June 2024
Posted:
01 July 2024
You are already at the latest version
Abstract
Background: Heart failure (HF) remains a challenging healthcare issue, necessitating innovative therapies like cardiac resynchronization-defibrillation therapy (CRT-D). However, defining CRT-D responders lacks uniformity, impeding effective clinical evaluation. This study explores diverse CRT-D responder definitions, encompassing functional, echocardiographic, and laboratory criteria.
Materials & Methods: A single-center study involving 132 CRT-D patients scrutinized responder criteria, including NYHA stage, LVEF increase, and proBNP decrease. Statistical analyses, such as Kaplan–Meier curves and Cox hazard regression, were employed to evaluate responder characteristics and survival outcomes.
Results: Responder rates varied across criteria, revealing nuanced patient profiles. CRT-D responders, defined by NYHA decrease, LVEF increase, or proBNP decrease, exhibit improved survival rates after 2 and 3 years (p < 0.050). Young age, absence of recent myocardial infarction, and normal right ventricular, echocardiographic parameters emerge as predictors for positive response. In part, drug-based HF therapy correlates with increased responder rates. Cox regression identified LVEF ≥ 5% and proBNP decrease ≥ 25% as independent predictors of extended survival.
Conclusions: CRT-D responder definitions exhibit considerable variability, emphasizing the need for a nuanced, patient-centered approach. Factors like right ventricular function, drug therapy, atrial fibrillation, and renal function influence responses. The study enriches our understanding of CRT-D response, contributing to the foundation for personalized HF management.
Keywords:
cardiac resynchronization therapy
; heart failure
; left ventricular ejection fraction
; proBNP
; responder status
1. Introduction
Heart failure (HF) stands as a formidable challenge in contemporary healthcare, demanding innovative therapeutic approaches to enhance patient outcomes [1]. Among the myriad interventions, cardiac resynchronization therapy (CRT-D) has emerged as a cornerstone in the management of HF, offering a ray of hope to those afflicted by this complex syndrome [2]. As the field of cardiology continues to evolve, an essential question resonates in the corridors of clinical practice: What defines a responder to CRT-D?
The concept of CRT-D responsiveness has been a subject of extensive investigation. While the benefits of CRT-D are well-established, the criteria defining a positive response remain elusive and multifaceted [3,4].
One commonly cited definition of CRT-D responders revolves around objective measures of cardiac function. Traditional metrics such as left ventricular ejection fraction (LVEF) and end-systolic volume have been pivotal in gauging the success of CRT-D [5,6]. Patients experiencing a significant improvement in these parameters post-implantation are often categorized as responders. However, the simplicity of these criteria belies the intricacies of the patient population and the diverse factors influencing response.
Beyond the realms of cardiac mechanics, the clinical realm introduces a myriad of subjective factors that contribute to the definition of CRT-D responders. Symptomatic relief, reflected in improvements in exercise tolerance, reduction in HF hospitalizations, and enhancements in quality of life, serves as an invaluable endpoint [3,7,8]. The subjective nature of these outcomes, however, adds a layer of complexity, as individual patient experiences and perceptions come into play, challenging the establishment of uniform criteria.
Furthermore, the emergence of advanced imaging modalities has provided clinicians with an unprecedented glimpse into the myocardial substrate. Tissue Doppler imaging [9], strain imaging [10], and myocardial perfusion imaging [11] are among the techniques that have been explored to refine the identification of CRT-D responders. These modalities offer insights into regional myocardial function and viability, contributing to a more nuanced understanding of response patterns.
As the horizon of CRT-D expands, the role of biomarkers in predicting response has garnered increasing attention. Neurohormonal activation, inflammatory markers, and genetic predispositions are among the factors under scrutiny, with ongoing research aiming to elucidate their predictive value [12,13,14]. Integrating these biomarkers into the CRT-D responder definition not only adds a layer of precision but also paves the way for personalized medicine in the realm of HF management.
This manuscript endeavors to unravel the intricate tapestry of CRT-D responders, navigating through diverse definitions and shedding light on the complexities that confront clinicians in their pursuit of optimal patient care.
2. Material & Methods
2.1. Study Population
The study population included 136 patients with indication for implantation of a CRT-D system at Paracelsus Medical University Hospital, Salzburg in the period from 2011 to 2021. Four patients were excluded from the final analysis due to loss to follow-up, resulting in a final cohort of 132 patients. Inclusion of patients was consecutive and retrospective.
The study protocol received approval from the local ethics committee of Paracelsus Medical University Salzburg (415-E/2427/7–2019) and adhered to the principles outlined in the Declaration of Helsinki and Good Clinical Practice. Patient consent was waived due to retrospective nature of the study.
2.2. Transthoracic Echocardiography
Transthoracic echocardiography (TTE) was routinely conducted, typically 1–4 weeks prior to CRT-D implantation, utilizing either an iE33 or Epiq 7 ultrasound device (Philips Healthcare, Hamburg, Germany). Experienced clinicians with over 4 years of training in echocardiography carried out these examinations. Left ventricular ejection fraction (LVEF) was computed using Simpson’s method. The maximum tricuspid regurgitation velocity was obtained using continuous wave Doppler over the tricuspid valve. Right atrial pressure and systolic pulmonary artery pressure (sPAP) were calculated following previously established methods [15]. A follow-up echocardiography was performed at intervals of approximately 6 months after CRT-D implantation.
2.3. Decision to CRT-D Implantation
In this study, the criteria for CRT-D implantation were systematically defined and applied [16]. The selection process involved a comprehensive evaluation of patients based on established clinical, echocardiographic, and electrocardiographic parameters. Clinical criteria included HF symptoms despite optimal medical therapy (at least 3 months of up-titrated HF medication) and reduced left ventricular ejection fraction (LVEF ≤ 35%). Additionally, echocardiographic assessments considered measures of ventricular dyssynchrony and structural abnormalities. Electrocardiographic criteria involved QRS duration (QRS width ≥ 130 ms) and morphology (left bundle branch block (LBBB) or non-LBBB/IVCD (intraventricular conduction delay)). The detailed methodology for CRT-D implantation eligibility aimed to provide a robust foundation for patient inclusion, ensuring a standardized and rigorous approach in evaluating the efficacy of CRT-D in the study cohort.
2.4. CRT-D Implantation
The implantation procedure involved transvenous placement of all leads through either the left-sided or right-sided cephalic and/or subclavian veins, with connections made to a previously described biventricular pacemaker [17]. The positioning of the left ventricular lead was aimed at the lateral coronary vein; if this was not accessible, alternative options included the posterolateral coronary vein, a posterior vein, or an anterolateral vein. During the implantation period of 10 years, various devices and leads from different manufacturers were implanted depending on current availability and the surgeon's preference.
2.5. Responder Criteria
The current guidelines [16] lack a distinct definition for the determination of responder status. Similarly, the existing literature on this topic lacks a standardized approach, creating challenges in making meaningful comparisons. This work endeavors to integrate functional congestion, echocardiographic criteria, and laboratory data in an effort to address this gap. Therefore, the following definitions were used in this paper:
- Functional status:
- 1. NYHA-improvement of ≥ I stage 6 months after CRT-D implantation
- Echocardiographic status:
- 2. LVEF-increase of 5% 6 months after CRT-D implantation
- 3. LVEF-increase of 10% 6 months after CRT-D implantation
- Laboratory status:
- 4. proBNP-decrease of ≥ 25% 6 months after CRT-D implantation
2.6. Statistical Analysis
The sample size for this study was determined through a calculation using G*Power 3.1, specifically for a t-test within the means test family, employing an a priori power analysis. The optimal sample size, calculated with an effect size (d) of 0.5, an alpha error of 0.05, a power of 0.95 (1 minus beta error), and an allocation ratio of 1, was found to be 176 patients. The current study, with a sample size of 132 patients, achieves a satisfactory power of 0.885 based on the parameters mentioned above.
Statistical analysis and graphical representation were conducted using SPSS (Version 25.0, SPSS Inc., USA). To assess normal distribution of variables, the Kolmogorov–Smirnov–Lilliefors test was employed. Metric data that followed a normal distribution were presented as mean ± standard deviation (SD) and analyzed using an unpaired Student's t-test. For metric data that did not exhibit a normal distribution, median and interquartile range (IQR) were reported, and the Mann–Whitney U-test was utilized for comparing two groups, while the Kruskal-Wallis test was employed for comparisons involving more than two groups. Categorical data were represented as frequencies and percentages, and the chi-square test was applied for comparisons.
Kaplan–Meier curves, along with corresponding log–rank tests and documentation of numbers at risk, were generated to discern potential disparities in 1- to 3-year survival between individuals exhibiting responder and non-responder characteristics.
For the calculation of hazard ratios (HR) and 95% confidence intervals (CI) related to 1-, 2-, and 3-year mortality, univariate Cox proportional hazard regression models were employed, considering various responder statuses. Subsequently, a multivariable Cox regression analysis was conducted to identify independent predictors of mortality. In this process, responder statuses associated with mortality in the univariate analysis (p < 0.050) were included, and a backward variable elimination procedure was implemented.
In order to eliminate potential confounding factors affecting the correlation between various responder statuses and clinical characteristics, a univariate binary logistic regression analysis was conducted. Additionally, a z-transformation was applied to metric data for enhanced comparability. Following this, a multivariate binary logistic regression analysis was undertaken to identify independent factors in predicting diverse responder statuses. To achieve this, covariates linked with a positive responder status in the univariate analysis (p < 0.050) were included, and a backward variable elimination process was executed.
3. Results
3.1. Overall Study Cohort and Baseline Characteristics
A total of 132 patients (75.0% men) were enrolled at Paracelsus Medical University Hospital, Salzburg. An overview of the overall baseline characteristics is provided in Table 1.
The average age of the study population was 65.0 ± 9.5 years. The vast majority of CRT-D patients (84.8%) were implanted for primary prophylactic reasons.
3.2. Responder Status and Baseline Characteristics
Table 2 provides an overview of the baseline characteristics in relation to the various responder criteria.
Considering the functional status based on the NYHA criterion, 43.9% (58 out of 132) of the patients were identified as responders. Within this responder group, individuals were not only significantly younger (62.0 ± 9.8 years vs. 67.5 ± 8.6 years; p = 0.001) but also exhibited a notably lower prevalence of myocardial infarction (24.1% vs. 40.5%; p = 0.047) and a reduced incidence of atrial fibrillation (AF) (20.7% vs. 43.2%; p = 0.006). Analyzing laboratory parameters, patients with a positive NYHA responder status demonstrated lower levels of creatinine (1.1 ± 0.5 mg/dl vs. 1.3 ± 0.6 mg/dl; p = 0.005) and proBNP values (1179.5 ± 2347.3 ng/l vs. 2612.5 ± 3469.8 ng/l; p < 0.001).
A comparable trend was observed among patients with a positive responder status for an increase in LVEF of ≥ 5% and ≥ 10%. In these instances, individuals were not only younger (LVEF ≥ 5%: 62.1 ± 9.7 years vs. 67.5 ± 8.6 years; p = 0.001 — LVEF ≥ 10%: 61.4 ± 10.0 years vs. 66.8 ± 8.8 years; p = 0.002) but also exhibited a significantly higher body mass index (BMI) (28.9 ± 5.4 kg/m² vs. 26.5 ± 4.3 kg/m²; p = 0.005 — LVEF ≥ 10%: 29.2 ± 5.7 kg/m² vs. 26.8 ± 4.4 kg/m²; p = 0.020). Similarly, patients with LVEF elevation of ≥ 5% and ≥ 10% had significantly lower incidences of recent myocardial infarction (23.3% vs. 41.7%; p = 0.026 — LVEF ≥ 10%: 20.9% vs. 39.3%; p = 0.036) and atrial fibrillation (18.3% vs. 45.8%; p = 0.001 — LVEF ≥ 10%: 11.6% vs. 43.8%; p < 0.001). Additionally, they exhibited lower levels of creatinine (1.0 ± 0.3 mg/dl vs. 1.4 ± 0.6 mg/dl; p < 0.001 — LVEF ≥ 10%: 1.0 ± 0.3 mg/dl vs. 1.3 ± 0.6 mg/dl; p < 0.001) and proBNP values (1179.5 ± 2222.3 ng/l vs. 2747.5 ± 3833.8 ng/l; p < 0.001 — LVEF ≥ 10%: 1215.0 ± 2398.0 ng/l vs. 2041.0 ± 3536.5 ng/l; p = 0.004).
The identification of a responder status through proBNP revealed a profile of patients who were not only younger (61.6 ± 10.1 years vs. 67.8 ± 8.0 years; p < 0.001) but also exhibited a higher BMI (28.8 ± 5.5 kg/m² vs. 26.6 ± 4.3 kg/m²; p = 0.011) and a lower incidence of AF (18.6% vs. 45.2%; p = 0.001). Moreover, as anticipated, this responder group demonstrated a more optimized and comprehensive HF drug therapy. The presence of loop diuretics (57.6% vs. 83.6%; p = 0.001) and amiodarone (18.6% vs. 41.1%; p = 0.006) was significantly more prevalent in association with a non-responder status.
3.3. Responder Status and Follow-Up Characteristics
Table 3 provides a concise overview of the pertinent clinical characteristics observed during the 6-month follow-up.
Irrespective of the responder criteria employed, patients identified as responders consistently exhibited superior control over NYHA progression, creatinine and proBNP values, along with improved left ventricular ejection fraction (LVEF) recorded postoperatively after 6 months. Specifically, patients with a positive responder status for NYHA ≥ I and LVEF ≥ 5% demonstrated notably enhanced right ventricular function, as evidenced by the determination of tricuspid annular plane systolic excursion (TAPSE) (NYHA ≥ I: 19.6 ± 3.1 mm vs. 16.6 ± 4.2 mm; p = 0.027 — LVEF ≥ 5%: 19.7 ± 3.5 mm vs. 16.1 ± 3.8 mm; p = 0.007) or the TAPSE/sPAP ratio, reflecting improved right ventricular-arterial coupling (NYHA ≥ I: 0.6 ± 0.1 vs. 0.4 ± 0.1; p < 0.001 — LVEF ≥ 5%: 0.5 ± 0.2 vs. 0.4 ± 0.2; p = 0.041). Interestingly, neither defibrillator shock therapies nor ventricular tachycardias up to three years had an impact on the investigated responder status.
3.4. Responder Status-Dependent Survival after CRT-D Implantation
To visualize the survival of responders vs. non-responders using the definitions above, Kaplan–Meier curves were generated up to 3 years after CRT-D implantation with corresponding log-rank tests and numbers at risk calculated annually (Figure 1). Patients with a positive responder status, regardless of the chosen definition, exhibited markedly enhanced survival rates in the calculated log-rank tests for 2- and 3-year survival (Figure 1A: NYHA ≥ I; Figure 1B: LVEF ≥ 5%; Figure 1C: LVEF ≥ 10%; Figure 1D: proBNP-decrease ≥ 25%). Notably, the 1-year log-rank tests for the responder criterion NYHA ≥ I and LVEF ≥ 5% also demonstrated statistically significant differences.
1A: Responder criterion NYHA-improvement ≥ I
1B: Responder criterion LVEF-increase ≥ 5%.
1C: Responder criterion LVEF-increase ≥ 10%.
1D: Responder criterion proBNP-decrease ≥ 25%.
Cox hazard regression analysis were performed for 1, 2, and 3 years to ascertain the predictive capacity of individual responder criteria or combinations thereof in determining the survival of recipients of CRT-D (Table 4).
Concerning 3-year survival, the responder criteria LVEF ≥ 5% (p = 0.033) and proBNP-decrease ≥ 25% (p = 0.041) emerged as independent factors associated with extended survival following CRT-D implantation.
3.5. Predictive Factors Regarding Responder Status
To ascertain a significant statistical association between various responder criteria and other clinical factors, particularly gender, age, weight, height, etc., both univariate and multivariable binary logistic regressions were conducted (Table 5, Table 6, Table 7 and Table 8).
For the functional status criterion of NYHA ≥ I (Table 5), young age (HR: 0.553, 95% CI: 0.306 — 0.997; p = 0.049), absence of recent MI (HR: 0.217, 95% CI: 0.063 — 0.743; p = 0.015) and preoperative TAPSE (HR: 1.832, 95% CI: 1.014 — 3.311; p = 0.045) were independent factors for a positive response rate
For the echocardiographic status with an increase in LVEF ≥ 5% (Table 6), the use of an SGLT2 inhibitor (HR: 9.013, 95% CI: 1.614 — 50.313; p = 0.012), a low baseline creatinine (HR: 0.155, 95% CI: 0.047 — 0.505; p = 0.002) and, again, the TAPSE (HR: 2.858, 95% CI: 1.305 — 6.259; p = 0.009) were independent criteria for a positive response after CRT-D treatment. With an improvement in LVEF ≥ 10% (Table 7), the absence of a previous myocardial infarction (HR: 0.091, 95% CI: 0.012 — 0.667; p = 0.018) and the preoperative absence of atrial fibrillation (HR: 0.028, 95 % CI: 0.002 — 0.314; p = 0.004) were favorable, independent factors for a positive responder status.
Independent factors associated with the laboratory definition of CRT-D response (Table 8) were increased BMI (HR: 1.545, 95% CI: 1.023 — 2.332; p = 0.039), absence of AF (HR: 0.369, 95% CI: 0.149 — 0.918; p = 0.032), use of Angiotensin-Receptor-Neprilysin inhibitor (ARNI) (HR: 2.717, 95% CI: 1.110 — 6.649; p = 0.029), and low baseline creatinine (HR: 0.455, 95% CI: 0.248 — 0.834; p = 0.011).
4. Discussion
CRT-D responder definitions exhibit considerable variability, lacking standardization across the medical community. This lack of consensus poses a significant challenge in clinical practice, as diverse criteria are employed to identify responders. The absence of clear, universally accepted responder definitions in current guidelines [16] further compounds this issue, leaving clinicians without a standardized framework for patient evaluation and CRT-D response assessment. Consequently, the inconsistency in defining responders impedes the comparison of study findings, complicates the establishment of evidence-based practices and hindering effective communication among healthcare professionals.
The aim of this single center study was to compare different definitions of CRT-D responder status using a wide range of functional, echocardiographic and laboratory criteria. Once more, it becomes evident that there is no singular definition for a CRT-D responder. Instead, numerous parameters must be integrated to allow accurate predictions regarding whether a patient will derive benefits from a CRT-D system.
4.1. Influence of Right Ventricular Function on CRT-D Implantation
The role of right ventricular function in determining CRT-D responder status is a critical aspect deserving thorough discussion. Our findings underscore the significance of assessing right ventricular function, particularly in patients categorized as CRT-D responders based on left ventricular criteria. The right ventricle's intricate interplay with the left ventricle and its response to CRT-D can significantly influence overall cardiac performance [18].
Several studies have highlighted the impact of right ventricular dysfunction on clinical outcomes in CRT-D recipients [18,19,20,21]. In our investigation, the positive association between CRT-D responders, defined by improvement of functional status (NYHA-improvement ≥ I) or by echocardiographic status (LVEF-increase ≥ 5%), and preserved right ventricular function preoperatively, as evidenced by TAPSE and the TAPSE/sPAP ratio, further emphasizes the importance of considering both ventricles in evaluating CRT-D efficacy. These results were almost congruent with previous studies by Abreu et al. [22] (TAPSE) and Stassen et al. [23] (TAPSE/sPAP), which also propagated a better response to CRT-D therapy with preserved right ventricular function.
The observed context between a positive CRT-D responder status and a normal right ventricular function prompts a deeper exploration of the potential mechanisms involved. It raises questions about the hemodynamic and electrical interactions between the ventricles and how optimizing CRT-D settings for both may contribute to better overall outcomes. Additionally, these findings advocate for a comprehensive evaluation of both ventricles in CRT-D assessment protocols and underscore the need for future research to elucidate the nuanced interplay between left and right ventricular function in CRT-D responders.
4.2. Influence of Drug-Based HF Therapy on CRT-D Implantation
Optimal pharmacological management is integral to the comprehensive care of HF patients, and its influence on the outcomes with CRT-D is a topic of substantial importance [24].
Our study reveals compelling associations between specific drug therapies and CRT-D responder status. Notably, patients on more extensive HF drug regimens demonstrated higher rates of positive CRT-D response. This finding underscores the synergistic relationship between pharmacological interventions and CRT-D efficacy. It suggests that an optimized drug-based HF therapy may create a more favorable substrate for the success of CRT-D, potentially enhancing its clinical benefits [25].
The observed positive context between CRT-D response and certain drug classes, such as beta-blockers, ACEIs, MRAs and ARNIs aligns with established evidence supporting the efficacy of these medications in HF management. Their impact on neurohormonal modulation and ventricular remodeling likely contributes to the observed association with improved CRT-D outcomes [25,26].
However, the complexities surrounding drug-based HF therapy and CRT-D response warrant careful consideration. The heterogeneity of HF etiologies and patient characteristics introduces variability in drug responses and, consequently, CRT-D outcomes. Furthermore, the intricate interplay between pharmacological and device-based therapies necessitates a personalized and nuanced approach to patient management. Future research should delve into the specific mechanisms through which individual drug classes influence CRT-D response, exploring potential synergies and interactions. Additionally, investigations into the optimal timing and sequencing of drug therapy initiation in relation to CRT-D implantation could provide valuable insights for refining treatment strategies.
4.3. Influence of Atrial Fibrillation on CRT-D Implantation
Atrial fibrillation, as a prevalent comorbidity in HF patients, adds a layer of complexity to the evaluation of CRT-D outcomes. Our study meticulously examined the impact of AF on CRT-D response, recognizing the challenges posed by this arrhythmia in achieving optimal cardiac resynchronization. The observed difference in CRT-D responder rates between patients with and without AF highlights a potential correlation between atrial fibrillation and a less favorable response to CRT-D [27] or increased mortality [28]
One plausible explanation for the reduced responder rates in the AF subgroup lies in the irregular atrial rhythm characteristic of AF. This irregularity can disrupt the temporal relationship between atrial and ventricular contractions, complicating the achievement of optimal biventricular synchronization — a cornerstone of successful CRT-D. The irregular ventricular activation and the loss of atrioventricular synchrony in the presence of AF may contribute to suboptimal CRT-D response [29,30].
The implications extend beyond responder rates to the intricacies of device programming and optimization for patients with atrial fibrillation. Tailoring CRT-D strategies to address the unique challenges posed by irregular atrial rhythm becomes paramount. CRT-D Optimizing device settings, adjusting pacing algorithms, together with pharmacological or ablative measures to block AV nodal conduction may be strategies to improve outcomes of CRT-D recipients with concomitant AF.
4.4. Influence of Kidney Function on CRT-D Implantation
Renal function, reflected by serum creatinine levels, emerges as a key determinant with potential implications for the outcomes of CRT-D [31]. A relevant discovery from our study is the inverse correlation identified between serum creatinine levels and the response to CRT-D. Specifically, patients characterized as CRT-D responders exhibited lower creatinine values. This association was also described by Goldenberg et al. [32] as part of the MADIT-CRT-D Trial.
Impaired renal function in HF patients has broader physiological ramifications. It may impact fluid balance, electrolyte homeostasis, and neurohormonal activation, all of which are intricately linked to HF progression. The observed correlation suggests that optimizing renal function may play a role in enhancing the response to CRT-D [33]. Strategies aimed at mitigating renal impairment, such as meticulous fluid management and judicious use of medications, could be integral components of an effective CRT-D optimization approach [34]. Some of the CRT-D devices provide useful information about the lung fluid status as measured by transthoracic impedance changes over time that may help to reduce the short-term risk for heart failure hospitalization [35].
However, the intricate relationship between renal function and CRT-D response introduces a level of complexity that warrants further investigation. Future research endeavors should delve into more advanced renal biomarkers, considering factors beyond serum creatinine. Assessing the impact of fluid status, exploring the potential benefits of interventions targeting renal optimization, and elucidating the mechanisms through which renal function influences CRT-D response are avenues ripe for exploration.
5. Limitation
- Single-Center Design: The study's reliance on data from a single center may limit the generalizability of the findings. Variations in patient demographics, local practices, and healthcare infrastructure could influence the external validity of the results.
- Retrospective Nature: The retrospective nature of the study design might introduce inherent biases, including selection bias and information bias. The reliance on existing medical records could lead to incomplete or missing data, impacting the comprehensiveness of the analysis.
- Sample Size: The study's sample size, though sufficient for the conducted analyses, might pose limitations when stratifying results based on certain subgroups or rare outcomes. Larger cohorts would enhance the statistical power for subgroup analyses, even if the statistical power was a satisfactory 88.5%.
- Definition of Responder Status: The lack of a universally accepted definition for CRT-D responder status could introduce variability in patient classification. The absence of standardized criteria across studies or clinical guidelines may impact the consistency and comparability of findings.
- Follow-Up Duration: The study's follow-up duration may be limited, particularly if exploring longer-term outcomes. Extended follow-up periods could provide a more comprehensive understanding of the durability of CRT-D response and potential late effects.
- Incomplete Covariate Adjustment: Despite efforts to control for confounding variables, unmeasured or residual confounding may persist. Incomplete adjustment for relevant covariates could influence the accuracy of the observed associations.
- Medication changes: The impact of CRT-D on medication, including potential post-implantation adjustments, is hindered by the probable unavailability of data on medication changes, with this study solely relying on baseline medication documentation.
6. Conclusions
This manuscript embarks on a comprehensive journey, weaving through the intricate fabric of CRT-D responsiveness definitions, acknowledging the challenges faced by clinicians, and highlighting the imperative for a holistic and patient-centered approach. As we delve into the nuances of CRT-D response, the hope is to foster a dialogue that transcends conventional boundaries, propelling us toward a future where personalized medicine in HF management becomes a tangible reality.
Author Contributions
Conceptualization: E.B., B.S, Statistical analysis E.B, Writing — original draft preparation E.B., S.Z., Writing — review and editing E.B., C.D., C.G., M.H., L.M., M.L., U.C.H., B.S., Data collection — E.B., S.Z., Implementation of interventions — J.K., C.D., C.S., F.D., T.K., B.S. , Project administration U.C.H., B.S. All authors have read and agreed to the published version of the manuscript.
Funding
No funding was needed for this study.
Data Availability Statement
The data underlying this article will be shared on reasonable request to the corresponding author.
Conflicts of Interest
The authors declare that the research was conducted in the absence of any commercial or financial relationships that could be constructed as a potential conflict of interest.
References
- Roger V. L. (2021). Epidemiology of Heart Failure: A Contemporary Perspective. Circulation research, 128(10), 1421–1434. [CrossRef]
- Jaffe, L. M., & Morin, D. P. (2014). Cardiac resynchronization therapy: history, present status, and future directions. Ochsner journal, 14(4), 596–607.
- Nakai, T., Ikeya, Y., Kogawa, R., Otsuka, N., Wakamatsu, Y., Kurokawa, S., Ohkubo, K., Nagashima, K., & Okumura, Y. (2021). What Are the Expectations for Cardiac Resynchronization Therapy? A Validation of Two Response Definitions. Journal of clinical medicine, 10(3), 514. [CrossRef]
- Bakos, Z., Chatterjee, N. C., Reitan, C., Singh, J. P., & Borgquist, R. (2018). Prediction of clinical outcome in patients treated with cardiac resynchronization therapy - the role of NT-ProBNP and a combined response score. BMC cardiovascular disorders, 18(1), 70. [CrossRef]
- van 't Sant, J., Mast, T. P., Bos, M. M., Ter Horst, I. A., van Everdingen, W. M., Meine, M., & Cramer, M. J. (2016). Echo response and clinical outcome in CRT-D patients. Netherlands heart journal : monthly journal of the Netherlands Society of Cardiology and the Netherlands Heart Foundation, 24(1), 47–55. [CrossRef]
- Allison, J. D., Jr, Biton, Y., & Mela, T. (2022). Determinants of Response to Cardiac Resynchronization Therapy. The Journal of innovations in cardiac rhythm management, 13(5), 4994–5003. [CrossRef]
- Gold, M. R., Rickard, J., Daubert, J. C., Zimmerman, P., & Linde, C. (2021). Redefining the Classifications of Response to Cardiac Resynchronization Therapy: Results From the REVERSE Study. JACC. Clinical electrophysiology, 7(7), 871–880. [CrossRef]
- Rosero, S. Z., Hernandez, N., Goldenberg, I., McNitt, S., Plonsky, B., Zareba, W., Buber, Y., Solomon, S. D., & Kutyifa, V. (2020). Utility of 6-Minute Walk Test to Predict Response to Cardiac Resynchronization Therapy in Patients With Mild Heart Failure. The American journal of cardiology, 132, 79–86. [CrossRef]
- Kuppahally, S. S., Fowler, M. B., Vagelos, R., Wang, P., Al-Ahmad, A., Hsia, H., & Liang, D. (2010). Dyssynchrony Assessment with Tissue Doppler Imaging and Regional Volumetric Analysis by 3D Echocardiography Do Not Predict Long-Term Response to Cardiac Resynchronization Therapy. Cardiology research and practice, 2011, 568918. [CrossRef]
- Zweerink, A., van Everdingen, W. M., Nijveldt, R., Salden, O. A. E., Meine, M., Maass, A. H., Vernooy, K., de Lange, F. J., Vos, M. A., Croisille, P., Clarysse, P., Geelhoed, B., Rienstra, M., van Gelder, I. C., van Rossum, A. C., Cramer, M. J., & Allaart, C. P. (2018). Strain imaging to predict response to cardiac resynchronization therapy: a systematic comparison of strain parameters using multiple imaging techniques. ESC heart failure, 5(6), 1130–1140. [CrossRef]
- Abdellatif, Y. A., Onsy, A. M., Eldemerdash, S. E. H., Rayan, M. M., Abu Shouk, H. M., & Badran, H. A. (2023). Prediction of Cardiac Resynchronization Therapy Response Using Quantitative Gated Myocardial Perfusion Imaging. The Journal of innovations in cardiac rhythm management, 14(1), 5313–5321. [CrossRef]
- Heggermont, W., Auricchio, A., & Vanderheyden, M. (2019). Biomarkers to predict the response to cardiac resynchronization therapy. Europace : European pacing, arrhythmias, and cardiac electrophysiology : journal of the working groups on cardiac pacing, arrhythmias, and cardiac cellular electrophysiology of the European Society of Cardiology, 21(11), 1609–1620. [CrossRef]
- Asgardoon, M. H., Vasheghani-Farahani, A., & Sherafati, A. (2020). Usefulness of Biomarkers for Predicting Response to Cardiac Resynchronization Therapy. Current cardiology reviews, 16(2), 132–140. [CrossRef]
- Yokoyama, Y., Kataoka, N., Nakai, M., Matsuo, A., Fujiwara, A., Wakamiya, A., Ueda, N., Nakajima, K., Kamakura, T., Wada, M., Yamagata, K., Ishibashi, K., Inoue, Y., Miyamoto, K., Nagase, S., Noda, T., Aiba, T., Takahama, H., Izumi, C., Kinugawa, K., … Kusano, K. (2022). A new biomarker of cardiac resynchronization therapy response: cGMP to mature BNP ratio. Journal of cardiology, 79(6), 727–733. [CrossRef]
- Parasuraman, S., Walker, S., Loudon, B. L., Gollop, N. D., Wilson, A. M., Lowery, C., & Frenneaux, M. P. (2016). Assessment of pulmonary artery pressure by echocardiography-A comprehensive review. International journal of cardiology. Heart & vasculature, 12, 45–51. [CrossRef]
- Glikson, M., Nielsen, J. C., Kronborg, M. B., Michowitz, Y., Auricchio, A., Barbash, I. M., Barrabés, J. A., Boriani, G., Braunschweig, F., Brignole, M., Burri, H., Coats, A. J. S., Deharo, J. C., Delgado, V., Diller, G. P., Israel, C. W., Keren, A., Knops, R. E., Kotecha, D., Leclercq, C., … ESC Scientific Document Group (2021). 2021 ESC Guidelines on cardiac pacing and cardiac resynchronization therapy. European heart journal, 42(35), 3427–3520. [CrossRef]
- Daubert, J. C., Ritter, P., Le Breton, H., Gras, D., Leclercq, C., Lazarus, A., Mugica, J., Mabo, P., & Cazeau, S. (1998). Permanent left ventricular pacing with transvenous leads inserted into the coronary veins. Pacing and clinical electrophysiology : PACE, 21(1 Pt 2), 239–245. [CrossRef]
- Sidiropoulos, G., Antoniadis, A., Saplaouras, A., Bazoukis, G., Letsas, Κ. P., Karamitsos, T. D., Giannopoulos, G., & Fragakis, N. (2023). Impact of baseline right ventricular function on the response to cardiac resynchronization therapy - A meta-analysis. Hellenic journal of cardiology : HJC = Hellenike kardiologike epitheorese, 73, 61–68. [CrossRef]
- Ogunyankin, K. O., & Puthumana, J. J. (2010). Effect of cardiac resynchronization therapy on right ventricular function. Current opinion in cardiology, 25(5), 464–468. [CrossRef]
- Alpendurada, F., Guha, K., Sharma, R., Ismail, T. F., Clifford, A., Banya, W., Mohiaddin, R. H., Pennell, D. J., Cowie, M. R., McDonagh, T., & Prasad, S. K. (2011). Right ventricular dysfunction is a predictor of non-response and clinical outcome following cardiac resynchronization therapy. Journal of cardiovascular magnetic resonance : official journal of the Society for Cardiovascular Magnetic Resonance, 13(1), 68. [CrossRef]
- Patel, D., Trulock, K., Kumar, A., Kiehl, E., Toro, S., Moennich, L. A., Gorodeski, E., Hussein, A., Cantillon, D., Tarakji, K. G., Niebauer, M., Wazni, O., Varma, N., Wilkoff, B., & Rickard, J. W. (2020). Baseline Right Ventricular Dysfunction Predicts Worse Outcomes in Patients Undergoing Cardiac Resynchronization Therapy Implantation. Journal of cardiac failure, 26(3), 227–232. [CrossRef]
- Abreu, A., Oliveira, M., Silva Cunha, P., Santa Clara, H., Santos, V., Portugal, G., Rio, P., Soares, R., Moura Branco, L., Alves, M., Papoila, A. L., Ferreira, R., Mota Carmo, M., & BETTER-HF investigators (2017). Predictors of response to cardiac resynchronization therapy: A prospective cohort study. Revista portuguesa de cardiologia : orgao oficial da Sociedade Portuguesa de Cardiologia = Portuguese journal of cardiology : an official journal of the Portuguese Society of Cardiology, 36(6), 417–425. [CrossRef]
- Stassen, J., Galloo, X., Hirasawa, K., Chimed, S., Marsan, N. A., Delgado, V., van der Bijl, P., & Bax, J. J. (2022). Right ventricular-pulmonary artery coupling in cardiac resynchronization therapy: evolution and prognosis. ESC heart failure, 9(3), 1597–1607. [CrossRef]
- Aranda, J. M., Jr, Woo, G. W., Schofield, R. S., Handberg, E. M., Hill, J. A., Curtis, A. B., Sears, S. F., Goff, J. S., Pauly, D. F., & Conti, J. B. (2005). Management of heart failure after cardiac resynchronization therapy: integrating advanced heart failure treatment with optimal device function. Journal of the American College of Cardiology, 46(12), 2193–2198. [CrossRef]
- Schmidt, S., Hürlimann, D., Starck, C. T., Hindricks, G., Lüscher, T. F., Ruschitzka, F., & Steffel, J. (2014). Treatment with higher dosages of heart failure medication is associated with improved outcome following cardiac resynchronization therapy. European heart journal, 35(16), 1051–1060. [CrossRef]
- Witt, C. T., Kronborg, M. B., Nohr, E. A., Mortensen, P. T., Gerdes, C., & Nielsen, J. C. (2015). Optimization of heart failure medication after cardiac resynchronization therapy and the impact on long-term survival. European heart journal. Cardiovascular pharmacotherapy, 1(3), 182–188. [CrossRef]
- Upadhyay, G. A., & Steinberg, J. S. (2012). Managing atrial fibrillation in the CRT-D patient: controversy or consensus?. Heart rhythm, 9(8 Suppl), S51–S59. [CrossRef]
- Hoppe, U. C., Casares, J. M., Eiskjaer, H., Hagemann, A., Cleland, J. G., Freemantle, N., & Erdmann, E. (2006). Effect of cardiac resynchronization on the incidence of atrial fibrillation in patients with severe heart failure. Circulation, 114(1), 18–25. [CrossRef]
- Sieniewicz, B. J., Gould, J., Porter, B., Sidhu, B. S., Teall, T., Webb, J., Carr-White, G., & Rinaldi, C. A. (2019). Understanding non-response to cardiac resynchronisation therapy: common problems and potential solutions. Heart failure reviews, 24(1), 41–54. [CrossRef]
- Elliott, M. K., Mehta, V. S., Martic, D., Sidhu, B. S., Niederer, S., & Rinaldi, C. A. (2021). Atrial fibrillation in cardiac resynchronization therapy. Heart rhythm O2, 2(6Part B), 784–795. [CrossRef]
- Dębska-Kozłowska, A., Warchoł, I., Książczyk, M., & Lubiński, A. (2021). The Significance of Renal Function in Response to Cardiac Resynchronisation Therapy - A Piece of a Much Larger Puzzle. Current vascular pharmacology, 19(4), 403–410. [CrossRef]
- Goldenberg, I., Moss, A. J., McNitt, S., Barsheshet, A., Gray, D., Andrews, M. L., Brown, M. W., Zareba, W., Sze, E., Solomon, S. D., Pfeffer, M. A., & Multicenter Automatic Defibrillator Implantation Trial--Cardiac Resynchronization Therapy Investigators (2010). Relation between renal function and response to cardiac resynchronization therapy in Multicenter Automatic Defibrillator Implantation Trial--Cardiac Resynchronization Therapy (MADIT-CRT-D). Heart rhythm, 7(12), 1777–1782. [CrossRef]
- Fung, J. W., Szeto, C. C., Chan, J. Y., Zhang, Q., Chan, H. C., Yip, G. W., & Yu, C. M. (2007). Prognostic value of renal function in patients with cardiac resynchronization therapy. International journal of cardiology, 122(1), 10–16. [CrossRef]
- Ter Maaten, J. M., Martens, P., L'hoyes, W., Maass, A. H., Damman, K., Dupont, M., & Mullens, W. (2019). Response to Cardiac Resynchronization Therapy Across Chronic Kidney Disease Stages. Journal of cardiac failure, 25(10), 803–811. [CrossRef]
- Abraham, W. T., Compton, S., Haas, G., Foreman, B., Canby, R. C., Fishel, R., McRae, S., Toledo, G. B., Sarkar, S., Hettrick, D. A., & FAST Study Investigators (2011). Intrathoracic impedance vs daily weight monitoring for predicting worsening heart failure events: results of the Fluid Accumulation Status Trial (FAST). Congestive heart failure (Greenwich, Conn.), 17(2), 51–55. [CrossRef]
Figure 1.
Kaplan-Meier curves with corresponding numbers at risk and annually log-rank tests for detection of 1- to 3-year survival in CRT-D responders vs. CRT-D non-responders.
Figure 1.
Kaplan-Meier curves with corresponding numbers at risk and annually log-rank tests for detection of 1- to 3-year survival in CRT-D responders vs. CRT-D non-responders.
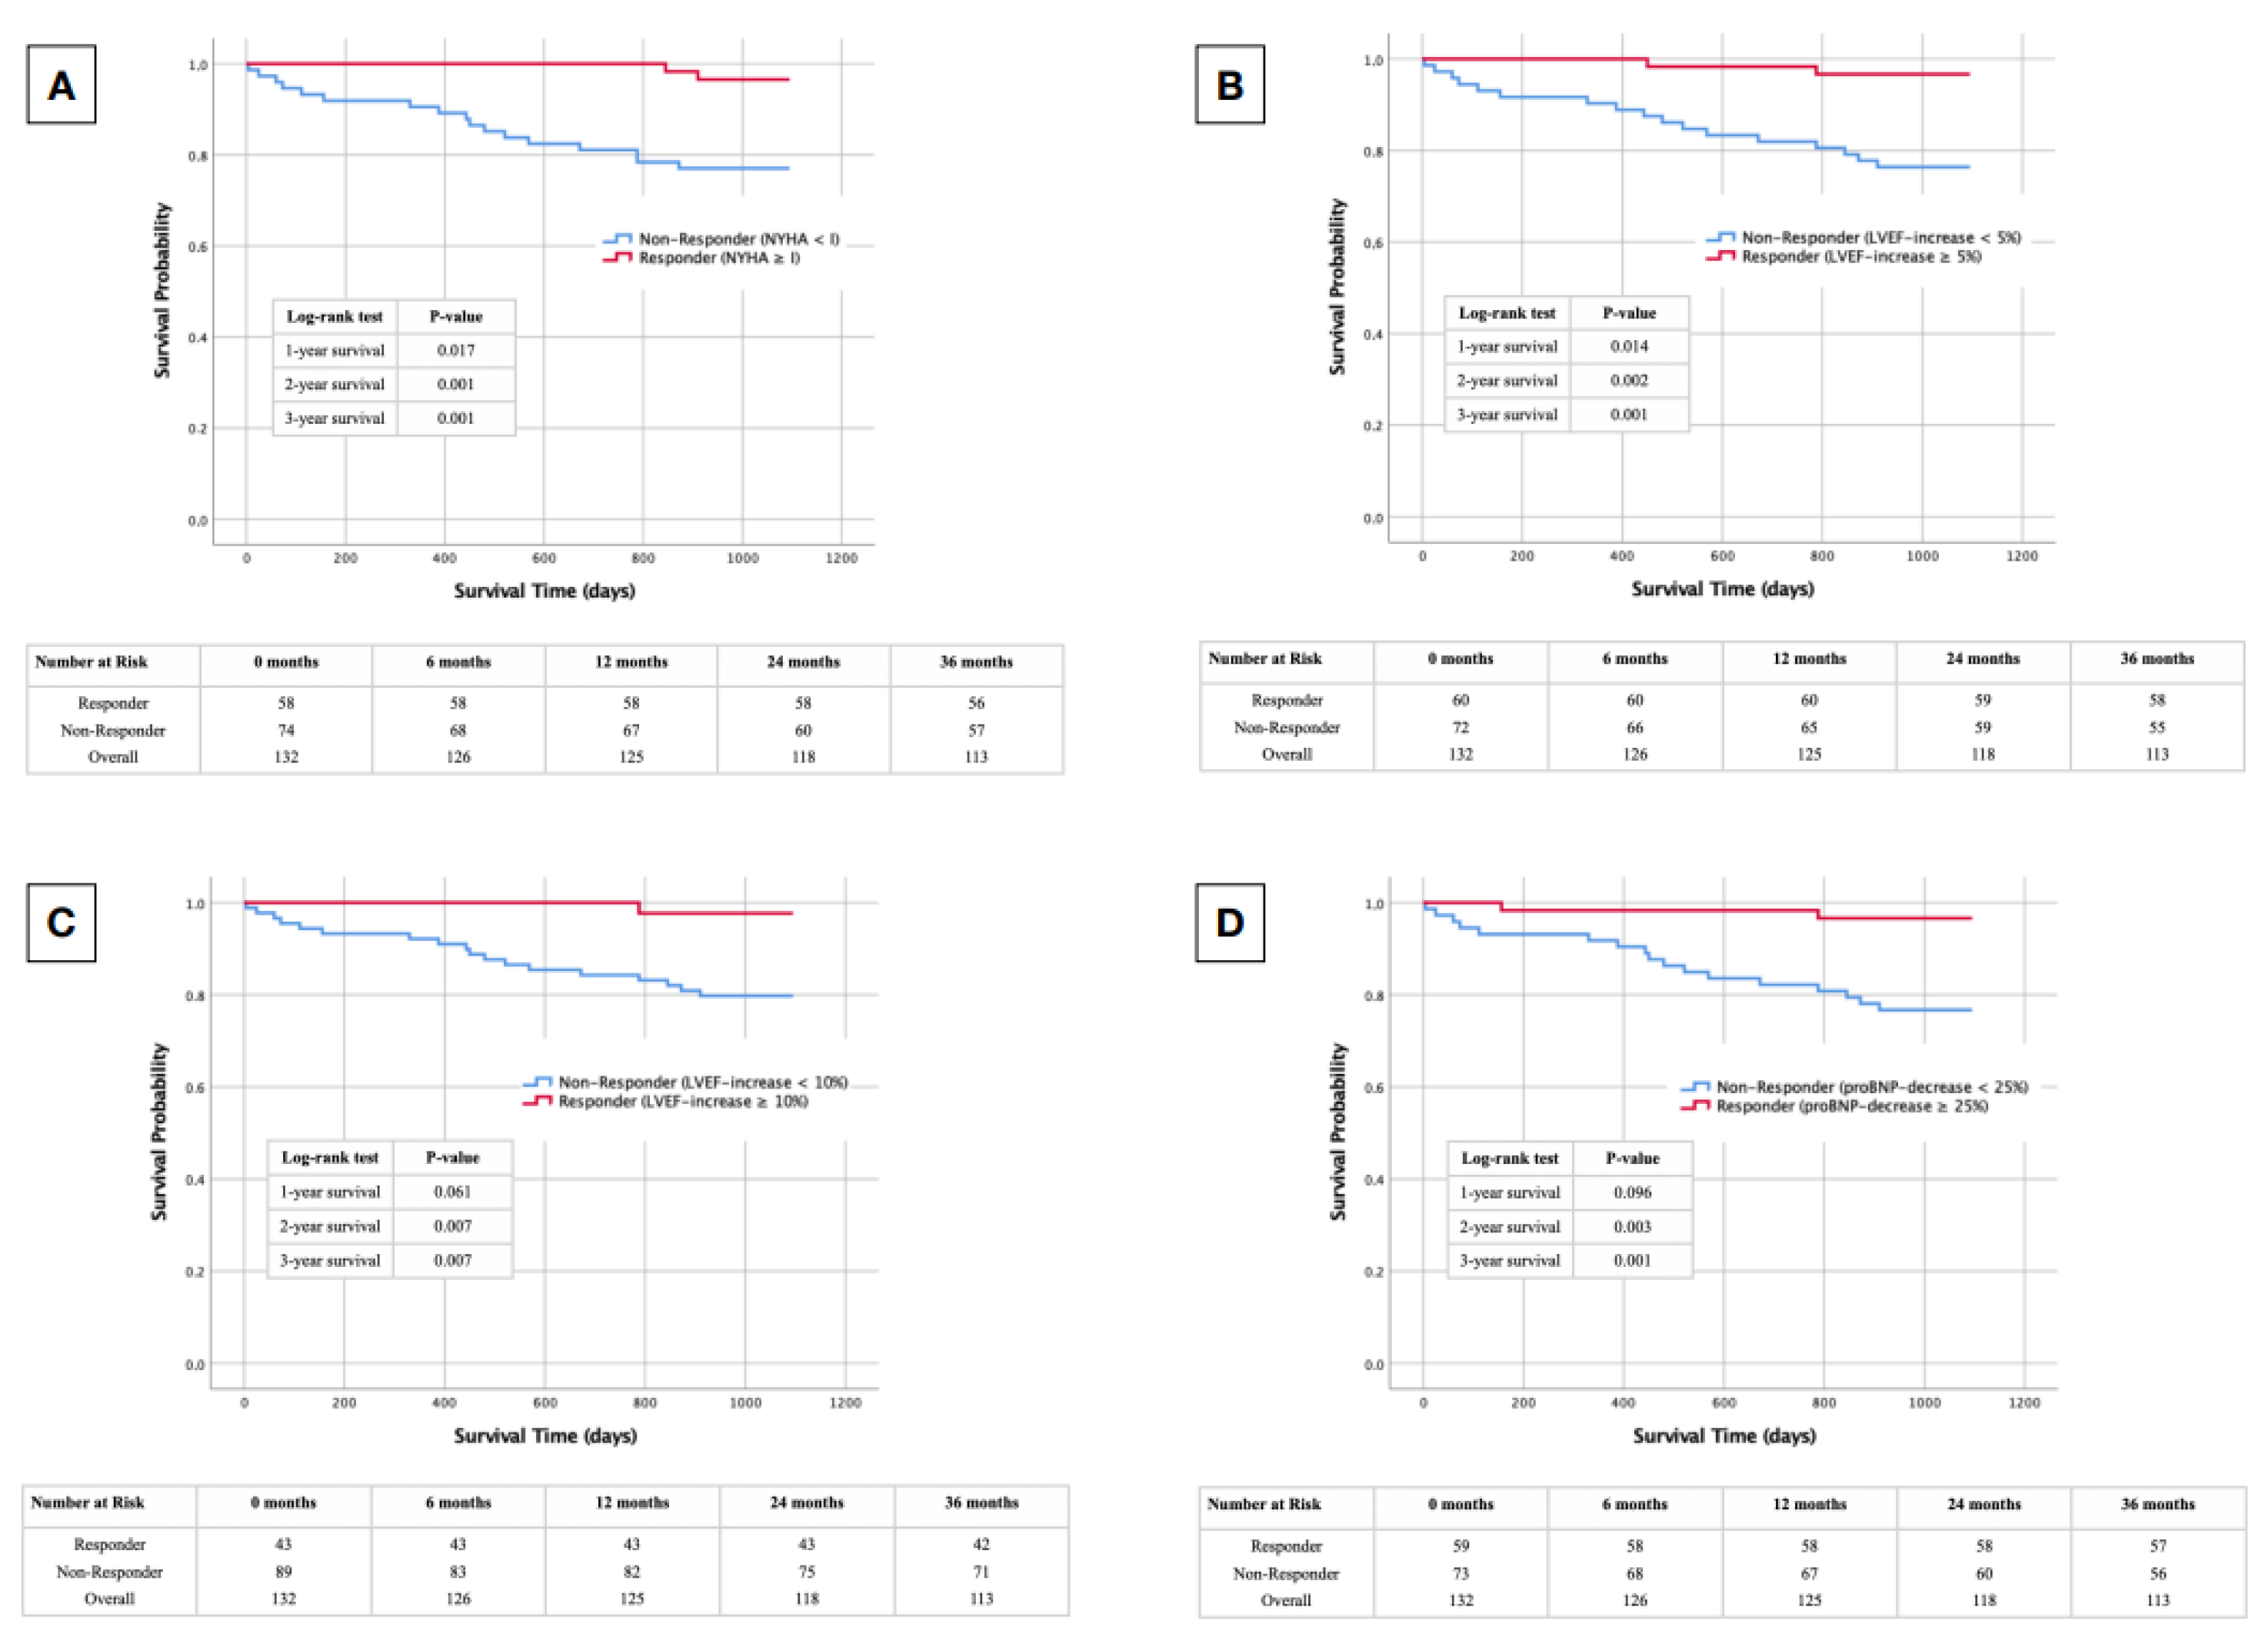

Table 1.
Baseline characteristics of of overall study cohort.
| Overall | |
|---|---|
|
Demographics n Male (%) Age (years — mean ± SD) |
132 75.0 65.0 ± 9.5 |
|
Clinical Weight (kg — mean ± SD) Height (m — mean ± SD) BMI (kg/m2 — mean ± SD) BMI < 18.5 kg/m2 (%) BMI 18.5 - 24.9 kg/m2 (%) BMI 25.0 - 29.9 kg/m2 (%) BMI 30.0 - 34.9 kg/m2 (%) BMI 35.0 - 39.9 kg/m2 (%) BMI ≥ 40.0 kg/m2 (%) ICMP (%) NICMP (%) Arterial Hypertension (%) Diabetes mellitus (%) Dyslipidemia (%) CVD (%) CVD – 1 vessel (%) CVD – 2 vessels (%) CVD – 3 vessels (%) Recent MI (%) Recent CABG (%) AF (%) COPD (%) Asthma (%) PAOD (%) Anemia (%) CKD > II (%) Recent Stroke (%) |
83.5 ± 16.9 173.7 ± 8.5 27.6 ± 5.0 2.3 31.8 38.6 18.9 6.8 1.5 35.6 59.1 65.2 39.4 70.5 50.8 21.1 11.4 16.7 33.3 11.4 33.3 12.9 2.3 8.3 3.8 44.7 11.4 |
|
Functional Class NYHA (median ± IQR) NYHA II (%) NYHA III (%) NYHA IV (%) |
3.0 ± 1.0 43.9 53.8 2.3 |
|
Medication ACEI/ARB (%) BB (%) Ivabradine (%) MRA (%) ARNI (%) SGLT2I (%) Loop Diuretics (%) Digoxin/Digitoxin (%) Amiodarone (%) |
67.4 95.5 6.8 72.0 28.8 12.1 72.0 12.1 31.1 |
|
Laboratory Creatinine (mg/dl — median ± IQR) proBNP (ng/l — median ± IQR) |
1.2 ± 0.5 2459.0 ± 3146.5 |
|
ECG LBBB (%) QRS-width (ms — mean ± SD) |
88.6 170.4 ± 28.4 |
|
Echocardiography LVEF (% — mean ± SD) LVEDD (mm — mean ± SD) TAPSE (mm — mean ± SD sPAP (mmHg — mean ± SD) |
27.0 ± 7.6 63.9 ± 8.2 18.4 ± 4.8 45.8 ± 13.2 |
|
Implantation characteristics Primary prevention (%) |
84.8 |
BMI: body mass index; ICMP: ischemic cardiomyopathy; NICMP: non-ischemic cardiomyopathy; CVD: cardiovascular disease; MI: myocardial infarction; CABG: coronary artery bypass graft; AF: atrial fibrillation; COPD: chronic obstructive pulmonary disease; PAOD: peripheral artery occlusive disease; CKD: chronic kidney disease; ACEI/ARB: angiotensin converting enzyme inhibitor/angiotensin-II-receptor blocker; BB: beta blocker; MRA: mineralocorticoid-receptor antagonist; ARNI: angiotensin-receptor-neprilysin inhibitor; SGLT2I: sodium-glucose-transporter-2 inhibitor; LBBB: left bundle branch block; LVEF: left ventricular ejection fraction; LVEDD: left ventricular end diastolic diameter; TAPSE: tricuspid annular plane systolic excursion; sPAP: systolic pulmonary artery pressure.
Table 2.
Baseline characteristics depending on different responder definitions.
| Functional Status NYHA-improvement ≥ I R NR p |
Echocardiographic Status LVEF-increase ≥ 5% LVEF-increase ≥ 10% R NR p R NR p |
Laboratory Status proBNP-decrease ≥ 25% R NR p |
||||||||||
|---|---|---|---|---|---|---|---|---|---|---|---|---|
|
Demographics n Male (%) Age (years — mean ± SD) |
58 69.0 62.0 ± 9.8 |
74 79.7 67.5 ± 8.6 |
0.156 0.001 |
60 65.0 62.1 ± 9.7 |
72 83.3 67.5 ± 8.6 |
0.015 0.001 |
43 67.4 61.4 ± 10.0 |
89 78.7 66.8 ± 8.8 |
0.163 0.002 |
59 64.4 61.6 ± 10.1 |
73 83.6 67.8 ± 8.0 |
0.012 0.000 |
|
Clinical Weight (kg — mean ± SD) Height (m — mean ± SD) BMI (kg/m2 — mean ± SD) BMI < 18.5 kg/m2 (%) BMI 18.5 - 24.9 kg/m2 (%) BMI 25.0 - 29.9 kg/m2 (%) BMI 30.0 - 34.9 kg/m2 (%) BMI 35.0 - 39.9 kg/m2 (%) BMI ≥ 40.0 kg/m2 (%) ICMP (%) NICMP (%) Arterial Hypertension (%) Diabetes mellitus (%) Dyslipidemia (%) CVD (%) CVD - 1 vessel (%) CVD - 2 vessels (%) CVD - 3 vessels (%) Recent MI (%) Recent CABG (%) AF (%) COPD (%) Asthma (%) PAOD (%) Anemia (%) CKD > II (%) Recent Stroke (%) |
85.8 ± 16.8 173.5 ± 7.9 28.5 ± 5.1 3.4 27.6 34.5 25.9 6.9 1.7 32.8 62.1 62.1 34.5 70.7 46.6 25.9 6.9 13.8 24.1 8.6 20.7 8.6 5.2 5.2 0.0 37.9 8.6 |
81.6 ± 16.8 173.9 ± 9.0 26.9 ± 4.8 1.4 35.1 41.8 13.5 6.8 1.4 37.8 56.8 67.6 43.2 70.3 52.7 16.2 17.6 18.9 40.5 13.5 43.2 16.2 0.0 10.8 6.8 50.0 13.5 |
0.129 0.809 0.074 0.673 0.125 0.386 0.072 0.975 0.862 0.545 0.538 0.511 0.307 0.958 0.392 0.199 0.440 0.393 0.047 0.379 0.006 0.196 0.048 0.245 0.044 0.166 0.379 |
86.2 ± 18.9 172.3 ± 8.6 28.9 ± 5.4 3.3 23.3 35.0 25.0 11.7 1.7 30.0 65.0 61.7 36.7 70.0 40.0 23.3 6.7 10.0 23.3 8.3 18.3 8.3 3.3 8.3 3.3 30.0 10.0 |
81.1 ± 14.7 174.9 ± 8.2 26.5 ± 4.3 1.4 38.9 41.7 13.9 2.8 1.4 40.3 54.2 68.1 41.7 70.8 59.6 18.1 18.1 22.2 41.7 13.9 45.8 16.7 1.4 8.3 4.2 56.9 12.5 |
0.083 0.075 0.005 0.877 0.008 0.433 0.105 0.044 0.896 0.219 0.207 0.443 0.558 0.917 0.024 0.505 0.376 0.051 0.026 0.317 0.001 0.155 0.455 1.000 0.803 0.002 0.823 |
87.0 ± 19.1 172.4 ± 8.6 29.2 ± 5.7 4.7 20.9 34.8 23.3 14.0 2.3 30.2 69.8 60.5 32.6 62.8 37.2 23.3 7.0 9.3 20.9 11.6 11.6 11.6 4.7 9.3 2.3 23.3 7.0 |
81.7 ± 15.5 174.3 ± 8.4 26.8 ± 4.4 1.1 37.1 40.4 16.9 3.4 1.1 38.2 53.9 67.4 42.7 74.2 57.3 19.1 14.6 20.2 39.3 11.2 43.8 13.5 1.1 7.9 4.5 55.1 13.5 |
0.095 0.227 0.020 0.489 0.013 0.538 0.379 0.024 0.596 0.370 0.083 0.432 0.264 0.180 0.030 0.623 0.358 0.103 0.036 0.947 0.000 0.766 0.202 0.779 0.541 0.001 0.270 |
86.2 ± 18.7 172.7 ± 8.5 28.8 ± 5.5 3.4 27.1 32.2 23.7 10.2 3.4 28.8 64.4 71.2 42.4 69.5 44.1 27.1 5.1 11.9 27.1 8.5 18.6 10.2 3.4 6.8 3.4 37.3 8.5 |
81.2 ± 15.1 174.6 ± 8.4 26.6 ± 4.3 1.4 35.6 43.8 15.1 4.1 0.0 41.1 54.8 60.3 37.0 71.2 56.2 15.1 17.8 20.5 38.4 13.7 45.2 15.1 1.4 9.6 4.1 50.7 13.7 |
0.094 0.204 0.011 0.806 0.047 0.172 0.207 0.170 0.113 0.143 0.264 0.191 0.529 0.827 0.167 0.104 0.062 0.161 0.173 0.347 0.001 0.403 0.439 0.561 0.829 0.124 0.347 |
|
Functional Class NYHA (median ± IQR) NYHA II (%) NYHA III (%) NYHA IV (%) |
3.0 ± 1.0 37.9 56.9 5.2 |
3.0 ± 1.0 48.6 51.4 0.0 |
0.131 0.218 0.431 0.048 |
3.0 ± 1.0 45.0 53.3 1.7 |
3.0 ± 1.0 44.4 52.8 2.8 |
0.775 0.823 0.949 0.670 |
3.0 ± 1.0 41.9 55.8 2.3 |
3.0 ± 1.0 44.9 52.9 2.2 |
0.744 0.738 0.656 0.977 |
3.0 ± 1.0 40.7 55.9 3.4 |
3.0 ± 1.0 46.6 52.0 1.4 |
0.435 0.497 0.548 0.439 |
|
Medication ACEI/ARB (%) BB (%) Ivabradine (%) MRA (%) ARNI (%) SGLT2I (%) Loop Diuretics (%) Digoxin/Digitoxin (%) Amiodarone (%) |
62.1 96.6 3.4 72.4 34.5 15.5 63.8 6.9 19.0 |
71.6 94.6 9.5 71.6 24.3 9.5 78.4 16.2 40.5 |
0.245 0.592 0.174 0.920 0.201 0.290 0.064 0.103 0.008 |
66.7 95.0 10.0 73.3 33.3 20.0 61.7 11.7 13.3 |
68.1 95.8 4.2 70.8 25.0 5.6 80.6 12.5 45.8 |
0.865 0.819 0.186 0.750 0.292 0.011 0.016 0.884 0.000 |
67.4 95.3 11.6 74.4 27.9 16.3 60.5 7.0 9.3 |
67.4 95.5 4.5 70.8 29.2 10.1 77.5 14.6 41.6 |
0.998 0.968 0.128 0.663 0.877 0.309 0.041 0.208 0.000 |
57.6 96.6 5.1 81.4 40.7 18.6 57.6 8.5 18.6 |
75.3 94.5 8.2 64.4 19.2 6.8 83.6 15.1 41.1 |
0.031 0.567 0.478 0.031 0.007 0.039 0.001 0.248 0.006 |
|
Laboratory Creatinine (mg/dl — median ± IQR) proBNP (ng/l — median ± IQR) |
1.1 ± 0.5 1179.5 ± 2347.3 |
1.3 ± 0.6 2612.5 ± 3469.8 |
0.005 0.000 |
1.0 ± 0.3 1179.5 ± 2222.3 |
1.4 ± 0.6 2747.5 ± 3833.8 |
0.000 0.000 |
1.0 ± 0.3 1215.0 ± 2398.0 |
1.3 ± 0.6 2041.0 ± 3536.5 |
0.000 0.004 |
1.0 ± 0.4 1555.0 ± 2742.0 |
1.3 ± 0.5 1925.0 ± 3286.0 |
0.000 0.130 |
|
ECG LBBB (%) QRS-width (ms — mean ± SD) |
94.8 167.3 ± 24.2 |
83.8 172.09 ± 31.2 |
0.047 0.255 |
91.7 168.1 ± 23.4 |
86.1 172.4 ± 32.0 |
0.317 0.371 |
93.0 169.0 ± 23.6 |
86.5 171.1 ± 30.5 |
0.270 0.667 |
91.5 172.1 ± 30.5 |
86.3 169.0 ± 26.6 |
0.347 0.539 |
|
Echocardiography LVEF (% — mean ± SD) LVEDD (mm — mean ± SD) TAPSE (mm — mean ± SD sPAP (mmHg — mean ± SD) |
26.3 ± 6.4 64.9 ± 8.5 20.0 ± 4.6 42.7 ± 10.0 |
27.5 ± 8.5 63.1 ± 7.9 17.1 ± 4.6 47.9 ± 14.6 |
0.335 0.242 0.011 0.108 |
25.7 ± 7.6 63.9 ± 9.0 20.5 ± 4.0 46.0 ± 11.6 |
28.0 ± 7.6 63.9 ± 7.6 17.0 ± 4.9 45.7 ± 13.9 |
0.092 0.983 0.002 0.928 |
24.9 ± 6.9 63.9 ± 9.5 20.4 ± 3.8 45.8 ± 12.5 |
27.9 ± 7.8 63.9 ± 7.6 17.7 ± 5.0 45.8 ± 13.5 |
0.033 0.958 0.035 0.998 |
26.5 ± 6.6 64.1 ± 7.6 18.9 ± 4.6 42.7 ± 10.3 |
27.4 ± 8.4 63.8 ± 8.7 17.9 ± 5.0 47.6 ± 14.4 |
0.497 0.817 0.372 0.128 |
|
Implantation characteristics Primary prevention (%) |
93.1 |
78.4 |
0.019 |
88.3 |
81.9 |
0.308 |
88.4 |
83.1 |
0.433 |
88.1 |
82.2 |
0.344 |
R: responder; NR: non-responder; BMI: body mass index; ICMP: ischemic cardiomyopathy; NICMP: non-ischemic cardiomyopathy; CVD: cardiovascular disease; MI: myocardial infarction; CABG: coronary artery bypass graft; AF: atrial fibrillation; COPD: chronic obstructive pulmonary disease; PAOD: peripheral artery occlusive disease; CKD: chronic kidney disease; ACEI/ARB: angiotensin converting enzyme inhibitor/angiotensin-II-receptor blocker; BB: beta blocker; MRA: mineralocorticoid-receptor antagonist; ARNI: angiotensin-receptor-neprilysin inhibitor; SGLT2I: sodium-glucose-transporter-2 inhibitor; LBBB: left bundle branch block; LVEF: left ventricular ejection fraction; LVEDD: left ventricular end diastolic diameter; TAPSE: tricuspid annular plane systolic excursion; sPAP: systolic pulmonary artery pressure.
Table 3.
Follow-up characteristics (6 months) depending on different responder definitions.
| Functional Status NYHA-improvement ≥ I R NR p |
Echocardiographic Status LVEF-increase ≥ 5% LVEF-increase ≥ 10% R NR p R NR p |
Laboratory Status proBNP-decrease ≥ 25% R NR p |
||||||||||
|---|---|---|---|---|---|---|---|---|---|---|---|---|
|
Functional Class NYHA 6 months postoperative (median ± IQR) |
2.0 ± 1.0 |
2.5 ± 1.0 |
0.000 |
2.0 ± 0.5 |
2.5 ±1.0 |
0.000 |
1.5 ± 1.0 |
2.5 ± 1.0 |
0.000 |
2.0 ± 0.5 |
2.5 ± 1.0 |
0.005 |
|
Laboratory Creatinine 6 months postoperative (mg/dl — median ± IQR) proBNP 6 months postoperative (ng/l — median ± IQR) |
1.0 ± 0.4 629.0 ± 1493.0 |
1.3 ± 0.8 2270.5 ± 4582.0 |
0.005 0.000 |
1.0 ± 0.3 573.0 ± 2058.0 |
1.4 ± 0.9 2623.5 ± 4814.0 |
0.000 0.000 |
1.0 ± 0.4 573.0 ± 1577.0 |
1.3 ± 0.7 2158.5 ± 3947.8 |
0.000 0.000 |
1.0 ± 0.3 489.5 ± 965.0 |
1.4 ± 0.7 3374.0 ± 4047.0 |
0.000 0.000 |
|
ECG QRS-width postoperative (ms — mean ± SD) |
153.1 ± 26.0 |
165.4 ± 29.8 |
0.014 |
154.8 ± 29.0 |
164.4 ± 28.0 |
0.057 |
153.8 ± 26.9 |
163.0 ± 29.3 |
0.088 |
154.6 ± 28.6 |
164.3 ± 28.3 |
0.054 |
|
CRT-D Analysis Shock releases up to 3 years postoperative (%) nsVT up to 3 years postoperative (%) sVT up to 3 years postoperative (%) |
22.4 53.4 34.5 |
25.7 54.1 32.4 |
0.601 0.810 0.890 |
28.3 53.3 30.0 |
20.8 54.2 36.1 |
0.362 0.786 0.391 |
20.9 48.8 25.6 |
25.8 56.2 37.1 |
0.493 0.352 0.161 |
16.9 62.7 25.4 |
30.1 46.6 39.7 |
0.064 0.091 0.064 |
|
Echocardiography LVEF 6 months postoperative (% — mean ± SD) LVEDD 6 months postoperative (mm — mean ± SD) TAPSE 6 months postoperative (mm — mean ± SD) sPAP 6 months postoperative (mmHg — mean ± SD) TAPSE/sPAP 6 months postoperative (mean ± SD) |
35.8 ± 10.2 63.4 ± 8.4 19.6 ± 3.1 35.4 ± 7.7 0.6 ± 0.1 |
28.2 ± 8.1 61.5 ± 10.7 16.6 ± 4.2 44.3 ± 14.2 0.4 ± 0.1 |
0.001 0.489 0.027 0.027 0.000 |
36.9 ± 8.9 62.8 ± 10.0 19.7 ± 3.5 36.4 ± 8.9 0.5 ± 0.2 |
26.5 ± 7.8 62.2 ± 9.1 16.1 ± 3.8 44.5 ± 14.4 0.4 ± 0.2 |
0.000 0.811 0.007 0.054 0.041 |
38.6 ± 8.3 61.5 ± 10.7 19.8 ± 3.6 35.5 ± 9.0 0.6 ± 0.2 |
27.6 ± 8.3 63.0 ± 9.0 17.0 ± 4.0 42.9 ± 13.5 0.4 ± 0.2 |
0.000 0.606 0.065 0.145 0.030 |
34.3 ± 9.5 61.1 ± 6.3 18.6 ± 3.9 36.6 ± 8.9 0.5 ± 0.2 |
29.5 ± 9.7 64.1 ± 12.1 17.2 ± 4.1 44.6 ± 14.4 0.4 ± 0.2 |
0.043 0.281 0.322 0.050 0.160 |
R: responder; NR: non-responder; nsVT: non-sustained ventricular tachycardia; sVT: sustained ventricular tachycardia; LVEF: left ventricular ejection fraction; LVEDD: left ventricular end diastolic diameter; TAPSE: tricuspid annular plane systolic excursion; sPAP: systolic pulmonary artery pressure.
Table 4.
Univariate and multivariable cox hazard regression analysis detecting 1-, 2- and 3-year mortality in dependence of different responder definitions.
Table 4.
Univariate and multivariable cox hazard regression analysis detecting 1-, 2- and 3-year mortality in dependence of different responder definitions.
| Cox Regression Analysis | Univariate | Multivariable | ||
|---|---|---|---|---|
| Hazard Ratio (95% CI) | p-value | Hazard Ratio (95% CI) | p-value | |
| 1-year survival | ||||
| Responder NYHA ≥ I | 54.232 (0.119 — 24780.897) | 0.201 | ||
| Responder LVEF ≥ 5% | 57.265 (0.128 — 25544.830) | 0.128 | ||
| Responder LVEF ≥ 10% | 38.426 (0.053 — 27604.409) | 0.277 | ||
| Responder proBNP | 5.037 (0.606 — 41.843) | 0.134 | ||
| Responder NYHA + LVEF ≥ 5% | 38.426 (0.053 — 27604.409) | 0.277 | ||
| Responder NYHA + LVEF ≥ 10% | 31.401 (0.021 — 46570.928) | 0.355 | ||
| Responder NYHA + proBNP | 34.276 (0.034 — 34616.859) | 0.317 | ||
| Responder LVEF ≥ 5% + proBNP | 35.565 (0.040 — 31656.799) | 0.303 | ||
| Responder LVEF ≥ 10% + proBNP | 30.879 (0.019 — 50147.546) | 0.363 | ||
| 2-year survival | ||||
| Responder NYHA ≥ I | 56.829 (0.758 — 4260.552) | 0.067 | ||
| Responder LVEF ≥ 5% | 11.831 (1.547 — 90.457) | 0.017 | 7.044 (0.896 — 55.342) | 0.063 |
| Responder LVEF ≥ 10% | 39.429 (0.392 — 3965.835) | 0.118 | ||
| Responder proBNP | 11.352 (1.485 — 86.790) | 0.019 | 6.605 (0.841 — 51.892) | 0.073 |
| Responder NYHA + LVEF ≥ 5% | 39.429 (0.392 — 3965.835) | 0.118 | ||
| Responder NYHA + LVEF ≥ 10% | 31.912 (0.193 — 5275.549) | 0.184 | ||
| Responder NYHA + proBNP | 34.972 (0.276 — 4437.930) | 0.150 | ||
| Responder LVEF ≥ 5% + proBNP | 36.351 (0.312 — 4230.689) | 0.139 | ||
| Responder LVEF ≥ 10% + proBNP | 31.358 (0.178 — 5519.271) | 0.192 | ||
| 3-year survival | ||||
| Responder NYHA ≥ I | 7.595 (1.754 — 32.889) | 0.007 | 3.015 (0.622 — 14.605) | 0.170 |
| Responder LVEF ≥ 5% | 7.958 (1.838 — 34.356) | 0.006 | 5.066 (1.135 — 22.606) | 0.033 |
| Responder LVEF ≥ 10% | 9.649 (1.288 — 72.294) | 0.027 | 2.226 (0.135 — 36.836) | 0.576 |
| Responder proBNP | 7.651 (1.767 — 33.124) | 0.006 | 4.768 (1.068 — 21.278) | 0.041 |
| Responder NYHA + LVEF ≥ 5% | 40.225 (0.787 — 2056.868) | 0.066 | ||
| Responder NYHA + LVEF ≥ 10% | 32.311 (0.417 — 2505.555) | 0.117 | ||
| Responder NYHA + proBNP | 35.520 (0.572 — 2205.141) | 0.090 | ||
| Responder LVEF ≥ 5% + proBNP | 8.330 (1.112 — 62.406) | 0.039 | 0.281 (0.009 — 8.673) | 0.468 |
| Responder LVEF ≥ 10% + proBNP | 6.036 (0.806 — 45.223) | 0.080 | ||
LVEF: left ventricular ejection fraction.
Table 5.
Univariate and multivariable binary logistic regression with regard to CRT-D responder criterion NYHA-improvement ≥ I and various clinical characteristics.
Table 5.
Univariate and multivariable binary logistic regression with regard to CRT-D responder criterion NYHA-improvement ≥ I and various clinical characteristics.
| CRT-Responder: NYHA ≥ I Binary Logistic Regression | Univariate | Multivariable | ||
|---|---|---|---|---|
| Hazard Ratio (95% CI) | p-value | Hazard Ratio (95% CI) | p-value | |
| Gender (male) | 0.565 (0.255 — 1.250) | 0.159 | ||
| Age | 0.536 (0.365 — 0.788) | 0.001 | 0.553 (0.306 — 0.997) | 0.049 |
| Weight | 1.296 (0.910 — 1.845) | 0.151 | ||
| Height | 0.958 (0.678 — 1.354) | 0.807 | ||
| BMI | 1.380 (0.966 — 1.971) | 0.077 | ||
| ICMP | 0.800 (0.389 — 1.648) | 0.546 | ||
| NICMP | 1.247 (0.618 — 2.516) | 0.538 | ||
| Arterial Hypertension | 0.785 (0.382 — 1.613) | 0.511 | ||
| Diabetes mellitus | 0.691 (0.339 — 1.406) | 0.307 | ||
| Dyslipidemia | 1.020 (0.480 — 2.168) | 0.958 | ||
| Cardiovascular Disease (all) | 0.740 (0.372 — 1.475) | 0.393 | ||
| CVD – 1 vessel | 1.744 (0.742 — 4.098) | 0.202 | ||
| CVD – 2 vessels | 0.523 (0.171 — 1.602) | 0.257 | ||
| CVD – 3 vessels | 0.663 (0.257 — 1.710) | 0.395 | ||
| Recent MI | 0.467 (0.218 — 0.998) | 0.049 | 0.217 (0.063 — 0.743) | 0.015 |
| Recent CABG | 0.604 (0.194 — 1.876) | 0.383 | ||
| AF | 0.342 (0.156 — 0.750) | 0.007 | 0.611 (0.178 — 2.091) | 0.432 |
| COPD | 0.487 (0.161 — 1.473) | 0.203 | ||
| Asthma | 0.000 (0.000 — .) | 0.999 | ||
| PAOD | 0.450 (0.114 — 1.779) | 0.255 | ||
| Anemia | 0.000 (0.000 — .) | 0.999 | ||
| CKD > II | 0.611 (0.304 — 1.230) | 0.167 | ||
| Recent Stroke | 0.604 (0.194 — 1.876) | 0.383 | ||
| NYHA (preoperative) | 1.747 (0.909 — 3.354) | 0.094 | ||
| ACEI/ARB | 0.648 (0.312 — 1.349) | 0.246 | ||
| BB | 1.600 (0.283 — 9.056) | 0.595 | ||
| Ivabradine | 0.342 (0.068 — 1.712) | 0.192 | ||
| MRA | 1.040 (0.483 — 2.238) | 0.920 | ||
| ARNI | 1.637 (0.767 — 3.496) | 0.203 | ||
| SGLT2I | 1.758 (0.613 — 5.045) | 0.294 | ||
| Loop Diuretics | 0.486 (0.225 — 1.050) | 0.066 | ||
| Digoxin/Digitoxin | 0.383 (0.117 — 1.257) | 0.113 | ||
| Amiodarone | 0.343 (0.154 — 0.767) | 0.009 | 1.012 (0.257 — 3.979) | 0.986 |
| Creatinine (baseline) | 0.571 (0.366 — 0.889) | 0.013 | 1.057 (0.457 — 2.441) | 0.897 |
| proBNP (baseline) | 0.503 (0.287 — 0.882) | 0.016 | 0.508 (0.230 — 1.122) | 0.094 |
| LBBB | 3.548 (0.951 — 13.233) | 0.059 | ||
| QRS-width (preoperative) | 0.819 (0.576 — 1.166) | 0.268 | ||
| LVEF (preoperative) | 0.846 (0.596 — 1.200) | 0.349 | ||
| LVEDD (preoperative) | 1.255 (0.858 — 1.834) | 0.241 | ||
| TAPSE (preoperative) | 1.951 (1.135 — 3.355) | 0.016 | 1.832 (1.014 — 3.311) | 0.045 |
| sPAP (preoperative) | 0.650 (0.382 — 1.107) | 0.113 | ||
| TAPSE/sPAP (preoperative) | 1.870 (0.935 — 3.741) | 0.077 | ||
| Primary Prevention | 3.724 (1.171 — 11.840) | 0.026 | 2.368 (0.368 — 15.237) | 0.364 |
CRT-D: cardiac resynchronization therapy; BMI: body mass index; ICMP: ischemic cardiomyopathy; NICMP: non-ischemic cardiomyopathy; CVD: cardiovascular disease; MI: myocardial infarction; CABG: coronary artery bypass graft; AF: atrial fibrillation; COPD: chronic obstructive pulmonary disease; PAOD: peripheral artery occlusive disease; CKD: chronic kidney disease; ACEI/ARB: angiotensin converting enzyme inhibitor/angiotensin-II-receptor blocker; BB: beta blocker; MRA: mineralocorticoid-receptor antagonist; ARNI: angiotensin-receptor-neprilysin inhibitor; SGLT2I: sodium-glucose-transporter-2 inhibitor; LBBB: left bundle branch block; LVEF: left ventricular ejection fraction; LVEDD: left ventricular end diastolic diameter; TAPSE: tricuspid annular plane systolic excursion; sPAP: systolic pulmonary artery pressure.
Table 6.
Univariate and multivariable binary logistic regression with regard to CRT-D responder criterion LVEF-increase ≥ 5% and various clinical characteristics.
Table 6.
Univariate and multivariable binary logistic regression with regard to CRT-D responder criterion LVEF-increase ≥ 5% and various clinical characteristics.
| CRT-Responder: LVEF ≥ 5% Binary Logistic Regression | Univariate | Multivariable | ||
|---|---|---|---|---|
| Hazard Ratio (95% CI) | p-value | Hazard Ratio (95% CI) | p-value | |
| Gender (male) | 0.371 (0.164 — 0.840) | 0.017 | 0.282 (0.041 — 1.947) | 0.199 |
| Age | 0.541 (0.368 — 0.794) | 0.002 | 1.377 (0.627 — 3.023) | 0.425 |
| Weight | 1.366 (0.957 — 1.952) | 0.086 | ||
| Height | 0.725 (0.508 — 1.036) | 0.077 | ||
| BMI | 1.701 (1.168 — 2.479) | 0.006 | 1.177 (0.467 — 2.971) | 0.730 |
| ICMP | 0.635 (0.308 — 1.313) | 0.221 | ||
| NICMP | 1.571 (0.777 — 3.179) | 0.209 | ||
| Arterial Hypertension | 0.755 (0.368 — 1.549) | 0.444 | ||
| Diabetes mellitus | 0.811 (0.401 — 1.638) | 0.558 | ||
| Dyslipidemia | 0.961 (0.454 — 2.035) | 0.917 | ||
| Cardiovascular Disease (all) | 0.450 (0.223 — 0.904) | 0.025 | 0.358 (0.090 — 1.418) | 0.143 |
| CVD – 1 vessel | 1.334 (0.571 — 3.119) | 0.505 | ||
| CVD – 2 vessels | 0.488 (0.159 — 1.493) | 0.208 | ||
| CVD – 3 vessels | 0.375 (0.136 — 1.031) | 0.057 | ||
| Recent MI | 0.426 (0.199 — 0.911) | 0.028 | 0.480 (0.066 — 3.483) | 0.468 |
| Recent CABG | 0.564 (0.181 — 1.750) | 0.321 | ||
| AF | 0.265 (0.119 —0.591) | 0.001 | 0.459 (0.095 — 2.212) | 0.332 |
| COPD | 0.455 (0.150 — 1.373) | 0.162 | ||
| Asthma | 2.448 (0.217 — 27.682) | 0.469 | ||
| PAOD | 1.000 (0.290 — 3.454) | 1.000 | ||
| Anemia | 0.793 (0.128 — 4.909) | 0.803 | ||
| CKD > II | 0.324 (0.157 — 0.668) | 0.002 | 0.734 (0.110 — 4.888) | 0.749 |
| Recent Stroke | 0.778 (0.260 — 2.325) | 0.653 | ||
| NYHA (preoperative) | 0.899 (0.475 — 1.703) | 0.745 | ||
| ACEI/ARB | 0.939 (0.452 — 1.949) | 0.865 | ||
| BB | 0.826 (0.161 — 4.251) | 0.819 | ||
| Ivabradine | 2.556 (0.611 — 10.689) | 0.199 | ||
| MRA | 1.132 (0.527 — 2.434) | 0.750 | ||
| ARNI | 1.500 (0.704 — 3.197) | 0.294 | ||
| SGLT2I | 4.250 (1.292 — 13.975) | 0.017 | 9.013 (1.614 — 50.313) | 0.012 |
| Loop Diuretics | 0.388 (0.178 — 0.849) | 0.018 | 0.326 (0.079 — 1.340) | 0.120 |
| Digoxin/Digitoxin | 0.925 (0.323 — 2.650) | 0.884 | ||
| Amiodarone | 0.182 (0.076 — 0.437) | < 0.001 | 0.395 (0.059 — 2.645) | 0.339 |
| Creatinine (baseline) | 0.318 (0.179 — 0.563) | < 0.001 | 0.155 (0.047 — 0.505) | 0.002 |
| proBNP (baseline) | 0.392 (0.206 — 0.747) | 0.004 | 0.690 (0.140 — 3.409) | 0.649 |
| LBBB | 1.774 (0.571 — 5.510) | 0.321 | ||
| QRS-width (preoperative) | 0.855 (0.603 — 1.213) | 0.381 | ||
| LVEF (preoperative) | 0.737 (0.516 — 1.053) | 0.094 | ||
| LVEDD (preoperative) | 1.004 (0.693 — 1.456) | 0.983 | ||
| TAPSE (preoperative) | 2.263 (1.274 — 4.021) | 0.005 | 2.858 (1.305 — 6.259) | 0.009 |
| sPAP (preoperative) | 1.024 (0.618 — 1.696) | 0.926 | ||
| TAPSE/sPAP (preoperative) | 1.334 (0.654 — 2.722) | 0.428 | ||
| Primary Prevention | 1.668 (0.619 — 4.494) | 0.311 | ||
CRT-D: cardiac resynchronization therapy; BMI: body mass index; ICMP: ischemic cardiomyopathy; NICMP: non-ischemic cardiomyopathy; CVD: cardiovascular disease; MI: myocardial infarction; CABG: coronary artery bypass graft; AF: atrial fibrillation; COPD: chronic obstructive pulmonary disease; PAOD: peripheral artery occlusive disease; CKD: chronic kidney disease; ACEI/ARB: angiotensin converting enzyme inhibitor/angiotensin-II-receptor blocker; BB: beta blocker; MRA: mineralocorticoid-receptor antagonist; ARNI: angiotensin-receptor-neprilysin inhibitor; SGLT2I: sodium-glucose-transporter-2 inhibitor; LBBB: left bundle branch block; LVEF: left ventricular ejection fraction; LVEDD: left ventricular end diastolic diameter; TAPSE: tricuspid annular plane systolic excursion; sPAP: systolic pulmonary artery pressure.
Table 7.
Univariate and multivariable binary logistic regression with regard to CRT-D responder criterion LVEF-increase ≥ 10% and various clinical characteristics.
Table 7.
Univariate and multivariable binary logistic regression with regard to CRT-D responder criterion LVEF-increase ≥ 10% and various clinical characteristics.
| CRT-Responder: LVEF ≥ 10% Binary Logistic Regression | Univariate | Multivariable | ||
|---|---|---|---|---|
| Hazard Ratio (95% CI) | p-value | Hazard Ratio (95% CI) | p-value | |
| Gender (male) | 0.562 (0.249 — 1.270) | 0.166 | ||
| Age | 0.555 (0.376 — 0.820) | 0.003 | 1.098 (0.399 — 3.016) | 0.857 |
| Weight | 1.369 (0.944 — 1.986) | 0.098 | ||
| Height | 0.796 (0.550 — 1.152) | 0.226 | ||
| BMI | 1.627 (1.110 — 2.385) | 0.013 | 0.907 (0.366 — 2.248) | 0.832 |
| ICMP | 0.701 (0.322 — 1.527) | 0.371 | ||
| NICMP | 1.971 (0.910 — 4.269) | 0.085 | ||
| Arterial Hypertension | 0.739 (0.347 — 1.573) | 0.433 | ||
| Diabetes mellitus | 0.648 (0.302 — 1.391) | 0.265 | ||
| Dyslipidemia | 0.588 (0.270 — 1.282) | 0.182 | ||
| Cardiovascular Disease (all) | 0.442 (0.209 — 0.932) | 0.032 | 0.462 (0.067 — 3.175) | 0.432 |
| CVD – 1 vessel | 1.248 (0.516 — 3.020) | 0.624 | ||
| CVD – 2 vessels | 0.427 (0.115 — 1.587) | 0.204 | ||
| CVD – 3 vessels | 0.393 (0.124 — 1.245) | 0.112 | ||
| Recent MI | 0.408 (0.175 — 0.955) | 0.039 | 0.091 (0.012 — 0.667) | 0.018 |
| Recent CABG | 1.039 (0.332 — 3.254) | 0.947 | ||
| AF | 0.169 (0.061 — 0.469) | 0.001 | 0.028 (0.002 — 0.314) | 0.004 |
| COPD | 0.844 (0.277 — 2.570) | 0.766 | ||
| Asthma | 4.293 (0.378 — 48.706) | 0.240 | ||
| PAOD | 1.201 (0.332 — 4.348) | 0.780 | ||
| Anemia | 0.606 (0.055 — 4.669) | 0.548 | ||
| CKD > II | 0.247 (0.109 — 0.563) | 0.001 | 0.403 (0.052 — 3.160) | 0.387 |
| Recent Stroke | 0.481 (0.128 — 1.804) | 0.278 | ||
| NYHA (preoperative) | 1.116 (0.567 — 2.197 | 0.751 | ||
| ACEI/ARB | 1.001 (0.460 — 2.177) | 0.998 | ||
| BB | 0.965 (0.170 — 5.484) | 0.968 | ||
| Ivabradine | 2.796 (0.711 — 10.996) | 0.141 | ||
| MRA | 1.201 (0.527 — 2.735) | 0.663 | ||
| ARNI | 0.938 (0.418 — 2.104) | 0.877 | ||
| SGLT2I | 1.728 (0.597 — 5.005) | 0.313 | ||
| Loop Diuretics | 0.443 (0.202 — 0.975) | 0.043 | 0.230 (0.040 — 1.319) | 0.099 |
| Digoxin/Digitoxin | 0.438 (0.118 — 1.629) | 0.218 | ||
| Amiodarone | 0.144 (0.047 — 0.438) | 0.001 | 0.177 (0.019 — 1.695) | 0.133 |
| Creatinine (baseline) | 0.313 (0.164 — 0597) | < 0.001 | 0.315 (0.075 — 1.328) | 0.116 |
| proBNP (baseline) | 0.492 (0.256 — 0.946) | 0.034 | 0.424 (0.038 — 4.686) | 0.484 |
| LBBB | 2.078 (0.554 — 7.791) | 0.278 | ||
| QRS-width (preoperative) | 0.928 (0.641 — 1.342) | 0.691 | ||
| LVEF (preoperative) | 0.656 (0.442 — 0.973) | 0.036 | 0.497 (0.194 — 1.276) | 0.146 |
| LVEDD (preoperative) | 0.989 (0.665 —1.471) | 0.957 | ||
| TAPSE (preoperative) | 1.772 (1.021 — 3.075) | 0.042 | 1.088 (0.399 — 2.969) | 0.869 |
| sPAP (preoperative) | 0.999 (0.577 — 1.730) | 0.998 | ||
| TAPSE/sPAP (preoperative) | 1.626 (0.725 — 3.646) | 0.238 | ||
| Primary Prevention | 1.541 (0.521 — 4.559) | 0.435 | ||
CRT-D: cardiac resynchronization therapy; BMI: body mass index; ICMP: ischemic cardiomyopathy; NICMP: non-ischemic cardiomyopathy; CVD: cardiovascular disease; MI: myocardial infarction; CABG: coronary artery bypass graft; AF: atrial fibrillation; COPD: chronic obstructive pulmonary disease; PAOD: peripheral artery occlusive disease; CKD: chronic kidney disease; ACEI/ARB: angiotensin converting enzyme inhibitor/angiotensin-II-receptor blocker; BB: beta blocker; MRA: mineralocorticoid-receptor antagonist; ARNI: angiotensin-receptor-neprilysin inhibitor; SGLT2I: sodium-glucose-transporter-2 inhibitor; LBBB: left bundle branch block; LVEF: left ventricular ejection fraction; LVEDD: left ventricular end diastolic diameter; TAPSE: tricuspid annular plane systolic excursion; sPAP: systolic pulmonary artery pressure.
Table 8.
Univariate and multivariable binary logistic regression with regard to CRT-D responder criterion proBNP-decrease ≥ 25% and various clinical characteristics.
Table 8.
Univariate and multivariable binary logistic regression with regard to CRT-D responder criterion proBNP-decrease ≥ 25% and various clinical characteristics.
| CRT-Responder: proBNP Binary Logistic Regression | Univariate | Multivariable | ||
|---|---|---|---|---|
| Hazard Ratio (95% CI) | p-value | Hazard Ratio (95% CI) | p-value | |
| Gender (male) | 0.356 (0.157 — 0.806) | 0.013 | 0.637 (0.221 — 1.832) | 0.403 |
| Age | 0.481 (0.322 — 0.717) | < 0.001 | 0.677 (0.432 — 1.061) | 0.089 |
| Weight | 1.353 (0.947 — 1.931) | 0.096 | ||
| Height | 0.797 (0.561 — 1.132) | 0.204 | ||
| BMI | 1.596 (1.103 — 2.309) | 0.013 | 1.545 (1.023 — 2.332) | 0.039 |
| ICMP | 0.580 (0.279 — 1.205) | 0.145 | ||
| NICMP | 1.493 (0.738 — 3.020) | 0.265 | ||
| Arterial Hypertension | 1.628 (1.628 — 3.389) | 0.192 | ||
| Diabetes mellitus | 1.253 (0.621 — 2.527) | 0.529 | ||
| Dyslipidemia | 0.920 (0.434 — 1.949) | 0.827 | ||
| Cardiovascular Disease (all) | 0.615 (0.308 — 1.228) | 0.168 | ||
| CVD – 1 vessel | 2.030 (0.857 — 4.805) | 0.107 | ||
| CVD – 2 vessels | 0.239 (0.065 — 0.884) | 0.032 | 0.379 (0.083 — 1.729) | 0.210 |
| CVD – 3 vessels | 0.503 (0.190 — 1.330) | 0.166 | ||
| Recent MI | 0.598 (0.284 — 1.257) | 0.175 | ||
| Recent CABG | 0.583 (0.188 — 1.812) | 0.351 | ||
| AF | 0.278 (0.125 — 0.619) | 0.002 | 0.369 (0.149 — 0.918) | 0.032 |
| COPD | 0.638 (0.221 — 1.842) | 0.406 | ||
| Asthma | 2.526 (0.223 — 28.567) | 0.454 | ||
| PAOD | 0.686 (0.191 — 2.465) | 0.563 | ||
| Anemia | 0.819 (0.132 — 5.068) | 0.830 | ||
| CKD > II | 0.579 (0.287 — 1.164) | 0.125 | ||
| Recent Stroke | 0.583 (0.188 — 1.812) | 0.351 | ||
| NYHA (preoperative) | 1.317 (0.693 — 2.501) | 0.401 | ||
| ACEI/ARB | 0.445 (0.212 — 0.934) | 0.062 | ||
| BB | 1.652 (0.292 — 9.350) | 0.570 | ||
| Ivabradine | 0.598 (0.143 — 2.501) | 0.481 | ||
| MRA | 2.414 (1.072 — 5.435) | 0.033 | 1.860 (0.674 — 5.134) | 0.231 |
| ARNI | 2.890 (1.324 — 6.308) | 0.008 | 2.717 (1.110 — 6.649) | 0.029 |
| SGLT2I | 3.117 (1.017 — 9.551) | 0.047 | 1.373 (0.357 — 5.284) | 0.645 |
| Loop Diuretics | 0.268 (0.119 — 0.599) | 0.001 | 0.509 (0.200 — 1.299) | 0.158 |
| Digoxin/Digitoxin | 0.522 (0.171 — 1.597) | 0.254 | ||
| Amiodarone | 0.328 (0.147 — 0.734) | 0.007 | 0.497 (0.188 — 1.319) | 0.161 |
| Creatinine (baseline) | 0.376 (0.220 — 0.641) | < 0.001 | 0.455 (0.248 — 0.834) | 0.011 |
| proBNP (baseline) | 0.883 (0.615 — 1.266) | 0.498 | ||
| LBBB | 1.714 (0.552 — 5.325) | 0.351 | ||
| QRS-width (preoperative) | 1.116 (0.789 — 1.577) | 0.536 | ||
| LVEF (preoperative) | 0.886 (0.626 — 1.254) | 0.494 | ||
| LVEDD (preoperative) | 1.045 (0.722 — 1.513) | 0.815 | ||
| TAPSE (preoperative) | 1.245 (0.772 — 2.008) | 0.368 | ||
| sPAP (preoperative) | 0.659 (0.383 — 1.134) | 0.132 | ||
| TAPSE/sPAP (preoperative) | 1.452 (0.752 — 2.806) | 0.267 | ||
| Primary Prevention | 0.621 (0.231 — 1.674) | 0.347 | ||
CRT-D: cardiac resynchronization therapy; BMI: body mass index; ICMP: ischemic cardiomyopathy; NICMP: non-ischemic cardiomyopathy; CVD: cardiovascular disease; MI: myocardial infarction; CABG: coronary artery bypass graft; AF: atrial fibrillation; COPD: chronic obstructive pulmonary disease; PAOD: peripheral artery occlusive disease; CKD: chronic kidney disease; ACEI/ARB: angiotensin converting enzyme inhibitor/angiotensin-II-receptor blocker; BB: beta blocker; MRA: mineralocorticoid-receptor antagonist; ARNI: angiotensin-receptor-neprilysin inhibitor; SGLT2I: sodium-glucose-transporter-2 inhibitor; LBBB: left bundle branch block; LVEF: left ventricular ejection fraction; LVEDD: left ventricular end diastolic diameter; TAPSE: tricuspid annular plane systolic excursion; sPAP: systolic pulmonary artery pressure.
Disclaimer/Publisher’s Note: The statements, opinions and data contained in all publications are solely those of the individual author(s) and contributor(s) and not of MDPI and/or the editor(s). MDPI and/or the editor(s) disclaim responsibility for any injury to people or property resulting from any ideas, methods, instructions or products referred to in the content. |
© 2024 by the authors. Licensee MDPI, Basel, Switzerland. This article is an open access article distributed under the terms and conditions of the Creative Commons Attribution (CC BY) license (http://creativecommons.org/licenses/by/4.0/).
Copyright: This open access article is published under a Creative Commons CC BY 4.0 license, which permit the free download, distribution, and reuse, provided that the author and preprint are cited in any reuse.


